Embed Size (px)
Citation preview

X■Ray Photoelectron Spectroscopy
Binayak Panda, Marshall Space Flight Center / NASA
General Uses
• Elemental analysis of surfaces of all elements
Lithium and higher
• Analyses the first few atomic layers on samples
• Thin surface layers that cannot be analyzed by other
techniques
• Chemical state identification of surface elements
• In-depth composition profiles for elemental
distribution as well as oxidation states in
samples
• Surface analysis of samples when destructive effects
of electron or ion beam techniques must be avoided
Examples of Applications
• Determination of oxidation states of metal atoms in
metal compounds
• Identification of surface contaminations
• Measurement of surfaces film thickness
• Identification and degradation of polymers
Samples
• Form : Flat solids with low vapor pressure are preferred
• Size : Depends on machine – up to 4 inches
• Preparation: Must be free of fingerprints, oils, or
surface contamination
Limitations
• Data collection is slow compared to other surface
analysis techniques, but analysis time can be
decreased substantially when high resolution or
chemical state identification is not needed
• Lower lateral resolution in imaging and analysis
compared to electron microscopes
• Surface sensitive, comparable to other surface
analysis techniques
• Charging effects may be a problem with insulating
samples. Some instruments are equipped with
charge-compensation devices
Estimated Analysis Time
• Requires few hours of vacuum pump down before
analysis
• Qualitative analysis can be performed in 5 to 10
minutes
• Quantitative analysis requires 1 h to several hours,
depending on information desired
Capabilities of Related Techniques
• Auger electron spectroscopy: Compositional analysis
of surfaces. Faster, with better lateral resolution than
XPS. Has depth-profiling capabilities. Electron beam
can be very damaging; bonding and other chemical
state information are not easily interpreted. Very thin
surface layers cannot be analyzed.
• Low-energy ion-scattering spectroscopy: Sensitive to
the top atomic layer of the surface and has profiling
capabilities. Quantitative analysis requires use of
standards; no chemical state information; poor mass
resolution for high-Z elements
• Ultraviolet Photoelectron spectroscopy (UPS): UPS operates with the same principles as the XPS, the exciting radiation in this case is the ultraviolet light with a narrow band of wavelength. In this technique the core level electrons are not accessible but does provide useful information at the surface level (valence band level). Analysis depth is estimated around 20 to 30 Angstroms. Used for information on surface species, reaction products, catalysis, and chemisorption.
https://ntrs.nasa.gov/search.jsp?R=20190030418 2020-05-07T23:04:46+00:00Z
Introduction:
The interaction of photon and the electron goes back to the early part of 19th century emanating from the photo-electric effect depicted by none other than Albert Einstein (Ref 1) described in 1905, and the redistribution of kinetic energy resulting from the interaction of x-ray and solids reported during early part of the century (Ref.2). The spectrum resolutions obtained at that time was not sufficient to observe distinct peaks in spectra for materials. Thus, these phenomena hardly attracted any attention for many years following these discoveries.
The modern X-ray Photoelectron Spectroscopy (XPS) has been possible by the extensive and significant contribution from Kai Siegbahn and others (Ref.3, 4) of Uppsala University. Siegbahn developed and employed a high-resolution electron spectrometer that revealed electron peaks in a spectrum emerging from the interaction of x-rays and solids. Eventually, Kai Siegbahn received Nobel Prize in 1981 for his contributions to XPS. Around 1958, shifts in elemental peaks were realized in compounds when the same elements are bound to other but different elements. This discovery resulted in the chemical state identification in various chemicals as well as the oxidation states of atoms in compounds. Because of these useful physical effects, the Uppsala group named XPS with a synonymous name of ESCA (Electron Spectroscopy for Chemical Analysis) used widely today and will be used here alternatively. Therefore, XPS or ESCA not only identifies the element, but also the compound these elements form, from their chemical shifts.
Compared to other micro-analytical techniques such as Energy Dispersive (EDS) or Wavelength Dispersive (WDS) techniques, XPS analyzes only few atomic layers present on the surface. This was discovered early in 1966 (Ref. 5). While this has awarded a merit to the analytical technique to analyze very thin layers such as films and coatings, it often analyzes the adsorbed superficial gases and contaminations on a sample introduced to its analytical chamber. This necessitates the surface is cleaned and the underlying material, material of interest, is exposed in a clean environment such that the material of interest is analyzed. The cleaning is accomplished by a scanning ion gun within the analytical chamber of the instrument. Ion gun uses an argon gas and is commonly attached in most modern machines. Reliable and efficient vacuum systems employed in modern machines does not allow adsorbed layers to rebuild after the surface is cleaned.
Development of efficient and reliable vacuum pumps over these developmental years is yet another important step in the commercialization of XPS machines. Vacuum levels of better than 10-7 torr are essential to increase the mean free path of electrons released from the sample surface. Thus, modern machines are equipped with high capacity ion, turbo or cryogenic pumps in their analytical chambers.
Today, XPS has advanced from an applied physics laboratory to industry for use in quality control as well as analysis of contaminants and has taken a dominant role in microanalysis. Its uniqueness arises from the fact that it is considered non-destructive compared to other common micro-analytical techniques using the electron and ion excitation sources. Polymers and plastics could be analyzed since the binding energies of saturated and unsaturated bonds in atoms could be separated. Extremely thin layers could be analyzed including materials with layered structures. The technique, though did not advance for many years, has now opened a new window for research as well as applications in industry due to its ability to separate and measure the chemical shifts in bound elements.
Principles
Fig. 1(Ref. 6) illustrates the electronic transitions involved in an XPS process. It shows an energetic
x-ray beam impinging on the surface. Due to their high energy, they eject one or more core electrons.
The ejected electrons are collected by the spectrometer and eventually detected by a multi-channel

analyzer. The process of this interaction conserves total energy for each interaction and from the
voltages needed for the retardation of the ejected electron, the energy of the electron is known. This
associated energy leads to the identification of the element and the orbit from which the electron is
knocked-off. Mathematically, if the kinetic energy KE is the core electron immediately after it
was ejected, then, due to the conservation of energy,
KE= hv - BE+ α (Eq. 1)
Where, hv is the energy of the exciting radiation, BE is the binding energy of the emitted electron in the solid, and α is the spectrometer work function. Value of α depends on the machine design that would
vary from model to model.
Often the vacancy created by the released electron from the photon interaction is filled by an electron from a higher energy level. The extra energy would be released by photon emission or by knocking of another electron with discrete energy known as Auger electron. The spectrometer also collects the Auger electron and displays it along with the other core level electrons. Auger emission is the more probable
transition for low atomic number elements.
From Eq.1 it is clear that the position of the XPS lines (Binding energy of peaks) depend on the energy of the x-ray photon and hence the target material of the x-ray source. Most common target materials are Aluminum and Magnesium. Existing data bases include both line positions for Al and Mg x-ray targets since the positions would vary depending on the wavelengths of the exciting beams. The Auger line
positions, however, do not change as the Auger electron energies liberate from the internal electron exchange process within an atom rather than on the impinging photon. When two or more elements combine to form a compound, their electrons change in their binding energies which is reflected in their corresponding line position shifts in the spectrum. Al and Mg x-ray targets are selected in most XPS machines due to strong x-ray beam intensity and the capability of Al Kα being filtered by quartz crystals.
Spectra generated by XPS instruments are mostly similar to the one shown in Fig.1 (Ref.6) for Cu. Fig.1
shows both photoelectron and Auger lines, there are, however, several other types of peaks found in XPS spectra largely due to aberrations and complexity of the interactions that the emitted photo-electron experiences.
X-ray Satellite peaks are found when the x-ray is not quite monochromatic. Small peaks that appear
towards the lower binding energies of XPS peaks. See Fig.2 (Ref. 7, page18)) coming from small number of photons with higher energy than the main exciting x-rays. Ghost lines appear due to impurities in anode material. The x-rays generating from the impurity atoms cannot get filtered and show additional lines in the spectra. Shake-up lines appear by the retardation effects of the ions that are created by the ejection of a photoelectron. This retarding effect generates small humps toward the higher binding energy side of a peak. The π →π* shake-up for C 1s (see the next section on nomenclatures such as C 1s, Si 2p etc. used in this chapter) line is a common example. Fig.3 (Ref.7, page 19) shows shake-up lines in copper compounds.
Photoelectrons may react with the surface atoms and lose their energy. Such electrons, when detected by
the spectrometer, appear as a hump at about 20 – 25 eV above the binding energy of a peak. They are called as energy loss lines or plasmon lines. Some cases they appear in a periodic fashion in 20-25 eV intervals of diminishing intensity. Fig.4 (Ref.7, page 21) shows plasmon lines in Al.
XPS spectrum very close to Fermi level (0 to 20 eV), known as Valence Band Spectrum, is often utilized
to distinguish between conductors and insulators

Nomenclature:
The Binding Energy of an electron is the energy required to free the electron from its orbit. This is
also known as the ionization energy and is commonly expressed in electron-volt (eV). XPS data
from a sample often plotted with eV on the abscissa and intensity of the peaks in the number of
counts on the ordinate. Such presentations are presented from right to left with increasing electron
volts. Sometimes, the ejected electron energies are presented in the form of Kinetic Energies and are
presented with increasing electron volts from left to right. Most presentations here are shown in this
Chapter are Binding Energy spectra.
The Binding Energy may be regarded as energy difference between the initial and final state of an
atom after an electron is ejected. The energy levels of an atom involved in photo emission are
represented in terms of an energy-level diagram that provides the energy of the atom when one
electron of the indicated energy level, s, p, d, or f is missing. Fig. 5 (Ref. 7, page 10) shows an energy
level diagram for Uranium metal. XPS spectra obtained from a machine shows peaks of both Auger
and photoelectron lines. Nomenclature used for the photoelectron and Auger lines are different and
are shown in Fig.6 (Ref.7, page 11). Photoelectron lines are designated as s, p, d, and f levels (from
the shell the electron came out of), whereas the Auger electrons are designated using the x-ray
spectral designations, K, L, M etc. depending on the Auger process. Fig. 7 (Ref.7 page 194) shows
a survey spectrum obtained from Uranium metal using Al K-alpha radiation. It can be compared
with the energy levels of U shown in Fig. 5 (Ref.7, page 10).
Systems and Equipment:
XPS instruments analyze the first few atomic layers of the sample. Usually, these layers also contain
the contaminations from the atmospheres and the environment that the sample is exposed prior to
the sample reaching the laboratory. While enough care is taken to not to contaminate any further in
the laboratory, it becomes essential to remove the unwanted contamination from the surface of the
sample to reach the base material inside. An ion gun is used for this purpose and is an essential part
of a modern machine. There are several types of ion guns available but an Argon ion gun is most
common.
The main part of the machine consists of an x-ray generator unit with a filtration system for the
generation of monochromatic x-rays.
Vacuum systems are inherent to the design of the instrument. Better vacuum of the order of 1.0 x
e-10 can give excellent results, though a 1.0 x e -7 is generally adequate. The vacuum system is
an integral part of the instrument.
Charge neutralizers are equally important as the part of the XPS system when non-metallic materials
are analyzed, and come as an integral part of the XPS system.
X-Ray Source:
As mentioned earlier, XPS literature is clustered around sources that have either Al or Mg anodes
for the generation of x-rays, are relatively inexpensive, and can generate intense beams. The sources
start with fine electron beams (fineness of an electron beam can be controlled but is difficult to
control the fineness of an x-ray beam) on to a cooled but pure Al or Mg targets. The x-ray that
comes out of this electronic impact is an intense white radiation. As such this radiation can be used

for XPS but would create a large number of peak lines in the spectrum.
A narrow and often monochromatic intense beam is sought for XPS analysis which is accomplished
by filtering the white radiation generated from the source. For Al K-alpha radiation, a bent quartz
crystal is used. While the filtration reduces the intensity, to generate more intense beams, in some
advanced machines, seven such crystals are employed, arranged with one at the center and six others
around the center one. This configuration increases the intensity seven-fold compared to a single
crystal. Each crystal subtending the same solid angle with the source reflects only a narrow
wavelength (Al Kα) by the quartz crystal atomic layers. These crystals are not only bent to focus
the x-ray beam, but also are maintained at a constant temperature for constant lattice spacings.
Analyzers:
Electrons emerging from the sample are collected by field lenses, some designs may use a strong
magnet below the sample to focus these electrons to the analyzer. Generally, the analyzers are either
a hemispherical analyzer or a cylindrical mirror analyzer. Fig.8 (Ref.8, page 131) shows a schematic
of a hemi-spherical analyzer. In a hemispherical or spherical sector analyzer, the two concentric
charged hemi-spherical lens segments are charged separately such that the electrons coming from
the same electronic shell are focused to a point on the detector generating the signal for a spectral
line. A detector is generally a channel plate or an electron multiplier.
Modern machines employ a multi-channel plate with a computer for digital counting. Photo-
electrons hitting the multi-channel plate create pulses which are eventually counted as a function of
time. Sometimes the scans are repeated when the whole scanning process is also repeated. The
number of photo-electrons gathered at the channel plate constitute the height of a peak of a
particular binding energy and all the binding energies of all photo-electrons are covered by varying
voltages of the spherical analyzers.
Vacuum Systems:
The capacities of the vacuum systems are such that the vacuum levels at the sample chamber and
the analyzer is maintained very low to have a long mean free path for the photo-electrons
generated. Vacuum levels of the order of 1.0 x 10⁻⁸ or 1.0 x 10⁻⁹ torr are obtained using ion,
cryogenic or turbo pumps of adequate capacity attached to the analytical chamber. These pumps
are most efficient at high vacuum level and therefore are backed by a conventional mechanical
rotary or dry pump generating a vacuum level of around 1.0 x 10⁻³ torr. In most instruments, there
is also a sample preparation chamber prior to the analytical chamber to introduce the sample from
air and to expel volatiles. The vacuum level in this chamber is maintained at a lower level (around
1.0 x 10⁻³ torr). Samples with holders are introduced to the analytical chamber after they spend
enough time to remove most volatiles in this sample preparation chamber.
Charge neutralizers:
When photo-electrons leave the surface of a sample a positive hole is created. In conductive samples
the electron hole is neutralized by electrons coming from ground immediately (provided there is a
good connection to ground). For non-conducting samples, the positive hole remains on the surface
and attracts the ejecting photo-electron reducing its kinetic energy. Erroneously, due to the
reduction in kinetic energy, these electrons appear at a higher binding energy level on the spectrum
and broaden the peak. A charge-neutralizer attempts to compensate this effect by simply spraying
low energy electrons onto the sample surface. Thus a charge neutralizer is nothing but an electron
gun. It may appear simple, but the x-ray spot has varying intensity needing more electron at the

center of the spot for compensation which is not easily done. Modern XPS machines have complex
charge neutralizers to counteract this effect as much as possible.
Ion Guns:
Argon ion guns are extensively used for XPS analysis to remove material from or to clean the
surface of the samples being analyzed. In recent days, cluster atom ion guns are gaining popularity
for use in polymeric materials since the cluster ions prevent damage to the surface bonds often
encountered when argon ion guns are used.
An argon ion gun generates ions when argon gas is passed over heated wires carrying electricity.
While a small percentage of the flowing gas is ionized, these ions could be manipulated and focused
using a series of electro-static lenses to generate a scanning ion beam. The ions due to their heavy
mass compared to an electron in an electron microscope are difficult to manipulate and require
strong electrostatic force to focus. In any case, these charged ions hit the sample surface like
bowling balls and remove surface layers. The scanned area generally covers more area than the
area being analyzed.
Samples with uneven surface would be cleaned unevenly by an ion gun by creating a shadowing
effect as the guns are normally at an angle to the sample surface. To counteract this effect, the
samples are rotated around the point being analyzed. This is accomplished by placing the sample at
the center of the analytical stage. Some instruments have arrangements (called as eucentric stages)
where the sample and the stage rotate around the point of interest rather than around the center of
the stage.
Accessories:
Since XPS has an electron spectrometer, other analytical excitation sources such as an electron source for Auger Electron Spectroscopy and an ultraviolet photon source for Ultraviolet Photoelectron Spectroscopy (UPS) are often come as attachments to the main XPS instrument. Kratos ESCA shown in Fig.9 has attachments such as Fracture Stage and Reaction cell where fresh surfaces in metals and alloys could be studied in vacuum after their fractured inside the instrument or after a chemical reaction is exercised. In the Reaction Cell chamber, studies in catalysis and chemical reactions can be made after chemical reactions take place between the candidate materials and gases and the reaction products are transferred within the instrument under high vacuum to perform chemical analysis avoiding reactions with atmosphere. Fracture Stage attachment is used when the grain boundaries in alloys are suspected to be responsible for low fracture test values and need investigation.
Specimen Preparation:
As mentioned, XPS analyzes the first few layers on a specimen. It is therefore, important to not to
contaminant these layers by touching or mis-handling the specimen. This is especially true for
specimens targeted for failure analysis. Often times it has become necessary to use gloves that are
manufactured with no mold releasing agents (generally silicones as the silicones migrate to the
analysis sites and can give false indications for the presence of silicones).
Any sample exposed to air would show adsorbed molecules of H2O or CO2. These adsorbed
molecules must be removed to analyze the material underneath. Ion guns are employed for this
purpose. Ions guns are mounted at an angle to the sample surface, and therefore, non-uniform
cleaning occurs on an uneven surface. A flat surface or sample rotation is required to avoid this.

The specimen should be placed flat (as opposed to a small angle) to the x-ray beam. If the sample
plane interacts at a low angle with the x-ray beam surface areas are analyzed more than the inside
materials. This behavior is taken advantage of when a film or thin coating on the specimen needs
to be characterized. This is called as Angle Resolved Spectroscopy (AR-XPS) when the specimen
is tilted at different angles and analysis is performed providing more information on the surface or
the coating.
Powder specimens:
Powder samples can be mounted and analyzed using adhesive tapes. Since most tapes use organic
volatiles, tapes compatible with high vacuum in the analytical chamber should be used. Usually,
the powder would not cover the tape surface completely, carbon or silicon peaks on the tapes would
show up on the spectrum when the x-ray would fall on the uncovered areas.
Another technique effectively used to analyze powder specimens is by mounting the powder in soft
metals such as Indium. In this case, the powder is placed on an Indium sheet and the sheet is folded
over to retain the powder inside. Generally, the Indium piece that is used as a sheet is cut from a
small Indium ingot with a sharp knife such that the clean knife creates two fresh surfaces where the
powder would be placed (on one side only) on one of the fresh surfaces. The folded Indium sheet
is then flattened further by rolling or hammering. This process not only embeds the powder into the
metal sheet, but also, the particles get squeezed to make good electrical contact. The two folded
sides are then separated to expose the powder and then the embedded powder is analyzed. In this
case the In lines are seen in the spectrum obtained along with the spectrum of the powder.
The powder can also be briquetted to generate a flat surface for analysis using a die and punch.
While this process generates a solid specimen for analysis, there is always a small amount of
material transfer from the die and punch. Care also should be taken that the specimen does not
transform to a compound under high pressure and adiabatic temperature rise when the die and the
punch are squeezed.
Specimens required for the XPS analysis are small and may be cut using wire saw or a diamond
wheel. However, the surface of specimens would be contaminated with cutting fluid or the cutting
blade materials. The analyst needs to know such material/chemical information of the fluids and
the saw materials.
Sample Charging:
Sample charging is inherent with insulators. For semiconductors, it depends on the incoming x-ray
intensity. Conductive metals can also accumulate charge if the electron holes are not filled quickly
by the electron from the instrument body. Most instruments incorporate spring clips or flat springs
in their stage designs to make the contact as good as possible. While the charging effect distorts the
spectrum completely in insulators, they can shift the spectrum slightly in alloys. It is important,
therefore, that the specimen be loaded to the analytical chamber such that enough conduction path
for electrons exists.
Mounted metallographic specimens cannot be analyzed due to lack of conductivity and the
outgassing of the embedding matrix. To improve the analytical situation the mounting material must
be of very small amount and a gold (or any other known coating) may be applied to provide
conductivity. The mounts should spend enough time in the pre-analytical (or sample preparation)
chamber prior to their insertion to the analytical chamber to remove volatiles.
Charge compensation in modern instruments are done by supplying electrons to the location where
the x-ray beam is falling spot. However, for some instruments, the intensity of the x-ray spot is not
uniform across. This poses problems due to some areas of the spot not being able to compensate.

Some instruments have their patented charge neutralizing combination of low energy electron gun
with a mesh-screen device shown in Figure 10. The device incorporates a very thin stretched nickel
screen on top of the specimen holder and the specimen placed about 0.5 to 1.2 mm below the screen.
The flood gun throws low energy electron on to the sample through the screen (Ref. 9).
Calibration and Accuracy:
Most machines are calibrated using lines for noble metals such as Au, Ag, and Cu. Excepting gold,
other pure elements react with the atmosphere to form oxides or sulfides on the surface that need to
be cleaned by sputtering. Thus, the calibration material is common but must be clean.
Most metals exposed to atmosphere are covered with carbon known as ‘adventitious carbon’ from
the atmosphere. This is saturated carbon and is taken advantage of as the reference for the entire
XPS binding energy spectrum from 0 eV to 1200 eV. The position for C 1s line is 284.6 (some take
it as 284.4 or even 285 eV). The span of binding energy is calibrated with respect to the BE for
copper 3s (122.4 eV) and copper 2p3/2 (932.5 eV).
Older systems such as those made by SSI ask for daily check of gold (Au 4f7/2) at 83.98 eV and
the split of 4f lines for Au to be at 3.68 eV. For SSI X-Probe, sanity of the machine is checked from
the Au 4f line separation (to be at 3.68 eV ±0.02eV) and the location of the Au 4f7/2 line to be at
83.98±0.1 eV. The width of the peak at half height (FWHM) of the peak should be 0.95 eV. In
addition, the integrated intensity of the peak should be at least 60,000 counts. Modern instruments
which incorporate intense monochromatic x-rays such as the one shown in Fig.9 are expected to
yield ten times more counts for the same lines. Kratos uses Ag 3d5/2 peak at 368.3 eV for their
intensity calibrations and system health check.
XPS machines have several adjustments to generate the desired spectra. Pass Energy regulation
allows control of passing electrons of a narrow energy band to reach the channel plate. A low pass
energy means fewer bandwidth of electrons being collected which indicates a higher resolution
spectrum. To get a high resolution spectrum with sufficient counts, an intense x-ray beam is
essential, however, machines with low intense beams accomplish high resolution by increasing the
analysis time. Fig.11 shows the Si2p line split with low pass energy using Kratos AXIS Ultra
spectrometer with high resolution.
Accuracy:
The spectrum obtained from XPS has two types of information in two axes of the spectrum. They
are the binding energy in eV and the intensity of the photoelectron line. The binding energy gives
information on the binding state of an atom e.g., whether the O is present as an oxide, di-oxide, or
sulfate. These states are estimated from the line shift. Such chemical shifts are often small and
when accurate, provide useful information. It is estimated that a well performed analysis would
have an accuracy of about +/- 0.2 eV of the line position depicted in the literature.
The intensity, or the area under the curve that constitute a peak, depends on a number of factors
including sample charging, interference from other peaks, sample thickness, sample inclination to
the beam, etc. This peak integration in a resolution that is estimated to be around 10%. In the next
section, “Data analysis and Reliability” some aspects of this accuracy in quantitative analysis is
elaborated.
Data Analysis and Reliability:

Quantitative surface analysis by XPS requires several operations including the specimen preparation,
adjustment to machine parameters, and data manipulation by the operator that effect the level of accuracy.
The final result in terms of uncertainty in measurements is the total amount of uncertainty introduced by
all these operations.
The most useful aspect of XPS is the shift of binding energy lines due to chemical interactions between
atoms. These shifts and the presence of other reacting elements establishes the nature of compounds that
are present on the surface of the sample. Shift in spectral lines are then compared with the shifts available
in literature and other data bases and handbooks (Ref. 7 and 9). Fortunately, there is not a lot of variation
in the measurements of line positions. Even if there is a small amount of charging effects seen on the
sample (and as a result there is a small amount of shift in the line position) the difference between other
line positions for elements that are suspected to be inactive (such as the adsorbed oxygen or carbon on
the surface) can be used as reference and their position differences can be used for the actual shift
determination. There are several data bases that are available (Ref. 7,9, and 10) but should be used with
caution as data from older instruments, perhaps obtained using non-monochromatic radiation may have
been included in them. It is always good to go to the original publication to know how the original
experiments were carried out. In any case, there may be a variation of about 0.2 eV between two
experiments so far as the line positioning is concerned.
The intensity of the photoelectron lines is an aspect which reduces confidence in the quantitative
analytical results of XPS. The following illustrates why such is the case. In the XPS process it is assumed
that the number of electrons collected and detected for a given transition are proportional to the number
on the surface being analyzed. What is not correct in this assumption is that all the ejected electrons are
accounted for. Electrons with higher or lower energies than the ones forming the main photoelectron peak
due to acceleration or retardation by overcompensation or under compensation of specimen charge
compensation system tend to shift away from the detection by the spectrometer. They broaden the peak
and make the peak asymmetric. This phenomenon effects spectrum for insulating samples where the
peaks are wider than those obtained for conducting specimens. In general, however, the peaks are
broadened to the high binding side of peaks and may even create separate lines (Shake-up lines in
polymers). To separate the background from the peaks, one of two popular methods are incorporated in
commercial softwares. The background separation from the peak can be made by a straight-line by joining
bottommost points of the peaks or they can be joined by a Shirly curve (Ref. 11). The Shirley curve shape
is determined by an iterative process where the background intensity at a point is proportional to the total
peak area above the back ground and to higher energy.
Fig.12 (Wikipedia) compares simple background subtractions such as linear or quadratic to a curved
Shirley background. Background corrections by Tougaard (Ref.10,12) have been claimed by some to be
better than Shirley corrections. The background subtraction is inherent to the software used and may be
different for different XPS instrument manufacturers.
Once the background has been subtracted, the intensity of the peak remains and it is processed using the
software that eventually leads to a composition table. When performing these calculations, Relative
Sensitivity Factors (RSFs) are used to scale the measured peak areas so that they are related to the amount
of material present on the sample. RSF calculations date back to Scofield’s report (Ref.13) from early
70’s and are modified to instrument design. For example, for Surface Science’s SSX-100 software, an
Adjusted Sensitivity Factor, SF is modified such that it is equal to SFo multiplied by {(Al Kα – B.E.)/( Al
Kα – C 1s)}x where, B.E. is the Binding Energy of an electron from Scofield Table (Ref.13), Al Kα=
1486.6 eV, C 1s is the Binding Energy for C 1s, and x has a default value of 0.7. Following Table lists
some SF values of Fe taken with C 1s as 1.0:

Line SF Line position
C 1s 1.0 284.6 eV
Fe 2p3 10.82 710.0 eV
Fe 2p (doublets incl.) 16.42 710.0 eV
Fe 3p 1.669 56 eV
It is easy to see from the above table why the quantification for Fe analysis could be erroneous when one takes a single peak vs. a double peak. Software from Casa XPS (Ref.`10) list three RSF values for doublets depending which one of either of the doublets or both doublets together gain consideration for calculation. For SSX-100 software, the C 1s (SF taken as 1.00). Other machines by Physical Electronics or Kratos take F 1s as reference (value taken as 1.0). Figure 13 shows the Sensitivity Factors for elements (at top right-hand corners for each element) for an XPS machine by Physical Electronics where the x-ray source is at 90 degrees to the axis of the analyzer, along with other physical parameters (Ref. 7 page 261).
For metals and alloy analysis, polished surfaces of standard alloys can be used and peak areas evaluated for
the known and unknown samples. With background appropriately subtracted, the peak area ratios between
known and unknown specimens can yield reliable results.
Data Analysis:
An XPS spectrum is displayed as a plot between the intensity (number of electrons of a definite binding
energy) in the ordinate and the binding energy in the abscissa. Sometimes the binding energy is replaced
by the electron kinetic energy. The binding energy plots increase from right to left whereas the kinetic
energy plots increase from left to right. Data analysis starts with the identification of lines that are easily
found in the XPS spectrum. The first step in line identification is to look for lines such as C 1s (known as
adventitious carbon originating from the environment) and the O1s lines. C and O are invariably present on
the surface which is unsputtered and unclean. They may be present even after light sputtering. After
sputtering by Argon ions, one is expected to see Ar lines around 241 eV and may be used as reference too.
It is important that both the C 1s and O1s appear as thin and sharp lines, otherwise, sample charging is
suspected. The C 1s and O 1s line widths can be compared with the instrument standards and watch for
deviations. In some instruments there is a possibility to adjust charge neutralizer parameters such that the
width at half peak height (FWHM) is minimized and the position for these lines are noted. Even after such
manipulations, the C 1s and O 1s lines may be found wider than the instrument specifies, indicates other
peaks hiding inside. Fig.14 shows side-by-side scans by two machines for a common reference polymer,
PET (Poly-ethylene Terephthalate) (Ref.9 page252 and Ref.14). It is interesting to see that even if all carbon
peaks are resolved clearly, earlier instruments provide wider peaks and in some cases may not be able to
resolve peaks to the satisfaction of the operator.
Once the C1s or O 1s line is identified and its position is determined accurately at 284.6 eV (for C 1s), other
intense lines should be identified. Once done, smaller and perhaps wider lines such as the shake-up, satellite
or Auger lines associated with the main intense lines could be identified. Following this, the low intensity
lines are generally identified. It is also possible that the most intense lines of an unknown element present
in small quantities can show up as a small peak. At the conclusion, spin doublets for p, d, and f lines are
identified. They should have the right separation and height or intensity ratios. Multiple splitting and shake-
up lines can also be utilized for chemical identification (Ref.7 page 20).

Important advantage of XPS analysis is its ability to measure small shifts due to chemical interactions in
compounds. These shifts are small but measurable. These shifts are based on experimental data since
theoretical calculations are not satisfactory. Handbooks and reference data (Ref. 7, 10) on shifts of main
elemental lines have been compiled and provided for operators’ references.
Curve Fitting:
Often several peaks are superimposed resulting in skewed or wide envelopes for peaks. Most commercial
XPS software provide a peak-fitting algorithm along with the peak identification software. Each of these
programs have options for line positions for one or more peaks inside the large peak envelope. One can also
adjust peak widths and different types of back ground subtractions so that the peaks best fit the large peak
envelope. The fitting is done by the software and the extent of the curve-fitting is also calculated. The
instrument operator has only to check the possibility of the existence of such peaks. See Fig. 15 (Ref. 14,
page 196-197) for the fitting inside of C 1s line for Nylon 6, 6 and can be compared it with binding of
carbon atoms on the molecular chain in page 196.
Valence Band Spectra:
Valance band spectra, in the range of -5 eV to about 50 eV, has been found to be useful in several cases
where the core level shift is subtle, valence band spectra have been employed. These spectra have also been
used as fingerprints of materials rather than identifying a specific molecular orbital. Fig. 15 also shows
valence band spectrum for Nylon 6,6 (ref. 14, page 197).
Applications and Interpretation:
From the very onset of the development of commercial XPS systems with the associated monochromators
and ion guns, XPS has emerged as a very useful tool in all kinds of analysis. Due to its ability to analyze
monolayers of surface materials and that, can detect elements above the atomic number Lithium, and the
presence of elements being registered in the form of sharp peaks, initial researchers used the technique
extensively to understand catalysis. Since the surface contamination can be removed by Argon sputtering,
and that the metals and alloys are conductive, metallurgical analyses can easily be performed and has taken
center stage for the analysis of coatings, plating, study of diffusional processes, development of materials
for adhesion and metallic bonding, as well as applications in microelectronics. The most attractive
capability of XPS is perhaps in the analysis of polymers, their failure analysis, production issues and
characterization capabilities as significant bonds in polymers could be resolved. With advancements in x-
ray sources, cluster guns and imaging capabilities, XPS is useful for investigating almost all surface
problems. Below are examples (brief summary of reports) of how XPS data can be used to solve problems
with existing surface interactions, or to investigate new materials.
General applications of XPS analysis includes (1) identification of unknown substances or material
characterization, (2) measurement of layer thickness in layered engineering materials, (3) quality control of
products with thin coatings, (4) contamination analysis, and (5) general failure analysis where failure is
investigated using XPS as a tool. What follows are examples of cases where XPS has been successfully
employed in resolving or analyzing problems that cannot be done by other analytical instruments such as
electron microscopes or electron microprobe analyzers.

Example of #1: Rhenium (Re) is an expensive but a ductile high temperature material. A rocket engine
(thruster) with Re liner was tested and at the end of testing there was a clear liquid found all around inside
the engine. The samples were brought to the NASA Marshall Space Flight Center laboratory using a cotton
swab. To analyze the residue, the cotton swab was rubbed on an aluminum foil and the residue, though
nearly invisible to the naked eye, was transferred to the aluminum foil. The sample spent one hour in the
preparation chamber and then analyzed using a Surface Science SSX-100 XPS machine. Several Re peaks
were identified indicating the residue to be ReO3. There were also other Re oxides (ReO2, ReO) present.
Re oxides are hygroscopic that was the reason the sample looked clear after absorbing moisture.
Example of #2: Several optical materials such as mirrors, radiation deflectors, and lenses used by NASA
are made from layered materials of different physical properties. The thickness of these layers can be
measured by sputtering using the Argon ion gun and followed by chemical analysis to verify chemistry of
the individual layers as they are removed. It is assumed that the sputtering rate of various substrates are
nearly same and that the gun at its maximum capacity (commercially available) removes about 1.0
angstroms thickness per seconds for SiO2. However, sputtering rates are not same for all matrices under the
same ion gun settings. Sputtering rates of some of the substrates (relative rates at 4KV gun voltage) are as
follows (Ref. 7, page 27).
Target Sputter Rate
Ta2O5 1.00
Si 0.90
SiO2 0.85
Pt 2.20
Cr 1.4
Al 0.95
Au 4.10
Therefore, care must be taken and sputtering rates for each material needs to be calibrated for accurate
thickness determination.
Example of #3: Carbon fibers are coated with materials that aids in the adhesion of fibers to the matrix.
Chemistry and amount of this coating material can be evaluated using ESCA since the fibers are very fine.
To perform this analysis, a bunch of fibers are pressed and clamped to create a flat surface such that the
surface created is covered by fibers. The surface with its attachment for the bundle is introduced into the
analytical chamber and the coating can then be analyzed.
Example of #4: Contaminations on surfaces are a big problem when two surfaces are not able to bond
leading to exfoliation, corrosion, or bulging of paint on a painted surface. This calls for a surface analysis
and a possible remedy of the failure. Contamination on one of the inside layers on a multi-layered material
becomes challenging since removal of layers by sputtering is very slow process and may not be uniform.
There are several examples of contaminants in engineering components. They generally are body oils,
lubricants, remnant chemicals from a cleaning process often originating from negligence during or after

manufacturing. To minimize such contaminations, production facilities use clean rooms and the operators
use gloves and face masks during handling of critical hardware.
It is important, therefore, that the samples reaching the laboratory must be pristine so that the traces of the
contaminants remain on the surface and are not further contaminated. For exfoliating paints or plating, the
paint or plating could be peeled and the contaminated surface could be analyzed. Silicone contamination is
a big culprit of non-adherence and can be easily identified using XPS. For silicones the Si 2p binding energy
peak lies between that of SiO2 and the Si element.
Example of #5: XPS can be used as a general tool for failure analysis. Examples would be identifying
materials on a fracture surface. This can be accomplished despite the fracture surface could be rough and
uneven. The example could be identification of chloride salts on a stainless-steel fracture surface. At NASA
Marshall Space Flight Center fracture surface of a rocket engine component made from Niobium was
analyzed. XPS analysis of the surface indicated to have reacted to fluoride containing lubricants resulting
in compounds such as NbO2 F. It is believed that the lubricant reacted with the surface to produce this
compound and possibly helped propagate the crack.
Failure analysis of polymeric materials exposed to x-ray and other radiations can be accomplished by taking
advantage of loss of peak ratios from data bases (Ref. 14 page 45). Peak ratio losses as function of time are
shown in Fig. 16. This indicates that the polymers are degraded by exposure to x-ray during analysis and
their ratios would indicate the length of exposure that could be related to failures.
Examples from Manufacturer’s websites:
Currently, there are three main manufacturers of XPS machines. They are: Physical Electronics
Incorporated (PHI), (www.phi.com); Thermo Fisher Scientific Inc., (www.thermofisher.com); and Kratos
Analytical Limited (www.kratos.com). All the three have application sections in their websites. Following
pages are excerpts from the websites and the websites may be visited for details of what follows. It is always
worthwhile to visit their websites as they have examples of advanced applications, continuously developing
capabilities, and XPS applications for new materials.
Physical Electronics (Ref.15)
Lithium Battery Electrode Analysis: XPS is routinely used to study the surface composition of Li battery
electrodes as a function of use, which is critical to understanding the mechanisms that may limit the life of
a battery. Due to the reactivity of Li battery electrode surfaces it is important to have the ability to transport
samples from a controlled environment, such as a glove box, to the surface analysis instrument under
vacuum or with an inert cover gas. Shown in Fig.17 are spectra from a lithium anode surface with and
without air exposure. The observed surface chemistries show how important it is to protect a lithium anode
surface from air exposure prior to analysis.
When Li surface is exposed to air, it forms carbonate but when the sample is not exposed, it will show
oxides and hydroxides on anode surfaces. XPS surface analysis can show these differences, see Fig.17.
Fuel Cell Membrane Characterization: Fuel cell membranes are multi-layered materials with a permeation
membrane and two thin layers of noble metal in a polymer matrix acting as anode and the cathode,
respectively, of the fuel cell. Cross-sectional chemical analysis of these membranes is useful for studying
mechanisms that impact life and performance of a fuel cell. Fig.18 shows XPS chemical state distribution

images from an aged fuel cell membrane that indicates degradation by fluorocarbon products in the anode
and cathode regions.
Contamination Identification on Polymer Surfaces: XPS has the capability to chemically characterize
contaminants on a polymer surface. In this case, a scanning x-ray beam induced secondary electron image
of the optically transparent PET sample revealed the presence of unexpected localized surface contaminants
on the polymers surface. Micro-area XPS spectra obtained with a 20 μm diameter x-ray beam quickly
identified the contaminant as a fluorocarbon (See Fig. 19).
Termo Fisher Scientific (Ref.16)
XPS Evaluation of Wear Resistant Coatings: Additives in lubricating oils play an important role in forming
friction modifying layers on metal surfaces. Calcium sulfonate additives in lubricating oil, as well as zinc
dialkyldiphosphonate (ZDDP), are used to deposit wear resistant layers on steel surfaces. It has been
observed that ZDDP forms a protective, glassy phosphonate coating on surfaces under tribological loads.
In this study various ratios of calcium sulfonate in oil and ZDDP were used.
Three tribological samples were tested in this evaluation. They are: GOODNEW, BADNEW, and GOODOLD.
Although, full details of all three samples were unavilable, the GOODOLD sample was in the tribology test
rig for a long time showing good tribological properties; GOODNEW sample behaved well under the
tribology test rig whereas BADNEW did show to have unusual tribological parameters in the test. All three
samples were analyzed using monochromatic XPS. Some of the results are shown in Fig.20.
Two of the samples, labelled GOODOLD and GOODNEW, were shown to have good friction stability
properties and XPS showed that the presence of calcium carbonate tracks on these samples. A third sample,
which was known to have poorer friction stability properties, labelled BADNEW, had virtually no calcium
carbonate on its surface. XPS analysis showed that the correct ratio of ZDDP to calcium detergent will
result in the formation of calcium carbonate during tribological load, and it is this carbonate that confers
good friction stability properties. Calcium carbonate, however, did not form on the BADNEW sample,
indicating an inappropriate ratio of ZDDP to detergent in the oil formulation.
XPS Analysis of a Surface Contamination on a Steel Sample: Ensuring a surface is free from contaminants
is extremely important in guaranteeing that materials such as steel meet their desired performance
specification. Surface contamination of steel can result in problems such as adhesion failure and contact
bonding problems when components are used in manufacturing. Surface contaminants can also result in an
“unsatisfactory” appearance for many steel finished products such as ovens and other domestic appliances.
In addition, surface contaminants are often the source of cross-contamination, corrosion and electrical
contact problems. Many of these surface contamination issues are difficult to detect during or after
production of manufactured goods using steel parts. XPS was used to analyze surface chemistry to identify
the contamination.
In this investigation, an area (3.7 mm × 4.8 mm) of a stainless steel surface was investigated and several
elemental maps were acquired by scanning the sample stage under the X-ray spot and collecting the spectra.
The atomic concentration maps of the analyzed area were taken and integrated. The maps show clearly the
difference between clean stainless steel and the contaminated areas. The contamination was identified to be
an organic residue.
Kratos Analytical (Ref.17)
Applications in Ionic Liquids Characterization: In the past ten years or so, ionic liquids have become an
area of increasing popularity in academic research which has resulted in the stellar rise in the number of

publications in this field. This rise can in part be attributed to the wide ranging applications these novel
materials can be adapted to. Only recently has this new field attracted the attention of a growing number of
surface scientists interested in exploring the interactions at the both the liquid/gas and liquid/solid
interfaces. Of particular interest is the structure and composition of the liquid/gas interface as this is where
the adsorption and desorption of gasses occur. These activities are known to play key roles in processes
such as heterogeneous catalysis and gas distillation and separation. Aside from such obvious applications,
the surface analysis of ionic liquid helps in the fundamental understanding of these unique
materials. Website provides a list of publications where Kratos AXIS spectrometers have been used to
generate valuable XPS data from ionic liquid characterizations.
Coatings and Thin Films: Surface coatings and thin films are of great commercial importance in many
industries and are used to enhance or provide required properties to bulk materials specific to their
applications. Thin films can range from tens of Angstroms to several microns in thickness and find
application in areas as diverse as optical anti-reflective coatings, architectural glazing and drug eluting thin
films in the pharmaceutical industry. XPS is ideally suited for characterizing the surface chemistry of these
thin films and when combined with sputter depth profiling can be used to determine the elemental and
chemical composition as a function of depth through the film using XPS spectrometers.
Polymers: Polymer materials are finding ever increasing application in numerous consumer
products. Applications of polymer materials range from fields as diverse as food packaging to organic
electronics and biomaterials to automotive body panels. The surface properties of these materials are often
vital in determining performance of the polymer for the specific application. X-ray photoelectron
spectroscopy is ideally suited to the surface characterization of these polymer materials as it can provide quantitative chemical state information from the upper 10nm of the material.
The majority of polymer materials are insulating and therefore effective charge compensation is paramount
if generating high resolution spectra with monochromatic x-rays. The performance of modern
spectrometers is demonstrated by the guaranteed performance on PET (Polyethylene terephthalate) where
the FWHM of the component corresponding to the ester group is <0.68 eV (see Fig. 14) with a sensitivity defined by the maximum of the hydrocarbon peak counts greater than 12 kcps.
An interesting aspect of polymer characterization is the use of cluster ion guns. Kratos website literature
demonstrates the advantages of polymer characterization by high resolution XPS combined with
Arn+ cluster depth profiles.

Fig. 1: Shows the electronic transitions involved in an XPS (ESCA) process. It shows Al
monochromatic x-rays coming from to left to a copper sample. Ejected electron from the
shells are knocked off and collected by the XPS spectrometer to produce a spectrum (top
right). The peak correspondences have been illustrated.

Fig.2 – Magnesium x-ray satellite peaks seen for around
the C1s peak for graphite. Binding energy displacements
are α3 at 8.4 eV, α4 at 10.1, α5 at 17.6, α6 at 20.6, and β at
48.7 (Ref.7 page 18).

Fig. 3: Shake-up lines (2p) as seen for some copper
compounds (Ref. 7 page 19).

Fig.4 – Surface and bulk plasmon lines associated with Al 2s at
normal and grazing take-off angles (Ref.7 page 21).

Fig.5 – Relative Binding Energies in eV
(x-axis) for a Uranium atom (Ref.7
page 10)
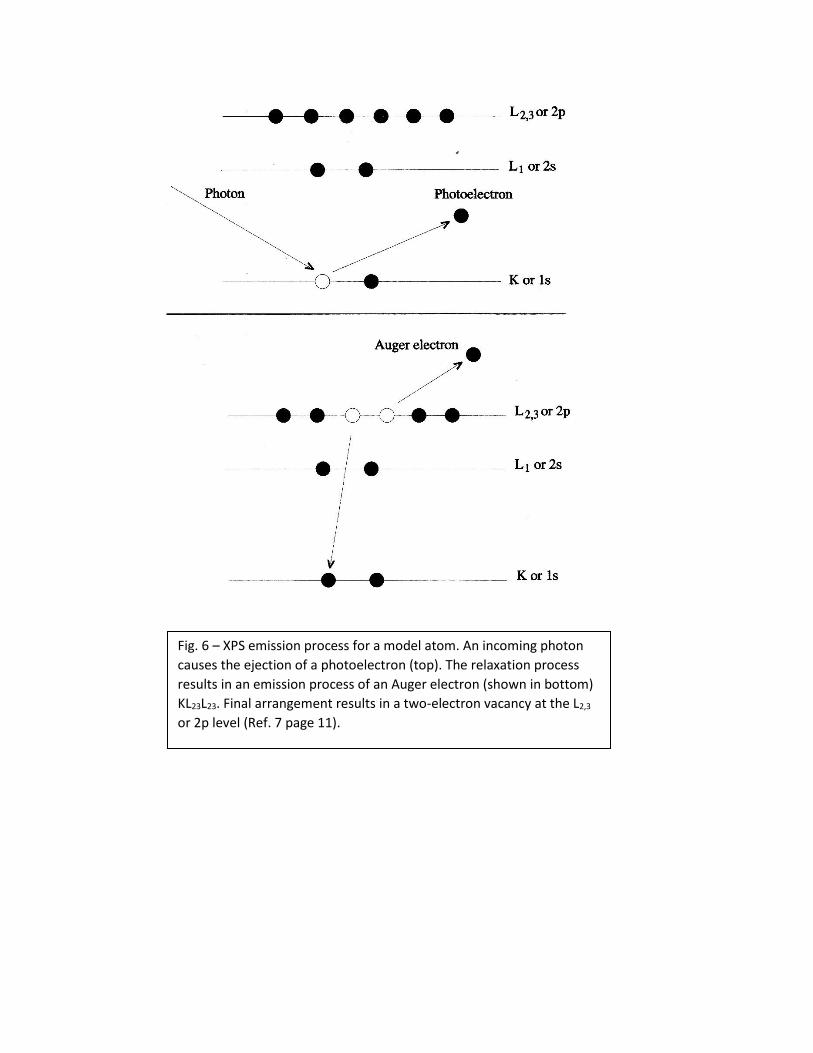
Fig. 6 – XPS emission process for a model atom. An incoming photon
causes the ejection of a photoelectron (top). The relaxation process
results in an emission process of an Auger electron (shown in bottom)
KL23L23. Final arrangement results in a two-electron vacancy at the L2,3
or 2p level (Ref. 7 page 11).

Fig. 7 – Photoelectron spectra from Uranium using Al
monochromatic radiation (Ref. 7 page 194).
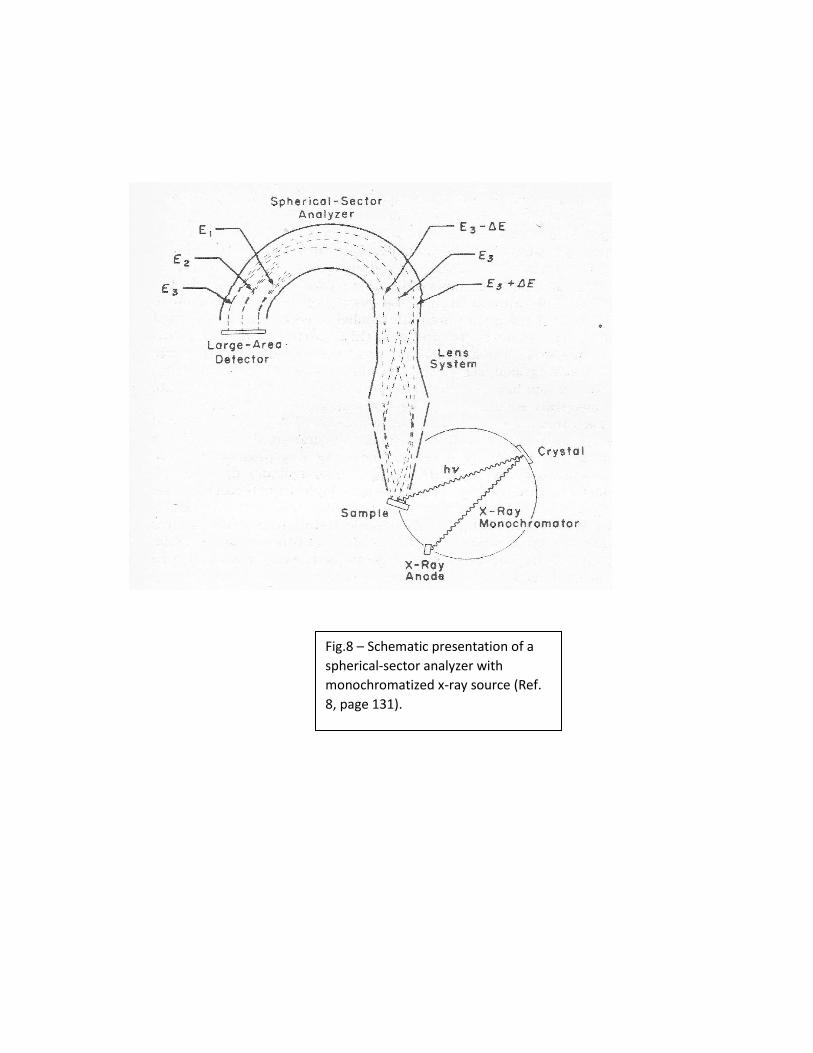
Fig.8 – Schematic presentation of a
spherical-sector analyzer with
monochromatized x-ray source (Ref.
8, page 131).

Fig.9 – XPS Machine (Kratos AXIS Ultra) with
fracture stage, UPS, Auger attachment, and
a reaction cell (at the back – not shown).

Fig.10 – Charge neutralization cage for insulators
goes on SSX-100 machine. The nickel screen is not
shown but goes on top. The spring around grabs it
and keeps it in place; sample goes inside the cage.
The whole fixture is mounted at the bottom and
goes to the analyzer stage.

Fig.11- Splitting of Si 2p line by a high
resolution spectrometer.
FWHM Si 2p3/2
0.439 eV
Si 2p1/2
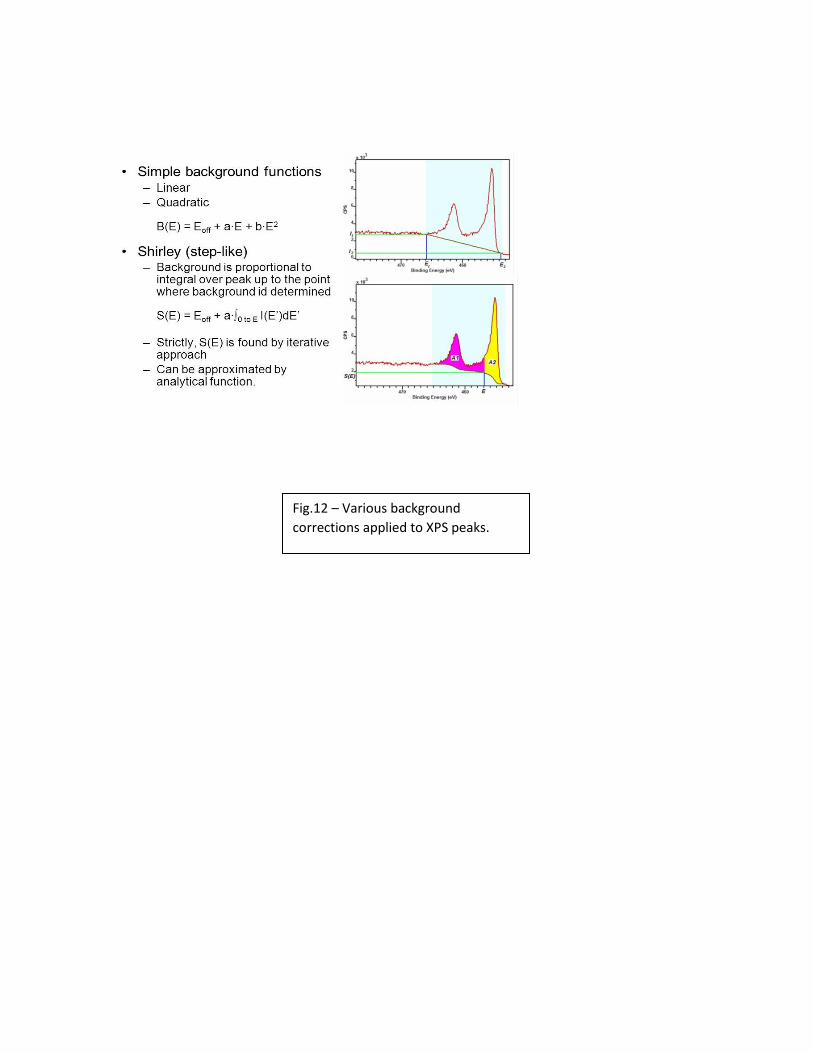
Fig.12 – Various background
corrections applied to XPS peaks.

Fig. 13 – Sensitivity Factors along with
other physical properties of elements.

Fig. 14 – Compares PET scans (C 1s area) in two XPS machines, top
from SSX-100 and, bottom, Kratos Axis Ultra. Notice the peak
widths.
Peak Position FWHM Raw Area Atomic BE (eV) (eV) (CPS) Conc %
C 1s CC,CH 285.077 0.896 29875.7 58.96 C 1s C-O 286.626 0.896 10062.6 19.86 C 1s ester 289.053 0.690 8364.6 16.50 C 1s sat 291.988 1.712 2369.7 4.68

Fig.15 – Spectrum from Nylon 6,6. Curve fitting of C 1s line is
shown on top left. Bottom part shows the formula and the
position of various carbon peaks fitted to C 1s at top left. Valence
band spectra is seen at middle on right.

Fig. 16 – Compares carious polymers as they get
damages due to exposures to x-rays. Top is the loss of Cl
intensity whereas the bottom is the loss of O peaks. (Ref.
14, page 45 Figs. 28 and 27 respectively).

Fig. 17 - Lithium Battery Electrode Analysis using XPS
shows details revealed, with and without any air
exposure. Ref.15

Fig. 18 – Left shows F 1s spectrum region corresponding to the chemical state
images on the right. Chemical state image showing the presence of
fluorocarbon chemistry at the center (blue) and the degradation products,
fluoride chemistry, in the anode and the cathode regions (green). Ref.15

Fig.19 – Contaminant analysis on a
PET sample identified as a
fluorocarbon. Top left is a Scanning
Electron Microscope image, Top right
is XPS scans from contaminant (red)
and the PET (blue), and bottom left is
detailed C 1s region. Ref.15.
Fig.20 - It shows spectrum obtained around C 1s on all three samples. It
is seen that GOODOLD shows significant carbonate compared to the
other two; BADNEW shows the least amount of carbonate. Ref. 16.

References:
(1) Albert Einstein, Ann. Physik, vol.17, 1905, p 132.
(2) H. Robinson, Phil. Mag. Vol. 50, 1925, p 241.
(3) K. Siegbahn et.al., ESCA: Atomic, Molecular and Solid State Structure Studied by Means of
Electron Spectroscopy, Almqvist and Wiksells, Stockholm, 1967.
(4) K. Siegbahn, D. Hammond, H. Fellner-Feldegg and E.F. Barnett, Science, vol.176, 1972, p 245.
(5) K. Larsson, C. Nordling, K. Siegbahn, and E. Stenhagen, Acta. Chem. Scand. vol. 20, 1966,
p.2880.
(6) B. Vincent Crist, Ph. D., Wikipedia.
(7) Handbook of X-Ray Photoelectron Spectroscopy, Physical Electronics, 1995 – various pages.
(8) Methods and Phenomena 1, A. W. Czandrerna Ed., Elsevier Scientific Publishing Co., 1975,
p.131.
(9) Handbook of Monochromatic XPS Spectra, B. Vincent Crist, John Wiley & Sons. Ltd. 2000, p
xv.
(10) Casa XPS data bases – Casa.XPS.com.
(11) D.A. Shirley, Phy. Review, B5, 1972, p. 4709.
(12) Background subtraction: 1. General behavior of Tougaard-style background in AES and
XPS by M. P. Seah, vol.420, Surface Science Issues 2-3, January 1999, p. 285.
(13) J. H. Scofield, Journal of Electron Spectroscopy, vol.8, 1976, p.129.
(14) High Resolution XPS of Organic polymers, G. Beamson and D. Briggs, The Scienta
ESCA300 Database, John Wiley & Sons, 1992, p.174.
(15) Physical Electronics Inc. website: www.phi.com.
(16) Thermo Fisher Scientific Inc. website: www.thermofisher.com.
(17) Kratos Analytical Limited. Website: www.kratos.com.