Embed Size (px)
Citation preview

1
X-RAY STRESS MEASUREMENT OF NICKEL-BASE SINGLE CRYSTAL SUPERALLOY USING TWO-DIMENSIONAL DETECTOR
Keisuke Tanaka*, Shutaro Machiya** and Yoshiaki Akiniwa***
*Department of Mechanical Engineering, Meijo University, Nagoya, Japan**Department of Mechanical Engineering, Daido Institute of Technology, Nagoya, Japan
***Department of Mechanical Engineering, Nagoya University, Nagoya, Japan
ABSTRACT
The stress in a single crystal of nickel-base superalloy with 72 % volume fraction of '-phase was measured by the X-ray method. The specimen whose surface normal was parallel to [001] direction was oscillated around -axis during recording of the X-ray diffraction pattern with a two-dimensional position sensitive proportional counter (PSPC). The stress was determined from the measured strain using the multiple regression method and the two-tilt method. The uniaxial stress was applied along [100] direction and three stress components were measured with the X-ray methods. The stress along [100] direction, 11, measured with the X-ray method increased proportionally to the applied uniaxial stress, and the measured stress was about 5 % smaller than the applied stress. The other stress components, 22 and 12, did not change with the appliedstress. Those two methods were applied to measure the machining residual stress of the specimen made for fatigue tests. The residual stress was a compression of about 700 MPa on the surface and quickly decreased to zero at about 15 m beneath the surface. The increase in the full-width at half maximum was observed within the depth of about 15m from the machined surface, corresponding to the depth of the compression zone.
INTRODUCTION
Nickel-base superalloys are widely used as high temperature materials in turbine blade of gas turbine engines. The superalloys are monocrystalline or have coarse-grained structure to achieve a high creep resistance. The fatigue properties are also important to guarantee the performance as turbine blades. The residual stress may have an influence on creep properties as well as fatigue strength. To understand the influence of the residual stress on high temperature properties of superalloys, the X-ray measurement of stress in single grains is necessary. The multiple regression method is a versatile method to measure the stress in single crystals [1], and more simple two-tilt method can be used for the cases of cubic single crystals with special orientation [2]. These two methods were applied to measure the stress in single crystals of silicon in our previous papers [2,3].
In the present study, the multiple regression method and two-tilt method are used for stress measurement of single crystals of nickel-base superalloys whose crystalline structure is cubic. The accuracy of the measured stress was first examined to measure the loading stress of the specimen subjected to four-point bending. The method was applied to measure the residual stress below the ground surface. The full width at half maximum (FWHM) of the diffraction profiles is also measured to observe the distribution of plastic strain below the surface.
405Copyright ©JCPDS-International Centre for Diffraction Data 2009 ISSN 1097-0002Advances in X-ray Analysis, Volume 52

This document was presented at the Denver X-ray Conference (DXC) on Applications of X-ray Analysis. Sponsored by the International Centre for Diffraction Data (ICDD). This document is provided by ICDD in cooperation with the authors and presenters of the DXC for the express purpose of educating the scientific community. All copyrights for the document are retained by ICDD. Usage is restricted for the purposes of education and scientific research. DXC Website – www.dxcicdd.com
ICDD Website - www.icdd.com
Advances in X-ray Analysis, Volume 52
2
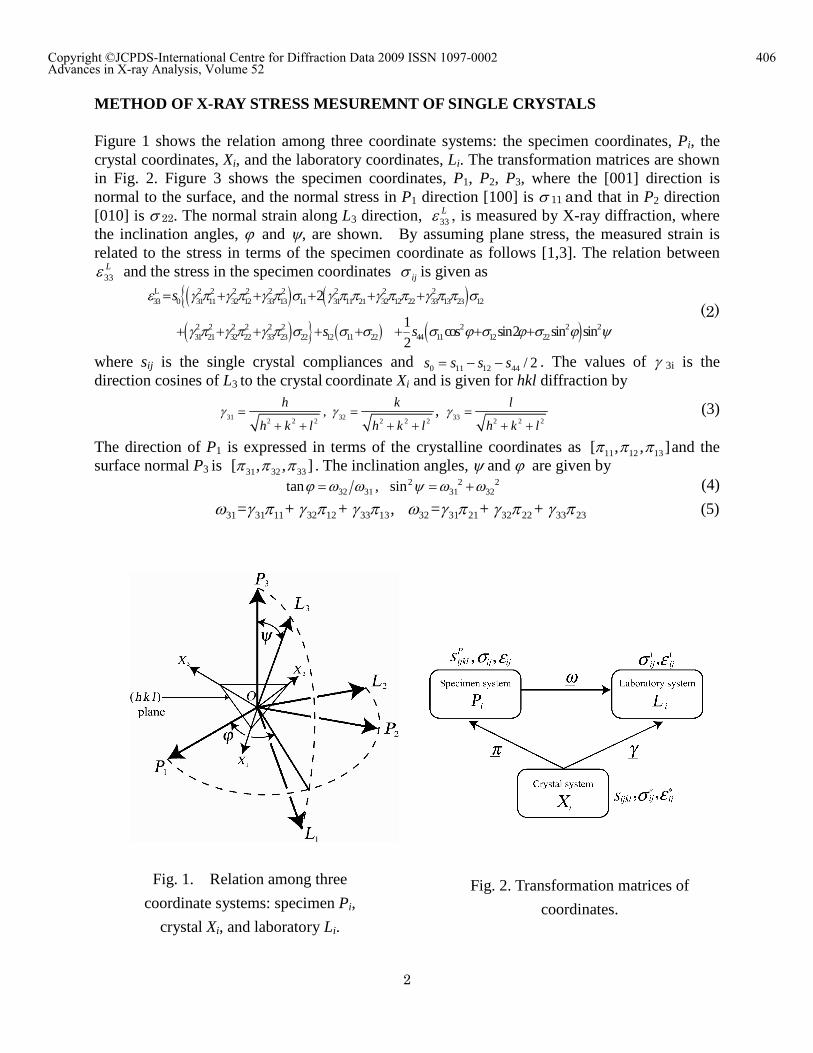
METHOD OF X-RAY STRESS MESUREMNT OF SINGLE CRYSTALS Figure 1 shows the relation among three coordinate systems: the specimen coordinates, Pi, the crystal coordinates, Xi, and the laboratory coordinates, Li. The transformation matrices are shown in Fig. 2. Figure 3 shows the specimen coordinates, P1, P2, P3, where the [001] direction is normal to the surface, and the normal stress in P1 direction [100] is 11 and that in P2 direction [010] is 22. The normal strain along L3 direction, 33
L , is measured by X-ray diffraction, where the inclination angles, and , are shown. By assuming plane stress, the measured strain is related to the stress in terms of the specimen coordinate as follows [1,3]. The relation between
33L and the stress in the specimen coordinates ij is given as
L 2 2 2 2 2 2 2 2 233 0 31 11 32 12 33 13 11 31 11 21 32 12 22 33 13 23 12
2 2 2 2 2 2 2 2 231 21 32 22 33 23 22 12 11 22 44 11 12 22
2
1 cos sin2 sin sin
2
s
s s
(2)
where sij is the single crystal compliances and 0 11 12 44 / 2 s s s s . The values of 3i is the direction cosines of L3 to the crystal coordinate Xi and is given for hkl diffraction by
31 32 332 2 2 2 2 2 2 2 2
, ,h k l
h k l h k l h k l
(3)
The direction of P1 is expressed in terms of the crystalline coordinates as 11 12 13[ , , ] and the surface normal P3 is 31 32 33[ , , ] . The inclination angles, and are given by
2 2 232 31 31 32tan , sin (4)
31 31 11 32 12 33 13 32 31 21 32 22 33 23= + + , = + + (5)
Fig. 1. Relation among three
coordinate systems: specimen Pi,
crystal Xi, and laboratory Li.
Fig. 2. Transformation matrices of
coordinates.
406Copyright ©JCPDS-International Centre for Diffraction Data 2009 ISSN 1097-0002Advances in X-ray Analysis, Volume 52
3
Fig. 4. Standard (001) stereographic
projection.
In the stress measurement, the strains in several directions, ( )33
Ln (n=1,2,3�), are measured and
they are related to stresses as
33 11 12 22( )L
n n nn A B C (6)
2 2 2 2 2 2 2 20 31 11 32 12 33 13 12 44
2 2 2 2 20 31 11 21 32 12 22 33 13 23 44
2 2 2 2 2 2 2 20 31 21 32 22 33 23 12 44
1cos sin
21
2 sin sin2
1sin sin
2
n
n
n
A s s s
B s s
C s s s
(7)
The strain is determined from the change of diffraction angles.
( )33 0 0
1cot 2 2
2n
Ln (8)
where 2n is the diffraction angle and 20 is the angle for stress-free materials. From
eqns. (6) and (8), the following equation is derived
11 12 220 11 12 22 0
0 0 0
2 2 22 2 2
cot cot cotn n n n n n nA B C A B C
(9)
The stress 11,12,22 are related to 11,12,22 as
11 11 0 12 12 0 22 22 0
1 1 1cot , cot cot
2 2 2, (10)
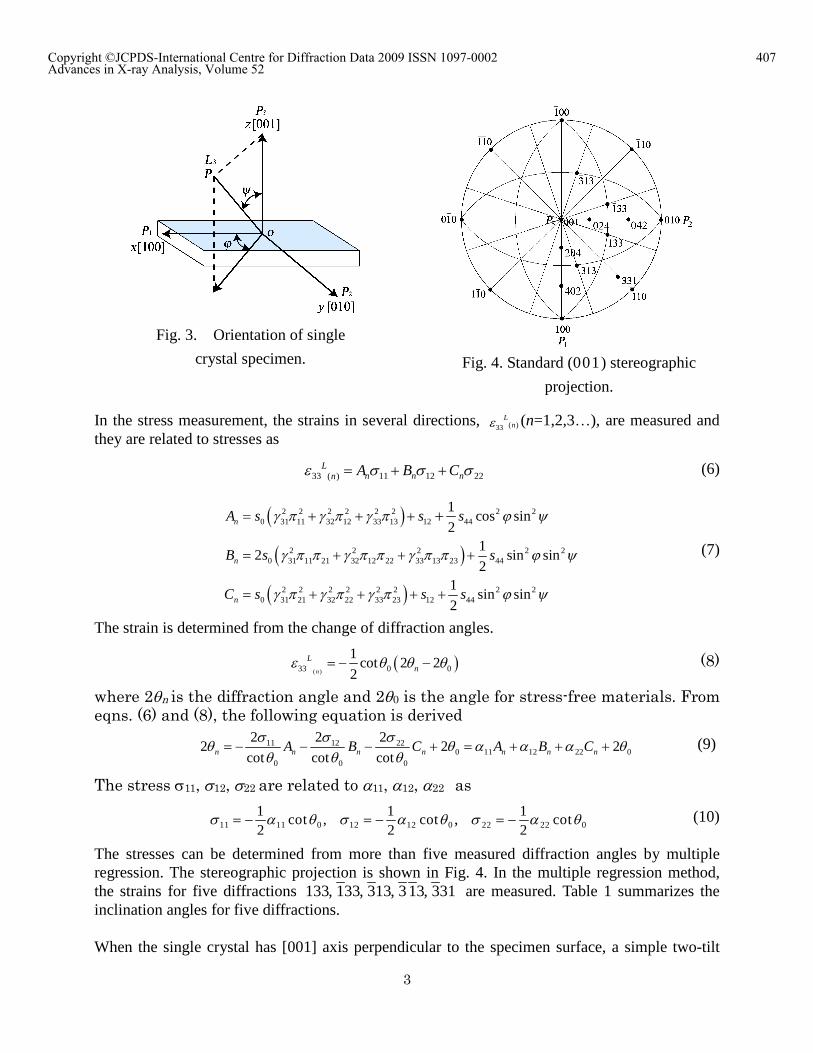
The stresses can be determined from more than five measured diffraction angles by multiple regression. The stereographic projection is shown in Fig. 4. In the multiple regression method, the strains for five diffractions 133, 133, 313, 3 13, 331 are measured. Table 1 summarizes the inclination angles for five diffractions. When the single crystal has [001] axis perpendicular to the specimen surface, a simple two-tilt
Fig. 3. Orientation of single
crystal specimen.
407Copyright ©JCPDS-International Centre for Diffraction Data 2009 ISSN 1097-0002Advances in X-ray Analysis, Volume 52

4
method can be used. Figure 4 shows the standard stereographic projection. The 420 diffraction can be obtained at two inclination angles for the cases of = 0 and 90°. The X-ray measured strain is related to the stress as follows [2]:
2 244 0 4411 22 11 22 12 12 11 22
2cos2 sin sin 2 sin
4 2s s s
s
(11)
The slope of the 2-sin2 diagrams for = 0°and = 90°are
0 44 0 11 022 1802 tan
sinM s s
(12)
90 44 0 22 022 1802 tan
sinM s s
(13)
From the slope, the stresses, 11 and 22, are determined. This method is simpler
and does not require the precise d0 value for stress determination. The inclination
angles for the two-tilt method are summarized in Table 2.
EXPERIMENTAL PROCEDURE The experimental material is a nickel-base single crystal superalloy. The microstructure is mainly '-phase with a volume fraction of 28 % of -phase. To measure the loading stress under four-point bending, a plate specimen with 10 mm in length, 1mm in thickness and 50 mm in length was machined to have the orientation shown in Fig. 1. The residual stress of the ground surface of the bar specimen with a diameter of 6.35 mm for fatigue tests was measured after successive removal of the surface layer by electropolishing. The axial direction of the bar specimen was parallel to the [001] direction of the crystal. The axial residual stress on the surface with the normal direction of [100], [010], [100], [010] was measured. The X-ray equipment used had a two-dimensional detector (Bruker AXS D8 DISCOVER with GADDS). The Cr-K radiation was used for stress measurement. The X-ray was collimated by double pinhole of 0.5 mm in diameter. In the experiments, the angle was oscillated between
3.0 , after setting the calculated inclination angles of and
408Copyright ©JCPDS-International Centre for Diffraction Data 2009 ISSN 1097-0002Advances in X-ray Analysis, Volume 52

5
EXPERIMENTAL RESULTS AND DISCUSSION RELATION BETWEEN X-RAY MEASURED SRESS AND APPLIED STRESS Figure 5(a) shows the diffraction image recorded on two-dimensional detector. It is possible to see the movement of the diffraction pattern by the oscillation of the inclination angle and the diffraction profile is obtained as the intensity distribution as shown in Fig. 5(b), where the square indicate the region of integration of the intensity. Two peaks for K1 and K2 radiation can be seen, while diffractions from '- and -phases are not separable. The elastic compliances of the single crystals required for stress calculation is derived as follows. Table 4 summarizes the published values of stiffnesses, cij, for '- and -phases [4], and the anisotropy constant A and Poisson's ratio are calculated by
11 1244
11 12 44
22 s scA
c c s
(14)
12 12
11 12 11
c sc c s
(15)
The stiffnesses of composite of '- and -phases calculated by Voigt and Reuss models [5] are presented in the table. Two models give nearly identical values, and A = 2.840 and = 0.2827. The Young's modulus E is given as
11 12 11 12
11 11 12
21 c c c cE
s c c
(16)
Fig. 5 Diffraction pattern and profile of 313 diffraction.
(a) Diffraction pattern (b) Diffraction profile
409Copyright ©JCPDS-International Centre for Diffraction Data 2009 ISSN 1097-0002Advances in X-ray Analysis, Volume 52

6
Young's modulus is 126GPa for -phase, 118GPa for '-phase, and 120GPa for the average. The measured value of the present material is 128GPa, which is larger than the former three. Because A and are rather insensitive to the material microstructure [6], the stiffnesses of the materials are derived using A = 2.840, = 0.2827, and the measured Young's modulus. Table 4 summarizes the values of stiffnesses and compliances used for stress calculation.
Fig. 6 Change of X-ray stress with applied stress for 331 diffration.
(multiple regression method)
Fig. 7 Change of X-ray stress with applied stress for 420 diffraction.
(two-tilt method)
410Copyright ©JCPDS-International Centre for Diffraction Data 2009 ISSN 1097-0002Advances in X-ray Analysis, Volume 52

7
The changes of the X-ray measured stresses as a function of the applied stress is shown in Fig. 6 for the case of the multiple regression method. The diffraction angle for stress-free state determined by the regression method was 02 139.054 0.002
independent of the applied stress. The relation between the stress 11 (MPa) and the applied stress A (MPa) is given by 11 32.1 0.950 A (17)
The stresses, 12 and 22, do not change with loading. Figure 7 show the changes of the stresses with the applied stress, and the following relation is obtained. 11 20.9 0.953 A (18)
The X-ray value of 11 is nearly equal to the applied stress for both methods and the difference is about 5%. DIFFRACTION PROFILES AND FWHM The diffraction profilesis broadened on the surface and becomes sharper at the depth of 15m. The diffractions from '- and -phases are not separated, so they are treated as a single peek. The diffraction profile is assumed to be a pseudo-Voigt function. The peek position and the full width at half maximum (FWHM) were determined from the K1 diffractions separated from measured doublet. Similar results were obtained for the other diffractions. The penetration depth of 331 diffraction is 3.9 m for o46.51 , 1.3 m for o76.74 . The depth is larger for 420 diffraction and 5.3 m for o26.57 and 2.6 m for o63.44 . The mean depth is 2.7m for 331 diffraction and 4.0 m for 420 diffraction. Figure 8 shows the distribution of FWHM, where each measured value is plotted at the positions of each penetration depth. The FWHM is increased to the depth of about 15 m, and takes a small constant value below that depth. It can be concluded that the plastic zone is spread about 15 m below the ground surface.
Fig. 8. Distribution of FWHM below
the surface.
Fig. 9. Distribution of residual stress
below the surface.
411Copyright ©JCPDS-International Centre for Diffraction Data 2009 ISSN 1097-0002Advances in X-ray Analysis, Volume 52

8
DISTRIBUTION OF RESIDUAL STRESS The residual stress value measured on the ground surface by the multiple regression method was usually larger compression than that by the two-tilt method. This is because the residual compressive stress has a steep gradient below the surface and the 313 diffraction used for the multiple regression method has a shallower penetration depth. The multiple regression method gives the stress averaged over a shallower region below the surface than the two-tilt method. Figure 9 shows the distribution of the residual stress, where the each data is plotted at each penetration depth. The compressive stress close to the surface is -700MPa and diminishes quickly to zero at the depth of about 15m. CONCLUSIONS The stress in a single crystal of nickel-base superalloy with 72% volume fraction of '-phase was measured by the X-ray method. The specimen whose surface normal was parallel to [001] direction was oscillated around -axis during recording of the X-ray diffraction pattern with a two-dimensional position sensitive proportional counter (PSPC). The stress was determined from the measured strain using the multiple regression method and the two-tilt method. The obtained results are summarized as follows: (1) A two-dimensional detector was successfully applied to measure the strain in single crystals only by using the oscillation of one axis during recording. (2) The stress along [100] direction, 11, measured with the X-ray method increased proportionally to the applied uniaxial stress, and the measured stress was about 5 % smaller than the applied stress. The other stress components, 22 and 12, did not change with the applied stress. (3) The plastically deformed depth below the ground surface superalloy was accompanied by the increase of the full width at half maximum. It was about 15 m in depth. (4) The residual stress on the ground surface was a large compression of about 700 MPa and diminished quickly to zero at the depth of about 15 m. REFERENCES [1] H.Suzuki, K. Akita and H. Misawa, Japanese Journal of Applied Physics, 2003, Vol. 42, 2876-2880. [2] K. Tanaka, Y. Akiniwa, K. Mizuno and K. Shirakihara, Journal of the Society of Materials Science, Japan, 2003, Vol. 52, No. 10, 1237-1244. [3] K. Tanaka, K. Mizuno, S. Machiya and Y. Akiniwa, Transactions of the Japan Society of Mechanical Engineers, Series A, 2006, Vol. 72, No. 717, 765-771. [4] T. M. Pollock and A.S. Argon, Acta Metallurgica et Materials, 1994, Vol. 42, No. 6, 1859-1874. [5] M. Yaguchi and E. P. Busso, International Journal of Solids and Structures, 2005, Vol. 42, 1073-1089. [6] H.M. Ledbetter, British Journal of NDI, 1981, Vol. 23, 286-287.
412Copyright ©JCPDS-International Centre for Diffraction Data 2009 ISSN 1097-0002Advances in X-ray Analysis, Volume 52