Embed Size (px)
Citation preview
materials
Article
XRD and TG-DTA Study of New Alkali ActivatedMaterials Based on Fly Ash with Sand andGlass Powder
Dumitru Doru Burduhos Nergis 1 , Mohd Mustafa Al Bakri Abdullah 1,Andrei Victor Sandu 1,2,3,* and Petrică Vizureanu 1,*
1 Faculty of Materials Science and Engineering, “Gheorghe Asachi” Technical University, Blvd. D. Mangeron71, 700050 Iasi, Romania; [email protected] (D.D.B.N.); [email protected] (M.M.A.B.A.)
2 Romanian Inventors Forum, Str. Sf. P. Movila 3, 700089 Iasi, Romania3 National Institute for Research and Development in Environmental Protection, 294 Splaiul Independent,ei
Blv, 060031 Bucharest, Romania* Correspondence: [email protected] (A.V.S.); [email protected] (P.V.)
Received: 18 November 2019; Accepted: 8 January 2020; Published: 11 January 2020�����������������
Abstract: In this paper, the effect on thermal behavior and compounds mineralogy of replacingdifferent percentages of fly ash with compact particles was studied. A total of 30% of fly ash wasreplaced with mass powder glass (PG), 70% with mass natural aggregates (S), and 85% with massPG and S. According to this study, the obtained fly ash based geopolymer exhibits a 20% mass lossin the 25–300 ◦C temperature range due to the free or physically bound water removal. However,the mass loss is closely related to the particle percentage. Multiple endothermic peaks exhibit thedihydroxylation of β-FeOOH (goethite) at close to 320 ◦C, the Ca(OH)2 (Portlandite) transformationto CaCO3 (calcite) occurs at close to 490 ◦C, and Al(OH)3 decomposition occurs at close to 570 ◦C.Moreover, above 600 ◦C, the curves show only very small peaks which may correspond to Ti or Mghydroxides decomposition. Also, the X-ray diffraction (XRD) pattern confirms the presence of sodaliteafter fly ash alkaline activation, whose content highly depends on the compact particles percentage.These results highlight the thermal stability of geopolymers in the 25–1000 ◦C temperature rangethrough the use of thermogravimetric analysis, differential thermal analysis, and XRD.
Keywords: geopolymers; fly ash; thermal behavior; Thermogravimetry-Differential Thermal Analysis(TG-DTA); XRD
1. Introduction
In recent years, strong technological development, the population increase, and the rapiddevelopment of the house-building industry in particular have led not only to a large lack of housingareas but also to high demand for building materials. The use of waste resulting from coal combustionin power plants offers two major advantages for this purpose: first, large tailings areas can be liberatedby utilizing the waste, and second, a soil contaminant material can be converted into an advancedmaterial with appropriate chemical and mechanical properties for engineering application through ageopolymerization process [1]. Geopolymers are inorganic materials, based on silica-alumina, whichare chemically balanced by Group I oxides [2]. These are rigid gels, created under normal conditionsof temperature and pressure, which can then be transformed into crystalline or glass-ceramic materialsthat are similar to zeolite materials [3]. A geopolymer, resulting from the exothermic process involvingoligomers, is a very long reticular polymer with silicon groups (SiO4) and a specific tetragonal networkof aluminum oxide (AlO4) [4]. The bonds between these tetragons are balanced by alkaline ions of K+,Na+, or Li+ [4]. Any geopolymer can be divided into two main constituents: the base material and the
Materials 2020, 13, 343; doi:10.3390/ma13020343 www.mdpi.com/journal/materials
Materials 2020, 13, 343 2 of 18
activator (an alkaline liquid) [5]. The major constituent is the base material, which must be rich insilicon and aluminum and can be a natural mineral, such as clays, kaolin, etc. or alternatively can be aform of waste, such as fly ash, red mud, slag, etc. [1].
Due to their physical [6], mechanical [7], and chemical properties [8,9], geopolymers show highusefulness in multiple civil engineering applications [10,11] as a replacement material for conventionalcement or ceramics [12–15]. Therefore, the thermal behavior and phase transition of fly ash basedgeopolymers during the exposed temperature range must be analyzed in order to evaluate the stabilityof their structure.
An additional advantage is the fact that the geopolymer microstructure contains multiple unreactedparticles, which are continuously reacting with the extra-gel remained in the micropores [16,17].As a result, some harmful cracks and pores could be repaired through the self-healing mechanism [18,19].Obviously, this self-healing feature positively influences the time depending behavior of the compositesdue to its high durability. Despite the fact that geopolymers possess many chemical and mechanicalproperties and can be obtained through simple methods, most of them are obtained from naturalminerals instead [20]. Therefore, it is essential to design, create, and characterize new geopolymers thatuse mineral waste as a source of raw materials, especially indigenous waste, and recyclized reinforcingparticles. This is encouraged for both economic and environmental reasons, because through thegeopolymerization reaction, we can obtain useful materials using “free” wastes that have negativeeffects on dumping areas [21].
There are multiple studies regarding the influence of different types of particles on the mechanicalproperties of geopolymers [17,22–26]. However, the presence of these particles will influence all thecharacteristics of the geopolymers, including their thermal behavior. The aim of this study is to evaluatethe thermal behavior changes and the phase transition due to the introduction of different types ofparticles in new geopolymers based on indigenous fly ash.
2. Materials and Methods
Geopolymerization is a multiple-stage chemical reaction which occurs when a raw material richin aluminum and silicon oxides is mixed with an alkaline solution of sodium silicate and sodiumhydroxide [27,28]. Also, this reaction is mainly influenced by the raw material characteristics [29],activator concentration, and curing process (drying time and temperature) [30]. In this study, fly ashwas used as the main raw material, and different percentages of glass powder and/or natural aggregateswere introduced in the binder as reinforcement particles. Their chemical composition was analyzed byusing X-ray fluorescence (XRF) involving XRF S8 Tiger equipment (Bruker, Karlsruhe, Germany).
2.1. Materials
Geopolymers consist of two main components: the liquid component (activator solution) and thesolid component (the material rich in aluminum and silicon oxides and the reinforcing particles).
2.1.1. Indigenous Fly Ash
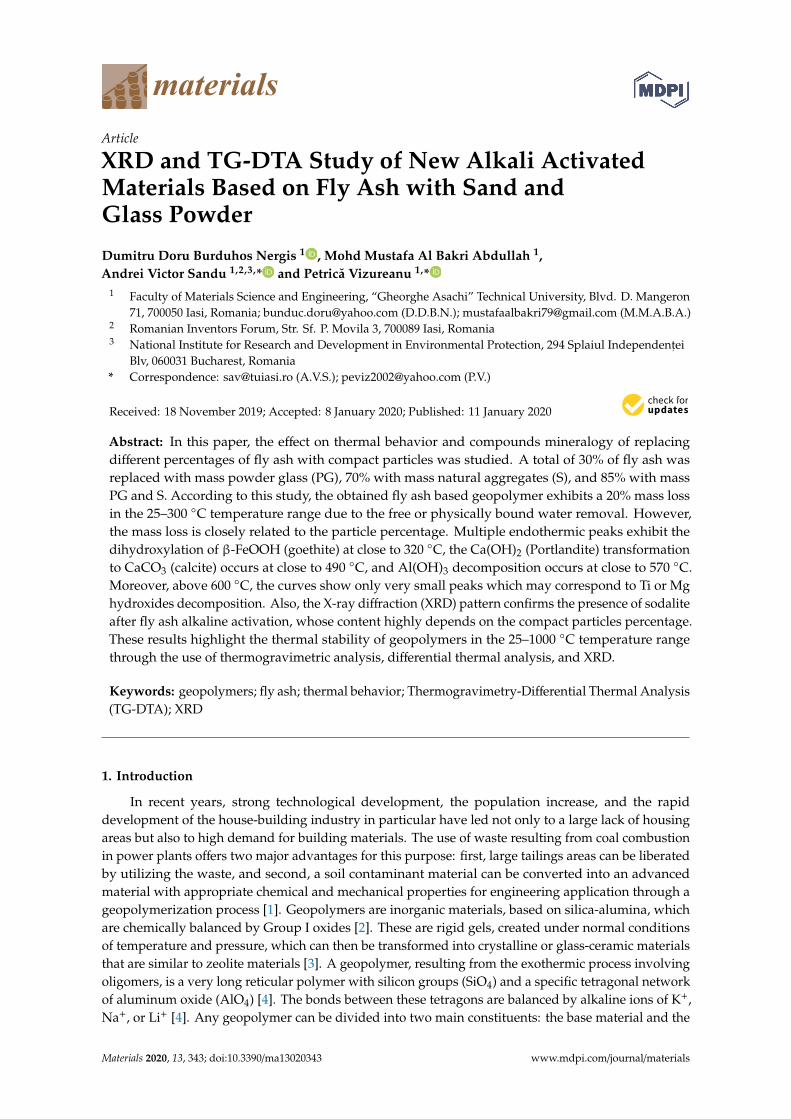
Fly ashes are, generally, solid torque spheres which result from coal combustion in powerplants burning chambers [31]. This micrometric powder ends up being deposited in huge areas nearmany cities all over the world. Because different dumps present different chemical compositions,the activation solution, as well as the ratio between constituents, must be calculated. The performanceof fly ash in geopolymers is strongly influenced by its physical, chemical, and mineralogical properties,and moreover, by its particle dimensions. While the mineralogical and chemical composition (Table 1)depends mainly on the coal composition, the particles can be ground or sifted (Figure 1).
Materials 2020, 13, 343 3 of 18
Table 1. Indigenous fly ash oxide chemical composition.
Oxide SiO2 Al2O3 FexOy CaO K2O MgO TiO2 Na2O P2O5 Oth 1
%, weight 47.80 28.60 10.20 6.40 2.40 2.00 1.30 0.60 0.40 0.30Stat. error, % 0.32 0.27 0.95 0.77 0.71 1.09 1.81 0.63 0.24 -
1 Sum of chemical elements lower than 0.1%.
Materials 2020, 13, x FOR PEER REVIEW 3 of 18
CET II—Holboca Iasi Romania ash dumps, which occupied an area of approximately 50 hectares in
2013 [32].
Table 1. Indigenous fly ash oxide chemical composition.
Oxide SiO2 Al2O3 FexOy CaO K2O MgO TiO2 Na2O P2O5 Oth 1
%, weight 47.80 28.60 10.20 6.40 2.40 2.00 1.30 0.60 0.40 0.30
Stat. error, % 0.32 0.27 0.95 0.77 0.71 1.09 1.81 0.63 0.24 -
1 Sum of chemical elements lower than 0.1%.
Figure 1. Scanning Electron Microscope (SEM) micrographs of indigenous fly ash after sifting: (a)
100X magnification; (b) 750X magnification.
According to the Standard ASTM C618-92a, indigenous fly ash belongs to class F because it has
a main oxides (silicon, aluminum and iron) sum that is higher than 70% (Equation (1)):
SiO2 + Al2O3 + Fe2O3 = 47.8% + 28.6% + 10.2% = 86.6%. (1)
2.1.2. Glass Powder
Another waste that appears in large quantities due to industrialization is glass. This inert
material does not decompose naturally, producing negative effects on the environment following
storage in landfills. Therefore, the use of glass particles in the manufacturing of environmentally
friendly materials has become a worldwide concern. Due to the incorporation ability of geopolymer
paste, the introduction of glass powder into the composition of these materials can be done using
simple methods.
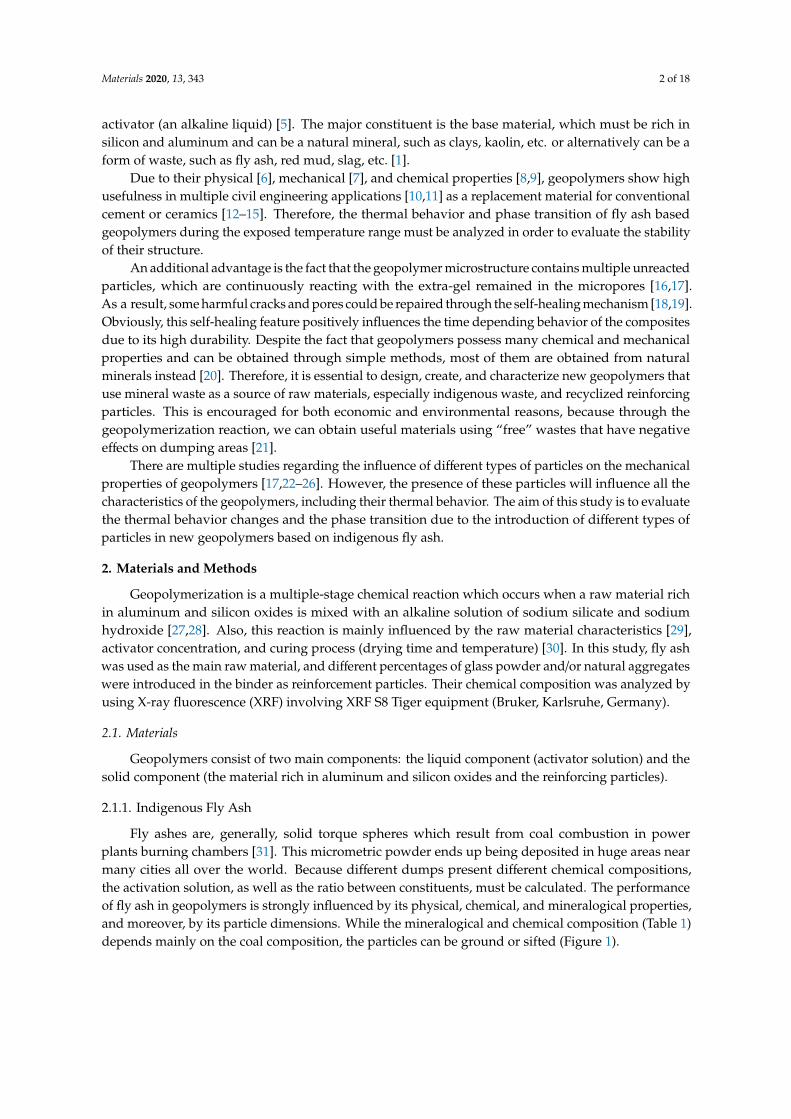
The glass powder (Figure 2) used as a reinforcing element in geopolymer samples contains only
particles smaller than 100 µm (SR EN 933-1/2012) and is obtained by conducting glass waste grinding
in a local factory.
Figure 1. Scanning Electron Microscope (SEM) micrographs of indigenous fly ash after sifting: (a) 100Xmagnification; (b) 750X magnification.
In Romania, there are large areas covered by industrial waste from coal burning in the city’spower plants. The indigenous thermal power plant ash used for the geopolymer tests comes fromCET II—Holboca Iasi Romania ash dumps, which occupied an area of approximately 50 hectaresin 2013 [32].
According to the Standard ASTM C618-92a, indigenous fly ash belongs to class F because it has amain oxides (silicon, aluminum and iron) sum that is higher than 70% (Equation (1)):
SiO2 + Al2O3 + Fe2O3 = 47.8% + 28.6% + 10.2% = 86.6%. (1)
2.1.2. Glass Powder
Another waste that appears in large quantities due to industrialization is glass. This inertmaterial does not decompose naturally, producing negative effects on the environment followingstorage in landfills. Therefore, the use of glass particles in the manufacturing of environmentallyfriendly materials has become a worldwide concern. Due to the incorporation ability of geopolymerpaste, the introduction of glass powder into the composition of these materials can be done usingsimple methods.
The glass powder (Figure 2) used as a reinforcing element in geopolymer samples contains onlyparticles smaller than 100 µm (SR EN 933-1/2012) and is obtained by conducting glass waste grindingin a local factory.
By comparing the chemical composition (Table 2) with that of the thermal power plant ash(Table 1), the glass powder contained much higher SiO2, CaO, and Na2O, but much lower Al2O3.However, according to several studies [33], glass powder reacts in alkaline environments. Therefore,this should increase the geopolymerization rate.
Materials 2020, 13, 343 4 of 18
Materials 2020, 13, x FOR PEER REVIEW 4 of 18
Figure 2. Glass powder.
By comparing the chemical composition (Table 2) with that of the thermal power plant ash (Table
1), the glass powder contained much higher SiO2, CaO, and Na2O, but much lower Al2O3. However,
according to several studies [33], glass powder reacts in alkaline environments. Therefore, this should
increase the geopolymerization rate.
Table 2. Glass powder oxide chemical composition.
Oxide SiO2 Al2O3 FexOy CaO MgO Na2O Oth 1
%, weight 70–71 1.5–2 0.8–1 9–11 2–3 12–14 <0.1
1 Sum of chemical elements lower than 0.1%.
By using glass particles for geopolymers manufacturing, two main advantages emerge: the first
is related to waste recycling and second refers to improving mechanical properties by introducing
particles with high mechanical properties.
2.1.3. Natural Aggregates
In order to improve the mechanical characteristics of geopolymers based on local powerplant
ash, different quantities or types of aggregates can be added to the composition. Besides the use of
waste, another category of reinforcing elements studied [25,34] worldwide is natural aggregates
(sand). Depending on the geometric peculiarities of the particles, by introducing them in the
geopolymer matrix, compressive strength increases of up to 150% can be obtained. The quantity and
type of aggregate used is chosen according to the particle size distribution of the sand, because it may
affect the homogeneity of the samples, but also their porosity.
The sand granulometric characteristics analysis conducted by using sifting (SR EN 933-1/2012)
was performed after drying the aggregates, in order to reduce the measurement errors due to the fine
particles sticking or adhesion to the sieve surface. According to the particle size distribution, close to
30% of particles had a diameter higher than 1.25 mm, and 50% (d50) had a diameter lower or equal
to 0.19 mm. Therefore, the type of sand used belongs to the 0/4 aggregate class because all particles
pass through the 4 mm mesh sieve (SR ISO 3310-3). The XRF analysis of sand indicated the following
composition: 98.8% SiO2, 0.57% Al2O3, 0.33% FexOy, and the rest being CaO, Na2O, and other materials
as traces.
2.1.4. Sodium Silicate
Sodium silicate is made by a sand (SiO2) fusion with sodium or potassium carbonate (Na2CO3 or
K2CO3) at temperatures above 1100 °C and dissolving the high-pressure vapor product in a semi-
Figure 2. Glass powder.
Table 2. Glass powder oxide chemical composition.
Oxide SiO2 Al2O3 FexOy CaO MgO Na2O Oth 1
%, weight 70–71 1.5–2 0.8–1 9–11 2–3 12–14 <0.11 Sum of chemical elements lower than 0.1%.
By using glass particles for geopolymers manufacturing, two main advantages emerge: the firstis related to waste recycling and second refers to improving mechanical properties by introducingparticles with high mechanical properties.
2.1.3. Natural Aggregates
In order to improve the mechanical characteristics of geopolymers based on local powerplantash, different quantities or types of aggregates can be added to the composition. Besides the use ofwaste, another category of reinforcing elements studied [25,34] worldwide is natural aggregates (sand).Depending on the geometric peculiarities of the particles, by introducing them in the geopolymermatrix, compressive strength increases of up to 150% can be obtained. The quantity and type ofaggregate used is chosen according to the particle size distribution of the sand, because it may affectthe homogeneity of the samples, but also their porosity.
The sand granulometric characteristics analysis conducted by using sifting (SR EN 933-1/2012)was performed after drying the aggregates, in order to reduce the measurement errors due to the fineparticles sticking or adhesion to the sieve surface. According to the particle size distribution, close to30% of particles had a diameter higher than 1.25 mm, and 50% (d50) had a diameter lower or equalto 0.19 mm. Therefore, the type of sand used belongs to the 0/4 aggregate class because all particlespass through the 4 mm mesh sieve (SR ISO 3310-3). The XRF analysis of sand indicated the followingcomposition: 98.8% SiO2, 0.57% Al2O3, 0.33% FexOy, and the rest being CaO, Na2O, and other materialsas traces.
2.1.4. Sodium Silicate
Sodium silicate is made by a sand (SiO2) fusion with sodium or potassium carbonate (Na2CO3
or K2CO3) at temperatures above 1100 ◦C and dissolving the high-pressure vapor product in asemi-viscous liquid known as silicate. Silicate is rarely used as an independent activator because itdoes not have a sufficient activation capacity to initiate a geopolymerization reaction.
A commercially purchased high purity Na2SiO3 solution (Scharlab S.L., Barcelona, Spain) with adensity of 1.37 g/cm3 and a lower pH than 11.5 was used in this study.
Materials 2020, 13, 343 5 of 18
2.1.5. Sodium Hydroxide
The NaOH solution concentration and molarity strongly influence the final properties of thegeopolymers. The high concentrations of the NaOH solution result in high resistance to the earlyreaction stages. NaOH-activated geopolymers possess high crystallinity, having better stability inacidic or sulfate environments [35].
The NaOH solution was prepared at a 10-molar concentration by dissolving the high purity (99%)NaOH flakes in distilled water for 24 h before use (mixing).
2.1.6. Sample Preparation
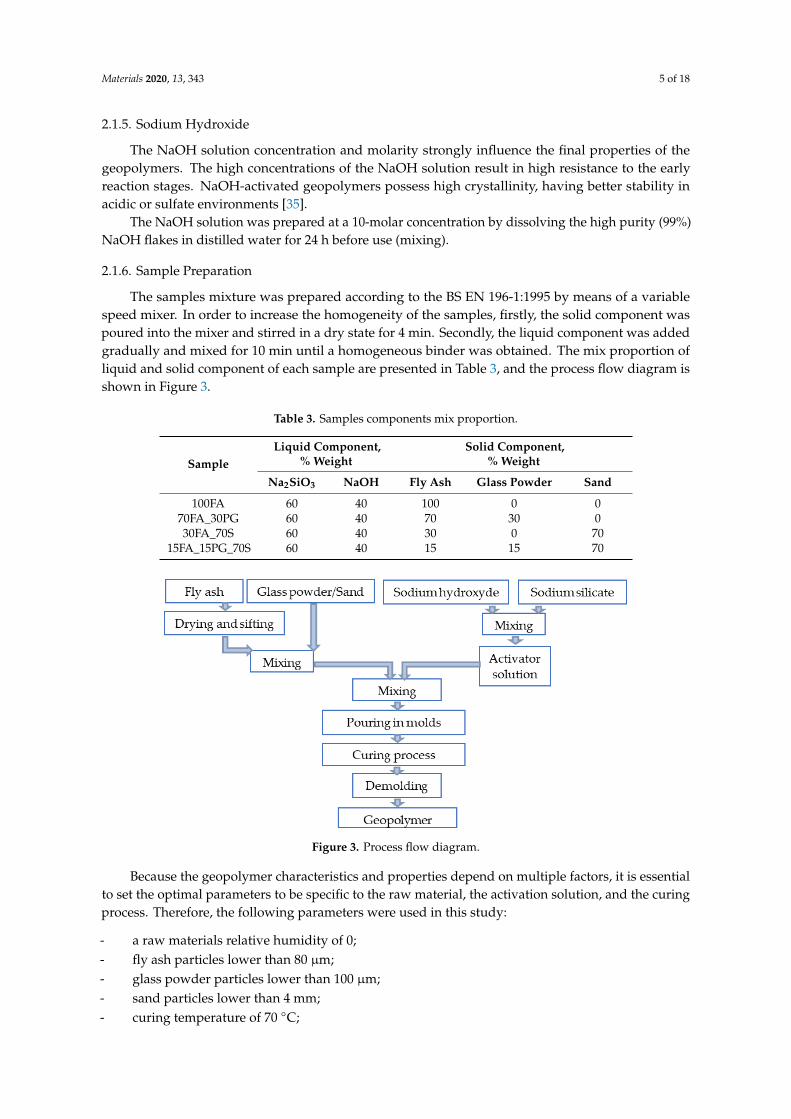
The samples mixture was prepared according to the BS EN 196-1:1995 by means of a variablespeed mixer. In order to increase the homogeneity of the samples, firstly, the solid component waspoured into the mixer and stirred in a dry state for 4 min. Secondly, the liquid component was addedgradually and mixed for 10 min until a homogeneous binder was obtained. The mix proportion ofliquid and solid component of each sample are presented in Table 3, and the process flow diagram isshown in Figure 3.
Table 3. Samples components mix proportion.
SampleLiquid Component,
% WeightSolid Component,
% Weight
Na2SiO3 NaOH Fly Ash Glass Powder Sand
100FA 60 40 100 0 070FA_30PG 60 40 70 30 030FA_70S 60 40 30 0 70
15FA_15PG_70S 60 40 15 15 70Materials 2020, 13, x FOR PEER REVIEW 6 of 18
Figure 3. Process flow diagram.
During the geopolymerization process, minerals rich in aluminum and silicon pass through
several phases. In the first phase, these are dissolved by the alkaline solution, forming a gel whose
viscosity is given by the ratio between solid and liquid (Equation (2)). In the second phase, the
reorganization of the molecules takes place, while water is removed and the material hardening
begins.
g of solid (powerplant ash)
g of activating solution (sodium silicate + sodium hydroxide)= 1.5 (2)
In order to evaluate the effect on thermal behavior and compounds mineralogy of replacing
different percentages of fly ash with reinforcing elements, four types of geopolymers samples were
obtained and studied.
2.2. Methods
Simultaneous thermal analysis consisting of thermogravimetric analysis (TGA) and Differential
thermal analysis (DTA) was performed on the obtained samples in order to evaluate their thermal
behavior. Because the DTA curve showed multiple peaks in the temperature range where the
evaluation was made, X-ray diffraction (XRD) was performed to confirm the phase transition during
heating.
2.2.1. Simultaneous Thermal Analysis
The sample’s mass evolution by TGA was analyzed simultaneously with the phase
transformations analysis using DTA by means of a STA PT-1600 equipment (Linseis, Selb, Germany).
The analysis was performed in the 25–1000 °C temperature range, with a heating rate of 10 °C/min
on samples and a mass lower than 50 mg, in a static air atmosphere.
Materials analysis conducted using TG-DTA emphasized their thermal stability and the
content/type of volatile compounds through two curves simultaneously plotted based on the
temperature.
2.2.2. X-ray Diffraction
X-ray diffraction (XRD) is a technique used to identify crystalline phases in different materials
and for quantitative analysis of these phases. XRD is used, in particular, due to the superior
highlighting of the three-dimensional atomic structure that directly influences the properties and
characteristics of the materials. In order to analyze the mineralogical composition of the obtained
geopolymers, an X’Pert Pro MPD equipment (Malvern Panalytical Ltd, Eindhoven, The Netherlands)
Figure 3. Process flow diagram.
Because the geopolymer characteristics and properties depend on multiple factors, it is essentialto set the optimal parameters to be specific to the raw material, the activation solution, and the curingprocess. Therefore, the following parameters were used in this study:
- a raw materials relative humidity of 0;- fly ash particles lower than 80 µm;- glass powder particles lower than 100 µm;- sand particles lower than 4 mm;- curing temperature of 70 ◦C;
Materials 2020, 13, 343 6 of 18
- curing time of 8 h.
During the geopolymerization process, minerals rich in aluminum and silicon pass through severalphases. In the first phase, these are dissolved by the alkaline solution, forming a gel whose viscosity isgiven by the ratio between solid and liquid (Equation (2)). In the second phase, the reorganization ofthe molecules takes place, while water is removed and the material hardening begins.
g of solid (powerplant ash)g of activating solution (sodium silicate + sodium hydroxide)
= 1.5 (2)
In order to evaluate the effect on thermal behavior and compounds mineralogy of replacingdifferent percentages of fly ash with reinforcing elements, four types of geopolymers samples wereobtained and studied.
2.2. Methods
Simultaneous thermal analysis consisting of thermogravimetric analysis (TGA) and Differentialthermal analysis (DTA) was performed on the obtained samples in order to evaluate their thermalbehavior. Because the DTA curve showed multiple peaks in the temperature range where the evaluationwas made, X-ray diffraction (XRD) was performed to confirm the phase transition during heating.
2.2.1. Simultaneous Thermal Analysis
The sample’s mass evolution by TGA was analyzed simultaneously with the phase transformationsanalysis using DTA by means of a STA PT-1600 equipment (Linseis, Selb, Germany). The analysis wasperformed in the 25–1000 ◦C temperature range, with a heating rate of 10 ◦C/min on samples and amass lower than 50 mg, in a static air atmosphere.
Materials analysis conducted using TG-DTA emphasized their thermal stability and the content/typeof volatile compounds through two curves simultaneously plotted based on the temperature.
2.2.2. X-ray Diffraction
X-ray diffraction (XRD) is a technique used to identify crystalline phases in different materials andfor quantitative analysis of these phases. XRD is used, in particular, due to the superior highlighting ofthe three-dimensional atomic structure that directly influences the properties and characteristics of thematerials. In order to analyze the mineralogical composition of the obtained geopolymers, an X’PertPro MPD equipment (Malvern Panalytical Ltd., Eindhoven, The Netherlands) equipped with a copperx-ray tube and a single channel detector was used. The diffractograms between the X-ray intensity onthe ordinate and the Bragg angle, θ, on the abscissa were performed on a θ–2θ angle range between5◦ and 90◦ through continuous scanning at a step size of 0.013◦ at every 60 s, with a scan speed of0.054 (◦/s) at a 45 KV voltage and 40 mA current intensity.
The mineralogical changes produced by the alkaline activator on the fly ash was analyzed onpowder obtained by grinding the samples maintained in normal atmosphere conditions (clean air,≤20 ◦C) for 90 days, and after being analyzed by TG-DTA.
3. Results and Discussion
3.1. Thermal Behavior Evaluation
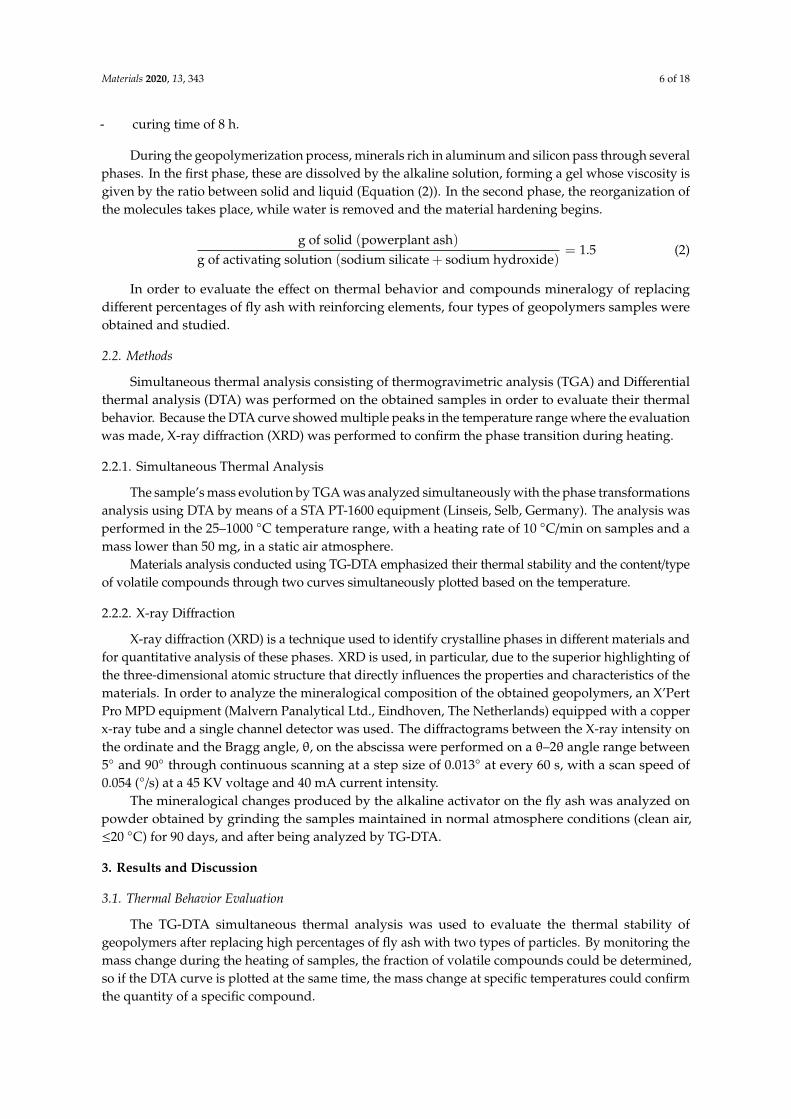
The TG-DTA simultaneous thermal analysis was used to evaluate the thermal stability ofgeopolymers after replacing high percentages of fly ash with two types of particles. By monitoring themass change during the heating of samples, the fraction of volatile compounds could be determined,so if the DTA curve is plotted at the same time, the mass change at specific temperatures could confirmthe quantity of a specific compound.
Materials 2020, 13, 343 7 of 18
The DTA curves of samples show multiple peaks at 123–130 ◦C, 185 ◦C, 232–240 ◦C, 312–358 ◦C,490–497 ◦C, and 572–576 ◦C, respectively. These peaks correspond to the removal of water molecules,which are free or bound are with the structural compounds. In totally inorganic materials, such asgeopolymers, water can be found in two main forms:
(i) hygroscopic (free) water, which is removed at rising temperatures up to 120 ◦C [36]. This wateris absorbed into the structure due to the hygroscopicity of geopolymers [37].
(ii) strong physically bonded water which is removed in the 120–300 ◦C temperature range. Thistype of water can be divided into three sub-types:
- crystallization water (anionic and cationic or coordinative) which is removed from the structure inthe 120–200 ◦C temperature range. This sub-type of water molecules are bonded in the structureduring the formation of crystals from aqueous solution [38].
- water from hydrogels that can be intercrystalline and network types that interact with thecrystallization water. This sub-type of water is removed during heating in the 180–300 ◦Ctemperature range [39].
- zeolitic water from cavities and channels, which is removed from the structure in the 200–300 ◦Ctemperature range [37,40].
When the temperatures exceed 300 ◦C, the (iii) chemically bound water starts being removed.The peaks on the DTA curve above this temperature corresponded to the decomposition of M (metal)and OH groups compounds [39,41,42]. These compounds exist in the fly-ash based geopolymersstructure in different forms, such as:
- Acids: M-O−H+ (Si(IV), Ti(IV), Fe(III))- Basics: M+HO− hydroxide (Na, Ca (II), K, Mg (II))- Neutral: M-OH hydroxyl (Al (III), Mn (III)).
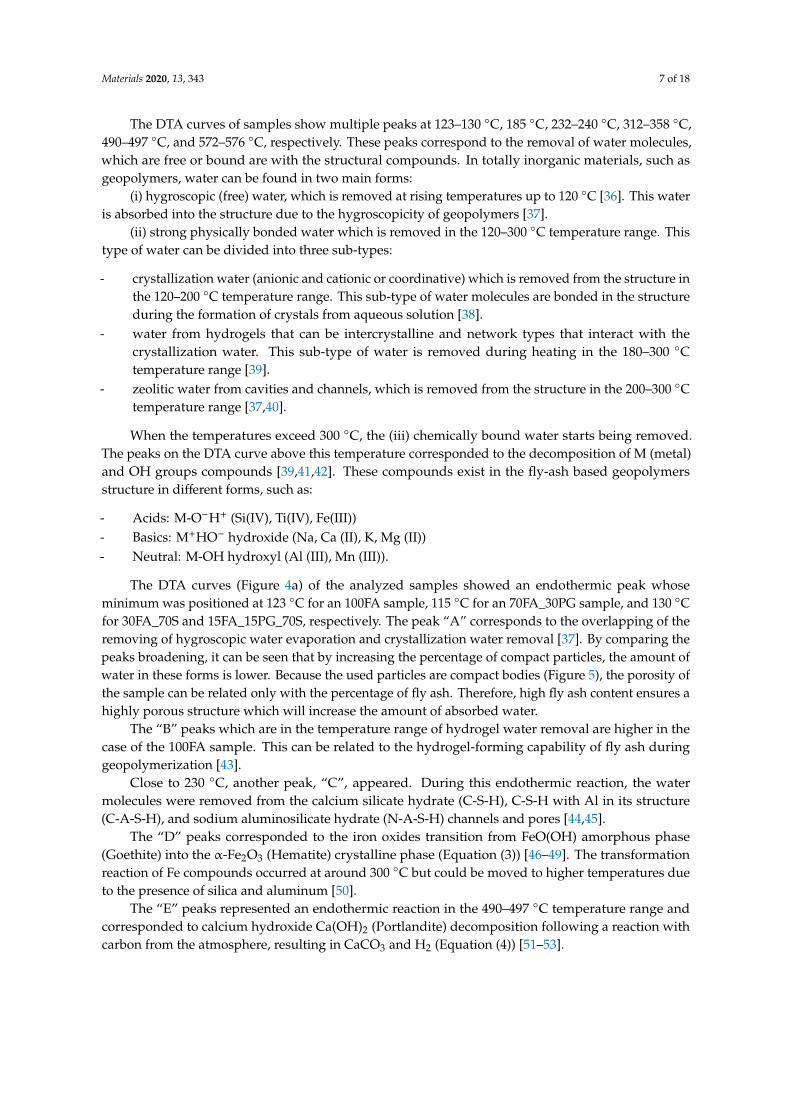
The DTA curves (Figure 4a) of the analyzed samples showed an endothermic peak whoseminimum was positioned at 123 ◦C for an 100FA sample, 115 ◦C for an 70FA_30PG sample, and 130 ◦Cfor 30FA_70S and 15FA_15PG_70S, respectively. The peak “A” corresponds to the overlapping of theremoving of hygroscopic water evaporation and crystallization water removal [37]. By comparing thepeaks broadening, it can be seen that by increasing the percentage of compact particles, the amount ofwater in these forms is lower. Because the used particles are compact bodies (Figure 5), the porosity ofthe sample can be related only with the percentage of fly ash. Therefore, high fly ash content ensures ahighly porous structure which will increase the amount of absorbed water.
The “B” peaks which are in the temperature range of hydrogel water removal are higher in thecase of the 100FA sample. This can be related to the hydrogel-forming capability of fly ash duringgeopolymerization [43].
Close to 230 ◦C, another peak, “C”, appeared. During this endothermic reaction, the watermolecules were removed from the calcium silicate hydrate (C-S-H), C-S-H with Al in its structure(C-A-S-H), and sodium aluminosilicate hydrate (N-A-S-H) channels and pores [44,45].
The “D” peaks corresponded to the iron oxides transition from FeO(OH) amorphous phase(Goethite) into the α-Fe2O3 (Hematite) crystalline phase (Equation (3)) [46–49]. The transformationreaction of Fe compounds occurred at around 300 ◦C but could be moved to higher temperatures dueto the presence of silica and aluminum [50].
The “E” peaks represented an endothermic reaction in the 490–497 ◦C temperature range andcorresponded to calcium hydroxide Ca(OH)2 (Portlandite) decomposition following a reaction withcarbon from the atmosphere, resulting in CaCO3 and H2 (Equation (4)) [51–53].
Materials 2020, 13, 343 8 of 18
Materials 2020, 13, x FOR PEER REVIEW 8 of 18
Figure 4. TG-DTA curves in the 22–820 °C temperature range: (a) DTA curves; (b) TG curves.
The “B” peaks which are in the temperature range of hydrogel water removal are higher in the
case of the 100FA sample. This can be related to the hydrogel-forming capability of fly ash during
geopolymerization [43].
Figure 5. SEM micrographs of geopolymers with particles.
Figure 4. TG-DTA curves in the 22–820 ◦C temperature range: (a) DTA curves; (b) TG curves.
Materials 2020, 13, x FOR PEER REVIEW 8 of 18
Figure 4. TG-DTA curves in the 22–820 °C temperature range: (a) DTA curves; (b) TG curves.
The “B” peaks which are in the temperature range of hydrogel water removal are higher in the
case of the 100FA sample. This can be related to the hydrogel-forming capability of fly ash during
geopolymerization [43].
Figure 5. SEM micrographs of geopolymers with particles. Figure 5. SEM micrographs of geopolymers with particles.
Materials 2020, 13, 343 9 of 18
Also, at up to 570 ◦C, the “F” peaks which appeared on the DTA curve corresponded to theα-quartz to β-quartz conversion and the reaction between the unreacted particles and the activatorcaught in gel pores [54]. However, in the same temperature range, aluminum hydroxide, (Al(OH)3)decomposition occured (Equation (5)) [55–58].
FeO(OH)(s) + 3H+(aq) = Fe2+(aq) + 2H2O(aq) (3)
Ca(OH)2(s) + CO(g)→ CaCO3(s) + H2(aq) (4)
2Al(OH)3(s)→ Al2O3(s) + 3H2O(aq) (5)
In addition, in the same temperature range, the water resulting from the silicon or aluminumhydroxide groups condensation could appear. According to references [5,59], this chemical reactionconsists of (Equation (6)):
≡M-OH + HO-M≡→ ≡M-O-M≡ + H2O (6)
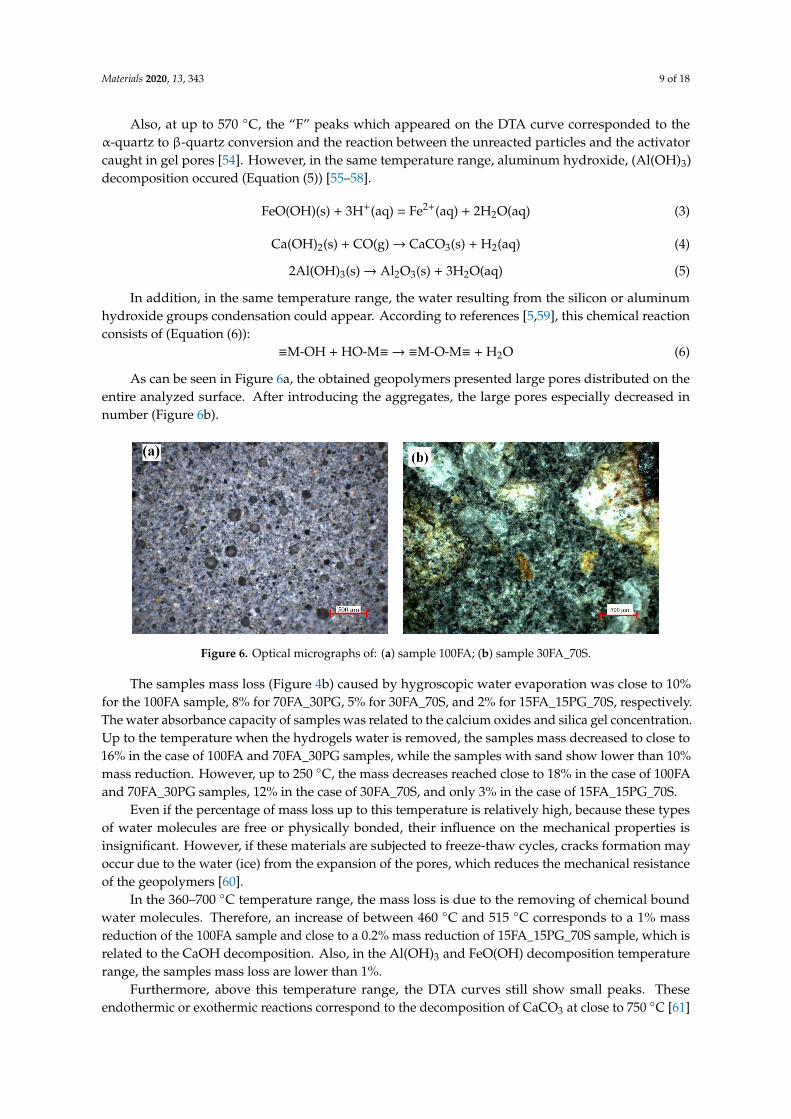
As can be seen in Figure 6a, the obtained geopolymers presented large pores distributed on theentire analyzed surface. After introducing the aggregates, the large pores especially decreased innumber (Figure 6b).
Materials 2020, 13, x FOR PEER REVIEW 9 of 18
Close to 230 °C, another peak, “C”, appeared. During this endothermic reaction, the water
molecules were removed from the calcium silicate hydrate (C-S-H), C-S-H with Al in its structure (C-
A-S-H), and sodium aluminosilicate hydrate (N-A-S-H) channels and pores [44,45].
The “D” peaks corresponded to the iron oxides transition from FeO(OH) amorphous phase
(Goethite) into the α-Fe2O3 (Hematite) crystalline phase (Equation (3)) [46–49]. The transformation
reaction of Fe compounds occurred at around 300 °C but could be moved to higher temperatures due
to the presence of silica and aluminum [50].
The “E” peaks represented an endothermic reaction in the 490–497 °C temperature range and
corresponded to calcium hydroxide Ca(OH)2 (Portlandite) decomposition following a reaction with
carbon from the atmosphere, resulting in CaCO3 and H2 (Equation (4)) [51–53].
Also, at up to 570 °C, the “F” peaks which appeared on the DTA curve corresponded to the α-
quartz to β-quartz conversion and the reaction between the unreacted particles and the activator
caught in gel pores [54]. However, in the same temperature range, aluminum hydroxide, (Al(OH)3)
decomposition occured (Equation (5)) [55–58].
FeO(OH)(s) + 3H+(aq) = Fe2+(aq) + 2H2O(aq) (3)
Ca(OH)2(s) + CO(g) → CaCO3(s) + H2(aq) (4)
2Al(OH)3(s) → Al2O3(s) + 3H2O(aq) (5)
In addition, in the same temperature range, the water resulting from the silicon or aluminum
hydroxide groups condensation could appear. According to references [5,59], this chemical reaction
consists of (Equation (6)):
≡M-OH + HO-M≡ → ≡M-O-M≡ + H2O (6)
As can be seen in Figure 6a, the obtained geopolymers presented large pores distributed on the
entire analyzed surface. After introducing the aggregates, the large pores especially decreased in
number (Figure 6b).
Figure 6. Optical micrographs of: (a) sample 100FA; (b) sample 30FA_70S.
The samples mass loss (Figure 4b) caused by hygroscopic water evaporation was close to 10%
for the 100FA sample, 8% for 70FA_30PG, 5% for 30FA_70S, and 2% for 15FA_15PG_70S, respectively.
The water absorbance capacity of samples was related to the calcium oxides and silica gel
concentration. Up to the temperature when the hydrogels water is removed, the samples mass
decreased to close to 16% in the case of 100FA and 70FA_30PG samples, while the samples with sand
show lower than 10% mass reduction. However, up to 250 °C, the mass decreases reached close to
18% in the case of 100FA and 70FA_30PG samples, 12% in the case of 30FA_70S, and only 3% in the
case of 15FA_15PG_70S.
Even if the percentage of mass loss up to this temperature is relatively high, because these types
of water molecules are free or physically bonded, their influence on the mechanical properties is
insignificant. However, if these materials are subjected to freeze-thaw cycles, cracks formation may
Figure 6. Optical micrographs of: (a) sample 100FA; (b) sample 30FA_70S.
The samples mass loss (Figure 4b) caused by hygroscopic water evaporation was close to 10%for the 100FA sample, 8% for 70FA_30PG, 5% for 30FA_70S, and 2% for 15FA_15PG_70S, respectively.The water absorbance capacity of samples was related to the calcium oxides and silica gel concentration.Up to the temperature when the hydrogels water is removed, the samples mass decreased to close to16% in the case of 100FA and 70FA_30PG samples, while the samples with sand show lower than 10%mass reduction. However, up to 250 ◦C, the mass decreases reached close to 18% in the case of 100FAand 70FA_30PG samples, 12% in the case of 30FA_70S, and only 3% in the case of 15FA_15PG_70S.
Even if the percentage of mass loss up to this temperature is relatively high, because these typesof water molecules are free or physically bonded, their influence on the mechanical properties isinsignificant. However, if these materials are subjected to freeze-thaw cycles, cracks formation mayoccur due to the water (ice) from the expansion of the pores, which reduces the mechanical resistanceof the geopolymers [60].
In the 360–700 ◦C temperature range, the mass loss is due to the removing of chemical boundwater molecules. Therefore, an increase of between 460 ◦C and 515 ◦C corresponds to a 1% massreduction of the 100FA sample and close to a 0.2% mass reduction of 15FA_15PG_70S sample, which isrelated to the CaOH decomposition. Also, in the Al(OH)3 and FeO(OH) decomposition temperaturerange, the samples mass loss are lower than 1%.
Furthermore, above this temperature range, the DTA curves still show small peaks. Theseendothermic or exothermic reactions correspond to the decomposition of CaCO3 at close to 750 ◦C [61]
Materials 2020, 13, 343 10 of 18
(Equation (7)), Ti(OH)4 close to 790 ◦C [62], or Mg(OH)2 close to 670 ◦C [63]. Yet, these compoundsexist only at the tracks level. Therefore, the effects on sample characteristics are low. At over 700 ◦C, amass gain can be observed, which appears to be due to the oxidation of oxygen-poor iron species orpure iron [64].
CaCO3(s)→ CaO(s) + CO2(g) (7)
The 100FA sample shows four peaks with the largest area. Therefore, the compounds thatdecompose in the analyzed temperature range come from the power plant fly ash particles.
3.2. Mineralogical Evaluation
The initial phases specific to the raw material and the transition in other phases that is specific tothe zeolites are governed by the characteristics of the geopolymerization reaction. This transition isbased on the raw material dissolution under alkaline conditions, resulting in reactive precursors ofSi(OH)4 and Al(OH)4, and the polymerization and precipitation of the system, resulting in condensationof Si-O-Al molecules in various compounds.
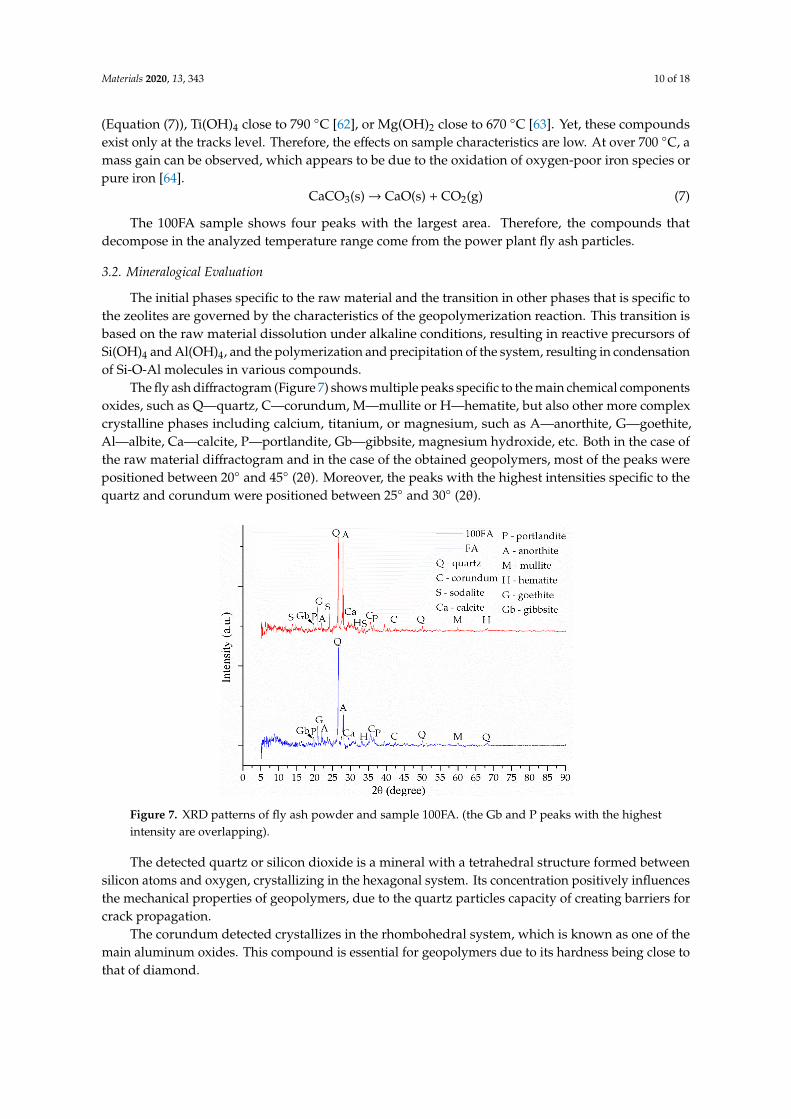
The fly ash diffractogram (Figure 7) shows multiple peaks specific to the main chemical componentsoxides, such as Q—quartz, C—corundum, M—mullite or H—hematite, but also other more complexcrystalline phases including calcium, titanium, or magnesium, such as A—anorthite, G—goethite,Al—albite, Ca—calcite, P—portlandite, Gb—gibbsite, magnesium hydroxide, etc. Both in the case ofthe raw material diffractogram and in the case of the obtained geopolymers, most of the peaks werepositioned between 20◦ and 45◦ (2θ). Moreover, the peaks with the highest intensities specific to thequartz and corundum were positioned between 25◦ and 30◦ (2θ).
Materials 2020, 13, x FOR PEER REVIEW 10 of 18
occur due to the water (ice) from the expansion of the pores, which reduces the mechanical resistance
of the geopolymers [60].
In the 360–700 °C temperature range, the mass loss is due to the removing of chemical bound
water molecules. Therefore, an increase of between 460 °C and 515 °C corresponds to a 1% mass
reduction of the 100FA sample and close to a 0.2% mass reduction of 15FA_15PG_70S sample, which
is related to the CaOH decomposition. Also, in the Al(OH)3 and FeO(OH) decomposition temperature
range, the samples mass loss are lower than 1%.
Furthermore, above this temperature range, the DTA curves still show small peaks. These
endothermic or exothermic reactions correspond to the decomposition of CaCO3 at close to 750 °C
[61] (Equation (7)), Ti(OH)4 close to 790 °C [62], or Mg(OH)2 close to 670 °C [63]. Yet, these compounds
exist only at the tracks level. Therefore, the effects on sample characteristics are low. At over 700 °C,
a mass gain can be observed, which appears to be due to the oxidation of oxygen-poor iron species
or pure iron [64].
CaCO3(s) → CaO(s) + CO2(g) (7)
The 100FA sample shows four peaks with the largest area. Therefore, the compounds that
decompose in the analyzed temperature range come from the power plant fly ash particles.
3.2. Mineralogical Evaluation
The initial phases specific to the raw material and the transition in other phases that is specific
to the zeolites are governed by the characteristics of the geopolymerization reaction. This transition
is based on the raw material dissolution under alkaline conditions, resulting in reactive precursors of
Si(OH)4 and Al(OH)4, and the polymerization and precipitation of the system, resulting in
condensation of Si-O-Al molecules in various compounds.
The fly ash diffractogram (Figure 7) shows multiple peaks specific to the main chemical
components oxides, such as Q—quartz, C—corundum, M—mullite or H—hematite, but also other
more complex crystalline phases including calcium, titanium, or magnesium, such as A—anorthite,
G—goethite, Al—albite, Ca—calcite, P—portlandite, Gb—gibbsite, magnesium hydroxide, etc. Both
in the case of the raw material diffractogram and in the case of the obtained geopolymers, most of the
peaks were positioned between 20° and 45° (2θ). Moreover, the peaks with the highest intensities
specific to the quartz and corundum were positioned between 25° and 30° (2θ).
Figure 7. XRD patterns of fly ash powder and sample 100FA. (the Gb and P peaks with the highest
intensity are overlapping).
The detected quartz or silicon dioxide is a mineral with a tetrahedral structure formed between
silicon atoms and oxygen, crystallizing in the hexagonal system. Its concentration positively
Figure 7. XRD patterns of fly ash powder and sample 100FA. (the Gb and P peaks with the highestintensity are overlapping).
The detected quartz or silicon dioxide is a mineral with a tetrahedral structure formed betweensilicon atoms and oxygen, crystallizing in the hexagonal system. Its concentration positively influencesthe mechanical properties of geopolymers, due to the quartz particles capacity of creating barriers forcrack propagation.
The corundum detected crystallizes in the rhombohedral system, which is known as one of themain aluminum oxides. This compound is essential for geopolymers due to its hardness being close tothat of diamond.
Materials 2020, 13, 343 11 of 18
Mullite crystallizes in the orthorhombic system, and is a less commonly encountered compoundthat forms between aluminum, silicon, and oxygen. Due to its very high melting temperature, 1840 ◦C,the presence of this mineral produces the increase of the geopolymers refractivity.
Hematite crystallizes in the rhombohedral system due to being a compound of iron with oxygen.It has the same crystallographic structure as that of the corundum, being frequently encountered with it.
Augite crystallizes in the monoclinic system being a complex compound of calcium, magnesium,silica and oxygen. It has a stone-like structure and color, and is rarely encountered with a shiny surface.
The anorthite crystallizes in the triclinic (anorthic) crystalline system, as it has the richest calciumcontent in the group of plagioclase feldspars. It is found in several colors and consists of calcium,aluminum, silicon, oxygen, but also potassium, sodium, iron, and titanium at trace levels.
Sodalite crystallizes in the cubic system as a mineral complex formed by the reaction betweensodium and chlorine with the main elements of the raw material (aluminum, silicon, and oxygen).The natural sodalite consists of an Al-O-Si network that encompasses Cl+ cations, but the one resultingfrom geopolymerization shows inter-structural Na+ cations, similar to zeolites [3].
Following the geopolymerization chemical reaction between the fly ash and the activation solution,the main phase specific to the raw material, the quartz, whose peak is positioned at 26.62◦, 2θ, decreasesin intensity as a result of the decrease of the glass phase, but there is a significant increase in theanorthite intensity, 28.03◦, 2θ, while new peaks specific to the phases created as a result of the reactionbetween Na and the other compounds also appear.
The diffractogram specific to the sample 100FA (Figure 7) shows the formation of the mostimportant phase specific to the geopolymerization, i.e., sodalite, which shows three peaks between 8◦
and 35◦, with the highest intensity at 24.50◦, 2θ. The appearance of such a phase specific to zeolitessuggests the formation of a mesoporous material (contains small pores with a diameter between 20and 50 nm) of semi-crystalline nature [65]. The sodalite content formed is directly proportional to thecation exchange capacity between the raw material and the activation solution. However, prior to andafter activation, secondary phases, such as corundum with the highest intensity peak at 35.47◦, 2θ,portlandite with the highest intensity peak at 36.48◦, 2θ, mullite with the highest intensity peak at60.76◦, 2θ, hematite with the highest intensity peak at 33.69◦, 2θ, goethite with the highest intensitypeak at 21.09◦, 2θ, and calcite were confirmed.
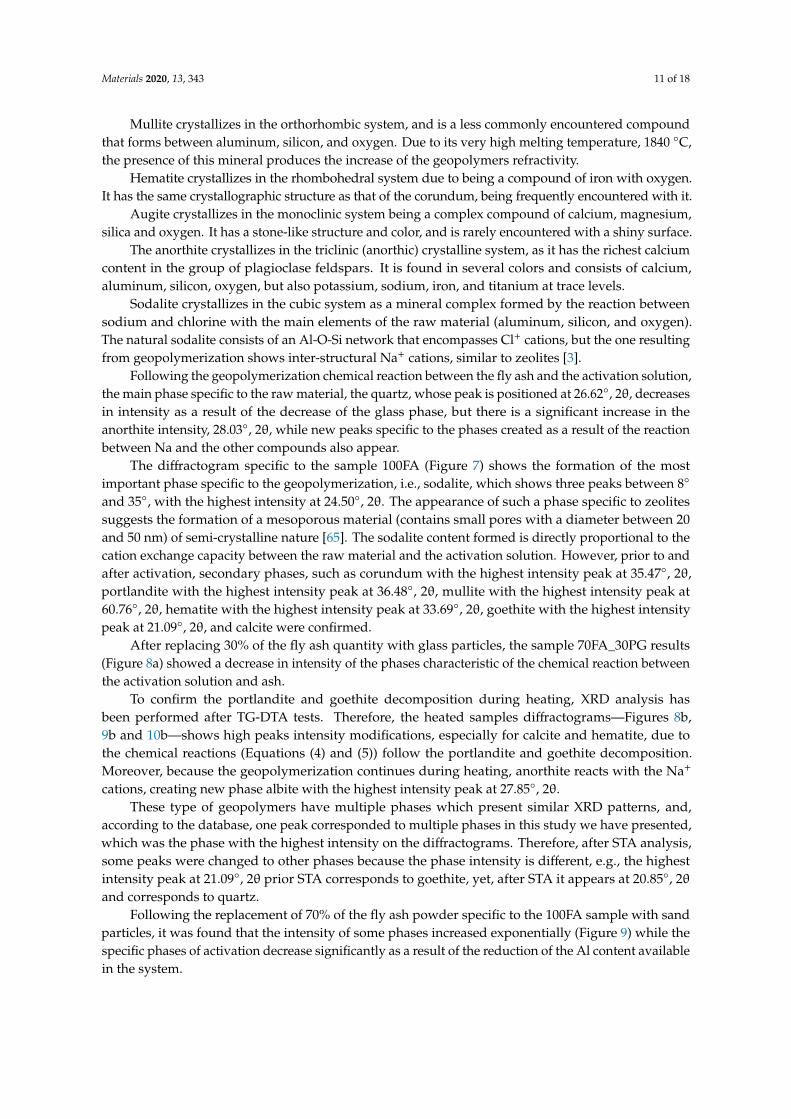
After replacing 30% of the fly ash quantity with glass particles, the sample 70FA_30PG results(Figure 8a) showed a decrease in intensity of the phases characteristic of the chemical reaction betweenthe activation solution and ash.
To confirm the portlandite and goethite decomposition during heating, XRD analysis hasbeen performed after TG-DTA tests. Therefore, the heated samples diffractograms—Figures 8b,9b and 10b—shows high peaks intensity modifications, especially for calcite and hematite, due tothe chemical reactions (Equations (4) and (5)) follow the portlandite and goethite decomposition.Moreover, because the geopolymerization continues during heating, anorthite reacts with the Na+
cations, creating new phase albite with the highest intensity peak at 27.85◦, 2θ.These type of geopolymers have multiple phases which present similar XRD patterns, and,
according to the database, one peak corresponded to multiple phases in this study we have presented,which was the phase with the highest intensity on the diffractograms. Therefore, after STA analysis,some peaks were changed to other phases because the phase intensity is different, e.g., the highestintensity peak at 21.09◦, 2θ prior STA corresponds to goethite, yet, after STA it appears at 20.85◦, 2θand corresponds to quartz.
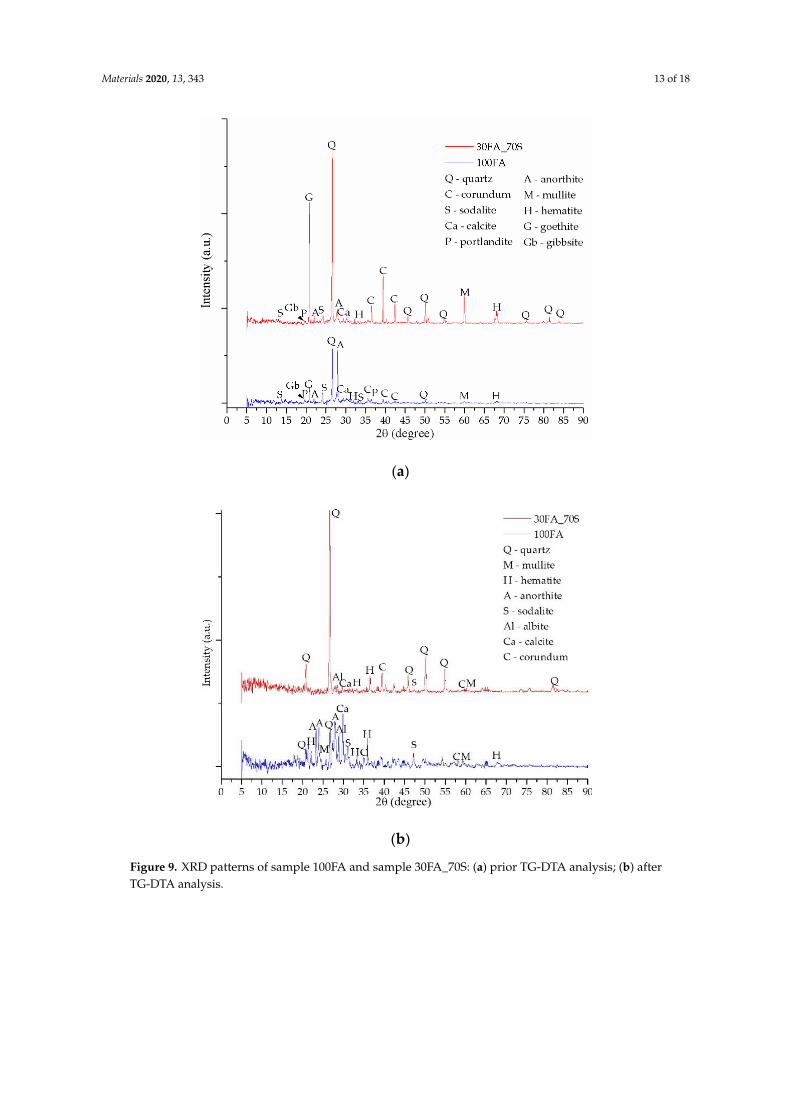
Following the replacement of 70% of the fly ash powder specific to the 100FA sample with sandparticles, it was found that the intensity of some phases increased exponentially (Figure 9) while thespecific phases of activation decrease significantly as a result of the reduction of the Al content availablein the system.
Materials 2020, 13, 343 12 of 18Materials 2020, 13, x FOR PEER REVIEW 12 of 18
(a)
(b)
Figure 8. XRD patterns of sample 100FA and sample 70FA_30PG: (a) prior TG-DTA analysis; (b) after
TG-DTA analysis.
These type of geopolymers have multiple phases which present similar XRD patterns, and,
according to the database, one peak corresponded to multiple phases in this study we have presented,
which was the phase with the highest intensity on the diffractograms. Therefore, after STA analysis,
some peaks were changed to other phases because the phase intensity is different, e.g., the highest
intensity peak at 21.09°, 2θ prior STA corresponds to goethite, yet, after STA it appears at 20.85°, 2θ
and corresponds to quartz.
Following the replacement of 70% of the fly ash powder specific to the 100FA sample with sand
particles, it was found that the intensity of some phases increased exponentially (Figure 9) while the
specific phases of activation decrease significantly as a result of the reduction of the Al content
available in the system.
Figure 8. XRD patterns of sample 100FA and sample 70FA_30PG: (a) prior TG-DTA analysis; (b) afterTG-DTA analysis.
Materials 2020, 13, 343 13 of 18
Materials 2020, 13, x FOR PEER REVIEW 13 of 18
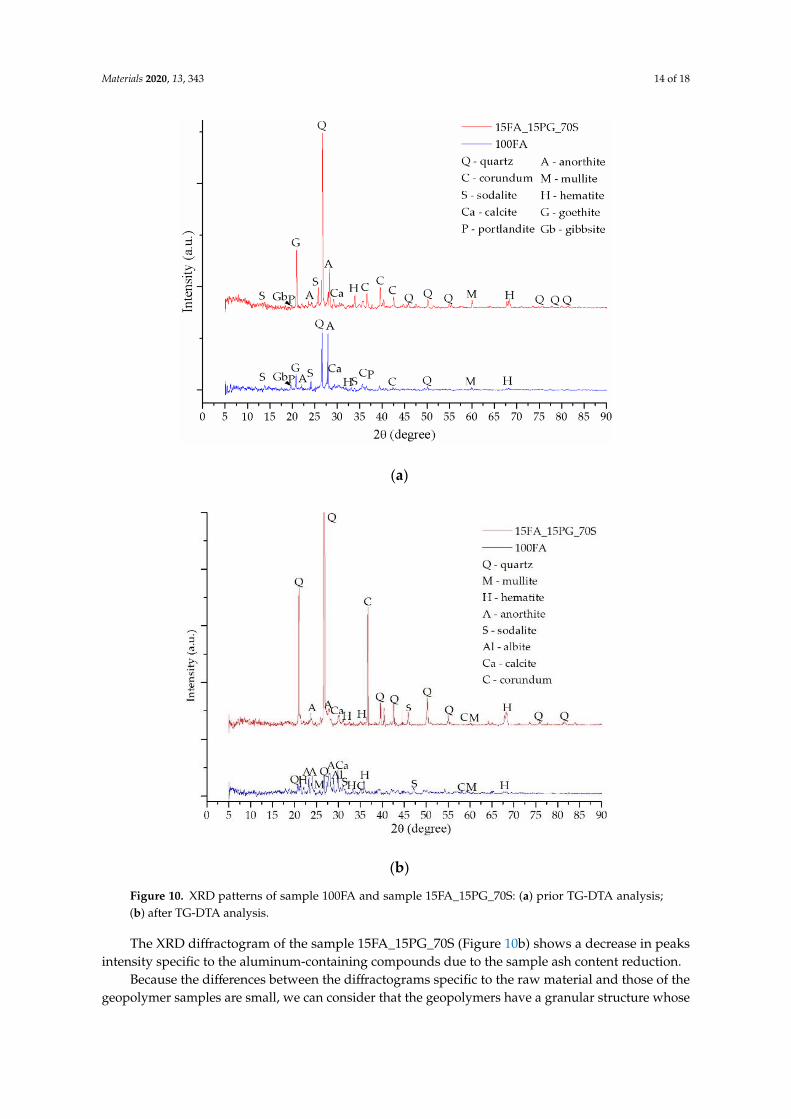
The XRD diffractogram of the sample 15FA_15PG_70S (Figure 10b) shows a decrease in peaks
intensity specific to the aluminum-containing compounds due to the sample ash content reduction.
Because the differences between the diffractograms specific to the raw material and those of the
geopolymer samples are small, we can consider that the geopolymers have a granular structure
whose surface is covered by phases resulting from the geopolymerization, which helps to bind them,
resulting in a semi-crystalline structure.
The diffractogram of the thermal power plant fly ash shows mainly phases specific to the
compounds of Al and Si, and at the trace level Fe, Ca, or Ti compounds can be observed. Following
activation, an additional phase specific to zeolites appeared known as sodalite, , while the initial
phases showed minimal changes.
(a)
(b)
Figure 9. XRD patterns of sample 100FA and sample 30FA_70S: (a) prior TG-DTA analysis; (b) after
TG-DTA analysis.
Figure 9. XRD patterns of sample 100FA and sample 30FA_70S: (a) prior TG-DTA analysis; (b) afterTG-DTA analysis.
Materials 2020, 13, 343 14 of 18Materials 2020, 13, x FOR PEER REVIEW 14 of 18
(a)
(b)
Figure 10. XRD patterns of sample 100FA and sample 15FA_15PG_70S: (a) prior TG-DTA analysis;
(b) after TG-DTA analysis.
4. Conclusions
In the analyzed temperature range, the fly ash-based geopolymers exhibited high mass loss due
to the removal of free and physically bound water molecules at up to 300 °C. Above this temperature
multiple compounds, such as goethite, portlandite, gibbsite, etc. decomposed due to the OH groups
(chemically bound water) removed. Yet, it was observed that the mass lose percentage depends on
the sample fly ash content. Therefore, the hygroscopicity, as well as the concentration of unstable
compounds, are strongly related to the matrix structure.
Taking into account the high number of chemical elements and so many possibilities of
compounds formation during heating, such phase transition and structural modifications will result
in geopolymers characteristics changing. Therefore, in order to obtain a much thermally stable
Figure 10. XRD patterns of sample 100FA and sample 15FA_15PG_70S: (a) prior TG-DTA analysis;(b) after TG-DTA analysis.
The XRD diffractogram of the sample 15FA_15PG_70S (Figure 10b) shows a decrease in peaksintensity specific to the aluminum-containing compounds due to the sample ash content reduction.
Because the differences between the diffractograms specific to the raw material and those of thegeopolymer samples are small, we can consider that the geopolymers have a granular structure whose
Materials 2020, 13, 343 15 of 18
surface is covered by phases resulting from the geopolymerization, which helps to bind them, resultingin a semi-crystalline structure.
The diffractogram of the thermal power plant fly ash shows mainly phases specific to thecompounds of Al and Si, and at the trace level Fe, Ca, or Ti compounds can be observed. Followingactivation, an additional phase specific to zeolites appeared known as sodalite, while the initial phasesshowed minimal changes.
4. Conclusions
In the analyzed temperature range, the fly ash-based geopolymers exhibited high mass loss dueto the removal of free and physically bound water molecules at up to 300 ◦C. Above this temperaturemultiple compounds, such as goethite, portlandite, gibbsite, etc. decomposed due to the OH groups(chemically bound water) removed. Yet, it was observed that the mass lose percentage depends onthe sample fly ash content. Therefore, the hygroscopicity, as well as the concentration of unstablecompounds, are strongly related to the matrix structure.
Taking into account the high number of chemical elements and so many possibilities of compoundsformation during heating, such phase transition and structural modifications will result in geopolymerscharacteristics changing. Therefore, in order to obtain a much thermally stable geopolymer, based onindigenous fly ash, a high percentage of natural aggregates should be introduced in the matrix.
The glass powder introduction in the matrix will result in a denser sample, yet, due to the highcalcium content, the thermal stability at high temperatures decreases.
Author Contributions: Writing original draft and investigation, D.D.B.N.; data curation and validation,M.M.A.B.A.; Validation and writing—reviewing and editing, A.V.S.; Validation and writing, project administrationand scientific supervision, P.V. All authors have read and agreed to the published version of the manuscript.
Funding: This research received no external funding.
Conflicts of Interest: The authors declare no conflict of interest.
References
1. Nergis, D.D.B.; Abdullah, M.M.A.B.; Vizureanu, P.; Tahir, M.F.M. Geopolymers and Their Uses: Review.IOP Conf. Ser. Mater. Sci. Eng. 2018, 374, 12019. [CrossRef]
2. Vogt, O.; Ukrainczyk, N.; Ballschmiede, C.; Koenders, E. Reactivity and Microstructure of Metakaolin BasedGeopolymers: Effect of Fly Ash and Liquid/Solid Contents. Materials 2019, 12, 3485. [CrossRef] [PubMed]
3. Papa, E.; Medri, V.; Amari, S.; Manaud, J.; Benito, P.; Vaccari, A.; Landi, E. Zeolite-geopolymer compositematerials: Production and characterization. J. Clean. Prod. 2018, 171, 76–84. [CrossRef]
4. North, M.R.; Swaddle, T.W. Kinetics of Silicate Exchange in Alkaline Aluminosilicate Solutions. Inorg. Chem.2000, 39, 2661–2665. [CrossRef] [PubMed]
5. Duxson, P.; Fernández-Jiménez, A.; Provis, J.L.; Lukey, G.C.; Palomo, A.; van Deventer, J.S.J. Geopolymertechnology: The current state of the art. J. Mater. Sci. 2006, 42, 2917–2933. [CrossRef]
6. Farhana, Z.F.; Kamarudin, H.; Rahmat, A.; Al Bakri, A.M.M. A Study on Relationship between Porosity andCompressive Strength for Geopolymer Paste. Key Eng. Mater. 2013, 594–595, 1112–1116. [CrossRef]
7. Ding, Y.; Dai, J.-G.; Shi, C.-J. Mechanical properties of alkali-activated concrete: A state-of-the-art review.Constr. Build. Mater. 2016, 127, 68–79. [CrossRef]
8. Rowles, M.; O’Connor, B. Chemical optimisation of the compressive strength of aluminosilicate geopolymerssynthesised by sodium silicate activation of metakaolinite. J. Mater. Chem. 2003, 13, 1161–1165. [CrossRef]
9. Ukrainczyk, N.; Muthu, M.; Vogt, O.; Koenders, E. Geopolymer, Calcium Aluminate, and PortlandCement-Based Mortars: Comparing Degradation Using Acetic Acid. Materials 2019, 12, 3115. [CrossRef]
10. Rangan, B.V. Design, Properties, and Applications of Low-Calcium Fly Ash-Based Geopolymer Concrete.In Developments in Porous, Biological and Geopolymer Ceramics; John Wiley & Sons, Inc.: Hoboken, NJ, USA,2007; pp. 347–362.
11. Ismail, N.; El-Hassan, H. Development and Characterization of Fly AshSlag Blended Geopolymer Mortarand Lightweight Concrete. J. Mater. Civ. Eng. 2018, 30, 4018029. [CrossRef]
Materials 2020, 13, 343 16 of 18
12. Reig, L.; Soriano, L.; Borrachero, M.V.; Monzó, J.; Payá, J. Influence of calcium aluminate cement (CAC) onalkaline activation of red clay brick waste (RCBW). Cem. Concr. Compos. 2016, 65, 177–185. [CrossRef]
13. Scrivener, K.L.; Capmas, A. Calcium Aluminate Cements. In Leas Chemistry of Cement and Concrete; Elsevier:Amsterdam, The Netherlands, 1998; pp. 713–782.
14. Vafaei, M.; Allahverdi, A. Influence of calcium aluminate cement on geopolymerization of natural pozzolan.Constr. Build. Mater. 2016, 114, 290–296. [CrossRef]
15. Nath, P.; Sarker, P.K. Use of OPC to improve setting and early strength properties of low calcium fly ashgeopolymer concrete cured at room temperature. Cem. Concr. Compos. 2015, 55, 205–214. [CrossRef]
16. Azmi, A.A.; Abdullah, M.M.A.B.; Ghazali, C.M.R.; Sandu, A.V.; Hussin, K.; Sumarto, D.A. A Review on FlyAsh Based Geopolymer Rubberized Concrete. Key Eng. Mater. 2016, 700, 183–196. [CrossRef]
17. Burduhos Nergis, D.D.; Vizureanu, P.; Corbu, O. Synthesis and characteristics of local fly ash basedgeopolymers mixed with natural aggregates. Rev. Chim. 2019, 70, 1262–1267.
18. Ma, H.; Qian, S.; Li, V.C. Influence of Fly Ash Type on Mechanical Properties and Self-Healing Behavior ofEngineered Cementitious Composite (ECC). In Proceedings of the 9th International Conference on FractureMechanics of Concrete and Concrete Structures, Berkeley, CA, USA, 28 May–1 June 2016.
19. Ibrahim, W.M.W.; Hussin, K.; Abdullah, M.M.A.B.; Kadir, A.A.; Binhussain, M. A Review of Fly Ash-BasedGeopolymer Lightweight Bricks. Appl. Mech. Mater. 2015, 754–755, 452–456. [CrossRef]
20. Davidovits, J. Geopolymers Based on Natural and Synthetic Metakaolin a Critical Review. In Proceedingsof the 41st International Conference on Advanced Ceramics and Composites, Daytona Beach, FL, USA,22–27 January 2017; pp. 201–214.
21. Available online: http://www.anpm.ro/documents/839616/33839940/Raport_Amplasament_CET2+Holboca+
Rev.+Sep2017.pdf/7931f8ce-1e21-4af7-9abf-a16c602acc5b (accessed on 12 December 2019).22. Zhang, S.; Keulen, A.; Arbi, K.; Ye, G. Waste glass as partial mineral precursor in alkali-activated slag/fly ash
system. Cement Concrete Res. 2017, 102, 29–40. [CrossRef]23. Shaikh, F.U.A. Mechanical and durability properties of fly ash geopolymer concrete containing recycled
coarse aggregates. Int. J. Sustain. Built Environ. 2016, 5, 277–287. [CrossRef]24. Embong, R.; Kusbiantoro, A.; Shafiq, N.; Nuruddin, M.F. Strength and microstructural properties of fly ash
based geopolymer concrete containing high-calcium and water-absorptive aggregate. J. Clean. Prod. 2016,112, 816–822. [CrossRef]
25. Joseph, B.; Mathew, G. Influence of aggregate content on the behavior of fly ash based geopolymer concrete.Sci. Iran. 2012, 19, 1188–1194. [CrossRef]
26. Dave, S.; Bhogayata, A.; Arora, D.N. Impact Resistance of Geopolymer Concrete Containing Recycled PlasticAggregates. EasyChair 2017, 1, 137–143.
27. Provis, J.L. Alkali-activated Binders and Concretes: The Path to Standardization. In Geopolymer BinderSystems; ASTM International: West Conshohocken, PA, USA, 2013; pp. 185–195.
28. Nordin, N.; Abdullah, M.M.A.B.; Fakri, W.M.N.R.W.; Tahir, M.F.M.; Sandu, A.V.; Hussin, K.; Zailani, W.W.A.Exploration on fly ash waste as global construction materials for dynamics marketability. In Proceedings ofthe Applied Physics of Condensed Matter (APCOM 2019), Pleso, Slovak, 19–21 June 2019; AIP Publishing:Melville, NY, USA, 2019.
29. Xu, H.; van Deventer, J.S.J. Effect of source materials on geopolymerization. Ind. Eng. Chem. Res. 2003, 42,1698–1706. [CrossRef]
30. Mo, B.H.; Zhu, H.; Cui, X.M.; He, Y.; Gong, S.Y. Effect of curing temperature on geopolymerization ofmetakaolin-based geopolymers. Appl. Clay Sci. 2014, 99, 144–148. [CrossRef]
31. Abdullah, M.M.A.B.; Yahya, Z.; Tahir, M.F.M.; Hussin, K.; Binhussain, M.; Sandhu, A.V. Fly Ash BasedLightweight Geopolymer Concrete Using Foaming Agent Technology. Appl. Mech. Mater. 2014, 679, 20–24.[CrossRef]
32. Harja, M.; Barbuta, M.; Rusu, L. Obtaining and Characterization of the Polymer Concrete with Fly Ash.J. Appl. Sci. 2009, 9, 88–96. [CrossRef]
33. Corbu, O.; Ioani, A.M.; Al Bakri Abdullah, M.M.; Meita, V.; Szilagyi, H.; Sandu, A.V. The pozzoolanicactivity level of powder waste glass in comparisons with other powders. Key Eng. Mater. 2015, 660, 237–243.[CrossRef]
34. Lee, W.K.W.; van Deventer, J.S.J. Chemical interactions between siliceous aggregates and low-Caalkali-activated cements. Cem. Concr. Res. 2007, 37, 844–855. [CrossRef]
Materials 2020, 13, 343 17 of 18
35. Ismail, I.; Bernal, S.A.; Provis, J.L.; Hamdan, S.; van Deventer, J.S.J. Microstructural changes in alkali activatedfly ash/slag geopolymers with sulfate exposure. Mater. Struct. 2012, 46, 361–373. [CrossRef]
36. Wuddivira, M.N.; Robinson, D.A.; Lebron, I.; Bréchet, L.; Atwell, M.; de Caires, S.; Oatham, M.; Jones, S.B.;Abdu, H.; Verma, A.K.; et al. Estimation of soil clay content from hygroscopic water content measurements.Soil Sci. Soc. Am. J. 2012, 76, 1529–1535. [CrossRef]
37. Rico, P.; Adriano, A.; Soriano, G.; Duque, J.V. Characterization of Water Absorption and Desorption propertiesof Natural Zeolites in Ecuador. In International Symposium on Energy; Puerto Rico Energy Center-Laccei:Puerto Rico, 2013.
38. Longhi, M.A.; Zhang, Z.; Rodríguez, E.D.; Kirchheim, A.P.; Wang, H. Efflorescence of alkali-activated cements(geopolymers) and the impacts on material structures: A critical analysis. Front. Mater. 2019, 6. [CrossRef]
39. Smart Nanoconcretes and Cement-Based Materials: Properties, Modelling and Applications. Available online:https://books.google.ro/books?id=oaq-DwAAQBAJ&pg=PA173&lpg=PA173&dq=strong+physically+
bound+water&source=bl&ots=F2VLsZWYHy&sig=ACfU3U11W_kRxqwL2yooFg6auXynm-80ww&hl=ro&sa=X&ved=2ahUKEwjjptPehrLmAhV_wAIHHVmYCG8Q6AEwDnoECAoQAQ#v=onepage&q=
strong%20physically%20bound%20water&f=false (accessed on 13 December 2019).40. Van Reeuwijk, L.P. The Thermal Dehydration of Natural Zeolites (with a Summary in Dutch); H. Veenman &
Zonen: Wageningen, The Netherlands, 1974.41. Valdiviés-Cruz, K.; Lam, A.; Zicovich-Wilson, C.M. Chemical interaction of water molecules with framework
Al in acid zeolites: A periodic ab initio study on H-clinoptilolite. Phys. Chem. Chem. Phys. 2015, 17,23657–23666. [CrossRef] [PubMed]
42. Calero, S.; Gómez-Álvarez, P. Hydrogen bonding of water confined in zeolites and their zeolitic imidazolateframework counterparts. RSC Adv. 2014, 4, 29571–29580. [CrossRef]
43. Glad, B.E.; Kriven, W.M. Geopolymer with Hydrogel Characteristics via Silane Coupling Agent Additives.J. Am. Ceram. Soc. 2014, 97, 295–302. [CrossRef]
44. Palomo, A.; Krivenko, P.; Garcia-Lodeiro, I.; Kavalerova, E.; Maltseva, O.; Fernández-Jiménez, A. A reviewon alkaline activation: New analytical perspectives. Mater. Constr. 2014, 64, 22. [CrossRef]
45. Criado, M.; Aperador, W.; Sobrados, I. Microstructural and mechanical properties of alkali activatedColombian raw materials. Materials 2016, 9, 158. [CrossRef] [PubMed]
46. Musicá, S.M.; Krehula, S.; Popovicb, S.; Popovicb, P. Thermal decomposition of h-FeOOH. Mater. Lett. 2004,58, 444–448.
47. Derie, R.; Ghodsi, M.; Calvo-Roche, C. DTA study of the dehydration of synthetic goethite αFeOOH. J. Therm.Anal. 1976, 9, 435–440. [CrossRef]
48. Rendon, J.L.; Cornejo, J.; de Arambarri, P.; Serna, C.J. Pore structure of thermally treated goethite (α-FeOOH).J. Colloid Interface Sci. 1983, 92, 508–516. [CrossRef]
49. Giovanoli, R.; Brütsch, R. Kinetics and mechanism of the dehydration of γ-FeOOH. Thermochim. Acta 1975,13, 15–36. [CrossRef]
50. Walter, D.; Buxbaum, G.; Laqua, W. The mechanism of the thermal transformation from goethite to hematite*.J. Therm. Anal. Calorim. 2001, 63, 733–748. [CrossRef]
51. Cheng-Yong, H.; Yun-Ming, L.; Abdullah, M.M.A.B.; Hussin, K. Thermal Resistance Variations of Fly AshGeopolymers: Foaming Responses. Sci. Rep. 2017, 7, 45355. [CrossRef] [PubMed]
52. Cornejo, M.H.; Togra, B.; Baykara, H.; Soriano, G.; Paredes, C.; Elsen, J. Effect of Calcium Hydroxide andWater to Solid Ratio on Compressive Strength of Mordenite-Based Geopolymer and the Evaluation of ItsThermal Transmission Property. In Proceedings of the ASME International Mechanical Engineering Congressand Exposition (IMECE), Pittsburgh, PA, USA, 9–15 November 2018; American Society of MechanicalEngineers (ASME): New York, NY, USA, 2018; Volume 12.
53. Abdullah, M.M.A.B.; Ming, L.Y.; Yong, H.C.; Tahir, M.F.M. Clay-Based Materials in Geopolymer Technology.In Cement Based Materials; InTechOpen: London, UK, 2018. [CrossRef]
54. Bajare, D.; Vitola, L.; Dembovska, L.; Bumanis, G. Waste stream porous alkali activated materials for hightemperature application. Front. Mater. 2019, 6. [CrossRef]
55. Dehydration Reactions and Kinetic Parameters of Gibbsite—Science Direct. Available online: https://www.sciencedirect.com/science/article/pii/S0272884210002592 (accessed on 13 December 2019).
56. MacKenzie, K.J.D.; Temuujin, J.; Okada, K. Thermal decomposition of mechanically activated gibbsite.Thermochim. Acta 1999, 327, 103–108. [CrossRef]
Materials 2020, 13, 343 18 of 18
57. Zhu, B.; Fang, B.; Li, X. Dehydration reactions and kinetic parameters of gibbsite. Ceram. Int. 2010, 36,2493–2498. [CrossRef]
58. Redaoui, D.; Sahnoune, F.; Heraiz, M.; Raghdi, A. Mechanism and Kinetic Parameters of the ThermalDecomposition of Gibbsite Al(OH)3 by Thermogravimetric Analysis. Acta Phys. Pol. Ser. A 2017, 131,562–565. [CrossRef]
59. Hao, H.; Lin, K.-L.; Wang, D.; Chao, S.-J.; Shiu, H.-S.; Cheng, T.-W.; Hwang, C.-L. Elucidating Characteristicsof Geopolymer with Solar Panel Waste Glass. Environ. Eng. Manag. J. 2015, 14, 79–87.
60. Grawe, S.; Augustin-Bauditz, S.; Clemen, H.C.; Ebert, M.; Eriksen Hammer, S.; Lubitz, J.; Reicher, N.;Rudich, Y.; Schneider, J.; Staacke, R.; et al. Coal fly ash: Linking immersion freezing behavior andphysicochemical particle properties. Atmos. Chem. Phys. 2018, 18, 13903–13923. [CrossRef]
61. Duan, P.; Yan, C.; Zhou, W. Compressive strength and microstructure of fly ash based geopolymer blendedwith silica fume under thermal cycle. Cem. Concr. Compos. 2017, 78, 108–119. [CrossRef]
62. Paunovic, P.; Petrovski, A.; Nacevski, G.; Grozdanov, A.; Marinkovski, M.; Andonovic, B.; Makreski, P.;Popovski, O.; Dimitrov, A. Pathways for the production of non-stoichiometric titanium oxides. In NanoscienceAdvances in CBRN Agents Detection, Information and Energy Security; Springer: Dordrecht, The Netherlands,2015; pp. 239–253. ISBN 9789401796972.
63. Anderson, P.J.; Horlock, R.F. Thermal decomposition of magnesium hydroxide. Trans. Faraday Soc. 1962, 58,1993–2004. [CrossRef]
64. Zulkifly, K.; Yong, H.C.; Abdullah, M.M.A.B.; Ming, L.Y.; Panias, D.; Sakkas, K. Review of GeopolymerBehaviour in Thermal Environment. In Proceedings of the IOP Conference Series: Materials Science andEngineering, Bali, Indonesia, 26–27 July 2016; Institute of Physics Publishing: Bristol, UK, 2017; Volume 209.
65. Alvarez-Ayuso, E.; Querol, X.; Plana, F.; Alastuey, A.; Moreno, N.; Izquierdo, M.; Font, O.; Moreno, T.;Diez, S.; Vázquez, E.; et al. Environmental, physical and structural characterisation of geopolymer matrixessynthesised from coal (co-)combustion fly ashes. J. Hazard. Mater. 2008, 154, 175–183. [CrossRef]
© 2020 by the authors. Licensee MDPI, Basel, Switzerland. This article is an open accessarticle distributed under the terms and conditions of the Creative Commons Attribution(CC BY) license (http://creativecommons.org/licenses/by/4.0/).


![Alkali & alkali tanah [yunusthariqrizky]](https://img.pdfslide.net/doc/110x75/555d0f95d8b42ac4258b46d7/alkali-alkali-tanah-yunusthariqrizky.jpg)