Embed Size (px)
Citation preview
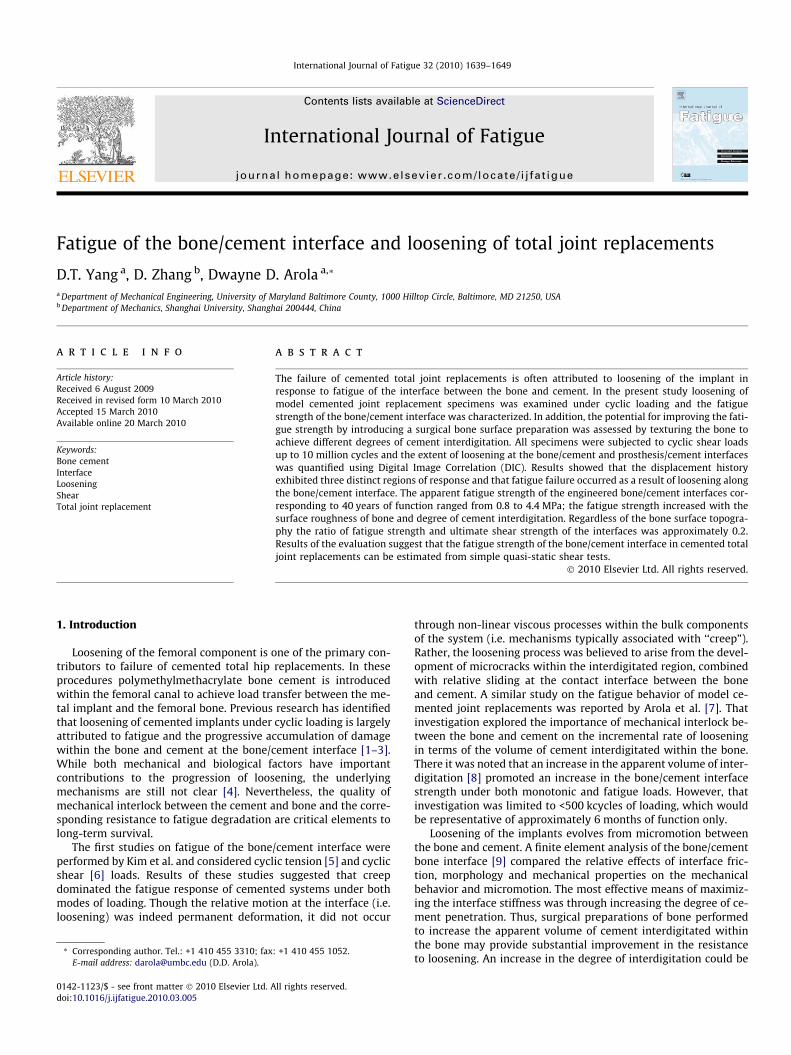
International Journal of Fatigue 32 (2010) 1639–1649
Contents lists available at ScienceDirect
International Journal of Fatigue
journal homepage: www.elsevier .com/locate / i j fa t igue
Fatigue of the bone/cement interface and loosening of total joint replacements
D.T. Yang a, D. Zhang b, Dwayne D. Arola a,*
a Department of Mechanical Engineering, University of Maryland Baltimore County, 1000 Hilltop Circle, Baltimore, MD 21250, USAb Department of Mechanics, Shanghai University, Shanghai 200444, China
a r t i c l e i n f o a b s t r a c t
Article history:Received 6 August 2009Received in revised form 10 March 2010Accepted 15 March 2010Available online 20 March 2010
Keywords:Bone cementInterfaceLooseningShearTotal joint replacement
0142-1123/$ - see front matter � 2010 Elsevier Ltd. Adoi:10.1016/j.ijfatigue.2010.03.005
* Corresponding author. Tel.: +1 410 455 3310; faxE-mail address: [email protected] (D.D. Arola).
The failure of cemented total joint replacements is often attributed to loosening of the implant inresponse to fatigue of the interface between the bone and cement. In the present study loosening ofmodel cemented joint replacement specimens was examined under cyclic loading and the fatiguestrength of the bone/cement interface was characterized. In addition, the potential for improving the fati-gue strength by introducing a surgical bone surface preparation was assessed by texturing the bone toachieve different degrees of cement interdigitation. All specimens were subjected to cyclic shear loadsup to 10 million cycles and the extent of loosening at the bone/cement and prosthesis/cement interfaceswas quantified using Digital Image Correlation (DIC). Results showed that the displacement historyexhibited three distinct regions of response and that fatigue failure occurred as a result of loosening alongthe bone/cement interface. The apparent fatigue strength of the engineered bone/cement interfaces cor-responding to 40 years of function ranged from 0.8 to 4.4 MPa; the fatigue strength increased with thesurface roughness of bone and degree of cement interdigitation. Regardless of the bone surface topogra-phy the ratio of fatigue strength and ultimate shear strength of the interfaces was approximately 0.2.Results of the evaluation suggest that the fatigue strength of the bone/cement interface in cemented totaljoint replacements can be estimated from simple quasi-static shear tests.
� 2010 Elsevier Ltd. All rights reserved.
1. Introduction
Loosening of the femoral component is one of the primary con-tributors to failure of cemented total hip replacements. In theseprocedures polymethylmethacrylate bone cement is introducedwithin the femoral canal to achieve load transfer between the me-tal implant and the femoral bone. Previous research has identifiedthat loosening of cemented implants under cyclic loading is largelyattributed to fatigue and the progressive accumulation of damagewithin the bone and cement at the bone/cement interface [1–3].While both mechanical and biological factors have importantcontributions to the progression of loosening, the underlyingmechanisms are still not clear [4]. Nevertheless, the quality ofmechanical interlock between the cement and bone and the corre-sponding resistance to fatigue degradation are critical elements tolong-term survival.
The first studies on fatigue of the bone/cement interface wereperformed by Kim et al. and considered cyclic tension [5] and cyclicshear [6] loads. Results of these studies suggested that creepdominated the fatigue response of cemented systems under bothmodes of loading. Though the relative motion at the interface (i.e.loosening) was indeed permanent deformation, it did not occur
ll rights reserved.
: +1 410 455 1052.
through non-linear viscous processes within the bulk componentsof the system (i.e. mechanisms typically associated with ‘‘creep”).Rather, the loosening process was believed to arise from the devel-opment of microcracks within the interdigitated region, combinedwith relative sliding at the contact interface between the boneand cement. A similar study on the fatigue behavior of model ce-mented joint replacements was reported by Arola et al. [7]. Thatinvestigation explored the importance of mechanical interlock be-tween the bone and cement on the incremental rate of looseningin terms of the volume of cement interdigitated within the bone.There it was noted that an increase in the apparent volume of inter-digitation [8] promoted an increase in the bone/cement interfacestrength under both monotonic and fatigue loads. However, thatinvestigation was limited to <500 kcycles of loading, which wouldbe representative of approximately 6 months of function only.
Loosening of the implants evolves from micromotion betweenthe bone and cement. A finite element analysis of the bone/cementbone interface [9] compared the relative effects of interface fric-tion, morphology and mechanical properties on the mechanicalbehavior and micromotion. The most effective means of maximiz-ing the interface stiffness was through increasing the degree of ce-ment penetration. Thus, surgical preparations of bone performedto increase the apparent volume of cement interdigitated withinthe bone may provide substantial improvement in the resistanceto loosening. An increase in the degree of interdigitation could be
1 cm
(a)
(b)
1 mm
200 µm
A
(c)
1 cm
1640 D.T. Yang et al. / International Journal of Fatigue 32 (2010) 1639–1649
considered to raise the potential for development of wear debris atthe bone/cement interface. But a more recent study of the interfaceshowed that there was no correlation between the fatigue strengthand the volume of wear debris [10].
Optical techniques have been adopted to understand the mech-anisms of loosening and the micromechanical contributions to thefatigue history. Specifically, Mann et al. [11] adopted the use ofDigital Image Correlation (DIC) to evaluate the bone/cement inter-face compliance under quasi-static tension and compression. Thetensile strength was inversely proportional to the interface compli-ance and proportional to the bone/cement contact area, both ofwhich further emphasize the importance of cement interdigitationand mechanical interlock. Components of tension and compressionloading may contribute to joint replacement failures, but cyclicshear is the predominate loading transferred across the bone/ce-ment interface. An experimental evaluation of the interface undercyclic shear using DIC reported that fatigue damage developed atthe bone/cement interface [12]. However, this study was limitedto very low-cycle fatigue (50 kcycles) and did not provide mea-sures of the bone/cement interface fatigue strength.
The present study was performed to further characterize loos-ening of the bone/cement interface under cyclic shear loading. Pre-vious investigations were limited to low-cycle fatigue (N 6500 kcycles) and the relative contributions of loosening from thebone/cement and prosthesis/cement interfaces were not distin-guished. Therefore, this in vitro study examined the looseningresponse under high-cycle fatigue (N > 1000 kcycles) and incorpo-rated optical methods to quantify the mechanisms of looseningand their relative contributions to the global response. The primaryobjectives were to estimate the stress-life fatigue strength of thebone/cement interface and to determine if results from monotonicor short-term fatigue tests could be used to predict the long-termperformance.
B
C
2. Materials and methods
The experimental program consisted of preparing model inter-face specimens comprised of bone, cement and prosthesis, charac-terizing their mechanical response under quasi-static and cyclicloading and evaluating loosening using an optical approach.
D
E
F
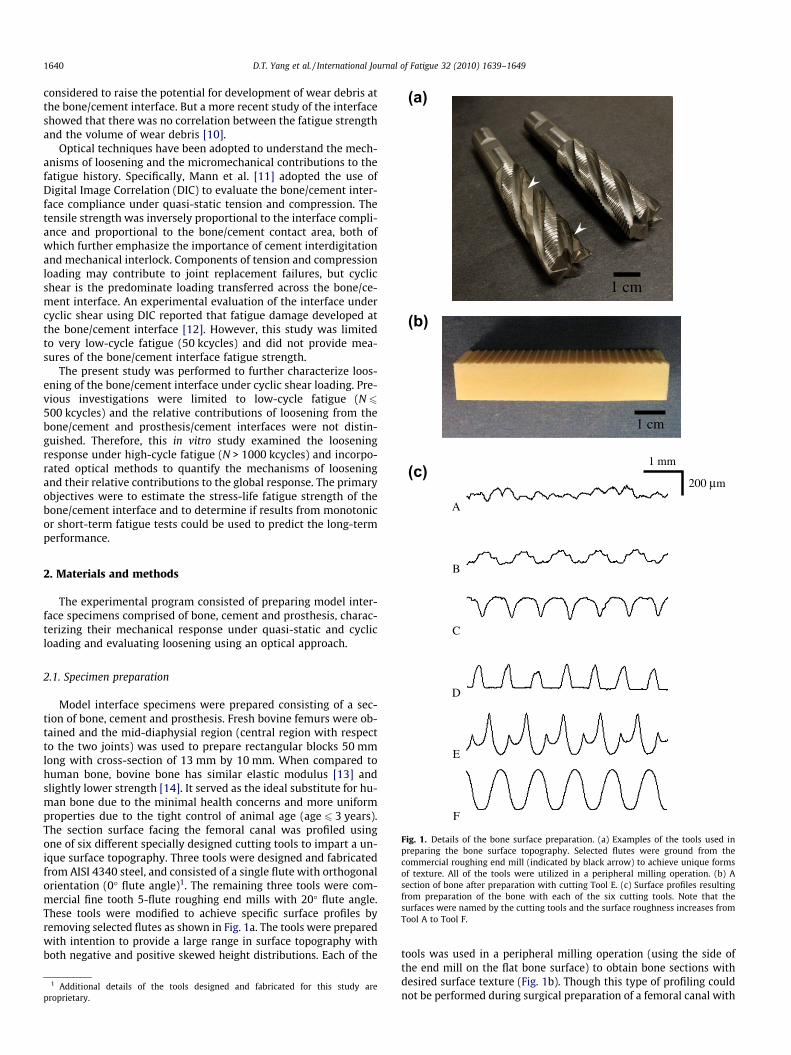
Fig. 1. Details of the bone surface preparation. (a) Examples of the tools used inpreparing the bone surface topography. Selected flutes were ground from thecommercial roughing end mill (indicated by black arrow) to achieve unique formsof texture. All of the tools were utilized in a peripheral milling operation. (b) Asection of bone after preparation with cutting Tool E. (c) Surface profiles resultingfrom preparation of the bone with each of the six cutting tools. Note that thesurfaces were named by the cutting tools and the surface roughness increases fromTool A to Tool F.
2.1. Specimen preparation
Model interface specimens were prepared consisting of a sec-tion of bone, cement and prosthesis. Fresh bovine femurs were ob-tained and the mid-diaphysial region (central region with respectto the two joints) was used to prepare rectangular blocks 50 mmlong with cross-section of 13 mm by 10 mm. When compared tohuman bone, bovine bone has similar elastic modulus [13] andslightly lower strength [14]. It served as the ideal substitute for hu-man bone due to the minimal health concerns and more uniformproperties due to the tight control of animal age (age 6 3 years).The section surface facing the femoral canal was profiled usingone of six different specially designed cutting tools to impart a un-ique surface topography. Three tools were designed and fabricatedfrom AISI 4340 steel, and consisted of a single flute with orthogonalorientation (0� flute angle)1. The remaining three tools were com-mercial fine tooth 5-flute roughing end mills with 20� flute angle.These tools were modified to achieve specific surface profiles byremoving selected flutes as shown in Fig. 1a. The tools were preparedwith intention to provide a large range in surface topography withboth negative and positive skewed height distributions. Each of the
1 Additional details of the tools designed and fabricated for this study areproprietary.
tools was used in a peripheral milling operation (using the side ofthe end mill on the flat bone surface) to obtain bone sections withdesired surface texture (Fig. 1b). Though this type of profiling couldnot be performed during surgical preparation of a femoral canal with
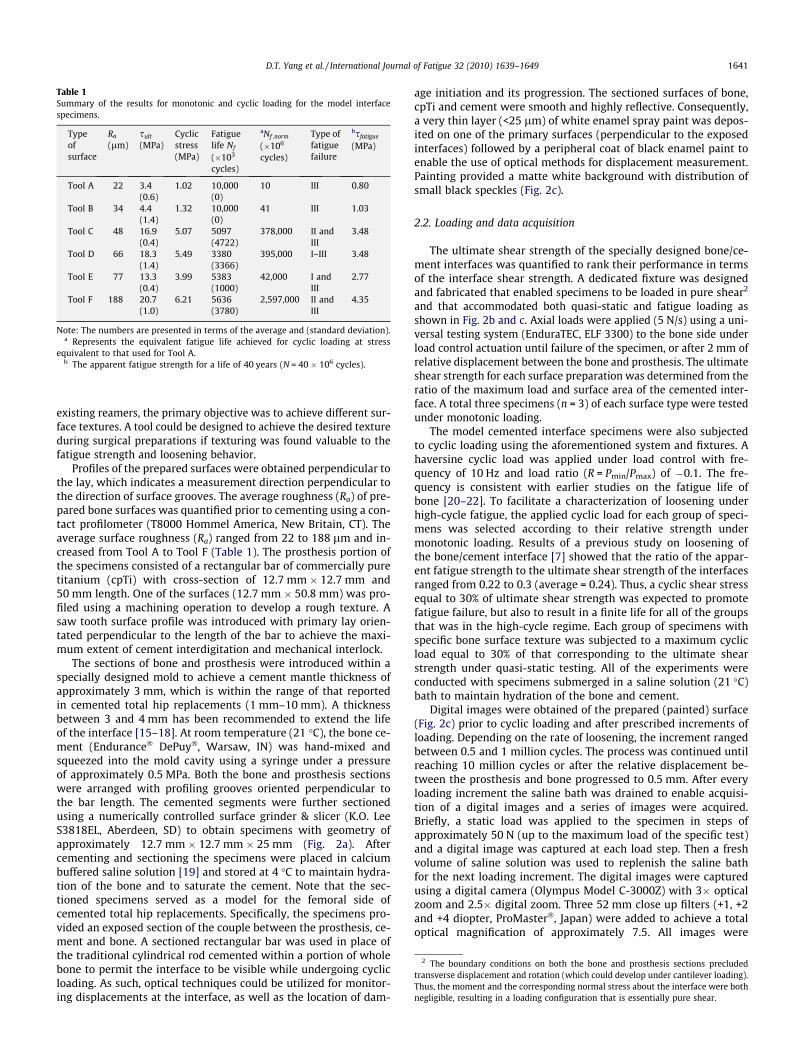
Table 1Summary of the results for monotonic and cyclic loading for the model interfacespecimens.
Typeofsurface
Ra
(lm)sult
(MPa)Cyclicstress(MPa)
Fatiguelife Nf
(�103
cycles)
aNf ;norm
(�106
cycles)
Type offatiguefailure
bsfatigue
(MPa)
Tool A 22 3.4(0.6)
1.02 10,000(0)
10 III 0.80
Tool B 34 4.4(1.4)
1.32 10,000(0)
41 III 1.03
Tool C 48 16.9(0.4)
5.07 5097(4722)
378,000 II andIII
3.48
Tool D 66 18.3(1.4)
5.49 3380(3366)
395,000 I–III 3.48
Tool E 77 13.3(0.4)
3.99 5383(1000)
42,000 I andIII
2.77
Tool F 188 20.7(1.0)
6.21 5636(3780)
2,597,000 II andIII
4.35
Note: The numbers are presented in terms of the average and (standard deviation).a Represents the equivalent fatigue life achieved for cyclic loading at stress
equivalent to that used for Tool A.b The apparent fatigue strength for a life of 40 years (N = 40 � 106 cycles).
2 The boundary conditions on both the bone and prosthesis sections precludedtransverse displacement and rotation (which could develop under cantilever loading).Thus, the moment and the corresponding normal stress about the interface were bothnegligible, resulting in a loading configuration that is essentially pure shear.
D.T. Yang et al. / International Journal of Fatigue 32 (2010) 1639–1649 1641
existing reamers, the primary objective was to achieve different sur-face textures. A tool could be designed to achieve the desired textureduring surgical preparations if texturing was found valuable to thefatigue strength and loosening behavior.
Profiles of the prepared surfaces were obtained perpendicular tothe lay, which indicates a measurement direction perpendicular tothe direction of surface grooves. The average roughness (Ra) of pre-pared bone surfaces was quantified prior to cementing using a con-tact profilometer (T8000 Hommel America, New Britain, CT). Theaverage surface roughness (Ra) ranged from 22 to 188 lm and in-creased from Tool A to Tool F (Table 1). The prosthesis portion ofthe specimens consisted of a rectangular bar of commercially puretitanium (cpTi) with cross-section of 12.7 mm � 12.7 mm and50 mm length. One of the surfaces (12.7 mm � 50.8 mm) was pro-filed using a machining operation to develop a rough texture. Asaw tooth surface profile was introduced with primary lay orien-tated perpendicular to the length of the bar to achieve the maxi-mum extent of cement interdigitation and mechanical interlock.
The sections of bone and prosthesis were introduced within aspecially designed mold to achieve a cement mantle thickness ofapproximately 3 mm, which is within the range of that reportedin cemented total hip replacements (1 mm–10 mm). A thicknessbetween 3 and 4 mm has been recommended to extend the lifeof the interface [15–18]. At room temperature (21 �C), the bone ce-ment (Endurance� DePuy�, Warsaw, IN) was hand-mixed andsqueezed into the mold cavity using a syringe under a pressureof approximately 0.5 MPa. Both the bone and prosthesis sectionswere arranged with profiling grooves oriented perpendicular tothe bar length. The cemented segments were further sectionedusing a numerically controlled surface grinder & slicer (K.O. LeeS3818EL, Aberdeen, SD) to obtain specimens with geometry ofapproximately 12.7 mm � 12.7 mm � 25 mm (Fig. 2a). Aftercementing and sectioning the specimens were placed in calciumbuffered saline solution [19] and stored at 4 �C to maintain hydra-tion of the bone and to saturate the cement. Note that the sec-tioned specimens served as a model for the femoral side ofcemented total hip replacements. Specifically, the specimens pro-vided an exposed section of the couple between the prosthesis, ce-ment and bone. A sectioned rectangular bar was used in place ofthe traditional cylindrical rod cemented within a portion of wholebone to permit the interface to be visible while undergoing cyclicloading. As such, optical techniques could be utilized for monitor-ing displacements at the interface, as well as the location of dam-
age initiation and its progression. The sectioned surfaces of bone,cpTi and cement were smooth and highly reflective. Consequently,a very thin layer (<25 lm) of white enamel spray paint was depos-ited on one of the primary surfaces (perpendicular to the exposedinterfaces) followed by a peripheral coat of black enamel paint toenable the use of optical methods for displacement measurement.Painting provided a matte white background with distribution ofsmall black speckles (Fig. 2c).
2.2. Loading and data acquisition
The ultimate shear strength of the specially designed bone/ce-ment interfaces was quantified to rank their performance in termsof the interface shear strength. A dedicated fixture was designedand fabricated that enabled specimens to be loaded in pure shear2
and that accommodated both quasi-static and fatigue loading asshown in Fig. 2b and c. Axial loads were applied (5 N/s) using a uni-versal testing system (EnduraTEC, ELF 3300) to the bone side underload control actuation until failure of the specimen, or after 2 mm ofrelative displacement between the bone and prosthesis. The ultimateshear strength for each surface preparation was determined from theratio of the maximum load and surface area of the cemented inter-face. A total three specimens (n = 3) of each surface type were testedunder monotonic loading.
The model cemented interface specimens were also subjectedto cyclic loading using the aforementioned system and fixtures. Ahaversine cyclic load was applied under load control with fre-quency of 10 Hz and load ratio (R = Pmin/Pmax) of �0.1. The fre-quency is consistent with earlier studies on the fatigue life ofbone [20–22]. To facilitate a characterization of loosening underhigh-cycle fatigue, the applied cyclic load for each group of speci-mens was selected according to their relative strength undermonotonic loading. Results of a previous study on loosening ofthe bone/cement interface [7] showed that the ratio of the appar-ent fatigue strength to the ultimate shear strength of the interfacesranged from 0.22 to 0.3 (average = 0.24). Thus, a cyclic shear stressequal to 30% of ultimate shear strength was expected to promotefatigue failure, but also to result in a finite life for all of the groupsthat was in the high-cycle regime. Each group of specimens withspecific bone surface texture was subjected to a maximum cyclicload equal to 30% of that corresponding to the ultimate shearstrength under quasi-static testing. All of the experiments wereconducted with specimens submerged in a saline solution (21 �C)bath to maintain hydration of the bone and cement.
Digital images were obtained of the prepared (painted) surface(Fig. 2c) prior to cyclic loading and after prescribed increments ofloading. Depending on the rate of loosening, the increment rangedbetween 0.5 and 1 million cycles. The process was continued untilreaching 10 million cycles or after the relative displacement be-tween the prosthesis and bone progressed to 0.5 mm. After everyloading increment the saline bath was drained to enable acquisi-tion of a digital images and a series of images were acquired.Briefly, a static load was applied to the specimen in steps ofapproximately 50 N (up to the maximum load of the specific test)and a digital image was captured at each load step. Then a freshvolume of saline solution was used to replenish the saline bathfor the next loading increment. The digital images were capturedusing a digital camera (Olympus Model C-3000Z) with 3� opticalzoom and 2.5� digital zoom. Three 52 mm close up filters (+1, +2and +4 diopter, ProMaster�, Japan) were added to achieve a totaloptical magnification of approximately 7.5. All images were
10 mm
Section line (1)
(2)
(3) 12.7 mm
3.3 mm
12.7 mm
Surface to be painted
PB C
(a)
P C B
δ (b)
(c)
Fig. 2. Details of the model interface specimens and loading configuration. (a) Segments of bone and prosthesis after cementing and section lines indicating three potentialspecimens (left). An oblique view of a single completed specimen is also shown (right), where P, C and B refer to the prosthesis, cement and bone, respectively. (b) A schematicdiagram of the loading arrangement. (c) A model interface specimen mounted within the loading fixture. The outlined portion (in dotted black line) represents theapproximate field of view documented sequentially during the cyclic loading process. The interfaces have been annotated with a white dotted line for clarity. On the right isan example gray scale image acquired using a digital camera. Note that the specimen’s surface has been painted to achieve a matte white background with dense distributionof small black speckles. The portion outlined with white dotted line represents the boundary of area assessed using DIC.
1642 D.T. Yang et al. / International Journal of Fatigue 32 (2010) 1639–1649
acquired with resolution of 2048 � 1536 pixels with 256 gray lev-els, which provided a precision of measurement over the field ofview of approximately 9.5 lm/pixel.
2.3. Image processing and data analysis
Digital Image Correlation (DIC) was adopted to quantify thefull-field displacement distribution within the model interfacespecimens that evolved with cyclic loading. The image acquiredprior to fatigue served as the ‘‘reference” image. At that stage,the specimen was considered to be free from defects and there
was no relative displacement between the bone, cement and pros-thesis. The images taken after each increment of fatigue loadingserved as the ‘‘deformed” images (i.e. displaced) and were com-pared with the ‘‘reference” image. Both the vertical (loading direc-tion) and horizontal (transverse to the loading direction)components of displacement were determined. A bi-cubic interpo-lation [23] was used to establish correlation in the grayscale distri-butions between the ‘‘deformed” and ‘‘reference” images. Thesearch for position with highest correlation was conducted untilachieving a precision of 0.01 pixels. Details of the process havebeen described elsewhere [24]. The maximum relative displace-

0
-250
-200
-150
-100
-50
50
-10 -8 -6 -4 -2 0 2 4
Rel
ativ
e D
ispl
acem
ent,
δ (μ
m)
Horizontal Position (mm)
B C P
B C P
(a)
(b)
Fig. 3. The evaluation of relative displacement between the bone, cement andprosthesis. (a) An example grayscale image after DIC which represents the full fieldvertical displacement distribution. Note the distinct boundary evident in thedisplacement field at the bone–cement interface evident from the sinusoidalprofile. (b) The vertical displacement distribution across the scribed white lineevident in (a).
D.T. Yang et al. / International Journal of Fatigue 32 (2010) 1639–1649 1643
ment of the prosthesis was found by comparing the ‘‘deformed”image obtained at the maximum load with the ‘‘reference” image.The average vertical and horizontal displacement between thebone and prosthesis was determined from the average displace-ment of the pixels along the scribe center line as shown inFig. 3a. Similarly, the relative horizontal and vertical relative dis-placements at the bone/cement and the prosthesis/cement inter-faces were also quantified.
Loosening of the model prosthesis systems was assessed interms the relative vertical displacement (d) between the prosthesisand bone. The fatigue history was documented in terms of the rel-ative displacement after each increment of cyclic loading over thelife of each specimen. Fatigue failure was defined when the relativedisplacement between the prosthesis and bone reached 0.5 mm.All of the cyclic displacement responses exhibited three regionsof loosening and a distinct component of steady-state loosening.Within this region, the displacement (d) was simply characterizedaccording to
d ¼ A � Nb ð1Þ
where A is the loosening coefficient, N the number of load cyclesand b is the loosening exponent. The quantities A and b were esti-mated from a least squares error power law regression of the exper-imental data.
Because the cyclic stress applied to each group of specimenswas a fraction (0.3) of the ultimate shear strength for that groupand not equivalent amongst the six groups, the corresponding fati-gue responses could not be compared directly. Therefore, a nor-malization was conducted according to
sa � log10ðNf ;normÞ ¼ saref � log10ðNf Þ ð2Þ
where s is the cyclic stress that was applied to the specimen and re-sulted in a measured fatigue life (Nf), sref is the maximum cyclicstress of interest that results in a normalized fatigue life Nf,norm
and a is introduced as a stress exponent to account for the rangeof cyclic stress induced by the shear load and the potential changein mechanisms of interface degradation.3 The exponent a was ob-tained from a pilot experiment by preparing a series of specimenswith Tool F, determining the fatigue life (at dmax = 0.5 mm) for a cyc-lic stress between 0.3 � sult 6 smax 6 0.5 � sult and estimating the va-lue of a that resulted in the minimum least squares error whenmodeling the response using Eq. (2). According to this approachthe normalized fatigue life for each surface preparation was esti-mated according to
Nf ;norm ¼ Nð ssrefÞ
13
f ð3Þ
Statistical comparisons of the metrics used in quantifying fati-gue performance were conducted using a one way analysis of var-iance when possible. Significant differences were identified whenp < 0.05.
After fatigue failure the specimens were examined using bothwhite light and Scanning Electron Microscopy (SEM) to interpretthe importance of the bone surface topography on the mechanismsof failure. These observations were combined with details obtainedfrom optical documentation of the bone/cement interface duringfatigue loading and qualities evident from DIC.
3 The stress exponent (a) is a constant that is introduced to account for the relativeinfluence of stress on the mechanisms of degradation involved in fatigue of the bone/cement interface. The response distribution for Tool F was used in determining thisexponent because it exhibited the largest strength in quasi-static and fatigue loading,and could be subjected to the largest range in cyclic stress.
3. Results
Results from monotonic loading of the model interface speci-mens distinguished that the ultimate shear strength (sult) rangedfrom 3.4 to nearly 21 MPa. In general, the shear strength increasedwith an increase of the bone surface roughness as evident from acomparison of the average values for specimens A through F in Ta-ble 1.
The displacement history of the model interface specimens sub-jected to cyclic loading exhibited three characteristic regions of re-sponse as evident for a selected specimen prepared with Tool E inFig. 4a. Region I was designated the initial migration region withtransition from Region I to Region II defined in terms of initialmigration amplitude (IMA) and corresponding fatigue cycles(NIMA). Region II exhibited steady-state loosening and generallyoccupied the majority of the fatigue life. That component of the fa-tigue response was characterized in terms of the power law modeldescribed by Eq. (1). The Region III component of response wascomprised of unstable loosening to failure. These three regions ofloosening were evident in most of the documented fatigue re-sponses regardless of the differences in method of surface prepara-tion and cyclic load. There was also consistency in the behavior ofspecimens within each group; the responses of all specimens pre-pared with Tool E are presented in Fig. 4c.

0
100
200
300
400
500
0 1 106
Dis
plac
emen
t, δ
(μm
)
Cycles, N
II
IMA
III I
NIMA
2 106 3 106 4 106 5 106 6 106
(a)
0
100
200
300
400
500
0 1 10
Prosthesis - BoneBone/CementProsthesis/CementCement Mantle
Dis
plac
emen
t, δ
(μm
)
Cycles, N
6 2 106 3 106 4 106 5 106 6 106
(b)
0
100
200
300
400
500
600
0 1 106 2 106 3 106 4 106 5 106 6 106 7 106
Spec-1Spec-2Spec-3
δ = 57.7 * e^(3.53e-07N) R= 0.92
Dis
plac
emen
t, δ
(μm
)
Fatigue Cycles, N
(c)
Fig. 4. An example displacement history resulting from the specimens preparedwith Tool E. (a) The displacement history exhibits three regions including RegionsI–III; the Initial Migration Amplitude (IMA) and corresponding number of fatiguecycles (NIMA) at the transition from Region I and Region II are defined as shown. (b)The total displacement between prosthesis and bone is displayed as well as therelative displacements at the bone–cement interface, prosthesis–cement interfacesand cement mantle; the displacement at the bone/cement interface comprised themajority and increased with a nearly identical trend as the total displacement. (c)All three fatigue responses from specimens prepared with Tool E. The plot describesthe average response and range.
1644 D.T. Yang et al. / International Journal of Fatigue 32 (2010) 1639–1649
An examination of the displacement profiles obtained from DIC(e.g. Fig. 3) showed that the total displacement between the pros-thesis and bone was comprised of three components, namely therelative displacement at the bone/cement and prosthesis/cementinterfaces, as well as deformation of the cement mantle. Thesethree components of displacement are shown for the looseninghistory from Fig. 4a in Fig. 4b. As evident in this figure, the relativedisplacement between the bone and cement comprised the major-ity of loosening, particularly in Regions II and III of the looseninghistory. In comparison, displacement at the prosthesis/cementinterface was negligible, generally equal to or <10 lm for all spec-imens. Similarly, the displacement resulting from deformation ofthe cement mantle ranged from approximately 10 to 70 lm andwas a limited portion of the total displacement beyond Region I.These observations indicated that loosening of the model interfacespecimens was primarily comprised of degradation of the bone/ce-ment interface.
The Region I response from cyclic loading was characterized interms of the initial migration amplitude (IMA) using the relativedisplacement between the prosthesis and bone (IMAP–B: i.e. the to-tal displacement), as well as the component of displacement be-tween the bone and cement (IMAB–C). Average results for the sixgroups of specimens are listed in Table 2. In general, the displace-ment responses reached a plateau (the definition of the IMA) andtransitioned to Region II behavior within 0.5 million cycles of load-ing. The IMAP–B ranged from 77 to 161 lm and specimens with thelowest roughness exhibited the highest IMA. For the specimensprepared with Tools C–F, the contribution of loosening across thebone/cement interface (IMAB–C) was less than half the total relativedisplacement (IMAP–B). In contrast, loosening at the bone/cementinterface dominated early displacement of the specimens withlowest canal roughness (Tool A and Tool B). Note that the speci-mens exhibiting the comparatively larger roughness (preparedwith Tools C–F) exhibited lower IMAB–C than those of the speci-mens with lower roughness (prepared with Tools A and B), despitebeing subjected to larger cyclic loads. Considering that the cyclicstress applied to the six groups of specimens were different, theIMAP–B was normalized by the cyclic stress (see IMAP–B(norm) in Ta-ble 2). Those specimens with larger roughness (prepared withTools C–F) exhibited significantly lower (p = 0.0009) normalizedIMA than those of the specimens with lower roughness (preparedwith Tools A and B).
The steady-state loosening parameters were evaluated in termsof displacement between the prosthesis and bone (P–B), and be-tween the bone and cement (B–C) (Table 3). Overall, the exponentsfor loosening (bP–B) ranged from 0.02 to 0.23. Those specimenswith larger canal roughness (prepared with Tools C–F) exhibiteda comparatively high loosening rate exponent (b P 0.20). In con-trast, the specimens with lower roughness (prepared with ToolsA and B) had significantly (p = 0.0005) lower loosening rates; the
Table 2Results for Region I behavior (initial migration) of the model interface specimens.
Surfacepreparation
NIMA
(�106 cycles)IMAP—B
(lm)IMAB—C
(lm)
IMAB�CIMAP—B
(%)
IMAP—BðnormÞ
(lm/MPa)
Tool A 0.76 161 (95) 149 (102) 92 158 (93)Tool B 0.10 94 (100) 80 (110) 85 72 (76)Tool C 0.41 91 (20) 40 (13) 44 18 (4)Tool D 0.37 111 (14) 37 (11) 33 20 (3)Tool E 0.37 77 (26) 33 (23) 42 19 (7)Tool F 0.25 93 (15) 44 (4) 47 15 (2)
Note: The numbers are presented in terms of the average and (standard deviation).IMAP–B(norm) is the normalized IMAP–B (i.e. the IMA is normalized by the magnitudeof cyclic shear stress).
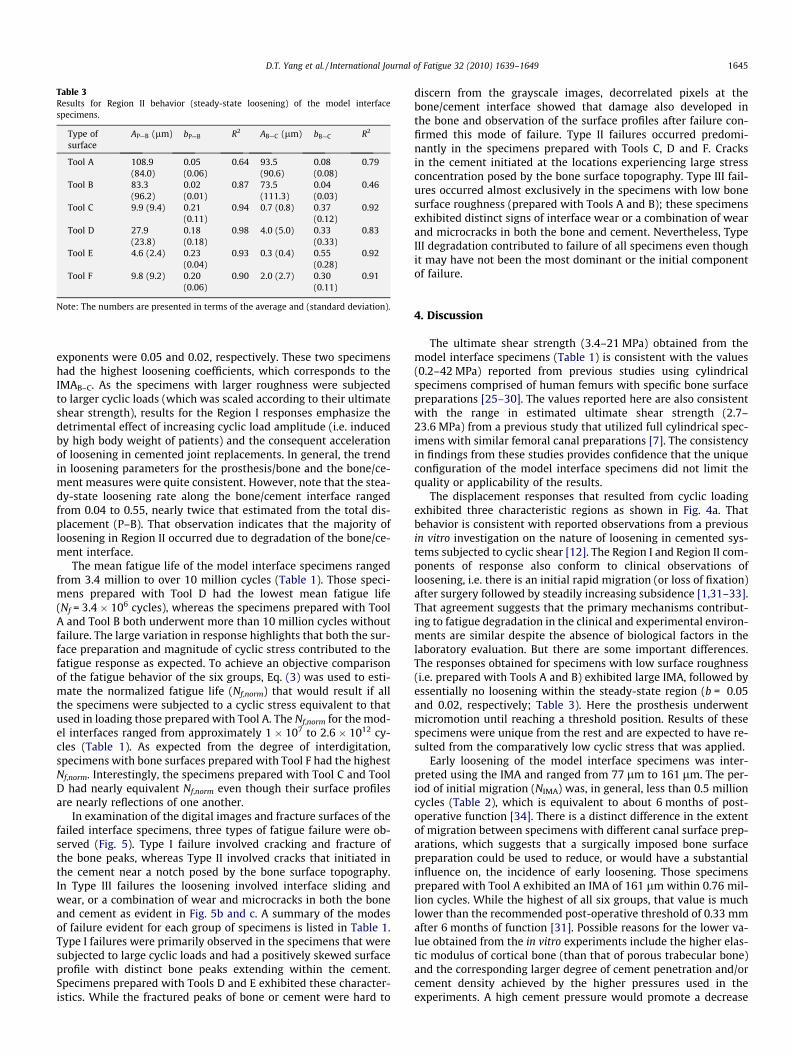
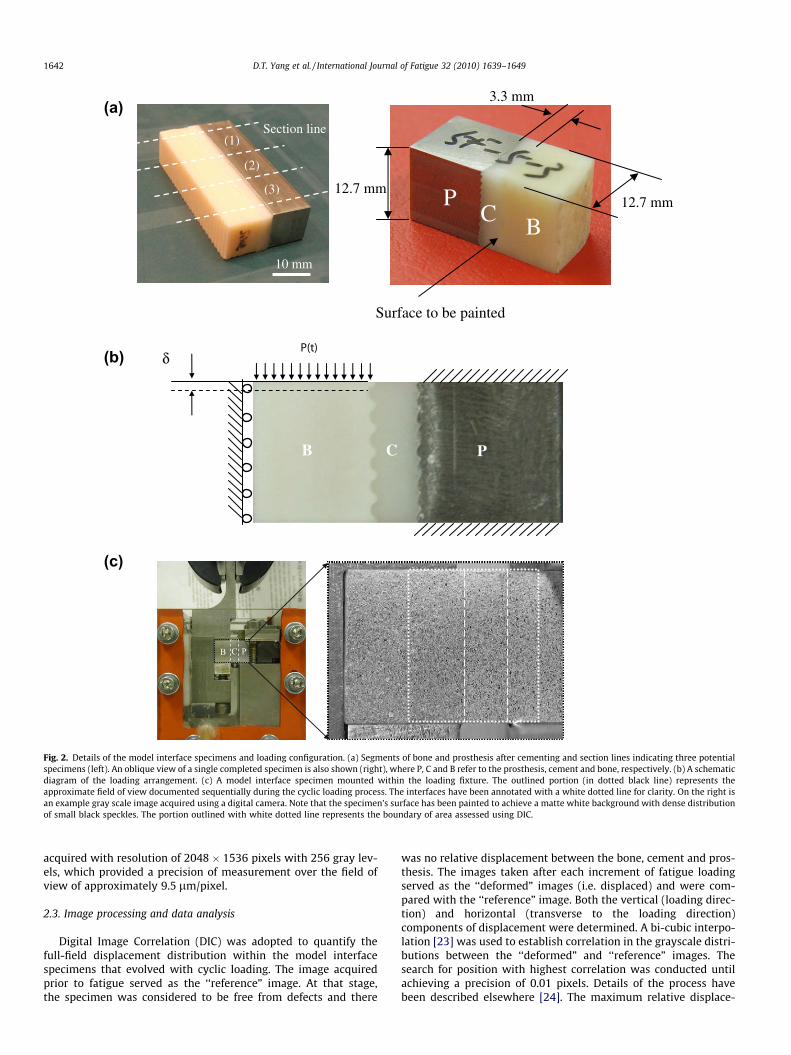
Table 3Results for Region II behavior (steady-state loosening) of the model interfacespecimens.
Type ofsurface
AP—B (lm) bP—B R2 AB—C (lm) bB—C R2
Tool A 108.9(84.0)
0.05(0.06)
0.64 93.5(90.6)
0.08(0.08)
0.79
Tool B 83.3(96.2)
0.02(0.01)
0.87 73.5(111.3)
0.04(0.03)
0.46
Tool C 9.9 (9.4) 0.21(0.11)
0.94 0.7 (0.8) 0.37(0.12)
0.92
Tool D 27.9(23.8)
0.18(0.18)
0.98 4.0 (5.0) 0.33(0.33)
0.83
Tool E 4.6 (2.4) 0.23(0.04)
0.93 0.3 (0.4) 0.55(0.28)
0.92
Tool F 9.8 (9.2) 0.20(0.06)
0.90 2.0 (2.7) 0.30(0.11)
0.91
Note: The numbers are presented in terms of the average and (standard deviation).
D.T. Yang et al. / International Journal of Fatigue 32 (2010) 1639–1649 1645
exponents were 0.05 and 0.02, respectively. These two specimenshad the highest loosening coefficients, which corresponds to theIMAB–C. As the specimens with larger roughness were subjectedto larger cyclic loads (which was scaled according to their ultimateshear strength), results for the Region I responses emphasize thedetrimental effect of increasing cyclic load amplitude (i.e. inducedby high body weight of patients) and the consequent accelerationof loosening in cemented joint replacements. In general, the trendin loosening parameters for the prosthesis/bone and the bone/ce-ment measures were quite consistent. However, note that the stea-dy-state loosening rate along the bone/cement interface rangedfrom 0.04 to 0.55, nearly twice that estimated from the total dis-placement (P–B). That observation indicates that the majority ofloosening in Region II occurred due to degradation of the bone/ce-ment interface.
The mean fatigue life of the model interface specimens rangedfrom 3.4 million to over 10 million cycles (Table 1). Those speci-mens prepared with Tool D had the lowest mean fatigue life(Nf = 3.4 � 106 cycles), whereas the specimens prepared with ToolA and Tool B both underwent more than 10 million cycles withoutfailure. The large variation in response highlights that both the sur-face preparation and magnitude of cyclic stress contributed to thefatigue response as expected. To achieve an objective comparisonof the fatigue behavior of the six groups, Eq. (3) was used to esti-mate the normalized fatigue life (Nf,norm) that would result if allthe specimens were subjected to a cyclic stress equivalent to thatused in loading those prepared with Tool A. The Nf,norm for the mod-el interfaces ranged from approximately 1 � 107 to 2.6 � 1012 cy-cles (Table 1). As expected from the degree of interdigitation,specimens with bone surfaces prepared with Tool F had the highestNf,norm. Interestingly, the specimens prepared with Tool C and ToolD had nearly equivalent Nf,norm even though their surface profilesare nearly reflections of one another.
In examination of the digital images and fracture surfaces of thefailed interface specimens, three types of fatigue failure were ob-served (Fig. 5). Type I failure involved cracking and fracture ofthe bone peaks, whereas Type II involved cracks that initiated inthe cement near a notch posed by the bone surface topography.In Type III failures the loosening involved interface sliding andwear, or a combination of wear and microcracks in both the boneand cement as evident in Fig. 5b and c. A summary of the modesof failure evident for each group of specimens is listed in Table 1.Type I failures were primarily observed in the specimens that weresubjected to large cyclic loads and had a positively skewed surfaceprofile with distinct bone peaks extending within the cement.Specimens prepared with Tools D and E exhibited these character-istics. While the fractured peaks of bone or cement were hard to
discern from the grayscale images, decorrelated pixels at thebone/cement interface showed that damage also developed inthe bone and observation of the surface profiles after failure con-firmed this mode of failure. Type II failures occurred predomi-nantly in the specimens prepared with Tools C, D and F. Cracksin the cement initiated at the locations experiencing large stressconcentration posed by the bone surface topography. Type III fail-ures occurred almost exclusively in the specimens with low bonesurface roughness (prepared with Tools A and B); these specimensexhibited distinct signs of interface wear or a combination of wearand microcracks in both the bone and cement. Nevertheless, TypeIII degradation contributed to failure of all specimens even thoughit may have not been the most dominant or the initial componentof failure.
4. Discussion
The ultimate shear strength (3.4–21 MPa) obtained from themodel interface specimens (Table 1) is consistent with the values(0.2–42 MPa) reported from previous studies using cylindricalspecimens comprised of human femurs with specific bone surfacepreparations [25–30]. The values reported here are also consistentwith the range in estimated ultimate shear strength (2.7–23.6 MPa) from a previous study that utilized full cylindrical spec-imens with similar femoral canal preparations [7]. The consistencyin findings from these studies provides confidence that the uniqueconfiguration of the model interface specimens did not limit thequality or applicability of the results.
The displacement responses that resulted from cyclic loadingexhibited three characteristic regions as shown in Fig. 4a. Thatbehavior is consistent with reported observations from a previousin vitro investigation on the nature of loosening in cemented sys-tems subjected to cyclic shear [12]. The Region I and Region II com-ponents of response also conform to clinical observations ofloosening, i.e. there is an initial rapid migration (or loss of fixation)after surgery followed by steadily increasing subsidence [1,31–33].That agreement suggests that the primary mechanisms contribut-ing to fatigue degradation in the clinical and experimental environ-ments are similar despite the absence of biological factors in thelaboratory evaluation. But there are some important differences.The responses obtained for specimens with low surface roughness(i.e. prepared with Tools A and B) exhibited large IMA, followed byessentially no loosening within the steady-state region (b = 0.05and 0.02, respectively; Table 3). Here the prosthesis underwentmicromotion until reaching a threshold position. Results of thesespecimens were unique from the rest and are expected to have re-sulted from the comparatively low cyclic stress that was applied.
Early loosening of the model interface specimens was inter-preted using the IMA and ranged from 77 lm to 161 lm. The per-iod of initial migration (NIMA) was, in general, less than 0.5 millioncycles (Table 2), which is equivalent to about 6 months of post-operative function [34]. There is a distinct difference in the extentof migration between specimens with different canal surface prep-arations, which suggests that a surgically imposed bone surfacepreparation could be used to reduce, or would have a substantialinfluence on, the incidence of early loosening. Those specimensprepared with Tool A exhibited an IMA of 161 lm within 0.76 mil-lion cycles. While the highest of all six groups, that value is muchlower than the recommended post-operative threshold of 0.33 mmafter 6 months of function [31]. Possible reasons for the lower va-lue obtained from the in vitro experiments include the higher elas-tic modulus of cortical bone (than that of porous trabecular bone)and the corresponding larger degree of cement penetration and/orcement density achieved by the higher pressures used in theexperiments. A high cement pressure would promote a decrease

Type I
Type II
B C P3 mm
Decorrelation
311 μm
μm89
Fractured bone
(a)
(b)
(c)
Fig. 5. Three type of failures occurred at the bone–cement interface and were observed using DIC and SEM. (a) An example grayscale image obtained using DIC for a specimenprepared with Tool D. Both Type I and Type II failure can be easily seen in the images presented in (b) and (c) The bone and cement surfaces of the specimen prepared withTool E were examined using SEM after fatigue loading. (b) Bone surface with magnified details. (c) Cement surface with magnified details.
1646 D.T. Yang et al. / International Journal of Fatigue 32 (2010) 1639–1649
in the extent of cement shrinkage with curing, thereby reducingthe development of tensile stress across the bone/cement interfaceand potential contribution to separation and accelerated loosening.But the most likely contribution to the comparatively low IMAfrom experiments is the absence of bone resorption and remodel-ing. A recent study [35] comparing the cement/bone interface fromretrieved cemented devices and specimens prepared in vitroshowed that the interface of retrieved devices was much morecompliant. They attributed the difference to bone remodeling anda consequent reduction in contact between the cement and bone.
Early migration of the prosthesis has been considered to be aprediction of long-term outcome in clinical assessments [31,36–
38]. As such, the overall fatigue life should correlate inverselywith the IMA. Indeed, the normalized fatigue life (Nf,norm) decreaseswith an increase of normalized initial migration amplitude(IMA(norm) = IMA/scyclic) as shown in Fig. 6. A similar relationshipwas found in a previous study [7] but that evaluation was limitedto less than 0.5 million cycles. Therefore, results from the presentstudy suggest that a cemented total joint replacement with im-plant that experiences a large IMA will exhibit a low fatigue life.
A total hip replacement that is implanted within a middle-agedpatient may be expected to support function through 40 years ofactivity. The apparent fatigue strength (sfatigue) for a bone/cementinterface with specific bone preparation can be estimated for a

106
107
108
109
1010
1011
1012
1013
1014
0 50 100 150 200 250 300
y = 1.3e+18 * x(-5.3) R2= 0.9 N
orm
aliz
ed L
ife, N
f, no
rm
IMAP-B(norm)
(µm/MPa)
Fig. 6. The relationship between normalized initial migration amplitude and thenormalized fatigue life of the bone–cement interface. Note that the IMA(norm) is theIMA normalized by the cyclic shear stress applied in the fatigue experiments(IMA/scyclic).
0
1
2
3
4
5
0 5 10 15 20 25
τfatigue
= 0.2τult
R2= 0.99
Fatig
ue S
treng
th, τ
fatig
ue (M
Pa)
Ultimate Shear Strength, τult
(MPa)
Fig. 7. The fatigue strength estimated for a fatigue life of 40 � 106 cycles is plottedas a function of ultimate shear strength of the bone–cement interface.
D.T. Yang et al. / International Journal of Fatigue 32 (2010) 1639–1649 1647
minimum life of 40 years (i.e. 40 � 106 cycles) using Eq. (2) withscyclic serving as the cyclic stress used in fatigue testing of the spec-imens and Nf the corresponding fatigue life of those specimens fora critical displacement of 0.5 mm. The estimated apparent fatiguestrength for all six groups of specimens ranged from 0.8 to4.4 MPa (Table 1). In general, the fatigue strength increases withthe average roughness (Ra) of bone, which agrees with the resultsof Raab et al. [39] concerning the influence of the prosthesis sur-face texture on loosening. Indeed, the specimens with canals pre-pared using Tool F had the highest Ra and exhibited the highestfatigue strength. The estimated maximum shear stress that devel-ops at the bone/cement interface in vivo is approximately 2 MPa[40]. Except for those specimens prepared with Tools A and B, esti-mates of the fatigue strength in Table 1 indicate that all groupswould achieve an equivalent fatigue life exceeding 40 years offunction. Results of this evaluation clearly demonstrated that thebone/cement interface fatigue strength can be improved throughsurface preparation of the bone. However, it is important to high-light that the estimated equivalent fatigue life was based on a nor-malization process (according to Eq. (3)) that involved the use of astress exponent to account for stress-dependent changes in themechanisms of fatigue. There may be differences in the actual fati-gue responses from those predicted through normalization, andadditional research is warranted to provide further understanding.But it is also important to emphasize that the bone/cement inter-face has been historically regarded as the outstanding weak-linkin fatigue of cemented joint replacements. A bone surface prepara-tion can substantially improve the interface fatigue resistance andfurther investigation should be performed to identify a simplepreparation resulting in a fatigue strength that exceeds the mini-mum for the most commonly defined targets of longevity.
Due to the time necessary to conduct fatigue tests there is con-siderable merit in predicting fatigue behavior of the bone/cementinterface from results of a quasi-static evaluation if there is a cor-relation in their responses. Results for the apparent fatiguestrength of the model interface specimens (Table 1) are plottedin terms of the ultimate shear strength of the specimens inFig. 7. Surprisingly, there is a remarkable correlation. The ratio ofsfatigue/sult of the bone/cement interfaces (0.20) agrees very wellwith a previous estimate that was based on short-term fatiguetests, where sfatigue=sult ¼ 0:24 [7]. According to results of the pres-ent study, the fatigue strength of the bone–cement interface withinterdigitation can be estimated from results of push-out tests
and sfatigue � 0.2 sult . That value may not be appropriate for inter-faces comprised of bone cement and trabecular bone due to differ-ences in properties of the porous bone. And as previously stated,this correlation is completely absent of the potential influence ofbone remodeling. Future studies should be performed to assessthe differences in fatigue strength associated with bone porosity,the corresponding degree of cement interdigitation achieved andthe changes in these characteristics with bone remodeling.
As with all studies there are recognized limitations to the inves-tigation. The estimated fatigue strength for the bone/cement inter-face of the prepared specimens (Table 1, Fig. 7) is a rathersimplistic estimate for 40 years of clinical function. Admittedly,these results may not be directly applicable to total hip replace-ments. Hip joints and the engineered replacements are both com-plicated systems and the longevity of clinical function depends onmany different factors. For example, biological factors (includingremodeling and other reactions associated with the developmentand presence of cement debris, etc.) are of tremendous importancebut were not considered in the present study. It is expected thatthe loosening rate (and fatigue life) will be different from what ispredicted in the present study due to these factors. The interfacialstrength and degree of subsidence undoubtedly varies with the ex-tent of remodeling and the rate of progression As evident here, ifremodeling reduces the extent of mechanical interlock over a sus-tained period of load-bearing function, the fatigue life will likely besacrificed. However, if the degree of mechanical interlock is not re-duced and remodeling serves to repair damage induced by fatigue,then the actual fatigue life may exceed the predictions presentedhere. Thus, there are a number of potential synergistic responsesbetween fatigue and remodeling of bone that are important to ce-mented devices. These are complex issues and well beyond thescope of the present study. Nevertheless, results of the investiga-tion do demonstrate the importance of mechanical interlock onthe fatigue response, which suggests that degree of remodelingand the rate may have an importance affect on both the looseninghistory and fatigue life of cemented devices.
Another important consideration is that the experiments wereconducted with dense cortical bone from young animals. Conse-quently, the results are not likely to be representative of the re-sponses for elderly patients suffering from osteoporosis. In theseinstances the fracture toughness of bone is significantly reduced[41,42] and would cause a substantial decrease in the integrity ofthe bone and it ability to resist fatigue degradation. These topicsare of high clinical relevance and require further evaluation. In

1648 D.T. Yang et al. / International Journal of Fatigue 32 (2010) 1639–1649
addition to the potential importance of remodeling and age-relatedbone fragility the interface was treated as a simplified system thatis subjected to shear loading only. Other components of loading(i.e. tension, compression) are expected to contribute to degrada-tion of the interface in vivo but were not considered here. The sim-plifications were recognized, but enabled the importance of bonesurface topography on durability of the bone/cement interface tobe identified in a clear manner. Overall, the results showed thatthe fatigue performance can be substantially improved throughthe use of a proper surgical preparation of bone.
5. Conclusions
An experimental study of the fatigue properties of the bone/ce-ment interface in cemented hip joint replacements was conductedunder pure shear loading. Model interface specimens were pre-pared in which the bone surface was textured to achieve differentdegrees of mechanical interlock. Loosening was characterizedusing Digital Image Correlation by the degree of relative displace-ment between the bone and prosthesis over the duration of cyclicloading. Based on the results from this study, the following conclu-sions were drawn:
(1) The average ultimate shear strength of the bone/cementinterface received from the model interface specimen ran-ged from 3.4 to nearly 21 MPa. In general, the shear strengthincreased with average roughness of the bone surface.
(2) The fatigue response of the model bone/cement interfacesexhibited three characteristic regions of loosening includingthe initiation of loosening (Region I), steady-state loosening(Region II) and unstable loosening to failure (Region III). Therelative presence of these three regions in the looseningresponse was largely dependent on the magnitude of cyclicloading and the bone surface topography.
(3) The normalized fatigue life (Nf,norm) of the model interfacesdecreased with an increase of normalized initial migrationamplitude (IMA(norm) = IMA/scyclic). These results suggestthat the amplitude of early migration of the prosthesis canbe used to infer the long-term clinical outcome.
(4) The apparent fatigue strength of the model interfaces corre-sponding to 40 million cycles (i.e. 40 years of function) ran-ged from 0.8 to 4.4 MPa. The ratio of the normalized fatiguestrength to the ultimate shear strength of the interfaces isapproximately 0.2.
(5) In general, the fatigue strength increased with magnitude ofaverage surface roughness as a result of the increase in inter-digitation of cement. A surgical preparation that increasesthe bone surface roughness and that degree of cement inter-digitation within bone contributed to the fatigue strength.
Acknowledgements
Support for this study was provided through a grant from theMaryland Chapter of the Arthritis Foundation. The authors grate-fully acknowledge Depuy Orthopaedic for providing bone cement.
References
[1] Alfaro-Adrian J, Gill HS, Murray DW. Cement migration after THR. Acomparison of Charnley Elite and Exeter femoral stems using RSA. J BoneJoint Surg 1999;81B:130–4.
[2] Mohler CG, Callaghan JJ, Collis DK, Johnston RC. Early loosening of the femoralcomponent at the cement–prosthesis interface after total hip replacement. JBone Joint Surg 1995;77A:1315–22.
[3] Sullivan PM, MacKenzie JR, Callaghan JJ, Johnston RC. Total hip arthroplastywith cement in patients who are less than fifty years old: a sixteen to twenty-two-year follow-up study. J Bone Joint Surg 1994;76A:863–9.
[4] Sundfeldt M, Carlsson LV, Johansson CB, Thomsen P, Gretzer C. Asepticloosening, not only a question of wear: a review of different theories. ActaOrthop 2006;77:177–97.
[5] Kim D-G, Miller MA, Mann KA. Creep dominates tensile fatigue damage of thecement–bone interface. J Orthop Res 2004;22:633–40.
[6] Kim D-G, Miller MA, Mann KA. A fatigue damage model for the cement–boneinterface. J Biomech 2004;37:1505–12.
[7] Arola D, Stoffel KA, Yang DT. Fatigue of the cement/bone interface: the surfacetexture of bone and loosening. J Biomed Mater Res: Appl Biomater2006;76B:287–97.
[8] Arola D, Yang DT, Stoffel KA. The apparent volume of interdigitation: a newparameter for evaluating the influence of surface topography on mechanicalinterlock. J Biomed Mater Res 2001;58:519–24.
[9] Janssen D, Mann KA, Verdonschot N. Micro-mechanical modeling of thecement–bone interface: the effect of friction, morphology and materialproperties on the micromechanical response. J Biomech 2008;41:3158–63.
[10] Stoffel KA, Yang DT, Arola D. The influence of surface topography on weardebris generation at the cement/bone interface under cyclic loading. J MaterSci: Mater Med 2008;19:1935–43.
[11] Mann KA, Miller MA, Cleary RJ, Janssen D, Verdonschot N. Experimentalmicromechanics of the cement–bone interface. J Orthop Res 2008;26:872–9.
[12] Mann KA, Miller MA, Race A, Verdonschot N. Shear fatigue micromechanics ofthe cement–bone interface: an in vitro study using digital image correlationtechniques. J Orthop Res 2009;27:340–6.
[13] Guo XE. Mechanical properties of cortical bone and cancellous bone tissue. In:Cowin SC, editor. Bone mechanicals handbook. Boca Raton (FL): CRC Press;2001. ISBN/ISSN:0849391172.
[14] Currey JD. Bones: structure and mechanics. 2nd ed. Princeton, NewJersey: Princeton University Press; 2006.
[15] Kwak BM, Lim OK, Kim YY, Rim K. An investigation of the effect of cementthickness on an implant by finite element stress analysis. Int Orthop1979;2:315–9.
[16] Huiskes R. The various stress pattern of press-fit, ingrown, and cementedfemoral stems. Clin Orthop Relat Res 1990;261:27–38.
[17] Ebramzadeh E, Sarmiento A, McKellop HA, Llinas A, Gogan W. The cementmantle in total hip arthroplasty. J Bone Joint Surg 1994;76A:77–87.
[18] Ramaniraka NA, Rakotomanana LR, Leyvraz P-F. The fixation of the cementedfemoral component: effects of stem stiffness, cement thickness and roughnessof the cement–bone surface. J Bone Joint Surg 2000;82B:297–303.
[19] Gustafson MB, Martin RB, Gibson V, Storms DH, Stover SM, Gibeling J, Griffin L.Calcium buffering is required to maintain bone stiffness in saline solution. JBiomech 1996;29:1191–4.
[20] Choi K, Goldstein SA. A comparison of the fatigue behavior of humantrabecular and cortical bone tissue. J Biomech 1992;25:1371–81.
[21] McCormack BAO, Prendergast PJ, Gallagher DG. An experimental study ofdamage accumulation in cemented hip prostheses. Clin Biomech1996;11:214–9.
[22] Zioupos P, Currey JD, Casinos A. Tensile fatigue in bone: are cycles-, or time tofailure, or both important? J Theor Biol 2001;210:389–99.
[23] Schreier HW, Braasch JR, Sutton MA. Systematic errors in digital imagecorrelation caused by intensity interpolation. Opt Eng 2000;39:2915–21.
[24] Zhang D, Arola DD. Application of digital image correlation to biologicaltissues. J Biomed Opt 2004;9:691–9.
[25] Halawa M, Lee AJC, Ling RSM, Vangala SS. The shear strength of trabecularbone from the femur, and some factors affecting the shear strength of thecement–bone interface. Arch Orthop Trauma Surg 1978;92:19–30.
[26] Krause WR, Krug WK, Miller J. Strength of the cement–bone interface. ClinOrthop Relat Res 1982;163:290–9.
[27] Dohmae Y, Bechtold JE, Sherman RE, Puno RM, Gustilo RB. Reduction incement–bone interface shear strength between primary and revisionarthroplasty. Clin Orthop Relat Res 1988;236:214–20.
[28] MacDonald W, Swarts E, Beaver R. Penetration and shear strength of cement–bone interfaces in vivo. Clin Orthop Relat Res 1993;286:283–8.
[29] Majkowski RS, Miles AW, Bannister GC, Perkins J, Taylor GJ. Bone surfacepreparation in cemented joint replacement. J Bone Joint Surg1993;75B:459–63.
[30] Mann KA, Allen MJ, Ayers DC. Pre-yield and post-yield shear behavior of thecement–bone interface. J Orthop Res 1998;16:370–8.
[31] Kärrholm J, Borssen B, Lowenhielm G, Snorrason F. Does early micromotion offemoral stem prostheses matter? 4–7-year stereoradiographic follow-up of 84cemented prostheses. J Bone Joint Surg 1994;76B:912–7.
[32] Kiss J, Murray DW, Turner-Smith AR, Bithell J, Bulstrode CJ. Migration ofcemented femoral components after THR—Roentgen stereophotogrammetricanalysis. J Bone Joint Surg 1996;78B:796–801.
[33] Ornstein E, Franzen H, Johnsson R, Sundberg M. Radiostereometric analysis inhip revision surgery–optimal time for index examination: 6 patients revisedwith impacted allograft and cement followed weekly for 6 weeks. Acta OrthopScand 2000;71:360–4.
[34] Davies JP, Harris WH. Strength of cement–metal interfaces in fatigue:comparison of smooth, porous and precoated specimens. Clin Mater1993;12:121–6.
[35] Miller MA, Eberhardt AW, Cleary RJ, Verdonschot N, Mann KA.Micromechanics of postmortem-retrieved cement–bone interfaces. J OrthopRes 2010;28:170–7.

D.T. Yang et al. / International Journal of Fatigue 32 (2010) 1639–1649 1649
[36] Freeman MA, Plante-Bordeneuve P. Early migration and late aseptic failure ofproximal femoral prostheses. J Bone Joint Surg 1994;76B:432–8.
[37] Walker PS, Mai SF, Cobb AG, Bentley G, Hua J. Prediction of clinical outcome ofTHR from migration measurements on standard radiographs—a study ofcemented Charnley and Stanmore femoral stems. J Bone Joint Surg1995;77B:705–14.
[38] Krismer M, Biedermann R, Stöckl B, Fischer M, Bauer R, Haid C. The predictionof failure of the stem in THR by measurement of early migration using EBRA-FCA. Einzel-Bild-Roentgen-Analyse-femoral component analysis. J Bone JointSurg 1999;81B:273–80.
[39] Raab S, Ahmed AM, Provan JW. The quasistatic and fatigue performance of theimplant/bone–cement interface. J Biomed Mater Res 1981;15:159–82.
[40] Brown TD, Pedersen DR, Radin EL, Rose RM. Global mechanical consequence ofreduced cement/bone coupling rigidity in proximal femoral arthroplasty: athree-dimensional finite element analysis. J Biomech 1988;21:115–29.
[41] Nalla RK, Kruzic JJ, Kinney JH, Ritchie RO. Effect of aging on the toughness ofhuman cortical bone: evaluation by R-curves. Bone 2004;35:1240–6.
[42] George WT, Vashishth D. Susceptibility of aging human bone to mixed-modefracture increases bone fragility. Bone 2006;38:105–11.