Embed Size (px)
Citation preview

Yearbook of World Electronics Data 2016
Computers Communications Consumer Control & Instrumentation Medical Industrial Office Equipment Semiconductors Passive Components Other Components
The Yearbook of World Electronics Data 2016 An Overview of Global Electronics Production & Markets
2
The Yearbook of World Electronics Data 2016 – An Overview of Global
Electronics Production & Markets
Output for the global electronics industry is forecast to reach US$1,861 billion in 2015 and compares to
US$1,047 billion thirty years earlier. Over the period the dynamics of the industry has changed. Production has
migrated from high cost to low cost locations and China has emerged as the focal point for electronics equipment
production for high volume products in the computing, consumer and communications, or the 3C segment of the
market.
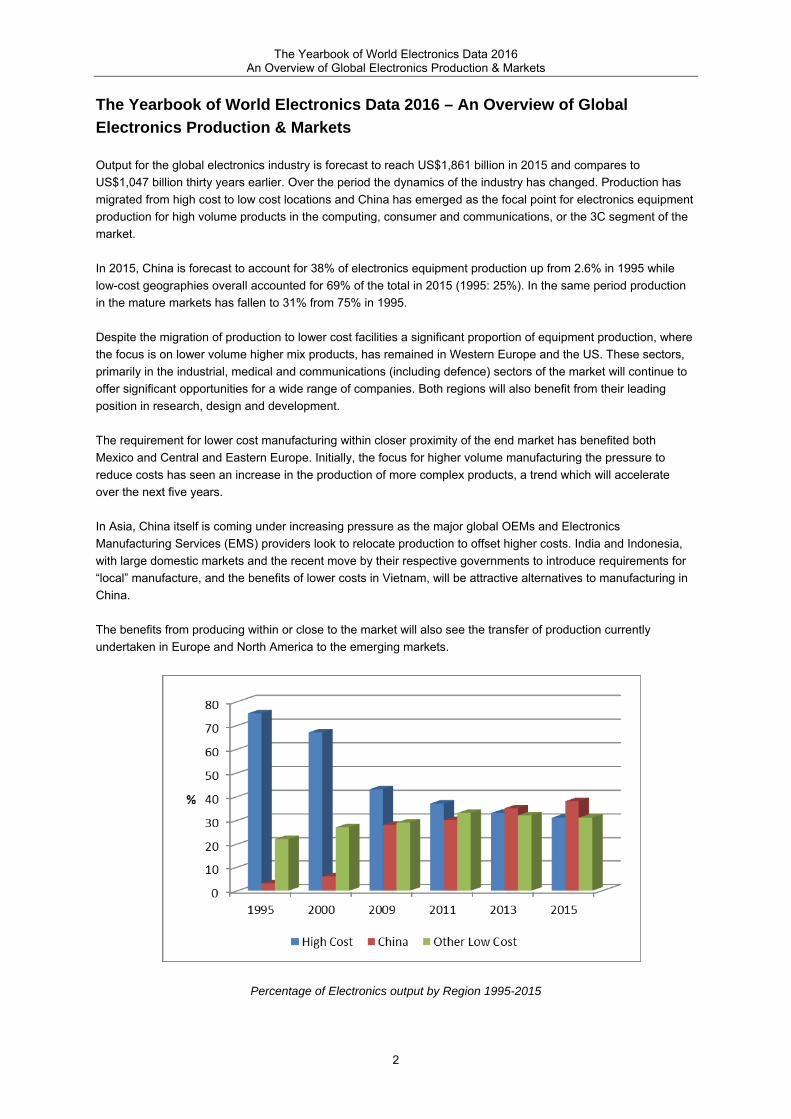
In 2015, China is forecast to account for 38% of electronics equipment production up from 2.6% in 1995 while
low-cost geographies overall accounted for 69% of the total in 2015 (1995: 25%). In the same period production
in the mature markets has fallen to 31% from 75% in 1995.
Despite the migration of production to lower cost facilities a significant proportion of equipment production, where
the focus is on lower volume higher mix products, has remained in Western Europe and the US. These sectors,
primarily in the industrial, medical and communications (including defence) sectors of the market will continue to
offer significant opportunities for a wide range of companies. Both regions will also benefit from their leading
position in research, design and development.
The requirement for lower cost manufacturing within closer proximity of the end market has benefited both
Mexico and Central and Eastern Europe. Initially, the focus for higher volume manufacturing the pressure to
reduce costs has seen an increase in the production of more complex products, a trend which will accelerate
over the next five years.
In Asia, China itself is coming under increasing pressure as the major global OEMs and Electronics
Manufacturing Services (EMS) providers look to relocate production to offset higher costs. India and Indonesia,
with large domestic markets and the recent move by their respective governments to introduce requirements for
“local” manufacture, and the benefits of lower costs in Vietnam, will be attractive alternatives to manufacturing in
China.
The benefits from producing within or close to the market will also see the transfer of production currently
undertaken in Europe and North America to the emerging markets.
Percentage of Electronics output by Region 1995-2015

The Yearbook of World Electronics Data 2016 An Overview of Global Electronics Production & Markets
3
The Yearbook of World Electronics Data – tracking developments in the global electronics industry
With a history spanning over 40 years Reed Electronics Research (RER) has provided an invaluable insight into
the global trends, regional variations and the underlying state of the global electronics market for all stages of the
supply chain - OEM, contract manufacturing and design, components and materials suppliers to financial
/industry analysts and government and academia.
Although encompassing a range of published and bespoke products the core of RER’s research programme is
one of the most comprehensive statistical databases covering the global electronics industry, with the resulting
analysis being published through four concise and clear demographic volumes, as a series of individual country
reports, through customised solutions to meet specific client requirements and, from 2012, as a series of Excel
databases providing the combination of both historical and forecasted data.
In 2016, the Yearbook of World Electronics Production will be published in three volumes which will enable us to
update all the countries on an annual basis. The Volume 1 will continue to cover Western Europe will be
published in February. This will be followed in the spring of 2015 by the next edition of the America, Japan & Asia
Pacific volume which will include data on China, Mexico and Vietnam in addition to the present 16 country
coverage. The final volume will include the countries covered in the current volume plus the addition of Turkey.
The World Summary, which will continue to track the minor countries currently published in the Volume 3, will
also be published in this edition and will be published in August 2016.
The Yearbook of World Electronics Data
The Yearbook of World Electronics Data series presents market and production statistics for the GLOBAL
electronics industry. Available in thee published volumes covering 53 countries and 13 major product groups, the
yearbook is used in the formulation of business and market planning, in tracking trends based on an clear
understanding on how the industry has developed historically and to provide a basis for medium and long-term
forecasting.
53 country coverage, 13 major product groups
… comparable country by country and product by product.
Methodology
The Yearbooks highlight market trends and opportunities and offer corroborative evidence for individual research.
Each new edition is fully revised and updated. Trade statistics are analyzed in detail, with over 500 separate
categories being employed. Production statistics are collected from Government and Manufacturer's Association
sources where these are available. Extensive use is also made of research reports, company reports, news items
and work by other consultants to supplement and cross check the official and semi-official sources.
Markets are forecast in real terms for the next five years, with production forecast for the next two years, using
constant exchange rates and excluding inflation. These are based on our extensive knowledge of the historical
performance of each product, the general economic outlook and the major growth influencing factors.
Who will benefit
The Yearbook is essential research providing key data for all areas of the electronics industry including:
Distributors and manufacturers of electronic components and materials.
Suppliers of electronic production equipment.
OEMs.
EMS Providers.
Government, including investment organizations.
Financial and industry analysts.
Academic institutes & universities tracking developments in the electronics industry.
The Yearbook of World Electronics Data 2016 An Overview of Global Electronics Production & Markets
4
2016 Series
Volume 1 201 6 West Europe
Synopsis: Economic Overview; Electronics Market Overview; Imports 2013-2014; Exports 2013-2014; Production
Data 2013-2016; Market Data 2013-2019
16 country coverage
Austria; Belgium; Denmark; Finland; France; Germany; Greece; Ireland; Italy; Netherlands; Norway; Portugal;
Spain; Sweden; Switzerland; UK
Publication Data: March 2015
Volume 2 2016 America, Japan, Asia Pacific
Synopsis: Economic Overview; Electronics Market Overview; Imports 2013-2014; Exports 2013-2014; Production
Data 2013-2016; Market Data 2013-2019
19 country coverage
Australia; Brazil; Canada; China, Hong Kong; India; Indonesia; Israel; Japan; Malaysia; Mexico, Philippines;
Singapore; South Africa; South Korea; Taiwan Thailand; Vietnam, USA
Publication Data: June 2016
Volume 3 2016 East Europe & World Summary
Synopsis: Economic Overview; Structure of the Industry; Imports 2013-2014; Exports 2013-2014; Production
Data 2013-2016; Market Data 2013-2019
53 Country World Summary covering production data 2013-2016 and market data for 2013-2019
13 country coverage
Bulgaria; Croatia; Czech Republic; Estonia; Hungary; Lithuania; Poland; Romania; Russia; Slovakia; Slovenia;
Turkey, Ukraine
Publication Data: August 2016
For each country production and market data is supplied for the following product groups:
Computers
Consumer – Video; Audio; Personal
Control & Instrumentation
Medical & Industrial
Office Equipment
Radio Communications
Telecommunications
Components – Passive Components; Semiconductors; Other Components
Related Products & Services
With a history spanning over 40 years Reed Electronics Research (RER) has provided an invaluable insight into
the global trends, regional variations and the underlying state of the global electronics industry for all stages of
the supply chain - OEM, contract manufacturing and design, components and materials suppliers to financial
/industry analysts and government and academia.
Although encompassing a range of published and bespoke products the core of RER’s research programme is
one of the most comprehensive statistical databases covering the global electronics industry. In addition to the
Yearbook, the data can be supplied as a series of individual country reports, through customised solutions to
The Yearbook of World Electronics Data 2016 An Overview of Global Electronics Production & Markets
5
meet specific client requirements and as a series of Excel databases providing the combination of both historical
and forecasted data.
European Electronics Production 2000-2019
As part of its programme of research covering developments in the European electronics industry RER has
released a new statistical database providing a medium term outlook for electronics production in Europe.
Covering the period 2000-2019 the research allows you to track developments both geographically and by major
product group.
The database is provided as an Excel spreadsheet providing production data for 13 product groups and 29
countries split by Western Europe and Central and Eastern Europe. In addition, a PDF document provides a
European overview as well as allowing the user to quickly reference data for individual countries.
Global Electronics Production & Markets
Launched in 2012, Global Electronics Production & Markets provides top line analysis on the global electronics
industry for the period 1995 to 2019 for markets and 1995-2016 for production. Through two Excel databases
(Pivot Tables) you can quickly analyse the structure of the global industry and how it has changed both
geographically, through RER’s unique coverage of 53 countries, and by thirteen major product groups. The
database will be fully updated in August 2016.
Country Reports
Drawing on data from its core statistical database RER provides a quick, reliable and cost-effective assessment
of the electronics industry for an individual country. For a full listing please visit www.rer.co.uk
Custom Research
Building on the flexibility of the two databases and the Yearbook series we can quickly search data by product or
country/region to provide solutions tailored to your specific needs or budgets. Ideal for input into internal
presentations/ documents the data is supplied via email.
European Electronic Markets Forecast
Market data is only one part of the equation when analyzing the European electronics industry. Updated monthly,
European Electronic Markets Forecast (EEMF) enables you to track with minimum time and cost, the key issues
and opportunities impacting the European electronics industry. From originally researched articles to the latest
company developments and market analysis EEMF is your virtual “Research Analyst” utilizing over 30 years of
industry and market research experience to provide you both in hardcopy and electronic formats not only reliable
but objective analysis and news on the European and global electronics industry.
Summary of Contents
Market Analysis: Up-to-the-minute analysis of the key sectors of the European and Global electronics industry
Industry News: The latest industry and company news split by:
Finance
Mergers & Acquisitions
Automotive
Distribution
Electronic Manufacturing Services/PCB
Production
Semiconductors
Renewable Energy/CleanTech
The Yearbook of World Electronics Data 2016 An Overview of Global Electronics Production & Markets
6
Asia Pacific Electronics: Highlighting the growing importance of Asia on the global electronics industry, EEMF
provides a monthly summary of key developments within the region.
For additional information on the above publications or Reed Electronics Research’s complete range of
research products please contact or visit www.rer.co.uk
Andrew Fletcher, Research Manager
Reed Electronics Research
Harvard House
Grove Technology Park
Wantage, Oxon OX12 9FF
United Kingdom
Tel: +44 (0) 1235 227310
Fax: +44 (0) 1235 420515
website: www.rer.co.uk

The Yearbook of World Electronics Data 2016 An Overview of Global Electronics Production & Markets
7
SAMPLE DATA
Over the following pages we provide sample data from the 2015 Yearbook series. This includes data from all
three reports.
The Yearbook of World Electronics Data 2016 An Overview of Global Electronics Production & Markets
8
SUMMARY OF WORLD PRODUCTION 2012
$M $M $M $M $M $M $M $M $M
Country Office Control Medical
& Radio
Comms Telecomm- Compo-
Computing Equip & Instr Industrial & Radar* unications Consumer nents TOTAL
Australia 1186 36 1082 392 1289 876 53 472 5386
Austria 397 1 1032 926 269 386 10 1868 4890
Belgium 891 - 774 441 335 179 11 1053 3684
Brazil 22282 255 1761 364 6415 1160 2990 2397 37624
Bulgaria 110 20 145 56 80 20 118 199 748
Canada 2200 51 2320 1235 4050 225 37 563 10681
China 279000 4270 9500 7350 115000 35500 51715 101150 603485
Croatia 38 3 67 50 50 55 - 73 336
Czech 6900 20 560 190 900 280 2965 1750 13565
Denmark 147 0 1036 928 150 126 125 629 3141
Egypt 33 2 9 12 72 31 144 42 346
Estonia 80 1 160 47 1120 622 - 89 2119
Finland 195 - 808 677 819 609 - 592 3700
France 1701 55 3768 2024 11103 1714 329 7462 28157
Germany 6192 195 23213 7258 4033 2571 1372 17512 62345
Greece 141 6 54 18 222 96 3 42 581
Hong Kong 187 29 50 168 174 129 421 560 1717
Hungary 3195 90 2260 271 3710 700 2997 1745 14968
India 2082 97 1827 581 8271 1617 3086 1663 19224
Indonesia 1850 65 170 250 700 310 4051 3870 11266
Ireland 2109 15 731 1700 256 224 106 3010 8153
Israel 1670 13 1470 1620 1475 1450 31 2518 10247
Italy 724 12 3695 1753 3205 1301 122 5182 15994
Japan 26763 1004 12597 8080 22773 6775 11029 81255 170276
Lithuania 25 7 110 49 70 20 33 74 388
Malaysia 13161 184 3526 531 1806 1742 6427 31627 59004
Mexico 18150 65 2000 987 6500 2100 17567 4607 51976
Netherlands 1455 128 2551 2812 532 295 73 1421 9267
N Zealand 270 6 208 67 173 81 7 163 975
Norway 139 - 825 160 514 184 - 143 1964
Philippines 4250 21 250 73 630 65 264 6626 12179
Poland 2370 50 550 235 790 775 5087 562 10419
Portugal 410 - 115 121 167 90 1077 653 2632
Puerto Rico 680 3 200 295 100 70 11 324 1683
Romania 535 9 330 165 400 460 207 200 2306
Russia 1200 90 550 410 375 300 1921 690 5536
Saudi Arabia 200 3 208 144 112 104 6 79 855
Singapore 12760 180 3520 716 4400 586 400 35611 58173
Slovakia 670 6 110 150 190 145 4614 1050 6935
Slovenia 50 2 180 52 165 110 19 222 800
South Africa 365 7 146 102 243 328 198 146 1536
South Korea 14025 235 600 2250 21570 950 3635 58869 102134
Spain 462 6 333 558 667 564 132 963 3685
Sweden 119 - 1757 353 3097 2935 44 1040 9346
Switzerland 457 16 4330 2172 463 323 5606 2036 15404
Taiwan 4040 12 402 4498 8182 808 2012 44800 64756
Thailand 13168 54 481 228 897 1346 4492 8178 28844
Turkey 1882 20 120 360 500 220 2299 268 5669
UK 1497 95 5537 2952 7992 616 124 4525 23338
Ukraine 170 9 150 78 280 170 24 160 1041
USA 31900 2250 40320 29012 71380 6041 731 55878 237512
Venezuela 280 12 70 54 250 60 19 98 843
Vietnam 3600 30 110 250 9900 600 948 2456 17894
TOTAL 488365 9742 138679 86223 328817 79045 139692 499163 1769726
The Yearbook of World Electronics Data 2016 An Overview of Global Electronics Production & Markets
9
SUMMARY OF EAST EUROPE PRODUCTION 2012 Table 3.4.1
$M $M $M $M $M $M $M $M $M
Country Office Control Medical & Radio
Comms Telecomm- Compo-
EDP Equip & Instr Industrial & Radar* unications Consumer nents TOTAL
Bulgaria 110 20 145 56 80 20 118 199 748
Croatia 38 3 67 50 50 55 - 73 336
Czech 6900 20 560 190 900 280 2965 1750 13565
Estonia 80 1 160 47 1120 622 - 89 2119
Hungary 3195 90 2260 271 3710 700 2997 1745 14968
Lithuania 25 7 110 49 70 20 33 74 388
Poland 2370 50 550 235 790 775 5087 562 10419
Romania 535 9 330 165 400 460 207 200 2306
Russia 1200 90 550 410 375 300 1921 690 5536
Slovakia 670 6 110 150 190 145 4614 1050 6935
Slovenia 50 2 180 52 165 110 19 222 800
Ukraine 170 9 150 78 280 170 24 160 1041
TOTAL 15343 307 5172 1753 8130 3657 17985 6814 59161
SUMMARY OF EAST EUROPE MARKETS 2012 Table 3.5.1
$M $M $M $M $M $M $M $M $M
Country Office Control Medical & Radio
Comms Telecomm- Compo-
EDP Equip & Instr Industrial & Radar* unications Consumer nents TOTAL
Bulgaria 366 9 125 96 312 142 288 1033 2371
Croatia 328 15 96 82 251 129 163 119 1183
Czech 2027 73 1028 315 847 251 781 4837 10159
Estonia 197 3 103 68 105 45 72 835 1428
Hungary 2401 43 407 354 670 328 669 5591 10463
Lithuania 186 14 88 50 180 77 152 184 931
Poland 3875 134 1228 479 2164 1292 1617 3453 14242
Romania 1116 34 465 246 1138 636 419 1768 5822
Russia 8797 184 2552 2811 5919 2090 2973 2351 27677
Slovakia 934 17 491 227 552 241 349 2545 5356
Slovenia 333 13 166 57 317 119 135 283 1423
Ukraine 482 31 335 346 837 324 260 1369 3984
TOTAL 21042 570 7084 5131 13292 5674 7878 24368 85039
The Yearbook of World Electronics Data 2016 An Overview of Global Electronics Production & Markets
10
4.3 Czech Republic 4.3.1 Economic Outlook
GDP posted a strong recovery in 2014 with growth of 2.0%, a marked improvement on the
contraction of 0.7% in the previous year. The rebound in investment was particularly strong,
although falling inventories weighed slightly on growth. Although export growth was buoyant,
import growth was even greater and net exports had a slightly negative impact on real GDP
growth. Confidence indicators have remained robust in the opening months of 2015,
suggesting continued strength in domestic demand. Real GDP is expected to grow by 2.5%
and 2.6% in 2015 and 2016, respectively.
Investment has played a major role in the rebound in the Czech economy. Investment rose by
4.5% in 2014 and compared to a contraction of 4.4% in 2013. There was a particularly strong
pick up in public investment, as the government made a renewed effort to co-finance projects
before the expiry of EU funds. Investment is expected to continue fuelling growth in 2015 but
is forecast to ease in 2016.
HCIP inflation averaged 0.4% in 2014, less than the 2013 rate despite the intervention by the
Czech National Bank in November 2013 to further ease the monetary policy stance via a
weakening of the CZK exchange rate. The substantial decline in oil and other commodity
prices since mid-2014 is forecast to weigh on inflation in 2015 which is expected to ease to
0.2% in 2015 before rising again to 1.4% in 2016.
The renewed strength of the Czech economy has led to improved labour market conditions,
with unemployment falling to 5.8% in the final quarter of 2014. A projected further decline in
the unemployment rate is expected to contribute to tighter labour market conditions over the
forecast period.
GDP Growth 2010-2016 Czech Republic’s Leading Economic Indicators
Actual Forecast
% Increase 2010 2011 2012 2013 2014 2015 2016
Growth of GDP 2.5 2.0 -0.8 -0.7 2.0 2.5 2.5
Source: EU Economic Forecast, Spring 2015
The Yearbook of World Electronics Data 2016 An Overview of Global Electronics Production & Markets
11
4.3.2 Electronics Industry Overview
Overview
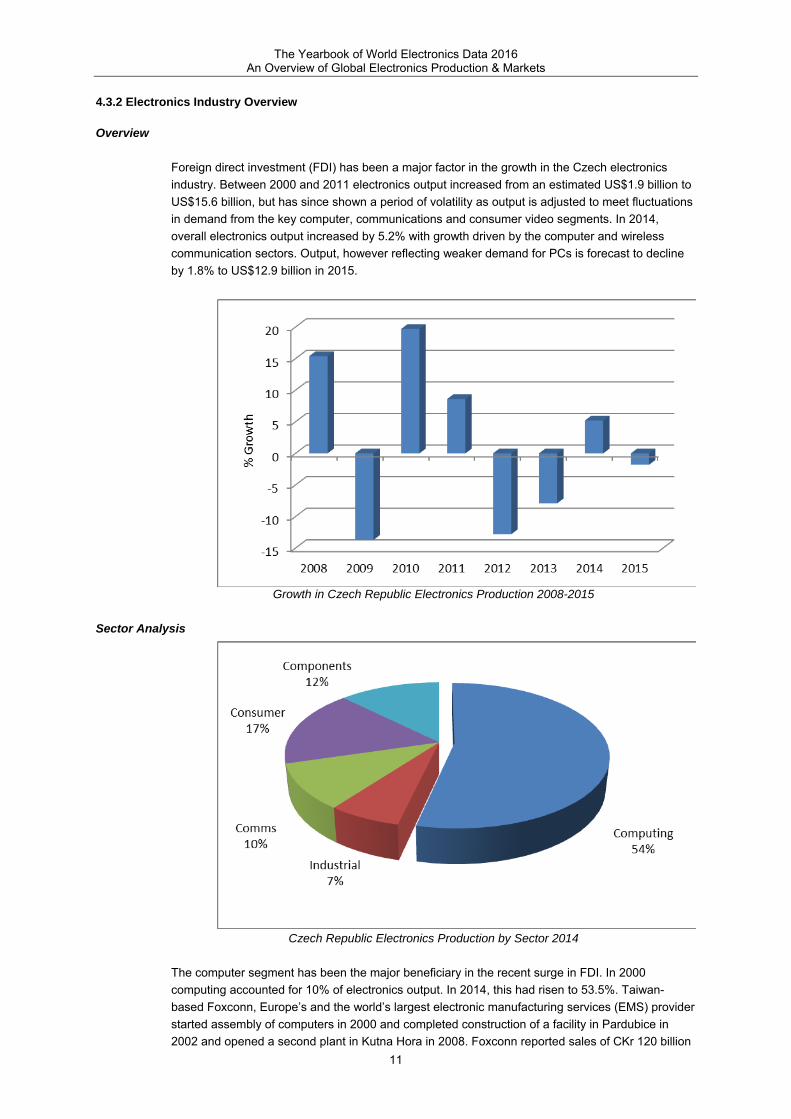
Foreign direct investment (FDI) has been a major factor in the growth in the Czech electronics
industry. Between 2000 and 2011 electronics output increased from an estimated US$1.9 billion to
US$15.6 billion, but has since shown a period of volatility as output is adjusted to meet fluctuations
in demand from the key computer, communications and consumer video segments. In 2014,
overall electronics output increased by 5.2% with growth driven by the computer and wireless
communication sectors. Output, however reflecting weaker demand for PCs is forecast to decline
by 1.8% to US$12.9 billion in 2015.
Growth in Czech Republic Electronics Production 2008-2015
Sector Analysis
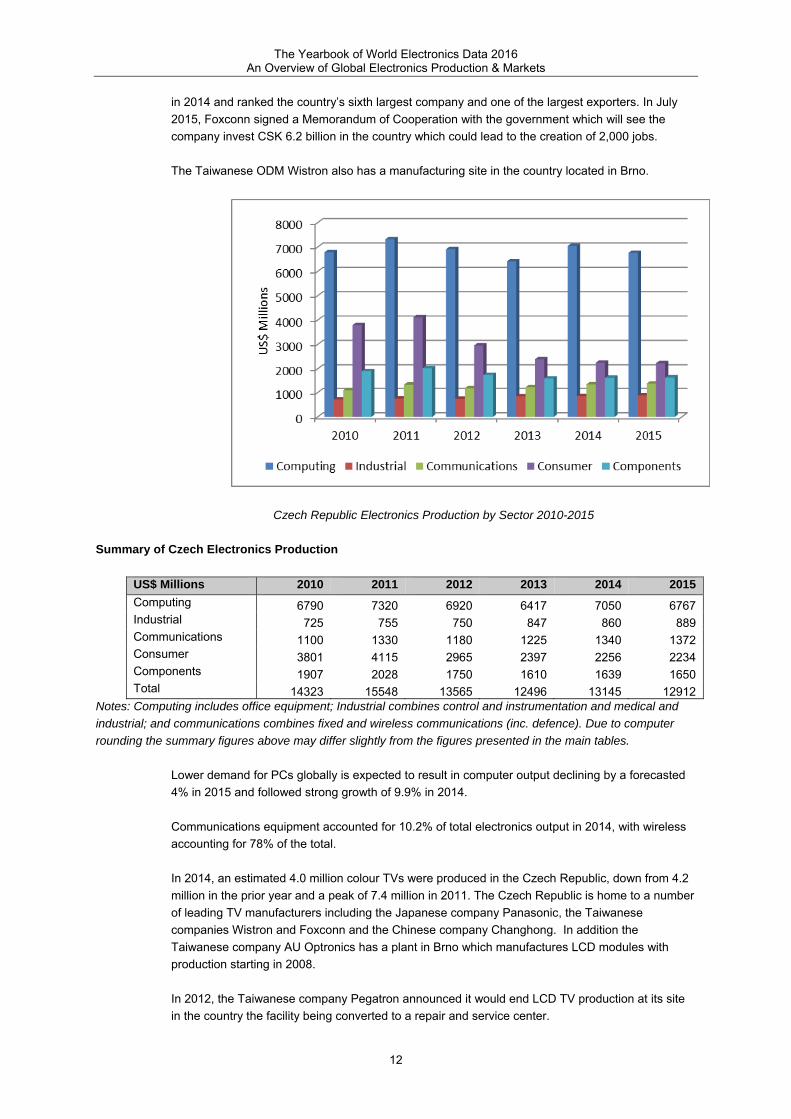
Czech Republic Electronics Production by Sector 2014
The computer segment has been the major beneficiary in the recent surge in FDI. In 2000
computing accounted for 10% of electronics output. In 2014, this had risen to 53.5%. Taiwan-
based Foxconn, Europe’s and the world’s largest electronic manufacturing services (EMS) provider
started assembly of computers in 2000 and completed construction of a facility in Pardubice in
2002 and opened a second plant in Kutna Hora in 2008. Foxconn reported sales of CKr 120 billion
The Yearbook of World Electronics Data 2016 An Overview of Global Electronics Production & Markets
12
in 2014 and ranked the country’s sixth largest company and one of the largest exporters. In July
2015, Foxconn signed a Memorandum of Cooperation with the government which will see the
company invest CSK 6.2 billion in the country which could lead to the creation of 2,000 jobs.
The Taiwanese ODM Wistron also has a manufacturing site in the country located in Brno.
Czech Republic Electronics Production by Sector 2010-2015
Summary of Czech Electronics Production
US$ Millions 2010 2011 2012 2013 2014 2015
Computing 6790 7320 6920 6417 7050 6767 Industrial 725 755 750 847 860 889 Communications 1100 1330 1180 1225 1340 1372 Consumer 3801 4115 2965 2397 2256 2234 Components 1907 2028 1750 1610 1639 1650 Total 14323 15548 13565 12496 13145 12912
Notes: Computing includes office equipment; Industrial combines control and instrumentation and medical and
industrial; and communications combines fixed and wireless communications (inc. defence). Due to computer
rounding the summary figures above may differ slightly from the figures presented in the main tables.
Lower demand for PCs globally is expected to result in computer output declining by a forecasted
4% in 2015 and followed strong growth of 9.9% in 2014.
Communications equipment accounted for 10.2% of total electronics output in 2014, with wireless
accounting for 78% of the total.
In 2014, an estimated 4.0 million colour TVs were produced in the Czech Republic, down from 4.2
million in the prior year and a peak of 7.4 million in 2011. The Czech Republic is home to a number
of leading TV manufacturers including the Japanese company Panasonic, the Taiwanese
companies Wistron and Foxconn and the Chinese company Changhong. In addition the
Taiwanese company AU Optronics has a plant in Brno which manufactures LCD modules with
production starting in 2008.
In 2012, the Taiwanese company Pegatron announced it would end LCD TV production at its site
in the country the facility being converted to a repair and service center.
The Yearbook of World Electronics Data 2016 An Overview of Global Electronics Production & Markets
13
In 2014, Panasonic transferred the production of high-end BD players, BD recorders as well as the
production of PCBs for TV sets from a plant in Slovakia to the Panasonic AVC Networks site in
Plzeň, the Czech Republic.
Production of digital audio equipment has also increased. Panasonic, through its subsidiary
Panasonic Automotive Systems Europe in Pardubice is a major producer of car audio equipment
the company transferring production from Germany to the site. The Danish company Bang &
Olufsen opened a new production facility in the industrial zone of Kopřivnice in 2005.
There are a number of indigenous and foreign manufacturers of electronic components in the
Czech Republic. In 2014, electronics components accounted to 12.5% of output.
Leading foreign manufacturers include:
AVX Czech Republic, a subsidiary of the US company AVX, started production of tantalum
capacitors in Lanškroun in 1993. Fellow US group Vishay Intertechnology has also moved
production of capacitors and resistors to the Czech Republic and operates multiple plants in the
country.
US-based ON Semiconductor has a production facility in Roznov the plant benefiting from the
company’s decision to relocate production to the site from France and the US. ON Semiconductor
also operates a design center in Brno. In 2012, ON Semiconductor announced it had expanded its
operations in Roznov, Czech Republic with the opening of a new 4,000 sq m state-of-the-art R&D
facility.
In March 2010, the Swiss industrial group ABB acquired the semiconductor business of the Czech
company Polovodiče a.s. The additional production capacity for high-power semiconductors will
help ABB to cope with the expected rising demand fueled by growth in renewable energy and
efforts to improve energy efficiency.
The Japanese company Kyocera has a major solar plant in Kadan with the company completing
construction of a new production hall in 2011.
In addition to Foxconn other leading EMS providers with manufacturing facilities in the Czech
Republic include Connect Systems (Belgium), Integrated Microelectronics Inc (IMI) (Philippines),
and the world’s number two Flextronics. IMI entered the Czech Republic in 2011 following the
acquisition of the Belgian EMS provider EPIQ’s plant in Tresmona.
Outlook
The Czech electronics industry is focused on the 3C markets of computing, communications and
consumer electronics with a small number of foreign multinationals holding a significant share of
electronics output. With production export orientated it will be strongly influenced by developments
both in Europe and globally which will lead to marked fluctuations in output.
Over the medium-term manufacturers will face increased pressure to lower costs which could
result in a further reduction in output as manufactures look to lower cost locations in Asia.
On the positive side, the country is expected to benefit from inward investment by companies in the
industrial sector as they look to move production from higher cost West European locations or in
the case of non-European companies look to establish a low-cost manufacturing base to serve the
European market.
The Yearbook of World Electronics Data 2016 An Overview of Global Electronics Production & Markets
14
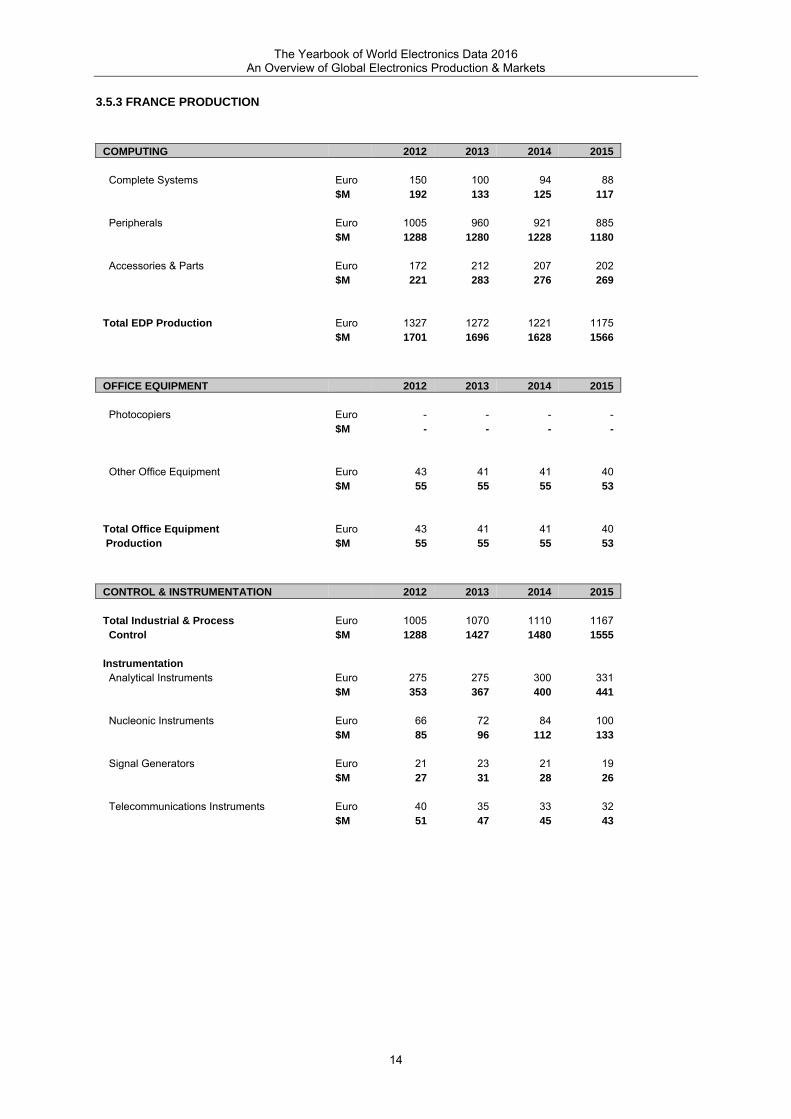
3.5.3 FRANCE PRODUCTION
COMPUTING 2012 2013 2014 2015 Complete Systems Euro 150 100 94 88 $M 192 133 125 117 Peripherals Euro 1005 960 921 885 $M 1288 1280 1228 1180 Accessories & Parts Euro 172 212 207 202 $M 221 283 276 269 Total EDP Production Euro 1327 1272 1221 1175 $M 1701 1696 1628 1566
OFFICE EQUIPMENT 2012 2013 2014 2015 Photocopiers Euro - - - - $M - - - - Other Office Equipment Euro 43 41 41 40 $M 55 55 55 53 Total Office Equipment Euro 43 41 41 40 Production $M 55 55 55 53
CONTROL & INSTRUMENTATION 2012 2013 2014 2015 Total Industrial & Process Euro 1005 1070 1110 1167 Control $M 1288 1427 1480 1555 Instrumentation Analytical Instruments Euro 275 275 300 331 $M 353 367 400 441 Nucleonic Instruments Euro 66 72 84 100 $M 85 96 112 133 Signal Generators Euro 21 23 21 19 $M 27 31 28 26 Telecommunications Instruments Euro 40 35 33 32 $M 51 47 45 43
The Yearbook of World Electronics Data 2016 An Overview of Global Electronics Production & Markets
15
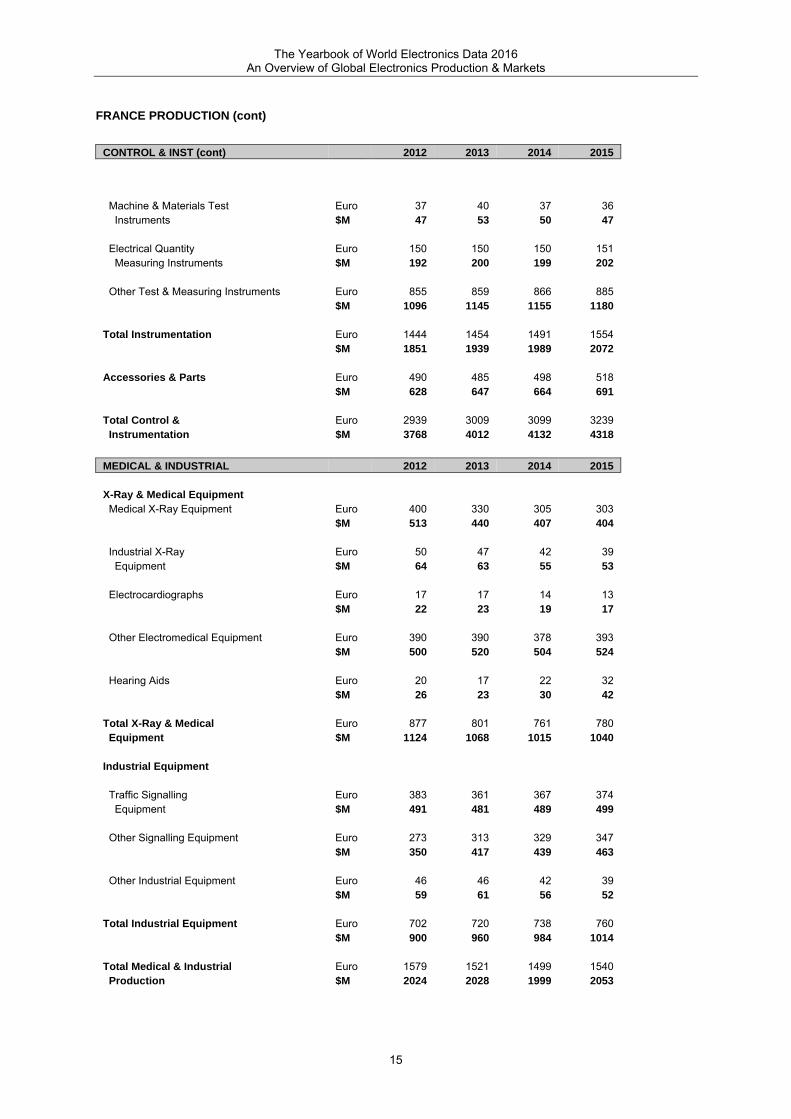
FRANCE PRODUCTION (cont)
CONTROL & INST (cont) 2012 2013 2014 2015
Machine & Materials Test Euro 37 40 37 36 Instruments $M 47 53 50 47 Electrical Quantity Euro 150 150 150 151 Measuring Instruments $M 192 200 199 202 Other Test & Measuring Instruments Euro 855 859 866 885 $M 1096 1145 1155 1180 Total Instrumentation Euro 1444 1454 1491 1554 $M 1851 1939 1989 2072 Accessories & Parts Euro 490 485 498 518 $M 628 647 664 691 Total Control & Euro 2939 3009 3099 3239 Instrumentation $M 3768 4012 4132 4318
MEDICAL & INDUSTRIAL 2012 2013 2014 2015 X-Ray & Medical Equipment Medical X-Ray Equipment Euro 400 330 305 303 $M 513 440 407 404 Industrial X-Ray Euro 50 47 42 39 Equipment $M 64 63 55 53 Electrocardiographs Euro 17 17 14 13 $M 22 23 19 17 Other Electromedical Equipment Euro 390 390 378 393 $M 500 520 504 524 Hearing Aids Euro 20 17 22 32 $M 26 23 30 42 Total X-Ray & Medical Euro 877 801 761 780 Equipment $M 1124 1068 1015 1040 Industrial Equipment Traffic Signalling Euro 383 361 367 374 Equipment $M 491 481 489 499 Other Signalling Equipment Euro 273 313 329 347 $M 350 417 439 463 Other Industrial Equipment Euro 46 46 42 39 $M 59 61 56 52 Total Industrial Equipment Euro 702 720 738 760 $M 900 960 984 1014 Total Medical & Industrial Euro 1579 1521 1499 1540 Production $M 2024 2028 1999 2053

The Yearbook of World Electronics Data 2016 An Overview of Global Electronics Production & Markets
16
FRANCE PRODUCTION (cont)
COMMUNICATIONS & RADAR 2012 2013 2014 2015 Radar, Nav Aids & Other Euro 4775 4950 5100 5508 Equipment incl military $M 6122 6600 6800 7344 Radio Comms incl Mobile Phones, Euro 3885 3740 3329 3107 Public Broadcasting & Parts $M 4981 4987 4439 4142 Total Communications & Euro 8660 8690 8429 8615 Radar Production $M 11103 11587 11239 11486
TELECOMMUNICATIONS 2012 2013 2014 2015 Facsimile Machines Euro 2 1 1 1 $M 3 1 1 1 Telephone Sets Euro 185 170 163 159 $M 237 227 218 212 Other Telecoms Equipment Euro 1150 1200 1179 1171 $M 1474 1600 1573 1561 Total Telecommunications Euro 1337 1371 1344 1330 Production $M 1714 1828 1791 1774
CONSUMER 2012 2013 2014 2015 Video Equipment Colour Television Euro - - - - $M - - - - No.th - - - - Video Cameras Euro 3 3 3 3 $M 4 4 4 4 No.th 25 25 25 26 Video Tuners & Satellite Euro 15 10 7 5 Receivers $M 19 13 9 7 Total Video Equipment Euro 18 13 10 8 $M 23 17 13 11
The Yearbook of World Electronics Data 2016 An Overview of Global Electronics Production & Markets
17
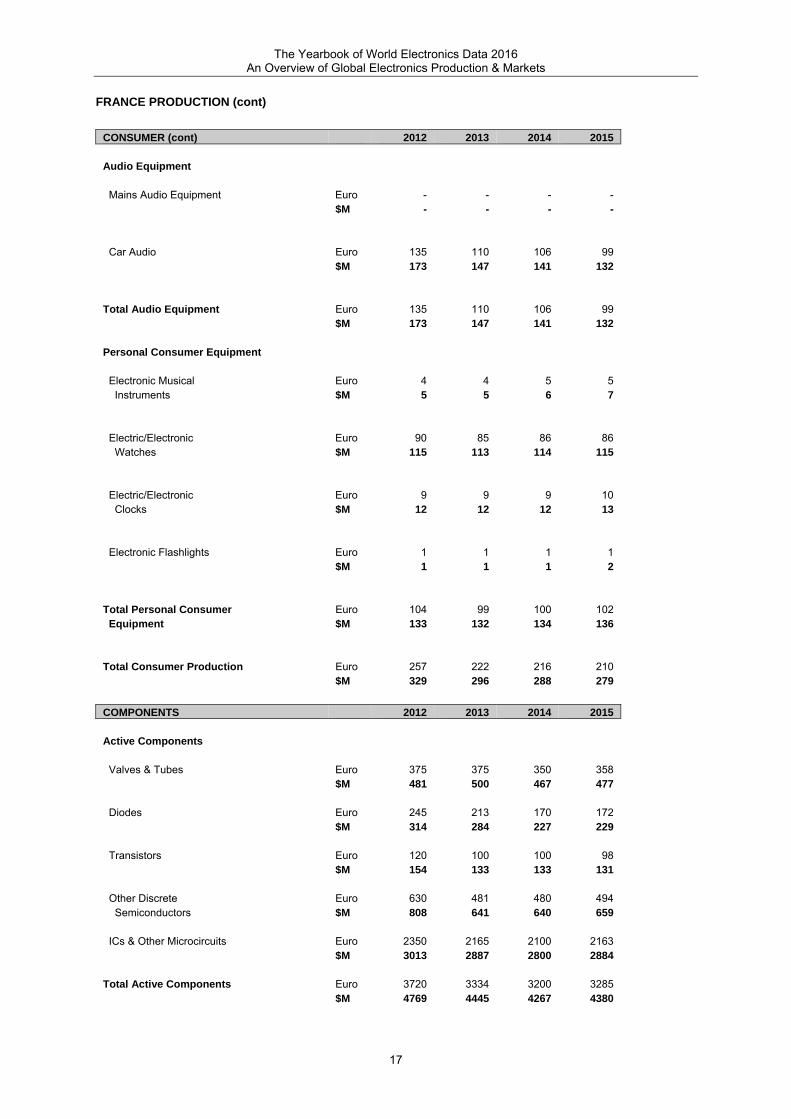
FRANCE PRODUCTION (cont)
CONSUMER (cont) 2012 2013 2014 2015 Audio Equipment Mains Audio Equipment Euro - - - - $M - - - - Car Audio Euro 135 110 106 99 $M 173 147 141 132 Total Audio Equipment Euro 135 110 106 99 $M 173 147 141 132 Personal Consumer Equipment Electronic Musical Euro 4 4 5 5 Instruments $M 5 5 6 7 Electric/Electronic Euro 90 85 86 86 Watches $M 115 113 114 115 Electric/Electronic Euro 9 9 9 10 Clocks $M 12 12 12 13 Electronic Flashlights Euro 1 1 1 1 $M 1 1 1 2 Total Personal Consumer Euro 104 99 100 102 Equipment $M 133 132 134 136 Total Consumer Production Euro 257 222 216 210 $M 329 296 288 279
COMPONENTS 2012 2013 2014 2015 Active Components Valves & Tubes Euro 375 375 350 358 $M 481 500 467 477 Diodes Euro 245 213 170 172 $M 314 284 227 229 Transistors Euro 120 100 100 98 $M 154 133 133 131 Other Discrete Euro 630 481 480 494 Semiconductors $M 808 641 640 659 ICs & Other Microcircuits Euro 2350 2165 2100 2163 $M 3013 2887 2800 2884 Total Active Components Euro 3720 3334 3200 3285 $M 4769 4445 4267 4380
The Yearbook of World Electronics Data 2016 An Overview of Global Electronics Production & Markets
18
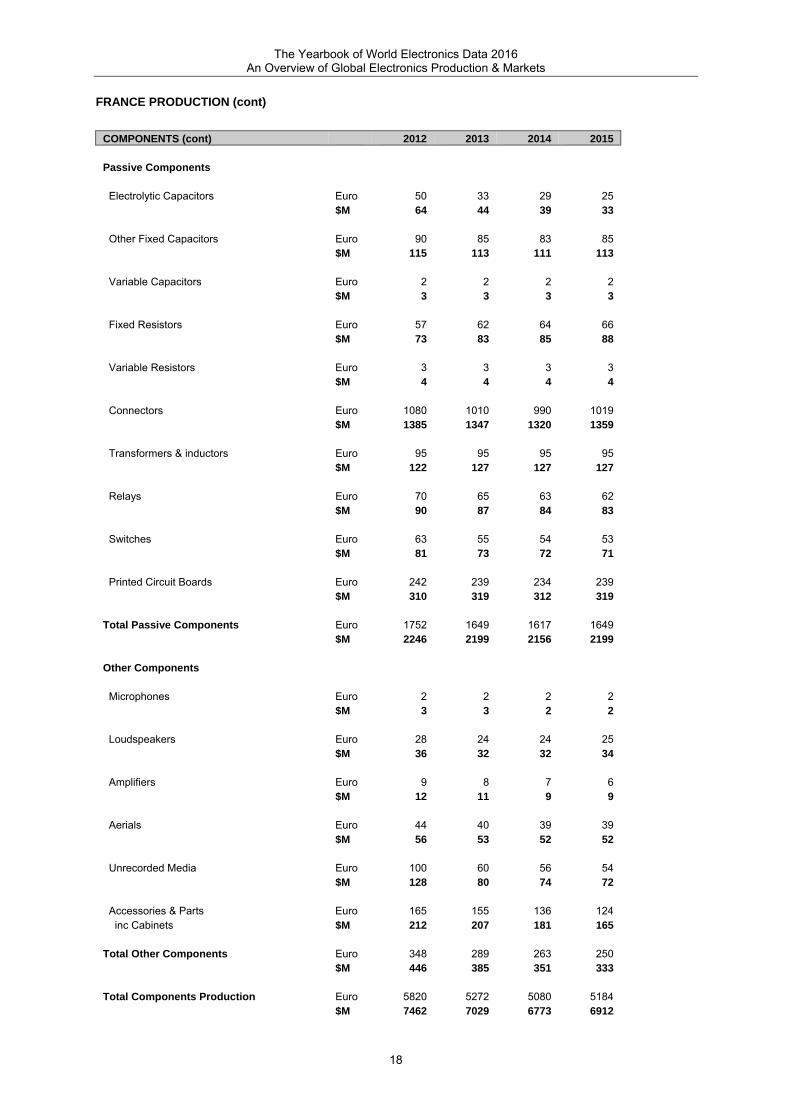
FRANCE PRODUCTION (cont)
COMPONENTS (cont) 2012 2013 2014 2015 Passive Components Electrolytic Capacitors Euro 50 33 29 25 $M 64 44 39 33 Other Fixed Capacitors Euro 90 85 83 85 $M 115 113 111 113 Variable Capacitors Euro 2 2 2 2 $M 3 3 3 3 Fixed Resistors Euro 57 62 64 66 $M 73 83 85 88 Variable Resistors Euro 3 3 3 3 $M 4 4 4 4 Connectors Euro 1080 1010 990 1019 $M 1385 1347 1320 1359 Transformers & inductors Euro 95 95 95 95 $M 122 127 127 127 Relays Euro 70 65 63 62 $M 90 87 84 83 Switches Euro 63 55 54 53 $M 81 73 72 71 Printed Circuit Boards Euro 242 239 234 239 $M 310 319 312 319 Total Passive Components Euro 1752 1649 1617 1649 $M 2246 2199 2156 2199 Other Components Microphones Euro 2 2 2 2 $M 3 3 2 2 Loudspeakers Euro 28 24 24 25 $M 36 32 32 34 Amplifiers Euro 9 8 7 6 $M 12 11 9 9 Aerials Euro 44 40 39 39 $M 56 53 52 52 Unrecorded Media Euro 100 60 56 54 $M 128 80 74 72 Accessories & Parts Euro 165 155 136 124 inc Cabinets $M 212 207 181 165 Total Other Components Euro 348 289 263 250 $M 446 385 351 333 Total Components Production Euro 5820 5272 5080 5184 $M 7462 7029 6773 6912

The Yearbook of World Electronics Data 2016 An Overview of Global Electronics Production & Markets
19
FRANCE PRODUCTION (cont)
TOTAL PRODUCTION - FRANCE 2012 2013 2014 2015 TOTAL PRODUCTION Euro 21962 21398 20930 21332 $M 28157 28531 27906 28442
Notes: 2012 and 2013 are current figures at current exchange rates. 2014 and 2015 are forecasts at 2014 constant values and
exchange rates (i.e. inflation is not included). Base year 2013
The Yearbook of World Electronics Data 2016 An Overview of Global Electronics Production & Markets
20
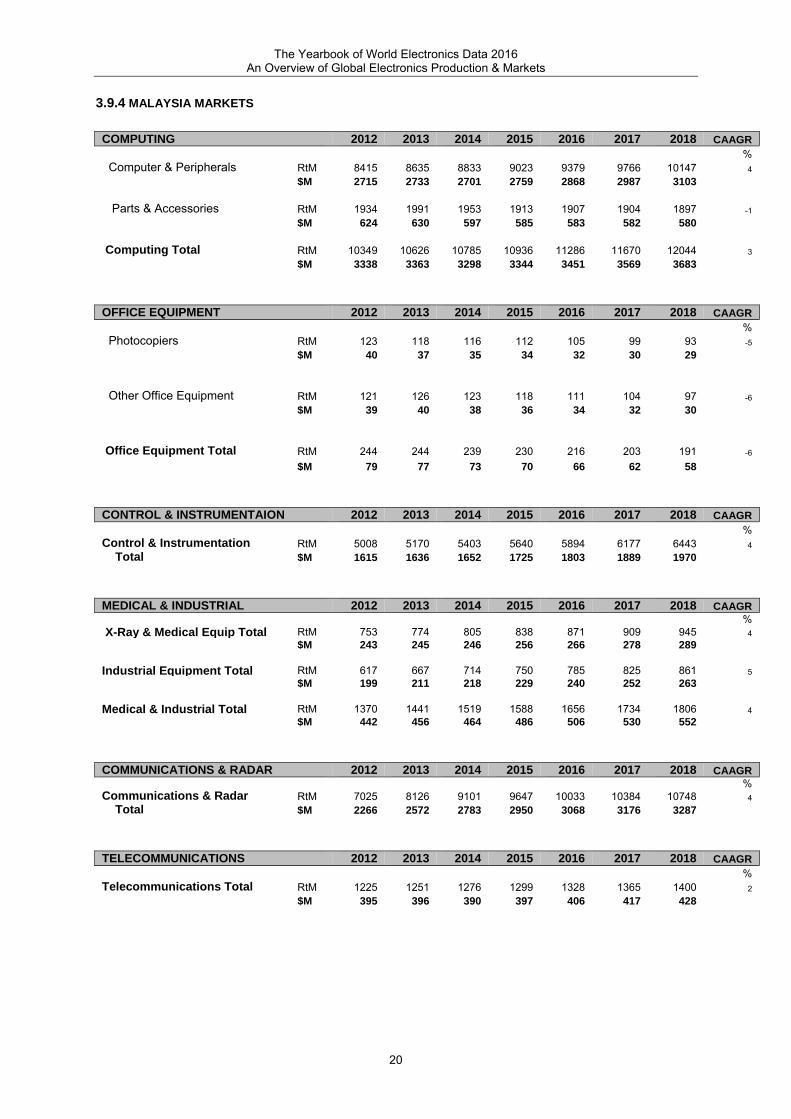
3.9.4 MALAYSIA MARKETS
COMPUTING 2012 2013 2014 2015 2016 2017 2018 CAAGR % Computer & Peripherals RtM 8415 8635 8833 9023 9379 9766 10147 4
$M 2715 2733 2701 2759 2868 2987 3103
Parts & Accessories RtM 1934 1991 1953 1913 1907 1904 1897 -1
$M 624 630 597 585 583 582 580
Computing Total RtM 10349 10626 10785 10936 11286 11670 12044 3
$M 3338 3363 3298 3344 3451 3569 3683
OFFICE EQUIPMENT 2012 2013 2014 2015 2016 2017 2018 CAAGR % Photocopiers RtM 123 118 116 112 105 99 93 -5
$M 40 37 35 34 32 30 29
Other Office Equipment RtM 121 126 123 118 111 104 97 -6
$M 39 40 38 36 34 32 30
Office Equipment Total RtM 244 244 239 230 216 203 191 -6
$M 79 77 73 70 66 62 58
CONTROL & INSTRUMENTAION 2012 2013 2014 2015 2016 2017 2018 CAAGR % Control & Instrumentation RtM 5008 5170 5403 5640 5894 6177 6443 4
Total $M 1615 1636 1652 1725 1803 1889 1970
MEDICAL & INDUSTRIAL 2012 2013 2014 2015 2016 2017 2018 CAAGR %
X-Ray & Medical Equip Total RtM 753 774 805 838 871 909 945 4
$M 243 245 246 256 266 278 289
Industrial Equipment Total RtM 617 667 714 750 785 825 861 5
$M 199 211 218 229 240 252 263
Medical & Industrial Total RtM 1370 1441 1519 1588 1656 1734 1806 4
$M 442 456 464 486 506 530 552
COMMUNICATIONS & RADAR 2012 2013 2014 2015 2016 2017 2018 CAAGR %Communications & Radar RtM 7025 8126 9101 9647 10033 10384 10748 4
Total $M 2266 2572 2783 2950 3068 3176 3287
TELECOMMUNICATIONS 2012 2013 2014 2015 2016 2017 2018 CAAGR % Telecommunications Total RtM 1225 1251 1276 1299 1328 1365 1400 2
$M 395 396 390 397 406 417 428
The Yearbook of World Electronics Data 2016 An Overview of Global Electronics Production & Markets
21
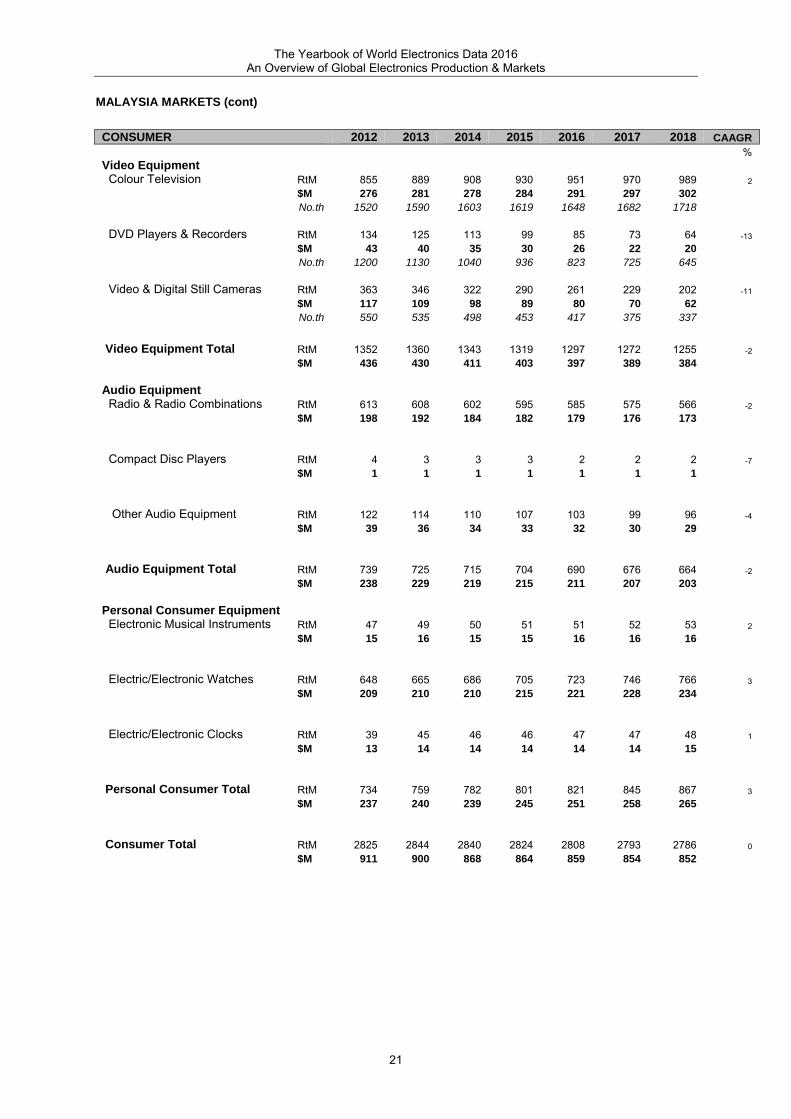
MALAYSIA MARKETS (cont)
CONSUMER 2012 2013 2014 2015 2016 2017 2018 CAAGR % Video Equipment Colour Television RtM 855 889 908 930 951 970 989 2
$M 276 281 278 284 291 297 302
No.th 1520 1590 1603 1619 1648 1682 1718
DVD Players & Recorders RtM 134 125 113 99 85 73 64 -13
$M 43 40 35 30 26 22 20
No.th 1200 1130 1040 936 823 725 645
Video & Digital Still Cameras RtM 363 346 322 290 261 229 202 -11
$M 117 109 98 89 80 70 62
No.th 550 535 498 453 417 375 337
Video Equipment Total RtM 1352 1360 1343 1319 1297 1272 1255 -2
$M 436 430 411 403 397 389 384
Audio Equipment Radio & Radio Combinations RtM 613 608 602 595 585 575 566 -2
$M 198 192 184 182 179 176 173
Compact Disc Players RtM 4 3 3 3 2 2 2 -7
$M 1 1 1 1 1 1 1
Other Audio Equipment RtM 122 114 110 107 103 99 96 -4
$M 39 36 34 33 32 30 29
Audio Equipment Total RtM 739 725 715 704 690 676 664 -2
$M 238 229 219 215 211 207 203
Personal Consumer Equipment Electronic Musical Instruments RtM 47 49 50 51 51 52 53 2
$M 15 16 15 15 16 16 16
Electric/Electronic Watches RtM 648 665 686 705 723 746 766 3
$M 209 210 210 215 221 228 234
Electric/Electronic Clocks RtM 39 45 46 46 47 47 48 1
$M 13 14 14 14 14 14 15
Personal Consumer Total RtM 734 759 782 801 821 845 867 3
$M 237 240 239 245 251 258 265
Consumer Total RtM 2825 2844 2840 2824 2808 2793 2786 0
$M 911 900 868 864 859 854 852

The Yearbook of World Electronics Data 2016 An Overview of Global Electronics Production & Markets
22
MALAYSIA MARKETS (cont)
COMPONENTS 2012 2013 2014 2015 2016 2017 2018 CAAGR Active Components % Colour Television Tubes RtM 49 45 38 29 22 15 11 -27
$M 16 14 12 9 7 5 3
Valves & Tubes Other RtM 258 261 256 251 241 231 217 -4
$M 83 83 78 77 74 71 66
Discrete Semiconductors RtM 4476 5640 6768 8122 8934 9738 10517 12
$M 1444 1785 2070 2484 2732 2978 3216
ICs & Other Microcircuits RtM 40174 41247 42278 43293 44375 45440 46803 3
$M 12959 13053 12929 13239 13570 13896 14313
Active Components Total RtM 44957 47193 49340 51695 53572 55424 57548 4
$M 14502 14934 15089 15809 16383 16949 17599
Passive Components Capacitors RtM 2283 2227 2253 2282 2313 2340 2373 1
$M 736 705 689 698 707 716 726
Resistors RtM 711 707 715 724 734 743 753 1
$M 229 224 219 222 225 227 230
Connectors RtM 1553 1692 1861 2049 2259 2485 2739 10
$M 501 535 569 627 691 760 838
Transformers Small RtM 497 466 462 459 456 452 450 -1
& other Inductors $M 160 147 141 140 139 138 138
Relays RtM 179 173 170 166 163 160 157 -2
$M 58 55 52 51 50 49 48
Switches RtM 165 158 160 162 164 166 168 1
$M 53 50 49 50 50 51 51
Printed Circuit Boards RtM 6184 6117 6265 6424 6594 6756 6934 3
$M 1995 1936 1916 1965 2017 2066 2121
Passive Components Total RtM 11572 11540 11886 12267 12684 13102 13574 3
$M 3733 3652 3635 3751 3879 4007 4151
Other Components Microphones RtM 34 34 34 34 33 31 30 -3
$M 11 11 10 10 10 10 9
Loudspeakers RtM 424 422 426 429 416 399 382 -3
$M 137 134 130 131 127 122 117
Amplifiers RtM 101 93 91 90 85 79 74 -5
$M 33 29 28 27 26 24 23
Aerials RtM 258 249 251 253 245 235 226 -3
$M 83 79 77 77 75 72 69
Unrecorded Media RtM 1001 912 908 904 864 818 774 -4
$M 323 289 278 276 264 250 237
Accessories & Parts for RtM 4370 4056 4171 4289 4236 4140 4046 -1
Consumer Equipment $M 1410 1284 1276 1311 1295 1266 1237
Other Components Total RtM 6188 5766 5881 5999 5879 5703 5532 -2
$M 1996 1825 1799 1835 1798 1744 1692
Components Total RtM 62717 64499 67108 69961 72135 74229 76653 3
$M 20231 20411 20522 21395 22060 22700 23441
2012 2013 2014 2015 2016 2017 2018 CAAGR %MARKET - MALAYSIA TOTAL RtM 90763 94201 98270 102125 105355 108555 112071 3
$M 29278 29810 30052 31231 32219 33197 34272
Notes: 2012 and 2013 are current figures at current exchange rates
2014 to 2018 are forecasts at 2014 constant values & exchange rates (i.e. Inflation is not included)
CAAGR column indicates true annual average growth between 2014 and 2018
Base year 2013

YEARBOOK 2016 ORDER FORM
*UK customers: to calculate VAT amount (applicable to CD-ROM and Corporate Licence only) deduct the ‘REPORT ONLY’ price from the CD-ROM or ‘Corporate Licence’ price (as applicable) to arrive at the taxable amount. VAT is currently 20%. European customers please enter your VAT No. here (to avoid addition of VAT): ** The Corporate License allows electronic distribution (excluding distribution to third parties) of the report throughout your organisation, making it a cost effective and essential tool for your business.
Title Report Only CD Rom (plus report)
Corporate Licence**
VAT UK Customers*
only, European customers see below
Total £/US$/€
Volume 1 West Europe 2016: ISBN 1 905429 584 (Pub Date 03/16)
£945/$1510
€1325
£1245/$1990
€1745
£1890/$3020
€2650
Volume 2 America, Japan, Asia Pacific
2016: ISBN 1 905429 592 (Pub Date 6/16)
£1295/$2075
€1815
£1595/$2550
€2235
£2590/$4150
€3630
Volume 3 East Europe & World
Summary 2016:ISBN 1 905429 606
(Pub Date 8/16)
£945/$1510
€1325
£1245/$1990
€1745
£1890/$3020
€2650
2 Volume Set (Volumes 1 & 2)
£1995/$3195
€2795
£2595/$4155
€3635
£3990/$6390
€5590
3 Volume Set
£2556/$4090
€3580
£3522/$5635
€4930
£5112/$8180
€7160
TOTAL
DELIVERY ADDRESS PAYMENT
Name (Mr/Ms): Position: Organisation: Address: City: Postcode/Zip: Country: Tel: Fax: Email Address+:
RETURN TO: ORDERS DEPARTMENT Fax: +44 (0) 1235 420515 Tel: +44 (0) 1235 227310 Post: Reed Electronics Research, Harvard House Grove Technology Park, Oxon OX12 9FF United Kingdom Email: [email protected]
RER Ltd Registered in England (Registered number 4596362) VAT No: GB 798 3767 49
Payment enclosed - cheques payable to Reed Electronics Research (postage free of charge)
Please charge my MasterCard/Visa/American Express (postage free of charge)
Cardholder Name: Cardholder Address: Expiry Date: Card Number:
Please invoice me: Company Purchase Order No: ………………………………………………………………(postage and packing at cost)
Signature Date:
+ We would like to keep you informed about our products and services. Please tick here if you do not wish to be contacted about this information. We do not pass email addresses on to third parties