Embed Size (px)
Citation preview

Analyst: Rajiv Mehta
Franklin Moraes
Stock Data
Sensex: 25330
52 Week h/l (Rs): 897/590
Market cap (Rscr) : 35,071
6m Avg t/o (Rscr): 268
Bloomberg code: YES IN
BSE code: 532648
NSE code: YESBANK
FV (Rs): 10
Div yield (%): 1.2
Prices as on Mar 22, 2016
Company Rating Grid
Low High
1 2 3 4 5
Earnings Growth
RoA Progression
B/S Strength
Valuation appeal
Risk
Shareholding Pattern
Jun‐15 Sep‐15 Dec‐15
Promoters 22.0 22.0 22.0
FII+DII 65.7 65.7 64.9
Others 12.2 12.3 13.1
Share Price Trend
60
80
100
120
Mar‐15 Jul‐15 Nov‐15 Mar‐16
Yes Bank SENSEX
Yes Bank Ltd Evolving as a robust franchise
BUY Sector: Financials Sector View: Positive
CMP: Rs834 2‐yr Target: Rs1,297 Upside: 55.7%
This report is published by IIFL ‘India Private Clients’ research desk. IIFL has other business units with independent research teams separated by 'Chinese walls' catering to different sets of customers having varying objectives, risk profiles, investment horizon, etc. The views and opinions expressed in this document may at times be contrary in terms of rating, target prices,
estimates and views on sectors and markets… (Read the complete disclaimer at the back of this report)
Company Report
March 23, 2016
Change in Estimates Rating Target
What makes Yes Bank a franchise to own? Yes Bank is among the few banks that were impacted negligibly by the
exhaustive asset quality review (AQR) conducted by RBI during H1 FY16.
Low exposure to project loans and consortium lending, credit based on strong structures and proactive risk management has stood in good stead. Not surprising then, Yes Bank has a much lower level of stressed assets compared to other corporate lenders.
Given a diversified and well‐rated Corporate Portfolio, asset quality is unlikely to surprise negatively even if macro recovery remains sluggish.
Liability franchise is evolving in the desired way with fast increasing share of Retail TDs and CASA. The latter is estimated to improve by 3‐4% pa.
Asset mix has started to complement the shift in liability mix. Share of Retail & Branch Banking has increased to 32% and would further improve. Bank has a host of consumer and commercial lending products to offer.
NIM profile will strengthen further underpinned by changing asset‐liability composition. Expansion of ~10bps pa likely over FY16‐18.
Notwithstanding sustained investments in network and resources, RoA is estimated to improve materially over FY15‐18. Earnings growth in the aforesaid period would be robust 27‐28% pa.
Structural and durable valuation re-rating underway Yes Bank is progressing well on a prudently etched journey of moving from a ‘high growth’ bank to a ‘high quality high growth’ bank. Bank’s impressive evolution towards its objective of becoming a diversified, granular and highly profitable franchise is visible in the milestones achieved well ahead of time. The ongoing structural shift in business profile and sustainable profitability calls for a structural improvement in valuation also. Stock trades at 1.8x 1‐year rolling fwd P/ABV, which is not demanding even considering its own history. We expect Yes Bank to trade at material premium to other corporate lenders. Reiterate ‘Conviction BUY’ with a 24‐month price target of Rs. 1,297.
Financial Highlights Y/e 31 Mar (Rs cr) FY15 FY16E FY17E FY18E
Total operating income 5,546 7,212 9,166 11,846
yoy growth (%) 25.0 30.0 27.1 29.2
Operating profit (pre‐provisions) 3,261 4,253 5,379 6,980
Net profit 2,013 2,538 3,177 4,176
yoy growth (%) 24.4 26.1 25.2 31.4
EPS (Rs) 48.2 60.8 63.5 83.5
Adj.BVPS (Rs) 277.5 323.2 448.6 512.8
P/E (x) 17.3 13.7 13.1 10.0
P/adj.BV (x) 3.0 2.6 1.9 1.6
ROE (%) 21.4 20.0 17.4 17.0
ROA (%) 1.6 1.7 1.8 1.8 Source: Company, India Infoline Research

Page 2 of 15
Yes Bank Ltd.
One of the few banks that came out unscathed in RBI’s AQR Such comprehensive review is unlikely to happen again
Negligible impact of RBI’s asset quality review Yes Bank was one of the few banks that were impacted negligibly by the exhaustive asset quality review (AQR) conducted by RBI during H1 FY16. Amongst corporate lenders, Yes Bank was probably the only one to come out unscathed from this comprehensive exercise. Having given adequate time and cues to banks for recognizing and providing for stressed assets, the central bank undertook a concurrent and intensive audit focusing on exposures to highly leveraged corporates, stalled infra projects, weak companies within stress sectors and already restructured cases. The underlying objective was to clean‐up the banking system by making banks recognize stressed exposures and build adequate provisioning against them. Another intended outcome was to have more uniformity with regards to classification of stressed assets within the system. RBI has already eluded that it is unlikely to conduct such a review again since a clean‐up has already been advocated by the end of FY17
A combination of factors stood in good stead for Yes Bank during the current credit cycle
Project loans are few and far exposures for Yes Bank and comprise only ~5% of advances. The bank has generally been a working capital and commercial loans provider.
In the current credit cycle, bulk of the stress in being observed for loans disbursed during the period of FY06‐10 towards funding the massive capex cycle that country, which was spread across various sectors. Having started commercial operations in 2004, Yes Bank, fortunately, did not have the balance sheet capacity to participate in this cycle.
The bank has a policy of not participating in consortium lending for large projects as interest of small lenders is generally not taken care of during the time of crisis (bank exited CDR in 2012). Rather, it prefers to be a sole or a lead lender in small projects; this is manifested bank’s approach in financing renewable energy projects.
Even while bank had lending exposures to some of the currently stressed corporates, it was based on a strong structure and backed by adequate and easily realizable collaterals. In many of these cases, Yes Bank has been able to make timey exits guided by its underlying proactive risk management. Largely, the exposures were taken for providing a solution (not to fund capex) after determining whether the problem is transient or permanent.
Yes Bank has also implemented innovative and robust loan servicing mechanism with many large and mid corporate borrowers wherein interest and principal is recovered through participation in revenue or opex.
With bank’s internal NPL recognition policy being stringent, there was a significant overlap between accounts already recognized as bad or restructured and what RBI notified during the AQR.

Page 3 of 15
Yes Bank Ltd.
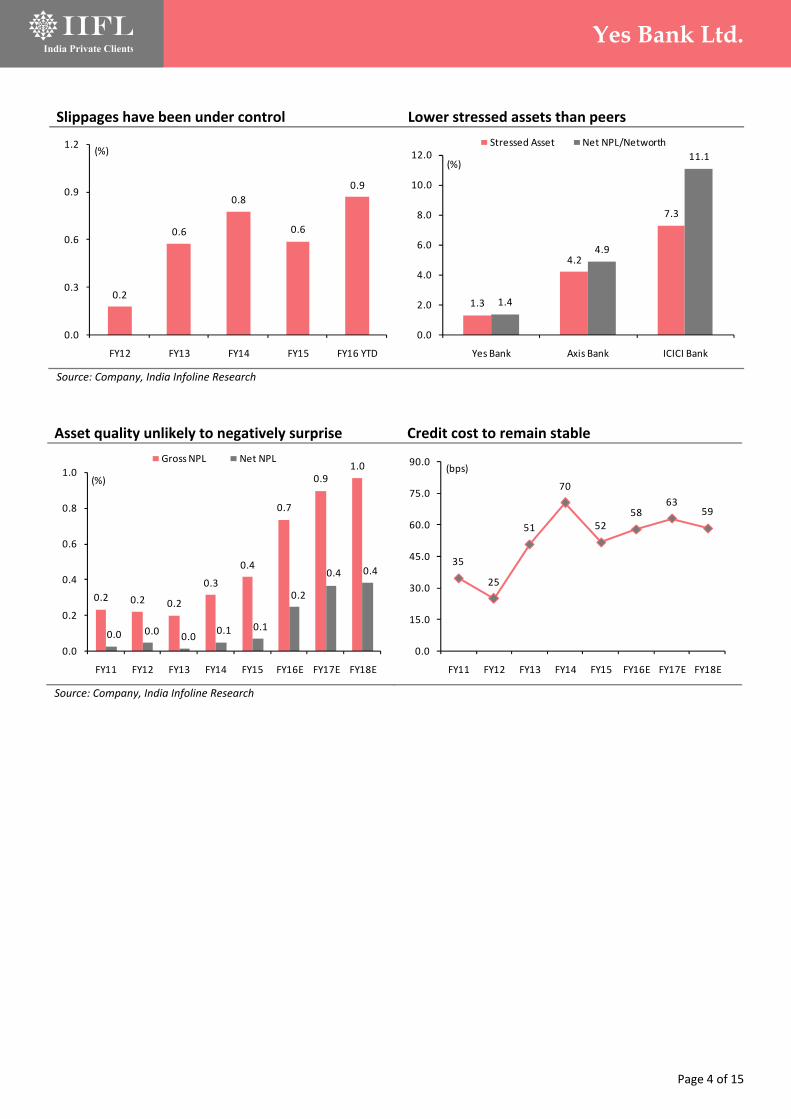
Asset quality unlikely to surprise negatively in FY17 More than 75% of the corporate loan book is rated A and above; no exposure to SEBs Yes Bank has much lower level of stressed assets compared to other private corporate lenders RBI’s review did not materially alter credit cost trajectory unlike other banks
Credit cost unlikely to spike in FY17 With Yes Bank having built a knowledge‐based corporate portfolio by taking well‐informed risks and ring‐fencing it against an adverse outcome, the bank’s asset quality is unlikely to surprise negatively even if economic recovery remains sluggish for a while. A well‐diversified sectoral distribution and robust rating profile points towards a high‐quality book. More than 75% of the corporate loan book is rated A and above. Sectoral break‐up of funded and non‐funded exposure indicate high granularity. While in case of Power, Iron & Steel and EPC sectors, the bank has some concentration, a bulk of the exposure here is to well‐rated companies (A and above) or to operational projects. Yes Bank does not have any exposure to SEBs. The bank’s strong focus on risk management was manifested during FY11‐14 when the economy slowed down severely. In the above period, Yes Bank calibrated its loan book growth and increased exposure to highly rated credit substitutes. The investment to deposits ratio jumped from 38% in FY10 to 64% in FY13. Not surprisingly, Yes Bank has a much lower level of stressed assets (Gross NPLs + Standard Restructured) as compared to other private corporate lenders currently. Nor has it resorted to significant ARC sale of stressed assets like others. Further, loans where 5:25 re‐financing has been implemented or SDR invoked is none. Even the likelihood of it is low since the bank has been averse to participate in consortium lending.
After incurring a credit cost of 34 bps in 9m FY16, the bank lowered its full‐year guidance to at most 50 bps. This implies a credit cost of 16 bps for Q4 FY16, which at near the level of Q3 FY16. Thus RBI’s review has not materially altered Yes Bank’s credit cost trajectory unlike other banks. Even assuming delinquencies may remain elevated in next few quarters, it seems unlikely that credit cost in FY17 would be materially higher than FY16.
Calibrated lending during FY11‐14 A well‐rated Corporate Portfolio
Source: Company, India Infoline Research
20.0
30.0
40.0
50.0
60.0
70.0
(25.0)
0.0
25.0
50.0
75.0
100.0
FY10
FY11
FY12
FY13
FY14
FY15
FY16E
FY17E
FY18E
(%)(%)
Inv growth yoy (LHS) Inv/Deposits (RHS)
19.4 17.6
38.9
21.8
2.3
0.0
10.0
20.0
30.0
40.0
50.0
AAA AA A BBB BB & Below
(%)
Page 4 of 15
Yes Bank Ltd.
Slippages have been under control Lower stressed assets than peers
Source: Company, India Infoline Research
0.2
0.6
0.8
0.6
0.9
0.0
0.3
0.6
0.9
1.2
FY12 FY13 FY14 FY15 FY16 YTD
(%)
1.3
4.2
7.3
1.4
4.9
11.1
0.0
2.0
4.0
6.0
8.0
10.0
12.0
Yes Bank Axis Bank ICICI Bank
(%)
Stressed Asset Net NPL/Networth
Asset quality unlikely to negatively surprise Credit cost to remain stable
Source: Company, India Infoline Research
0.2 0.2 0.2
0.3
0.4
0.7
0.9 1.0
0.0 0.0 0.0
0.1 0.1
0.2
0.4 0.4
0.0
0.2
0.4
0.6
0.8
1.0
FY11 FY12 FY13 FY14 FY15 FY16E FY17E FY18E
(%)
Gross NPL Net NPL
35
25
51
70
52 58
63 59
0.0
15.0
30.0
45.0
60.0
75.0
90.0
FY11 FY12 FY13 FY14 FY15 FY16E FY17E FY18E
(bps)

Page 5 of 15
Yes Bank Ltd.
SA ratio has risen from 1.8% in FY11 to 17.6% currently Higher rates offered and relentless investment in network were the kickers Bank confident of improving CASA ratio by 3‐4% annually Retail TD share and branch penetration is also improving
Liability franchise evolving in the desired way De‐regulation of savings deposits rate in October 2011 was the real kicker for small private banks stimulating their drive to improve liability franchise. A host of players responded excitedly by increasing their base savings rate and even offering higher rates on higher balances. The success of this move was measured for some and disproportionate for others. Yes Bank falls in the latter category. Consider this; bank’s SA ratio has risen from just 1.8% as at the end of FY11 to 17.6% at present. During the period, savings deposits grew nearly 22x as the bank added substantial number of liability accounts looking to earn more on their balances. The SA mobilization was also supported by relentless investment in the branch network. The number of branches has increased by 3.5x since FY11. With the network maturing, per branch savings deposits has also risen substantially over the past few years to Rs. 22cr. The CASA share at the end of Q3 FY16 stood at 27%. Even after lowering the savings rate to 6% in November 2015, the bank continues to witness robust mobilization (SA deposits grew by 64% in 3Q FY16). Currently, the rates offered are 6% for average balances up till Rs. 1cr and 7% for average balances above it. The bank is confident about improving the CASA ratio by 3‐4% annually driven by a) reasonable SA rate premium offered b) ongoing investments in branch network c) a well‐established brand equity and d) softening of interest rate in the economy.
The combination of rapid network expansion and rising brand equity has also helped Yes Bank in mobilization of retail TDs. Its share in total deposits stands at 27%, having come a long way when compared to 18% four years back. The penetration of Retail TDs per branch has also improved to Rs. 37cr from Rs. 27cr over the aforementioned period. Retail TD and CASA deposits combined now comprise 54% of overall deposits representing the significant progress the bank has achieved towards granularizing its liability franchise. This trend is likely to continue well into the future.
Share of CASA deposits rising at impressive rate Branch network being ramped‐up aggressively
Source: Company, India Infoline Research
10.3
15.0
18.9
22.0 23.1
27.1
30.6
34.1
0.0
8.0
16.0
24.0
32.0
40.0
FY11 FY12 FY13 FY14 FY15 FY16E FY17E FY18E
(%)
150
214
356
430
560
630
750
0.0
200.0
400.0
600.0
800.0
FY10 FY11 FY12 FY13 FY14 FY15 9M FY16
(no)

Page 6 of 15
Yes Bank Ltd.
Yes Bank witnessing disproportionate benefit of offering higher SA rate
Source: Company, India Infoline Research
Branches witnessing a sharp uptick in SA balance
Source: Company, India Infoline Research
Network expansion also driving robust growth in Retail TDs
Source: Company, India Infoline Research
0.0
4.0
8.0
12.0
16.0
20.0
0
4,000
8,000
12,000
16,000
20,000
FY11 FY12 FY13 FY14 FY15 9M FY16
(%)(Rs cr)
Savings Deposits (LHS) SA Share (RHS)
3
6
11
16
18
22
0.0
5.0
10.0
15.0
20.0
25.0
FY11 FY12 FY13 FY14 FY15 9M FY16
(cr)
22.0
25.0
28.0
31.0
34.0
37.0
40.0
12.0
15.0
18.0
21.0
24.0
27.0
30.0
Q3 FY12 Q3 FY13 Q3 FY14 Q3 FY15 Q3 FY16
(Rs cr)(%)
Retail TD Share (LHS) Retail TD/Branch (RHS)

Page 7 of 15
Yes Bank Ltd.
Bank claims to have one of the best in industry liability customer base maintaining high balances
Bank now has a host of consumer and commercial lending products to offer Share of Retail & Business Banking which currently stands at 33% is likely to reach 45% by 2020
Asset mix to follow suit Having built a large liability customer franchise over the past five years, Yes Bank is in the process of developing a robust consumer and MSME lending franchise on top of it. Using analytics that dives into customers’ relationship, the bank intends to indentify internal deserving customers for offering credit products and cross‐selling. As a result, the bank is not following the general approach of offering all products to all customers. As per the management, bank’s liability customer base is one of the best in the industry as measured by higher average quarterly balance maintained by them. Most of the other banks have a longer tail.
Barring for credit cards, Yes Bank now has a host of consumer and commercial lending products, which would be offered through various channels. For enhancing service levels, the bank is investing in various digital initiatives. More importantly, it has hired various senior talents of retail banking industry over the past couple of years. Thus, all the elements are in place to grow the consumer and MSME book not only aggressively but also prudently. As per the bank, the share of Retail & Business Banking, which currently stands at 33%, is likely to reach 45% by 2020.
Corporate Banking share on the decline
Source: Company, India Infoline Research
71 67
1513
911
5 10
0%
20%
40%
60%
80%
100%
Q2 FY15 Q3 FY16
Corporate Banking Business Banking MSE Consumer Banking
Page 8 of 15
Yes Bank Ltd.
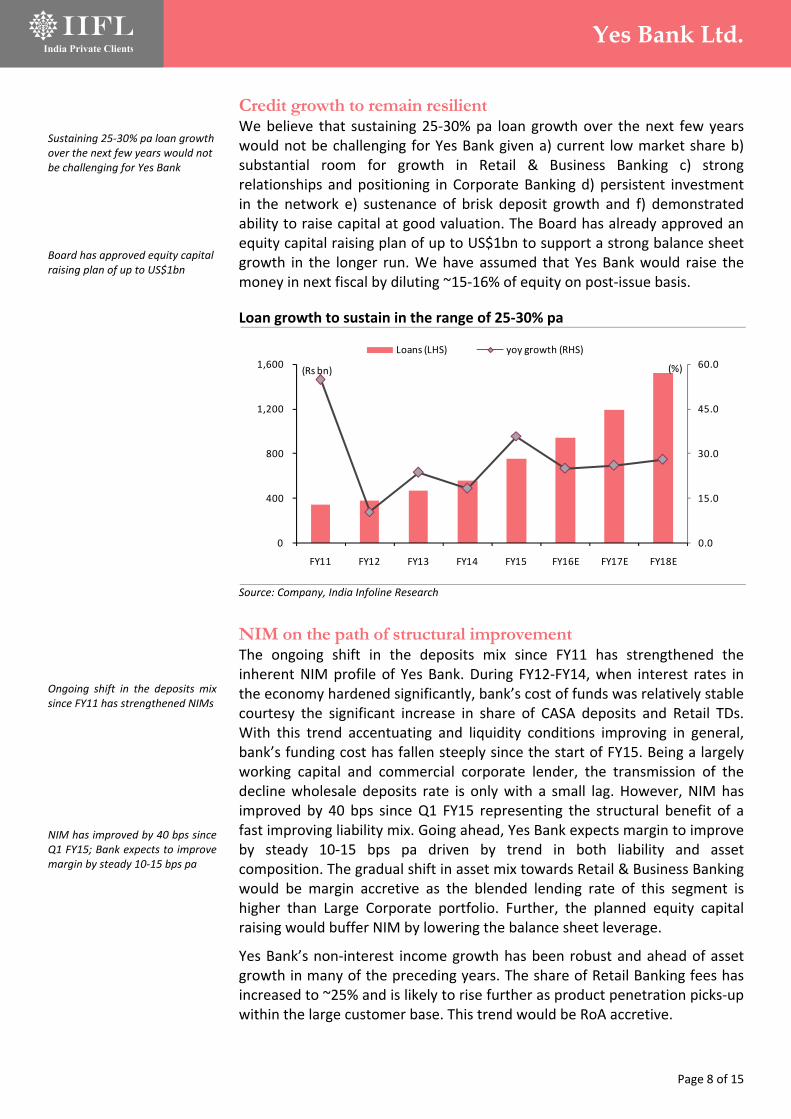
Sustaining 25‐30% pa loan growth over the next few years would not be challenging for Yes Bank Board has approved equity capital raising plan of up to US$1bn
Ongoing shift in the deposits mix since FY11 has strengthened NIMs NIM has improved by 40 bps since Q1 FY15; Bank expects to improve margin by steady 10‐15 bps pa
Credit growth to remain resilient We believe that sustaining 25‐30% pa loan growth over the next few years would not be challenging for Yes Bank given a) current low market share b) substantial room for growth in Retail & Business Banking c) strong relationships and positioning in Corporate Banking d) persistent investment in the network e) sustenance of brisk deposit growth and f) demonstrated ability to raise capital at good valuation. The Board has already approved an equity capital raising plan of up to US$1bn to support a strong balance sheet growth in the longer run. We have assumed that Yes Bank would raise the money in next fiscal by diluting ~15‐16% of equity on post‐issue basis.
Loan growth to sustain in the range of 25‐30% pa
Source: Company, India Infoline Research
NIM on the path of structural improvement The ongoing shift in the deposits mix since FY11 has strengthened the inherent NIM profile of Yes Bank. During FY12‐FY14, when interest rates in the economy hardened significantly, bank’s cost of funds was relatively stable courtesy the significant increase in share of CASA deposits and Retail TDs. With this trend accentuating and liquidity conditions improving in general, bank’s funding cost has fallen steeply since the start of FY15. Being a largely working capital and commercial corporate lender, the transmission of the decline wholesale deposits rate is only with a small lag. However, NIM has improved by 40 bps since Q1 FY15 representing the structural benefit of a fast improving liability mix. Going ahead, Yes Bank expects margin to improve by steady 10‐15 bps pa driven by trend in both liability and asset composition. The gradual shift in asset mix towards Retail & Business Banking would be margin accretive as the blended lending rate of this segment is higher than Large Corporate portfolio. Further, the planned equity capital raising would buffer NIM by lowering the balance sheet leverage.
Yes Bank’s non‐interest income growth has been robust and ahead of asset growth in many of the preceding years. The share of Retail Banking fees has increased to ~25% and is likely to rise further as product penetration picks‐up within the large customer base. This trend would be RoA accretive.
0.0
15.0
30.0
45.0
60.0
0
400
800
1,200
1,600
FY11 FY12 FY13 FY14 FY15 FY16E FY17E FY18E
(%)(Rs bn)
Loans (LHS) yoy growth (RHS)

Page 9 of 15
Yes Bank Ltd.
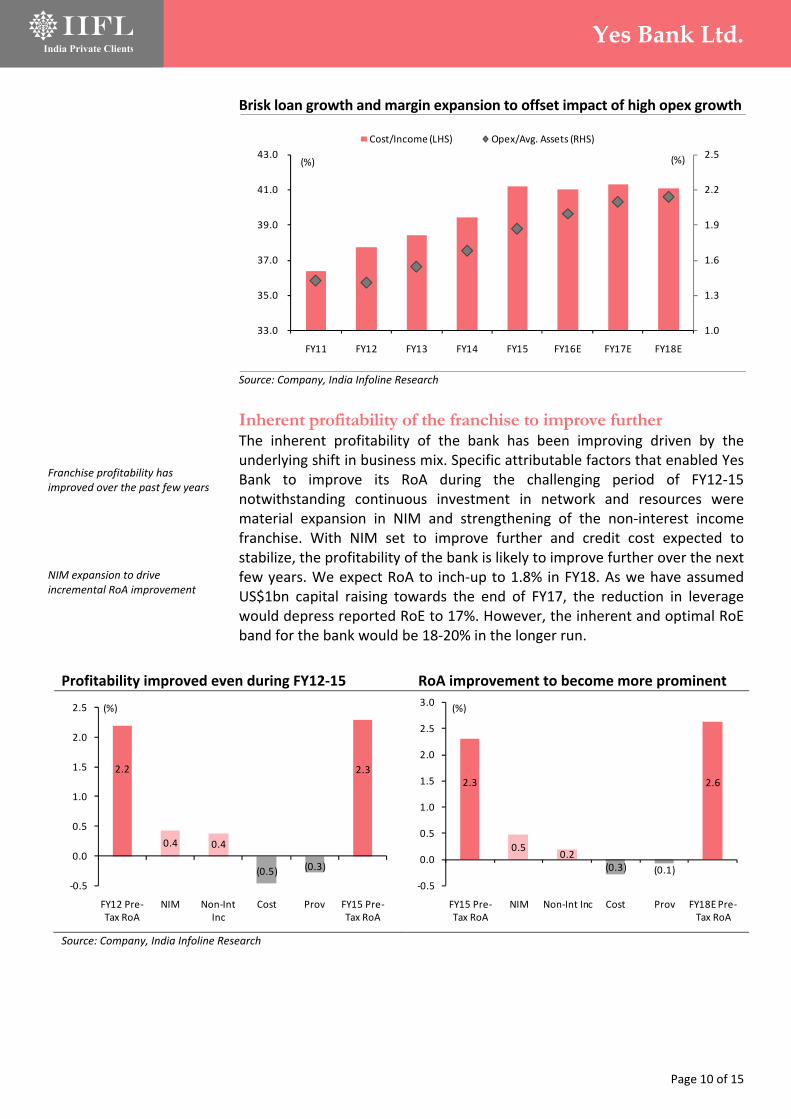
Bank is likely to sustain relentless investment in network and employees over the coming years Strong loan growth and NIM expansion to help bank in keeping the cost ratios steady
Asset penetration within a large customer base to drive superior fee growth
Source: Company, India Infoline Research
Sustained investments to keep cost metric at current level As the bank is likely to sustain the relentless investment is network and employees over the coming years with the objective of strengthening the Retail and Business Banking franchise, the cost growth is expected to remain elevated. The cost ratios of Yes Bank have already moved up over the past few years concomitant with the shift in liability and asset mix. Over FY11‐FY16, the cost/income ratio has increased from 36% to 41% and the cost/assets ratio has risen from 1.4% to 2%. Both these cost measures are likely to stay near the current levels over the next couple of years as the adverse impact of sustained high investments is offset by a robust income growth underpinned by strong loan growth and steady NIM expansion.
1.0
1.2
1.4
1.6
1.8
2.0
0
1,000
2,000
3,000
4,000
5,000
FY11 FY12 FY13 FY14 FY15 FY16E FY17E FY18E
(%)(Rs cr)
Non‐Int Income (LHS) Non‐Int Inc/Assets (RHS)
NIM to continue to see steady improvement Fall in funding cost to outpace softening in yield
Source: Company, India Infoline Research
2.8 2.7
2.6
2.7 2.8
3.0
3.2
3.4 3.5
2.0
2.3
2.6
2.9
3.2
3.5
3.8
FY10 FY11 FY12 FY13 FY14 FY15 FY16E FY17E FY18E
(%)
10.2 10.6
12.2 12.7 12.7
12.2 11.4
11.0 10.8
6.2 6.6
8.1 8.0 7.9 7.6 7.0
6.6 6.3
3.0
6.0
9.0
12.0
15.0
FY10 FY11 FY12 FY13 FY14 FY15 FY16E FY17E FY18E
(%)
Portfolio Yield Cost of Funds
Page 10 of 15
Yes Bank Ltd.
Franchise profitability has improved over the past few years NIM expansion to drive incremental RoA improvement
Brisk loan growth and margin expansion to offset impact of high opex growth
Source: Company, India Infoline Research
Inherent profitability of the franchise to improve further The inherent profitability of the bank has been improving driven by the underlying shift in business mix. Specific attributable factors that enabled Yes Bank to improve its RoA during the challenging period of FY12‐15 notwithstanding continuous investment in network and resources were material expansion in NIM and strengthening of the non‐interest income franchise. With NIM set to improve further and credit cost expected to stabilize, the profitability of the bank is likely to improve further over the next few years. We expect RoA to inch‐up to 1.8% in FY18. As we have assumed US$1bn capital raising towards the end of FY17, the reduction in leverage would depress reported RoE to 17%. However, the inherent and optimal RoE band for the bank would be 18‐20% in the longer run.
1.0
1.3
1.6
1.9
2.2
2.5
33.0
35.0
37.0
39.0
41.0
43.0
FY11 FY12 FY13 FY14 FY15 FY16E FY17E FY18E
(%)(%)
Cost/Income (LHS) Opex/Avg. Assets (RHS)
Profitability improved even during FY12‐15 RoA improvement to become more prominent
Source: Company, India Infoline Research
2.2
0.4 0.4
(0.5) (0.3)
2.3
‐0.5
0.0
0.5
1.0
1.5
2.0
2.5
FY12 Pre‐Tax RoA
NIM Non‐Int Inc
Cost Prov FY15 Pre‐Tax RoA
(%)
2.3
0.5 0.2
(0.3) (0.1)
2.6
‐0.5
0.0
0.5
1.0
1.5
2.0
2.5
3.0
FY15 Pre‐Tax RoA
NIM Non‐Int Inc Cost Prov FY18E Pre‐Tax RoA
(%)
Page 11 of 15
Yes Bank Ltd.
From being a ‘high growth’ bank to ‘high quality high growth’ bank Trades at 1.8x 1‐year rolling forward P/ABV, below 5‐year average Expect Yes Bank to trade at material premium to other corporate lenders
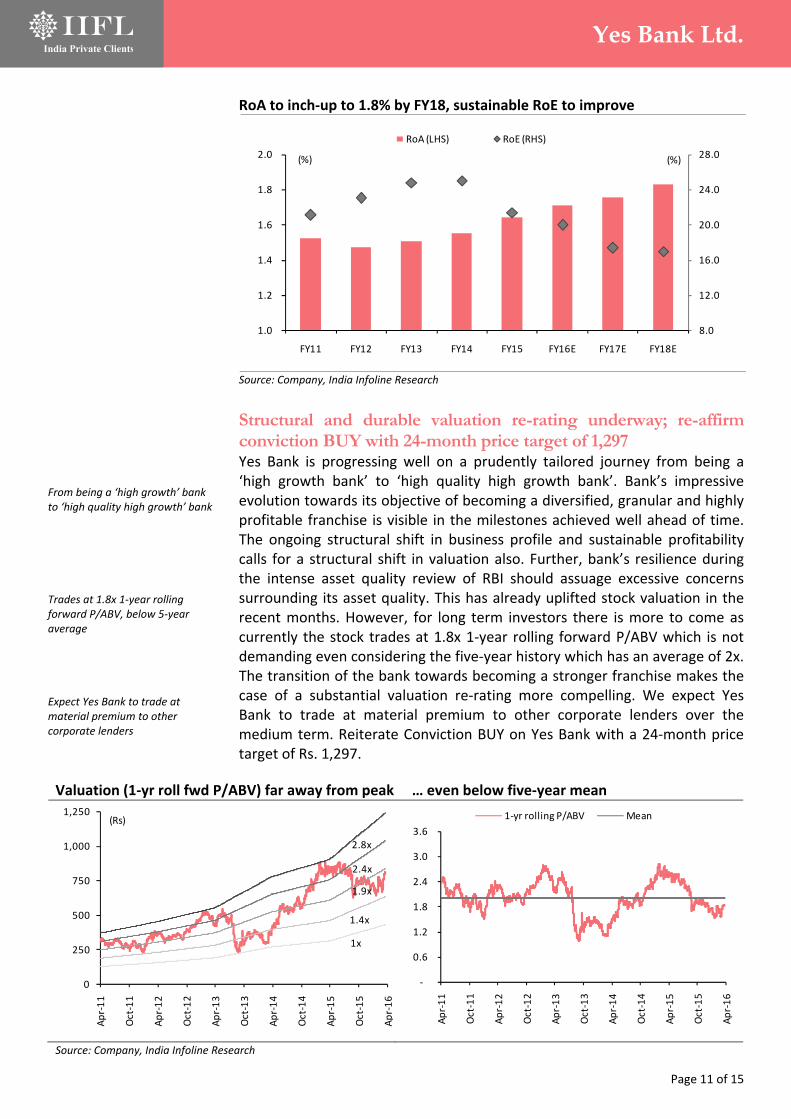
RoA to inch‐up to 1.8% by FY18, sustainable RoE to improve
Source: Company, India Infoline Research
Structural and durable valuation re-rating underway; re-affirm conviction BUY with 24-month price target of 1,297 Yes Bank is progressing well on a prudently tailored journey from being a ‘high growth bank’ to ‘high quality high growth bank’. Bank’s impressive evolution towards its objective of becoming a diversified, granular and highly profitable franchise is visible in the milestones achieved well ahead of time. The ongoing structural shift in business profile and sustainable profitability calls for a structural shift in valuation also. Further, bank’s resilience during the intense asset quality review of RBI should assuage excessive concerns surrounding its asset quality. This has already uplifted stock valuation in the recent months. However, for long term investors there is more to come as currently the stock trades at 1.8x 1‐year rolling forward P/ABV which is not demanding even considering the five‐year history which has an average of 2x. The transition of the bank towards becoming a stronger franchise makes the case of a substantial valuation re‐rating more compelling. We expect Yes Bank to trade at material premium to other corporate lenders over the medium term. Reiterate Conviction BUY on Yes Bank with a 24‐month price target of Rs. 1,297.
8.0
12.0
16.0
20.0
24.0
28.0
1.0
1.2
1.4
1.6
1.8
2.0
FY11 FY12 FY13 FY14 FY15 FY16E FY17E FY18E
(%)(%)
RoA (LHS) RoE (RHS)
Valuation (1‐yr roll fwd P/ABV) far away from peak … even below five‐year mean
Source: Company, India Infoline Research
0
250
500
750
1,000
1,250
Apr‐11
Oct‐11
Apr‐12
Oct‐12
Apr‐13
Oct‐13
Apr‐14
Oct‐14
Apr‐15
Oct‐15
Apr‐16
(Rs)
2.8x
2.4x
1.9x
1.4x
1x
‐
0.6
1.2
1.8
2.4
3.0
3.6
Apr‐11
Oct‐11
Apr‐12
Oct‐12
Apr‐13
Oct‐13
Apr‐14
Oct‐14
Apr‐15
Oct‐15
Apr‐16
1‐yr rolling P/ABV Mean

Page 12 of 15
Yes Bank Ltd.
Peer Comparison
Company M‐Cap Loan CAGR PAT CAGR Imp Assets NNPL/NW RoA RoE P/ABV P/E
(Rs cr) FY15‐18
(%) FY15‐18
(%) (%) (%) FY18E FY18E FY18E
(x) FY18E
(x)
HDFC Bank 264,488 26.6 24.9 1.1 1.8 1.9 21.8 2.7 13.2
IndusInd Bank 55,428 28.2 29.0 1.4 1.6 1.9 17.7 2.4 14.2
Yes Bank 35,146 26.3 27.5 1.3 1.4 1.8 17.0 1.6 10.0
Axis Bank 104,395 22.2 16.8 4.2 4.9 1.6 18.4 1.6 9.0
ICICI Bank* 134,803 18.3 8.9 7.3 11.1 1.5 14.3 1.1 6.7 Source: Company, India Infoline Research * Valuation adjusted for stand‐alone bank

Page 13 of 15
Yes Bank Ltd.
Financials Income statement Y/e 31 Mar (Rs cr) FY15 FY16E FY17E FY18E
Interest income 11,572 13,528 15,958 19,639
Interest expense (8,084) (8,951) (10,138) (12,043)
Net interest income 3,488 4,577 5,820 7,596
Non‐interest income 2,058 2,635 3,346 4,250
Total op income 5,546 7,212 9,166 11,846
Total op expenses (2,285) (2,959) (3,787) (4,866)
Op profit (pre‐prov) 3,261 4,253 5,379 6,980
Total provisions (339) (493) (672) (794)
Profit before tax 2,922 3,760 4,706 6,186
Taxes (909) (1,222) (1,530) (2,010)
Net profit 2,013 2,538 3,177 4,176
Balance sheet Y/e 31 Mar (Rs cr) FY15 FY16E FY17E FY18E
Total cash & equiv 7,557 9,711 11,979 13,910
Investments 46,605 48,469 61,556 77,253
Advances 75,550 94,437 118,991 152,308
Total int‐earn assets 129,712 152,618 192,526 243,472
Fixed assets 319 399 498 623
Other assets 6,139 7,060 8,472 10,167
Total assets 136,170 160,077 201,497 254,261
Net worth 11,680 13,733 22,872 26,236
Deposits 91,176 109,867 135,136 172,974
Borrowings 26,220 28,318 33,698 43,303
Total int‐bearing liab 117,396 138,185 168,835 216,277
Non‐int bearing liab 7,094 8,158 9,790 11,748
Total liabilities 124,490 146,343 178,625 228,025
Equity + Total liab 136,170 160,077 201,497 254,261
Key ratios Y/e 31 Mar FY15 FY16E FY17E FY18E
Growth matrix (%)
Net interest income 28.4 31.2 27.2 30.6
Total op income 25.0 30.0 27.1 29.3
Op profit (pre‐provision) 21.3 30.4 26.5 29.8
Net profit 24.4 26.1 25.2 31.5
Advances 35.8 25.0 26.0 28.0
Deposits 22.9 20.5 23.0 28.0
Total assets 24.9 17.6 25.9 26.2
Profitability Ratios (%)
NIM 3.0 3.2 3.4 3.5
Non‐int inc/Total inc 37.1 36.5 36.5 35.9
Return on Avg Equity 21.4 20.0 17.4 17.0
Return on Avg Assets 1.6 1.7 1.8 1.8
Per share ratios (Rs)
EPS 48.2 60.8 63.5 83.5
Adj.BVPS 277.5 323.2 448.6 512.8
DPS 9.0 10.0 11.0 14.0
Other key ratios (%)
Credit/Deposits 82.9 86.0 88.1 88.1
Cost/Income 41.2 41.0 41.3 41.1
CAR 15.6 13.5 16.7 14.9
Tier‐I capital 11.5 10.8 14.3 12.8
Gross NPLs/Loans 0.4 0.7 0.9 1.0
Credit Cost 0.5 0.6 0.6 0.6
Net NPLs/Net loans 0.1 0.2 0.4 0.4
Tax rate 31.1 32.5 32.5 32.5
Dividend yield 1.1 1.2 1.3 1.7
Page 14 of 15
‘Best Broker of the Year’ – by Zee Business for contribution to broking Nirmal Jain, Chairman, IIFL, received the award for The Best Broker of the Year (for contribution to broking in India) at India's Best Market Analyst Awards 2014 organised by the Zee Business in Mumbai. The award was presented by the guest of Honour Amit Shah, president of the Bharatiya Janata Party and Piyush Goel, Minister of state with independent charge for power, coal new and renewable energy.
Recommendation parameters for fundamental reports:
Buy – Absolute return of over +15%
Accumulate – Absolute return between 0% to +15%
Reduce – Absolute return between 0% to ‐10%
Sell – Absolute return below ‐10%
Call Failure ‐ In case of a Buy report, if the stock falls 20% below the recommended price on a closing basis, unless otherwise specified by the analyst; or, in case of a Sell report, if the stock rises 20% above the recommended price on a closing basis, unless otherwise specified by the analyst
India Infoline Group (hereinafter referred as IIFL) is engaged in diversified financial services business including equity broking, DP services, merchant banking, portfolio management services, distribution of Mutual Fund, insurance products and other investment products and also loans and finance business. India Infoline Ltd (“hereinafter referred as IIL”) is a part of the IIFL and is a member of the National Stock Exchange of India Limited (“NSE”) and the BSE Limited (“BSE”). IIL is also a Depository Participant registered with NSDL & CDSL, a SEBI registered merchant banker and a SEBI registered portfolio manager. IIL is a large broking house catering to retail, HNI and institutional clients. It operates through its branches and authorised persons and sub‐brokers spread across the country and the clients are provided online trading through internet and offline trading through branches and Customer Care. Terms & Conditions and Other Disclosures:‐ a) This research report (“Report”) is for the personal information of the authorised recipient(s) and is not for public distribution and should not be
reproduced or redistributed to any other person or in any form without IIL’s prior permission. The information provided in the Report is from publicly available data, which we believe, are reliable. While reasonable endeavors have been made to present reliable data in the Report so far as it relates to current and historical information, butIIL does not guarantee the accuracy or completeness of the data in the Report. Accordingly, IIL or any of its connected persons including its directors or subsidiaries or associates or employees shall not be in any way responsible for any loss or damage that may arise to any person from any inadvertent error in the information contained, views and opinions expressed in this publication.
b) Past performance should not be taken as an indication or guarantee of future performance, and no representation or warranty, express or implied, is made regarding future performance. Information, opinions and estimates contained in this report reflect a judgment of its original date of publication by IIFL and are subject to change without notice. The price, value of and income from any of the securities or financial instruments mentioned in this report can fall as well as rise. The value of securities and financial instruments is subject to exchange rate fluctuation that may have a positive or adverse effect on the price or income of such securities or financial instruments.
c) The Report also includes analysis and views of our research team. The Report is purely for information purposes and does not construe to be investment recommendation/advice or an offer or solicitation of an offer to buy/sell any securities. The opinions expressed in the Report are our current opinions as of the date of the Report and may be subject to change from time to time without notice. IIL or any persons connected with it do not accept any liability arising from the use of this document.
d) Investors should not solely rely on the information contained in this Report and must make investment decisions based on their own investment objectives, judgment, risk profile and financial position. The recipients of this Report may take professional advice before acting on this information.
e) IIL has other business segments / divisions with independent research teams separated by 'Chinese walls' catering to different sets of customers having varying objectives, risk profiles, investment horizon, etc and therefore, may at times have, different and contrary views on stocks, sectors and markets.
f) This report is not directed or intended for distribution to, or use by, any person or entity who is a citizen or resident of or located in any locality, state, country or other jurisdiction, where such distribution, publication, availability or use would be contrary to local law, regulation or which would subject IIL and its affiliates to any registration or licensing requirement within such jurisdiction. The securities described herein may or may not be eligible for sale in all jurisdictions or to certain category of investors. Persons in whose possession this Report may come are required to inform themselves of and to observe such restrictions.
g) As IIL along with its associates, are engaged in various financial services business and so might have financial, business or other interests in other entities including the subject company/ies mentioned in this Report. However, IIL encourages independence in preparation of research report and strives to minimize conflict in preparation of research report. IIL and its associates did not receive any compensation or other benefits from the subject company/ies mentioned in the Report or from a third party in connection with preparation of the Report. Accordingly, IIL and its associates do not have any material conflict of interest at the time of publication of this Report.

Page 15 of 15
h) As IIL and its associates are engaged in various financial services business, it might have:‐
(a) received any compensation (except in connection with the preparation of this Report) from the subject company in the past twelve months; (b) managed or co‐managed public offering of securities for the subject company in the past twelve months; (c) received any compensation for investment banking or merchant banking or brokerage services from the subject company in the past twelve months; (d) received any compensation for products or services other than investment banking or merchant banking or brokerage services from the subject company in the past twelve months; (e) engaged in market making activity for the subject company.
i) IIL and its associates collectively do not own(in their proprietary position) 1% or more of the equity securities of the subject company/ies mentioned in the report as of the last day of the month preceding the publication of the research report.
j) The Research Analyst/s engaged in preparation of this Report or his/her relative
(a) does not have any financial interests in the subject company/ies mentioned in this report; (b) does not own 1% or more of the equity securities of the subject company mentioned in the report as of the last day of the month preceding the publication of the research report; (c) does not have any other material conflict of interest at the time of publication of the research report.
k) The Research Analyst/s engaged in preparation of this Report:‐
(a) has not received any compensation from the subject company in the past twelve months; (b) has not managed or co‐managed public offering of securities for the subject company in the past twelve months; (c) has not received any compensation for investment banking or merchant banking or brokerage services from the subject company in the past twelve months; (d) has not received any compensation for products or services other than investment banking or merchant banking or brokerage services from the subject company in the past twelve months; (e) has not received any compensation or other benefits from the subject company or third party in connection with the research report; (f) has not served as an officer, director or employee of the subject company; (g) is not engaged in market making activity for the subject company.
We submit that no material disciplinary action has been taken on IIL by any regulatory authority impacting Equity Research Analysis. A graph of daily closing prices of securities is available at http://www.nseindia.com/ChartApp/install/charts/mainpage.jsp, www.bseindia.com and http://economictimes.indiatimes.com/markets/stocks/stock‐quotes. (Choose a company from the list on the browser and select the “three years” period in the price chart).
Published in 2016. © India Infoline Ltd 2016 India Infoline Limited (Formerly “India Infoline Distribution Company Limited”), CIN No.: U99999MH1996PLC132983, Corporate Office – IIFL Centre, Kamala City, Senapati Bapat Marg, Lower Parel, Mumbai – 400013 Tel: (91‐22) 4249 9000 .Fax: (91‐22) 40609049, Regd. Office – IIFL House, Sun Infotech Park, Road No. 16V, Plot No. B‐23, MIDC, Thane Industrial Area, Wagle Estate, Thane – 400604 Tel: (91‐22) 25806650. Fax: (91‐22) 25806654 E‐mail: [email protected] Website: www.indiainfoline.com, Refer www.indiainfoline.com for detail of Associates. National Stock Exchange of India Ltd. SEBI Regn. No. : INB231097537/ INF231097537/ INE231097537, Bombay Stock Exchange Ltd. SEBI Regn. No.:INB011097533/ INF011097533/ BSE‐Currency, MCX Stock Exchange Ltd. SEBI Regn. No.: INB261097530/ INF261097530/ INE261097537, United Stock Exchange Ltd. SEBI Regn. No.: INE271097532, PMS SEBI Regn. No. INP000002213, IA SEBI Regn. No. INA000000623, SEBI RA Regn.:‐ INH000000248.
For Research related queries, write to: Amar Ambani, Head of Research at [email protected] For Sales and Account related information, write to customer care: [email protected] or call on 91‐22 4007 1000


![IIFL Holdings Ltdcontent.indiainfoline.com/admin/PDF/corporate_presentation_INR_Q3… · IIFL Holdings Ltd [Bloomberg Code: IIFL IN ] Investor Presentation April 2016 . 17.5 19.6](https://img.pdfslide.net/doc/110x75/5edff300ad6a402d666b3977/iifl-holdings-iifl-holdings-ltd-bloomberg-code-iifl-in-investor-presentation.jpg)