Embed Size (px)
Citation preview
This is a repository copy of Yield-line plasticity and tensile membrane action in lightly-reinforced rectangular concrete slabs.
White Rose Research Online URL for this paper:http://eprints.whiterose.ac.uk/111463/
Version: Accepted Version
Article:
Burgess, I. orcid.org/0000-0001-9348-2915 (2017) Yield-line plasticity and tensile membrane action in lightly-reinforced rectangular concrete slabs. Engineering Structures, 138. pp. 195-214. ISSN 0141-0296
https://doi.org/10.1016/j.engstruct.2017.01.072
Article available under the terms of the CC-BY-NC-ND licence (https://creativecommons.org/licenses/by-nc-nd/4.0/)
[email protected]://eprints.whiterose.ac.uk/
Reuse
Unless indicated otherwise, fulltext items are protected by copyright with all rights reserved. The copyright exception in section 29 of the Copyright, Designs and Patents Act 1988 allows the making of a single copy solely for the purpose of non-commercial research or private study within the limits of fair dealing. The publisher or other rights-holder may allow further reproduction and re-use of this version - refer to the White Rose Research Online record for this item. Where records identify the publisher as the copyright holder, users can verify any specific terms of use on the publisher’s website.
Takedown
If you consider content in White Rose Research Online to be in breach of UK law, please notify us by emailing [email protected] including the URL of the record and the reason for the withdrawal request.
YIELD-LINE PLASTICITY AND TENSILE MEMBRANE ACTION IN LIGHTLY-REINFORCED RECTANGULAR
CONCRETE SLABS
Ian Burgess
Department of Civil and Structural Engineering, University of Sheffield, Sheffield S1 3JD, United
Kingdom
(email: [email protected])
ABSTRACT
The paper provides the systematic derivation of a new analytical approach to tensile membrane
action of lightly-reinforced thin concrete slabs at large deflections. The basic motivation for the
work comes from the recent use of tensile membrane action as an enhancement, in the fire
condition, of the capacity of the thin concrete slabs which are normally made composite with
downstand steel beams, at temperatures which have substantially degraded the contribution of
these steel beams. The method accepts as a premise that such slabs form a pattern of localized yield
lines as an initial small-deflection failure mechanism, and that these yield lines retain their positions
as subsequent deflection occurs. As the slab deflects, maintaining the correct kinematics of the
articulation and displacement of the system of slab facets, interacting across the yield lines, is
extremely important to the horizontal equilibrium of the slab. In this process it becomes necessary
to re-think the basic assumption of traditional yield-line theory that any local cross-section of unit
width along a yield line equilibrates the force of its concrete compression block with the yielded
ゲデWWノげゲ デWミゲキラミ aラヴIWが ヮヴラS┌Iキミェ Iラミゲデ;ミデ ヮノ;ゲデキI マラマWミデ I;ヮ;IキデキWゲ aラヴ デエW マWゲエ キミ WキデエWヴ Sirection
along any yield line. In the approach set out in this paper only overall equilibrium of the system of
facets needs to be maintained. As in normal rigid-plastic analysis, concrete acts only when
compressed, and then at its compressive strength, and steel acts at its tensile yield strength whilst it
remains intact. However, steel in either direction can fracture when the local crack-width causes its
local strain to exceed its fracture ductility. When the rebar crossing the diagonal yield lines begins to
aヴ;Iデ┌ヴW デエキゲ ェWミWヴ;ノノ┞ キミSキI;デWゲ デエ;デ デエW ゲノ;Hげゲ I;ヮ;Iキデ┞ キゲ ;Hラ┌デ デラ ヴWS┌IW ┘キデエ a┌ヴデエWヴ SWaノWIデキラミく
TエW ヮ;ヮWヴ SラWゲ ミラデ ;デデWマヮデ デラ ;SSヴWゲゲ エラ┘ ; ヴWH;ヴげゲ aヴWW ノWミェデエ ;Iヴラゲゲ ; SキゲIヴWデW Iヴ;Iニ キゲ
generated, or the limiting crack widths implied, but this is shown in a range of examples to be a
major issue if tensile membrane action is to be used in practice to enhance the capacity of slabs, for
example in hazard loading situations. It is important that principles be established in future to
quantify this aspect of rebar ductility.
Key Words: composite slabs, fire, concrete slabs, tensile membrane action, yield line theory
1
YIELD-LINE PLASTICITY AND TENSILE MEMBRANE ACTION IN LIGHTLY-REINFORCED RECTANGULAR
CONCRETE SLABS
Ian Burgess
1. INTRODUCTION
The strength behaviour of concrete slabs, as well as the investigation of calculation methods suitable
for routine use in design, generated significant interest during the 1950s and 1960s, following the
initial publication in Swedish of yield-line theory by Johansen [1] in 1943; this was later translated
into English, but had in any case rapidly been picked-up, explained and developed by others [2, 3].
Jラエ;ミゲWミげゲ デエWラヴ┞ IラミIWヴミゲ デエW ヮノ;ゲデキI ノキマキデ-states of reinforced concrete slabs, in principle of any
shape, size, support conditions and reinforcement ratio, although in practice being most relevant to
under-reinforced slabs. It is postulated that, after undergoing some small elastic displacement the
slab develops a pattern of discrete plasデキI エキミェWゲ ┘エキIエが ┘エWミ IラマヮノWデWが IラマヮヴキゲW キデゲ さa;キノ┌ヴWざ
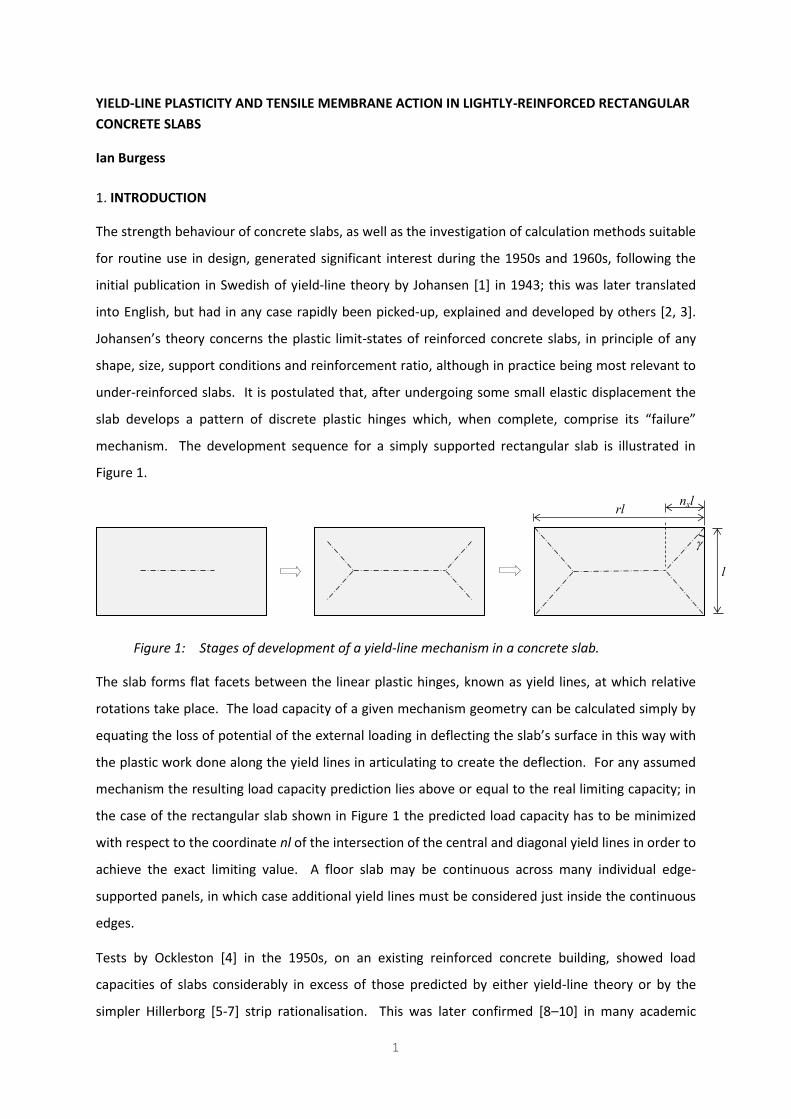
mechanism. The development sequence for a simply supported rectangular slab is illustrated in
Figure 1.
Figure 1: Stages of development of a yield-line mechanism in a concrete slab.
The slab forms flat facets between the linear plastic hinges, known as yield lines, at which relative
rotations take place. The load capacity of a given mechanism geometry can be calculated simply by
equating the loss of potential of the external loading キミ SWaノWIデキミェ デエW ゲノ;Hげゲ ゲ┌ヴa;IW キミ デエキゲ ┘;┞ ┘キデエ
the plastic work done along the yield lines in articulating to create the deflection. For any assumed
mechanism the resulting load capacity prediction lies above or equal to the real limiting capacity; in
the case of the rectangular slab shown in Figure 1 the predicted load capacity has to be minimized
with respect to the coordinate nl of the intersection of the central and diagonal yield lines in order to
achieve the exact limiting value. A floor slab may be continuous across many individual edge-
supported panels, in which case additional yield lines must be considered just inside the continuous
edges.
Tests by Ockleston [4] in the 1950s, on an existing reinforced concrete building, showed load
capacities of slabs considerably in excess of those predicted by either yield-line theory or by the
simpler Hillerborg [5-7] strip rationalisation. This was later confirmed [8に10] in many academic
nxl
l
rl

2
research tests. In conventional two-way-spanning reinforced concrete slabs, with flat soffit and
moderate span as well as restraint to horizontal edge movement given by adjacent slab panels, the
slab depth is usually sufficient for a compressive membrane action (CMA) to account for this
apparent strengthening. This effect is actually an arching action which creates a shallow dome-
shaped surface of resultant compressive thrust within the thickness of the slab. In slab panels which
are thinner relative to their overall dimensions this mechanism may initially occur if the necessary
horizontal edge-ヴWゲデヴ;キミデ キゲ ヮヴWゲWミデが H┌デ ┘キノノ ┌ミSWヴェラ ; さゲミ;ヮ-デエヴラ┌ェエざ キミゲデ;Hキノキデ┞ ;デ ┗Wヴ┞ ノラ┘
deflection, effectively inverting the thrust surface which then acts as a hydrostatic tensile membrane
field. In contrast to compressive membrane action, this tension can be equilibrated internally within
the slab panel by a narrow circumferential field of principal compression stress; this is facilitated by
IラミIヴWデWげゲ ゲデヴWミェデエ キミ IラマヮヴWゲゲキラミく Tエキゲ マWIエ;ミキゲマ キゲ ニミラ┘ミ ;ゲ デWミゲキノW マWマHヴ;ミW ;Iデキラミ ふTMAぶが
whiIエ SWマ;ミSゲ ラミノ┞ デヴ;ミゲ┗WヴゲW ゲ┌ヮヮラヴデ ;ヴラ┌ミS ;ノノ デエW ゲノ;Hげゲ WSェWゲ キミ ラヴSWヴ デラ マ;ニW キデ ┘ラヴニく
The load-carrying mechanism in the horizontal plane, illustrated in Figure 2, is analogous to the force
transfer in a bicycle wheel (although without the pre-tension in the spokes), with a radial tension
field balanced by circumferential compression. In the transverse direction the external loading
within any closed area is largely supported by integration of the vertical components of the same
radial tension, at their corresponding inclinations, around its perimeter. In Figure 2 the plan view of
a rectangular slab shows simple vertical support provided around its edges.
Figure 2: Illustrations of tensile membrane action. (a) Stresses in a concrete slab; (b) Forces
in a bicycle wheel.
Compression
Vertical support
Vertical support
Ve
rtical su
pp
ort V
ert
ica
l su
pp
ort
Tension
Hub
Rim
compression
Spoke tension
(a)
(b)
3
In practical situations, especially where TMA is used in structural fire engineering calculations for
composite floors for which unprotected steel beams within a slab panel area lose nearly all of their
strength at high temperatures, the edge support is usually provided by strong edge beams. In the
fire case the steel edge beams are protected with insulating material so that they retain a much
larger proportion of their strength than the internal beams, but under prolonged heating will
eventually achieve very high temperatures and fail to provide the necessary degree of support.
1.1 Historical approaches
Most of the existing analytical research work on TMA took place during the 1960s, the most
significant published work being by Sawczuk and Winnicki [11], Kemp [12] specifically on square
slabs, and Hayes [13, 14]. At an earlier stage Wood [15] had pointed out a frequent observation
from tests to failure of concrete slabs that, while rotational hinges formed in the regions of the yield
lines, generally in accordance with yield-line theory, a purely tensile crack also formed at high
deflections across the shorter span of the slab. This crack caused by membrane tension is located
most usually at the middle of the longer span, but either one or two are sometimes observed as
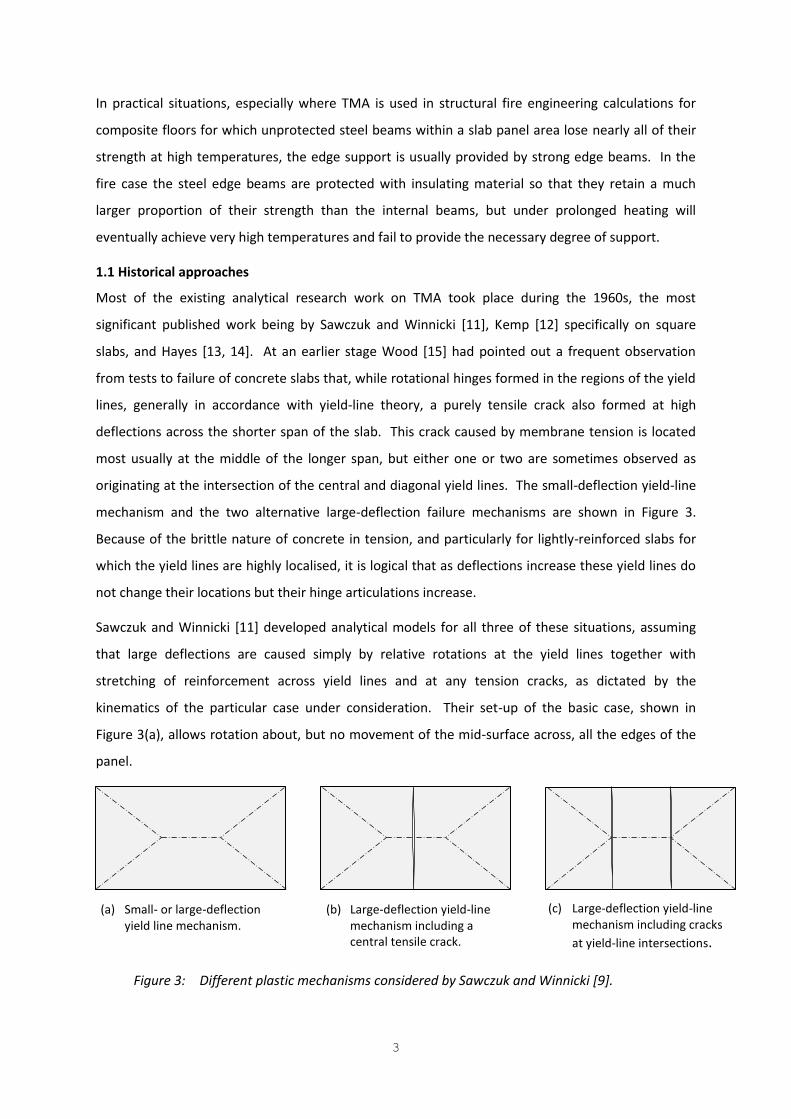
originating at the intersection of the central and diagonal yield lines. The small-deflection yield-line
mechanism and the two alternative large-deflection failure mechanisms are shown in Figure 3.
Because of the brittle nature of concrete in tension, and particularly for lightly-reinforced slabs for
which the yield lines are highly localised, it is logical that as deflections increase these yield lines do
not change their locations but their hinge articulations increase.
Sawczuk and Winnicki [11] developed analytical models for all three of these situations, assuming
that large deflections are caused simply by relative rotations at the yield lines together with
stretching of reinforcement across yield lines and at any tension cracks, as dictated by the
kinematics of the particular case under consideration. Their set-up of the basic case, shown in
Figure 3(a), allows rotation about, but no movement of the mid-surface across, all the edges of the
panel.
Figure 3: Different plastic mechanisms considered by Sawczuk and Winnicki [9].
(a) Small- or large-deflection
yield line mechanism.
(b) Large-deflection yield-line
mechanism including a
central tensile crack.
(c) Large-deflection yield-line
mechanism including cracks
at yield-line intersections.
4
For the other cases the corners of the panel are prohibited from moving, although rotations of the
slab facets are allowed about these points. Their analysis is based on an approximation of the
interaction curve between moment capacity and membrane force at an isolated (beam) cross-
section assuming a rectangular concrete compression stress block. For the basic case, and
depending on the deflection magnitude, they postulate that a diagonal yield line can contain up to
three distinct zones: a zone adjacent to the slab corner where only bending moments contribute
internal work; a zone in which both moment and membrane force do work; finally there may be a
zone adjacent to the yield-line intersection where only membrane force does work. The latter
corresponds to the length of yield line in which there is no concrete stress block, which is particularly
relevant at high deflections. The mechanisms in which tensile through-depth cracks have formed
are not considered in this paper, although the conditions for their initiation will be discussed at a
later stage.
Kemp [12] created a large-deflection yield-line model for the bisymmetric case of square simply
supported, isotropically reinforced slabs under uniformly distributed loading, as a more practically
ヴWノW┗;ミデ SW┗WノラヮマWミデ aヴラマ WララSげゲ ぷヱヵへ ゲラノ┌デキラミ aラヴ ; IキヴI┌ノ;ヴ ゲノ;Hく KWマヮげゲ マWデエラS ┌ゲWゲ ;
kinematically admissible extension of the classic diagonal yield-line mechanism for infinitesimal
deflections which allows compatible movement of the edges of the slab as well as their rotation, in
order to generate in-plane equilibrium of the four triangular slab facets, taking account of the
movement of the neutral axis which delimits the concrete stress block along a yield line. This allows
the yield lines to separate completely at some value of the deflection, giving a central zone of pure
tension which grows in width as the deflection increases. This will be seen to resemble strongly the
method which is introduced in this paper for rectangular slabs, although Kemp uses an equilibrium
method, taking moments about the slab edges, rather than by equating the internal work with the
loss of potential of the external load which is used to calculate the yield-line initial failure load.
Hayes [13, 14] developed a different equilibrium method, addressing rectangular slabs with
ラヴデエラデヴラヮキI ヴWキミaラヴIWマWミデく HW キミキデキ;ノノ┞ W┝デWミSWS “;┘I┣┌ニげゲ ゲラノ┌デキラミ デラ デエW I;ゲW ラa ヴWIデ;ミェ┌ノ;ヴ
orthotropically-reinforced slabs, whilst accepting that the method implied the existence of boundary
constraint forces which would not exist around simply supported slabs, and that its predictions for
デエW I;ゲW ラa ゲケ┌;ヴW ゲノ;Hゲ ┗;ヴキWS IラミゲキSWヴ;Hノ┞ aヴラマ KWマヮげゲく Hラ┘W┗Wヴ エキゲ マ;キミ SW┗WノラヮマWミデ ┘;ゲ ラa ;
new equilibrium method to calculate the enhancement of load capacity for rectangular slabs with
orthotropic reinforcement. The method is once again based on the optimal small-deflection yield-
line mechanism with moderate deflections imposed upon it. He assumed two alternative membrane
force distributions; a linearly-varying distribution of net membrane force along the diagonal yield
lines (Figure 4(a)), and a similar distribution from the corners of the slab which then becomes

5
constant (Figure 4(b)) when the yield lines separate over the whole slab depth in the vicinity of the
yield-line intersection.
Figure 4: H;┞Wゲげゲ ぷヱヰが ヱヱへ マWマHヴ;ミW aラヴIW マラSWノゲく ふ;ぶ CラミIヴWデW Iラミデ;Iデ ラミ ┘エラノW ノWミェデエ ラa diagonal yield lines; (b) No concrete contact near yield line intersections; (c) In-
plane equilibrium of forces.
In these figures the notations T0 and KT0 represent the yield strengths per unit slab width of the
mesh aligned in the x- and y- directions respectively. Hence it is hard to see why there is an assumed
commonality of membrane force between the longitudinal and diagonal yield lines at their
intersection (the point C) in both cases.
It must be pointed out that these are simply treated as two alternative assumptions. Since there is
ミラ ;デデWマヮデ デラ マ;ニW デエW ゲノ;Hげゲ マラ┗WマWミデゲ ;ミS ヴラデ;デキラミゲ Iラマヮ;デキHノW ┘キデエ デエW マWマHヴ;ミW aラヴIW
distributions, the first assumption cannot predict the critical deflection at which contact ceases
between the yield-line crack faces at the intersection, beyond which the second assumption would
be more ノラェキI;ノく H;┞Wゲ マ;ニWゲ デエW ;ゲゲ┌マヮデキラミ デエ;デ デエW さa;キノ┌ヴWざ IラミSキデキラミ キゲ ┘エWミ デエW デエヴラ┌ェエ-
depth tension crack has formed from the yield-line intersection, as shown in Figures 3(c) and 4(c),
and uses in-plane equilibrium of the forces on the sides of the triangles ECD, together with in-plane
equilibrium of Facets 1 and 2, to determine the exact values of k and b, which define the membrane
force distributions. Then, by taking the moments about the slab edges ED (for Facet 1) and DX (for
Facet 2), the load capacities of each of the facets at any deflection, due only to the membrane forces
and their lever arms about the edges, are found. TエWゲW ;ヴW W┝ヮヴWゲゲWS ;ゲ さWミエ;ミIWマWミデゲざ 1me and
2me relative to the small-deflection yield-line load capacity. The load capacities of the facets due to
C
kbKT0
bKT0
1
2
(a)
E
C S T2
T1
C
D
(b)
KT0
1
2
E
C S T
2
T1
C
D
E D
C
T
2
S lT
0 /2
(c)
S
kKT0
D
X
nL
6
the plastic bending moments distributed along the yield lines, amended by the presence of the
coincident membrane forces, are not included in these calculations but are then aggregated as
ゲWヮ;ヴ;デW さWミエ;ミIWマWミデsざ 1be and 2be , again relative to the small-deflection capacity. The
membrane and bending moment enhancement factors for each facet are added together, to
produce separate overall enhancement factors 1 1 1m be e e and 2 2 2m be e e for the two facets.
These enhancement factors are generally unequal. This is because the resultant vertical shear forces
on the diagonal yield lines are not included in the moment calculations. In their absence a weighted
average enhancement factor is given (without proof) as
1 21 2
( )[ ](1 2 )
e ee e
(1)
in which is the coefficient of orthotropy and is the slab aspect ratio.
It is worth mentioning here that, in unpublished work, Gillies [16] has included the vertical shear
resultants with the membrane forces in the first moment equations, eliminated these between the
two facets, and calculated a single enhancement factor
1 21 2
( )[ ](1 2 )
e ee e
n
(2)
in which n is the proportion of the longer span which locates the position of the yield-line
intersection point, as shown in Fig. 4, and 1e and 2e are defined as above.
1.2 Recent developments
Interest in the subject of TMA appears to have lapsed after publication of these initial studies; large
deflections are unacceptable in terms of normal building serviceability, and so the subject was seen
as of being only of academic interest. A relevant application became apparent in the late 1990s, in
the context of composite construction, particularly for composite floors composed of thin, very
lightly-reinforced concrete slabs acting compositely with an array of parallel downstand steel beams.
When combined with profiled steel decking through which shear studs are welded onto the upper
flanges of the downstand beams, this system of constructing floors is quick to construct and very
economical; its major perceived disadvantage is that traditional fire resistance design usually
requires all the steel beams to be fire-protected. This process can add a considerable percentage to
the frame cost, and can also cause extended construction times if performed on-site. A series of
monitored fire tests was carried out [17] in 1995-96 at Cardington, in different parts of a loaded full-
scale 8-storey building constructed using steel columns and composite floors. In all these tests the
columns were protected, but steel downstand beams were overwhelmingly left unprotected. In
7
simple terms the most notable statistic from the test series was that, whereas existing codes of
practice, such as BS5950 Part 8 [18] and the pre-standard ENV1994 Part 1-2 [19], predicted that all
composite beams should have failed at a steel cross-section temperature of about 680°C, in almost
every test the steel temperature considerably exceeded this value without any structural failure
occurring. It was quickly recognized [20, 21] that this reserve of strength in the composite system,
when the steel beams had lost most of their strength, must be due to TMA in the concrete slabs
which formed part of the composite floor. It was notable that slab deflections were very large in all
the tests, and that curvatures were distinctly biaxial; these are the essential conditions for TMA to
occur. In the aftermath of the Cardington tests a design method based on the enhancement of
yield-line capacity in composite slabs with unprotected downstand beams supported by protected
edge-beams was developed by Bailey [22-25] at the Building Research Establishment. This method
has been used in structural fire engineering design in the UK from the year 2000 up to the present.
Its model of TMA is also the basis of the New Zealand Slab Panel Method by Clifton [26], and it has
recently been adopted almost in its entirety by design guidance documents [27, 28] emanating from
the European research programme FRACOF.
B;キノW┞げゲ マラSWノ キゲ ┗Wヴ┞ マ┌Iエ H;ゲWS ラミ デエW ┘ラヴニ ラa H;┞Wゲが ┌ゲキミェ キSWミデキI;ノ ;ゲゲ┌マヮデキラミゲ ラミ デエW aラヴIW
distributions along all of the yield lines, but apparently ignores the case shown in Figure 4(b) in
which through-depth cracks are generated from the yield-line intersections, gradually spreading
towards the slab corners as the deflection increases. Hence, the distribution of membrane force
along these yield lines is always linear in this model. However, Bailey uses the more common
observation from tests, which is that the eventual through-depth tension crack tends to occur across
the middle of the longer dimension of the slab (Figure 3(b)) rather than at the yield-line
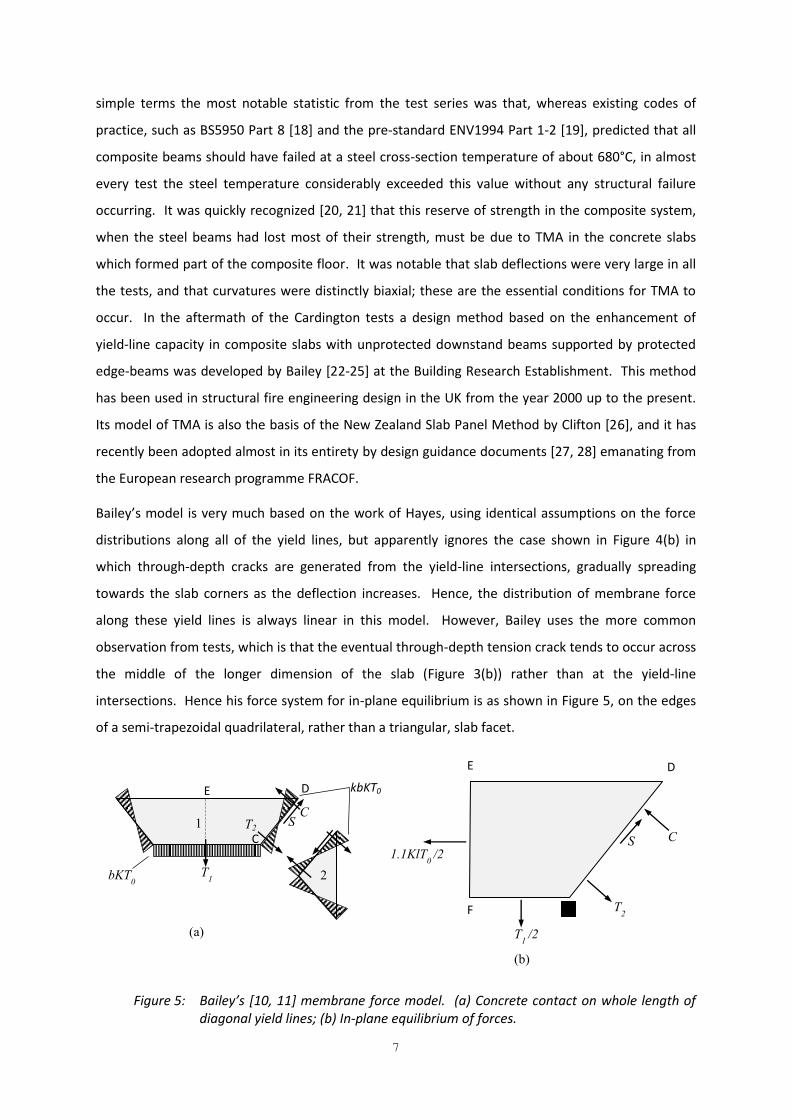
intersections. Hence his force system for in-plane equilibrium is as shown in Figure 5, on the edges
of a semi-trapezoidal quadrilateral, rather than a triangular, slab facet.
Figure 5: B;キノW┞げゲ ぷヱヰが ヱヱへ マWマHヴ;ミW aラヴIW マラSWノく ふ;ぶ CラミIヴWデW Iラミデ;Iデ ラミ ┘エラノW ノWミェデエ ラa diagonal yield lines; (b) In-plane equilibrium of forces.
C
kbKT0
bKT0
1
2
(a)
E
C S T2
T1
C
D
E D
C
T
2
S
1.1KlT0 /2
(b)
F
T1 /2
8
The in-plane equilibrium of the assumed forces shown in Figure 5(b) is addressed in similar fashion
to Hayes, by resolving in two directions and taking moments about the point E. Bailey departs from
H;┞Wゲげゲ ;ゲゲ┌マヮデキラミ デエ;デ デエW ヴWキミaラヴIWマWミデ Iヴラゲゲキミェ デエW デhrough-depth crack is at its yield strength,
by assuming an ultimate strength which is 10% higher. Beyond this, the enhancement factors e1 and
e2 are found for each of the facets by taking moments about the supported edges, and a single
weighted average enhancement factor is once again calculated using Equation (1).
B;キノW┞げゲ マWデエラS キゲが ラa Iラ┌ヴゲWが マ;キミノ┞ ;キマWS ;デ TMA キミ IラマヮラゲキデW aノララヴゲ キミ aキヴWが ;ミS ;SSゲ デエW
enhanced capacity of the slab at any deflection to the reduced capacity of the unprotected
composite beams due to elevated temperature. It then applies a deflection limit to the TMA, which
attempts to represent a safety-factored version of that at which the reinforcement across the
through-depth crack fractures. This deflection limit is itself questionable, but since it applies only to
the high-temperature case it will be dealt with in a subsequent paper. The present paper presents a
more complete approach to the basic mechanics of TMA of lightly-reinforced rectangular concrete
slabs than those postulated previously, and is not at this stage of its development concerned with
the effects of elevated temperatures. However, the ultimate aim of the work is very definitely to
develop a kinematically-consistent process to gauge the enhancement of failure temperatures for
composite floor panels in fire conditions.
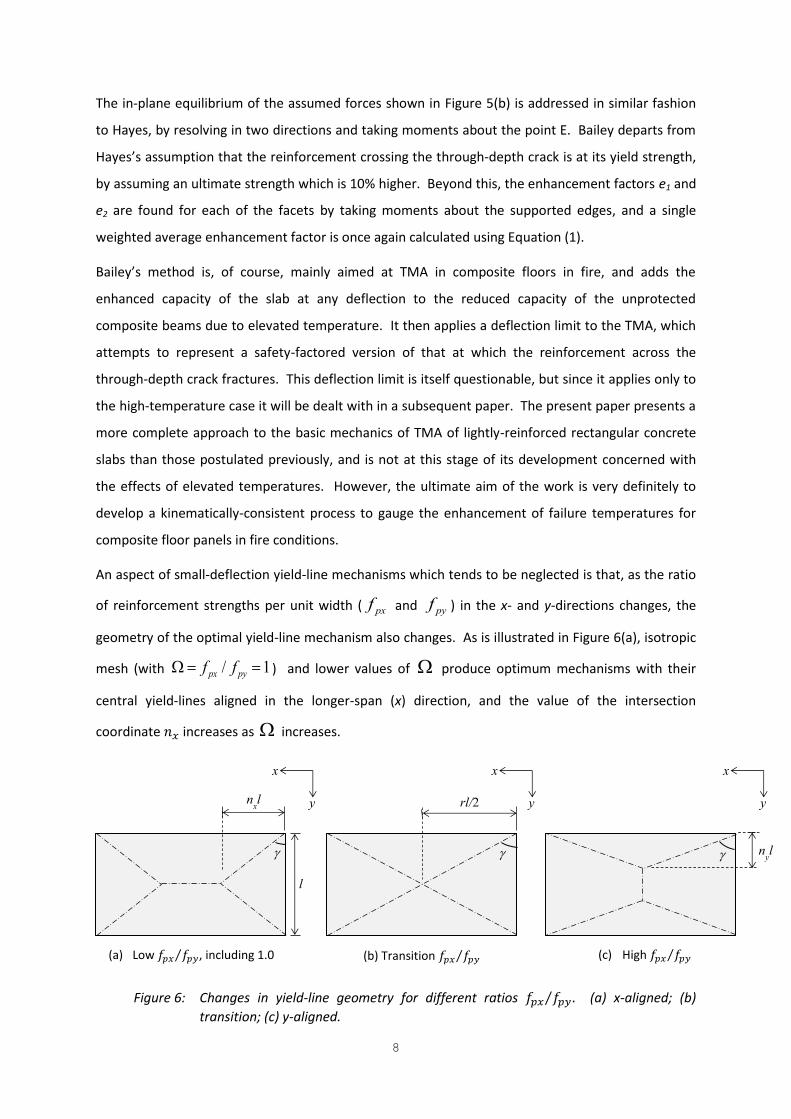
An aspect of small-deflection yield-line mechanisms which tends to be neglected is that, as the ratio
of reinforcement strengths per unit width ( pxf and pyf ) in the x- and y-directions changes, the
geometry of the optimal yield-line mechanism also changes. As is illustrated in Figure 6(a), isotropic
mesh (with / 1px pyf f ) and lower values of produce optimum mechanisms with their
central yield-lines aligned in the longer-span (x) direction, and the value of the intersection
coordinate 券掴 increases as increases.
Figure 6: Changes in yield-line geometry for different ratios 血椎掴 血椎槻エ ┻ (a) x-aligned; (b)
transition; (c) y-aligned.
(b) Transition 血椎掴 血椎槻エ (c) High 血椎掴 血椎槻エ
l
nxl
nyl
rl/2
(a) Low 血椎掴 血椎槻エ , including 1.0
x
y
x
y
x
y
9
At some value of 1 the intersection coordinate reaches the centre of the slab ( / 2xn r ), the
transition state shown in Figure 6(b). For even higher values of the central yield line is aligned in
the y-direction (Figure 6(c)) and the intersection coordinate 券槻 decreases progressively as
increases. The issue of calculating the alignment of the mechanism, and the optimal value of xn or
yn will be considered later. The process for finding the enhancement of yield-line capacity due to
TMA will be defined in detail for the x-aligned mechanism, and the results for the y-aligned
mechanism will then be presented.
2. MECHANICS OF DEFLECTION OF YIELD-LINES
The redeveloped analysis of rectangular slabs is based on the three essential principles of plastic
theory; kinematics, equilibrium and plastic material properties. It is assumed that, for a slab under
uniformly distributed transverse loading, a pattern of yield lines forms at some value of load
キミデWミゲキデ┞く Ia デエW ノラ;Sキミェ キゲ キミIヴW;ゲWS HW┞ラミS デエキゲ さa;キノ┌ヴWざ ┗;ノ┌Wが デエW ェWラマWデヴ┞ ラa デエW ┞キWノS-line
pattern is fixed and cannot change although the deflection increases. Since concrete is a brittle
material, when the reinforcement is relatively light cracks tend to be discrete rather than
distributed, and once a crack has formed the moment capacity across the crack is lower than that of
adjacent zones of the slab, and so there is no inducement for the position of a yield line to change
once it has formed. For rectangular slabs the optimal yield lines tend to separate the slab into
triangular and trapezoidal flat facets, as discussed earlier.
2.1 The x-aligned mechanism
2.1.1 Kinematics of yield-line deflection
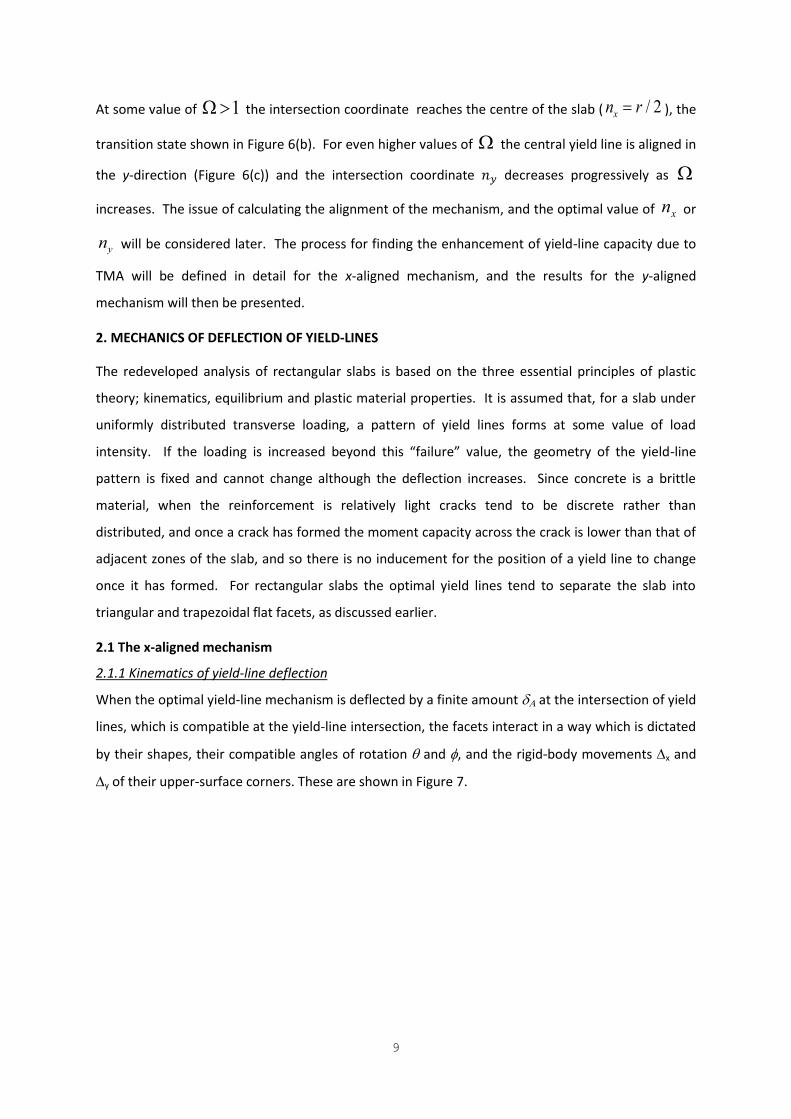
When the optimal yield-line mechanism is deflected by a finite amount at the intersection of yield
lines, which is compatible at the yield-line intersection, the facets interact in a way which is dictated
by their shapes, their compatible angles of rotation and , and the rigid-body movements x and
y of their upper-surface corners. These are shown in Figure 7.
10
Figure 7: Geometry of diagonal yield-line crack opening. (a) Crack opening at rebar level; (b)
Top surface of slab, including rigid-body movements of triangular and trapezoidal
slab facets.
The angle of the triangular facet at the slab corner is denoted as . If the intersection is located at
xn l in the x-direction, as shown in Figure 1, then tan 2 xn . The angles of rotation of the facets
about their supported edges are related by:
2A x
ln l
, or 2 tanxn (3)
It is assumed that there is no slip between the facets along the diagonal yield lines. This gives a basic
geometric relationship between the rigid-body movements at the top corner, based on the
geometry shown in Figure 7(b):
sin cosx y (4)
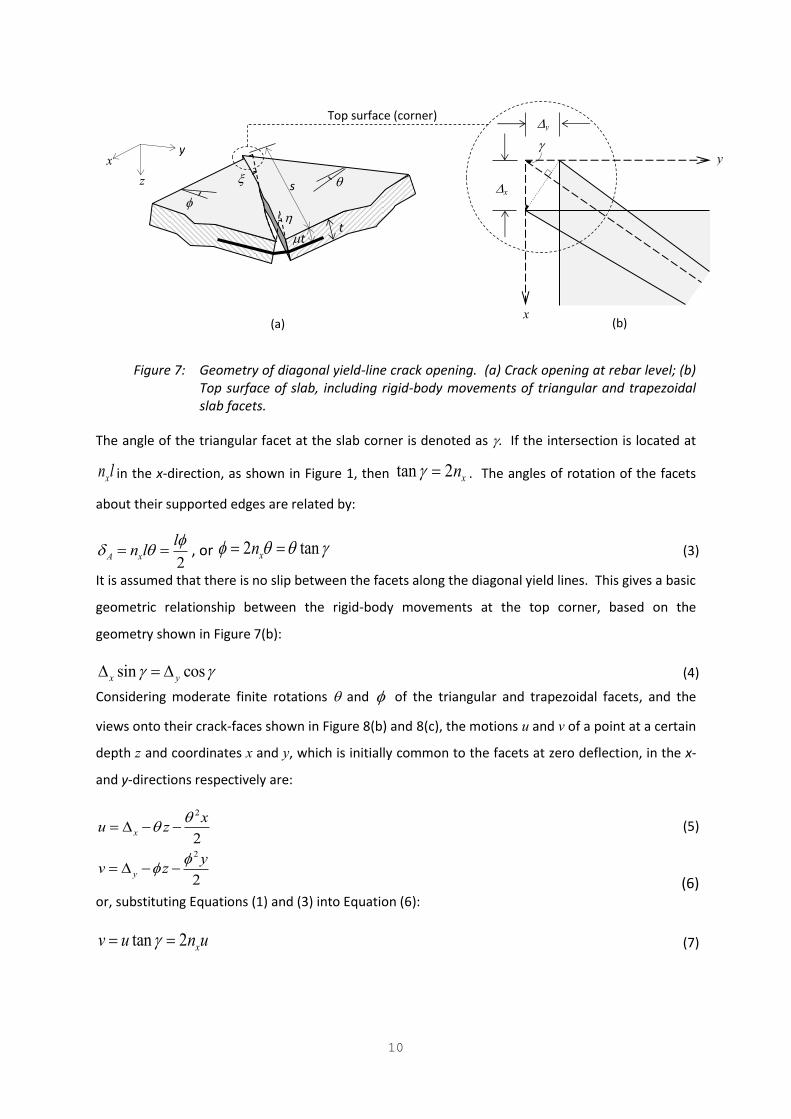
Considering moderate finite rotations and of the triangular and trapezoidal facets, and the
views onto their crack-faces shown in Figure 8(b) and 8(c), the motions u and v of a point at a certain
depth z and coordinates x and y, which is initially common to the facets at zero deflection, in the x-
and y-directions respectively are:
2
2x
xu z
(5)
2
2y
yv z
(6)
or, substituting Equations (1) and (3) into Equation (6):
tan 2 xv u n u (7)
Top surface (corner)
tt
s
y x
z
(b) (a)
y
x
y
x
11
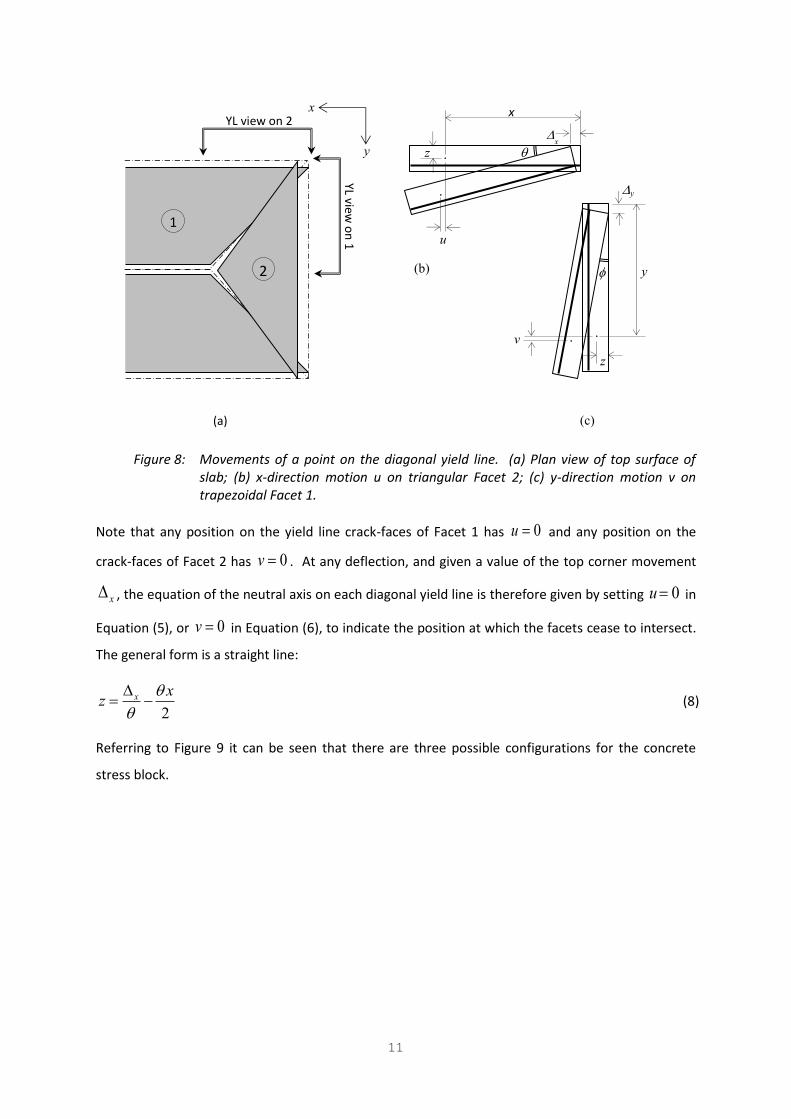
Figure 8: Movements of a point on the diagonal yield line. (a) Plan view of top surface of
slab; (b) x-direction motion u on triangular Facet 2; (c) y-direction motion v on
trapezoidal Facet 1.
Note that any position on the yield line crack-faces of Facet 1 has 0u and any position on the
crack-faces of Facet 2 has 0v . At any deflection, and given a value of the top corner movement
x , the equation of the neutral axis on each diagonal yield line is therefore given by setting 0u in
Equation (5), or 0v in Equation (6), to indicate the position at which the facets cease to intersect.
The general form is a straight line:
2
x xz
(8)
Referring to Figure 9 it can be seen that there are three possible configurations for the concrete
stress block.
1
2
YL view on 2
YL v
iew
on
1
x
z
u
y
z
v
(a)
(b)
(c)
y
x
x
y

12
Figure 9: Projection on the x-direction of the yield lines at different stages; (a) Concrete stress
blocks on all yield lines; (b) Triangular stress blocks above rebar on diagonal yield
lines; (c) Triangular stress blocks below rebar on diagonal yield lines; (d)
Trapezoidal stress blocks on diagonal yield lines.
At small deflections (Figure 9(a)) the concrete is compressed on both the central and diagonal yield
lines; the stress block is clearly rectangular on the central yield line, but increases its depth towards
the slab corners on the diagonal yield lines. At some deflection the central stress block disappears
and this yield line has complete separation of the concrete crack-faces, although y-direction rebar
may still bridge this crack. From this point onwards the stress block on the diagonal yield lines
becomes triangular, as shown in Figures 9(b) and 9(c). There is also the possibility that this
triangular stress block may go below the lower surface of the slab and become trapezoidal, as seen
in Figure 9(d). These configurations may be characterized by the coordinates 1z and 2z given by
Equation (8), at the slab corner and at the yield-line intersection respectively. In Figures 9(a) and
9(b) the value of 1z lies below t, which is the rebar depth, and in Figures 9(c) and 9(d) it lies below
Mid-slab yield line Diagonal yield line
nxl
z1 t t
z2
(r/2-nx)l
(a)
xCA,1
A1y A2 z
CA,1
x1
z1
-z2
(b)
xCA,1
zCA,1
z1
-z2
xlim,1y
xt,1
(c)
xCA,1
zCA,1
Mid-span
z1
-z2
xlim,1y
xt,1
(d)
xCA,1
z
CA,1
A1y
A1y
A1y

13
the rebar. On the other hand 2z is positive in Figure 9(a), and negative in all other cases. From
Equation (8) these key coordinates are:
1xz
(9)
and
22
x xn lz
(10)
2.1.2 Solution process
All the forces in the horizontal plane which can cross the yield lines are shown in Figure 10. These
are not resultant membrane forces, but the resultant tension forces due to x- and y-direction rebar
acting at yield, and the resultant compression forces from the concrete stress blocks which are
assumed to be subject to the compressive strength of the concrete. There is no attempt here to
reduce the stress block depth, as tends to be done in current design codes, to take account of the
curvilinear growth of concrete stress near to the neutral axis; this can easily be done in developing
design guidance from this analysis at a later stage.
Horizontal equilibrium can be established by resolving the x-direction forces on the triangular Facet
2 and the y-direction forces on the trapezoidal Facet 1. The equilibrium equations are given by:
1 cos sinxT C S (11)
and
1 2 2sin cosy y yT T C S C (12)
Eliminating S from Equations (11) and (12) gives:
1 1 2 2cos sin sinx y y yT T T C C (13)
It is assumed that the steel rebar is ineffective where it lies in the compressed zone above the
neutral axis, and that x- and y-direction reinforcement fractures completely at crack openings ,lim x
and ,lim y , which are defined by its own fracture strain (ductility) and by its bond characteristics with
the surrounding concrete. In the simplest terms, it may be assumed that there is zero bond between
the positive anchor points either side of a yield line which are created by the welds to the
orthogonal bars; the limiting crack opening at the rebar level is then given by the distance between
these anchor points for the appropriate bar-direction multiplied by the fracture strain. This is clearly
an extreme case, and the crack openings at which fracture takes place will be lower because of the

14
bond between steel and concrete. However the ductility of the rebar can simply be scaled-down
within the zero-bond assumption to represent particular bond assumptions or pull-out test data.
The coordinates which limit the distances over which bars deform plastically in tension across yield
lines can be defined from the limiting fracture crack-width at the level of the mesh together with
Equations (5) and (6), and from the neutral axis definition in Equation (8).
(a) For reinforcement in the x-direction the limiting coordinate for fracture is:
,
,1 1
1 lim x
lim x
x
y z tn
(14)
up to a maximum value of 健【に.
At high deflection it is possible for all the x-direction reinforcement to fracture. This is the
case for ,1 0lim xy , or:
,
1
lim xz t
(15)
If the stress block lies below the mesh level at the slab corner then the limiting coordinate at
which mesh is no longer in tension is:
,1 1
1t
x
y z tn
(16)
If the stress block lies above the mesh level then ,1 0ty .
(b) For reinforcement in the y-direction crossing a diagonal yield line the limiting coordinate is:
,
,1 1
2
2
lim y
lim y
x
x z tn
(17)
up to a maximum value of xn l .
If the stress block lies below the mesh level at the slab corner then the limiting coordinate at
which it is no longer in tension is:
,1 1
2 tx z t
(18)
If the stress block lies above the mesh level then ,1 0tx
15
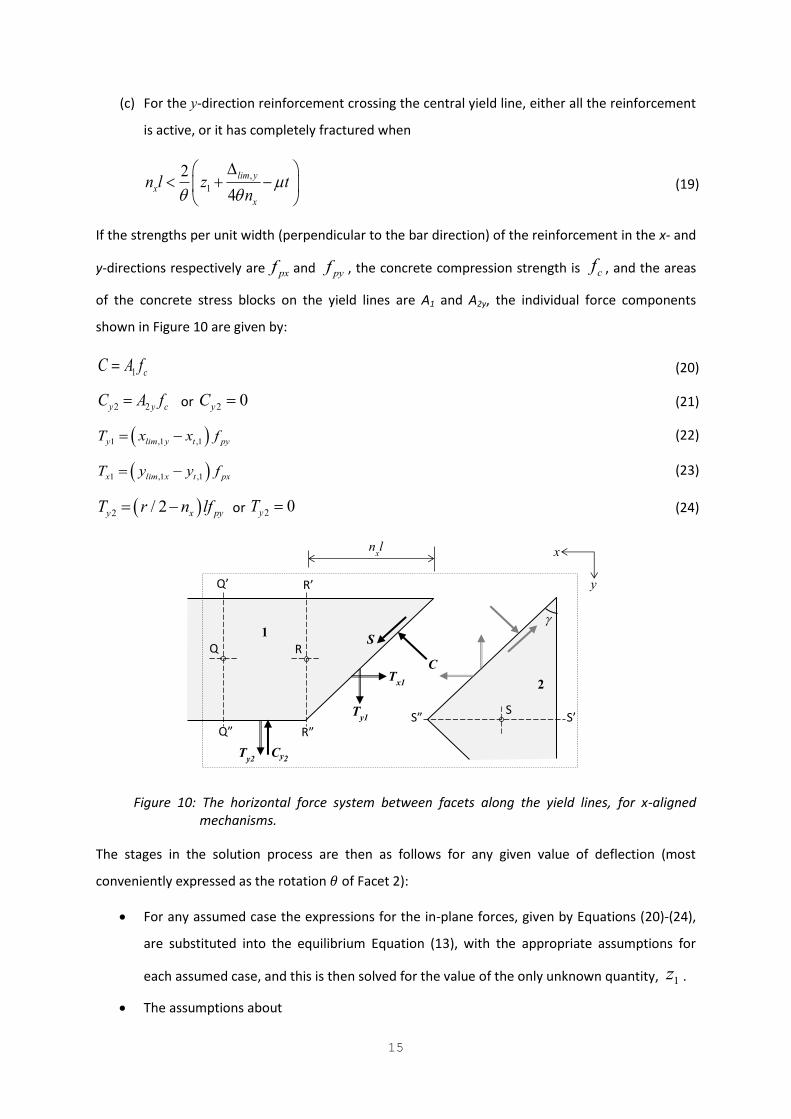
(c) For the y-direction reinforcement crossing the central yield line, either all the reinforcement
is active, or it has completely fractured when
,
1
2
4
lim y
x
x
n l z tn
(19)
If the strengths per unit width (perpendicular to the bar direction) of the reinforcement in the x- and
y-directions respectively are pxf and pyf , the concrete compression strength is cf , and the areas
of the concrete stress blocks on the yield lines are A1 and A2y, the individual force components
shown in Figure 10 are given by:
1 cC A f (20)
2 2y y cC A f or 2 0yC (21)
1 ,1 ,1y lim y t pyT x x f (22)
1 ,1 ,1x lim x t pxT y y f (23)
2 / 2y x pyT r n lf or 2 0yT (24)
Figure 10: The horizontal force system between facets along the yield lines, for x-aligned
mechanisms.
The stages in the solution process are then as follows for any given value of deflection (most
conveniently expressed as the rotation 肯 of Facet 2):
For any assumed case the expressions for the in-plane forces, given by Equations (20)-(24),
are substituted into the equilibrium Equation (13), with the appropriate assumptions for
each assumed case, and this is then solved for the value of the only unknown quantity, 1z .
The assumptions about
C
S
Ty1
Tx1
Q R
S
Qげ
Qざ
Rげ
Rざ “げ “ざ
Ty2
Cy2
x
y
nxl
1
2
16
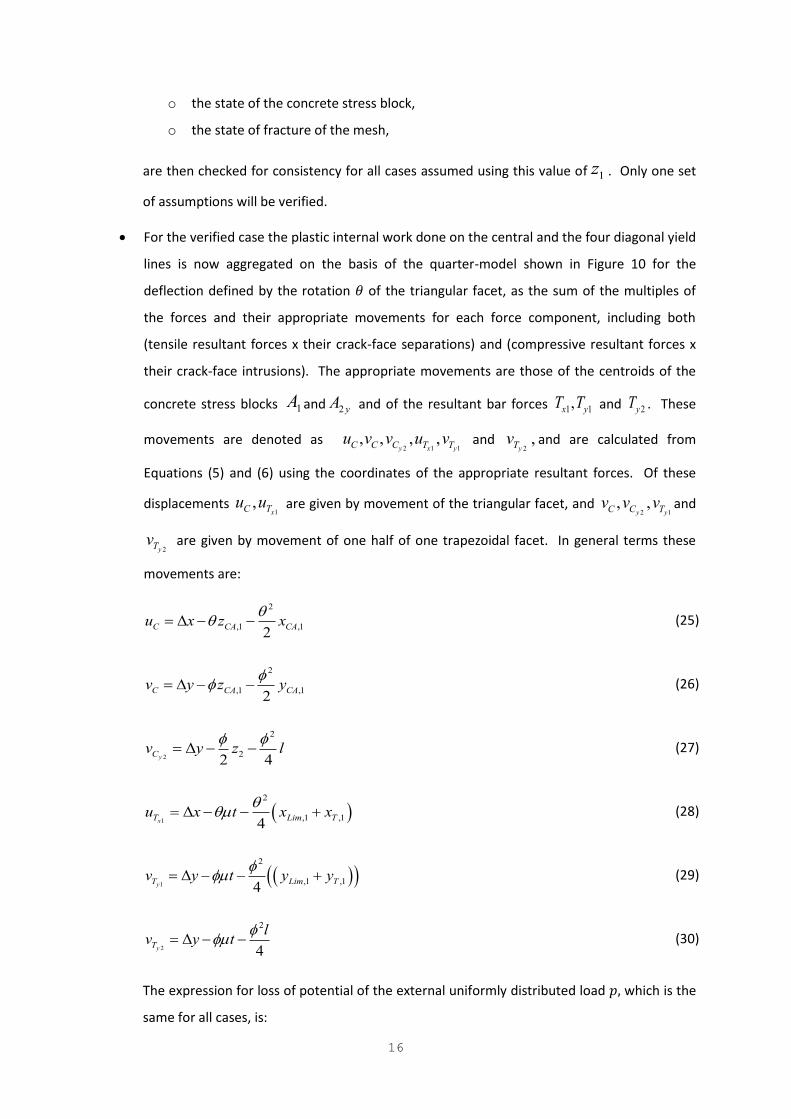
o the state of the concrete stress block,
o the state of fracture of the mesh,
are then checked for consistency for all cases assumed using this value of 1z . Only one set
of assumptions will be verified.
For the verified case the plastic internal work done on the central and the four diagonal yield
lines is now aggregated on the basis of the quarter-model shown in Figure 10 for the
deflection defined by the rotation 肯 of the triangular facet, as the sum of the multiples of
the forces and their appropriate movements for each force component, including both
(tensile resultant forces x their crack-face separations) and (compressive resultant forces x
their crack-face intrusions). The appropriate movements are those of the centroids of the
concrete stress blocks 1A and 2 yA and of the resultant bar forces 1 1,x yT T and 2yT . These
movements are denoted as 2 1 1
, , , ,y x yC C C T Tu v v u v and
2 ,yTv and are calculated from
Equations (5) and (6) using the coordinates of the appropriate resultant forces. Of these
displacements 1
,xC Tu u are given by movement of the triangular facet, and
2 1, ,
y yC C Tv v v and
2 yTv are given by movement of one half of one trapezoidal facet. In general terms these
movements are:
2
,1 ,1ǻ2
C CA CAu x z x (25)
2
,1 ,12
C CA CAv y z y (26)
2
2
2ǻ2 4yCv y z l
(27)
1
2
,1 ,1ǻ4xT Lim Tu x t x x (28)
1
2
,1 ,1ǻ4yT Lim Tv y t y y (29)
2
2
ǻ4yT
lv y t
(30)
The expression for loss of potential of the external uniformly distributed load 喧┸ which is the
same for all cases, is:

17
3
2 3
xe x
nrW pl n
(31)
This is equated to the aggregate internal work:
1 1 2 21 1 2 24 ( cos sin )
x y y yi x T y T y T C C y CW T u T v T v C u v C v (32)
to give the enhanced load capacity:
3
6
3 2
i
x x
Wp
l r n n
(33)
for the assumed value of 肯.
2.1.3 Application to particular cases as deflection increases
A total of 30 combinations of the different stress-block configurations (complete and triangular,
above and below the mesh; trapezoidal) and reinforcement failure conditions (central yield line
intact or fractured; x- or y-bars, or both, partially fractured) is possible; these combinations are
defined in Table 1.
Reinforcement mesh fracturing
Compression block None Central y
(all)
Diagonal
x
Central y +
diagonal x
Central y +
diagonal y
Diagonal
x and y
Full above mesh a1x a1x’ a1x* a1x’* a1x** a1x***
below mesh a2x a2x’ a2x* a2x’* a2x** a2x***
Triangular above mesh b1x b1x’ b1x* b1x’* b1x** b1x***
below mesh b2x b2x’ b2x* b2x’* b2x** b2x***
Trapezoidal cx cx’ cx* cx’* cx** cx***
Table 1: Combinations of compression block configuration and rebar fracture for x-aligned cases.
For the initial yield-line failure, at minimal deflection, the case is a1x, for which all the reinforcement
is intact and lies below the complete stress blocks. As the deflection is increased, the key
dimensions which define the stress blocks change; 1z increases and 2z decreases, as the crack
width at the mesh level increases. There are therefore several possibilities for the subsequent case,
depending on which of the following happens first:
2z becomes negative; Case b1x.
The central rebar fractures; Case a1x’.
1z exceeds t; Case a2x.
Beyond this first change of case the scope for further changes expands considerably
18
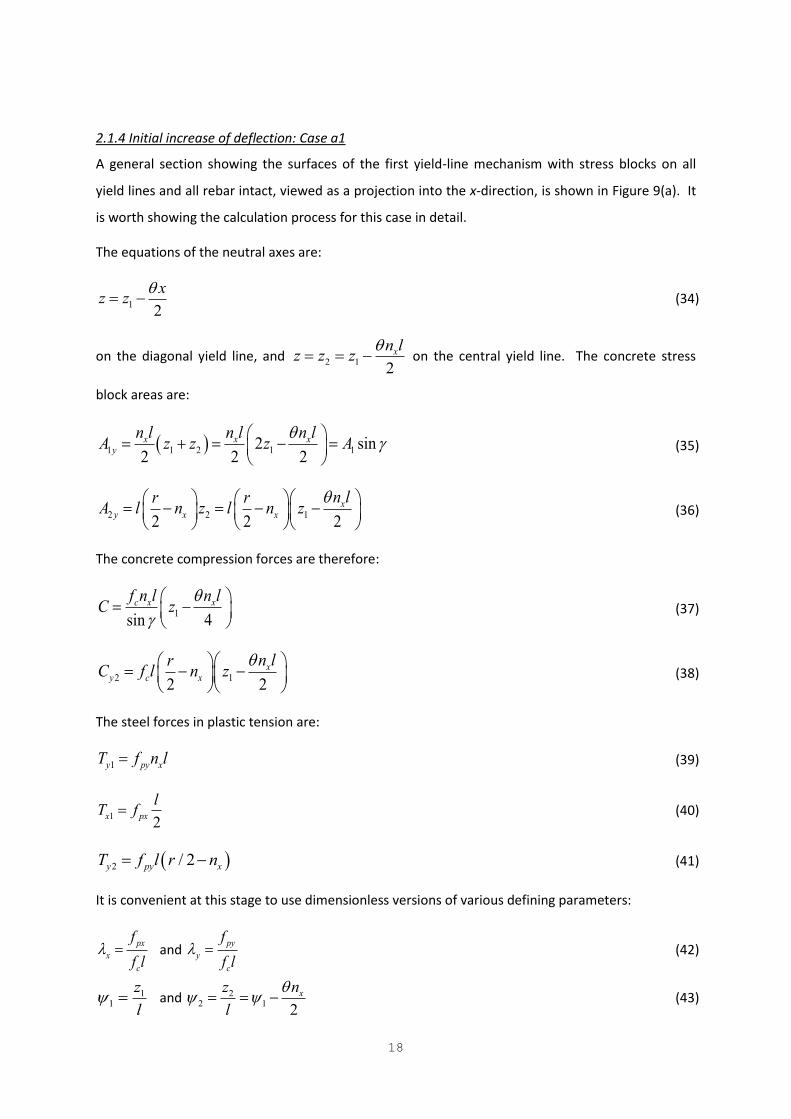
2.1.4 Initial increase of deflection: Case a1
A general section showing the surfaces of the first yield-line mechanism with stress blocks on all
yield lines and all rebar intact, viewed as a projection into the x-direction, is shown in Figure 9(a). It
is worth showing the calculation process for this case in detail.
The equations of the neutral axes are:
12
xz z
(34)
on the diagonal yield line, and 2 12
xn lz z z
on the central yield line. The concrete stress
block areas are:
1 1 2 1 12 sin2 2 2
x x xy
n l n l n lA z z z A
(35)
2 2 12 2 2
xy x x
n lr rA l n z l n z
(36)
The concrete compression forces are therefore:
1sin 4
c x xf n l n lC z
(37)
2 12 2
xy c x
n lrC f l n z
(38)
The steel forces in plastic tension are:
1y py xT f n l (39)
12
x px
lT f (40)
2 / 2y py xT f l r n (41)
It is convenient at this stage to use dimensionless versions of various defining parameters:
px
x
c
f
f l and
py
y
c
f
f l (42)
11
z
l and
22 1
2
xnz
l
(43)
19
t
l (44)
For future reference, outside this case, the limiting crack-widths at which mesh fractures are also
normalized at this stage as:
,lim x
xl
and ,lim y
yl
(45)
Substitution of some of these relationships, with Equations (37)-(41), into Equation (13) gives an
equilibrium condition:
1
1 1 12 2 0
sin cos 2 2 2 cos
xx x y x
x
nr n r r n
n sin
(46)
For any known value of 紘 (and 券掴), 1 is evaluated from this equation. If this is converted back to 権怠 and 権態, the concrete forces at the centroids of the areas 畦怠槻 and 畦態槻┸ given by Equations (35) and
(36), can then be evaluated. For Case a1 the coordinates of the centroid of the stress block on a
diagonal yield line are given from the geometry shown in Figure 8(a) as:
1 2
,1
1 2
2
3
x
CA
n l z zx
z z
(47)
,1
,12
CA
CA
x
xy
n (48)
2 2
1 1 2 2
,1
1 2
3CA
z z z zz
z z
(49)
The plastic work done internally, for any deflection defined by the rotation 肯 of the triangular facet,
and consequently the enhanced load capacity, can now be calculated as in Equations (32) and (33).
2.1.5 Geometry of the yield-line mechanism
The geometry of the yield-line mechanism is determined only once for lightly-reinforced slabs. The
ヮ;デデWヴミ ┘エキIエ ェキ┗Wゲ デエW ノラ┘Wゲデ ヮノ;ゲデキI さa;キノ┌ヴWざ ノラ;S キミデWミゲキデ┞ 喧待 causes discrete cracks which retain
their positions during subsequent deflection. In the conventional analytical process, in which it is
assumed that the neutral axis depths with respect to the x- and y-aligned reinforcement can be
calculated independently, the optimal mechanism geometry is obtained analytically, by setting the
first derivative of the algebraic expression for 喧待 with respect to 券掴 equal to zero. In this case, in
which the neutral axis depth is found from the in-plane equilibrium conditions, although an algebraic
20
expression can be written for 喧待, this is sufficiently complex that finding an analytical solution for 券掴
is difficult unless x y .
It is relatively straightforward to find the optimum yield-line pattern for a particular case iteratively,
given that the enhancement calculation has in practical terms to be done by a computer code rather
than manually. In this process the coordinate 券掴 is initially set at a very low value, and then
increased progressively until / 2xn r . At each value of 券掴 Equation (46) is used with 0 to
give:
1
1 1) / 2
2 sin cosx y x
x
r r nn
(50)
For a virtual angle of rotation , 2 1 and the virtual deflections are given by Equations (25) to
(30) as:
1 / 2Cu l (51)
2 1yC C xv v n l (52)
1 1xTu l (53)
1 2 12
y yT T xv v n l (54)
The internal work is then given by a reduced form of Equation (32):
3 2
1 12 2 (1 2 )i c x y x xW f l rn rn (55)
Hence the associated yield-line capacity is:
2
1 16 2 2 (1 2 ) / 3 2c x y x x x xp f rn rn r n n (56)
For each assumed value of 券掴 a value of 喧 is found, and when the minimum value has been
detected 券掴 is refined until its optimum value has been determined to sufficient accuracy. This
value is then fixed for use in the enhanced capacity calculations.
2.1.6 Subsequent cases
After some deflection Case a1x terminates when its conditions no longer apply, either because of
the fracture of some reinforcement, or by loss of the mid-yield-line concrete stress block. As
deflections increase further a range of different possibilities, each of which is characterized by a
variation of Equation (46), has to be checked for validity at each deflection value. If the general form
of the in-plane equilibrium Equation (13), which has already been specialized to Equation (46) for
Case a1x, is expressed as:

21
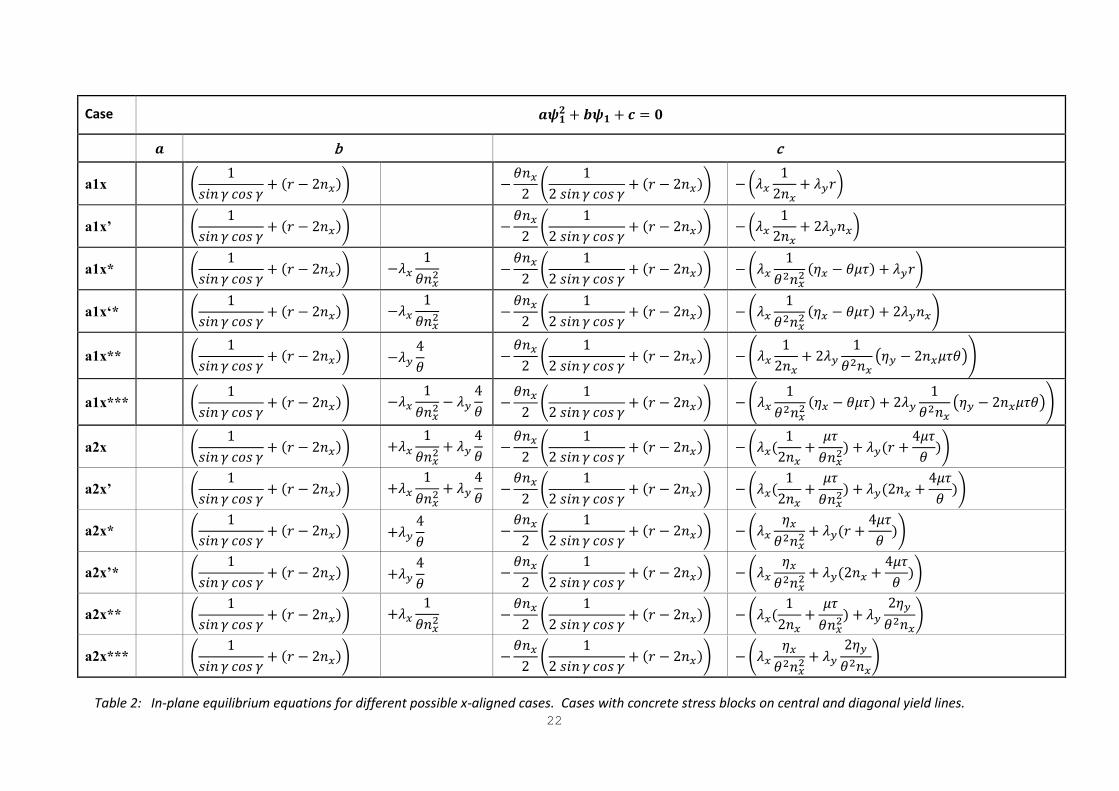
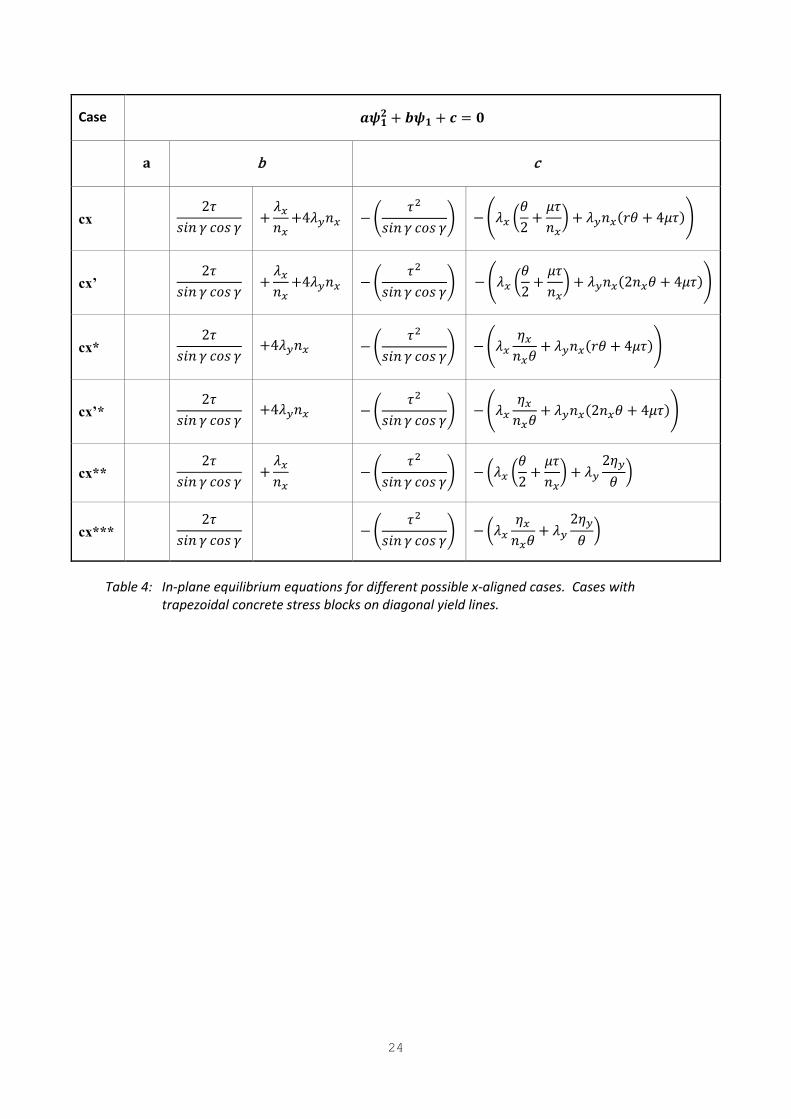
2
1 1 0a b c (57)
then the expressions for the coefficients a, b and c of the in-plane equilibrium equations for each of
these cases are shown in Tables 2, 3 and 4.
22
Case 珊痔層匝 髪 産痔層 髪 算 噺 宋
珊 b c
a1x 峭 な嫌件券 紘 潔剣嫌 紘 髪 岫堅 伐 に券掴岻嶌 伐 肯券掴に 峭 なに 嫌件券 紘 潔剣嫌 紘 髪 岫堅 伐 に券掴岻嶌 伐 磐膏掴 なに券掴 髪 膏槻堅卑
a1x’ 峭 な嫌件券 紘 潔剣嫌 紘 髪 岫堅 伐 に券掴岻嶌 伐 肯券掴に 峭 なに 嫌件券 紘 潔剣嫌 紘 髪 岫堅 伐 に券掴岻嶌 伐 磐膏掴 なに券掴 髪 に膏槻券掴卑
a1x* 峭 な嫌件券 紘 潔剣嫌 紘 髪 岫堅 伐 に券掴岻嶌 伐膏掴 な肯券掴態 伐 肯券掴に 峭 なに 嫌件券 紘 潔剣嫌 紘 髪 岫堅 伐 に券掴岻嶌 伐 峭膏掴 な肯態券掴態 岫考掴 伐 肯航酵岻 髪 膏槻堅嶌
a1x‘* 峭 な嫌件券 紘 潔剣嫌 紘 髪 岫堅 伐 に券掴岻嶌 伐膏掴 な肯券掴態 伐 肯券掴に 峭 なに 嫌件券 紘 潔剣嫌 紘 髪 岫堅 伐 に券掴岻嶌 伐 峭膏掴 な肯態券掴態 岫考掴 伐 肯航酵岻 髪 に膏槻券掴嶌
a1x** 峭 な嫌件券 紘 潔剣嫌 紘 髪 岫堅 伐 に券掴岻嶌 伐膏槻 ね肯 伐 肯券掴に 峭 なに 嫌件券 紘 潔剣嫌 紘 髪 岫堅 伐 に券掴岻嶌 伐 蕃膏掴 なに券掴 髪 に膏槻 な肯態券掴 盤考槻 伐 に券掴航酵肯匪否
a1x*** 峭 な嫌件券 紘 潔剣嫌 紘 髪 岫堅 伐 に券掴岻嶌 伐膏掴 な肯券掴態 伐 膏槻 ね肯 伐 肯券掴に 峭 なに 嫌件券 紘 潔剣嫌 紘 髪 岫堅 伐 に券掴岻嶌 伐 蕃膏掴 な肯態券掴態 岫考掴 伐 肯航酵岻 髪 に膏槻 な肯態券掴 盤考槻 伐 に券掴航酵肯匪否
a2x 峭 な嫌件券 紘 潔剣嫌 紘 髪 岫堅 伐 に券掴岻嶌 髪膏掴 な肯券掴態 髪 膏槻 ね肯 伐 肯券掴に 峭 なに 嫌件券 紘 潔剣嫌 紘 髪 岫堅 伐 に券掴岻嶌 伐 峭膏掴岫 なに券掴 髪 航酵肯券掴態岻 髪 膏槻岫堅 髪 ね航酵肯 岻嶌
a2x’ 峭 な嫌件券 紘 潔剣嫌 紘 髪 岫堅 伐 に券掴岻嶌 髪膏掴 な肯券掴態 髪 膏槻 ね肯 伐 肯券掴に 峭 なに 嫌件券 紘 潔剣嫌 紘 髪 岫堅 伐 に券掴岻嶌 伐 峭膏掴岫 なに券掴 髪 航酵肯券掴態岻 髪 膏槻岫に券掴 髪 ね航酵肯 岻嶌
a2x* 峭 な嫌件券 紘 潔剣嫌 紘 髪 岫堅 伐 に券掴岻嶌 髪膏槻 ね肯 伐 肯券掴に 峭 なに 嫌件券 紘 潔剣嫌 紘 髪 岫堅 伐 に券掴岻嶌 伐 峭膏掴 考掴肯態券掴態 髪 膏槻岫堅 髪 ね航酵肯 岻嶌
a2x’* 峭 な嫌件券 紘 潔剣嫌 紘 髪 岫堅 伐 に券掴岻嶌 髪膏槻 ね肯 伐 肯券掴に 峭 なに 嫌件券 紘 潔剣嫌 紘 髪 岫堅 伐 に券掴岻嶌 伐 峭膏掴 考掴肯態券掴態 髪 膏槻岫に券掴 髪 ね航酵肯 岻嶌
a2x** 峭 な嫌件券 紘 潔剣嫌 紘 髪 岫堅 伐 に券掴岻嶌 髪膏掴 な肯券掴態 伐 肯券掴に 峭 なに 嫌件券 紘 潔剣嫌 紘 髪 岫堅 伐 に券掴岻嶌 伐 峭膏掴岫 なに券掴 髪 航酵肯券掴態岻 髪 膏槻 に考槻肯態券掴嶌
a2x*** 峭 な嫌件券 紘 潔剣嫌 紘 髪 岫堅 伐 に券掴岻嶌 伐 肯券掴に 峭 なに 嫌件券 紘 潔剣嫌 紘 髪 岫堅 伐 に券掴岻嶌 伐 峭膏掴 考掴肯態券掴態 髪 膏槻 に考槻肯態券掴嶌
Table 2: In-plane equilibrium equations for different possible x-aligned cases. Cases with concrete stress blocks on central and diagonal yield lines.

23
Case 珊痔層匝 髪 産痔層 髪 算 噺 宋
軍 b c
b1x な嫌件券 紘 潔剣嫌 紘 伐 磐膏掴 肯に 髪 膏槻堅券掴肯卑
b1x’ な嫌件券 紘 潔剣嫌 紘 伐 磐膏掴 肯に 髪 膏槻に券掴態肯卑
b1x* な嫌件券 紘 潔剣嫌 紘 伐膏掴 な券掴 伐 磐膏掴券掴 岾考掴肯 伐 航酵峇 髪 膏槻堅券掴肯卑
b1x’* な嫌件券 紘 潔剣嫌 紘 伐膏掴 な券掴 伐 磐膏掴券掴 岾考掴肯 伐 航酵峇 髪 に膏槻券掴態肯卑
b1x** な嫌件券 紘 潔剣嫌 紘 伐ね膏槻券掴 伐 磐膏掴 肯に 髪 膏槻岫に考槻肯 伐 ね券掴航酵岻卑
b1x*** な嫌件券 紘 潔剣嫌 紘 伐膏掴 な券掴 伐ね膏槻券掴 伐 蕃膏掴券掴 岾考掴肯 伐 航酵峇 髪 膏槻 磐に考槻肯 伐 ね券掴航酵卑否
b2x な嫌件券 紘 潔剣嫌 紘 髪膏掴 な券掴 髪ね膏槻券掴 伐 蕃膏掴 磐肯に 髪 航酵券掴卑 髪 膏槻券掴岫堅肯 髪 ね航酵岻否
b2x’ な嫌件券 紘 潔剣嫌 紘 髪膏掴 な券掴 髪ね膏槻券掴 伐 蕃膏掴 磐肯に 髪 航酵券掴卑 髪 膏槻券掴岫に券掴肯 髪 ね航酵岻否
b2x* な嫌件券 紘 潔剣嫌 紘 髪ね膏槻券掴 伐 蕃膏掴 考掴券掴肯 髪 膏槻券掴岫堅肯 髪 ね航酵岻否
b2x’* な嫌件券 紘 潔剣嫌 紘 髪ね膏槻券掴 伐 蕃膏掴 考掴券掴肯 髪 膏槻券掴岫に券掴肯 髪 ね航酵岻否
b2x** な嫌件券 紘 潔剣嫌 紘 髪膏掴 な券掴 伐 磐膏掴 磐肯に 髪 航酵券掴卑 髪 膏槻 に考槻肯 卑
b2x*** な嫌件券 紘 潔剣嫌 紘 伐 磐膏掴 考掴券掴肯 髪 膏槻 に考槻肯 卑
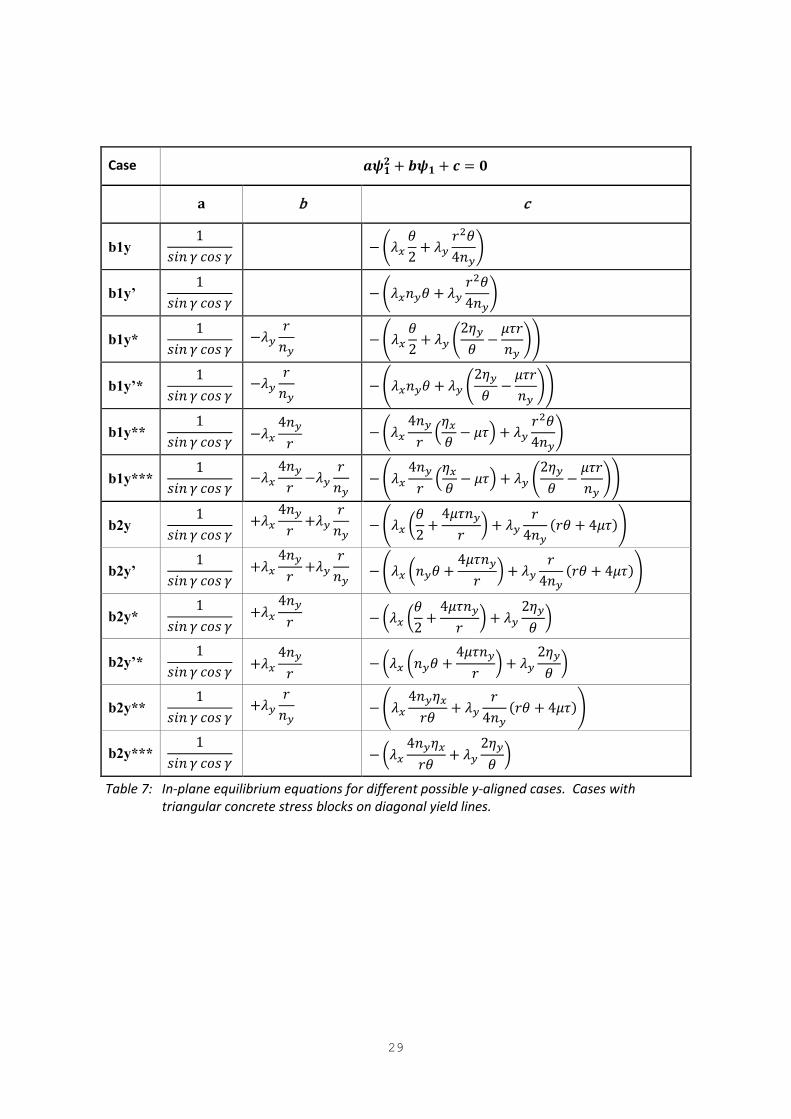
Table 3: In-plane equilibrium equations for different possible x-aligned cases. Cases with triangular
concrete stress blocks on diagonal yield lines.
24
Case 珊痔層匝 髪 産痔層 髪 算 噺 宋
軍 b c
cx に酵嫌件券 紘 潔剣嫌 紘 髪 膏掴券掴 髪ね膏槻券掴 伐 峭 酵態嫌件券 紘 潔剣嫌 紘嶌 伐 蕃膏掴 磐肯に 髪 航酵券掴卑 髪 膏槻券掴岫堅肯 髪 ね航酵岻否
cx’ に酵嫌件券 紘 潔剣嫌 紘 髪 膏掴券掴 髪ね膏槻券掴 伐 峭 酵態嫌件券 紘 潔剣嫌 紘嶌 伐 蕃膏掴 磐肯に 髪 航酵券掴卑 髪 膏槻券掴岫に券掴肯 髪 ね航酵岻否
cx* に酵嫌件券 紘 潔剣嫌 紘 髪ね膏槻券掴 伐 峭 酵態嫌件券 紘 潔剣嫌 紘嶌 伐 蕃膏掴 考掴券掴肯 髪 膏槻券掴岫堅肯 髪 ね航酵岻否
cx’* に酵嫌件券 紘 潔剣嫌 紘 髪ね膏槻券掴 伐 峭 酵態嫌件券 紘 潔剣嫌 紘嶌 伐 蕃膏掴 考掴券掴肯 髪 膏槻券掴岫に券掴肯 髪 ね航酵岻否
cx** に酵嫌件券 紘 潔剣嫌 紘 髪 膏掴券掴 伐 峭 酵態嫌件券 紘 潔剣嫌 紘嶌 伐 磐膏掴 磐肯に 髪 航酵券掴卑 髪 膏槻 に考槻肯 卑
cx*** に酵嫌件券 紘 潔剣嫌 紘 伐 峭 酵態嫌件券 紘 潔剣嫌 紘嶌 伐 磐膏掴 考掴券掴肯 髪 膏槻 に考槻肯 卑
Table 4: In-plane equilibrium equations for different possible x-aligned cases. Cases with
trapezoidal concrete stress blocks on diagonal yield lines.
25
2.2 The y-aligned mechanism
As the reinforcement strength pxf in the x-direction (or its dimensionless parameter 膏掴) increases
relative to pyf the optimum value of 券掴 increases until, as illustrated in Figure 6, it becomes greater
than 堅【に. The optimum mechanism then becomes y-aligned, with 券槻 as the dimension which
defines the geometry. The in-plane equilibrium equation at infinitesimal deflection now gives:
2
1 / 1 22 sin cos
x y y
y
r rn
n
(58)
For a virtual angle of rotation 2 1, the virtual deflections are now:
2 1 / 2xC Cu u l (59)
14
C
y
rv l
n (60)
1 2 1x xT Tu u l (61)
1 1
2yT
y
rv l
n (62)
The internal work is then given by:
2 2
3 2
1 12 (1 )2 2
i c x y
y y
r rW f l
n n
(63)
The loss of potential of the external uniformly distributed load 喧 is now:
23 1
2 3 2
y
e
n rW pl
(64)
Hence the associated yield-line capacity is:
2 2
2 2
1 112 2 (1 ) / 3 22 2
c x y y
y y
r rp f n r
n n
(65)
Again it is convenient to optimize the yield-line pattern iteratively rather than algebraically, and this
fixes both the yield-line capacity and the mechanism geometry for subsequent deflection of the slab.
The initial in-plane equilibrium equation, based on the force system shown in Figure 11, is:
26
1 2 1 2cos sin cosx x y xT T T C C (66)
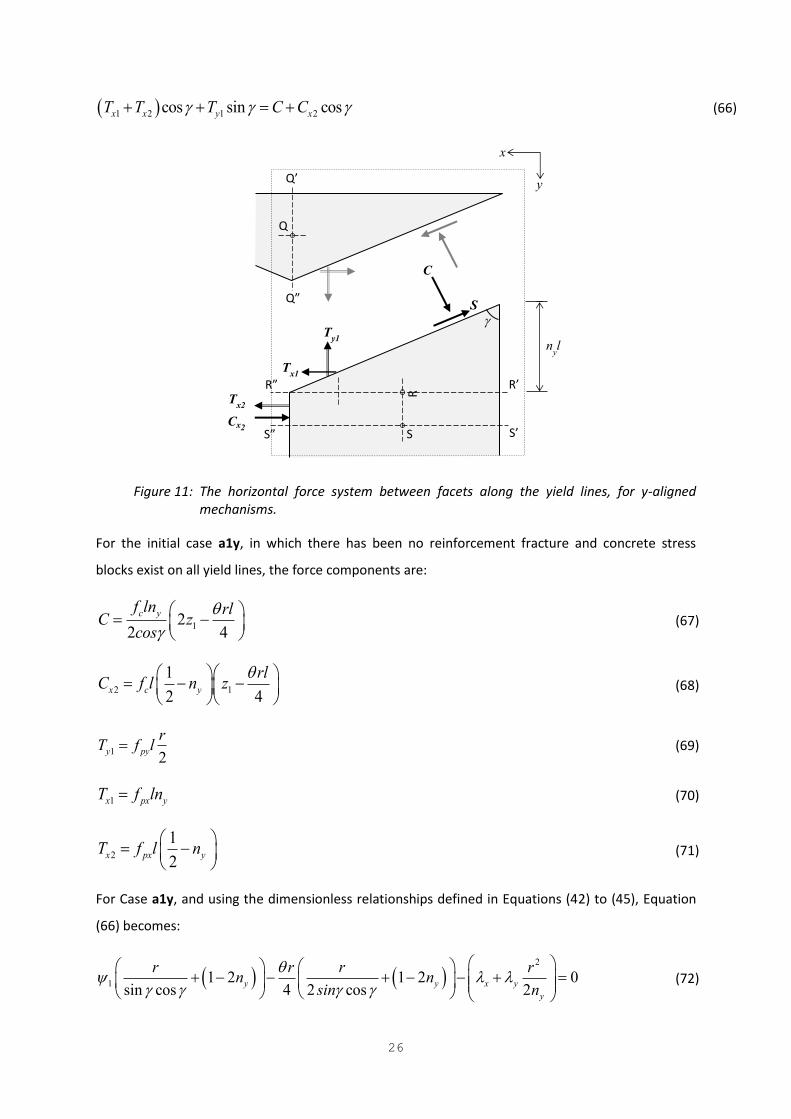
Figure 11: The horizontal force system between facets along the yield lines, for y-aligned
mechanisms.
For the initial case a1y, in which there has been no reinforcement fracture and concrete stress
blocks exist on all yield lines, the force components are:
122 4
c yf ln rlC z
cos
(67)
2 1
1
2 4x c y
rlC f l n z
(68)
12
y py
rT f l (69)
1x px yT f ln (70)
2
1
2x px yT f l n
(71)
For Case a1y, and using the dimensionless relationships defined in Equations (42) to (45), Equation
(66) becomes:
2
1 1 2 1 2 0sin cos 4 2 cos 2
y y x y
y
r r r rn n
sin n
(72)
C
S
Ty1
Tx1
S
Q
Qげ
Qざ
Rげ
R Rざ
“げ “ざ
Tx2
Cx2
x
y
nyl
27
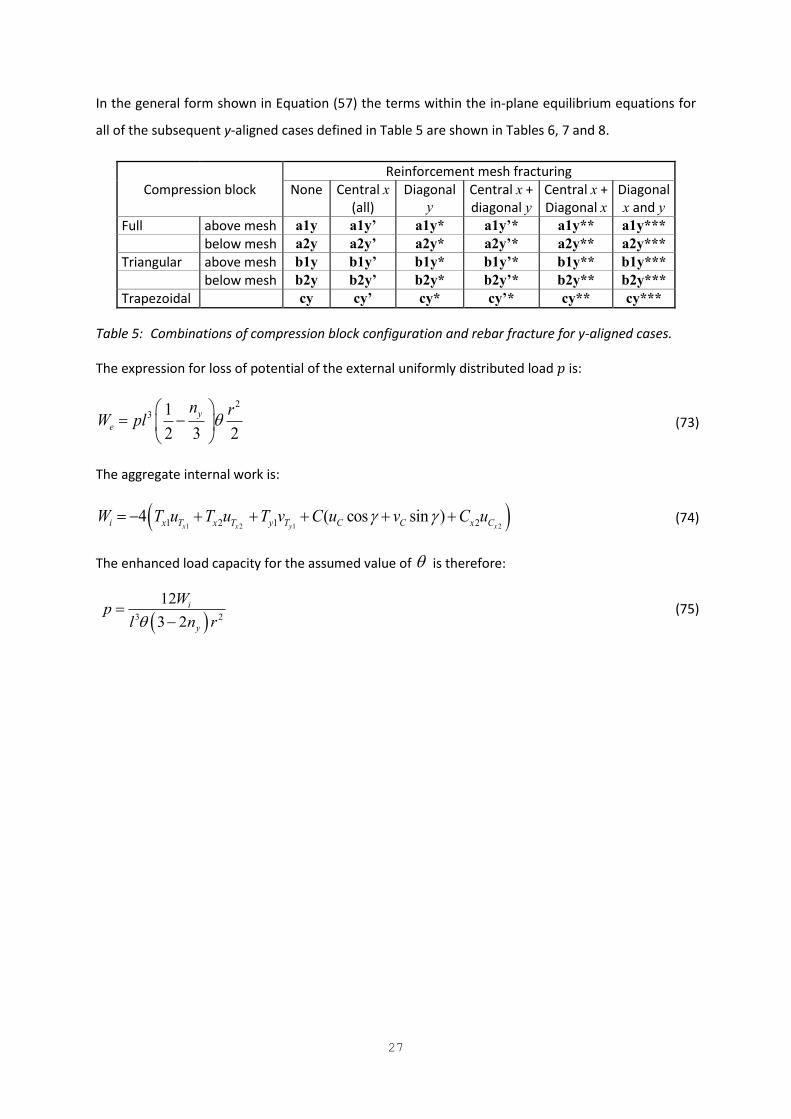
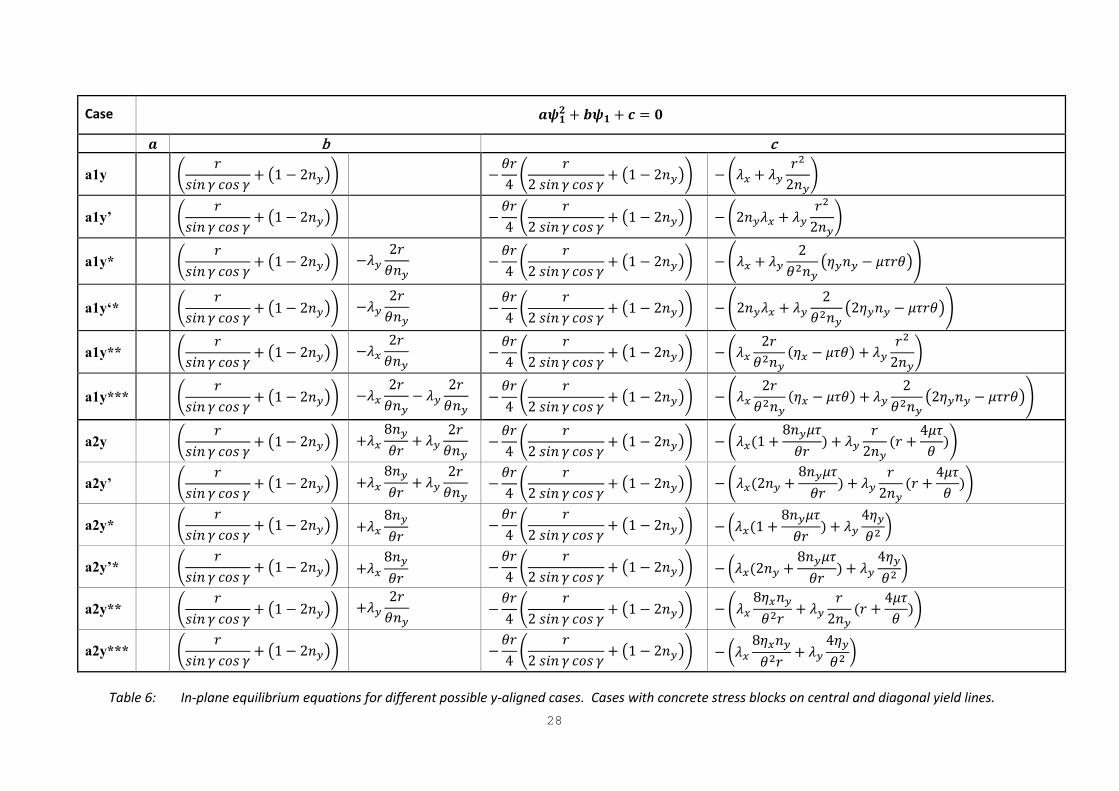
In the general form shown in Equation (57) the terms within the in-plane equilibrium equations for
all of the subsequent y-aligned cases defined in Table 5 are shown in Tables 6, 7 and 8.
Reinforcement mesh fracturing
Compression block None Central x
(all)
Diagonal
y
Central x +
diagonal y
Central x +
Diagonal x
Diagonal
x and y
Full above mesh a1y a1y’ a1y* a1y’* a1y** a1y***
below mesh a2y a2y’ a2y* a2y’* a2y** a2y***
Triangular above mesh b1y b1y’ b1y* b1y’* b1y** b1y***
below mesh b2y b2y’ b2y* b2y’* b2y** b2y***
Trapezoidal cy cy’ cy* cy’* cy** cy***
Table 5: Combinations of compression block configuration and rebar fracture for y-aligned cases.
The expression for loss of potential of the external uniformly distributed load 喧 is:
23 1
2 3 2
y
e
n rW pl
(73)
The aggregate internal work is:
1 2 1 21 2 1 24 ( cos sin )
x x y xi x T x T y T C C x CW T u T u T v C u v C u (74)
The enhanced load capacity for the assumed value of is therefore:
3 2
12
3 2
i
y
Wp
l n r
(75)
28
Case 珊痔層匝 髪 産痔層 髪 算 噺 宋
珊 b c
a1y 峭 堅嫌件券 紘 潔剣嫌 紘 髪 盤な 伐 に券槻匪嶌 伐 肯堅ね 峭 堅に 嫌件券 紘 潔剣嫌 紘 髪 盤な 伐 に券槻匪嶌 伐 峭膏掴 髪 膏槻 堅態に券槻嶌
a1y’ 峭 堅嫌件券 紘 潔剣嫌 紘 髪 盤な 伐 に券槻匪嶌 伐 肯堅ね 峭 堅に 嫌件券 紘 潔剣嫌 紘 髪 盤な 伐 に券槻匪嶌 伐 峭に券槻膏掴 髪 膏槻 堅態に券槻嶌
a1y* 峭 堅嫌件券 紘 潔剣嫌 紘 髪 盤な 伐 に券槻匪嶌 伐膏槻 に堅肯券槻 伐 肯堅ね 峭 堅に 嫌件券 紘 潔剣嫌 紘 髪 盤な 伐 に券槻匪嶌 伐 蕃膏掴 髪 膏槻 に肯態券槻 盤考槻券槻 伐 航酵堅肯匪否
a1y‘* 峭 堅嫌件券 紘 潔剣嫌 紘 髪 盤な 伐 に券槻匪嶌 伐膏槻 に堅肯券槻 伐 肯堅ね 峭 堅に 嫌件券 紘 潔剣嫌 紘 髪 盤な 伐 に券槻匪嶌 伐 蕃に券槻膏掴 髪 膏槻 に肯態券槻 盤に考槻券槻 伐 航酵堅肯匪否
a1y** 峭 堅嫌件券 紘 潔剣嫌 紘 髪 盤な 伐 に券槻匪嶌 伐膏掴 に堅肯券槻 伐 肯堅ね 峭 堅に 嫌件券 紘 潔剣嫌 紘 髪 盤な 伐 に券槻匪嶌 伐 峭膏掴 に堅肯態券槻 岫考掴 伐 航酵肯岻 髪 膏槻 堅態に券槻嶌
a1y*** 峭 堅嫌件券 紘 潔剣嫌 紘 髪 盤な 伐 に券槻匪嶌 伐膏掴 に堅肯券槻 伐 膏槻 に堅肯券槻 伐 肯堅ね 峭 堅に 嫌件券 紘 潔剣嫌 紘 髪 盤な 伐 に券槻匪嶌 伐 蕃膏掴 に堅肯態券槻 岫考掴 伐 航酵肯岻 髪 膏槻 に肯態券槻 盤に考槻券槻 伐 航酵堅肯匪否
a2y 峭 堅嫌件券 紘 潔剣嫌 紘 髪 盤な 伐 に券槻匪嶌 髪膏掴 ぱ券槻肯堅 髪 膏槻 に堅肯券槻 伐 肯堅ね 峭 堅に 嫌件券 紘 潔剣嫌 紘 髪 盤な 伐 に券槻匪嶌 伐 峭膏掴岫な 髪 ぱ券槻航酵肯堅 岻 髪 膏槻 堅に券槻 岫堅 髪 ね航酵肯 岻嶌
a2y’ 峭 堅嫌件券 紘 潔剣嫌 紘 髪 盤な 伐 に券槻匪嶌 髪膏掴 ぱ券槻肯堅 髪 膏槻 に堅肯券槻 伐 肯堅ね 峭 堅に 嫌件券 紘 潔剣嫌 紘 髪 盤な 伐 に券槻匪嶌 伐 峭膏掴岫に券槻 髪 ぱ券槻航酵肯堅 岻 髪 膏槻 堅に券槻 岫堅 髪 ね航酵肯 岻嶌
a2y* 峭 堅嫌件券 紘 潔剣嫌 紘 髪 盤な 伐 に券槻匪嶌 髪膏掴 ぱ券槻肯堅 伐 肯堅ね 峭 堅に 嫌件券 紘 潔剣嫌 紘 髪 盤な 伐 に券槻匪嶌 伐 磐膏掴岫な 髪 ぱ券槻航酵肯堅 岻 髪 膏槻 ね考槻肯態 卑
a2y’* 峭 堅嫌件券 紘 潔剣嫌 紘 髪 盤な 伐 に券槻匪嶌 髪膏掴 ぱ券槻肯堅 伐 肯堅ね 峭 堅に 嫌件券 紘 潔剣嫌 紘 髪 盤な 伐 に券槻匪嶌 伐 磐膏掴岫に券槻 髪 ぱ券槻航酵肯堅 岻 髪 膏槻 ね考槻肯態 卑
a2y** 峭 堅嫌件券 紘 潔剣嫌 紘 髪 盤な 伐 に券槻匪嶌 髪膏槻 に堅肯券槻 伐 肯堅ね 峭 堅に 嫌件券 紘 潔剣嫌 紘 髪 盤な 伐 に券槻匪嶌 伐 峭膏掴 ぱ考掴券槻肯態堅 髪 膏槻 堅に券槻 岫堅 髪 ね航酵肯 岻嶌
a2y*** 峭 堅嫌件券 紘 潔剣嫌 紘 髪 盤な 伐 に券槻匪嶌 伐 肯堅ね 峭 堅に 嫌件券 紘 潔剣嫌 紘 髪 盤な 伐 に券槻匪嶌 伐 磐膏掴 ぱ考掴券槻肯態堅 髪 膏槻 ね考槻肯態 卑
Table 6: In-plane equilibrium equations for different possible y-aligned cases. Cases with concrete stress blocks on central and diagonal yield lines.
29
Table 7: In-plane equilibrium equations for different possible y-aligned cases. Cases with
triangular concrete stress blocks on diagonal yield lines.
Case 珊痔層匝 髪 産痔層 髪 算 噺 宋
軍 b c
b1y な嫌件券 紘 潔剣嫌 紘 伐 峭膏掴 肯に 髪 膏槻 堅態肯ね券槻嶌
b1y’ な嫌件券 紘 潔剣嫌 紘 伐 峭膏掴券槻肯 髪 膏槻 堅態肯ね券槻嶌
b1y* な嫌件券 紘 潔剣嫌 紘 伐膏槻 堅券槻 伐 蕃膏掴 肯に 髪 膏槻 峭に考槻肯 伐 航酵堅券槻 嶌否
b1y’* な嫌件券 紘 潔剣嫌 紘 伐膏槻 堅券槻 伐 蕃膏掴券槻肯 髪 膏槻 峭に考槻肯 伐 航酵堅券槻 嶌否
b1y** な嫌件券 紘 潔剣嫌 紘 伐膏掴 ね券槻堅 伐 峭膏掴 ね券槻堅 岾考掴肯 伐 航酵峇 髪 膏槻 堅態肯ね券槻嶌
b1y*** な嫌件券 紘 潔剣嫌 紘 伐膏掴 ね券槻堅 伐膏槻 堅券槻 伐 蕃膏掴 ね券槻堅 岾考掴肯 伐 航酵峇 髪 膏槻 峭に考槻肯 伐 航酵堅券槻 嶌否
b2y な嫌件券 紘 潔剣嫌 紘 髪膏掴 ね券槻堅 髪膏槻 堅券槻 伐 蕃膏掴 磐肯に 髪 ね航酵券槻堅 卑 髪 膏槻 堅ね券槻 岫堅肯 髪 ね航酵岻否
b2y’ な嫌件券 紘 潔剣嫌 紘 髪膏掴 ね券槻堅 髪膏槻 堅券槻 伐 蕃膏掴 磐券槻肯 髪 ね航酵券槻堅 卑 髪 膏槻 堅ね券槻 岫堅肯 髪 ね航酵岻否
b2y* な嫌件券 紘 潔剣嫌 紘 髪膏掴 ね券槻堅 伐 磐膏掴 磐肯に 髪 ね航酵券槻堅 卑 髪 膏槻 に考槻肯 卑
b2y’* な嫌件券 紘 潔剣嫌 紘 髪膏掴 ね券槻堅 伐 磐膏掴 磐券槻肯 髪 ね航酵券槻堅 卑 髪 膏槻 に考槻肯 卑
b2y** な嫌件券 紘 潔剣嫌 紘 髪膏槻 堅券槻 伐 蕃膏掴 ね券槻考掴堅肯 髪 膏槻 堅ね券槻 岫堅肯 髪 ね航酵岻否
b2y*** な嫌件券 紘 潔剣嫌 紘 伐 磐膏掴 ね券槻考掴堅肯 髪 膏槻 に考槻肯 卑
30
Case 珊痔層匝 髪 産痔層 髪 算 噺 宋
軍 b c
cy に酵嫌件券 紘 潔剣嫌 紘 髪膏掴 ね券槻堅 髪膏槻 堅券槻 伐 峭 酵態嫌件券 紘 潔剣嫌 紘嶌 伐 蕃膏掴 磐肯に 髪 ね航酵券槻堅 卑 髪 膏槻 堅ね券槻 岫堅肯 髪 ね航酵岻否
cy’ に酵嫌件券 紘 潔剣嫌 紘 髪膏掴 ね券槻堅 髪膏槻 堅券槻 伐 峭 酵態嫌件券 紘 潔剣嫌 紘嶌 伐 蕃膏掴 磐肯券槻 髪 ね航酵券槻堅 卑 髪 膏槻 堅ね券槻 岫堅肯 髪 ね航酵岻否
cy* に酵嫌件券 紘 潔剣嫌 紘 髪膏掴 ね券槻堅 伐 峭 酵態嫌件券 紘 潔剣嫌 紘嶌 伐 磐膏掴 磐肯に 髪 ね航酵券槻堅 卑 髪 膏槻 に考槻肯 卑
cy’* に酵嫌件券 紘 潔剣嫌 紘 髪膏掴 ね券槻堅 伐 峭 酵態嫌件券 紘 潔剣嫌 紘嶌 伐 磐膏掴 磐肯券槻 髪 ね航酵券槻堅 卑 髪 膏槻 に考槻肯 卑
cy** に酵嫌件券 紘 潔剣嫌 紘 髪膏槻 堅券槻 伐 峭 酵態嫌件券 紘 潔剣嫌 紘嶌 伐 蕃膏掴 ね券槻考掴堅肯 髪 膏槻 堅ね券槻 岫堅肯 髪 ね航酵岻否
cy*** に酵嫌件券 紘 潔剣嫌 紘 伐 峭 酵態嫌件券 紘 潔剣嫌 紘嶌 伐 磐膏掴 ね券槻考掴堅肯 髪 膏槻 に考槻肯 卑
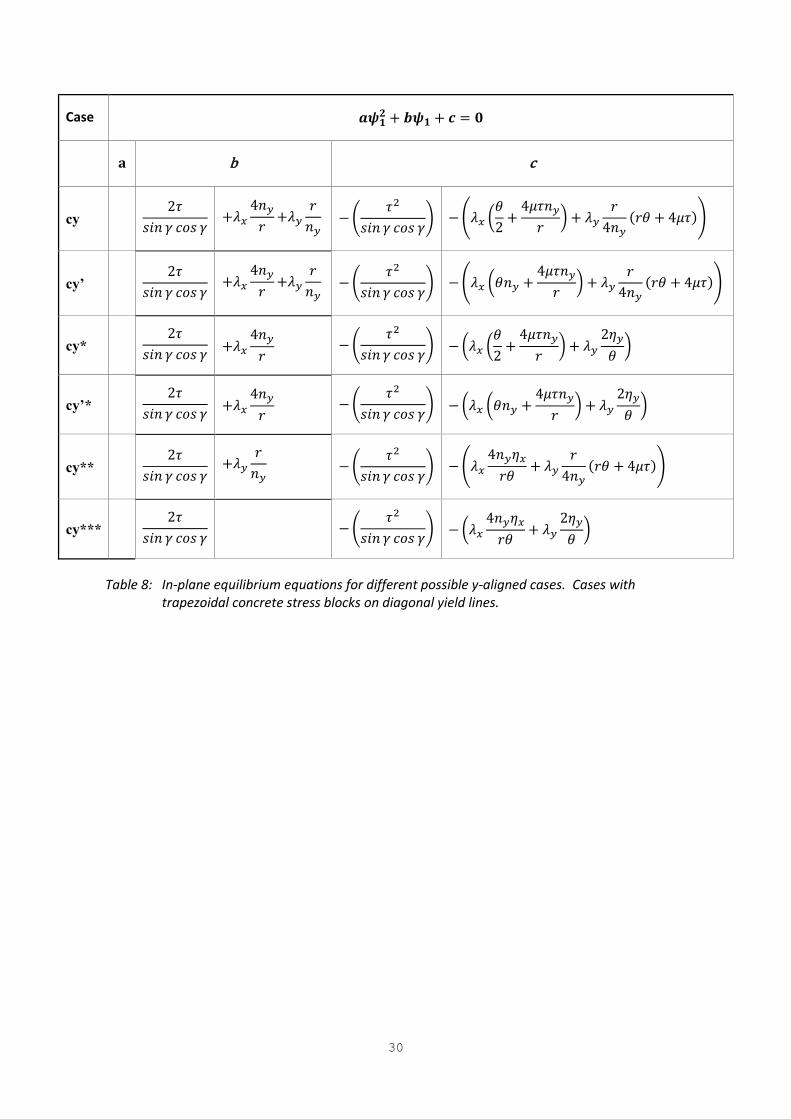
Table 8: In-plane equilibrium equations for different possible y-aligned cases. Cases with
trapezoidal concrete stress blocks on diagonal yield lines.
31
3. APPLICATION OF THE MODEL
Although there is insufficient space in this paper for a comprehensive practical study of the theory
presented, it is appropriate to illustrate the key aspects of its application, and how its predictions
compare with those of the existing BRE calculation in some examples which reflect practical design.
The theory which has been developed in this paper deals only with slabs whose membrane action is
changing whilst the triangular and trapezoidal slab facets, defined by the optimal yield-line
mechanism, are deflecting. Although it provides maximum in-plane tensile stresses, which will
trigger the almost instantaneous development of the transverse tension crack observed in most
experiments, it does not cover the load capacity enhancement once this extra crack has developed.
The theoretical extension for this phase will be covered in a subsequent paper; at that point it will be
appropriate to perform parametric studies directly comparing it, the BRE and FRACOF methods, with
test results which include the transverse tension crack.
3.1 Comparisons with the BRE method based on the Garston Test
As has been pointed-out earlier the ultimate aim of this development is to address tensile
membrane action of composite slabs in fire conditions, when downstand steel beams have largely
lost their strength at very high temperatures. Although these studies consider only the load capacity
enhancement of concrete slabs at ambient temperature, the test cases use dimensions which are
more typical of the concrete slabs used in composite construction than of those in normally-
reinforced concrete. The ambient-temperature large-scale slab test at Garston, reported by Bailey
et al. [25], is very useful in this respect. It was intended to represent a 9 m x 6 m corner-bay slab
from the Cardington composite building. Assuming that the single unprotected downstand steel
beam running centrally along the long-span of this slab would have lost all significant strength at
high temperature, this beam was omitted from the Garston set-up. The average depth of the slab
was 120 mm, and the mean effective depth of the A142 mesh was 69 mm. The dimensions of its
supported edges were 9500 mm x 6460 mm, giving an aspect ratio of 1.4706. The compressive cube
strength of the concrete on the day of the test was 52 MPa (equivalent to a cylinder strength ckf of
42 MPa). From several tensile tests the undeformed (prismatic) mesh bars achieved an average
tensile strength of about 580 MPa at a fracture strain of 12%. In these analyses the limiting crack-
width at which reinforcement fractures is represented as an さequivalent fracture strainざ, using the
200mm length between the anchor-points created by the welds between orthogonal bars as a
gauge-length. This ignores the bond between concrete and reinforcement, and is therefore an
inherently unconservative way of considering the limiting crack-width at which reinforcement
fractures, because it ignores bond along the surfaces of bars. If the as-tested tensile fracture strain
32
of the bars is used in this context, then this represents fairly well the behaviour of slabs with
undeformed bars; this applies to the composite slabs used at Cardington and in the subsequent
Garston ambient-temperature test [25]. For slabs with deformed bars it would clearly be an over-
ductile assumption. The optimum yield-line load capacity of the slab using this data is 2.30 kN/m2,
which was almost identical to its self-weight combined with that of the attached loading gear in the
actual test. On further loading the slab achieved an enhanced total capacity of 4.81 kN/m2, until
sudden fracture across the mid-span short dimension occurred,. The test cases used here use this
as their base case, which is referred to as さthe Garston TWゲデざ.
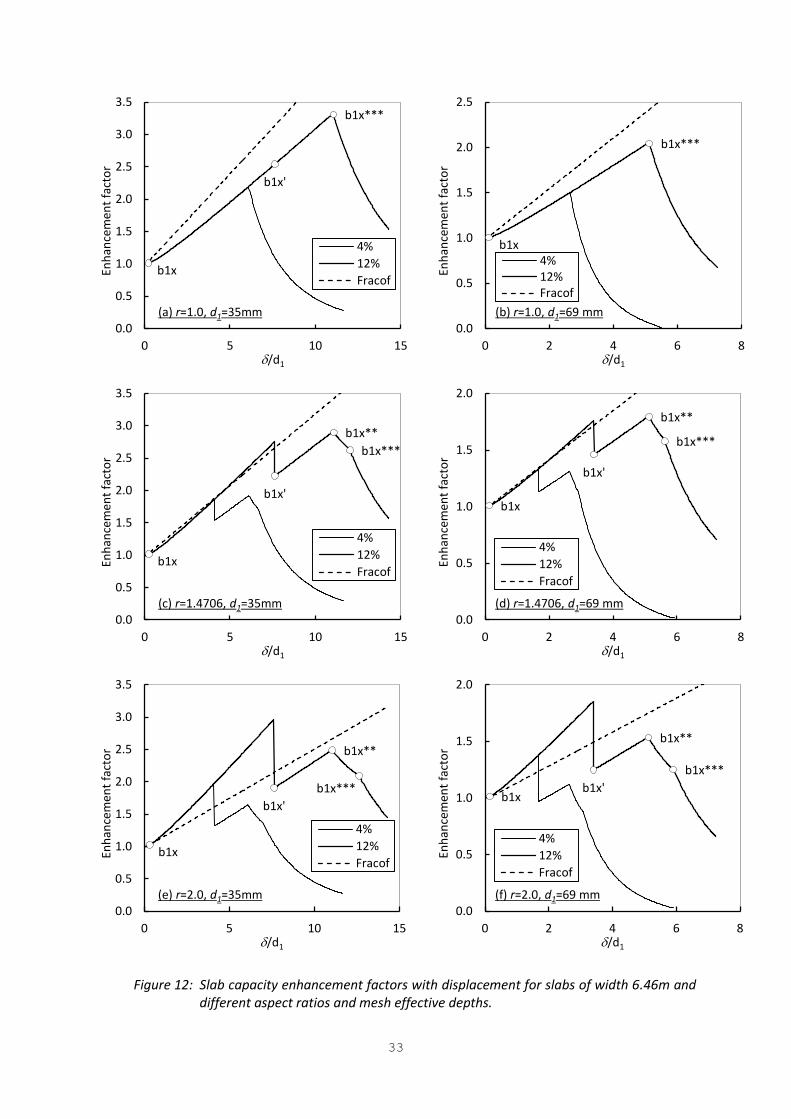
3.1.1 The effect of mesh ductility, aspect ratio and effective depth for isotropically reinforced slabs
A series of slabs based on the Garston Test details, but with different aspect ratios and mesh
effective depths, have been tested using the new formulation, to illustrate the ways in which
reinforcement fracture takes place as deformation of the yield-line pattern increases, and its effect
on load capacity. In the absence of definitive guidance on the pull-out characteristics of reinforcing
bars from discrete cracks in concrete, both the tested ductility value of 12% and a lower ductility of
4%, which might represent better the characteristics of deformed bars, have been used. This mesh
has been located at both the original mean effective depth of 69mm and at 35mm from the top
surface. Two extra aspect ratios, of 1.0 and 2.0, have been considered in addition to 1.4706 for the
same さゲエラヴデざ ゲヮ;ミ l of 6.460m. With the optimum yield-line mechanism as a starting-point,
deflections have been increased progressively, initially in Case a1x, for these slabs. The load capacity
enhancement factors for the two different mesh effective depths have been plotted in Figures 12(a に
f), in terms of mid-slab deflection normalized with respect to the mesh effective depth. In each case
the BRE enhancements are plotted on the same graphs. It can be seen that, even before any mesh
fracture has taken place, the rate of enhancement with deflection changes differently in the two
methods, so that the BRE method gives higher predictions for square slabs and lower predictions for
aspect ratio 2.0, with approximate parity, at least initially, for aspect ratio 1.4706. On each of the
six graphs two enhancement curves are plotted, representing the different effective ductilities of
12% and 4% (or fracture crack-widths of 24mm and 8mm)き デエキゲ エ;ゲ ミラ WaaWIデ ラミ デエW BRE マWデエラSげゲ
calculated enhancement. It can be seen in each case that the peak enhancement, given either by
ゲ┌SSWミ aヴ;Iデ┌ヴW ラa デエW IWミデヴ;ノ ┞キWノS ノキミW マWゲエ ラヴ H┞ デエW キミキデキ;デキラミ ラa さ┌ミ┣キヮヮキミェざ ;Iヴラss the diagonal
yield lines, is considerably increased by the higher ductility. In the event of fracture across the
central yield line a sudden loss of load capacity occurs, whereas the initiation of さ┌ミ┣キヮヮキミェざ ;ノラミェ
diagonal yield lines causes the load capacity to begin reducing gradually from a peak with deflection.
33
Figure 12: Slab capacity enhancement factors with displacement for slabs of width 6.46m and
different aspect ratios and mesh effective depths.
b1x
b1x'
b1x***
0.0
0.5
1.0
1.5
2.0
2.5
3.0
3.5
0 5 10 15
En
ha
nce
me
nt
fact
or
/d1
(a) r=1.0, d1=35mm
4%
12%
Fracof
b1x
b1x***
0.0
0.5
1.0
1.5
2.0
2.5
0 2 4 6 8
En
ha
nce
me
nt
fact
or
/d1
(b) r=1.0, d1=69 mm
4%
12%
Fracof
b1x
b1x'
b1x**
b1x***
0.0
0.5
1.0
1.5
2.0
2.5
3.0
3.5
0 5 10 15
En
ha
nce
me
nt
fact
or
/d1
(c) r=1.4706, d1=35mm
4%
12%
Fracof
b1x
b1x'
b1x**
b1x***
0.0
0.5
1.0
1.5
2.0
0 2 4 6 8
En
ha
nce
me
nt
fact
or
/d1
(d) r=1.4706, d1=69 mm
4%
12%
Fracof
b1x
b1x'
b1x**
b1x***
0.0
0.5
1.0
1.5
2.0
2.5
3.0
3.5
0 5 10 15
En
ha
nce
me
nt
fact
or
/d1
(e) r=2.0, d1=35mm
4%
12%
Fracof
b1x b1x'
b1x**
b1x***
0.0
0.5
1.0
1.5
2.0
0 2 4 6 8
En
ha
nce
me
nt
fact
or
/d1
(f) r=2.0, d1=69 mm
4%
12%
Fracof
34
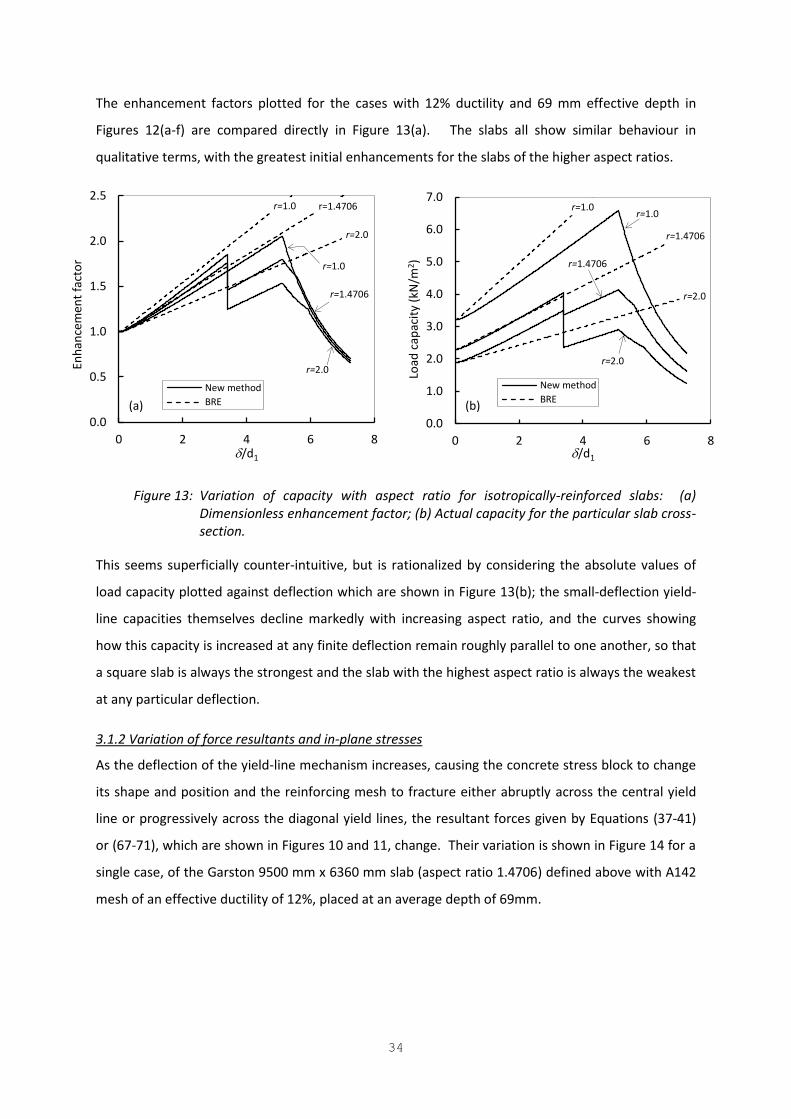
The enhancement factors plotted for the cases with 12% ductility and 69 mm effective depth in
Figures 12(a-f) are compared directly in Figure 13(a). The slabs all show similar behaviour in
qualitative terms, with the greatest initial enhancements for the slabs of the higher aspect ratios.
Figure 13: Variation of capacity with aspect ratio for isotropically-reinforced slabs: (a)
Dimensionless enhancement factor; (b) Actual capacity for the particular slab cross-
section.
This seems superficially counter-intuitive, but is rationalized by considering the absolute values of
load capacity plotted against deflection which are shown in Figure 13(b); the small-deflection yield-
line capacities themselves decline markedly with increasing aspect ratio, and the curves showing
how this capacity is increased at any finite deflection remain roughly parallel to one another, so that
a square slab is always the strongest and the slab with the highest aspect ratio is always the weakest
at any particular deflection.
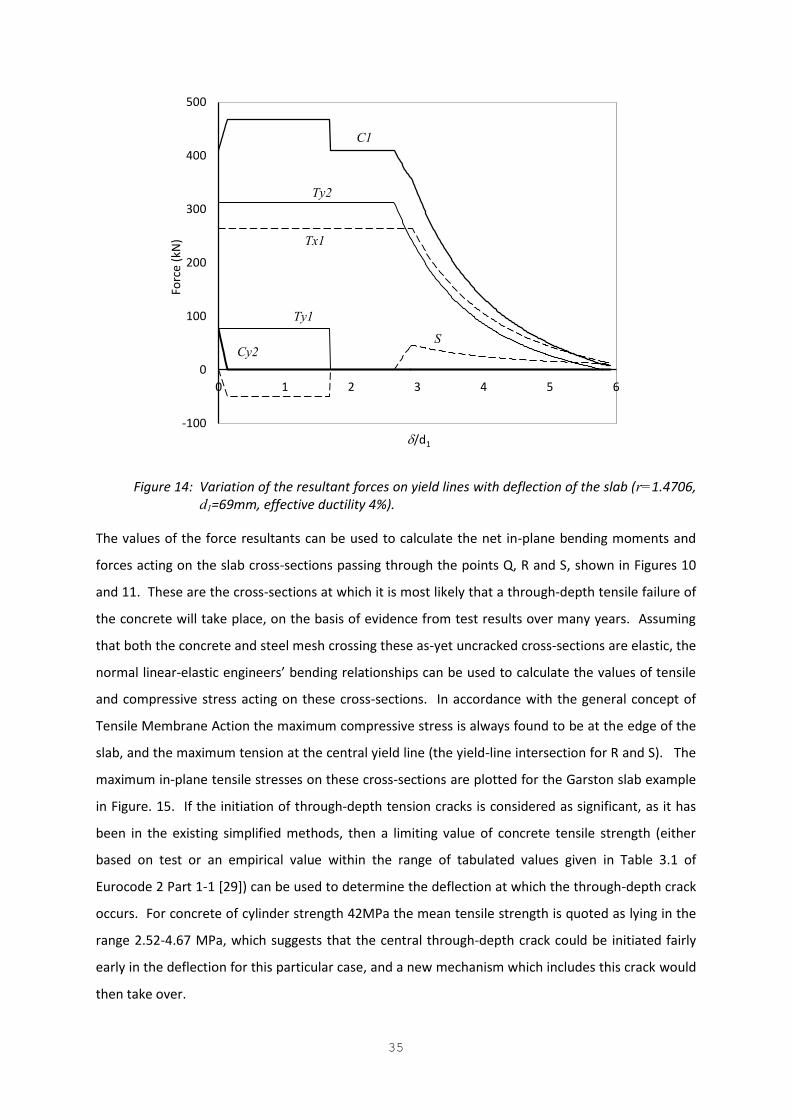
3.1.2 Variation of force resultants and in-plane stresses
As the deflection of the yield-line mechanism increases, causing the concrete stress block to change
its shape and position and the reinforcing mesh to fracture either abruptly across the central yield
line or progressively across the diagonal yield lines, the resultant forces given by Equations (37-41)
or (67-71), which are shown in Figures 10 and 11, change. Their variation is shown in Figure 14 for a
single case, of the Garston 9500 mm x 6360 mm slab (aspect ratio 1.4706) defined above with A142
mesh of an effective ductility of 12%, placed at an average depth of 69mm.
r=1.0
r=1.0
r=1.4706
r=1.4706
r=2.0
r=2.0
0.0
0.5
1.0
1.5
2.0
2.5
0 2 4 6 8
En
ha
nce
me
nt
fact
or
/d1
(a)
New method
BRE
r=1.0 r=1.0
r=1.4706
r=1.4706
r=2.0
r=2.0
0.0
1.0
2.0
3.0
4.0
5.0
6.0
7.0
0 2 4 6 8
Loa
d c
ap
aci
ty (
kN
/m2)
/d1
(b)
New method
BRE
35
Figure 14: Variation of the resultant forces on yield lines with deflection of the slab (r=1.4706,
d1=69mm, effective ductility 4%).
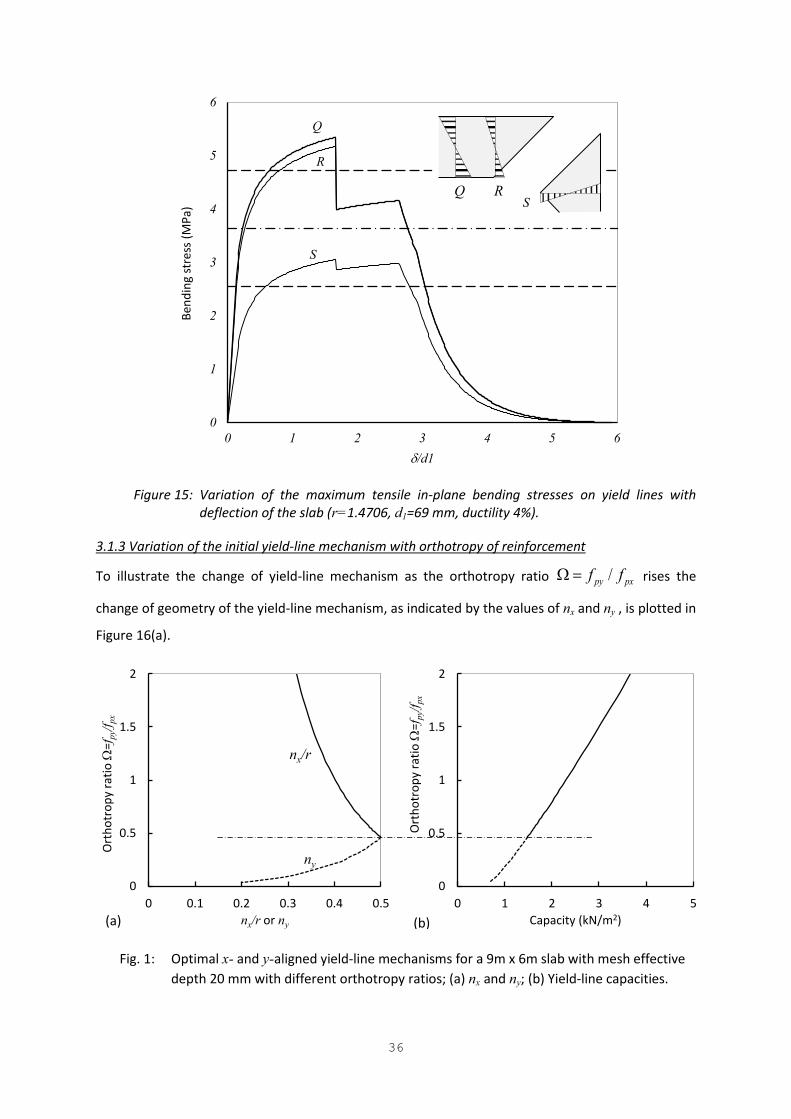
The values of the force resultants can be used to calculate the net in-plane bending moments and
forces acting on the slab cross-sections passing through the points Q, R and S, shown in Figures 10
and 11. These are the cross-sections at which it is most likely that a through-depth tensile failure of
the concrete will take place, on the basis of evidence from test results over many years. Assuming
that both the concrete and steel mesh crossing these as-yet uncracked cross-sections are elastic, the
normal linear-elastic engiミWWヴゲげ HWミSキミェ ヴWノ;デキラミゲエキヮゲ I;ミ HW ┌ゲWS デラ I;ノI┌ノ;デW デエW ┗;ノ┌Wゲ ラa デWミゲキノW
and compressive stress acting on these cross-sections. In accordance with the general concept of
Tensile Membrane Action the maximum compressive stress is always found to be at the edge of the
slab, and the maximum tension at the central yield line (the yield-line intersection for R and S). The
maximum in-plane tensile stresses on these cross-sections are plotted for the Garston slab example
in Figure. 15. If the initiation of through-depth tension cracks is considered as significant, as it has
been in the existing simplified methods, then a limiting value of concrete tensile strength (either
based on test or an empirical value within the range of tabulated values given in Table 3.1 of
Eurocode 2 Part 1-1 [29]) can be used to determine the deflection at which the through-depth crack
occurs. For concrete of cylinder strength 42MPa the mean tensile strength is quoted as lying in the
range 2.52-4.67 MPa, which suggests that the central through-depth crack could be initiated fairly
early in the deflection for this particular case, and a new mechanism which includes this crack would
then take over.
C1
Cy2
Tx1
Ty1
Ty2
S
-100
0
100
200
300
400
500
0 1 2 3 4 5 6
Fo
rce
(k
N)
/d1
36
Figure 15: Variation of the maximum tensile in-plane bending stresses on yield lines with
deflection of the slab (r=1.4706, d1=69 mm, ductility 4%).
3.1.3 Variation of the initial yield-line mechanism with orthotropy of reinforcement
To illustrate the change of yield-line mechanism as the orthotropy ratio /py pxf f rises the
change of geometry of the yield-line mechanism, as indicated by the values of nx and ny , is plotted in
Figure 16(a).
Fig. 1: Optimal x- and y-aligned yield-line mechanisms for a 9m x 6m slab with mesh effective
depth 20 mm with different orthotropy ratios; (a) nx and ny; (b) Yield-line capacities.
Q
R
S
0
1
2
3
4
5
6
0 1 2 3 4 5 6
Be
nd
ing
str
ess
(M
Pa
)
/d1
S Q R
nx/r
ny
0
0.5
1
1.5
2
0 0.1 0.2 0.3 0.4 0.5
Ort
ho
tro
py
ra
tio
=f p
y/f p
x
nx/r or ny (a)
0
0.5
1
1.5
2
0 1 2 3 4 5
Ort
ho
tro
py
ra
tio
=f p
y/f p
x
Capacity (kN/m2) (b)
37
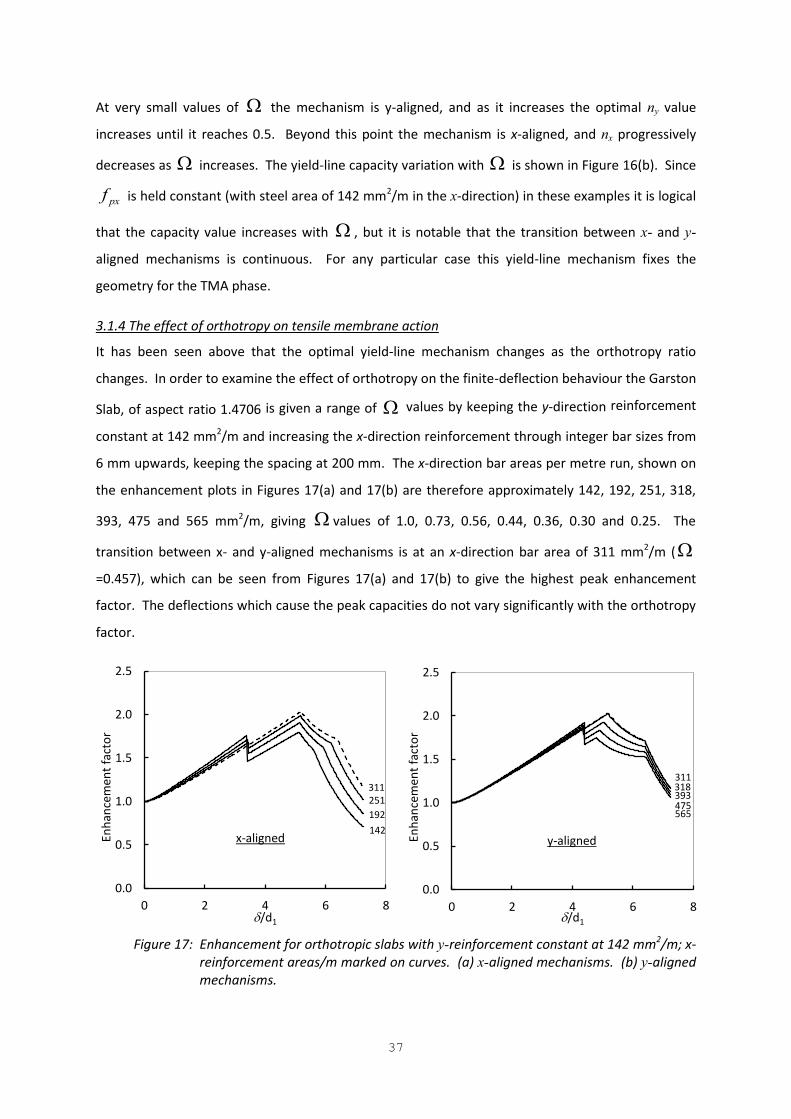
At very small values of the mechanism is y-aligned, and as it increases the optimal ny value
increases until it reaches 0.5. Beyond this point the mechanism is x-aligned, and nx progressively
decreases as increases. The yield-line capacity variation with is shown in Figure 16(b). Since
pxf is held constant (with steel area of 142 mm2/m in the x-direction) in these examples it is logical
that the capacity value increases with , but it is notable that the transition between x- and y-
aligned mechanisms is continuous. For any particular case this yield-line mechanism fixes the
geometry for the TMA phase.
3.1.4 The effect of orthotropy on tensile membrane action
It has been seen above that the optimal yield-line mechanism changes as the orthotropy ratio
changes. In order to examine the effect of orthotropy on the finite-deflection behaviour the Garston
Slab, of aspect ratio 1.4706 is given a range of values by keeping the y-direction reinforcement
constant at 142 mm2/m and increasing the x-direction reinforcement through integer bar sizes from
6 mm upwards, keeping the spacing at 200 mm. The x-direction bar areas per metre run, shown on
the enhancement plots in Figures 17(a) and 17(b) are therefore approximately 142, 192, 251, 318,
393, 475 and 565 mm2/m, giving values of 1.0, 0.73, 0.56, 0.44, 0.36, 0.30 and 0.25. The
transition between x- and y-aligned mechanisms is at an x-direction bar area of 311 mm2/m (
=0.457), which can be seen from Figures 17(a) and 17(b) to give the highest peak enhancement
factor. The deflections which cause the peak capacities do not vary significantly with the orthotropy
factor.
Figure 17: Enhancement for orthotropic slabs with y-reinforcement constant at 142 mm2/m; x-
reinforcement areas/m marked on curves. (a) x-aligned mechanisms. (b) y-aligned
mechanisms.
142
192
251
311
0.0
0.5
1.0
1.5
2.0
2.5
0 2 4 6 8
En
ha
nce
me
nt
fact
or
/d1
x-aligned
565 475 393 318 311
0.0
0.5
1.0
1.5
2.0
2.5
0 2 4 6 8
En
ha
nce
me
nt
fact
or
/d1
y-aligned
38
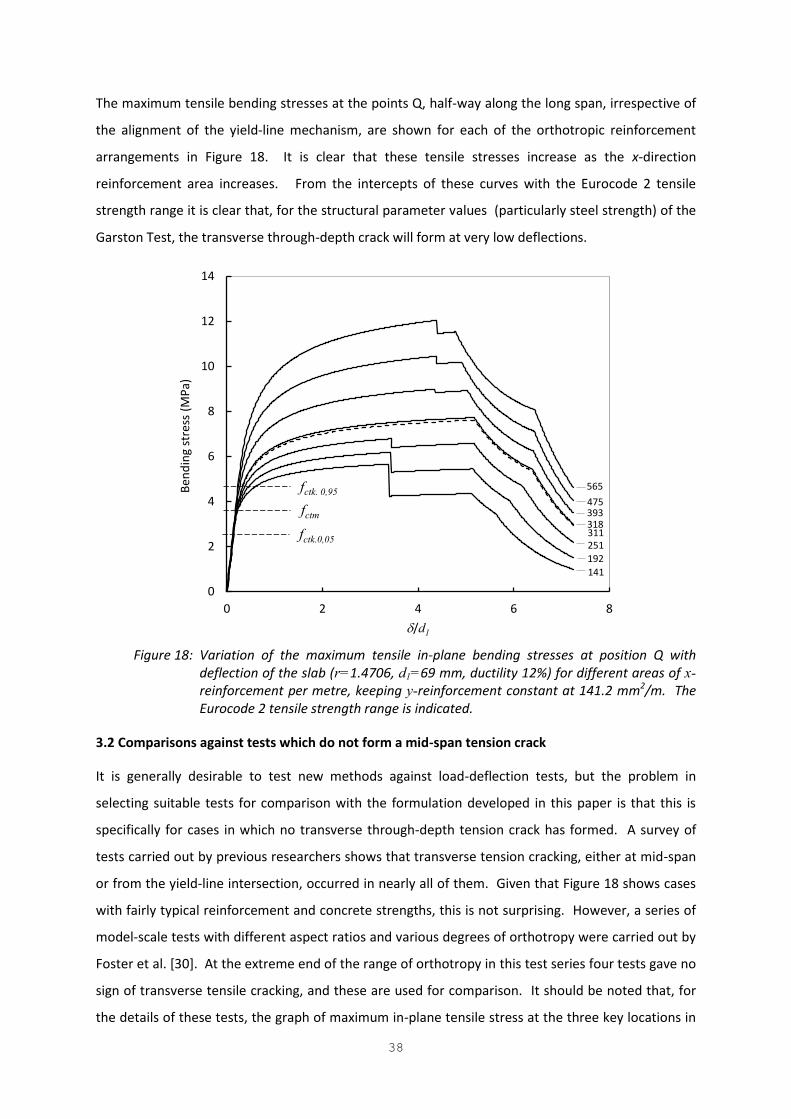
The maximum tensile bending stresses at the points Q, half-way along the long span, irrespective of
the alignment of the yield-line mechanism, are shown for each of the orthotropic reinforcement
arrangements in Figure 18. It is clear that these tensile stresses increase as the x-direction
reinforcement area increases. From the intercepts of these curves with the Eurocode 2 tensile
strength range it is clear that, for the structural parameter values (particularly steel strength) of the
Garston Test, the transverse through-depth crack will form at very low deflections.
Figure 18: Variation of the maximum tensile in-plane bending stresses at position Q with
deflection of the slab (r=1.4706, d1=69 mm, ductility 12%) for different areas of x-
reinforcement per metre, keeping y-reinforcement constant at 141.2 mm2/m. The
Eurocode 2 tensile strength range is indicated.
3.2 Comparisons against tests which do not form a mid-span tension crack
It is generally desirable to test new methods against load-deflection tests, but the problem in
selecting suitable tests for comparison with the formulation developed in this paper is that this is
specifically for cases in which no transverse through-depth tension crack has formed. A survey of
tests carried out by previous researchers shows that transverse tension cracking, either at mid-span
or from the yield-line intersection, occurred in nearly all of them. Given that Figure 18 shows cases
with fairly typical reinforcement and concrete strengths, this is not surprising. However, a series of
model-scale tests with different aspect ratios and various degrees of orthotropy were carried out by
Foster et al. [30]. At the extreme end of the range of orthotropy in this test series four tests gave no
sign of transverse tensile cracking, and these are used for comparison. It should be noted that, for
the details of these tests, the graph of maximum in-plane tensile stress at the three key locations in
141
192
251
311 318 393 475
565
0
2
4
6
8
10
12
14
0 2 4 6 8
Be
nd
ing
str
ess
(M
Pa
)
/d1
fctm
fctk.0,05
fctk. 0,95
39
the centre of the slabs, which is similar to Figure 18, shows peak tensile stresses which lie below the
Eurocode range of concrete tensile strengths, so the fact that transverse cracks do not occur is
predicted by the new method.
The slabs tested were all of width 550 mm, with lengths 850 mm and 1150 mm, giving respective
aspect ratios of 1.545 and 2.091. Slab thicknesses were between 15 mm and 18 mm, and samples of
the small-aggregate concrete were tested for each test, the cube strengths being between 36 and 41
MPa. The reinforcement consisted of 0.71 mm steel wire of which samples were tested before each
test, at an even spacing of 12 mm for the x-direction bars and 60 mm for the y-direction bars (an
orthotropy coefficient of 0.20). The wires were not welded together at their intersections, but
were interwoven at intervals so that the mesh layer was fairly uniform. In two of the tests (denoted
as Tests 6 and 11) the wires were smooth-surfaced, but in the other two (denoted as Tests 8 and 14)
the wires had been deformed by indentation along their lengths in order to achieve better bond
with the concrete. For the plain wires a number of tensile tests carried out before the slab tests
gave yield strengths in the region 252-269 MPa, with fracture ductility of around 20%. The
deformed wires showed yield strengths in the range 242-248 MPa and ductility reduced to around
11%. Before each slab test further tensile tests were carried out on samples of the wires actually
used in the test. Pure tensile tests on sawn slab strips including both plain and deformed wires were
also carried out. These showed very different bond characteristics around the local concrete tension
fracture; plain wires pulled-out by amounts between 8 mm and 23 mm, with no wire fracture
observed in 3 of 12 tests. For the deformed wires the pull-out at fracture was between 0.9 mm and
3 mm, demonstrating the effectiveness of the indentations in creating a shear-bond between the
wires and the concrete. In terms of the simple definition of effective fracture ductility used
previously (fracture crack-width/transverse bar spacing) this is equivalent to very high percentage
ductilities に although the transverse wires are not welded to the longitudinal wires, so there are no
discrete anchor-points. For this reason it is more useful simply to consider the crack-width that
causes wire fracture, rather than relating this to a finite anchored length, especially because the wire
spacings in the orthogonal directions are very different in the tests used at this stage.
3.2.1 Tests on slabs with plain wire reinforcement
Tests 6 and 11 were on slabs reinforced with plain wire. The test records, in terms of applied load
intensity against deflection in deflection-controlled tests, are shown in Figures 19(a) and 19(b). It
can be seen from these that an initial peak load, which fairly rapidly declines over 10-12 mm of
deflection, is caused by the formation of the yield-line mechanism which requires the tensile
strength of the concrete to be overcome progressively along the yield lines as the maximum tensile
strain moves along the yield lines from the central region towards the corners, and as the initial
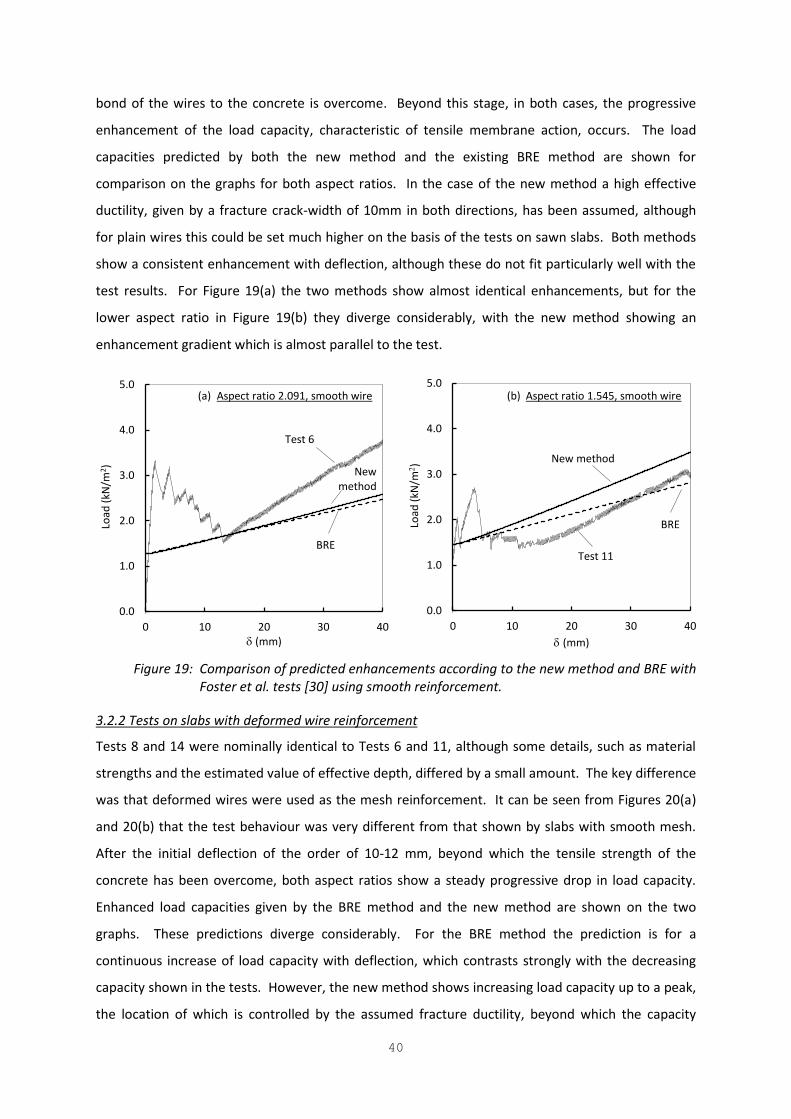
40
bond of the wires to the concrete is overcome. Beyond this stage, in both cases, the progressive
enhancement of the load capacity, characteristic of tensile membrane action, occurs. The load
capacities predicted by both the new method and the existing BRE method are shown for
comparison on the graphs for both aspect ratios. In the case of the new method a high effective
ductility, given by a fracture crack-width of 10mm in both directions, has been assumed, although
for plain wires this could be set much higher on the basis of the tests on sawn slabs. Both methods
show a consistent enhancement with deflection, although these do not fit particularly well with the
test results. For Figure 19(a) the two methods show almost identical enhancements, but for the
lower aspect ratio in Figure 19(b) they diverge considerably, with the new method showing an
enhancement gradient which is almost parallel to the test.
Figure 19: Comparison of predicted enhancements according to the new method and BRE with
Foster et al. tests [30] using smooth reinforcement.
3.2.2 Tests on slabs with deformed wire reinforcement
Tests 8 and 14 were nominally identical to Tests 6 and 11, although some details, such as material
strengths and the estimated value of effective depth, differed by a small amount. The key difference
was that deformed wires were used as the mesh reinforcement. It can be seen from Figures 20(a)
and 20(b) that the test behaviour was very different from that shown by slabs with smooth mesh.
After the initial deflection of the order of 10-12 mm, beyond which the tensile strength of the
concrete has been overcome, both aspect ratios show a steady progressive drop in load capacity.
Enhanced load capacities given by the BRE method and the new method are shown on the two
graphs. These predictions diverge considerably. For the BRE method the prediction is for a
continuous increase of load capacity with deflection, which contrasts strongly with the decreasing
capacity shown in the tests. However, the new method shows increasing load capacity up to a peak,
the location of which is controlled by the assumed fracture ductility, beyond which the capacity
0.0
1.0
2.0
3.0
4.0
5.0
0 10 20 30 40
Loa
d (
kN
/m2)
(mm)
Test 6
New
method
BRE
0.0
1.0
2.0
3.0
4.0
5.0
0 10 20 30 40
Loa
d (
kN
/m2 )
(mm)
New method
Test 11
BRE
(a) Aspect ratio 2.091, smooth wire (b) Aspect ratio 1.545, smooth wire
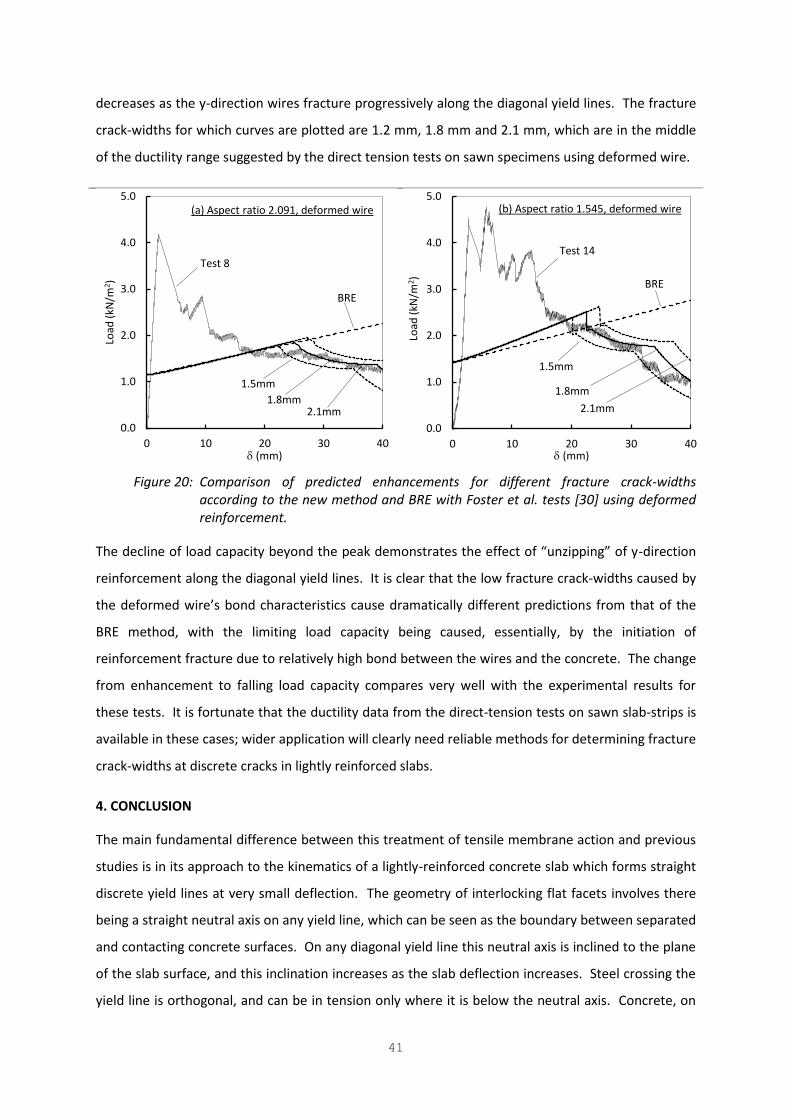
41
decreases as the y-direction wires fracture progressively along the diagonal yield lines. The fracture
crack-widths for which curves are plotted are 1.2 mm, 1.8 mm and 2.1 mm, which are in the middle
of the ductility range suggested by the direct tension tests on sawn specimens using deformed wire.
Figure 20: Comparison of predicted enhancements for different fracture crack-widths
according to the new method and BRE with Foster et al. tests [30] using deformed
reinforcement.
TエW SWIノキミW ラa ノラ;S I;ヮ;Iキデ┞ HW┞ラミS デエW ヮW;ニ SWマラミゲデヴ;デWゲ デエW WaaWIデ ラa さ┌ミ┣キヮヮキミェざ ラa ┞-direction
reinforcement along the diagonal yield lines. It is clear that the low fracture crack-widths caused by
デエW SWaラヴマWS ┘キヴWげゲ HラミS Iエ;ヴ;IデWヴキゲデキIゲ I;┌ゲW Sヴ;マ;デキI;ノノ┞ SキaaWヴWミデ ヮヴWSキIデキラミs from that of the
BRE method, with the limiting load capacity being caused, essentially, by the initiation of
reinforcement fracture due to relatively high bond between the wires and the concrete. The change
from enhancement to falling load capacity compares very well with the experimental results for
these tests. It is fortunate that the ductility data from the direct-tension tests on sawn slab-strips is
available in these cases; wider application will clearly need reliable methods for determining fracture
crack-widths at discrete cracks in lightly reinforced slabs.
4. CONCLUSION
The main fundamental difference between this treatment of tensile membrane action and previous
studies is in its approach to the kinematics of a lightly-reinforced concrete slab which forms straight
discrete yield lines at very small deflection. The geometry of interlocking flat facets involves there
being a straight neutral axis on any yield line, which can be seen as the boundary between separated
and contacting concrete surfaces. On any diagonal yield line this neutral axis is inclined to the plane
of the slab surface, and this inclination increases as the slab deflection increases. Steel crossing the
yield line is orthogonal, and can be in tension only where it is below the neutral axis. Concrete, on
0.0
1.0
2.0
3.0
4.0
5.0
0 10 20 30 40
Loa
d (
kN
/m2)
(mm)
Test 8
BRE
1.5mm
1.8mm 2.1mm
(a) Aspect ratio 2.091, deformed wire
0.0
1.0
2.0
3.0
4.0
5.0
0 10 20 30 40
Loa
d (
kN
/m2)
(mm)
BRE
Test 14
1.5mm
1.8mm
2.1mm
(b) Aspect ratio 1.545, deformed wire
42
the other hand, is only compressed within the area above the neutral axis, and produces a resultant
compressive force normal to the yield line. Individual cross-sections through yield lines are not
required to create an equilibrium of normal stresses, except at infinitesimal deflection; each of the
flat facets caused by the appearance of discrete yield lines must be in equilibrium under the whole
system of resultant forces to which it is subjected. As the deflection increases the neutral axis level
rises above the top surface of the slab, leaving only the reinforcement crossing the crack to impose
tension in the middle area of the slab. A very similar approach to the kinematics of rectangular slabs
in tensile membrane action has recently been used by Herraiz and Vogel [31] in a recent analysis of
tensile membrane action of reinforced concrete slabs. Their approach includes an elastic deflection
prior to the rigid-plastic yield line phase and assumes that the initial fracture of reinforcement or an
estimate of ultimate concrete compressive strain at the slab corners defines structural failure, and
they do not consider the behaviour as the reinforcing mesh fractures across yield lines. However,
they have modified a bond-slip model based on the FIB Model Code [32] to estimate fracture crack-
width. This is clearly worthy of further experimental investigation as an analytical predictor of
fracture ductility of the light meshes used in composite slabs.
Wherever the reinforcement in either direction is in tension across a yield line this implies that it is
crossing the yield line at a point where there is a separation between the two opposing faces of the
discrete crack which defines the extension of a finite length of reinforcing bar as a uniform plastic
strain below the fracture strain of the steel material. This finite length depends on failure of the
bond between the bar and the concrete over finite lengths either side of the crack. Clearly tensile
membrane action would be impossible with perfect bond between steel and concrete, because the
bars would fracture instantly within the cracks. On the other hand, remembering that the context in
which the behaviour is important is for the relatively thin slabs reinforced only with anti-crack mesh
that typically form composite floors, the tensile strength of the steel reinforcement in either
direction is less than that of the whole concrete cross-section, and cracking is localized. In more
heavily reinforced slabs, in which the reinforcement layer is stronger in tension than the concrete
cross-section, the cracking can be distributed over a distance either side of a yield-line. There is
currently insufficient reliable information concerning the pull-out characteristics of deformed bars
from discrete crack surfaces; this is necessary in order to define the free lengths over which the
known fracture strain of the steel bars can be used to specify crack widths at bar fracture. However,
significant work has been done in recent years by Cashell et al. [33] and by Sezen and Setzler [34] in
developing simplified bond models, either of which could form the basis for a general design model
of pull-out at a discrete crack which could be guaranteed as conservative but otherwise accurate. In
this paper the problem has been dealt with provisionally for plain welded mesh by assuming that
43
H;ヴゲ ;ヴW a┌ノノ┞ SWデ;IエWS aヴラマ デエW IラミIヴWデW HWデ┘WWミ デエW ヮラゲキデキ┗W さ;ミIエラヴ ヮラキミデゲざ ;デ ┘エキIエ デヴ;ミゲ┗WヴゲW
bars are welded to the bars under consideration (in most practical meshes these are at 200mm
spacing, and this has been assumed in the full-scale examples presented), and assigning artificially
low ductility to the steel. Essentially, however, this is just one way of defining the crack-width, at
the level of the reinforcement, at which a bar fractures, and for the comparisons with model-scale
tests on orthotropic slabs experimentally-determined fracture crack-widths have been used,
showing an extremely promising degree of correlation with the reducing load capacity in the tests.
Clearly there is a need for more work on bar pull-out from discrete cracks, because the fracture of
ヴWキミaラヴIWマWミデ ;Iヴラゲゲ Iヴ;Iニゲが WゲヮWIキ;ノノ┞ デエW キミキデキ;デキラミ ラa さ┌ミ┣キヮヮキミェざ ラa マWゲエ ;ノラミェ デエW Sキ;ェラミ;ノ ┞キWノS
lines, has been shown to be the key effect which limits the enhancement of yield-line load capacity
with increasing deflection, and initiates structural collapse of the slab. In fire, which will eventually
be the context in which this model is most relevant, it should also be capable of including the effect
of differential thermal expansions on pull-out characteristics.
It is should be remembered that this work has been done as an essential first step in re-developing a
method for assessing the load capacity of lightly-reinforced composite slabs in fire conditions, at
very high temperatures which reduce the contribution from the attached steel beams to a very low
level. In this context the limiting condition may be either a resistance failure (either local or global
loss of structural capacity) of the slab, or as a compartment integrity failure (a through-depth crack
which allows flames to pass through to the adjacent compartment at the upper face of the slab).
Both of these may be interpreted in different ways. It may be considered that the first peak of
capacity in an enhancement curve, often caused by fracture of the bars crossing the central yield
line, is sufficient to define a resistance failure, although this usually stabilizes with increasing
SWaノWIデキラミ ┌ミデキノ ; ゲWIラミS ;ミS aキミ;ノ ヮW;ニ キゲ I;┌ゲWS H┞ デエW ゲデ;ヴデ ラa Sキ;ェラミ;ノ さ┌ミ┣キヮヮキミェざく TエW エキェエWヴ ラa
the two peaks definitely indicates the limiting capacity of the slab. In terms of fire compartment
integrity there are also different possibilities. The concrete surfaces either side of the central yield
line lose contact when the neutral axis depth at the intersections becomes negative; in a composite
slab it is likely that steel decking will continue to cross this through-depth crack, creating a physical
barrier to hot gases passing through, although there may still be some heat transmission by
radiation from the upper surface of this thin sheet. A similar argument may be applied to the
appearance of a central through-depth crack across the short span, which initiates a new mechanism
not considered in this paper. In either case criteria need to be developed to identify integrity failure
of composite slabs.

44
Subsequent papers will deal with high-temperature applications in which tensile membrane action
occurs, as well as explicitly covering the effect of heating of unprotected downstand beams and the
reinforcing mesh.
REFERENCES
[1] Johansen, K.W., "Brudlinieteorier", Copenhagen 1943. (English translation "Yield-Line Theory",
Cement and Concrete Association, London, 1962).
[2] Hognestad, E., "Yield-line theory for the ultimate flexural strength of reinforced concrete
slabs", ACI Journal, 49, March 1953.
[3] Park, R. and Gamble, W., さRWキミaラヴIWS concrete slabsざ, Wiley, London, 2000.
[4] Ockleston, A. J. "Load tests on a three storey reinforced concrete building in Jラエ;ミミWゲH┌ヴェざが The Structural Engineer, (1955).
[5] Hillerborg, A., "Jamviktsteori for axmerade betongplattor", Betong, 41 (4), 1956. (English
デヴ;ミゲノ;デキラミ さTエWラヴ┞ ラa equilibrium for reinforced concrete slabsざ H┞ Gく Nく GキHゲラミが B┌キノSキミェ Research Station Library Communication No. 1082).
[6] Hillerborg, A., "Strip method of designざ, Viewpoint, London, 1975, 256 pp.
[7] Wood, R.H., and Armer, G.S.T., "The theory of the strip-method for design of slabs", Proc. ICE,
40, (1968).
[8] P;ヴニが Rくが さTWミゲキノW membrane behaviour of uniformly loaded rectangular reinforced concrete
slabs with fully restrained edgesざが Magazine of Concrete Research, 16 (46), (1964) pp 39-44.
[9] P;ヴニ Rくが さUノデキマ;デW strength of rectangular concrete slabs under short-term uniform loading
with edges restrained against lateral movementざが Proc. Institution of Civil Engineers, 28,
(1964) pp 125-150.
[10] Brotchie, J.F. and Holley, M.J., さMWmbrane action in slabs: cracking, deflection and ultimate
load of concrete slab systemsざ, Publication SP-30, American Concrete Institute, Detroit, Paper
30-16, (1971) pp 345-377.
[11] “;┘I┣┌ニが Aく ;ミS WキミミキIニキが Lくが さPノ;ゲデキI behavior of simply supported reinforced concrete plates
at moderately large deflectionsざが Int. J. Solids Structures, 1, (1965) pp 97-111.
[12] KWマヮが KくOくが さYキWノS ラa a square reinforced concrete slab on simple supports, allowing for
membrane forcesざが The Structural Engineer, 45 (7), (1967) pp 235-240.
[13] H;┞Wゲが Bくが さAノノラ┘キミェ aラヴ membrane action in the plastic analysis of rectangular reinforced
concrete slabsざが Magazine of Concrete Research, 20 (65), (1968) pp 205-212.
[14] Hayes, B., さA study of the design of reinforced concrete slab structuresざ, PhD thesis, University
of Manchester, 1968, 398 pp.
[15] Wood, R.H., "Plastic and elastic design of slabs and plates, with particular reference to
reinforced concrete floor slabs", Thames and Hudson, London, 1961.
[16] Gillies, A., Unpublished communication
[17] Kirby, B.R., さTエW HWエ;┗キラ┌ヴ ラa マ┌ノデキ-storey steel framed buildings in fire: a European joint
ヴWゲW;ヴIエ ヮヴラェヴ;ママWざ, British Steel Swinden Technology Centre, 1999.
[18] さB“ヵΓヵヰぎ “デヴ┌Iデ┌ヴ;ノ use of steelwork in buildings: Part 8: Code of practice for fire resistant
designざ, British Standards Institution,, London, (1990).
45
[19] さENVヱΓΓヴ-1-2: 1992: Eurocode 4: Design of composite steel and concrete structures, Part 1.2:
Structural fire design ふDヴ;aデぶざ, European Committee for Standardisation, Brussels, (1992).
[20] W;ミェが YくCくが さTWミゲキノW マWマbrane action in slabs and its application to the Cardington fire tests.
FキヴWが ゲデ;デキI ;ミS S┞ミ;マキI デWゲデゲ ラa H┌キノSキミェ ゲデヴ┌Iデ┌ヴWゲざが PヴラIWWSキミェs of the Second Cardington
Conference, England, (1996), pp 55に67.
[21] Newman G.M., Robinson J.T. and Bailey C.G., さFキヴW safe design: A new approach to multi-
storey steel-framed buildingsざ, The Steel Construction Institute, Ascot, UK (2000).
[22] Bailey, C.G., さDWゲキェミ ラa ゲデWWノ ゲデヴ┌Iデ┌ヴWゲ ┘キデエ IラマヮラゲキデW ゲノ;Hゲ ;デ デエW aキヴW ノキマキデ ゲデ;デWざ, BRE Final
Report to the Department of the Environment, Transport and Regions, Report No. 81415,
Building Research Establishment, Garston, UK, 2000.
[23] B;キノW┞が CくGく ;ミS MララヴWが DくBくが さTエW ゲデヴ┌Iデ┌ヴ;ノ HWエ;┗キラ┌ヴ ラa ゲデWWノ aヴ;マWゲ ┘キデエ IラマヮラゲキデW aノララヴゲ slabs subject to fire に P;ヴデ ヱぎ TエWラヴ┞ざが The Structural Engineer, 78 (11), (2000) pp 19-27.
[24] Baileyが CくGくが WエキデWが Dく“く ;ミS MララヴWが DくBくが さTエW デWミゲキノW マWマHヴ;ミW ;Iデキラミ ラa ┌ミヴWゲデヴ;キミWS composite slabs simulated under fire conditionsざが Engineering Structures, 22, (2000) pp 1583に1595.
[25] B;キノW┞が CくGくが さMWマHヴ;ミW ;Iデキラミ ラa ┌ミヴWゲデヴ;キミWS ノキェエデノ┞ ヴWキミaラヴIWS IラミIヴWデW ゲノ;Hゲ ;デ ノ;ヴェW Sキゲヮノ;IWマWミデゲげが Engineering Structures, 23, (2001) pp 470-483.
[26] Clifton, G.C., さDesign of multi-storey steel framed buildings with unprotected secondary beams
or joists for dependable inelastic response in severe firesざ, HERA Steel Design & Construction
Bulletin, 60, Manukau City, New Zealand (2001).
[27] Vassart, O. and Zhao, Bくが さFRACOFぎ FキヴW ヴWゲキゲデ;ミIW ;ゲゲWゲゲマWミデ ラa ヮ;ヴデキ;ノノ┞ ヮヴラデWIデWS IラマヮラゲキデW floors. Engineering backgroundざ, Arcelor Mittal & CTICM (2011).
[28] Vassart, O. and Zhao, B., さFRACOFぎ FキヴW ヴWゲキゲデ;ミIW ;ゲゲWゲゲマWミデ ラa ヮ;ヴデキ;ノノ┞ ヮヴラデWIデWS Iomposite
floors. Design guideざが Arcelor Mittal & CTICM (2011).
[29] さBS EN 1992-1-1: 2004: Eurocode 2: Design of concrete structures, Part 1-1: General rules and
ヴ┌ノWゲ aラヴ H┌キノSキミェゲざ, British Standards Institution, London (2004).
[30] FラゲデWヴが “くJくが B;キノW┞が CくGくが B┌ヴェWゲゲが IくWく ;ミS Pノ;ミニが RくJくが さE┝ヮWヴキマWミデ;ノ behaviour of concrete
floor slabs at large displacementsざが Engineering Structures, 26 (9), (2004) pp 1231-1247.
[31] HWヴヴ;キ┣が Bく ;ミS VラェWノが Tくが さNovel design approach for the analysis of laterally unrestrained
ヴWキミaラヴIWS IラミIヴWデW ゲノ;Hゲ IラミゲキSWヴキミェ マWマHヴ;ミW ;Iデキラミざが Engineering Structures, 123, (2016),
pp 313-329.
[32] International Federation for Structural Concrete (FIB). さaキH MラSWノ CラSW ヲヰヱヰが Fキヴゲデ ESキデキラミざ,
Ernst & Sohn, Lausanne, Switzerland (2013).
[33] Cashell,K.A., Elghazouli, A.Y. and Izzuddinが BくAくが さE┝ヮWヴキマWミデ;ノ ;ミS ;ミ;ノ┞デキI;ノ ;ゲゲWゲゲマWミデ ラa S┌Iデキノキデ┞ キミ ノキェエデノ┞ ヴWキミaラヴIWS IラミIヴWデW マWマHWヴゲざが Engineering Structures, 32 (9), (2010) pp
27292743
[34] “W┣Wミが Hく ;ミS “Wデ┣ノWヴが Eくが さRWキミaラヴIWマWミデ ゲノキヮ キミ ヴWキミaラヴIWS IラミIヴWデW Iラノ┌マミゲざが ACI Structural
Journal, 105 (3), (2008) pp 280に289.
46
Notation List
BRE/Bailey method [13, 14, 22, 23]
e Weighted-mean enhancement factor
1 2,e e Enhancement factors for triangular and trapezoidal slab facets
n Dimensionless coordinate of yield line intersection as a proportion of L (long span)
Slab aspect ratio (x:y)
Orthotropy ratio, equivalent to in current method (below)
Current method
1 2, yA A Concrete stress block areas on diagonal and central yield lines
C Concrete resultant force across a diagonal yield line
2 2,x yC C Concrete x- or y- direction resultant forces on central yield line
,px pyf f Steel strengths per unit width in x and y directions
cf Concrete strength
l y-dimension of slab
,x yn n Dimensionless coordinates of yield line intersection in x- and y-aligned mechanisms
p Distributed load intensity on slab
r Aspect ratio of slab (x:y)
S Resultant shear force along a diagonal yield line
t Thickness of slab
1xT , 2xT Tensile resultant forces in x-aligned mesh
1 2,y yT T Tensile resultant forces in y-aligned mesh
,u v Movements of a point on a crack-face in x and y directions
,C Cu v Movements of centroid of diagonal concrete stress block in x and y directions
1 1 2 ,,x y yT T Tu v v Movements of resultant mesh forces on diagonal and central yield lines
2yCv Movement of centroid of central concrete stress block in y direction
eW External work: loss of potential of load on slab
iW Internal work: plastic movements of steel and concrete
, ,x y z Coordinate system
,1 ,1 ,1, ,CA CA CAx y z Coordinates of concrete stress-block centroids on diagonal and central yield lines
,1lim yx Limiting x coordinate of unbroken y-direction reinforcement
,1 tx x coordinate at which y reinforcement emerges from compressive stress block
,1lim xy Limiting y coordinate of unbroken x-direction reinforcement
,1ty y coordinate at which x reinforcement emerges from compressive stress block
1 2,z z Depths of concrete stress block at slab corner and yield line intersection
47
Angle of diagonal yield line to y axis
A Deflection of centre of slab
,x y x and y movements of facets at corner of slab
, ,,lim x lim y Limiting x and y crack widths at which reinforcement fractures
,x y Dimensionless limiting crack widths ,lim x
xl
and ,lim y
yl
Rotation of slab Facet 1 about x axis
Rotation of slab Facet 2 about y axis
Mesh depth as a proportion of slab thickness
,x y Dimensionless strength ratios px
x
c
f
f l and
py
y
c
f
f l
1 2, Dimensionless stress block depths 1 1 2 2/ , /z l z l
Dimensionless slab thickness t/l
Orthotropy factor /py pxf f
48
Table Captions
Table 1: Combinations of compression block configuration and rebar fracture for x-aligned cases.
Table 2: In-plane equilibrium equations for different possible x-aligned cases. Cases with concrete
stress blocks on central and diagonal yield lines.
Table 3: In-plane equilibrium equations for different possible x-aligned cases. Cases with
triangular concrete stress blocks on diagonal yield lines.
Table 4: In-plane equilibrium equations for different possible x-aligned cases. Cases with
trapezoidal concrete stress blocks on diagonal yield lines.
Table 5: Combinations of compression block configuration and rebar fracture for y-aligned cases.
Table 6: In-plane equilibrium equations for different possible y-aligned cases. Cases with concrete
stress blocks on central and diagonal yield lines.
Table 7: In-plane equilibrium equations for different possible y-aligned cases. Cases with
triangular concrete stress blocks on diagonal yield lines.
Table 8: In-plane equilibrium equations for different possible y-aligned cases. Cases with
trapezoidal concrete stress blocks on diagonal yield lines.

49
Figure Captions
Fig. 2: Stages of development of a yield-line mechanism in a concrete slab.
Fig. 3: Illustrations of tensile membrane action. (a) Stresses in a concrete slab; (b) Forces in a
bicycle wheel
Fig. 4: Different plastic mechanisms considered by Sawczuk and Winnicki [9].
Fig. 5: H;┞Wゲげゲ ぷヱヰが ヱヱへ マWマHヴ;ミW aラヴIW マラSWノゲく ふ;ぶ CラミIヴWデW Iラミデ;Iデ ラミ ┘エラノW ノWミgth of
diagonal yield lines; (b) No concrete contact near yield line intersections; (c) In-plane
equilibrium of forces.
Fig. 6: B;キノW┞げゲ ぷヱヰが ヱヱへ マWマHヴ;ミW aラヴIW マラSWノく ふ;ぶ CラミIヴWデW Iラミデ;Iデ ラミ ┘エラノW ノWミェデエ ラa diagonal yield lines; (b) In-plane equilibrium of forces.
Fig. 7: Changes in yield-line geometry for different ratios 血椎掴 血椎槻エ ┻ (a) x-aligned; (b) transition;
(c) y-aligned.
Fig. 8: Geometry of diagonal yield-line crack opening. (a) Crack opening at rebar level; (b) Top
surface of slab, including rigid-body movements of triangular and trapezoidal slab
facets.
Fig. 9: Movements of a point on the diagonal yield line. (a) Plan view of top surface of slab; (b)
x-direction motion u on triangular Facet 2; (c) y-direction motion v on trapezoidal
Facet 1.
Fig. 10: Projection on the x-direction of the yield lines at different stages; (a) Concrete stress
blocks on all yield lines; (b) Triangular stress blocks above rebar on diagonal yield lines;
(c) Triangular stress blocks below rebar on diagonal yield lines; (d) Trapezoidal stress
blocks on diagonal yield lines.
Fig. 11: The horizontal force system between facets along the yield lines, for x-aligned
mechanisms.
Fig. 12: The horizontal force system between facets along the yield lines, for y-aligned
mechanisms.
Fig. 13: Slab capacity enhancement factors with displacement for slabs of width 6m and
different aspect ratios and mesh effective depths.
Fig. 14: Variation of capacity with aspect ratio for isotropically-reinforced slabs: (a)
Dimensionless enhancement factor; (b) Actual capacity for the particular slab cross-
section.
Fig. 15: Variation of the resultant forces on yield lines with deflection of the slab (r=1.5,
d1=20mm, ductility 1%).
Fig. 16: Variation of the maximum tensile in-plane bending stresses on yield lines with
deflection of the slab (r=1.5, d1=20mm, ductility 1%).
Fig. 17: Optimal x- and y-aligned yield-line mechanisms for a 9m x 6m slab with mesh effective
depth 20mm with different orthotropy ratios; (a) nx and ny; (b) Yield-line capacities.
50
Fig. 18: Enhancement for orthotropic slabs with y-reinforcement constant at 142mm2/m; x-
reinforcement areas/m marked in legends. (a) x-aligned mechanisms. (b) y-aligned
mechanisms.
Fig. 19: Variation of the maximum tensile in-plane bending stresses at position Q with
deflection of the slab (r=1.5, d1=20mm, ductility 1%) for different areas of x-
reinforcement per metre, keeping y-reinforcement constant at 141.2mm2/m.
Fig. 20: Comparison of predicted enhancements according to the new method and BRE with
Foster et al. tests [30] using smooth reinforcement.
Fig. 21: Comparison of predicted enhancements for different fracture crack-widths according to
the new method and BRE with Foster et al. tests [30] using deformed reinforcement.