Embed Size (px)
Citation preview
Your Global Guide to Alternative PaymentsSecond Edition
www.worldpay.comwww.worldpay.com 3
Introduction 04
Defining alternative payments 05
Alternative payments by type 06
A global overview 10
Global E-transaction payment mix 12
Alternative payment share by country 14
Trends and drivers 21
Top ten alternative payments 25
Alternative payments across the globe 27
About the data in this report 71
Contents
www.worldpay.com 5www.worldpay.com
This report considers an alternative payment to be any payment type that is not a credit or debit card.That includes the following payment methods:
Bank transfers
• Real-time bank transfers
• Offline bank transfers
Direct debits
E-wallets
Mobile
Cash on delivery
Other
• Local card schemes
• Pre-pay
• Post-pay
• E-invoices
• Digital currencies
Defining alternative paymentsThe e-commerce economy is growing at a rapid pace with a significant increase in global online transactions. WorldPay’s e-commerce division reported that transaction volumes rose by 16% in 2013, compared to 2012 across all its product groups. The value of payments processed by alternative means was up 21% in 2013, with turnover value up 44%, compared to 2012. This growth means that customers are embracing different ways to pay for goods and services: retailers and providers of services can no longer just offer credit and debit cards as a means of payment.
With more than 300 alternative payment schemes in operation around the world, merchants need to understand which payment types to offer, and that in turn depends where their customers are and what kind of services are being offered. Given the increasingly globalised nature of e-commerce, a payment strategy that focuses on the needs of customers around the world is essential to maximise transaction acceptance and expand global reach.
The WorldPay payment portfolio includes more than 200 alternative payment methods. As an expert in the complexity of the payment landscape, WorldPay advises merchants on the most effective payment types to offer.
This is the second edition of the Alternative Payments Report, which seeks to provide an in-depth view of the alternative payment landscape by volume, type, sector and country. We hope you find it useful.
Introduction
4
www.worldpay.comwww.worldpay.com 7
Bank transfersOnline (real-time) bank transfers offer merchants payment with immediate online authorisation via a customer’s bank, usually followed by next-day settlement. Banking systems are moving towards quicker payments.
Example schemes: iDEAL, eNets and Sofortuberweisung.
Offline bank transfers are in most cases processed via the customer’s online bank account. Instead of being redirected during the transaction process, the customer is presented with a reference number, which the customer must then quote when they log into their online bank account to make a payment. The customer can also choose to pay in a bank branch or via telephone banking using the same reference number.
Example schemes: Dineromail, SafetyPay and PayU2.
2 Please note all providers offer a breadth of services, not just offline
Transactional value and share of payments market in US billions:
2012 - $122 / 7%
2017 - $245 / 6%
Alternative payments by type
Direct debitsLimited mainly to low-value or recurring transactions, direct debits are not relevant to all merchants. Although direct debits carry the risk of chargebacks, they are popular with customers and merchants for regular, predictable payments such as subscriptions.
Example schemes: SEPA, ELV (Elektronisches Lastschriftverfahren Germany) and Domiciliacion Bancaria (Spain).
Transactional value and share of payments market in US billions:
2012 - $42 / 2%
2017 - $54 / 1%
6
E-wallets E-wallets are the fastest growing payment type around the world, and are increasingly popular for purchasing digital goods and video games because they are easy for the customer to use. In more mature e-commerce economies such as the UK and US, new e-wallet products from traditional card providers such as V.me by Visa are increasingly being accepted by merchants. Globally, Alipay and PayPal continue to dominate the e-wallet market. Growth is largely driven by younger shoppers accustomed to using e-wallets for online purchases.
Example schemes: Alipay, V.me by Visa and Qiwi.
Transactional value and share of payments market in US billions:
2012 - $295 / 17%
2017 - $1,656 / 41%
Mobile Mobile payments fall into two categories, direct carrier billing and mobile wallets.
Direct carrier billing has become an important payment mechanism with the rise of smartphones and app stores and aligns well with the purchase of digital goods and in-app payments. The process is quick and simple and enables the shopper to remain relatively anonymous, only needing to provide their phone number to complete payment.
The number of mobile wallet solutions have increased in the last 12 months with a wide range of differing solutions becoming available. Due to the infancy of many of these solutions, they predominantly only operate in their own local country / territory with only a very small number demonstrating a truly global capability.
Example schemes: Boku, MoPay, Zong, Zapp, SEQR, Znap (MPayME), Pingit and PayBox
Transactional value and share of payments market in US billions:
2012 - $18 / 1%
2017 - $117 / 3%
www.worldpay.com www.worldpay.com 98
Cash on delivery Payment is taken when the goods are delivered and collected by the courier rather than by the merchant. This method is increasingly less prevalent as it is declining in popularity both with merchants and customers.
Example schemes: Merchant and delivery company specific.
Transactional value and share of payments market in US billions:
2012 - $93 / 5%
2017 - $93 / 2%
OthersLocal card schemes
Local card schemes, specific to certain markets, often operate much like traditional cards, but some schemes will be more sophisticated, for instance offering card and bank transfer options. These schemes generally require the shopper to be redirected to their own pages for payment completion.
Example schemes: MisterCash (Belgium), UnionPay (China), Carte Bleue (France)
Pre-pay
Customers are required to buy and add funds to a card or voucher before starting a transaction, which means that these cards are usually authorised immediately. Most pre-pay products have a funding limit and some will not allow multiple cards/vouchers to fund a single transaction, which means that pre-pay methods are not generally suitable for high-value goods.
Example schemes: Astropay, Postepay, Swiff, uKash, Neosurf, Paysafecard and Toditocash.
Post-pay
Customers using post-pay methods are required to settle payment at an affiliated outlet or store after making a transaction online. Businesses that accept post-pay methods have to be prepared for delays between a transaction being made and payment being
settled. This payment method may not be suitable for perishable goods and time-sensitive purchases such as travel tickets.
Example schemes: Konbini, Boleto Bancário Multibanco
E-invoices
E-invoices enable customers to receive goods and pay after delivery without the need for sharing sensitive credit card or bank details. The process for customers can be as simple as entering their email address and postcode to make a payment, while the risk of fraud is reduced for merchants.
Example schemes: Klarna, Billmelater and Afterpay.
Digital currencies
Digital currencies or crypto-currencies such as Bitcoin are gaining traction. However, the barriers to entry are high as they require a degree of technical know-how and confidence, and they are not backed by governments or central banks, nor linked to any real-world currencies. Additionally, their value can fluctuate dramatically.
Example scheme: Bitcoin and Litecoin.
Transactional value and share of payments market in US billions:
2012 - $164 / 10%
2017 - $209 / 5%

www.worldpay.com 11www.worldpay.com10
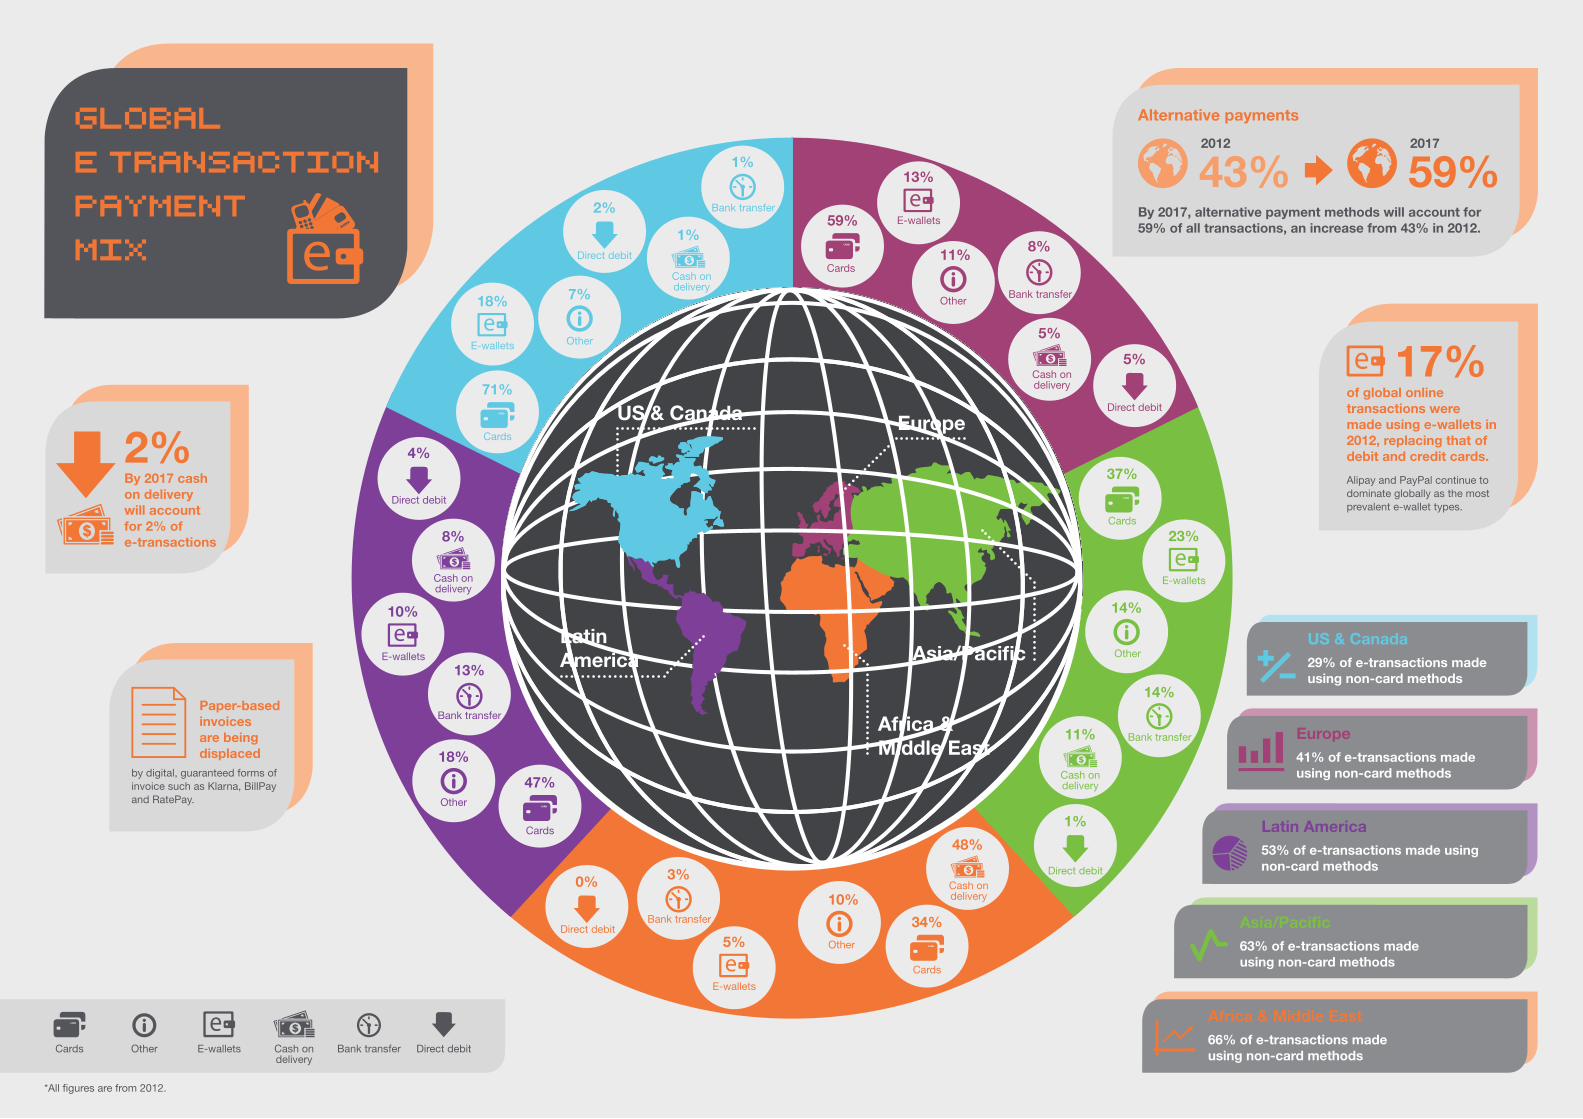
In 2012, the total global e-commerce market was worth $1,713 billion and it continues to grow. Whilst traditional payment methods are more popular in mature markets such as the UK and the US, other regions are seeing strong growth in alternative payments. It’s estimated that alternative payments will account for 59% of all online transactions in 2017, up from 43% in 2012.
Europe
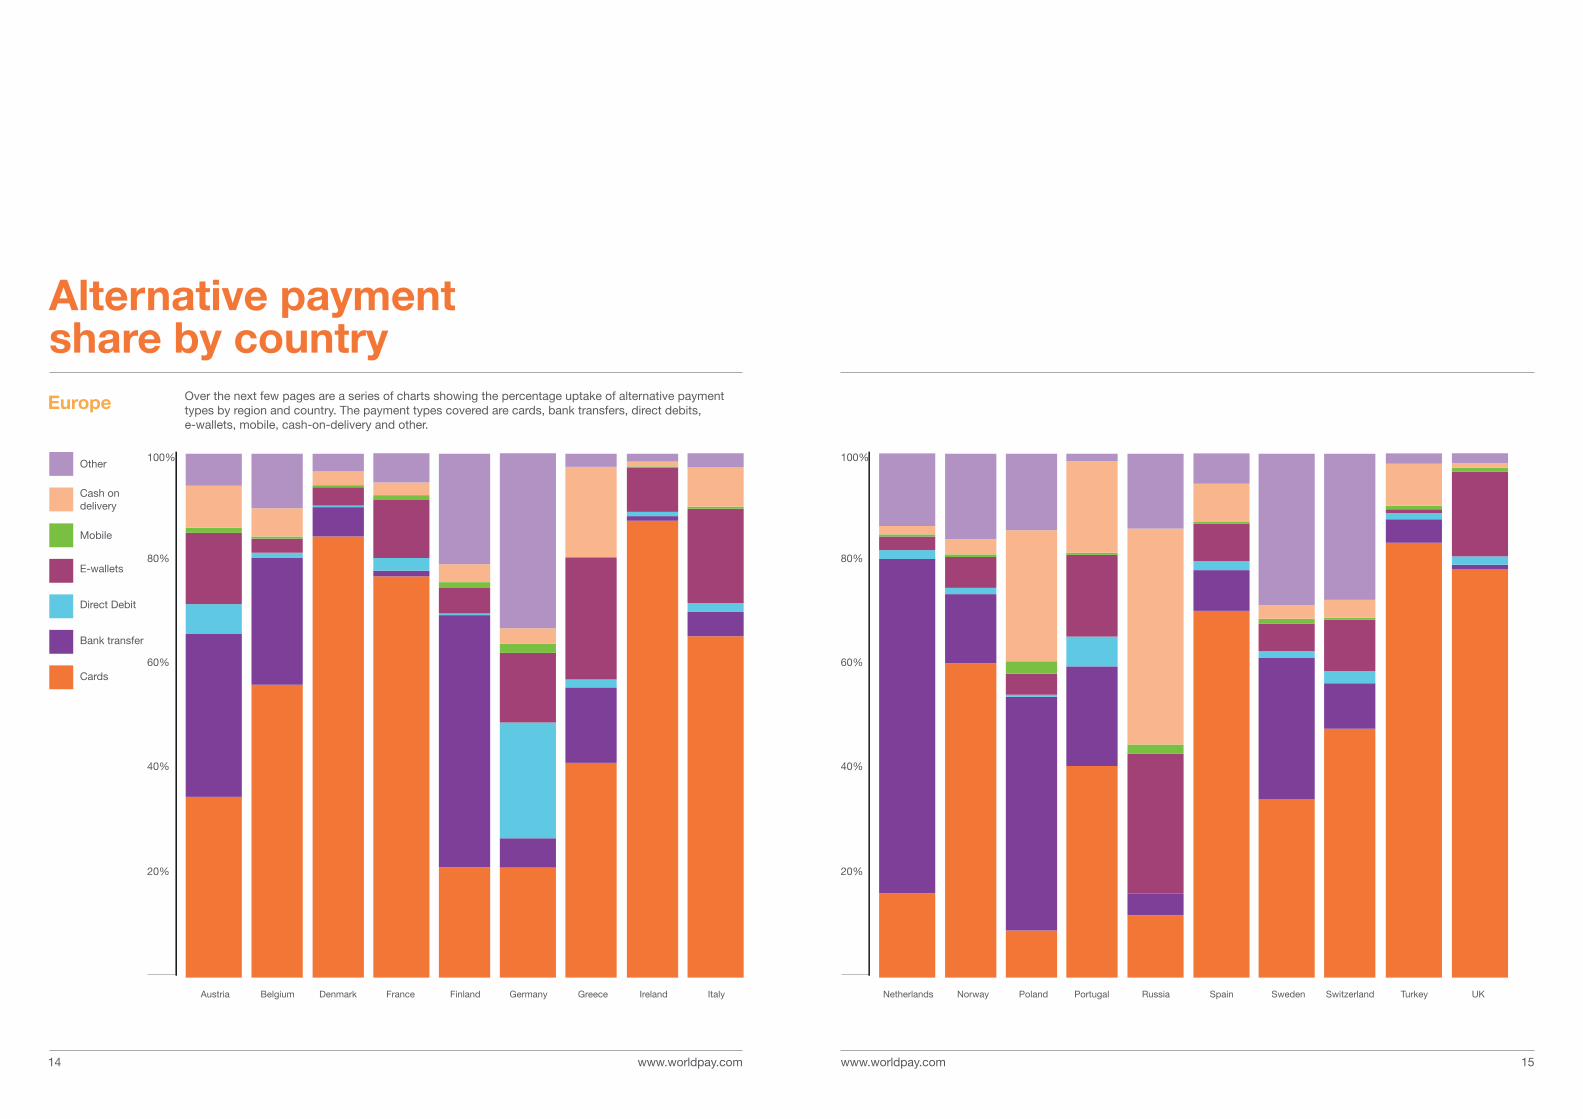
Europe accounted for 34% of the global e-commerce market in 2012 with a turnover of $579 billion. 41% of transactions were made using alternative payment methods in 2012 with e-wallets being the most popular method. The popularity of alternative payment methods varies significantly between countries – nations such as the UK, Ireland, Denmark and Turkey are still heavy card users, while alternative payment methods dominate in countries including Poland, Finland, Germany and the Netherlands.
The Americas
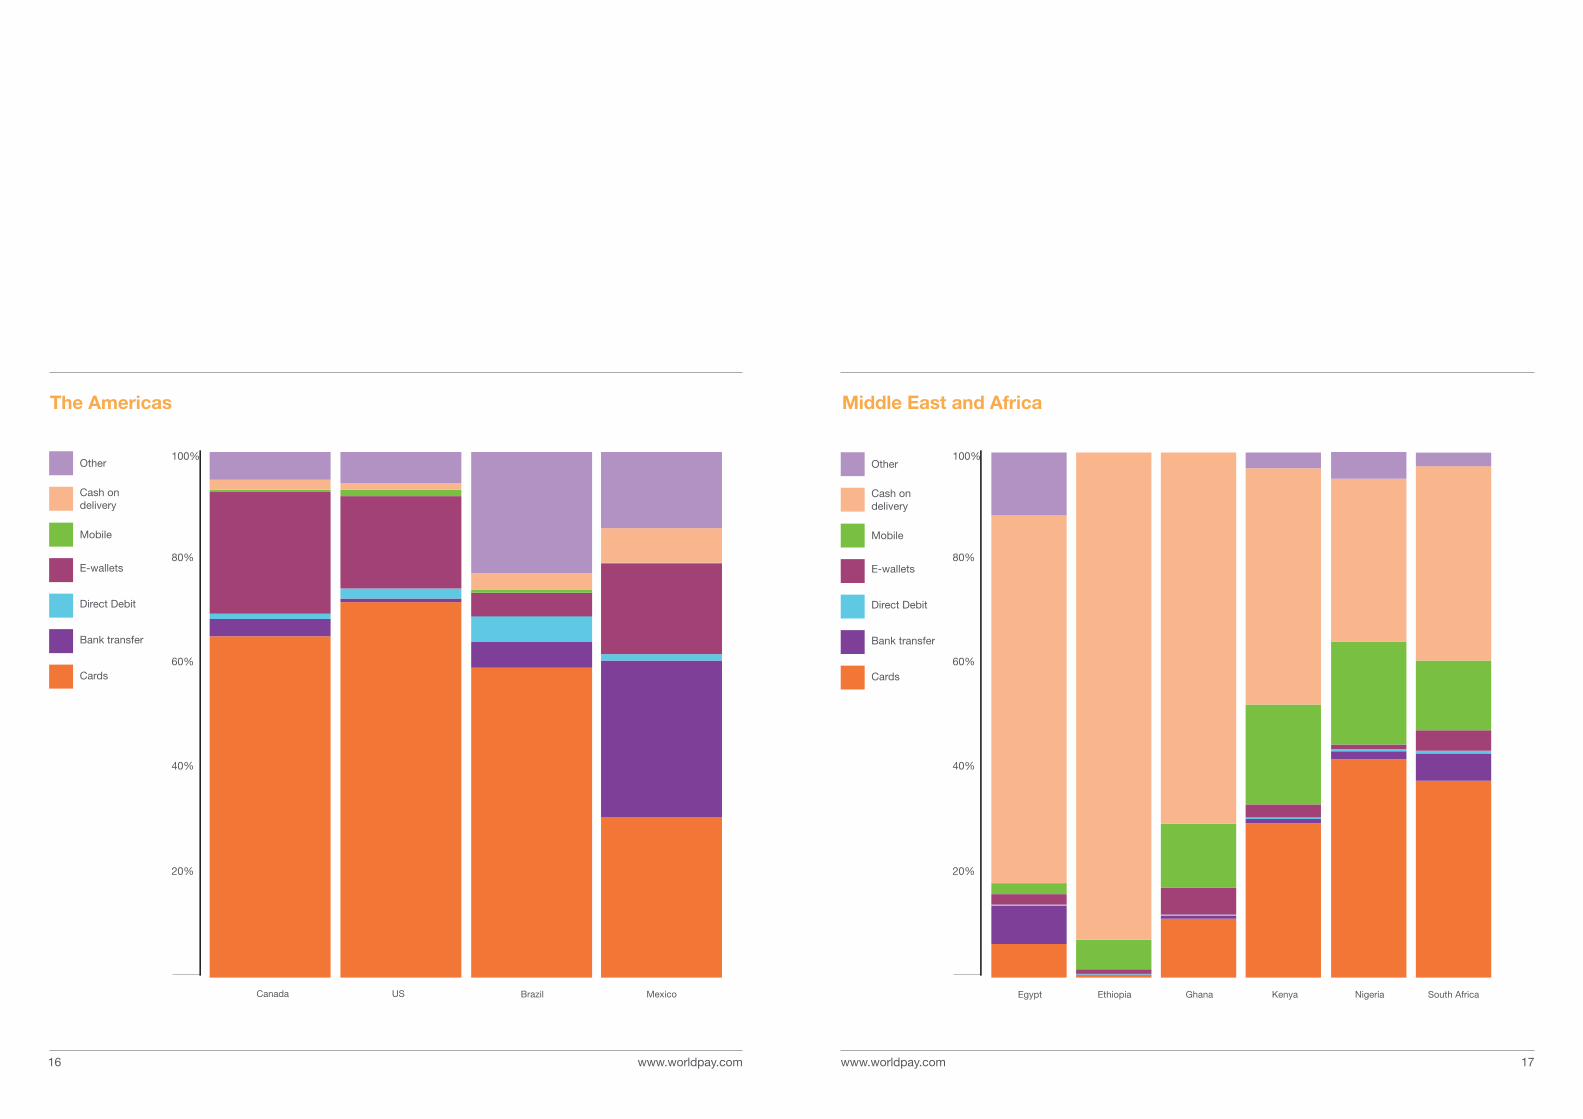
In 2012, North America was the leading business-to-consumer e-commerce market, accounting for a 36% share of the e-commerce market with a turnover of $625 billion. This is a card-dominated market (71%) where alternative payment methods are used less frequently. In comparison, Latin America, which had an e-commerce global share of 2% in 2012, has a more diverse range of payment preferences ranging from bank transfers (13%) to e-wallets (10%).
Asia Pacific
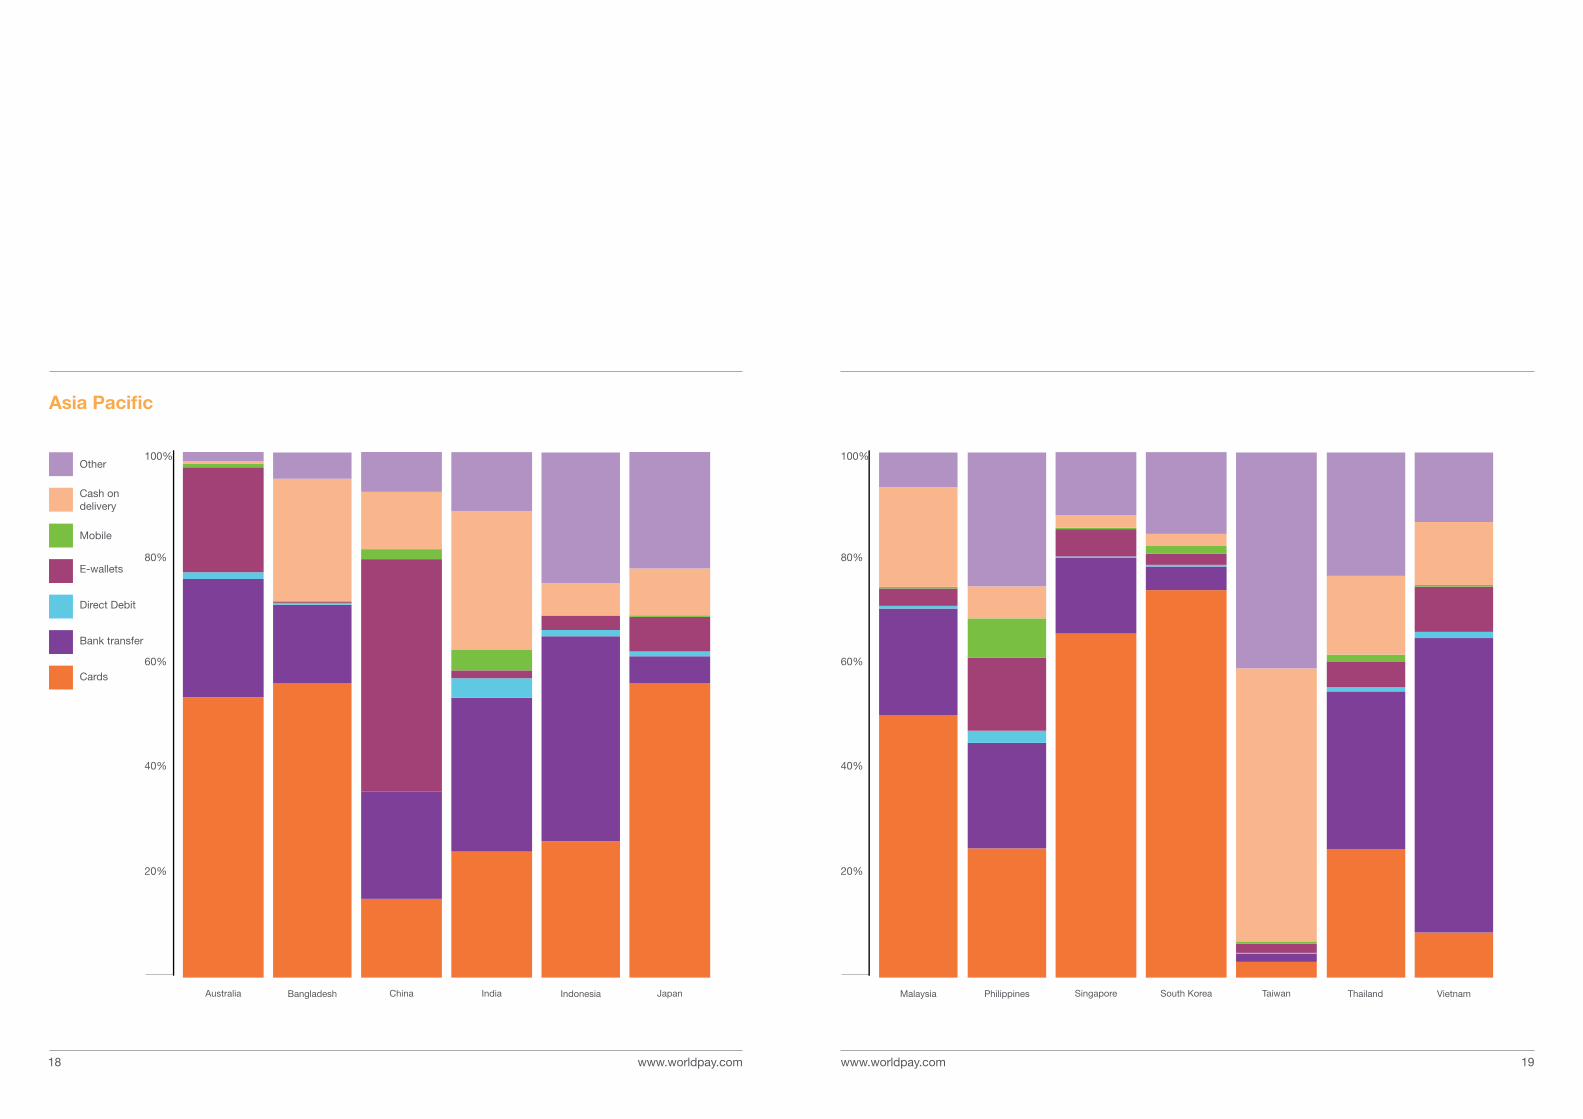
Asia-Pacific has shown the fastest growth in the e-commerce market compared to other regions with a turnover of $461 billion in 2012 (27% global share) and a compound annual growth rate of 34%. 23% of transactions were made using e-wallets in Asia Pacific and this trend is set to grow over the next five years.
Middle East and Africa
In 2012, Middle East and Africa had a 1% share of the global e-commerce market, of which the majority of transactions were cash payments. That being said, 5% of e-commerce transactions were made with e-wallets in 2012, which shows promise for uptake of alternative payments in this region.
The following chart compares e-commerce transaction values in 2012 with predictions for 2017. Forecasts show that transactions made using cards and e-wallets are set to increase dramatically over the next five years. Cash payments are set to stay at the same value of $93 billion, and payments made via bank transfers and other methods are expected to rise slowly by 2017.
A global overview
59%By 2017, alternative payments will account for 59% of all transaction methods
2012
43% Alternative payments*
57% Cards
2017
59% Alternative payments*
41% Cards
59%
43%
*Alternative Payments excludes international card brands.
Payment transactions 2012 vs. 2017
$979$1,679
$122$245
$295$1,656
$93$93
$164$209
2012
*figures are in USD billion
2017
Cards
Cash on delivery
Mobile
Bank transfer
OtherDirect debits
E-wallets
Transaction Value for Payment Methods 2012 vs. 2017
$42$54
$18$117
*All figures are from 2012.
2%By 2017 cashon delivery will account for 2% of e-transactions
Paper-based invoices are being displaced
by digital, guaranteed forms of invoice such as Klarna, BillPay and RatePay.
GLOBAL
E-TRANSACTION
PAYMENT
MIX
Direct debitOtherCards E-wallets Cash on delivery
Bank transfer
US & Canada29% of e-transactions made using non-card methods
Europe41% of e-transactions made using non-card methods
Asia/Pacific 63% of e-transactions made using non-card methods
Africa & Middle East 66% of e-transactions made using non-card methods
Latin America53% of e-transactions made using non-card methods
By 2017, alternative payment methods will account for 59% of all transactions, an increase from 43% in 2012.
43% 59%2012 2017
Alternative payments
Alipay and PayPal continue to dominate globally as the most prevalent e-wallet types.
of global online transactions were made using e-wallets in 2012, replacing that of debit and credit cards.
17%
59%
18%
10%
7%
11%
2%
5%
4%
8%1%
5%
34%
71%
13%
47%
Asia/Pacific
Africa & Middle East
EuropeUS & Canada
Direct debit
18%
Other
14%
Other
Other
Other
10%
Other
E-wallets
E-wallets
5%
E-wallets
23%
E-wallets
E-wallets
8%
Cash on delivery
48%
Cash on delivery
11%
Cash on delivery
Cash on delivery
Cash on delivery
13%
Bank transfer
3%
Bank transfer
14%
Bank transfer
1%
Bank transfer
Bank transfer
Cards
Cards
Cards
37%
Cards
Cards
0%
Direct debit
1%
Direct debit
Direct debit
Direct debit
LatinAmerica
www.worldpay.com www.worldpay.com 1514
Alternative payment share by country
100% 100%
80% 80%
60% 60%
40% 40%
20% 20%
UKGermanyFrance Italy Spain TurkeyNetherlands SwedenRussiaAustria Finland SwitzerlandNorwayIrelandDenmarkBelgium PolandGreece Portugal
Europe
Mobile
Other
E-wallets
Direct Debit
Bank transfer
Cards
Cash on delivery
Over the next few pages are a series of charts showing the percentage uptake of alternative payment types by region and country. The payment types covered are cards, bank transfers, direct debits, e-wallets, mobile, cash-on-delivery and other.
www.worldpay.com www.worldpay.com 1716
100%
80%
60%
40%
20%
Egypt South AfricaNigeriaGhana KenyaEthiopia
100%
80%
60%
40%
20%
US BrazilCanada Mexico
Mobile
Other
E-wallets
Direct Debit
Bank transfer
Cards
Cash on delivery
Mobile
Other
E-wallets
Direct Debit
Bank transfer
Cards
Cash on delivery
The Americas Middle East and Africa
www.worldpay.com 19www.worldpay.com18
100% 100%
80% 80%
60% 60%
40% 40%
20% 20%
China JapanAustralia South Korea TaiwanIndia Singapore ThailandMalaysiaIndonesia Philippines VietnamBangladesh
Mobile
Other
E-wallets
Direct Debit
Bank transfer
Cards
Cash on delivery
Asia Pacific
www.worldpay.com 21
www.worldpay.com
Growth of e-walletsLeading alternative payment methods have been growing at an average of 35% in recent years. While growth is spread across all payment types, e-wallets are undoubtedly the leader. In China, e-wallets account for the largest proportion of the e-commerce market, with 44% of the market there.
Of the e-wallet providers, Alipay and PayPal continue to be the dominant players around the world. Alipay is the market leader in China, with a market share of 30%, while Tenpay is the second biggest provider with 13.3% of the market. PayPal and others have a marginal market share in comparison.
Traditional card providers are recognising the growth opportunity for e-wallets and are developing card-based e-wallets for their own brands. For example, Visa has recently launched V.me to capitalise on this shift. Observers expect that e-wallet technology will be made available for mobile devices, thus increasing the potential for providers: card-based wallets are expected to account for 25% of the card market by 2017, according to the research.
While e-wallet transactions are growing across all types of e-commerce industries, digital content such as downloadable books, films and TV programmes as well as video games are encouraging customers both to embrace and demand the ability to use e-wallets from vendors, as they provide a seamless experience for users.
44%In China, e-wallets account for the largest proportion of the e-commerce market
Trends and drivers
www.worldpay.com www.worldpay.com 2322
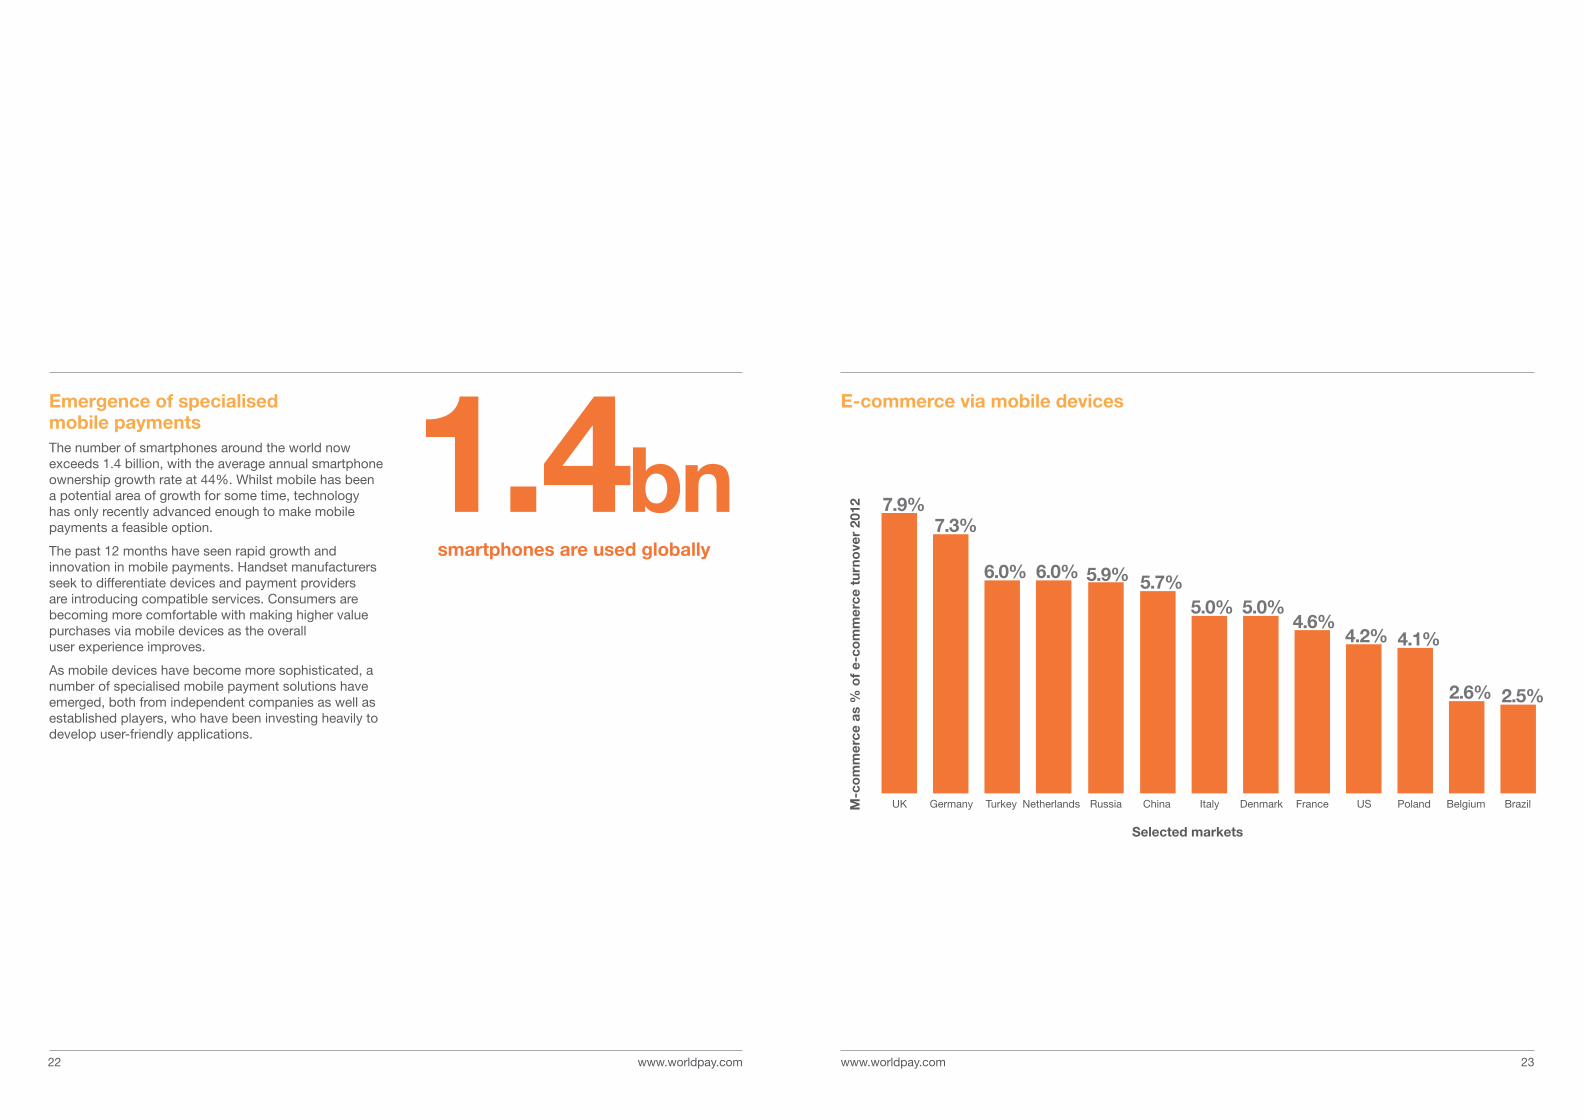
Emergence of specialised mobile paymentsThe number of smartphones around the world now exceeds 1.4 billion, with the average annual smartphone ownership growth rate at 44%. Whilst mobile has been a potential area of growth for some time, technology has only recently advanced enough to make mobile payments a feasible option.
The past 12 months have seen rapid growth and innovation in mobile payments. Handset manufacturers seek to differentiate devices and payment providers are introducing compatible services. Consumers are becoming more comfortable with making higher value purchases via mobile devices as the overall user experience improves.
As mobile devices have become more sophisticated, a number of specialised mobile payment solutions have emerged, both from independent companies as well as established players, who have been investing heavily to develop user-friendly applications.
7.9%7.3%
6.0% 6.0% 5.7%5.0% 5.0%
4.6%4.2% 4.1%
2.6% 2.5%
UK Germany Turkey Netherlands China Italy Denmark France US Poland Belgium Brazil
5.9%
Russia
E-commerce via mobile devices
Selected markets
M-c
om
mer
ce a
s %
of
e-co
mm
erce
tur
nove
r 20
121.4bnsmartphones are used globally
www.worldpay.com www.worldpay.com 2524
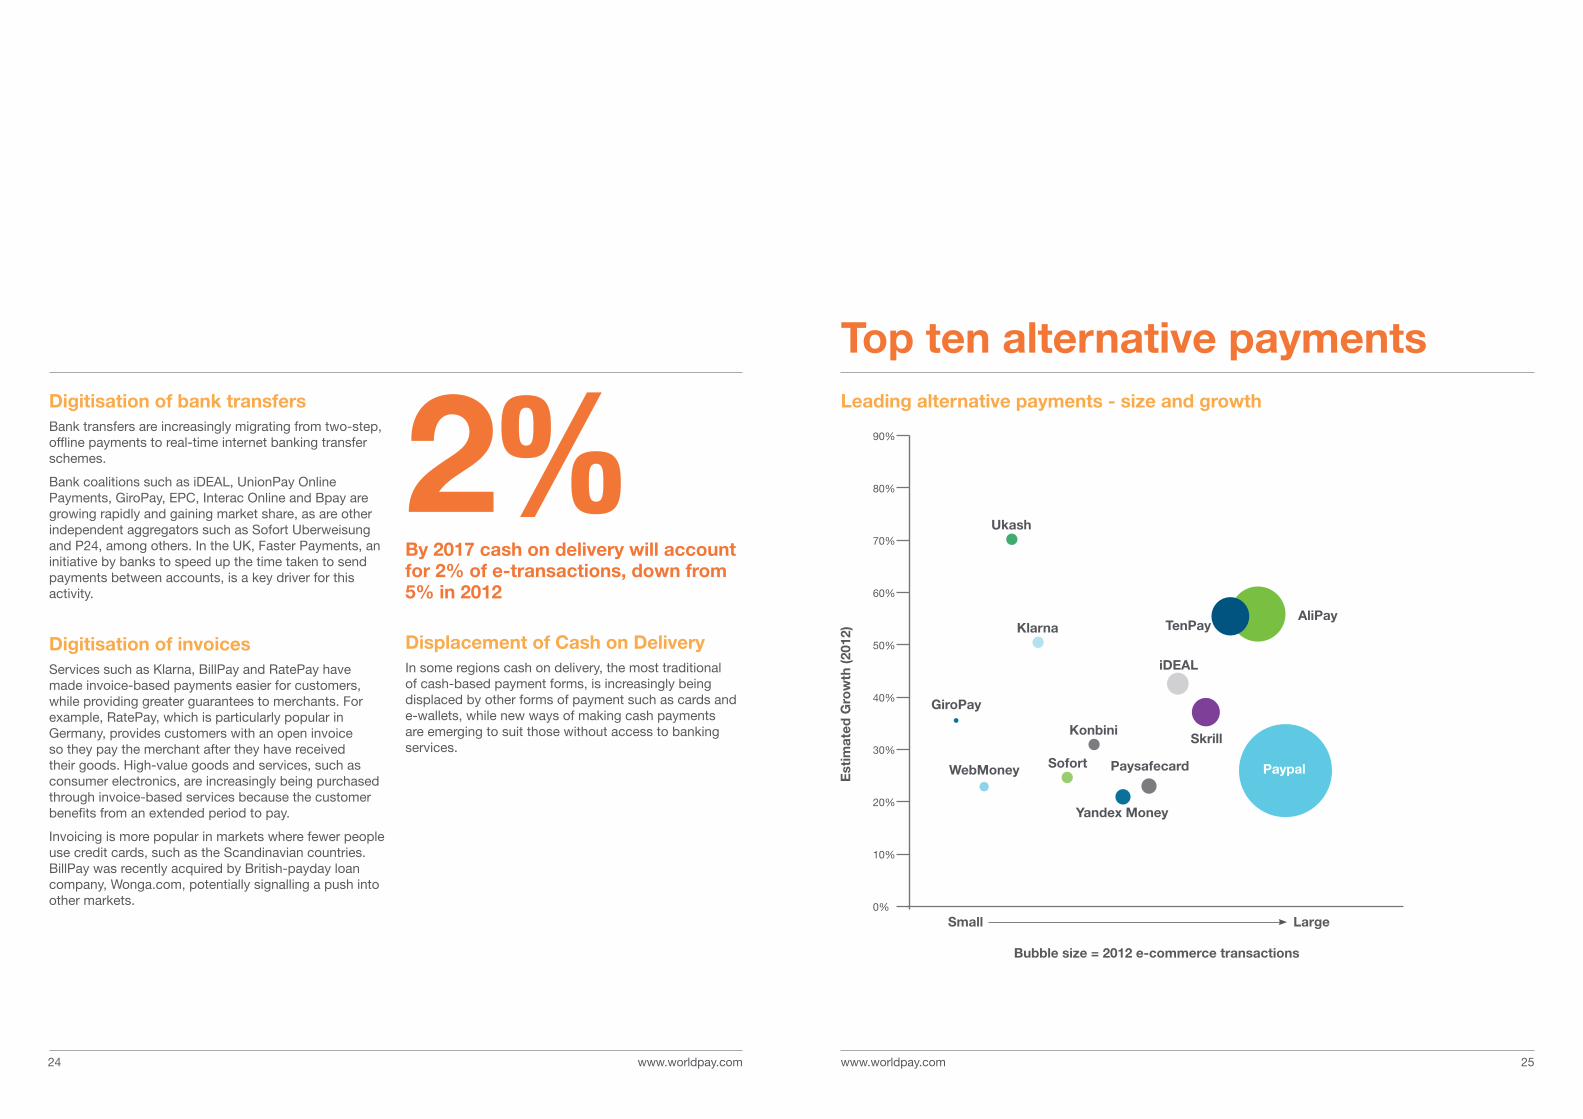
Digitisation of bank transfersBank transfers are increasingly migrating from two-step, offline payments to real-time internet banking transfer schemes.
Bank coalitions such as iDEAL, UnionPay Online Payments, GiroPay, EPC, Interac Online and Bpay are growing rapidly and gaining market share, as are other independent aggregators such as Sofort Uberweisung and P24, among others. In the UK, Faster Payments, an initiative by banks to speed up the time taken to send payments between accounts, is a key driver for this activity.
Digitisation of invoicesServices such as Klarna, BillPay and RatePay have made invoice-based payments easier for customers, while providing greater guarantees to merchants. For example, RatePay, which is particularly popular in Germany, provides customers with an open invoice so they pay the merchant after they have received their goods. High-value goods and services, such as consumer electronics, are increasingly being purchased through invoice-based services because the customer benefits from an extended period to pay.
Invoicing is more popular in markets where fewer people use credit cards, such as the Scandinavian countries. BillPay was recently acquired by British-payday loan company, Wonga.com, potentially signalling a push into other markets.
Displacement of Cash on DeliveryIn some regions cash on delivery, the most traditional of cash-based payment forms, is increasingly being displaced by other forms of payment such as cards and e-wallets, while new ways of making cash payments are emerging to suit those without access to banking services.
2%By 2017 cash on delivery will account for 2% of e-transactions, down from 5% in 2012
Top ten alternative payments
0%
10%
20%
30%
40%
50%
60%
70%
80%
90%
Est
imat
ed G
row
th (2
012)
Small Large
Leading alternative payments - size and growth
Paypal
AliPayTenPay
Skrill
iDEAL
Yandex Money
Paysafecard
Konbini
Sofort
Ukash
GiroPay
WebMoney
Klarna
Bubble size = 2012 e-commerce transactions
www.worldpay.com 27www.worldpay.com
Different payment methods prevail in different countries, and merchants need to understand local preferences if they want to expand internationally and maximise transaction acceptance rates when they operate abroad.
Country profiles
The next section of this report examines the payment trends in each market and the penetration levels of payment methods by type.
Growth of alternative paymentsWhile credit and debit cards have long dominated as the payment method of choice for online transactions, by 2017 alternative schemes will overtake cards for products and services purchased online, with alternative payments accounting for 59% of all transactions.
Significant growth trend for e-walletsE-wallet transaction value is set to rise by $1,361 billion by 2017, comprising 41% market share.
Emergence of specialised mobile paymentsMobile payment solutions will continue to grow as technology advances and smartphone penetration rates rise. The value of mobile transactions will increase from $18 billion in 2012 to $117 billion by 2017.
Displacement of cash on deliveryCash on delivery will decline from 5% of the payments market in 2012 to just 2% by 2017.
Global diversity in preferred payment types Merchants will need to be prepared by ensuring they are offering customers their preferred method of payment. These preferences vary by demographic, country of residence and the product or service consumers are purchasing, which shows the importance of working with a payment provider with specialist knowledge.
Subsequent editions of this report will explore alternative payments in specific verticals and regions in greater detail.
Alternative payments across the globe Conclusion
26
www.worldpay.com www.worldpay.com 2928
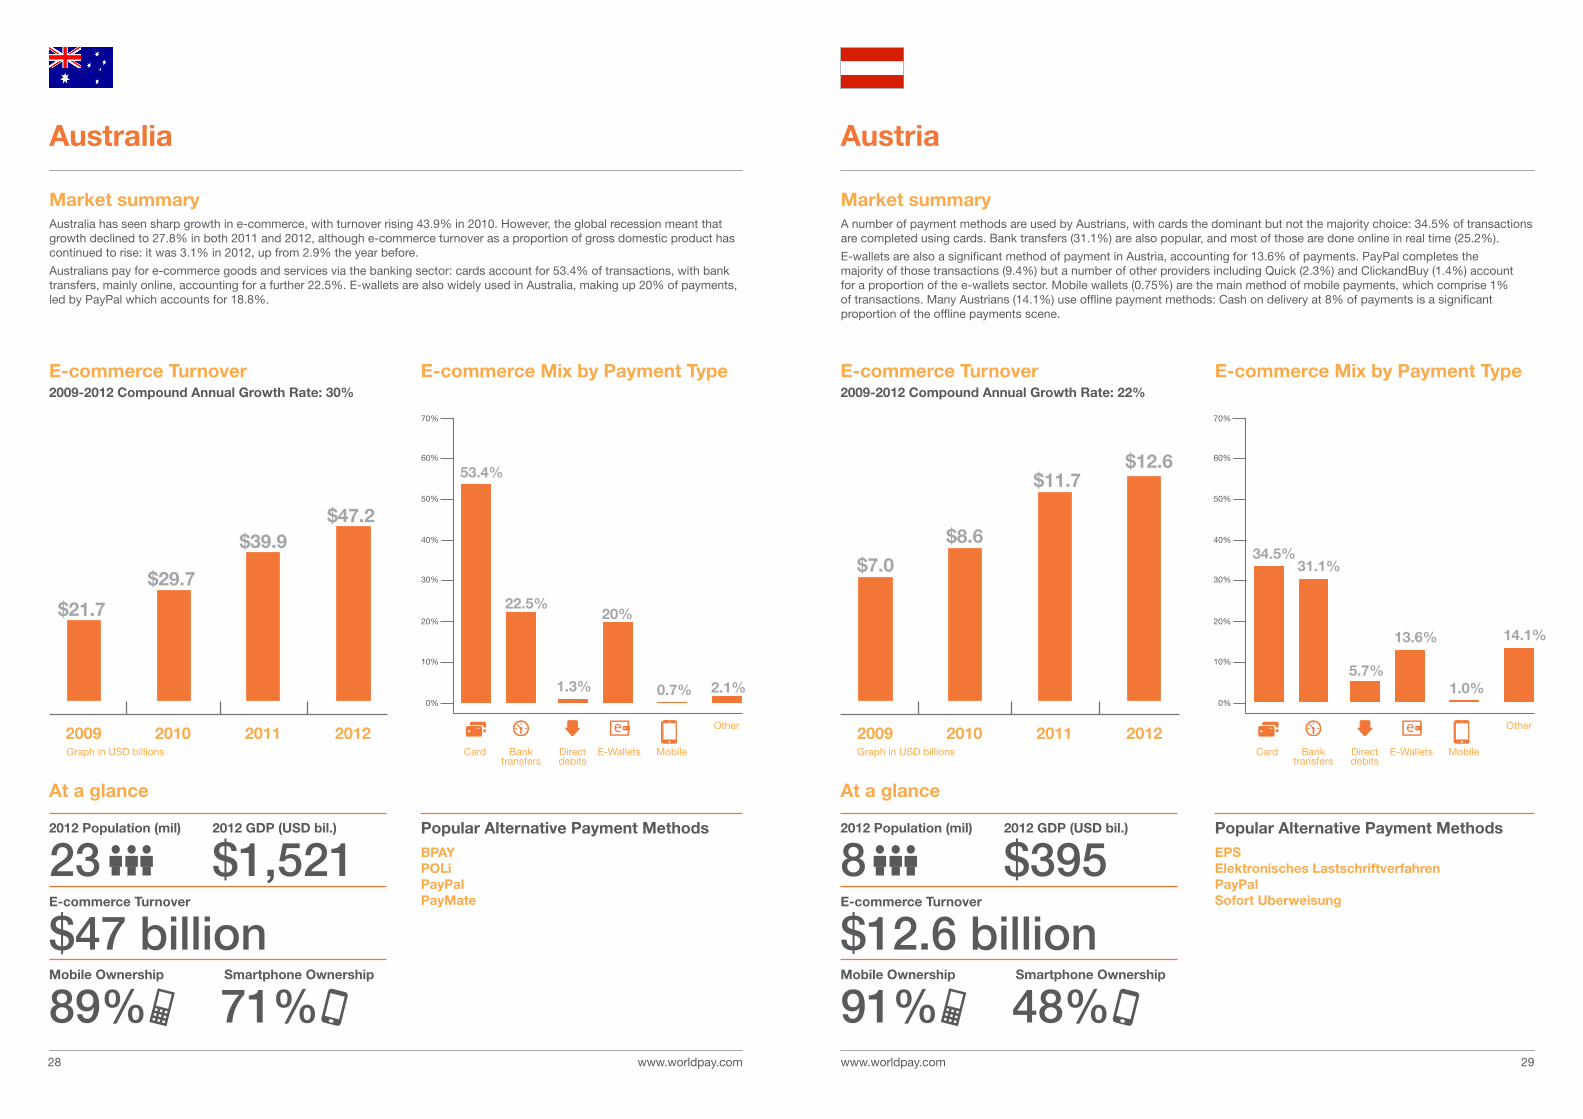
Market summaryA number of payment methods are used by Austrians, with cards the dominant but not the majority choice: 34.5% of transactions are completed using cards. Bank transfers (31.1%) are also popular, and most of those are done online in real time (25.2%).
E-wallets are also a significant method of payment in Austria, accounting for 13.6% of payments. PayPal completes the majority of those transactions (9.4%) but a number of other providers including Quick (2.3%) and ClickandBuy (1.4%) account for a proportion of the e-wallets sector. Mobile wallets (0.75%) are the main method of mobile payments, which comprise 1% of transactions. Many Austrians (14.1%) use offline payment methods: Cash on delivery at 8% of payments is a significant proportion of the offline payments scene.
Market summaryAustralia has seen sharp growth in e-commerce, with turnover rising 43.9% in 2010. However, the global recession meant that growth declined to 27.8% in both 2011 and 2012, although e-commerce turnover as a proportion of gross domestic product has continued to rise: it was 3.1% in 2012, up from 2.9% the year before.
Australians pay for e-commerce goods and services via the banking sector: cards account for 53.4% of transactions, with bank transfers, mainly online, accounting for a further 22.5%. E-wallets are also widely used in Australia, making up 20% of payments, led by PayPal which accounts for 18.8%.
AustriaAustralia
2012 Population (mil)
232012 Population (mil)
8E-commerce Turnover
$47 billionE-commerce Turnover
$12.6 billionMobile Ownership
89%Mobile Ownership
91% Smartphone Ownership
71% Smartphone Ownership
48%
2012 GDP (USD bil.)
$1,5212012 GDP (USD bil.)
$395Popular Alternative Payment MethodsBPAYPOLiPayPalPayMate
Popular Alternative Payment MethodsEPSElektronisches Lastschriftverfahren PayPalSofort Uberweisung
E-commerce Turnover2009-2012 Compound Annual Growth Rate: 22%
E-commerce Turnover2009-2012 Compound Annual Growth Rate: 30%
At a glance At a glance
$7.0
$21.7
20092009 20102010 20112011 20122012
$8.6
$29.7
$11.7
$39.9
$12.6
$47.2
E-commerce Mix by Payment TypeE-commerce Mix by Payment Type
34.5%
53.4%
31.1%
22.5%
5.7%1.3%
13.6%
20%
1.0%0.7%
14.1%
2.1%
70%70%
60%60%
50%50%
40%40%
30%30%
20%20%
10%10%
0%0%
OtherOther
Card Bank transfers
Direct debits
E-Wallets Mobile Card Bank transfers
Direct debits
E-Wallets MobileGraph in USD billions Graph in USD billions
www.worldpay.com www.worldpay.com 3130
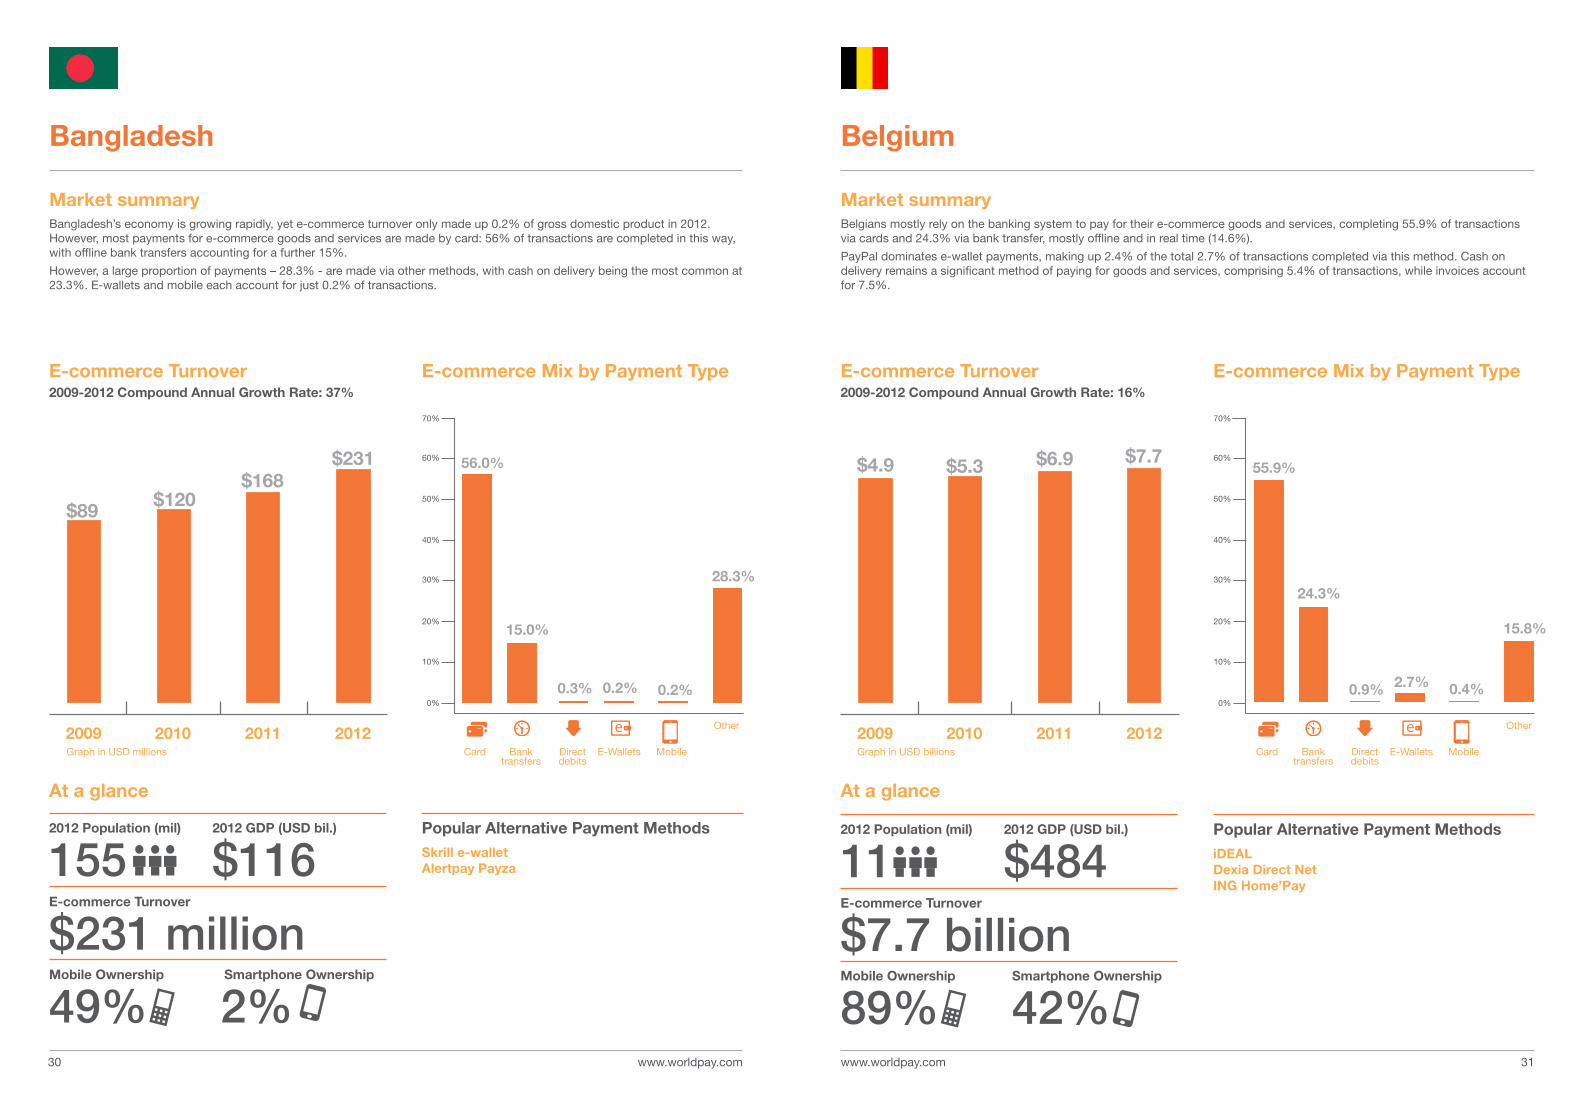
Market summaryBelgians mostly rely on the banking system to pay for their e-commerce goods and services, completing 55.9% of transactions via cards and 24.3% via bank transfer, mostly offline and in real time (14.6%).
PayPal dominates e-wallet payments, making up 2.4% of the total 2.7% of transactions completed via this method. Cash on delivery remains a significant method of paying for goods and services, comprising 5.4% of transactions, while invoices account for 7.5%.
Market summaryBangladesh’s economy is growing rapidly, yet e-commerce turnover only made up 0.2% of gross domestic product in 2012. However, most payments for e-commerce goods and services are made by card: 56% of transactions are completed in this way, with offline bank transfers accounting for a further 15%.
However, a large proportion of payments – 28.3% - are made via other methods, with cash on delivery being the most common at 23.3%. E-wallets and mobile each account for just 0.2% of transactions.
BelgiumBangladesh
E-commerce Turnover2009-2012 Compound Annual Growth Rate: 16%
E-commerce Turnover2009-2012 Compound Annual Growth Rate: 37%
$4.9
$89$120
$168$231
20092009 20102010 20112011 20122012
$5.3 $6.9 $7.7
E-commerce Mix by Payment TypeE-commerce Mix by Payment Type
55.9%56.0%
24.3%
15.0%
0.9%0.3% 2.7%0.2% 0.4%0.2%
15.8%
28.3%
70%70%
60%60%
50%50%
40%40%
30%30%
20%20%
10%10%
0%0%
Other
2012 Population (mil)
1552012 Population (mil)
11E-commerce Turnover
$231 millionE-commerce Turnover
$7.7 billionMobile Ownership
49%Mobile Ownership
89% Smartphone Ownership
2%Smartphone Ownership
42%
2012 GDP (USD bil.)
$1162012 GDP (USD bil.)
$484Popular Alternative Payment MethodsSkrill e-walletAlertpay Payza
Popular Alternative Payment MethodsiDEALDexia Direct Net ING Home’Pay
Graph in USD millions
Other
Card Bank transfers
Direct debits
E-Wallets Mobile Card Bank transfers
Direct debits
E-Wallets MobileGraph in USD billions
At a glance At a glance
www.worldpay.com www.worldpay.com 3332
0.6%
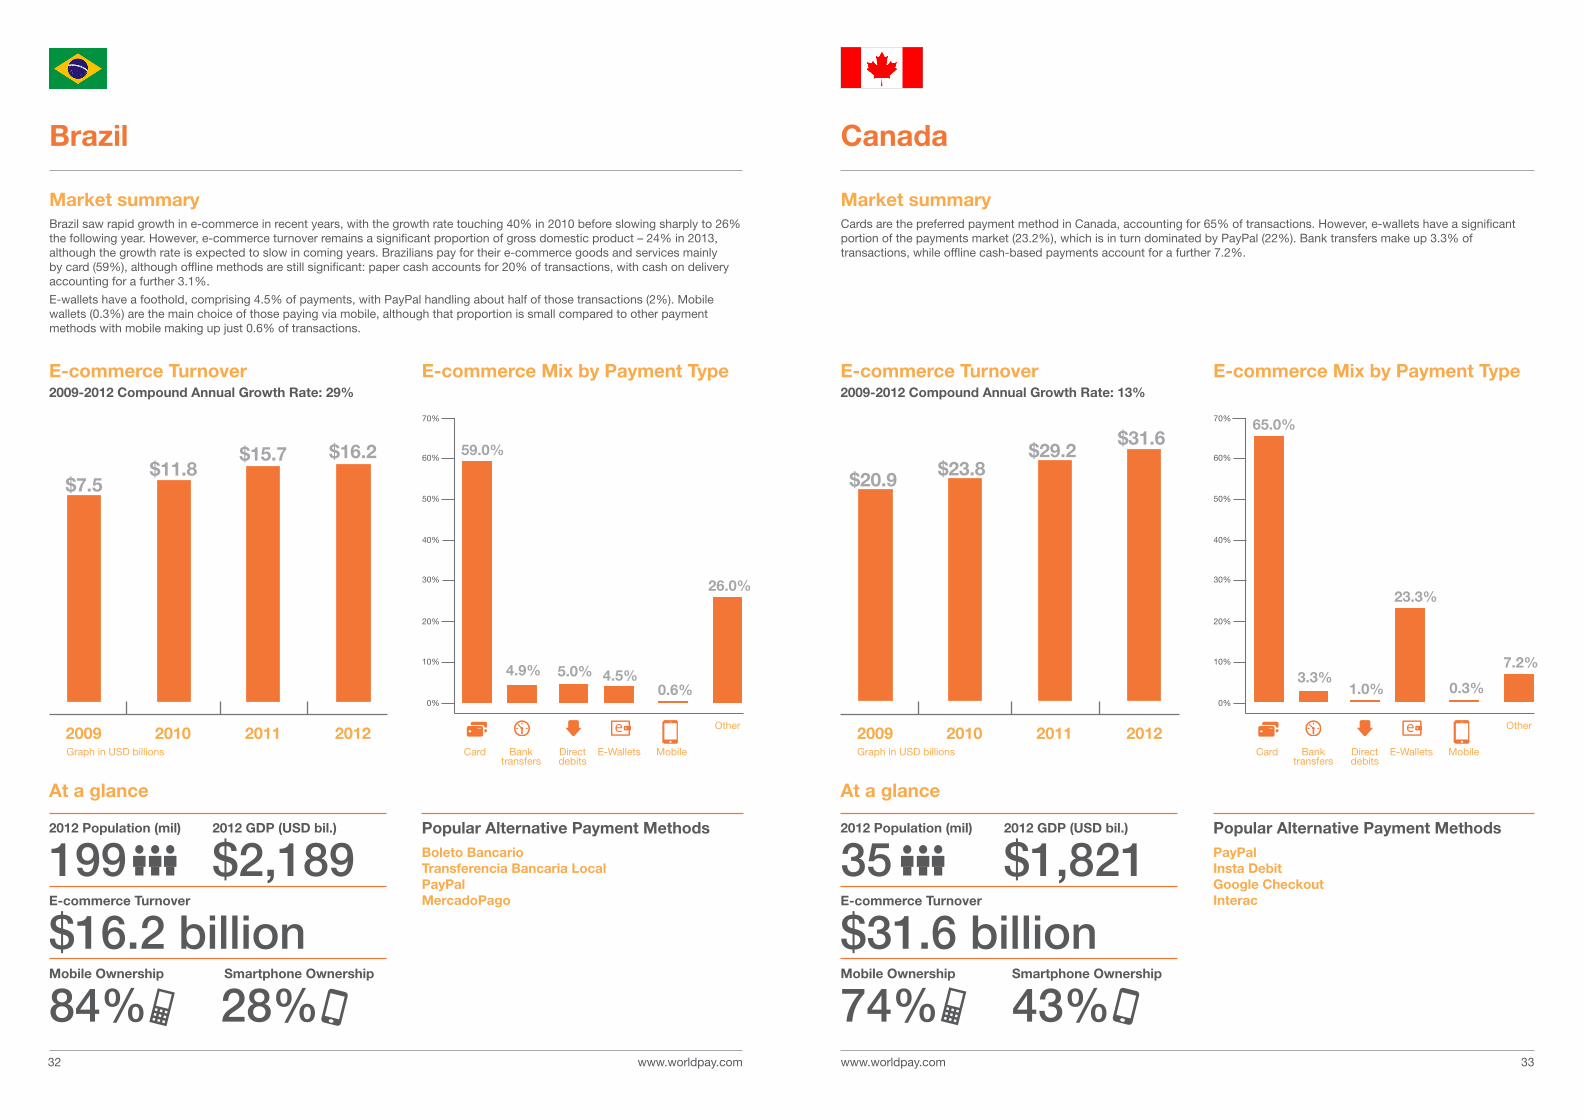
Market summaryCards are the preferred payment method in Canada, accounting for 65% of transactions. However, e-wallets have a significant portion of the payments market (23.2%), which is in turn dominated by PayPal (22%). Bank transfers make up 3.3% of transactions, while offline cash-based payments account for a further 7.2%.
Market summaryBrazil saw rapid growth in e-commerce in recent years, with the growth rate touching 40% in 2010 before slowing sharply to 26% the following year. However, e-commerce turnover remains a significant proportion of gross domestic product – 24% in 2013, although the growth rate is expected to slow in coming years. Brazilians pay for their e-commerce goods and services mainly by card (59%), although offline methods are still significant: paper cash accounts for 20% of transactions, with cash on delivery accounting for a further 3.1%.
E-wallets have a foothold, comprising 4.5% of payments, with PayPal handling about half of those transactions (2%). Mobile wallets (0.3%) are the main choice of those paying via mobile, although that proportion is small compared to other payment methods with mobile making up just 0.6% of transactions.
CanadaBrazil
E-commerce Turnover2009-2012 Compound Annual Growth Rate: 13%
E-commerce Turnover2009-2012 Compound Annual Growth Rate: 29%
$20.9$7.5$11.8
$15.7 $16.2
20092009 20102010 20112011 20122012
$23.8$29.2
$31.6
E-commerce Mix by Payment TypeE-commerce Mix by Payment Type
65.0%
59.0%
3.3%4.9%1.0%
5.0%
23.3%
4.5%0.3%
7.2%
26.0%
70%70%
60%60%
50%50%
40%40%
30%30%
20%20%
10%10%
0%0%
OtherOther
2012 Population (mil)
1992012 Population (mil)
35E-commerce Turnover
$16.2 billionE-commerce Turnover
$31.6 billionMobile Ownership
84%Mobile Ownership
74% Smartphone Ownership
28%Smartphone Ownership
43%
2012 GDP (USD bil.)
$2,1892012 GDP (USD bil.)
$1,821Popular Alternative Payment MethodsBoleto BancarioTransferencia Bancaria LocalPayPalMercadoPago
Popular Alternative Payment MethodsPayPalInsta DebitGoogle CheckoutInterac
Card Bank transfers
Direct debits
E-Wallets Mobile Card Bank transfers
Direct debits
E-Wallets MobileGraph in USD billions Graph in USD billions
At a glance At a glance
www.worldpay.com www.worldpay.com
Other
3534
70%
60%
50%
40%
30%
20%
Other2009 2010 2011 2012
10%
0%
2009 2010 2011 2012
E-commerce Turnover2009-2012 Compound Annual Growth Rate: 13%
E-commerce Turnover2009-2012 Compound Annual Growth Rate: 16%
E-commerce Mix by Payment TypeE-commerce Mix by Payment Type
70%
80%
90%
60%
50%
40%
30%
20%
10%
0%
6.0%0.4%3.5%0.3%
5.6%
84.2%
$9.5$8.6$7.0$6.5
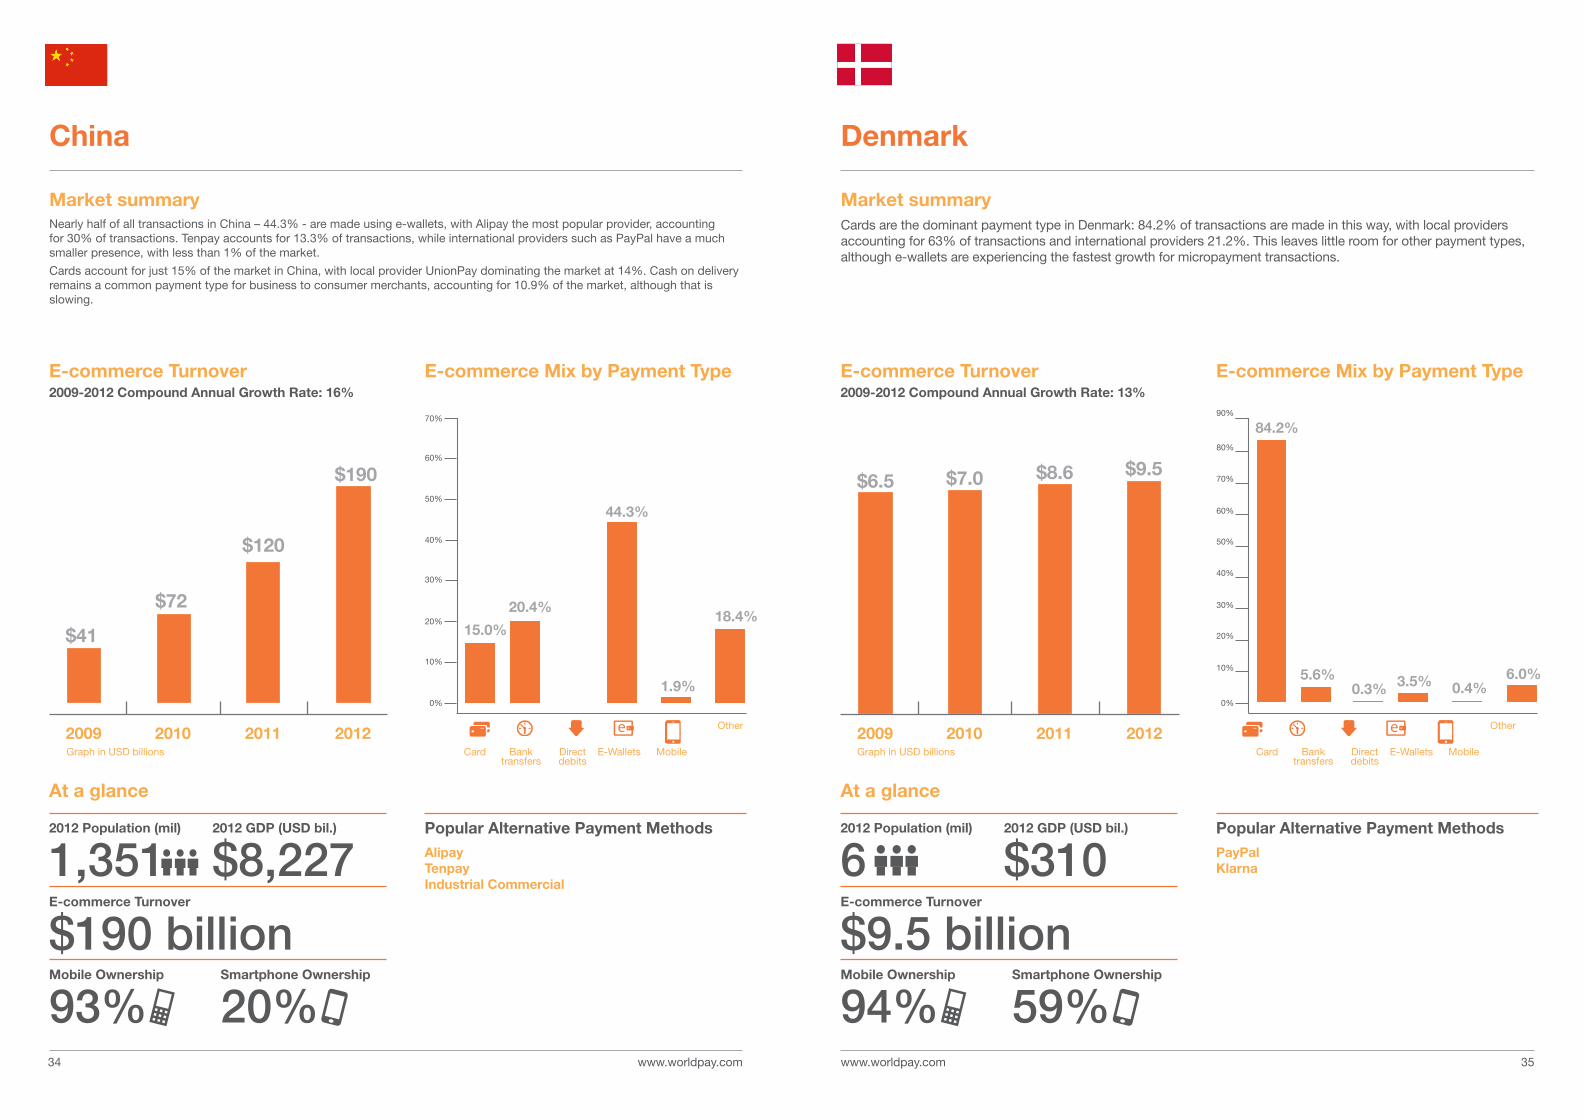
Market summaryCards are the dominant payment type in Denmark: 84.2% of transactions are made in this way, with local providers accounting for 63% of transactions and international providers 21.2%. This leaves little room for other payment types, although e-wallets are experiencing the fastest growth for micropayment transactions.
Denmark
1.9%
18.4%15.0%
20.4%
44.3%
$190
$120
$72
$41
Market summaryNearly half of all transactions in China – 44.3% - are made using e-wallets, with Alipay the most popular provider, accounting for 30% of transactions. Tenpay accounts for 13.3% of transactions, while international providers such as PayPal have a much smaller presence, with less than 1% of the market.
Cards account for just 15% of the market in China, with local provider UnionPay dominating the market at 14%. Cash on delivery remains a common payment type for business to consumer merchants, accounting for 10.9% of the market, although that is slowing.
China
2012 Population (mil)
1,3512012 Population (mil)
6E-commerce Turnover
$190 billionE-commerce Turnover
$9.5 billionMobile Ownership
93%Mobile Ownership
94%Smartphone Ownership
20%Smartphone Ownership
59%
2012 GDP (USD bil.)
$8,2272012 GDP (USD bil.)
$310Popular Alternative Payment MethodsAlipayTenpayIndustrial Commercial
Popular Alternative Payment MethodsPayPalKlarna
Card Bank transfers
Direct debits
E-Wallets Mobile Card Bank transfers
Direct debits
E-Wallets MobileGraph in USD billions Graph in USD billions
At a glance At a glance
www.worldpay.com www.worldpay.com
20092009 20102010 20112011 20122012
3736
OtherOther
E-commerce Turnover2009-2012 Compound Annual Growth Rate: 50%
E-commerce Turnover2009-2012 Compound Annual Growth Rate: 23%
E-commerce Mix by Payment TypeE-commerce Mix by Payment Type
£19
$30£38
£65$2.1 $2.5 $3.2 $3.9
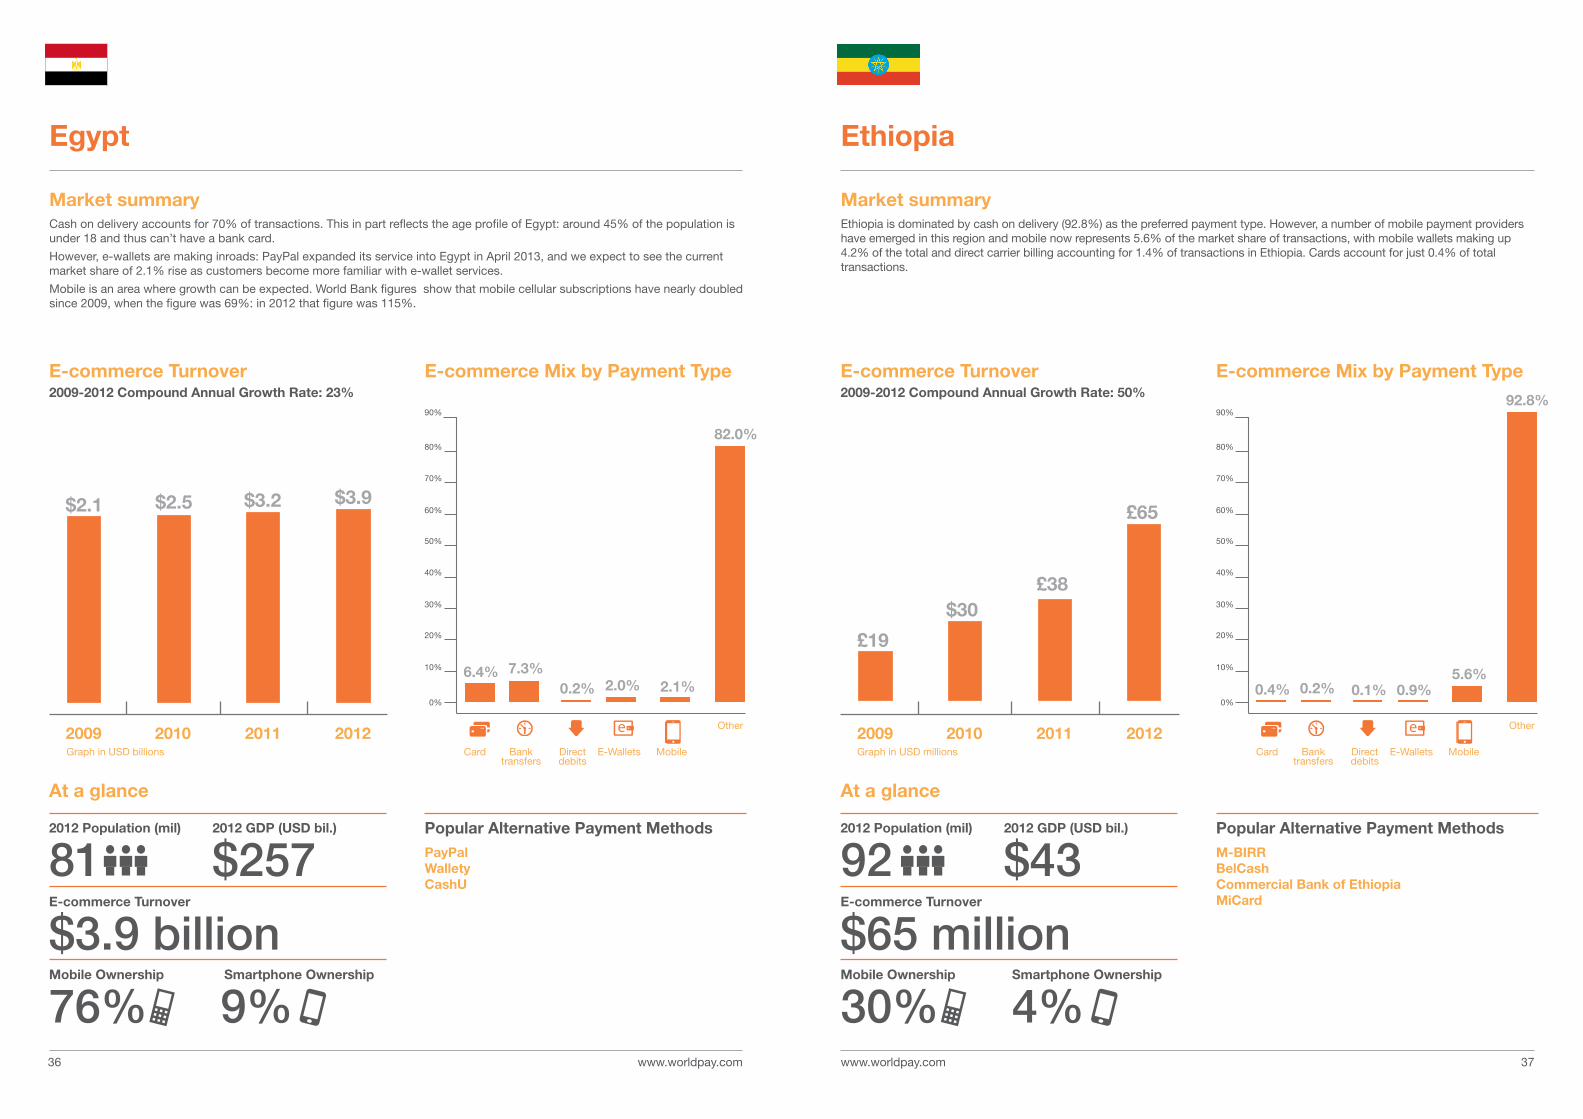
Market summaryEthiopia is dominated by cash on delivery (92.8%) as the preferred payment type. However, a number of mobile payment providers have emerged in this region and mobile now represents 5.6% of the market share of transactions, with mobile wallets making up 4.2% of the total and direct carrier billing accounting for 1.4% of transactions in Ethiopia. Cards account for just 0.4% of total transactions.
Market summaryCash on delivery accounts for 70% of transactions. This in part reflects the age profile of Egypt: around 45% of the population is under 18 and thus can’t have a bank card.
However, e-wallets are making inroads: PayPal expanded its service into Egypt in April 2013, and we expect to see the current market share of 2.1% rise as customers become more familiar with e-wallet services.
Mobile is an area where growth can be expected. World Bank figures show that mobile cellular subscriptions have nearly doubled since 2009, when the figure was 69%: in 2012 that figure was 115%.
EthiopiaEgypt
70%
80%
90%
60%
50%
40%
30%
20%
10%
0%
82.0%
2.1%2.0%0.2%7.3%6.4%
70%
80%
90%
60%
50%
40%
30%
20%
10%
0%
92.8%
5.6%0.9%0.1%0.2%0.4%
2012 Population (mil)
812012 Population (mil)
92E-commerce Turnover
$3.9 billionE-commerce Turnover
$65 millionMobile Ownership
76%Mobile Ownership
30% Smartphone Ownership
9%Smartphone Ownership
4%
2012 GDP (USD bil.)
$2572012 GDP (USD bil.)
$43Popular Alternative Payment MethodsPayPalWalletyCashU
Popular Alternative Payment MethodsM-BIRRBelCashCommercial Bank of EthiopiaMiCard
Card Bank transfers
Direct debits
E-Wallets Mobile Card Bank transfers
Direct debits
E-Wallets MobileGraph in USD billions Graph in USD millions
At a glance At a glance
www.worldpay.com www.worldpay.com 3938
11.2%
1.1%
76.6%
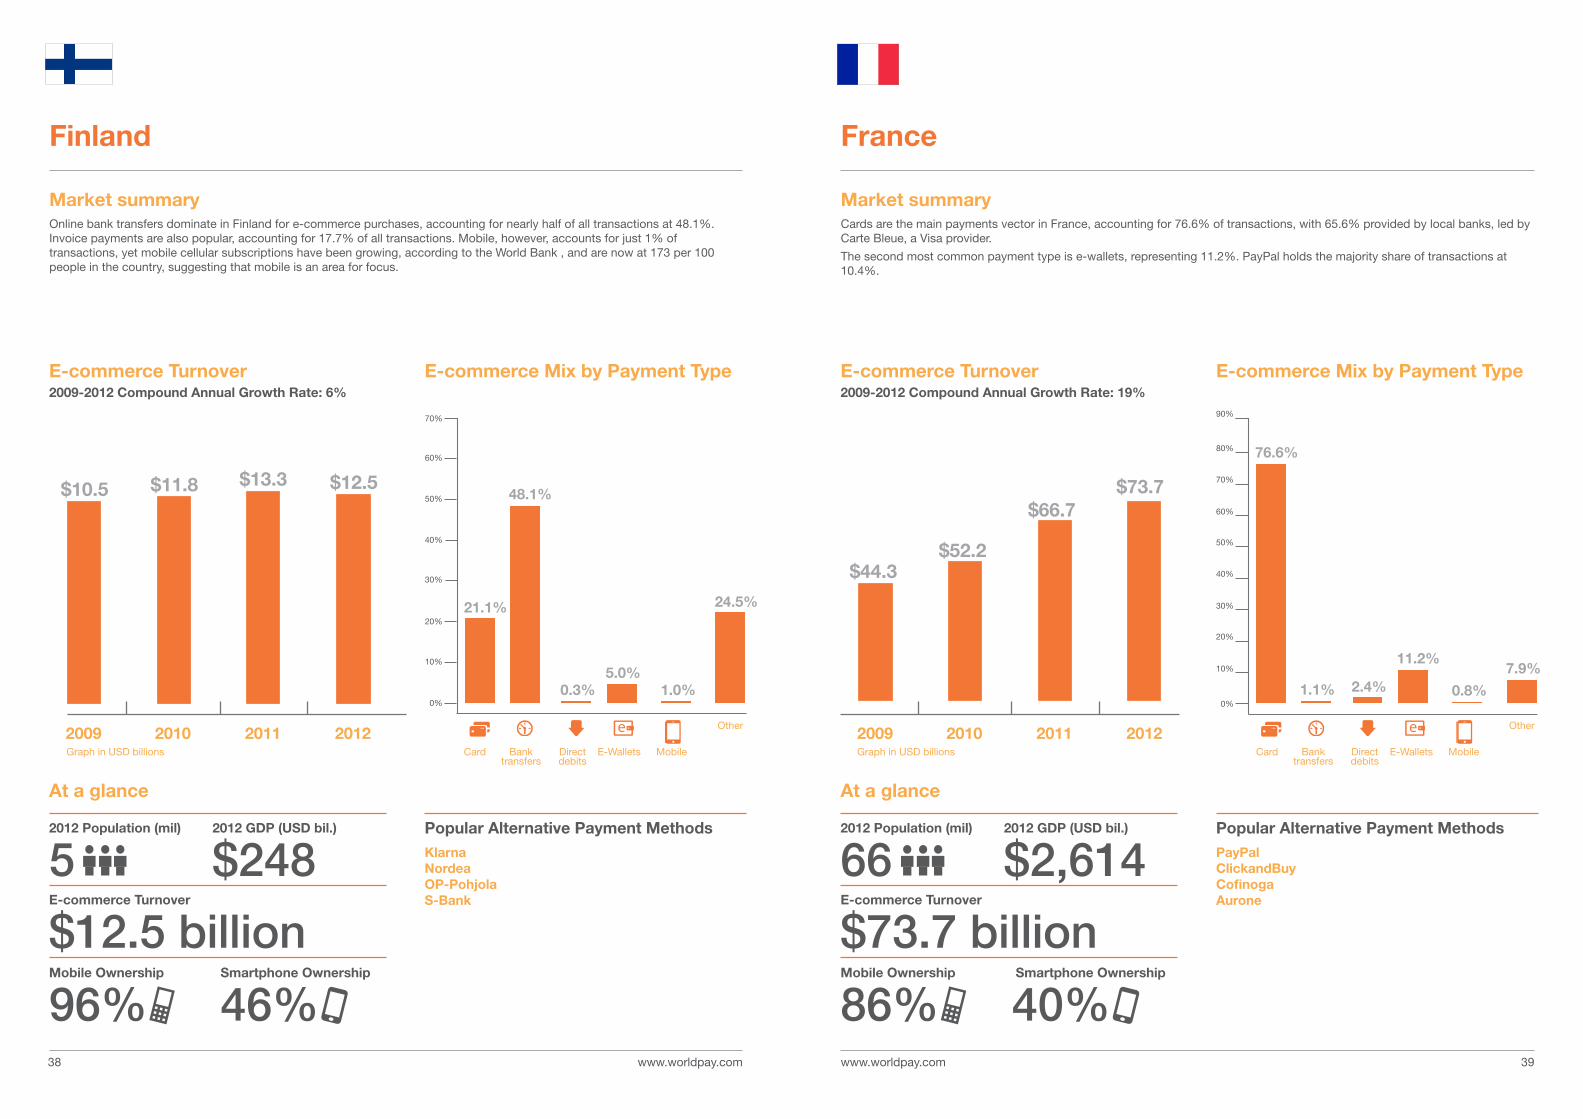
Market summaryCards are the main payments vector in France, accounting for 76.6% of transactions, with 65.6% provided by local banks, led by Carte Bleue, a Visa provider.
The second most common payment type is e-wallets, representing 11.2%. PayPal holds the majority share of transactions at 10.4%.
France
E-commerce Turnover2009-2012 Compound Annual Growth Rate: 19%
$44.3
2009 2010 2011 2012
$52.2
$66.7$73.7
E-commerce Mix by Payment Type
Other
1.0%
Market summaryOnline bank transfers dominate in Finland for e-commerce purchases, accounting for nearly half of all transactions at 48.1%. Invoice payments are also popular, accounting for 17.7% of all transactions. Mobile, however, accounts for just 1% of transactions, yet mobile cellular subscriptions have been growing, according to the World Bank , and are now at 173 per 100 people in the country, suggesting that mobile is an area for focus.
Finland
E-commerce Turnover2009-2012 Compound Annual Growth Rate: 6%
$10.5 $11.8 $13.3 $12.5
2009 2010 2011 2012
E-commerce Mix by Payment Type
21.1%
48.1%
0.3%5.0%
24.5%
70%
60%
50%
40%
30%
20%
10%
0%
Other
70%
80%
90%
60%
50%
40%
30%
20%
10%
0%
7.9%
0.8%2.4%
2012 Population (mil)
52012 Population (mil)
66E-commerce Turnover
$12.5 billionE-commerce Turnover
$73.7 billionMobile Ownership
96%Mobile Ownership
86%Smartphone Ownership
46% Smartphone Ownership
40%
2012 GDP (USD bil.)
$2482012 GDP (USD bil.)
$2,614Popular Alternative Payment MethodsKlarnaNordeaOP-PohjolaS-Bank
Popular Alternative Payment MethodsPayPalClickandBuyCofinogaAurone
Card Bank transfers
Direct debits
E-Wallets Mobile Card Bank transfers
Direct debits
E-Wallets MobileGraph in USD billions Graph in USD billions
At a glance At a glance
www.worldpay.com www.worldpay.com
2009 2010 2011 2012
4140
E-commerce Turnover2009-2012 Compound Annual Growth Rate: 16%
E-commerce Mix by Payment Type
1.7%
21.0%
5.6%
22.1%
13.3%
36.3%
70%
60%
50%
40%
30%
20%
10%
0%
Other
$54.1 $60.3$74.3
$83.6
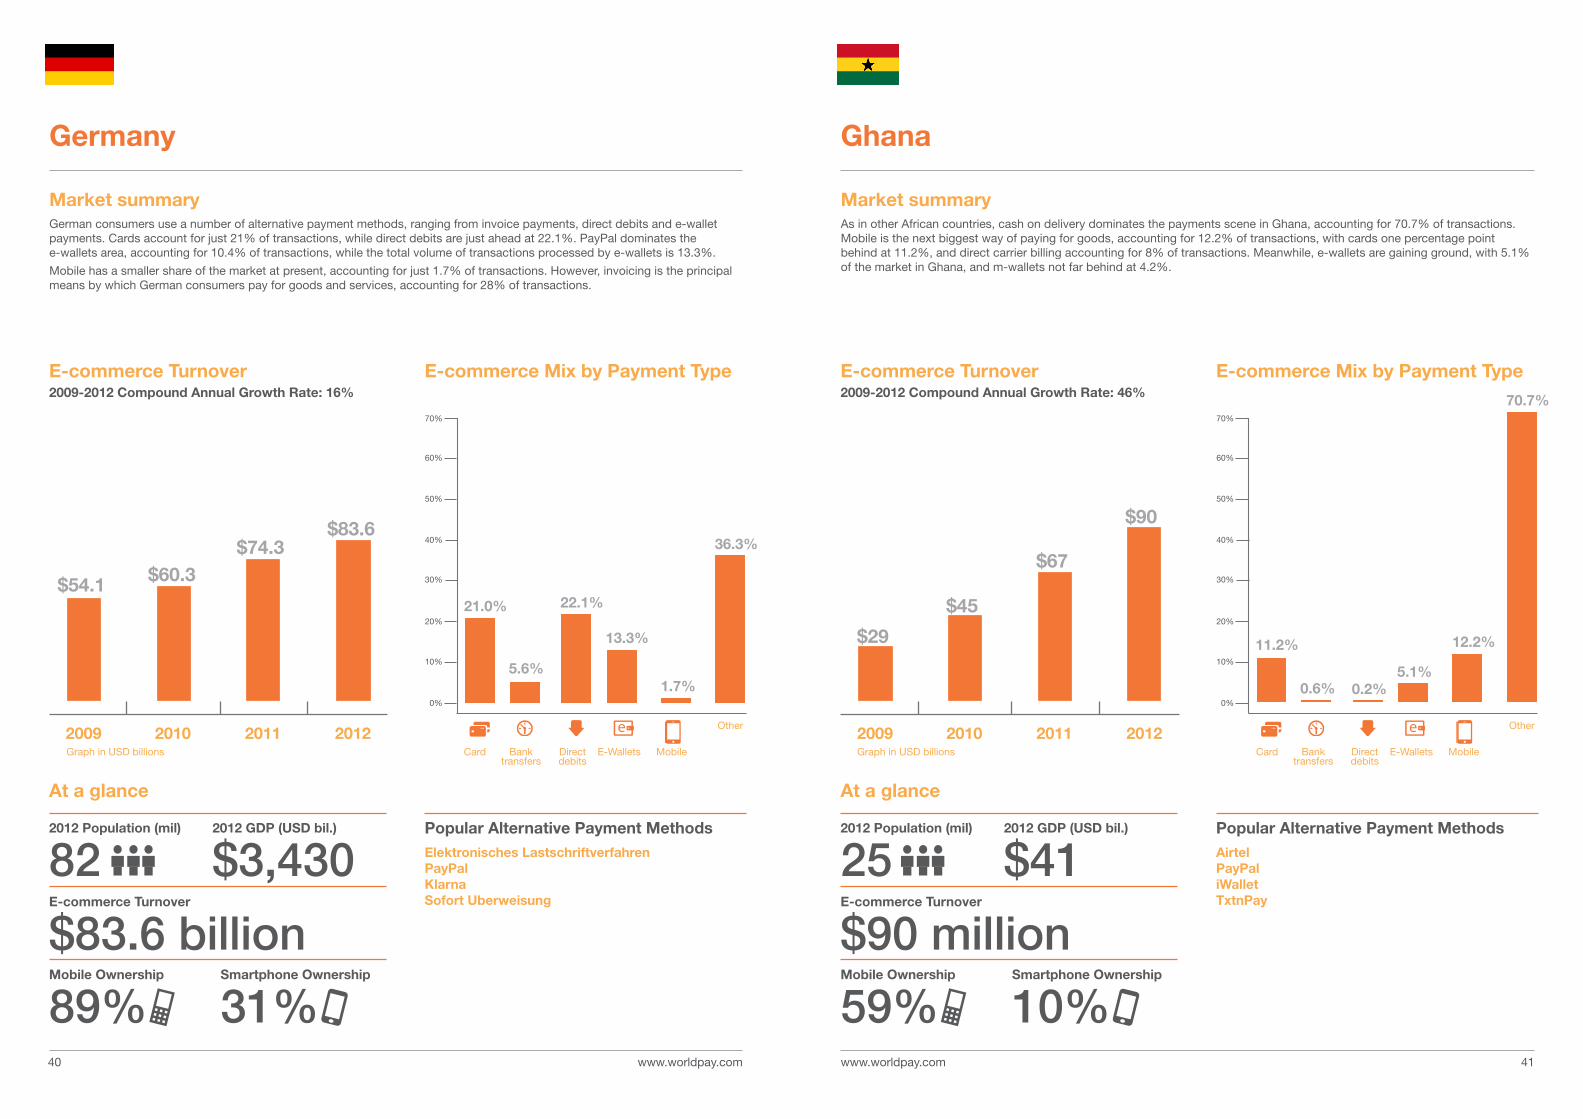
Market summaryAs in other African countries, cash on delivery dominates the payments scene in Ghana, accounting for 70.7% of transactions. Mobile is the next biggest way of paying for goods, accounting for 12.2% of transactions, with cards one percentage point behind at 11.2%, and direct carrier billing accounting for 8% of transactions. Meanwhile, e-wallets are gaining ground, with 5.1% of the market in Ghana, and m-wallets not far behind at 4.2%.
Ghana
E-commerce Turnover2009-2012 Compound Annual Growth Rate: 46%
$29
2009 2010 2011 2012
$45
$67
$90
E-commerce Mix by Payment Type
11.2%
0.6% 0.2%5.1%
12.2%
70.7%70%
60%
50%
40%
30%
20%
10%
0%
Other
Market summaryGerman consumers use a number of alternative payment methods, ranging from invoice payments, direct debits and e-wallet payments. Cards account for just 21% of transactions, while direct debits are just ahead at 22.1%. PayPal dominates the e-wallets area, accounting for 10.4% of transactions, while the total volume of transactions processed by e-wallets is 13.3%.
Mobile has a smaller share of the market at present, accounting for just 1.7% of transactions. However, invoicing is the principal means by which German consumers pay for goods and services, accounting for 28% of transactions.
Germany
2012 Population (mil)
822012 Population (mil)
25E-commerce Turnover
$83.6 billionE-commerce Turnover
$90 millionMobile Ownership
89%Mobile Ownership
59%Smartphone Ownership
31%Smartphone Ownership
10%
2012 GDP (USD bil.)
$3,4302012 GDP (USD bil.)
$41Popular Alternative Payment MethodsElektronisches Lastschriftverfahren PayPalKlarnaSofort Uberweisung
Popular Alternative Payment MethodsAirtelPayPaliWalletTxtnPay
Card Bank transfers
Direct debits
E-Wallets Mobile Card Bank transfers
Direct debits
E-Wallets MobileGraph in USD billions Graph in USD billions
At a glance At a glance
www.worldpay.com www.worldpay.com 4342
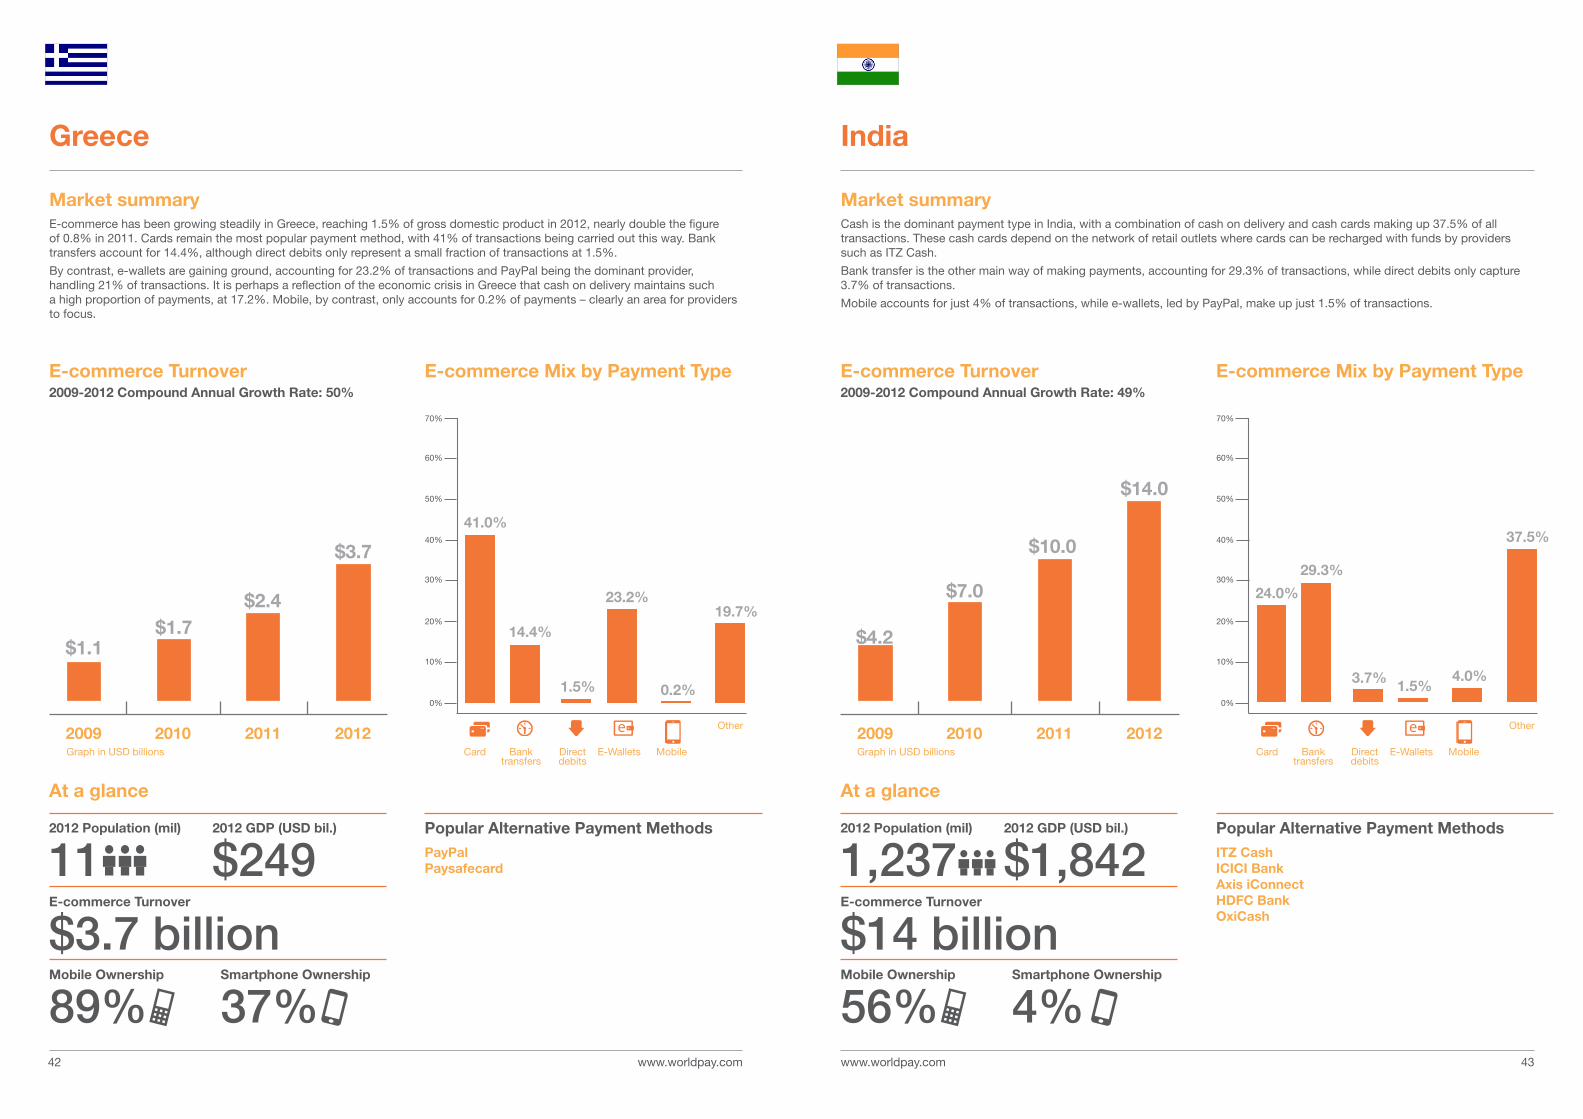
Market summaryCash is the dominant payment type in India, with a combination of cash on delivery and cash cards making up 37.5% of all transactions. These cash cards depend on the network of retail outlets where cards can be recharged with funds by providers such as ITZ Cash.
Bank transfer is the other main way of making payments, accounting for 29.3% of transactions, while direct debits only capture 3.7% of transactions.
Mobile accounts for just 4% of transactions, while e-wallets, led by PayPal, make up just 1.5% of transactions.
India
E-commerce Turnover2009-2012 Compound Annual Growth Rate: 49%
$4.2
2009 2010 2011 2012
$7.0
$10.0
$14.0
E-commerce Mix by Payment Type
24.0%
29.3%
3.7% 1.5%4.0%
37.5%
70%
60%
50%
40%
30%
20%
10%
0%
Other
0.2%
Market summaryE-commerce has been growing steadily in Greece, reaching 1.5% of gross domestic product in 2012, nearly double the figure of 0.8% in 2011. Cards remain the most popular payment method, with 41% of transactions being carried out this way. Bank transfers account for 14.4%, although direct debits only represent a small fraction of transactions at 1.5%.
By contrast, e-wallets are gaining ground, accounting for 23.2% of transactions and PayPal being the dominant provider, handling 21% of transactions. It is perhaps a reflection of the economic crisis in Greece that cash on delivery maintains such a high proportion of payments, at 17.2%. Mobile, by contrast, only accounts for 0.2% of payments – clearly an area for providers to focus.
Greece
E-commerce Turnover2009-2012 Compound Annual Growth Rate: 50%
$1.1$1.7
$2.4
$3.7
2009 2010 2011 2012
E-commerce Mix by Payment Type
41.0%
14.4%
1.5%
23.2%19.7%
70%
60%
50%
40%
30%
20%
10%
0%
Other
2012 Population (mil)
112012 Population (mil)
1,237E-commerce Turnover
$3.7 billionE-commerce Turnover
$14 billionMobile Ownership
89%Mobile Ownership
56%Smartphone Ownership
37%Smartphone Ownership
4%
2012 GDP (USD bil.)
$2492012 GDP (USD bil.)
$1,842Popular Alternative Payment MethodsPayPalPaysafecard
Popular Alternative Payment MethodsITZ CashICICI BankAxis iConnectHDFC BankOxiCash
Card Bank transfers
Direct debits
E-Wallets Mobile Card Bank transfers
Direct debits
E-Wallets MobileGraph in USD billions Graph in USD billions
At a glance At a glance
www.worldpay.com 4544 www.worldpay.com
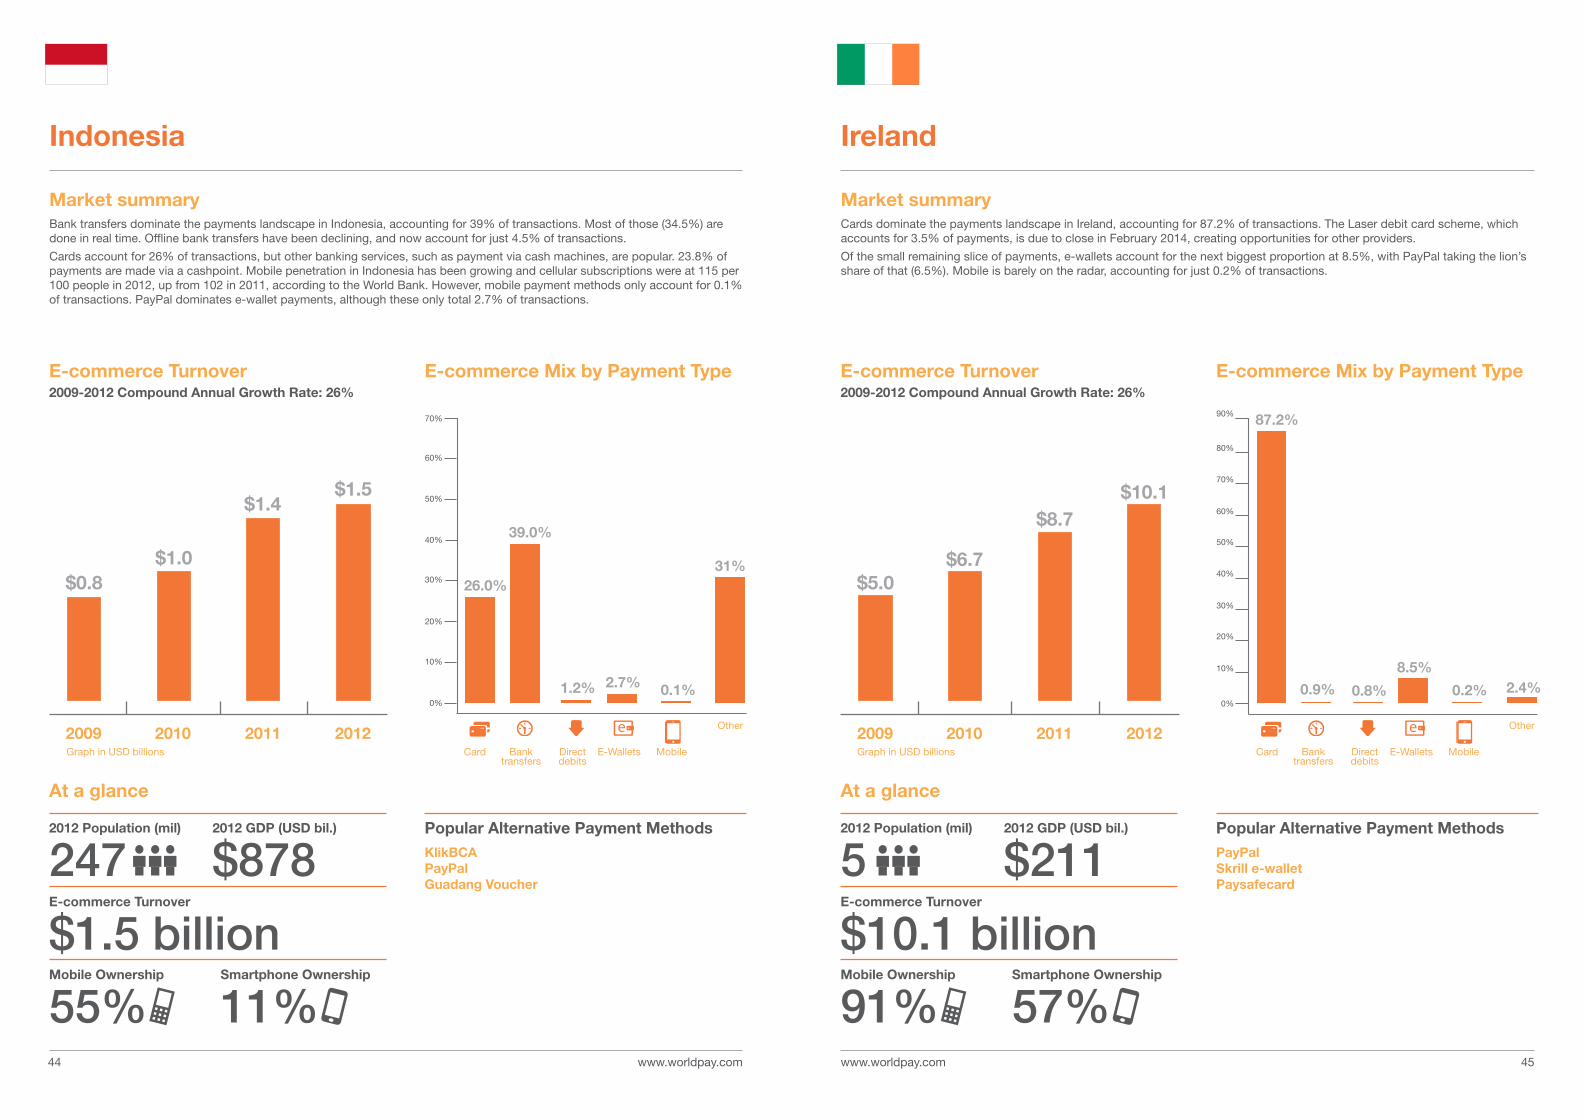
Market summaryCards dominate the payments landscape in Ireland, accounting for 87.2% of transactions. The Laser debit card scheme, which accounts for 3.5% of payments, is due to close in February 2014, creating opportunities for other providers.
Of the small remaining slice of payments, e-wallets account for the next biggest proportion at 8.5%, with PayPal taking the lion’s share of that (6.5%). Mobile is barely on the radar, accounting for just 0.2% of transactions.
Ireland
E-commerce Turnover2009-2012 Compound Annual Growth Rate: 26%
$5.0
2009 2010 2011 2012
$6.7
$8.7$10.1
E-commerce Mix by Payment Type
Other
0.1%
Market summaryBank transfers dominate the payments landscape in Indonesia, accounting for 39% of transactions. Most of those (34.5%) are done in real time. Offline bank transfers have been declining, and now account for just 4.5% of transactions.
Cards account for 26% of transactions, but other banking services, such as payment via cash machines, are popular. 23.8% of payments are made via a cashpoint. Mobile penetration in Indonesia has been growing and cellular subscriptions were at 115 per 100 people in 2012, up from 102 in 2011, according to the World Bank. However, mobile payment methods only account for 0.1% of transactions. PayPal dominates e-wallet payments, although these only total 2.7% of transactions.
Indonesia
E-commerce Turnover2009-2012 Compound Annual Growth Rate: 26%
$0.8$1.0
$1.4$1.5
2009 2010 2011 2012
E-commerce Mix by Payment Type
26.0%
39.0%
1.2% 2.7%
31%
70%
60%
50%
40%
30%
20%
10%
0%
Other
8.5%
0.9%
87.2%
70%
80%
90%
60%
50%
40%
30%
20%
10%
0%
2.4%0.2%0.8%
2012 Population (mil)
2472012 Population (mil)
5E-commerce Turnover
$1.5 billionE-commerce Turnover
$10.1 billionMobile Ownership
55%Mobile Ownership
91%Smartphone Ownership
11%Smartphone Ownership
57%
2012 GDP (USD bil.)
$8782012 GDP (USD bil.)
$211Popular Alternative Payment MethodsKlikBCAPayPalGuadang Voucher
Popular Alternative Payment MethodsPayPalSkrill e-walletPaysafecard
Card Bank transfers
Direct debits
E-Wallets Mobile Card Bank transfers
Direct debits
E-Wallets MobileGraph in USD billions Graph in USD billions
At a glance At a glance
www.worldpay.com www.worldpay.com 4746
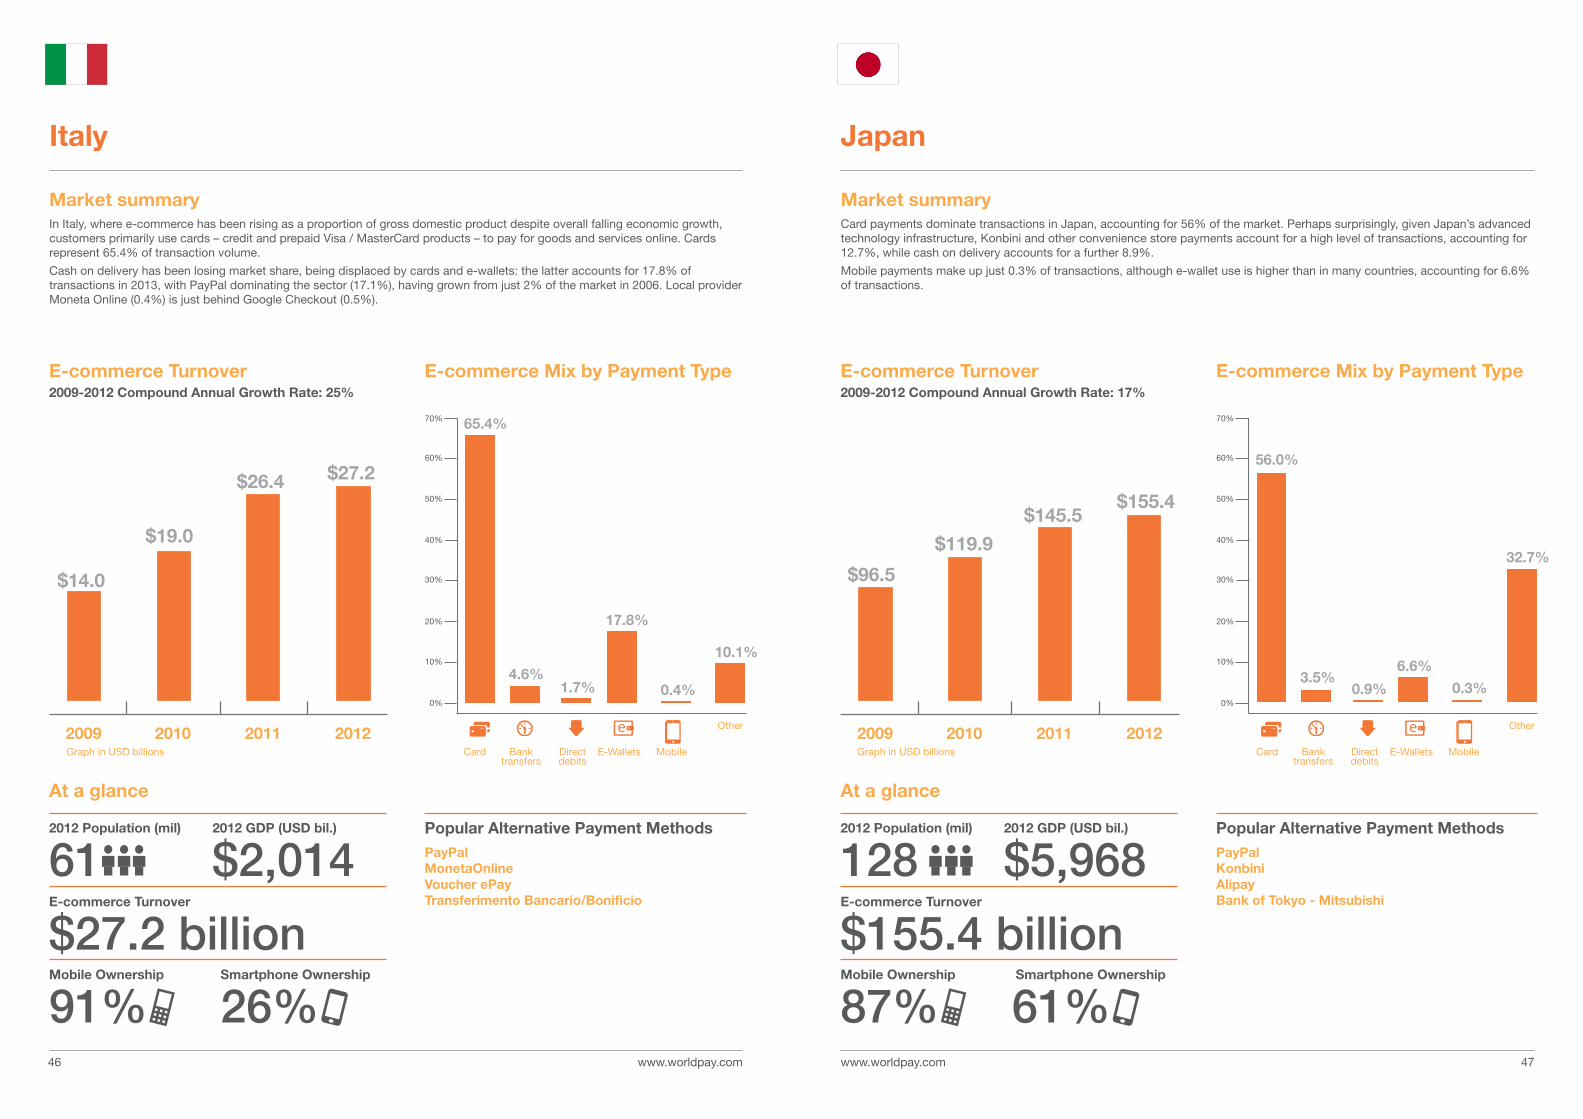
Market summaryCard payments dominate transactions in Japan, accounting for 56% of the market. Perhaps surprisingly, given Japan’s advanced technology infrastructure, Konbini and other convenience store payments account for a high level of transactions, accounting for 12.7%, while cash on delivery accounts for a further 8.9%.
Mobile payments make up just 0.3% of transactions, although e-wallet use is higher than in many countries, accounting for 6.6% of transactions.
Japan
E-commerce Turnover2009-2012 Compound Annual Growth Rate: 17%
$96.5
2009 2010 2011 2012
$119.9
$145.5$155.4
E-commerce Mix by Payment Type
56.0%
3.5%0.9%
6.6%
0.3%
32.7%
70%
60%
50%
40%
30%
20%
10%
0%
Other
0.4%
Market summaryIn Italy, where e-commerce has been rising as a proportion of gross domestic product despite overall falling economic growth, customers primarily use cards – credit and prepaid Visa / MasterCard products – to pay for goods and services online. Cards represent 65.4% of transaction volume.
Cash on delivery has been losing market share, being displaced by cards and e-wallets: the latter accounts for 17.8% of transactions in 2013, with PayPal dominating the sector (17.1%), having grown from just 2% of the market in 2006. Local provider Moneta Online (0.4%) is just behind Google Checkout (0.5%).
Italy
E-commerce Turnover2009-2012 Compound Annual Growth Rate: 25%
$14.0
$19.0
$26.4 $27.2
2009 2010 2011 2012
E-commerce Mix by Payment Type
65.4%
4.6%1.7%
17.8%
10.1%
70%
60%
50%
40%
30%
20%
10%
0%
Other
2012 Population (mil)
612012 Population (mil)
128E-commerce Turnover
$27.2 billionE-commerce Turnover
$155.4 billionMobile Ownership
91%Mobile Ownership
87%Smartphone Ownership
26% Smartphone Ownership
61%
2012 GDP (USD bil.)
$2,0142012 GDP (USD bil.)
$5,968Popular Alternative Payment MethodsPayPalMonetaOnlineVoucher ePayTransferimento Bancario/Bonificio
Popular Alternative Payment MethodsPayPalKonbiniAlipayBank of Tokyo - Mitsubishi
Card Bank transfers
Direct debits
E-Wallets Mobile Card Bank transfers
Direct debits
E-Wallets MobileGraph in USD billions Graph in USD billions
At a glance At a glance
www.worldpay.com www.worldpay.com
20092009 20102010 20112011 20122012
4948
70%
60%
50%
40%
30%
20%
10%
0%
Other
70%
60%
50%
40%
30%
20%
10%
0%
Other
E-commerce Turnover2009-2012 Compound Annual Growth Rate: 33%
E-commerce Turnover2009-2012 Compound Annual Growth Rate: 35%
E-commerce Mix by Payment TypeE-commerce Mix by Payment Type
50.0%
20.3%
0.5%3.3%
0.3%
25.6%$0.8
$1.0
$1.4
$1.9
19.0%
29.4%
0.8% 0.3% 2.5%
48.0%$82
$34$45
$57
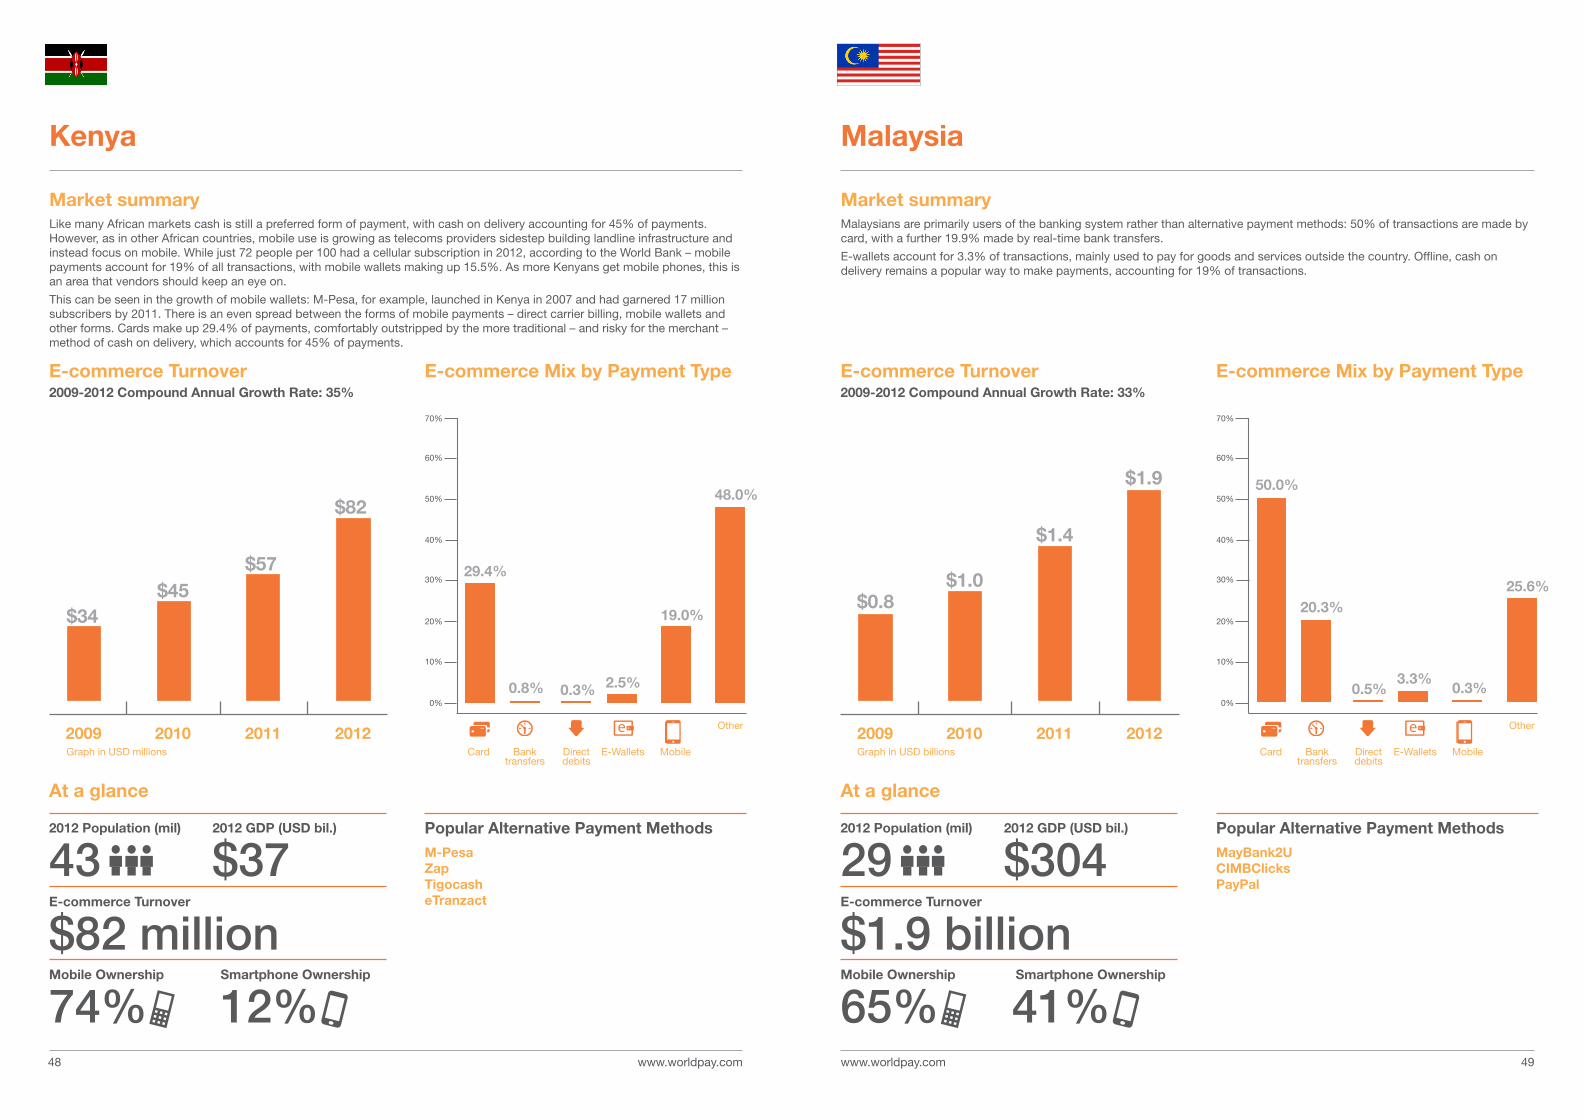
Market summaryMalaysians are primarily users of the banking system rather than alternative payment methods: 50% of transactions are made by card, with a further 19.9% made by real-time bank transfers.
E-wallets account for 3.3% of transactions, mainly used to pay for goods and services outside the country. Offline, cash on delivery remains a popular way to make payments, accounting for 19% of transactions.
Market summaryLike many African markets cash is still a preferred form of payment, with cash on delivery accounting for 45% of payments. However, as in other African countries, mobile use is growing as telecoms providers sidestep building landline infrastructure and instead focus on mobile. While just 72 people per 100 had a cellular subscription in 2012, according to the World Bank – mobile payments account for 19% of all transactions, with mobile wallets making up 15.5%. As more Kenyans get mobile phones, this is an area that vendors should keep an eye on.
This can be seen in the growth of mobile wallets: M-Pesa, for example, launched in Kenya in 2007 and had garnered 17 million subscribers by 2011. There is an even spread between the forms of mobile payments – direct carrier billing, mobile wallets and other forms. Cards make up 29.4% of payments, comfortably outstripped by the more traditional – and risky for the merchant – method of cash on delivery, which accounts for 45% of payments.
MalaysiaKenya
2012 Population (mil)
432012 Population (mil)
29E-commerce Turnover
$82 millionE-commerce Turnover
$1.9 billionMobile Ownership
74%Mobile Ownership
65%Smartphone Ownership
12% Smartphone Ownership
41%
2012 GDP (USD bil.)
$372012 GDP (USD bil.)
$304Popular Alternative Payment MethodsM-PesaZapTigocasheTranzact
Popular Alternative Payment MethodsMayBank2UCIMBClicksPayPal
Card Bank transfers
Direct debits
E-Wallets Mobile Card Bank transfers
Direct debits
E-Wallets MobileGraph in USD millions Graph in USD billions
At a glance At a glance
www.worldpay.com www.worldpay.com
20092009 20102010 20112011 20122012
5150
70%
60%
50%
40%
30%
20%
10%
0%
Other
70%
60%
50%
40%
30%
20%
10%
0%
Other
E-commerce Turnover2009-2012 Compound Annual Growth Rate: 7%
E-commerce Turnover2009-2012 Compound Annual Growth Rate: 22%
E-commerce Mix by Payment TypeE-commerce Mix by Payment Type
16.1%
63.8%
1.7% 2.6% 0.4%
15.4%
$13.4 $14.1$16.2 $16.4
0.1%
30.5%29.9%
1.2%
17.3%21.0%
$4.3
$5.6$6.3
$3.5
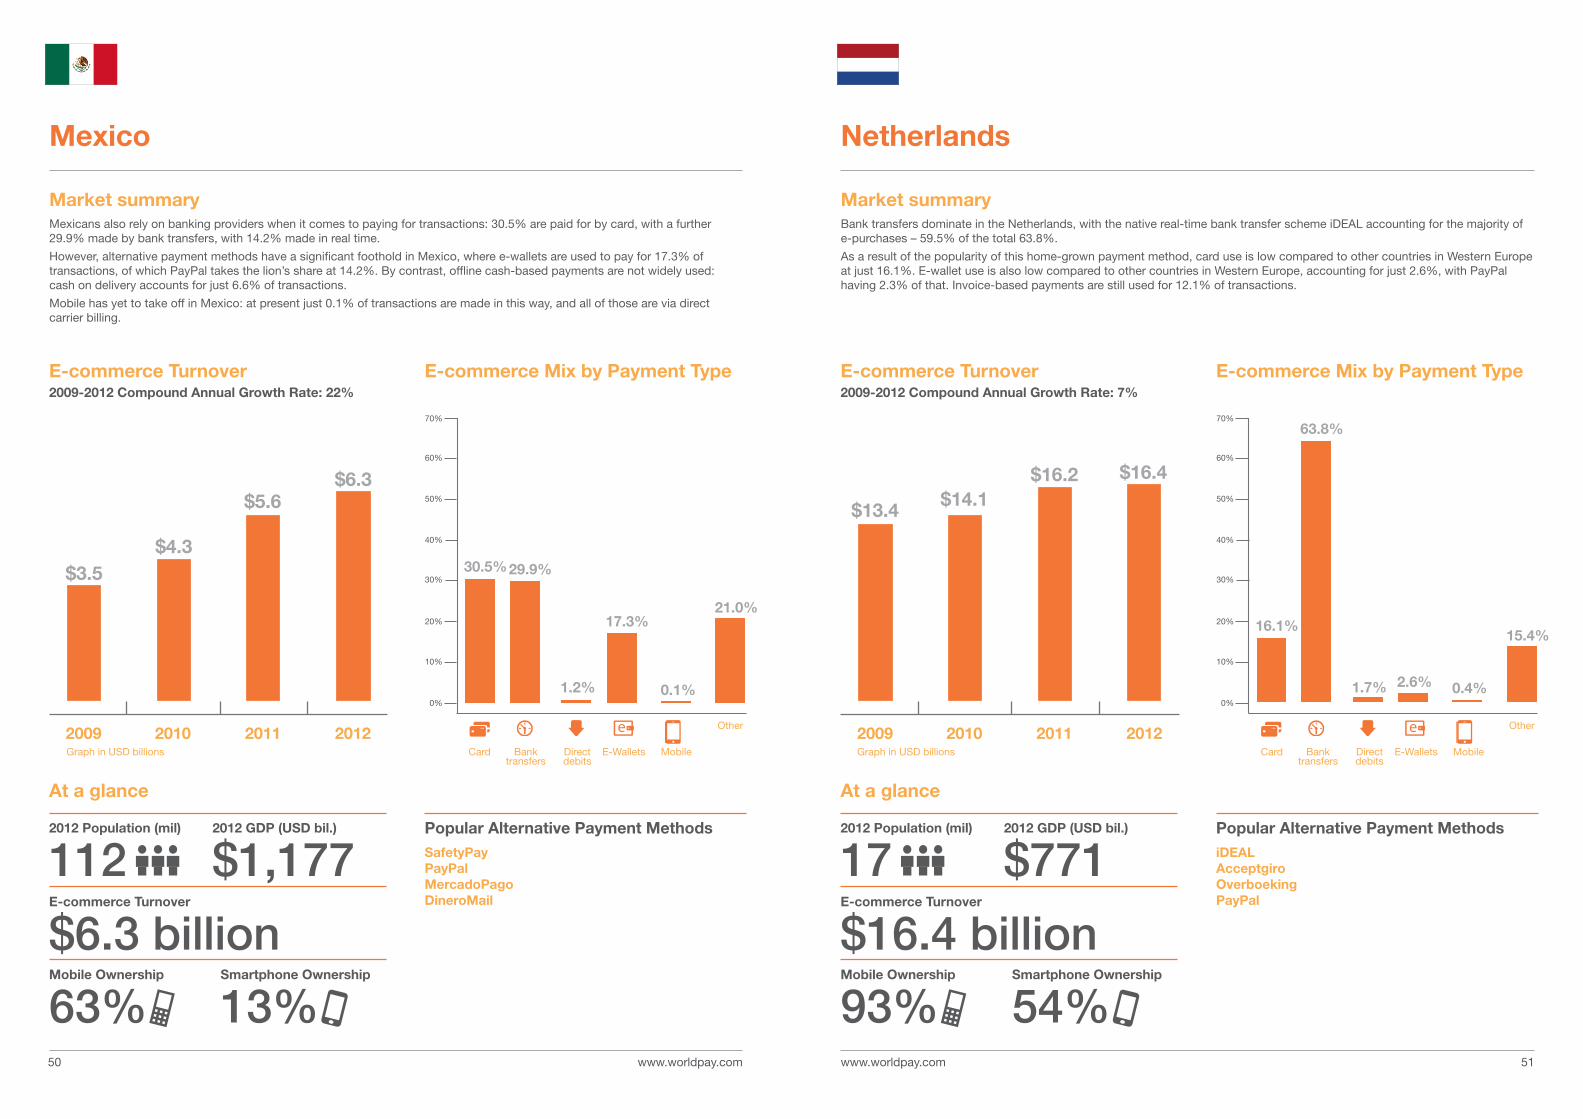
Market summaryBank transfers dominate in the Netherlands, with the native real-time bank transfer scheme iDEAL accounting for the majority of e-purchases – 59.5% of the total 63.8%.
As a result of the popularity of this home-grown payment method, card use is low compared to other countries in Western Europe at just 16.1%. E-wallet use is also low compared to other countries in Western Europe, accounting for just 2.6%, with PayPal having 2.3% of that. Invoice-based payments are still used for 12.1% of transactions.
Netherlands
Market summaryMexicans also rely on banking providers when it comes to paying for transactions: 30.5% are paid for by card, with a further 29.9% made by bank transfers, with 14.2% made in real time.
However, alternative payment methods have a significant foothold in Mexico, where e-wallets are used to pay for 17.3% of transactions, of which PayPal takes the lion’s share at 14.2%. By contrast, offline cash-based payments are not widely used: cash on delivery accounts for just 6.6% of transactions.
Mobile has yet to take off in Mexico: at present just 0.1% of transactions are made in this way, and all of those are via direct carrier billing.
Mexico
2012 Population (mil)
1122012 Population (mil)
17E-commerce Turnover
$6.3 billionE-commerce Turnover
$16.4 billionMobile Ownership
63%Mobile Ownership
93%Smartphone Ownership
13%Smartphone Ownership
54%
2012 GDP (USD bil.)
$1,1772012 GDP (USD bil.)
$771Popular Alternative Payment MethodsSafetyPayPayPalMercadoPagoDineroMail
Popular Alternative Payment MethodsiDEALAcceptgiroOverboekingPayPal
Card Bank transfers
Direct debits
E-Wallets Mobile Card Bank transfers
Direct debits
E-Wallets MobileGraph in USD billions Graph in USD billions
At a glance At a glance
www.worldpay.com www.worldpay.com
20092009 20102010 20112011 20122012
5352
70%
60%
50%
40%
30%
20%
10%
0%
Other
70%
60%
50%
40%
30%
20%
10%
0%
Other
E-commerce Turnover2009-2012 Compound Annual Growth Rate: 49%
E-commerce Turnover2009-2012 Compound Annual Growth Rate: 13%
E-commerce Mix by Payment TypeE-commerce Mix by Payment Type
60.0%
13.2%
1.2%5.9%
0.5%
19.2%
$7.1$7.9
$9.6$10.2
19.6%
32.6%
1.5% 0.4% 0.9%
34.0%
$0.2
$0.4
$0.6
$0.8
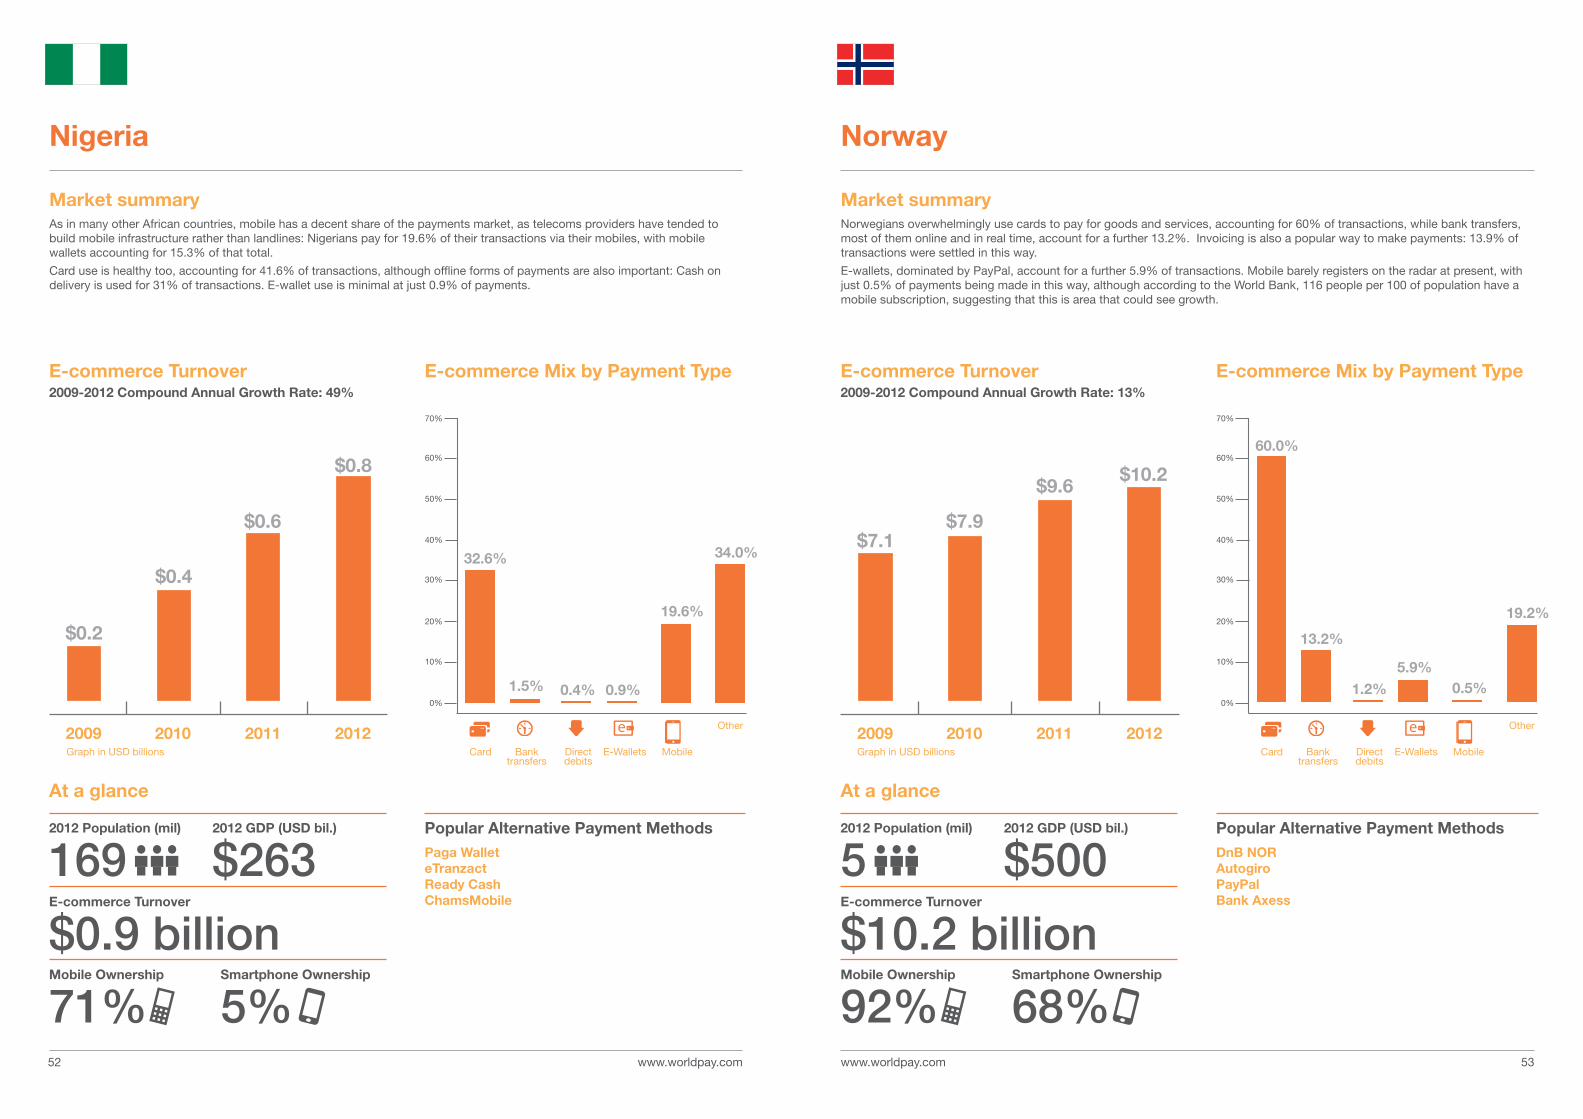
Market summaryNorwegians overwhelmingly use cards to pay for goods and services, accounting for 60% of transactions, while bank transfers, most of them online and in real time, account for a further 13.2%. Invoicing is also a popular way to make payments: 13.9% of transactions were settled in this way.
E-wallets, dominated by PayPal, account for a further 5.9% of transactions. Mobile barely registers on the radar at present, with just 0.5% of payments being made in this way, although according to the World Bank, 116 people per 100 of population have a mobile subscription, suggesting that this is area that could see growth.
Market summaryAs in many other African countries, mobile has a decent share of the payments market, as telecoms providers have tended to build mobile infrastructure rather than landlines: Nigerians pay for 19.6% of their transactions via their mobiles, with mobile wallets accounting for 15.3% of that total.
Card use is healthy too, accounting for 41.6% of transactions, although offline forms of payments are also important: Cash on delivery is used for 31% of transactions. E-wallet use is minimal at just 0.9% of payments.
NorwayNigeria
2012 Population (mil)
1692012 Population (mil)
5E-commerce Turnover
$0.9 billionE-commerce Turnover
$10.2 billionMobile Ownership
71%Mobile Ownership
92%Smartphone Ownership
5%Smartphone Ownership
68%
2012 GDP (USD bil.)
$2632012 GDP (USD bil.)
$500Popular Alternative Payment MethodsPaga WalleteTranzactReady CashChamsMobile
Popular Alternative Payment MethodsDnB NORAutogiroPayPalBank Axess
Card Bank transfers
Direct debits
E-Wallets Mobile Card Bank transfers
Direct debits
E-Wallets MobileGraph in USD billions Graph in USD billions
At a glance At a glance
www.worldpay.com www.worldpay.com
20092009 20102010 20112011 20122012Other
5554
70%
Other
E-commerce Turnover2009-2012 Compound Annual Growth Rate: 44%
E-commerce Turnover2009-2012 Compound Annual Growth Rate: 24%
E-commerce Mix by Payment TypeE-commerce Mix by Payment Type
9.0%
44.6%
0.4%4.0% 2.4%
39.6%
70%
60%
50%
40%
30%
20%
10%
0%
$2.8$3.3
$4.7$5.4
7.5%
24.6%20.1%
2.3%
13.9%
31.6%
$0.2
$0.4
$0.6
$0.760%
50%
40%
30%
20%
10%
0%
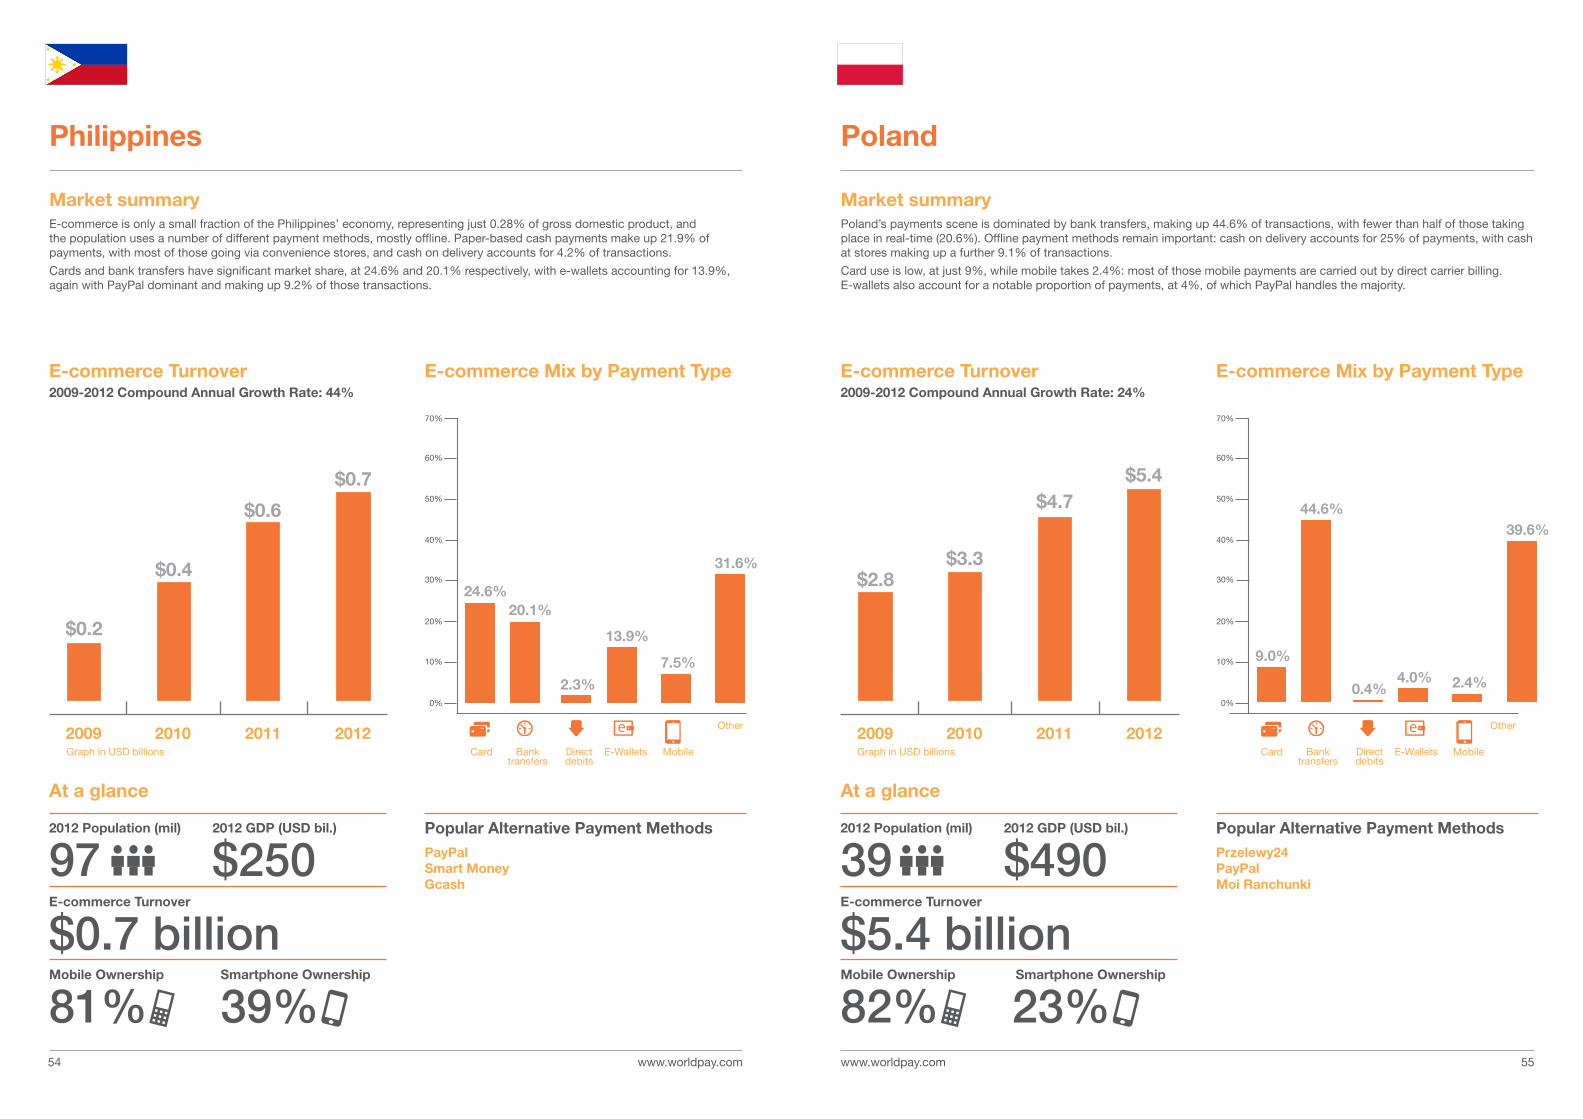
Market summaryPoland’s payments scene is dominated by bank transfers, making up 44.6% of transactions, with fewer than half of those taking place in real-time (20.6%). Offline payment methods remain important: cash on delivery accounts for 25% of payments, with cash at stores making up a further 9.1% of transactions.
Card use is low, at just 9%, while mobile takes 2.4%: most of those mobile payments are carried out by direct carrier billing. E-wallets also account for a notable proportion of payments, at 4%, of which PayPal handles the majority.
Poland
Market summaryE-commerce is only a small fraction of the Philippines’ economy, representing just 0.28% of gross domestic product, and the population uses a number of different payment methods, mostly offline. Paper-based cash payments make up 21.9% of payments, with most of those going via convenience stores, and cash on delivery accounts for 4.2% of transactions.
Cards and bank transfers have significant market share, at 24.6% and 20.1% respectively, with e-wallets accounting for 13.9%, again with PayPal dominant and making up 9.2% of those transactions.
Philippines
2012 Population (mil)
972012 Population (mil)
39E-commerce Turnover
$0.7 billionE-commerce Turnover
$5.4 billionMobile Ownership
81%Mobile Ownership
82%Smartphone Ownership
39% Smartphone Ownership
23%
2012 GDP (USD bil.)
$2502012 GDP (USD bil.)
$490Popular Alternative Payment MethodsPayPalSmart MoneyGcash
Popular Alternative Payment MethodsPrzelewy24PayPalMoi Ranchunki
Card Bank transfers
Direct debits
E-Wallets Mobile Card Bank transfers
Direct debits
E-Wallets MobileGraph in USD billions Graph in USD billions
At a glance At a glance

www.worldpay.com www.worldpay.com
2009 2010 2011 2012
5756
Other
E-commerce Turnover2009-2012 Compound Annual Growth Rate: 20%
E-commerce Mix by Payment Type E-commerce Turnover2009-2012 Compound Annual Growth Rate: 26%
$6.6
2009 2010 2011 2012
$8.1
$10.5
$13.2
E-commerce Mix by Payment Type
11.9%
4.1%
26.7%
1.8%
55.5%
70%
60%
50%
40%
30%
20%
10%
0%
Other
0.4%
40.4%
19.0%
5.7%
15.6%18.9%
70%
60%
50%
40%
30%
20%
10%
0%
$0.9$1.0
$1.3
$1.5
Market summaryRussia’s e-commerce economy is growing fast and projected to grow faster over the next two years, yet its payments landscape is largely based on cash, which accounts for 55.5% of transactions. Cash on delivery makes up the bulk of those at 41.2%, with payment terminals accounting for 5.8% of total e-commerce transactions. Card use and bank transfers are low, at 11.9% and 4.1% respectively, and bank transfers are exclusively offline.
Russians prefer local providers for e-wallets. The proportion of payments made this way accounts for 26.7% of transactions, with local provider Yandex.Money accounting for 7.3% of those. PayPal limps into fourth place with less than half of Yandex.Money’s share at 3.4%. Mobile payments are low, at just 1.8%, and again it is local providers who dominate the scene including mobile wallet provider RuRu.
Russia
Market summaryPortuguese customers have a preference for card payments for online purchases, completing 40.4% of transactions in this way, but bank transfers, e-wallets and cash on delivery are also important ways of paying for goods and services. Bank transfers appear to be all offline, and are used for 19% of transactions.
However, offline methods of payment, particularly cash on delivery, remain important: 17.5% of transactions are completed in this way. E-wallets are not far behind, though, accounting for 15.6% of payments, with PayPal the leading provider.
Portugal
2012 Population (mil)
112012 Population (mil)
144E-commerce Turnover
$1.5 billionE-commerce Turnover
$13.2 billionMobile Ownership
84%Mobile Ownership
88%Smartphone Ownership
32%Smartphone Ownership
15%
2012 GDP (USD bil.)
$2122012 GDP (USD bil.)
$2,017Popular Alternative Payment MethodsPayPalPaysafe card
Popular Alternative Payment MethodsYandex.MoneyWebMoneyQIWIPayPal
Card Bank transfers
Direct debits
E-Wallets Mobile Card Bank transfers
Direct debits
E-Wallets MobileGraph in USD billions Graph in USD billions
At a glance At a glance
www.worldpay.com www.worldpay.com 5958
E-commerce Turnover2009-2012 Compound Annual Growth Rate: 28%
$0.6
2009 2010 2011 2012
$0.8
$1.1$1.2
E-commerce Mix by Payment Type
37.5%
5.2%0.5%
3.9%
13.3%
39.6%
70%
60%
50%
40%
30%
20%
10%
0%
Other
0.3%
E-commerce Turnover2009-2012 Compound Annual Growth Rate: 24%
$1.8 $2.1
$2.9$3.4
2009 2010 2011 2012
E-commerce Mix by Payment Type
65.5%
21.3%
0.3%5.2%
7.4%
70%
60%
50%
40%
30%
20%
10%
0%
Other
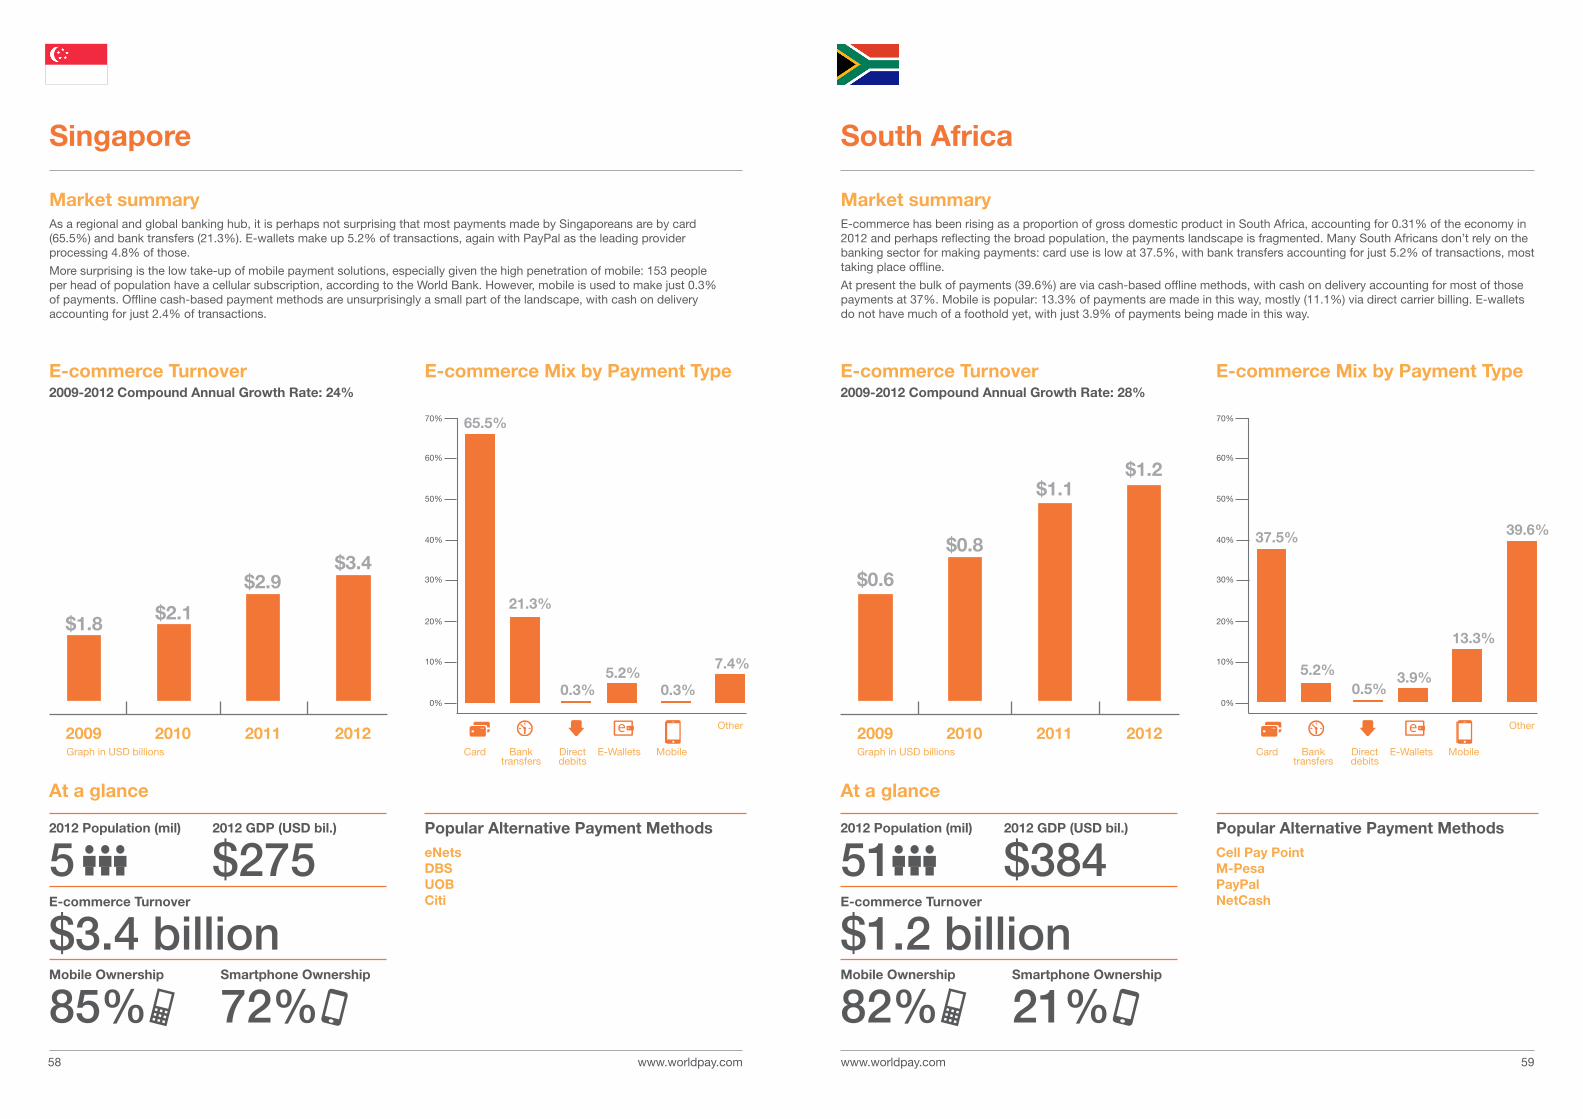
Market summaryE-commerce has been rising as a proportion of gross domestic product in South Africa, accounting for 0.31% of the economy in 2012 and perhaps reflecting the broad population, the payments landscape is fragmented. Many South Africans don’t rely on the banking sector for making payments: card use is low at 37.5%, with bank transfers accounting for just 5.2% of transactions, most taking place offline.
At present the bulk of payments (39.6%) are via cash-based offline methods, with cash on delivery accounting for most of those payments at 37%. Mobile is popular: 13.3% of payments are made in this way, mostly (11.1%) via direct carrier billing. E-wallets do not have much of a foothold yet, with just 3.9% of payments being made in this way.
South Africa
Market summaryAs a regional and global banking hub, it is perhaps not surprising that most payments made by Singaporeans are by card (65.5%) and bank transfers (21.3%). E-wallets make up 5.2% of transactions, again with PayPal as the leading provider processing 4.8% of those.
More surprising is the low take-up of mobile payment solutions, especially given the high penetration of mobile: 153 people per head of population have a cellular subscription, according to the World Bank. However, mobile is used to make just 0.3% of payments. Offline cash-based payment methods are unsurprisingly a small part of the landscape, with cash on delivery accounting for just 2.4% of transactions.
Singapore
2012 Population (mil)
52012 Population (mil)
51E-commerce Turnover
$3.4 billionE-commerce Turnover
$1.2 billionMobile Ownership
85%Mobile Ownership
82%Smartphone Ownership
72%Smartphone Ownership
21%
2012 GDP (USD bil.)
$2752012 GDP (USD bil.)
$384Popular Alternative Payment MethodseNets DBSUOBCiti
Popular Alternative Payment MethodsCell Pay PointM-PesaPayPalNetCash
Card Bank transfers
Direct debits
E-Wallets Mobile Card Bank transfers
Direct debits
E-Wallets MobileGraph in USD billions Graph in USD billions
At a glance At a glance
www.worldpay.com www.worldpay.com 6160
E-commerce Turnover2009-2012 Compound Annual Growth Rate: 28%
$11.3
2009 2010 2011 2012
$13.7
$18.1
$23.6
E-commerce Mix by Payment Type
70.0%
7.6%
1.7%
7.2%
0.3%
13.2%
70%
60%
50%
40%
30%
20%
10%
0%
Other
1.5%
E-commerce Turnover2009-2012 Compound Annual Growth Rate: 23%
$12.7
$18.7
$22.6 $24.0
2009 2010 2011 2012
E-commerce Mix by Payment Type
73.8%
4.5%0.3% 2.1%
17.8%
0%
10%
20%
30%
40%
50%
60%
70%
80%
Other
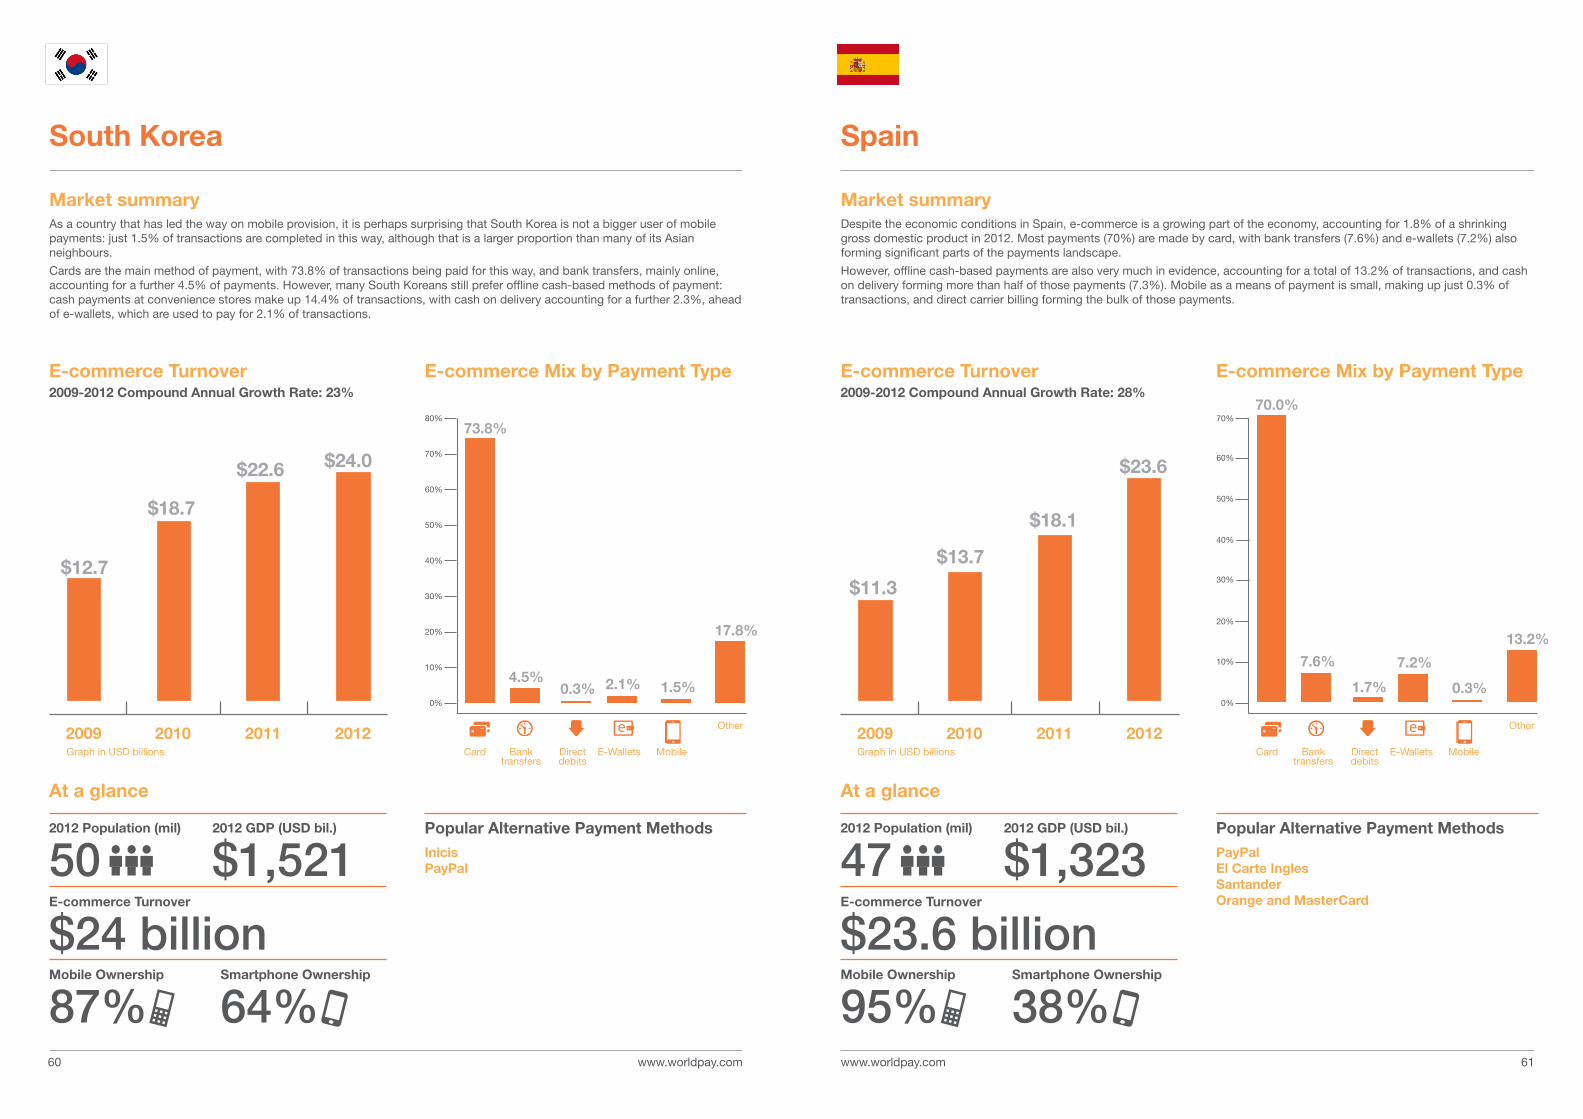
Market summaryDespite the economic conditions in Spain, e-commerce is a growing part of the economy, accounting for 1.8% of a shrinking gross domestic product in 2012. Most payments (70%) are made by card, with bank transfers (7.6%) and e-wallets (7.2%) also forming significant parts of the payments landscape.
However, offline cash-based payments are also very much in evidence, accounting for a total of 13.2% of transactions, and cash on delivery forming more than half of those payments (7.3%). Mobile as a means of payment is small, making up just 0.3% of transactions, and direct carrier billing forming the bulk of those payments.
Spain
Market summaryAs a country that has led the way on mobile provision, it is perhaps surprising that South Korea is not a bigger user of mobile payments: just 1.5% of transactions are completed in this way, although that is a larger proportion than many of its Asian neighbours.
Cards are the main method of payment, with 73.8% of transactions being paid for this way, and bank transfers, mainly online, accounting for a further 4.5% of payments. However, many South Koreans still prefer offline cash-based methods of payment: cash payments at convenience stores make up 14.4% of transactions, with cash on delivery accounting for a further 2.3%, ahead of e-wallets, which are used to pay for 2.1% of transactions.
South Korea
2012 Population (mil)
502012 Population (mil)
47E-commerce Turnover
$24 billionE-commerce Turnover
$23.6 billionMobile Ownership
87%Mobile Ownership
95%Smartphone Ownership
64%Smartphone Ownership
38%
2012 GDP (USD bil.)
$1,5212012 GDP (USD bil.)
$1,323Popular Alternative Payment MethodsInicisPayPal
Popular Alternative Payment MethodsPayPalEl Carte InglesSantanderOrange and MasterCard
Card Bank transfers
Direct debits
E-Wallets Mobile Card Bank transfers
Direct debits
E-Wallets MobileGraph in USD billions Graph in USD billions
At a glance At a glance
www.worldpay.com www.worldpay.com 6362
E-commerce Turnover2009-2012 Compound Annual Growth Rate: 15%
$7.7
2009 2010 2011 2012
$9.1
$11.0$11.7
E-commerce Mix by Payment Type
47.5%
8.7%
2.3%
9.8%
0.4%
31.3%
70%
60%
50%
40%
30%
20%
10%
0%
Other
0.9%
E-commerce Turnover2009-2012 Compound Annual Growth Rate: 17%
$10.1$12.1
$14.8$16.3
2009 2010 2011 2012
E-commerce Mix by Payment Type
34.0%
27.0%
1.3%5.3%
31.5%
70%
60%
50%
40%
30%
20%
10%
0%
Other
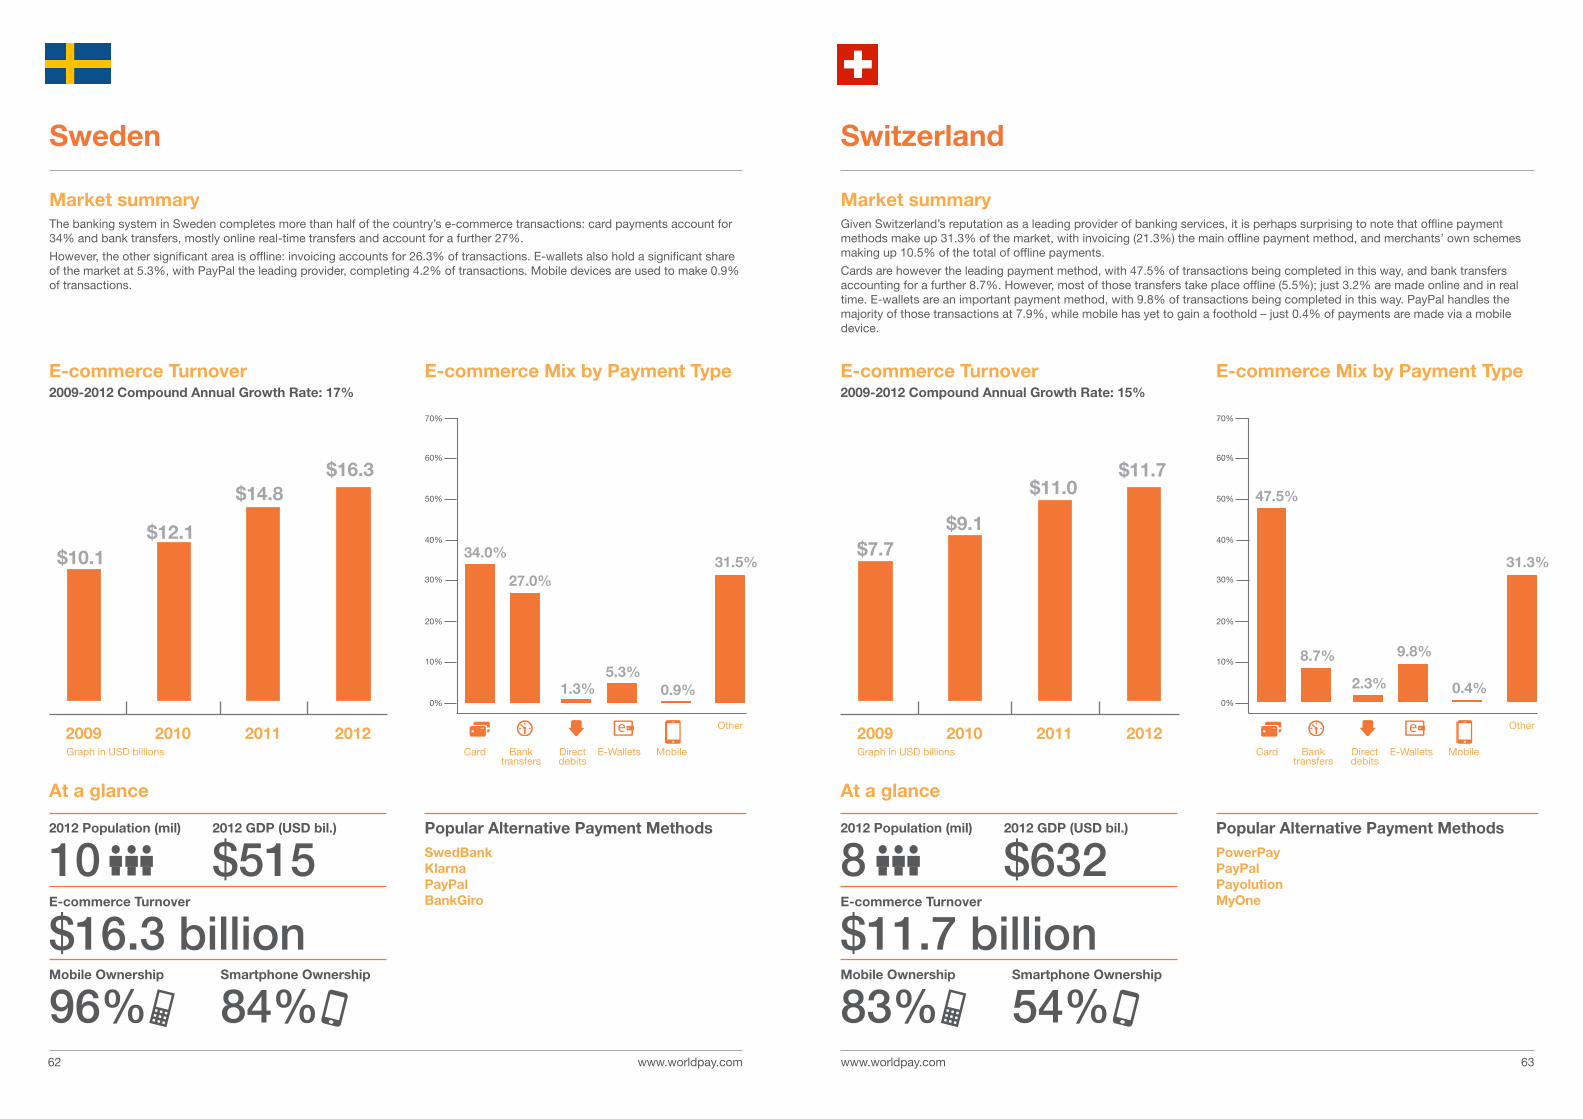
Market summaryGiven Switzerland’s reputation as a leading provider of banking services, it is perhaps surprising to note that offline payment methods make up 31.3% of the market, with invoicing (21.3%) the main offline payment method, and merchants’ own schemes making up 10.5% of the total of offline payments.
Cards are however the leading payment method, with 47.5% of transactions being completed in this way, and bank transfers accounting for a further 8.7%. However, most of those transfers take place offline (5.5%); just 3.2% are made online and in real time. E-wallets are an important payment method, with 9.8% of transactions being completed in this way. PayPal handles the majority of those transactions at 7.9%, while mobile has yet to gain a foothold – just 0.4% of payments are made via a mobile device.
Switzerland
Market summaryThe banking system in Sweden completes more than half of the country’s e-commerce transactions: card payments account for 34% and bank transfers, mostly online real-time transfers and account for a further 27%.
However, the other significant area is offline: invoicing accounts for 26.3% of transactions. E-wallets also hold a significant share of the market at 5.3%, with PayPal the leading provider, completing 4.2% of transactions. Mobile devices are used to make 0.9% of transactions.
Sweden
2012 Population (mil)
102012 Population (mil)
8E-commerce Turnover
$16.3 billionE-commerce Turnover
$11.7 billionMobile Ownership
96%Mobile Ownership
83%Smartphone Ownership
84%Smartphone Ownership
54%
2012 GDP (USD bil.)
$5152012 GDP (USD bil.)
$632Popular Alternative Payment MethodsSwedBankKlarnaPayPalBankGiro
Popular Alternative Payment MethodsPowerPayPayPalPayolutionMyOne
Card Bank transfers
Direct debits
E-Wallets Mobile Card Bank transfers
Direct debits
E-Wallets MobileGraph in USD billions Graph in USD billions
At a glance At a glance
www.worldpay.com www.worldpay.com 6564
E-commerce Turnover2009-2012 Compound Annual Growth Rate: 29%
$1.6
2009 2010 2011 2012
$2.2
$3.1 $3.4
E-commerce Mix by Payment Type
24.5%
30.0%
0.8%4.8%
1.4%
38.5%
70%
60%
50%
40%
30%
20%
10%
0%
Other
0.4%
E-commerce Turnover2009-2012 Compound Annual Growth Rate: 30%
$7.1$9.4
$12.9
$15.7
2009 2010 2011 2012
E-commerce Mix by Payment Type
3.0% 1.5% 0.2% 1.8%
93.1%
70%
80%
90%
100%
60%
50%
40%
30%
20%
10%
0%
Other
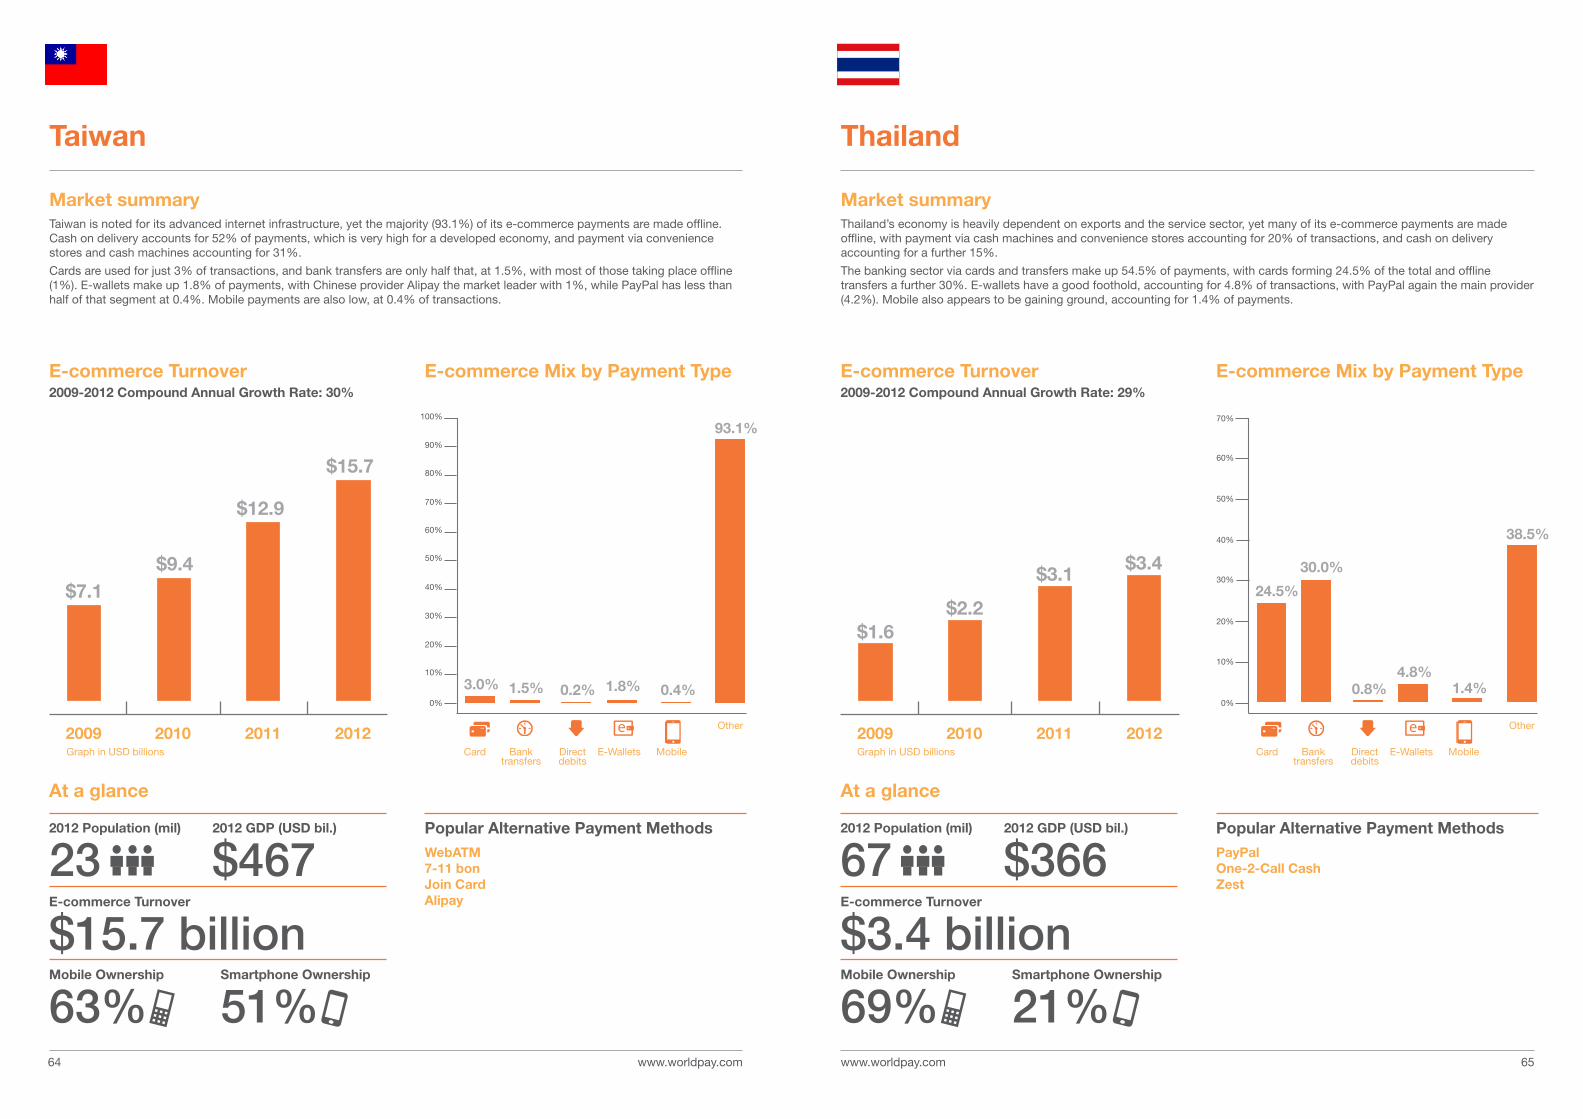
Market summaryThailand’s economy is heavily dependent on exports and the service sector, yet many of its e-commerce payments are made offline, with payment via cash machines and convenience stores accounting for 20% of transactions, and cash on delivery accounting for a further 15%.
The banking sector via cards and transfers make up 54.5% of payments, with cards forming 24.5% of the total and offline transfers a further 30%. E-wallets have a good foothold, accounting for 4.8% of transactions, with PayPal again the main provider (4.2%). Mobile also appears to be gaining ground, accounting for 1.4% of payments.
Thailand
Market summaryTaiwan is noted for its advanced internet infrastructure, yet the majority (93.1%) of its e-commerce payments are made offline. Cash on delivery accounts for 52% of payments, which is very high for a developed economy, and payment via convenience stores and cash machines accounting for 31%.
Cards are used for just 3% of transactions, and bank transfers are only half that, at 1.5%, with most of those taking place offline (1%). E-wallets make up 1.8% of payments, with Chinese provider Alipay the market leader with 1%, while PayPal has less than half of that segment at 0.4%. Mobile payments are also low, at 0.4% of transactions.
Taiwan
2012 Population (mil)
232012 Population (mil)
67E-commerce Turnover
$15.7 billionE-commerce Turnover
$3.4 billionMobile Ownership
63%Mobile Ownership
69%Smartphone Ownership
51%Smartphone Ownership
21%
2012 GDP (USD bil.)
$4672012 GDP (USD bil.)
$366Popular Alternative Payment MethodsWebATM7-11 bonJoin CardAlipay
Popular Alternative Payment MethodsPayPalOne-2-Call CashZest
Card Bank transfers
Direct debits
E-Wallets Mobile Card Bank transfers
Direct debits
E-Wallets MobileGraph in USD billions Graph in USD billions
At a glance At a glance
www.worldpay.com www.worldpay.com 6766
E-commerce Turnover2009-2012 Compound Annual Growth Rate: 14%
$144.3
2009 2010 2011 2012
$156.6
$191.2$212.1
E-commerce Mix by Payment Type
78.0%
0.8% 1.6%
16.2%
0.7% 2.8%
Other
0.7%
E-commerce Turnover2009-2012 Compound Annual Growth Rate: 35%
$8.1
$12.3
$16.6
$19.9
2009 2010 2011 2012
E-commerce Mix by Payment Type
83.0%
4.5%1.2% 0.7%
9.9%
70%
80%
90%
100%
60%
50%
40%
30%
20%
10%
0%
70%
80%
90%
100%
60%
50%
40%
30%
20%
10%
0%
Other
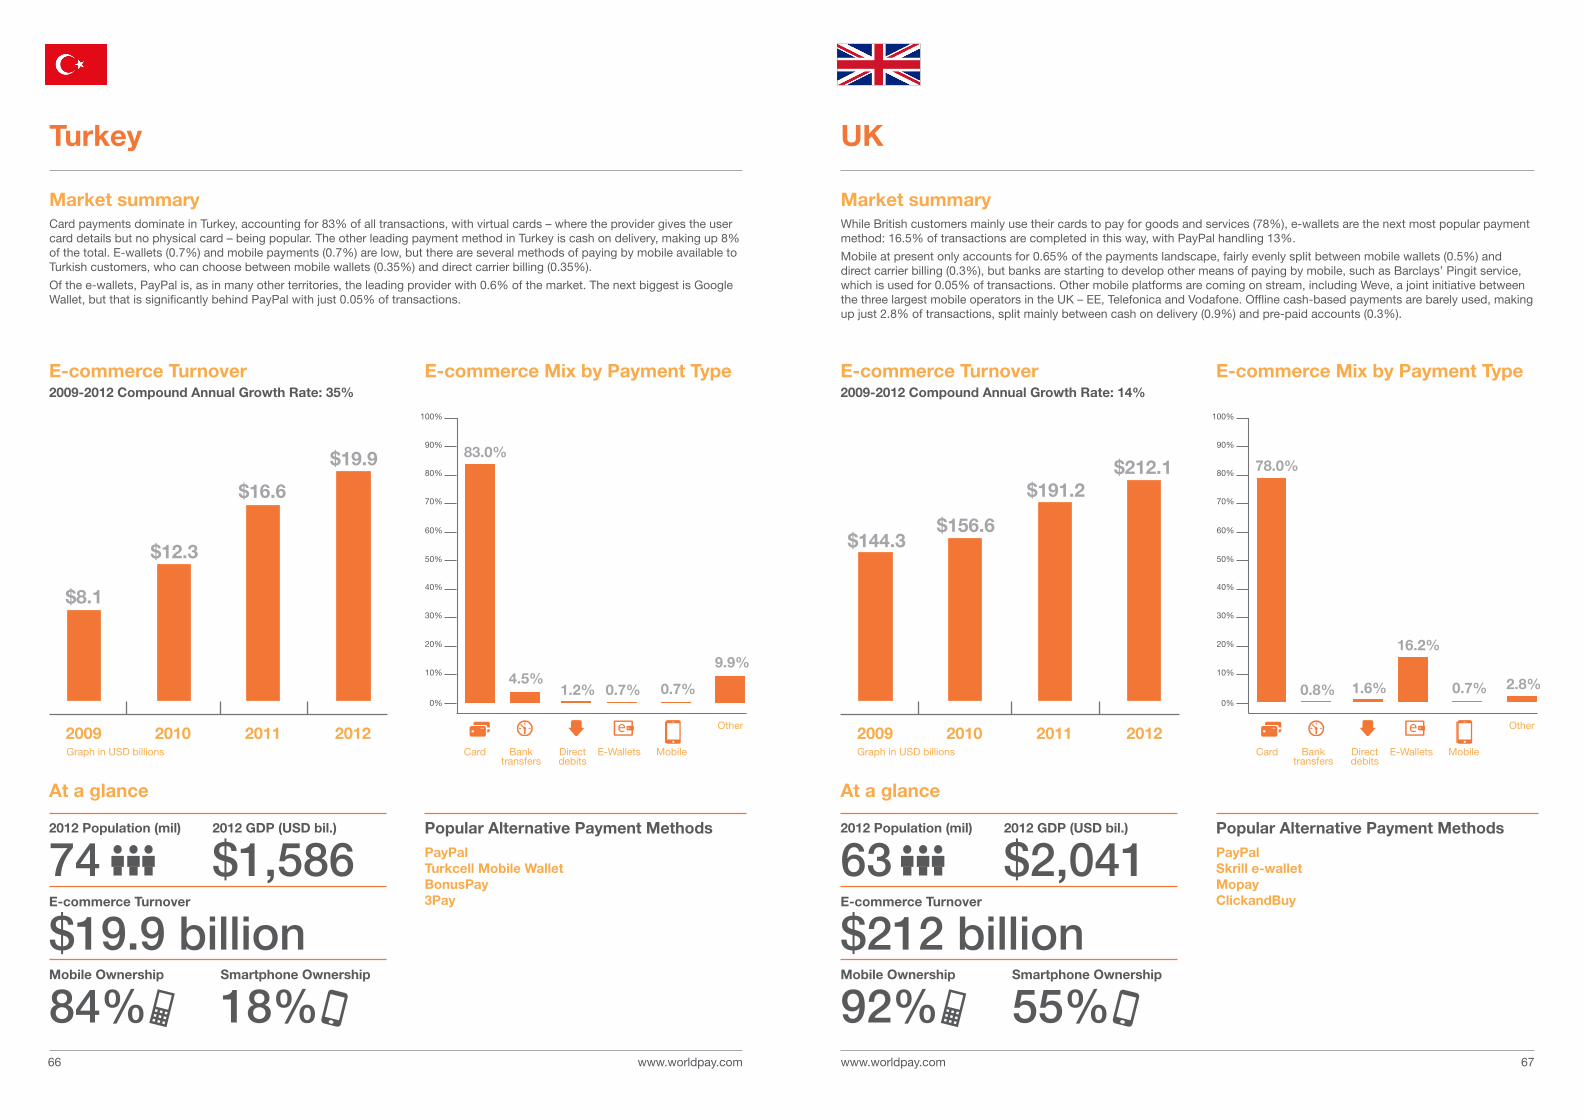
Market summaryWhile British customers mainly use their cards to pay for goods and services (78%), e-wallets are the next most popular payment method: 16.5% of transactions are completed in this way, with PayPal handling 13%.
Mobile at present only accounts for 0.65% of the payments landscape, fairly evenly split between mobile wallets (0.5%) and direct carrier billing (0.3%), but banks are starting to develop other means of paying by mobile, such as Barclays’ Pingit service, which is used for 0.05% of transactions. Other mobile platforms are coming on stream, including Weve, a joint initiative between the three largest mobile operators in the UK – EE, Telefonica and Vodafone. Offline cash-based payments are barely used, making up just 2.8% of transactions, split mainly between cash on delivery (0.9%) and pre-paid accounts (0.3%).
UK
Market summaryCard payments dominate in Turkey, accounting for 83% of all transactions, with virtual cards – where the provider gives the user card details but no physical card – being popular. The other leading payment method in Turkey is cash on delivery, making up 8% of the total. E-wallets (0.7%) and mobile payments (0.7%) are low, but there are several methods of paying by mobile available to Turkish customers, who can choose between mobile wallets (0.35%) and direct carrier billing (0.35%).
Of the e-wallets, PayPal is, as in many other territories, the leading provider with 0.6% of the market. The next biggest is Google Wallet, but that is significantly behind PayPal with just 0.05% of transactions.
Turkey
2012 Population (mil)
742012 Population (mil)
63E-commerce Turnover
$19.9 billionE-commerce Turnover
$212 billionMobile Ownership
84%Mobile Ownership
92%Smartphone Ownership
18%Smartphone Ownership
55%
2012 GDP (USD bil.)
$1,5862012 GDP (USD bil.)
$2,041Popular Alternative Payment MethodsPayPalTurkcell Mobile WalletBonusPay3Pay
Popular Alternative Payment MethodsPayPalSkrill e-walletMopayClickandBuy
Card Bank transfers
Direct debits
E-Wallets Mobile Card Bank transfers
Direct debits
E-Wallets MobileGraph in USD billions Graph in USD billions
At a glance At a glance
www.worldpay.com www.worldpay.com 6968
E-commerce Turnover2009-2012 Compound Annual Growth Rate: 43%
$87$117
$173
2009 2010 2011 2012
$255
E-commerce Mix by Payment Type
8.6%
56.1%
1.2%
8.6%
0.3%
25.2%
70%
60%
50%
40%
30%
20%
10%
0%
Other
1.2%
E-commerce Turnover2009-2012 Compound Annual Growth Rate: 15%
$394.1 $441.4$545.4 $593.6
2009 2010 2011 2012
E-commerce Mix by Payment Type
71.5%
0.7% 1.9%
17.6%
7.1%
Other
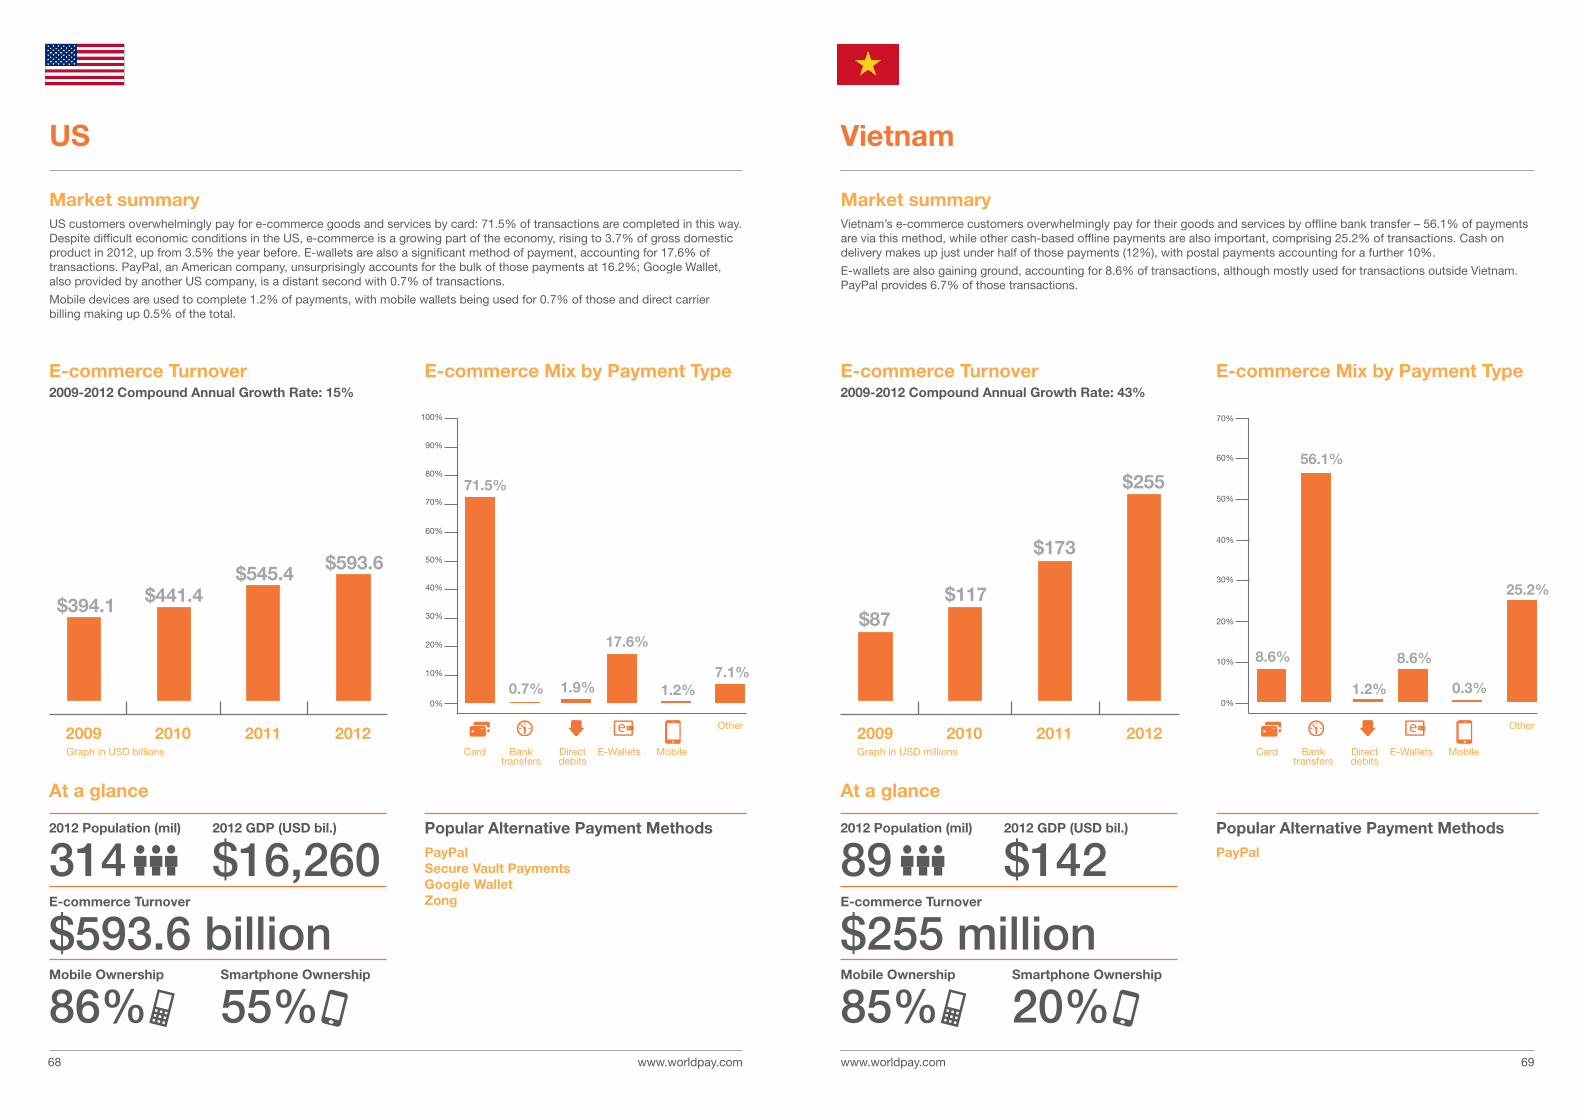
Market summaryVietnam’s e-commerce customers overwhelmingly pay for their goods and services by offline bank transfer – 56.1% of payments are via this method, while other cash-based offline payments are also important, comprising 25.2% of transactions. Cash on delivery makes up just under half of those payments (12%), with postal payments accounting for a further 10%.
E-wallets are also gaining ground, accounting for 8.6% of transactions, although mostly used for transactions outside Vietnam. PayPal provides 6.7% of those transactions.
Vietnam
Market summaryUS customers overwhelmingly pay for e-commerce goods and services by card: 71.5% of transactions are completed in this way. Despite difficult economic conditions in the US, e-commerce is a growing part of the economy, rising to 3.7% of gross domestic product in 2012, up from 3.5% the year before. E-wallets are also a significant method of payment, accounting for 17.6% of transactions. PayPal, an American company, unsurprisingly accounts for the bulk of those payments at 16.2%; Google Wallet, also provided by another US company, is a distant second with 0.7% of transactions.
Mobile devices are used to complete 1.2% of payments, with mobile wallets being used for 0.7% of those and direct carrier billing making up 0.5% of the total.
US
70%
80%
90%
100%
60%
50%
40%
30%
20%
10%
0%
2012 Population (mil)
3142012 Population (mil)
89E-commerce Turnover
$593.6 billionE-commerce Turnover
$255 millionMobile Ownership
86%Mobile Ownership
85%Smartphone Ownership
55%Smartphone Ownership
20%
2012 GDP (USD bil.)
$16,2602012 GDP (USD bil.)
$142Popular Alternative Payment MethodsPayPalSecure Vault PaymentsGoogle WalletZong
Popular Alternative Payment MethodsPayPal
Card Bank transfers
Direct debits
E-Wallets Mobile Card Bank transfers
Direct debits
E-Wallets MobileGraph in USD billions Graph in USD millions
At a glance At a glance
www.worldpay.com www.worldpay.com 71
This report has been compiled by WorldPay and First Annapolis Consulting. The findings are based on extensive surveys and interviews with experts in the e-commerce and m-commerce payments industries. We have also used more than 130 secondary sources, including:
• Local e-commerce trade associations
• Local card, banking, and/or payments associations
• Various national banks
• Facts and figures of various e-wallets and m-wallets and other payments schemes
• Facts and figures of various card schemes and payments providers
• E/m-commerce studies and reports and other research
• Other payments surveys and reports
• Third-party news articles
This document is proprietary to WorldPay. The information provided herein is provided on an “as-is” basis for information purposes only, and WorldPay makes no warranties of any kind in relation to the content or suitability. Terms and conditions apply to all our services. WorldPay (UK) Limited is a company registered in England number
07316500. Registered office: 55 Mansell Street, London, E1 8AN. WorldPay (UK) Limited is authorised and regulated by the Financial Conduct Authority under the Payment Services Regulations 2009 (Register No. 530923) for the provision of payment services.
About the data in this report

www.worldpay.com © Copyright 2013 WorldPay. All rights reserved.
For more information, please email: