Embed Size (px)
Citation preview
© 2013 The Alexander Group, Inc.® SARA – October 25, 2013
Your Sales Compensation Future:Why Sales Leadership Needs Your Help
David Cichelli
Senior Vice President
480.315.5828
Atlanta | Chicago | San Francisco | Scottsdale | Stamford
October 25, 2013
© 2013 The Alexander Group, Inc.® SARA – October 25, 2013
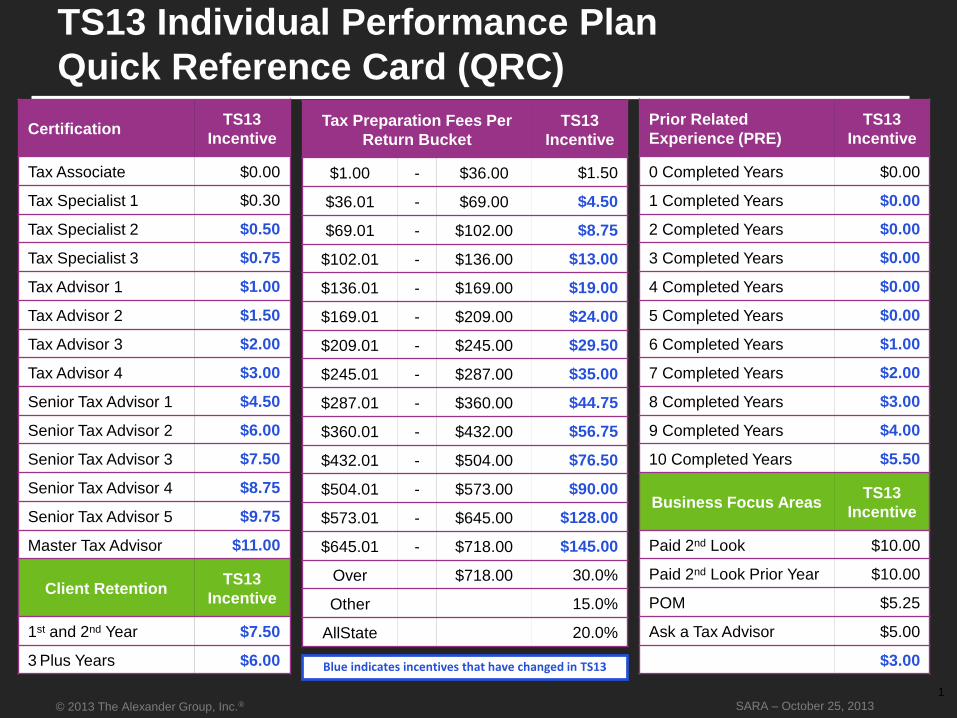
TS13 Individual Performance Plan
Quick Reference Card (QRC)
Tax Preparation Fees Per
Return Bucket
TS13
Incentive
$1.00 - $36.00 $1.50
$36.01 - $69.00 $4.50
$69.01 - $102.00 $8.75
$102.01 - $136.00 $13.00
$136.01 - $169.00 $19.00
$169.01 - $209.00 $24.00
$209.01 - $245.00 $29.50
$245.01 - $287.00 $35.00
$287.01 - $360.00 $44.75
$360.01 - $432.00 $56.75
$432.01 - $504.00 $76.50
$504.01 - $573.00 $90.00
$573.01 - $645.00 $128.00
$645.01 - $718.00 $145.00
Over $718.00 30.0%
Other 15.0%
AllState 20.0%
CertificationTS13
Incentive
Tax Associate $0.00
Tax Specialist 1 $0.30
Tax Specialist 2 $0.50
Tax Specialist 3 $0.75
Tax Advisor 1 $1.00
Tax Advisor 2 $1.50
Tax Advisor 3 $2.00
Tax Advisor 4 $3.00
Senior Tax Advisor 1 $4.50
Senior Tax Advisor 2 $6.00
Senior Tax Advisor 3 $7.50
Senior Tax Advisor 4 $8.75
Senior Tax Advisor 5 $9.75
Master Tax Advisor $11.00
Client RetentionTS13
Incentive
1st and 2nd Year $7.50
3 Plus Years $6.00
1
Prior Related
Experience (PRE)
TS13
Incentive
0 Completed Years $0.00
1 Completed Years $0.00
2 Completed Years $0.00
3 Completed Years $0.00
4 Completed Years $0.00
5 Completed Years $0.00
6 Completed Years $1.00
7 Completed Years $2.00
8 Completed Years $3.00
9 Completed Years $4.00
10 Completed Years $5.50
Business Focus AreasTS13
Incentive
Paid 2nd Look $10.00
Paid 2nd Look Prior Year $10.00
POM $5.25
Ask a Tax Advisor $5.00
Emerald Card $3.00Blue indicates incentives that have changed in TS13
© 2013 The Alexander Group, Inc.® SARA – October 25, 2013
Sales Compensation Around the World
2
© 2013 The Alexander Group, Inc.® SARA – October 25, 2013
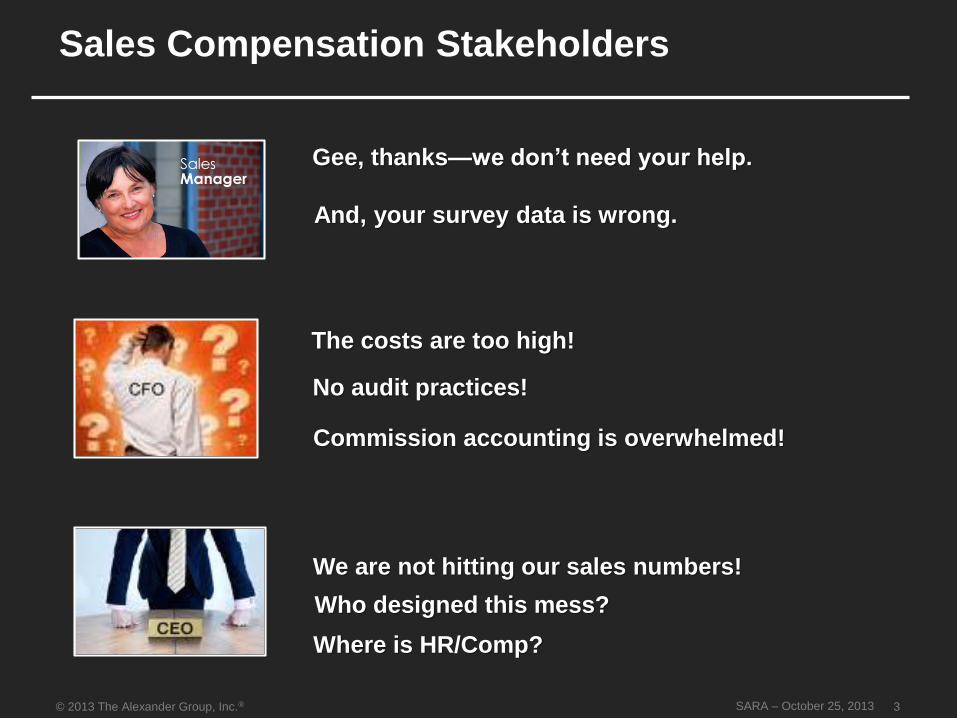
We are not hitting our sales numbers!
Who designed this mess?
Where is HR/Comp?
The costs are too high!
No audit practices!
Commission accounting is overwhelmed!
Sales Compensation Stakeholders
And, your survey data is wrong.
Gee, thanks—we don’t need your help.
3
© 2013 The Alexander Group, Inc.® SARA – October 25, 2013
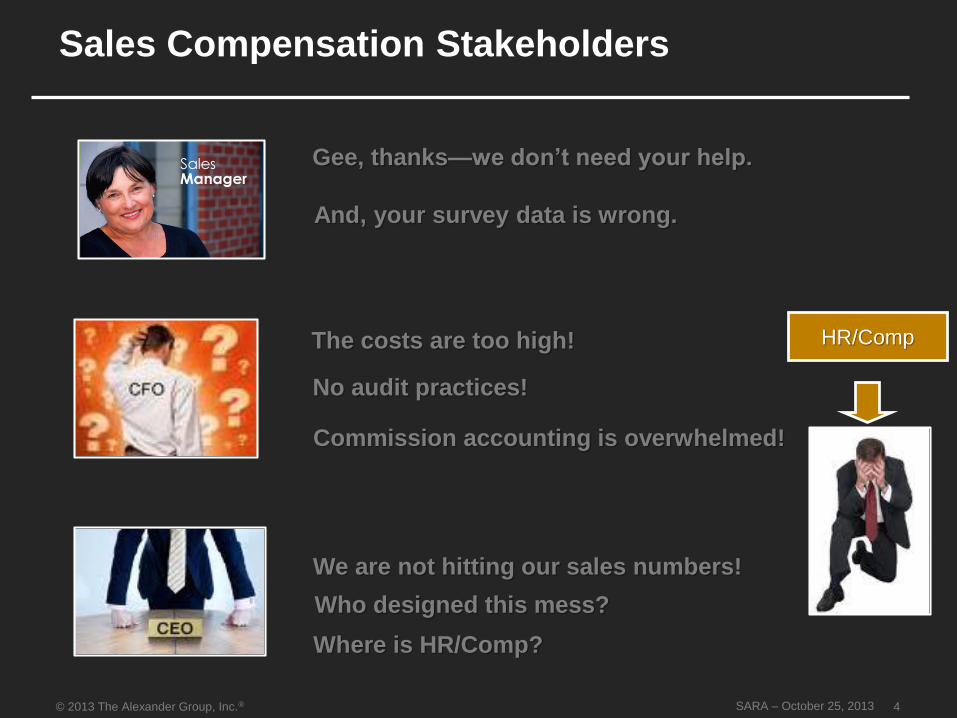
We are not hitting our sales numbers!
Who designed this mess?
Where is HR/Comp?
The costs are too high!
No audit practices!
Commission accounting is overwhelmed!
HR/Comp
Sales Compensation Stakeholders
And, your survey data is wrong.
Gee, thanks—we don’t need your help.
4
© 2013 The Alexander Group, Inc.® SARA – October 25, 2013
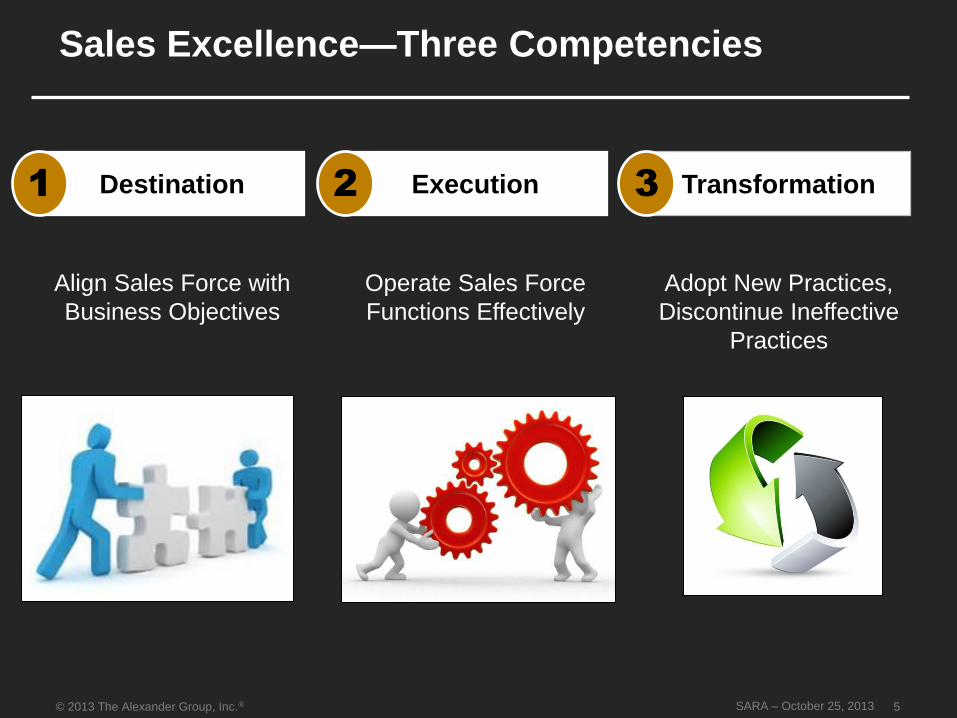
Sales Excellence—Three Competencies
Operate Sales Force
Functions Effectively
Transformation
Align Sales Force with
Business Objectives
Adopt New Practices,
Discontinue Ineffective
Practices
ExecutionDestination 2 31
5
© 2013 The Alexander Group, Inc.® SARA – October 25, 2013
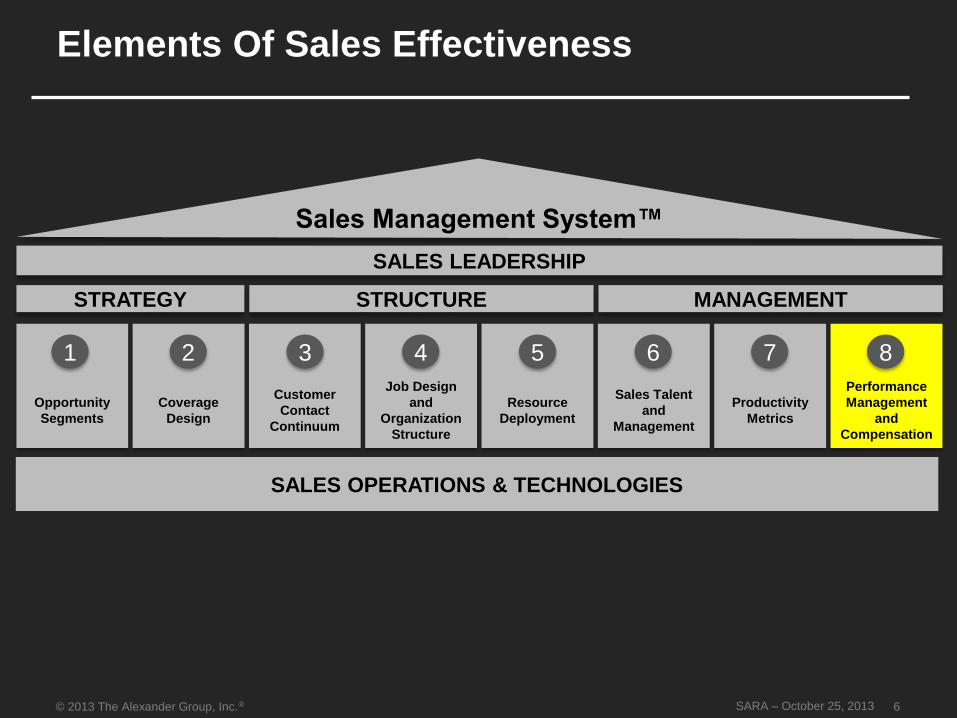
Elements Of Sales Effectiveness
Sales Management System™
SALES LEADERSHIP
STRATEGY STRUCTURE
Opportunity
Segments
1
Coverage
Design
2
Customer
Contact
Continuum
3
Job Design
and
Organization
Structure
4
Resource
Deployment
5
Sales Talent
and
Management
6
Productivity
Metrics
7
Performance
Management
and
Compensation
8
MANAGEMENT
SALES OPERATIONS & TECHNOLOGIES
6
© 2013 The Alexander Group, Inc.® SARA – October 25, 2013
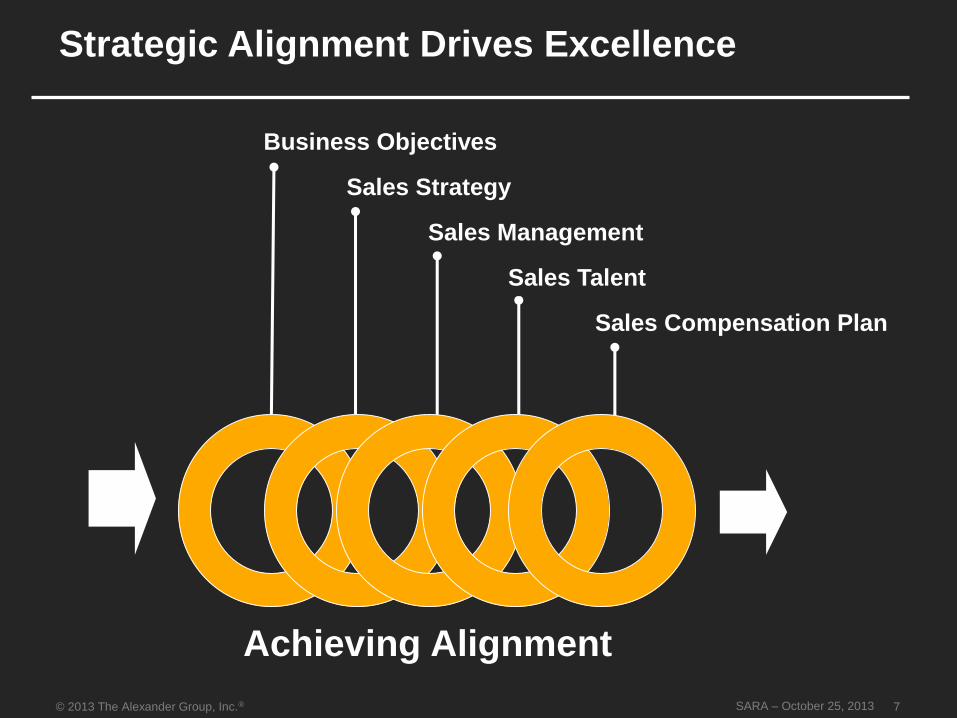
Business Objectives
Sales Strategy
Sales Management
Sales Talent
Sales Compensation Plan
Strategic Alignment Drives Excellence
7
Achieving Alignment
© 2013 The Alexander Group, Inc.® SARA – October 25, 2013
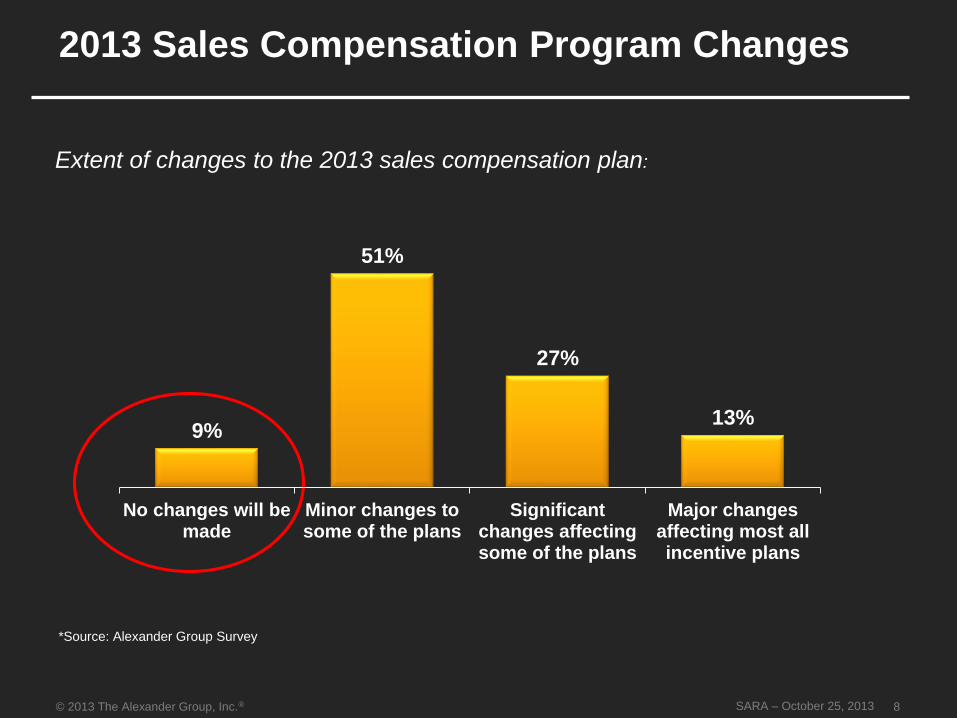
2013 Sales Compensation Program Changes
Extent of changes to the 2013 sales compensation plan:
*Source: Alexander Group Survey
8
9%
51%
27%
13%
No changes will bemade
Minor changes tosome of the plans
Significantchanges affectingsome of the plans
Major changesaffecting most allincentive plans
© 2013 The Alexander Group, Inc.® SARA – October 25, 2013
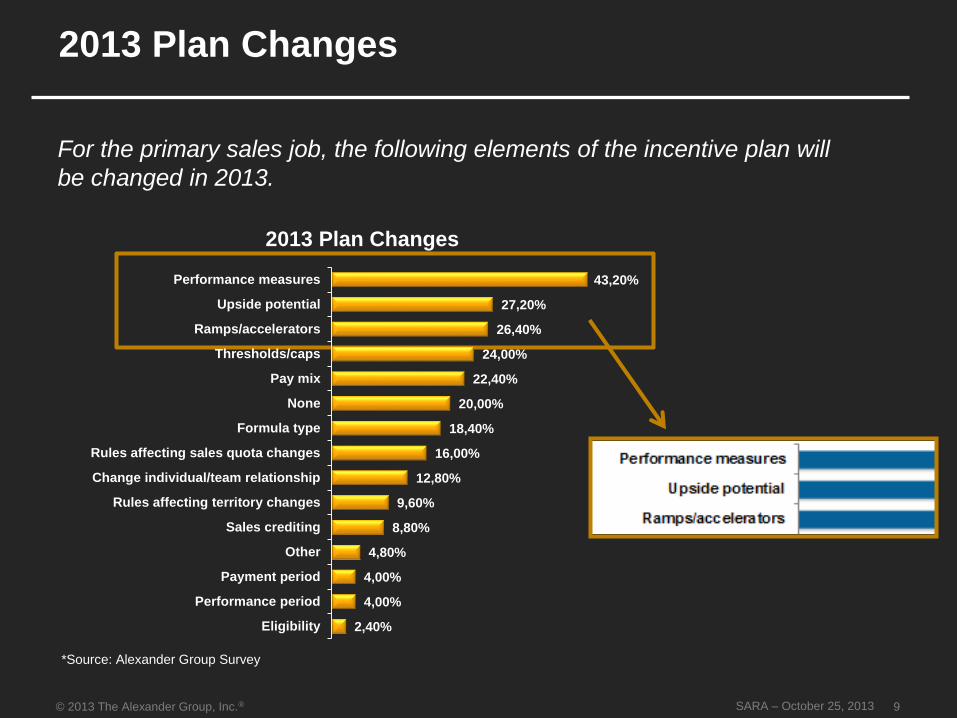
2013 Plan Changes
For the primary sales job, the following elements of the incentive plan will
be changed in 2013.
*Source: Alexander Group Survey
9
43,20%
27,20%
26,40%
24,00%
22,40%
20,00%
18,40%
16,00%
12,80%
9,60%
8,80%
4,80%
4,00%
4,00%
2,40%
Performance measures
Upside potential
Ramps/accelerators
Thresholds/caps
Pay mix
None
Formula type
Rules affecting sales quota changes
Change individual/team relationship
Rules affecting territory changes
Sales crediting
Other
Payment period
Performance period
Eligibility
2013 Plan Changes

© 2013 The Alexander Group, Inc.® SARA – October 25, 2013
Sales Compensation: Why You?
© 2013 The Alexander Group, Inc.® SARA – October 25, 2013
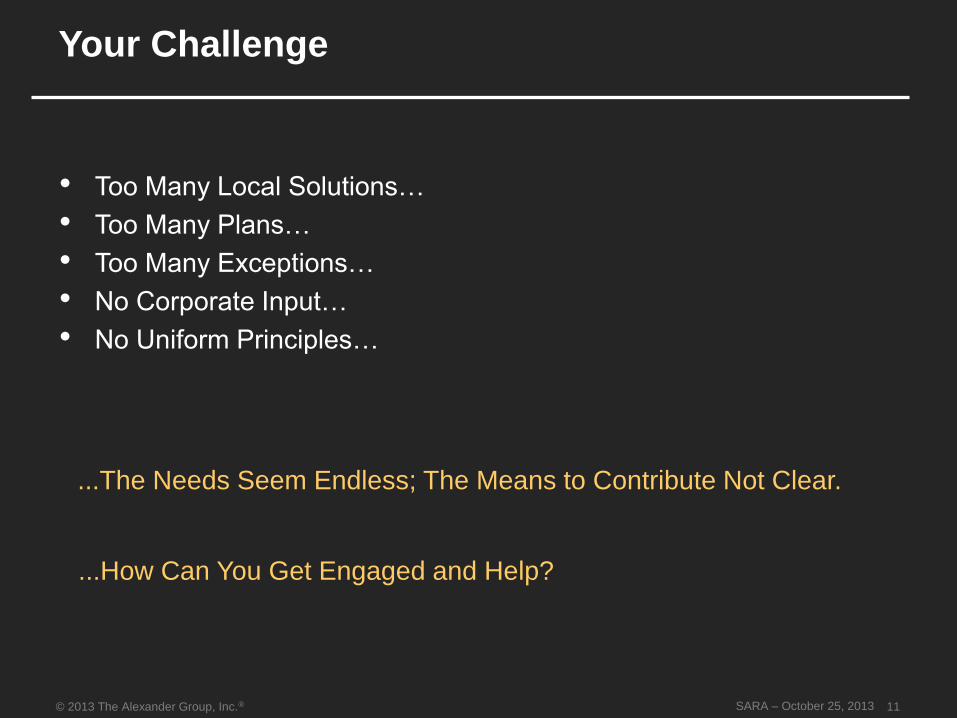
Your Challenge
• Too Many Local Solutions…
• Too Many Plans…
• Too Many Exceptions…
• No Corporate Input…
• No Uniform Principles…
...The Needs Seem Endless; The Means to Contribute Not Clear.
...How Can You Get Engaged and Help?
11
© 2013 The Alexander Group, Inc.® SARA – October 25, 2013
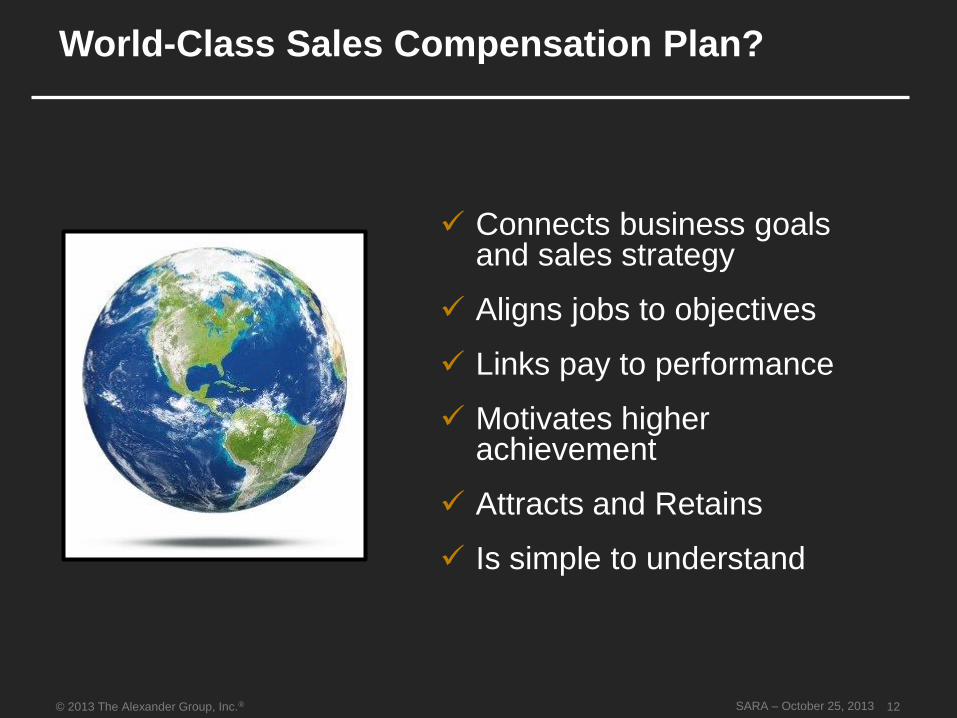
World-Class Sales Compensation Plan?
Connects business goals and sales strategy
Aligns jobs to objectives
Links pay to performance
Motivates higher achievement
Attracts and Retains
Is simple to understand
12
© 2013 The Alexander Group, Inc.® SARA – October 25, 2013
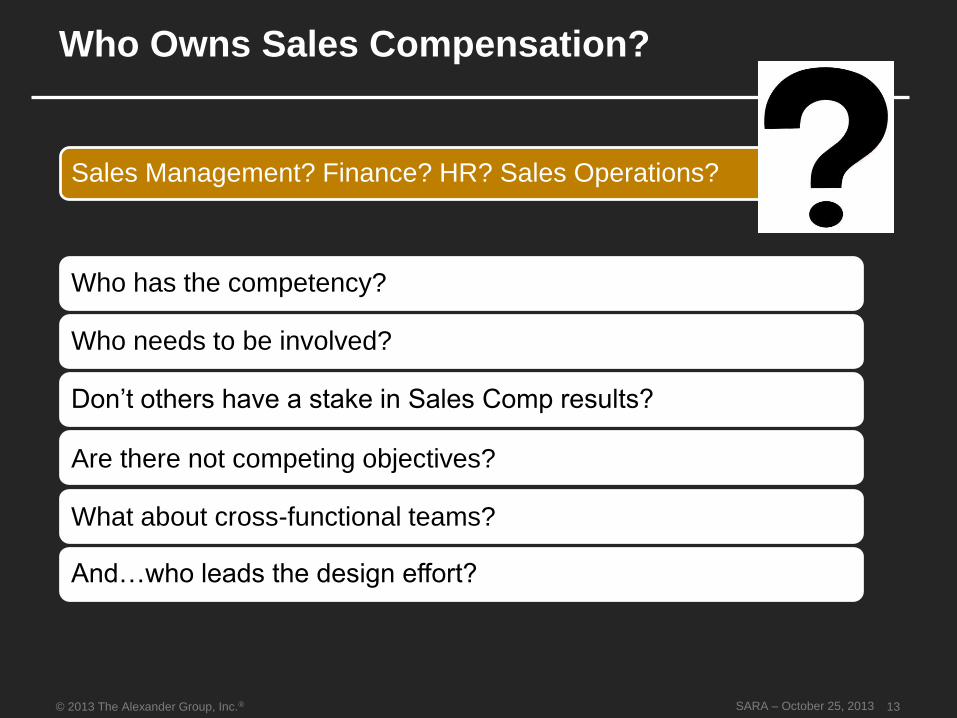
Who Owns Sales Compensation?
Sales Management? Finance? HR? Sales Operations?
Who has the competency?
Who needs to be involved?
Don’t others have a stake in Sales Comp results?
Are there not competing objectives?
What about cross-functional teams?
And…who leads the design effort?
13
© 2013 The Alexander Group, Inc.® SARA – October 25, 2013
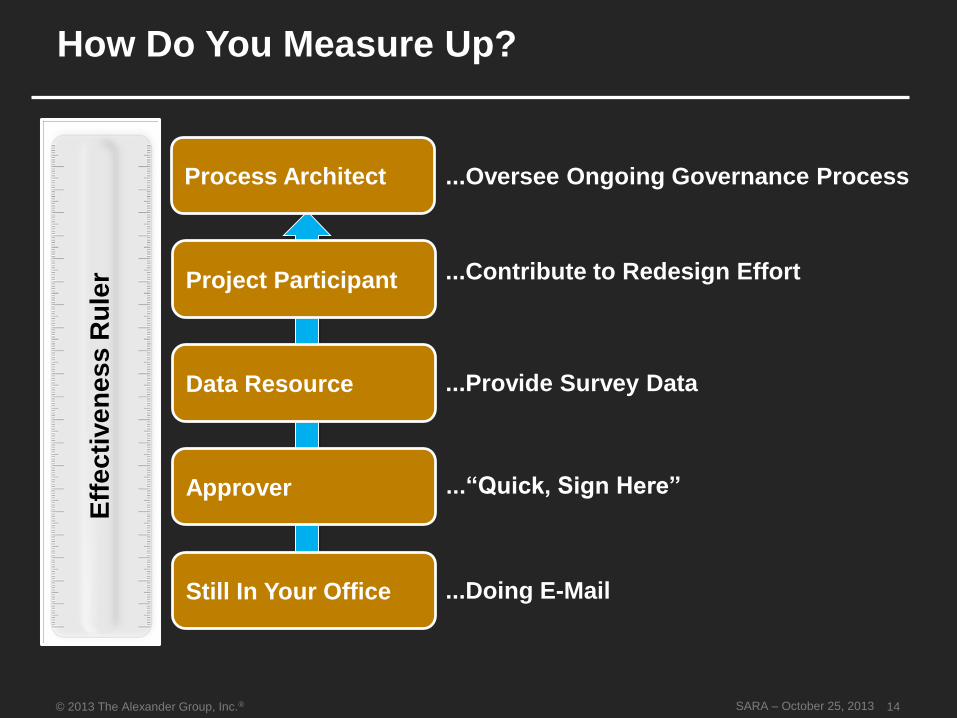
Eff
ec
tive
ne
ss
Ru
ler
How Do You Measure Up?
...Oversee Ongoing Governance Process
...Contribute to Redesign Effort
...Provide Survey Data
...“Quick, Sign Here”
...Doing E-Mail
Process Architect
Project Participant
Data Resource
Approver
Still In Your Office
14

© 2013 The Alexander Group, Inc.® SARA – October 25, 2013
2014: Your Action Steps
© 2013 The Alexander Group, Inc.® SARA – October 25, 2013
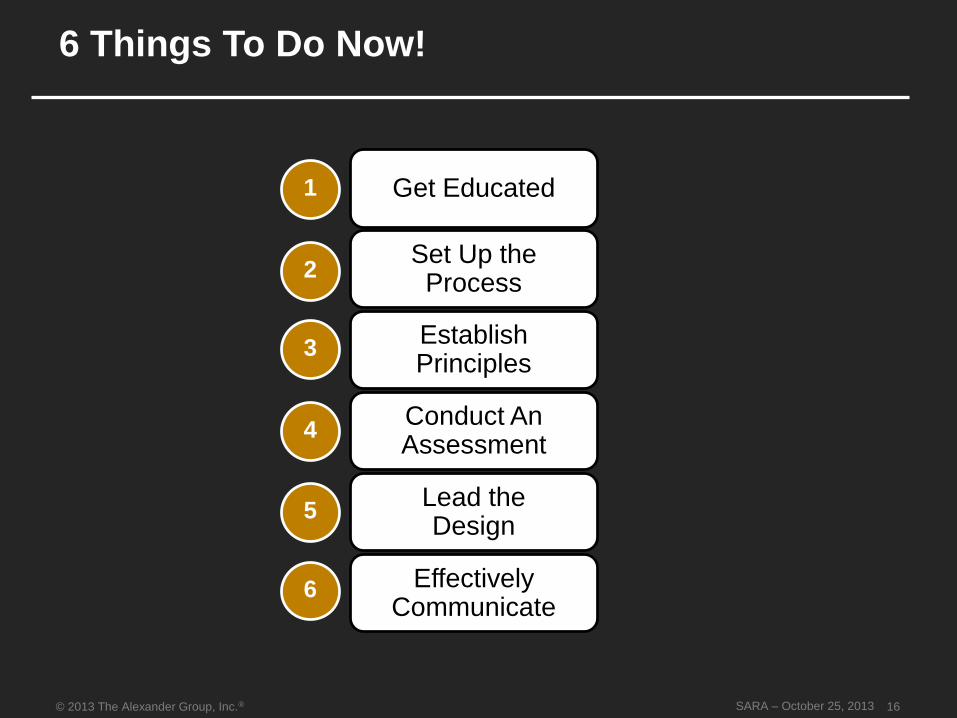
6 Things To Do Now!
Conduct An Assessment
Lead the Design
1
3
4
5
2
Effectively Communicate
6
Get Educated
Establish Principles
Set Up the Process
16

© 2013 The Alexander Group, Inc.® SARA – October 25, 2013
• Do an In-House Briefing
• Send to a Training Session/Seminar
• Share Articles of Interest
• Provide Books of Interest
• Sponsor In-House Workshop
Educate Stakeholders
17
Get Educated
Conduct An Assessment
Establish Principles
Lead the Design
Communicate
Set Up the Process
© 2013 The Alexander Group, Inc.® SARA – October 25, 2013
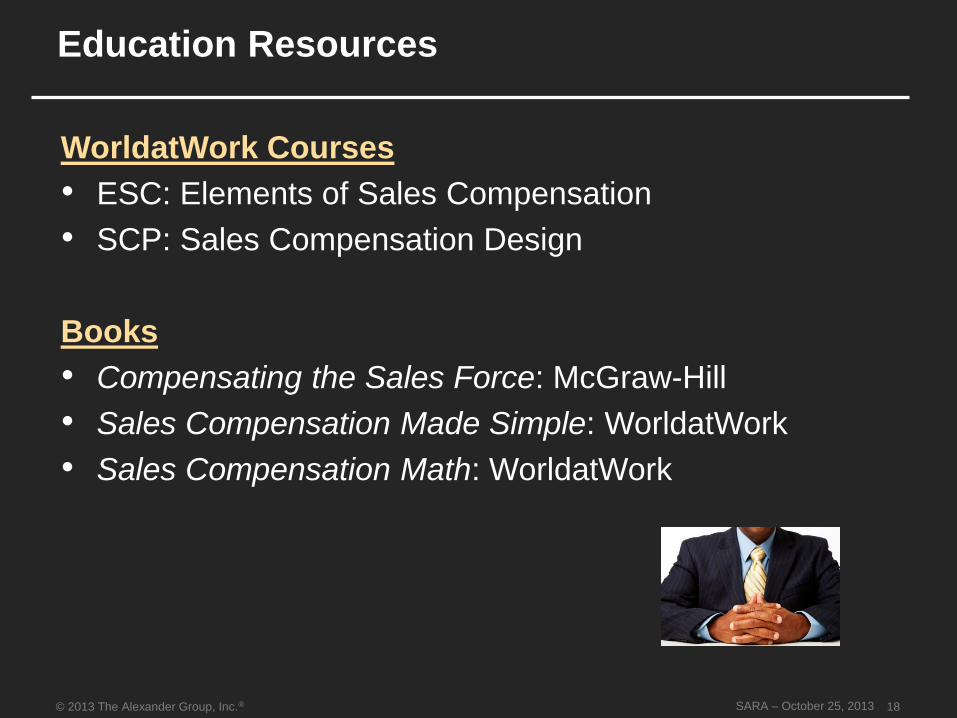
Education Resources
WorldatWork Courses
• ESC: Elements of Sales Compensation
• SCP: Sales Compensation Design
Books
• Compensating the Sales Force: McGraw-Hill
• Sales Compensation Made Simple: WorldatWork
• Sales Compensation Math: WorldatWork
18
© 2013 The Alexander Group, Inc.® SARA – October 25, 2013
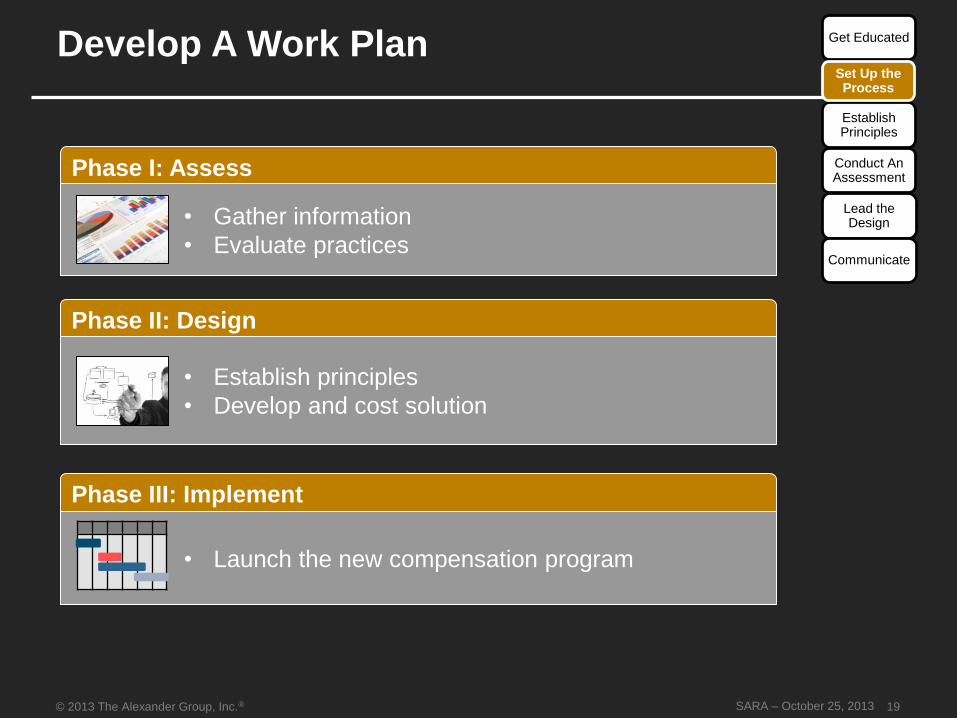
Develop A Work Plan
Phase II: Design
• Establish principles
• Develop and cost solution
• Launch the new compensation program
Phase I: Assess
• Gather information
• Evaluate practices
Phase III: Implement
Get Educated
Conduct An Assessment
Establish Principles
Lead the Design
Communicate
19
Set Up the Process
© 2013 The Alexander Group, Inc.® SARA – October 25, 2013
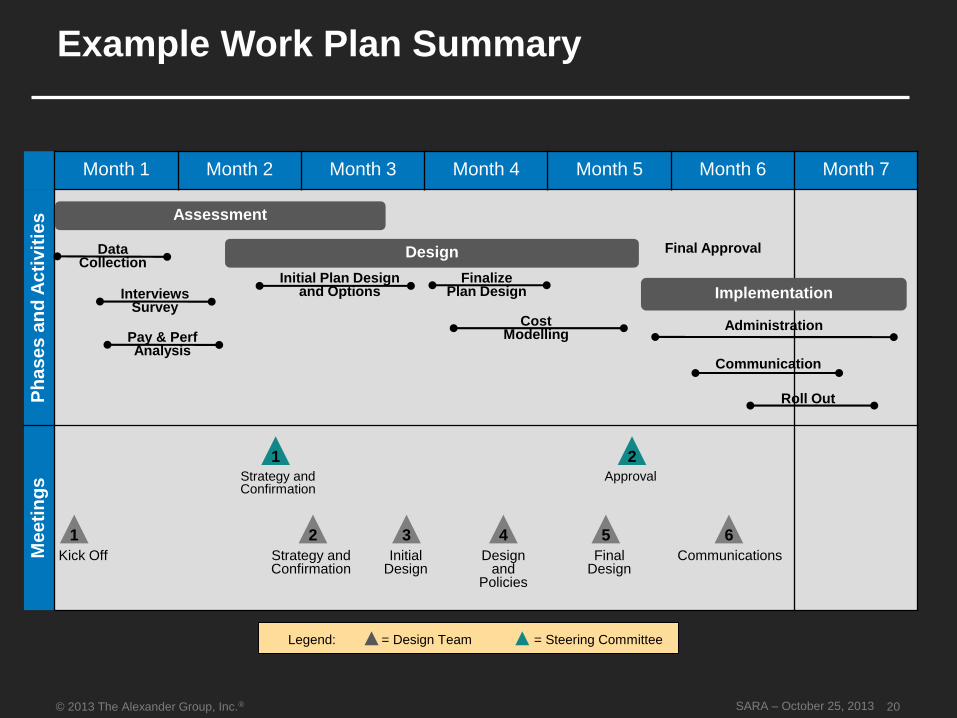
Month 1 Month 2 Month 3 Month 4 Month 5 Month 6 Month 7
Ph
as
es
an
d A
cti
vit
ies
Me
eti
ng
sExample Work Plan Summary
Implementation
Final Approval
= Design Team = Steering CommitteeLegend:
Cost Modelling
Design
Assessment
InterviewsSurvey
Data Collection
Pay & Perf Analysis
Initial Plan Design and Options
Finalize Plan Design
5
Strategy and Confirmation
2 6
2
Final Design
Communications
Approval
Kick Off
1 3
Initial Design
1
Strategy and Confirmation
4
Design and
Policies
Administration
Communication
Roll Out
20
© 2013 The Alexander Group, Inc.® SARA – October 25, 2013
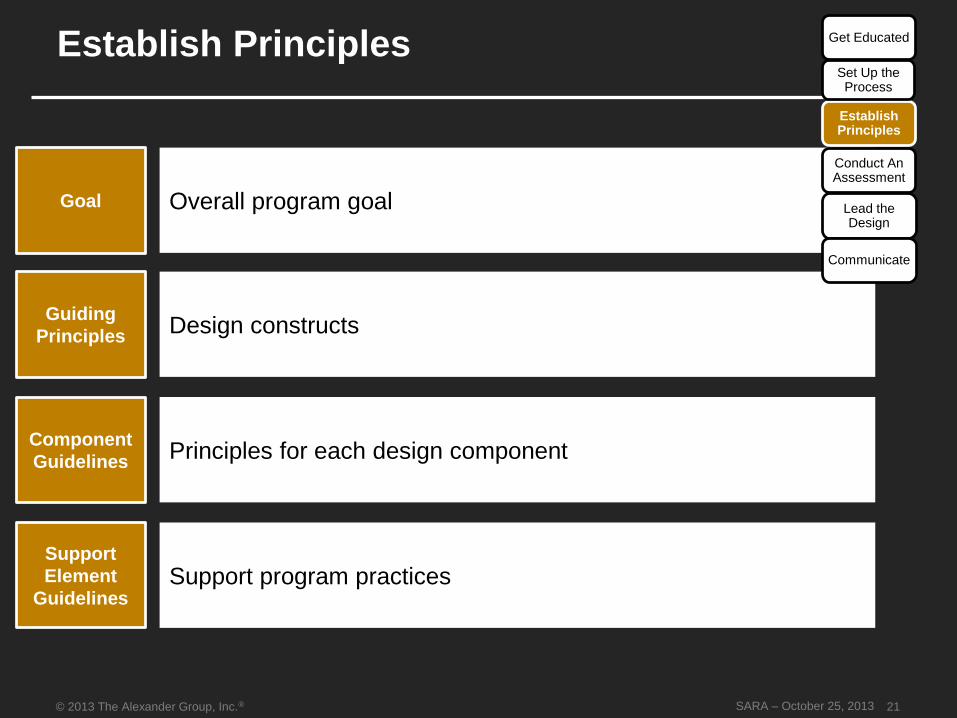
Establish Principles
Component
Guidelines
Support
Element
Guidelines
Guiding
Principles
Goal
Principles for each design component
Support program practices
Design constructs
Overall program goal
Get Educated
Conduct An Assessment
Establish Principles
Lead the Design
Communicate
21
Set Up the Process
© 2013 The Alexander Group, Inc.® SARA – October 25, 2013
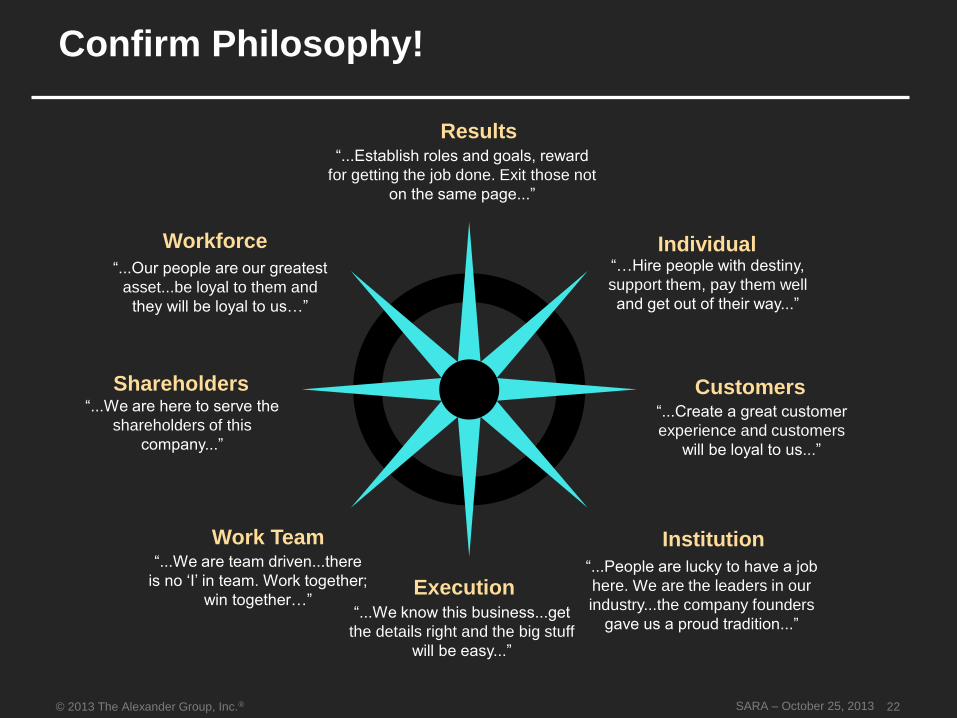
Confirm Philosophy!
Results
CustomersShareholders
Execution
Individual
InstitutionWork Team
Workforce
“...Establish roles and goals, reward
for getting the job done. Exit those not
on the same page...”
“…Hire people with destiny,
support them, pay them well
and get out of their way...”
“...Create a great customer
experience and customers
will be loyal to us...”
“...People are lucky to have a job
here. We are the leaders in our
industry...the company founders
gave us a proud tradition...”“...We know this business...get
the details right and the big stuff
will be easy...”
“...We are team driven...there
is no ‘I’ in team. Work together;
win together…”
“...We are here to serve the
shareholders of this
company...”
“...Our people are our greatest
asset...be loyal to them and
they will be loyal to us…”
22
© 2013 The Alexander Group, Inc.® SARA – October 25, 2013
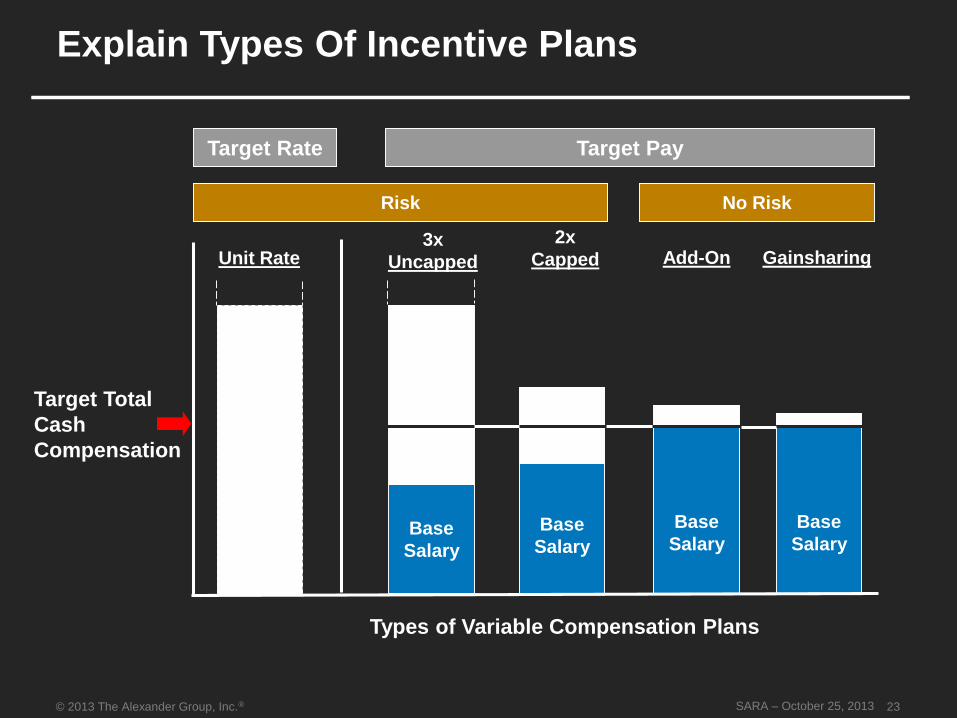
Base
Salary
Base
Salary
Target Total
Cash
Compensation
Base
Salary
GainsharingAdd-On3x
Uncapped
Types of Variable Compensation Plans
Base
Salary
2x
CappedUnit Rate
No RiskRisk
Target PayTarget Rate
Explain Types Of Incentive Plans
23
© 2013 The Alexander Group, Inc.® SARA – October 25, 2013
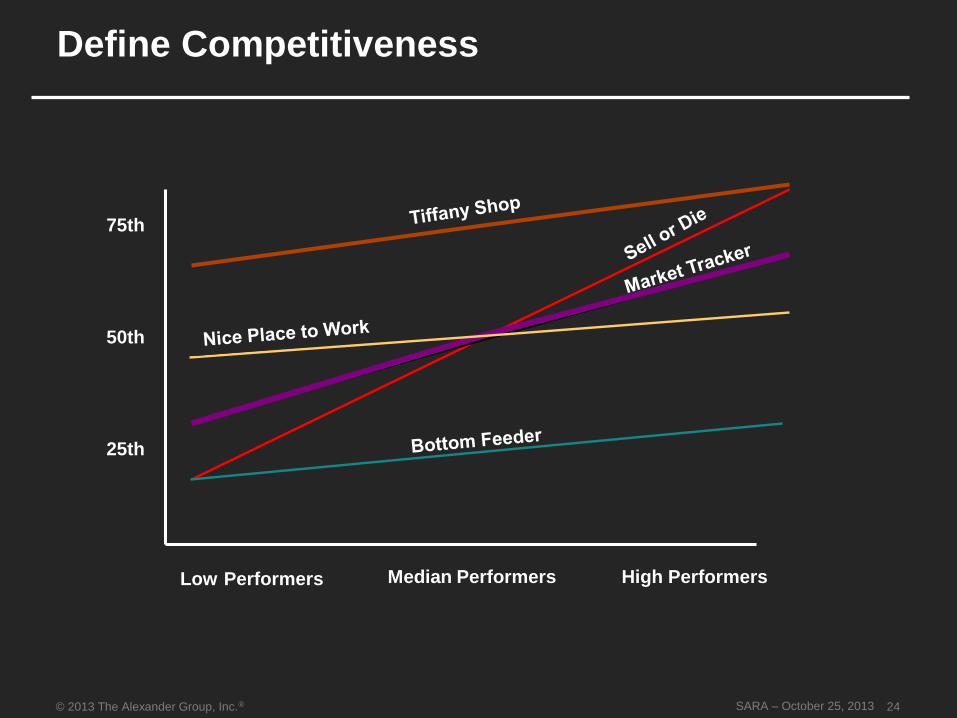
Low Performers Median Performers High Performers
75th
50th
25th
Define Competitiveness
24
© 2013 The Alexander Group, Inc.® SARA – October 25, 2013
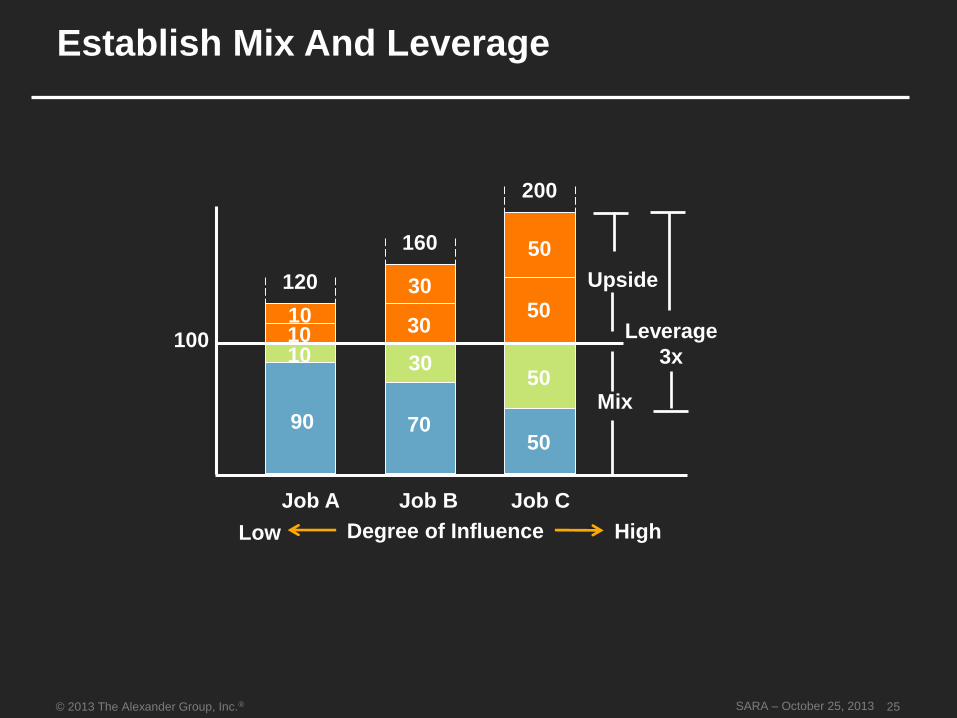
Establish Mix And Leverage
120
10
200
160
30
50
Mix
Upside
90 7050
Degree of Influence
Job A Job B Job C
Low High
1010 30
30
50
50
100 Leverage
3x
25
© 2013 The Alexander Group, Inc.® SARA – October 25, 2013
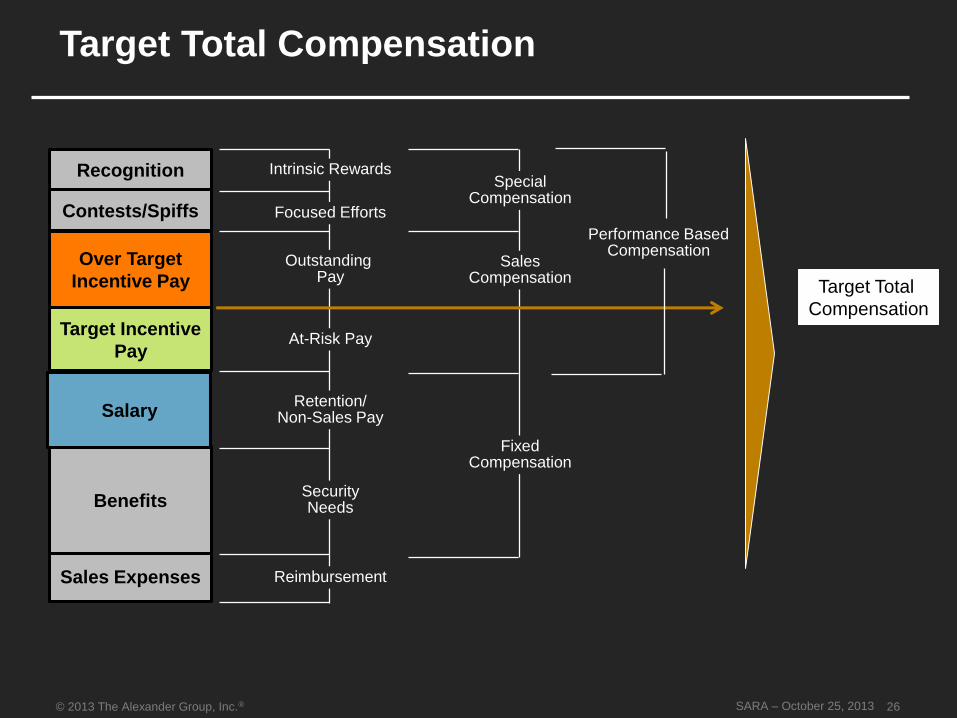
Target Total Compensation
Target Total
Compensation
Benefits
Sales Expenses
Recognition
Contests/Spiffs
Over Target
Incentive Pay
Target Incentive
Pay
Salary
Outstanding Pay
Retention/Non-Sales Pay
SecurityNeeds
Reimbursement
SpecialCompensation
FixedCompensation
Focused Efforts
Intrinsic Rewards
SalesCompensation
At-Risk Pay
Performance BasedCompensation
26
© 2013 The Alexander Group, Inc.® SARA – October 25, 2013
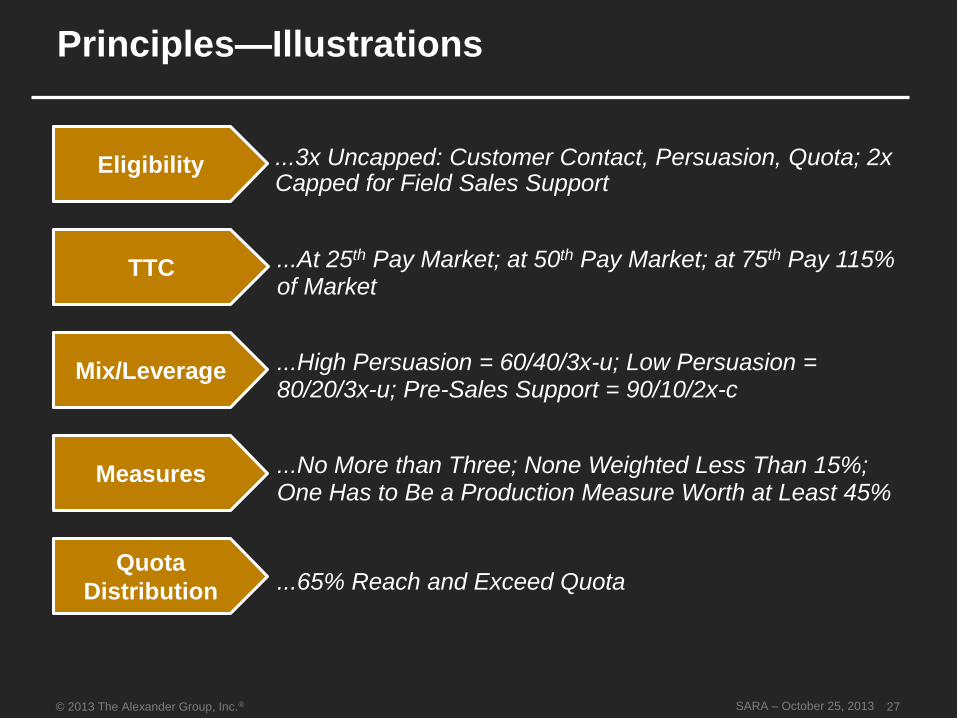
Principles—Illustrations
...3x Uncapped: Customer Contact, Persuasion, Quota; 2x Capped for Field Sales Support
...At 25th Pay Market; at 50th Pay Market; at 75th Pay 115% of Market
...High Persuasion = 60/40/3x-u; Low Persuasion = 80/20/3x-u; Pre-Sales Support = 90/10/2x-c
...No More than Three; None Weighted Less Than 15%; One Has to Be a Production Measure Worth at Least 45%
...65% Reach and Exceed Quota
Eligibility
TTC
Mix/Leverage
Measures
Quota
Distribution
27
© 2013 The Alexander Group, Inc.® SARA – October 25, 2013
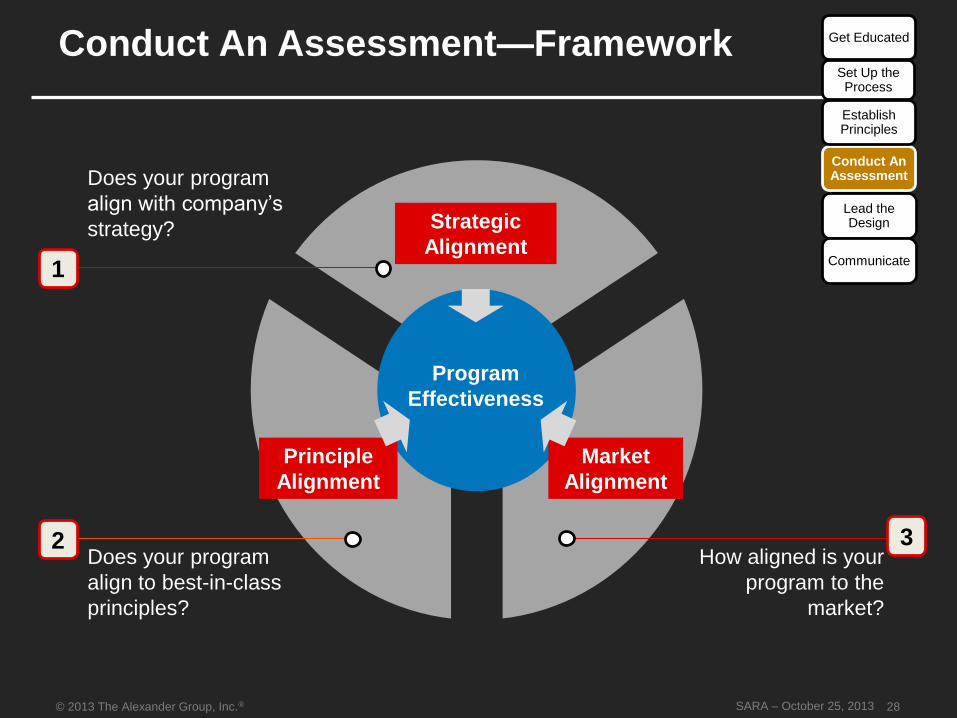
Conduct An Assessment—Framework
Program
Effectiveness
Strategic
Alignment
Market
Alignment
Principle
Alignment
Does your program
align with company’s
strategy?
1
Does your program
align to best-in-class
principles?
2How aligned is your
program to the
market?
3
Get Educated
Conduct An Assessment
Establish Principles
Lead the Design
Communicate
28
Set Up the Process
© 2013 The Alexander Group, Inc.® SARA – October 25, 2013
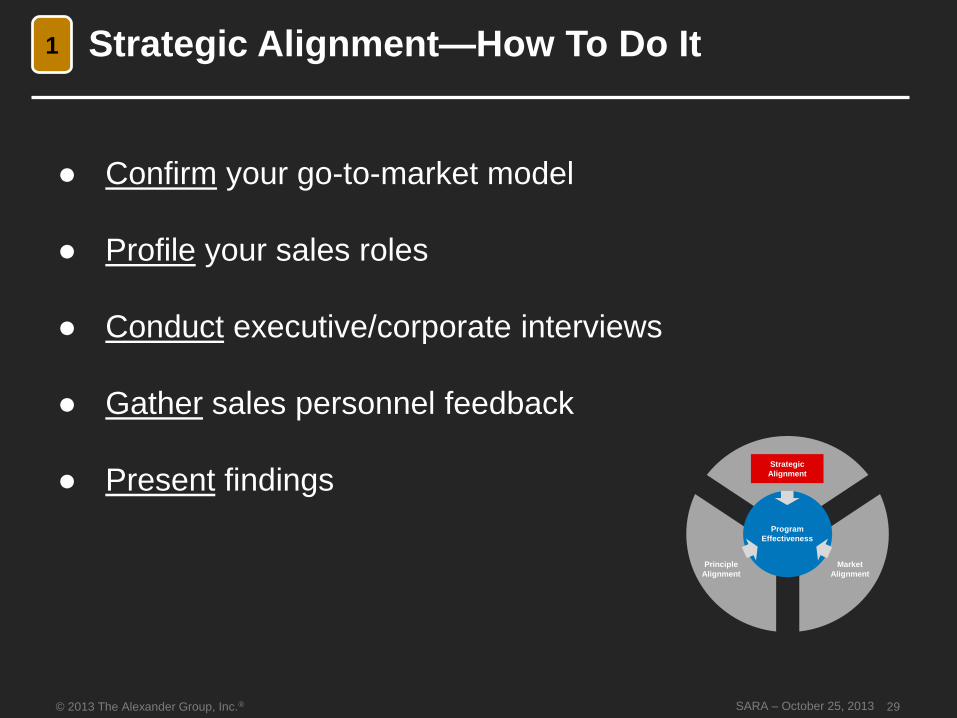
Strategic Alignment—How To Do It
● Confirm your go-to-market model
● Profile your sales roles
● Conduct executive/corporate interviews
● Gather sales personnel feedback
● Present findings
1
Program
Effectiveness
Strategic
Alignment
Market
Alignment
Principle
Alignment
29
© 2013 The Alexander Group, Inc.® SARA – October 25, 2013
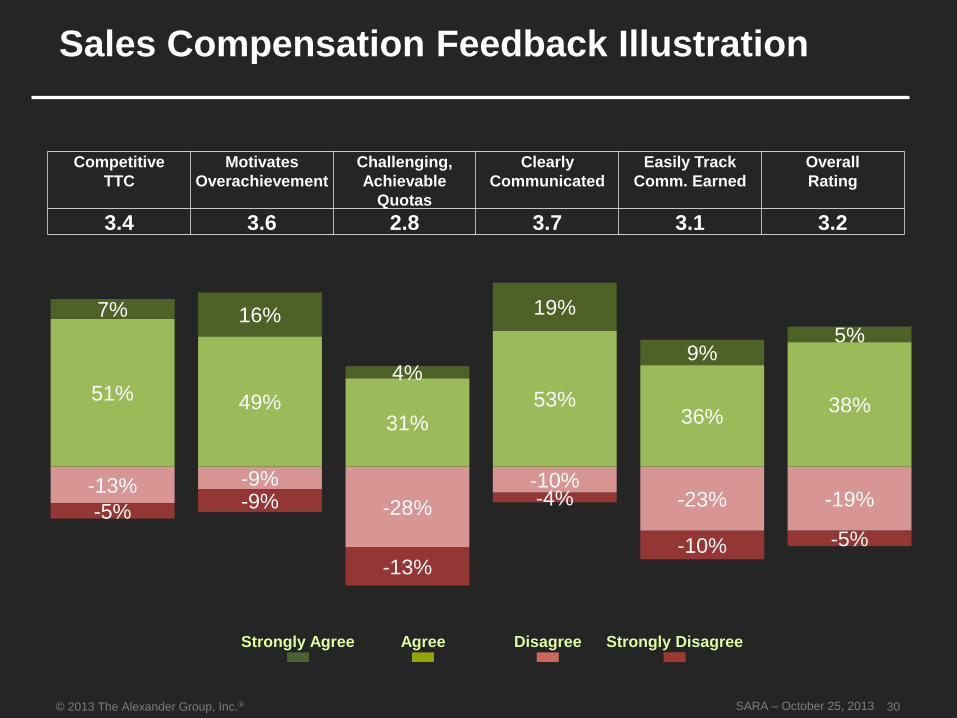
Sales Compensation Feedback Illustration
Competitive
TTC
Motivates
Overachievement
Challenging,
Achievable
Quotas
Clearly
Communicated
Easily Track
Comm. Earned
Overall
Rating
3.4 3.6 2.8 3.7 3.1 3.2
Strongly Agree Agree Disagree Strongly Disagree
-13% -9%
-28%
-10%-23% -19%
-5%-9%
-13%
-4%
-10% -5%
51% 49%31%
53%36%
38%
7% 16%
4%
19%
9%5%
30
© 2013 The Alexander Group, Inc.® SARA – October 25, 2013
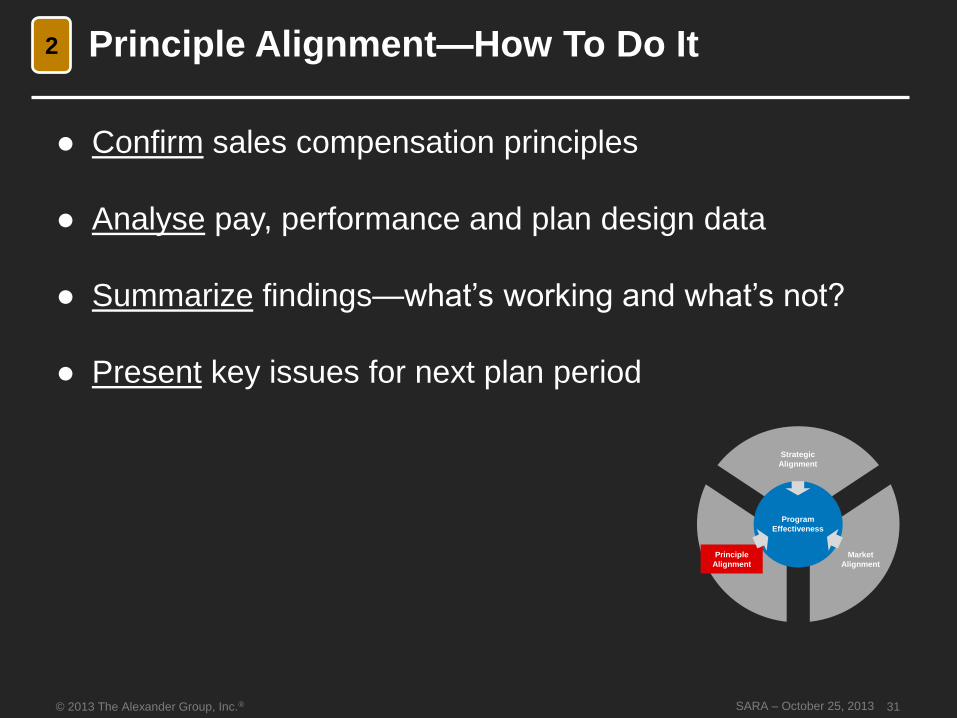
Principle Alignment—How To Do It
● Confirm sales compensation principles
● Analyse pay, performance and plan design data
● Summarize findings—what’s working and what’s not?
● Present key issues for next plan period
2
Program
Effectiveness
Strategic
Alignment
Market
Alignment
Principle
Alignment
31
© 2013 The Alexander Group, Inc.® SARA – October 25, 2013
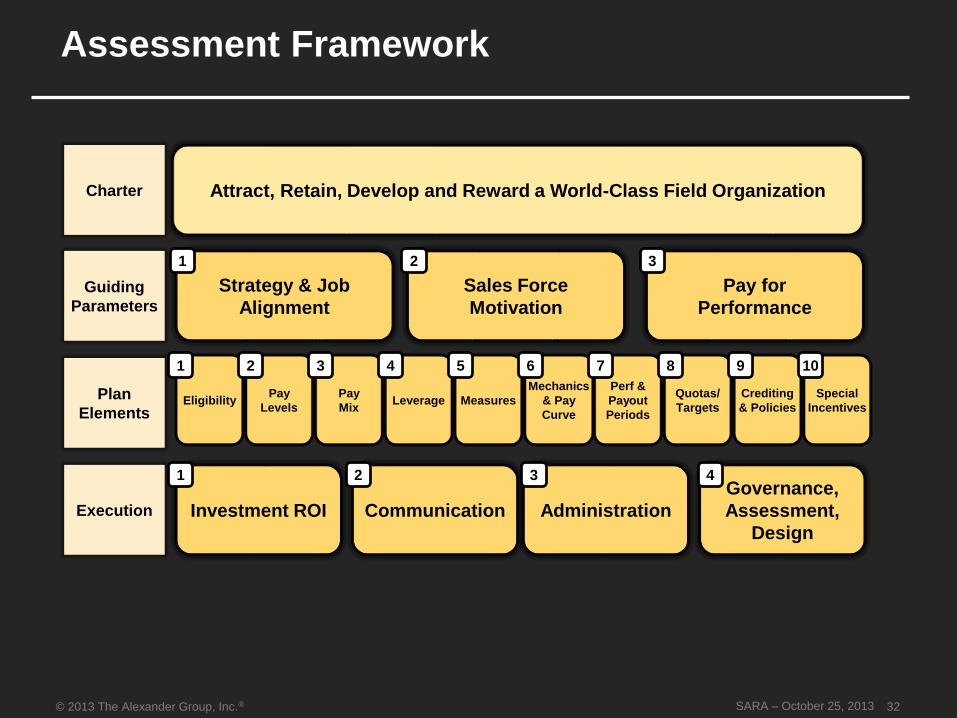
Assessment Framework
Investment ROI Communication Administration
Governance,
Assessment,
Design
Attract, Retain, Develop and Reward a World-Class Field Organization
EligibilityPay
Levels
Pay
MixLeverage Measures
Mechanics
& Pay
Curve
Perf &
Payout
Periods
Strategy & Job
Alignment
Sales Force
Motivation
Pay for
Performance
Plan
Elements
Execution
Guiding
Parameters
Charter
1 2 3
1 2 3 4
Quotas/
Targets
Special
Incentives
Crediting
& Policies
1 2 3 4 5 6 7 8 9 10
32
© 2013 The Alexander Group, Inc.® SARA – October 25, 2013
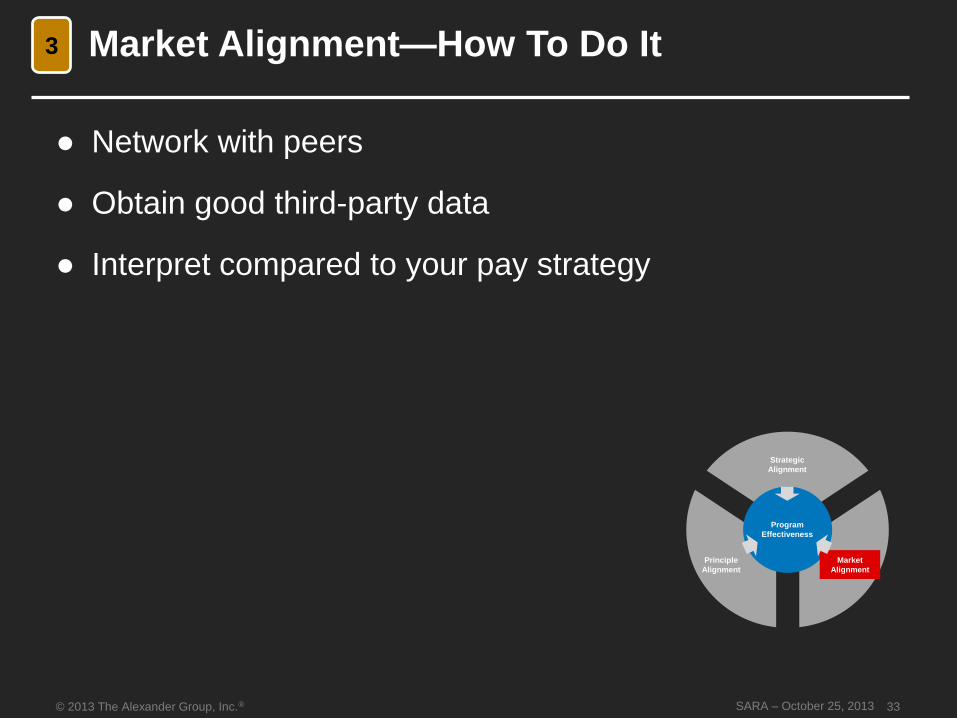
Market Alignment—How To Do It
● Network with peers
● Obtain good third-party data
● Interpret compared to your pay strategy
3
Program
Effectiveness
Strategic
Alignment
Market
Alignment
Principle
Alignment
33
© 2013 The Alexander Group, Inc.® SARA – October 25, 2013
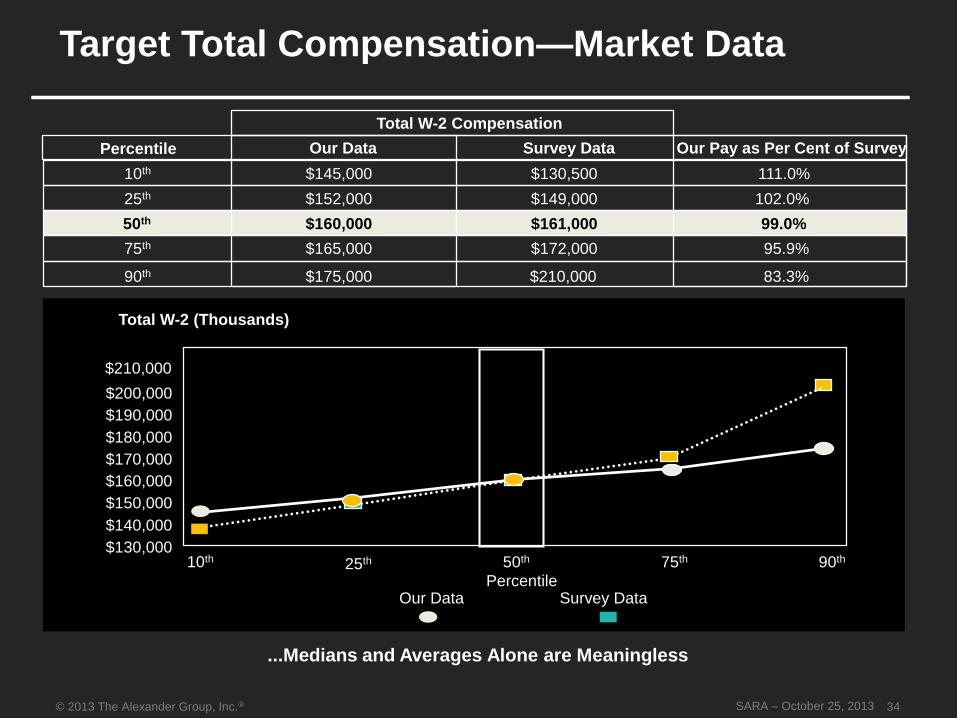
Target Total Compensation—Market Data
...Medians and Averages Alone are Meaningless
Total W-2 Compensation
Percentile Our Data Survey Data Our Pay as Per Cent of Survey
10th $145,000 $130,500 111.0%
25th $152,000 $149,000 102.0%
50th $160,000 $161,000 99.0%
75th $165,000 $172,000 95.9%
90th $175,000 $210,000 83.3%
10th 25th 50th 75th 90th$130,000
$140,000
$150,000
$160,000
$170,000
$180,000
$190,000
$200,000
Percentile
Total W-2 (Thousands)
Our Data Survey Data
$210,000
34
© 2013 The Alexander Group, Inc.® SARA – October 25, 2013
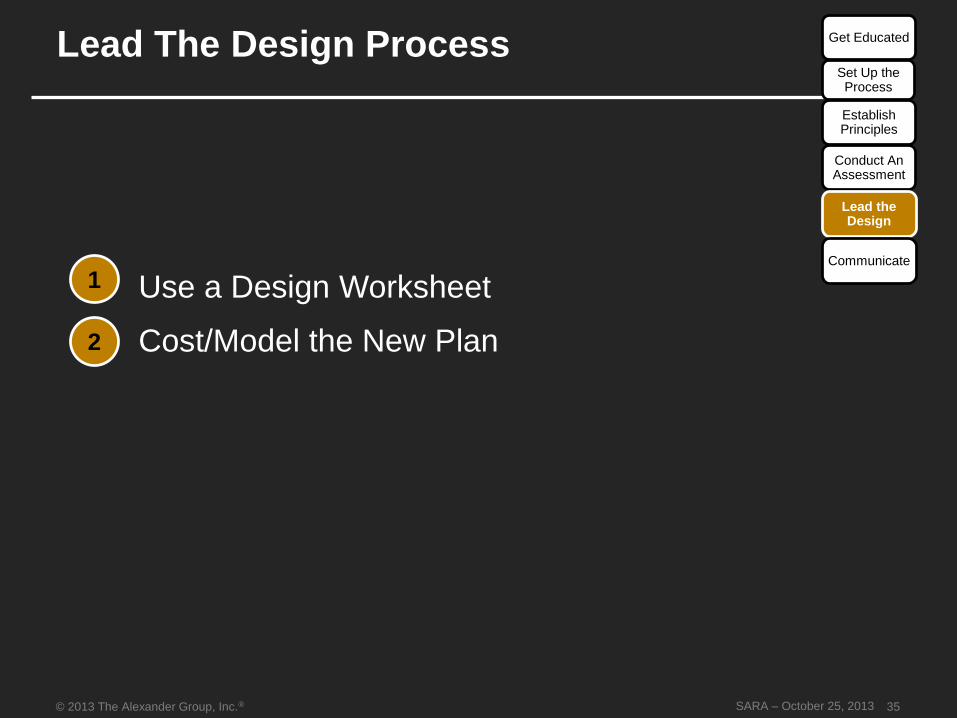
Lead The Design Process
Use a Design Worksheet
Cost/Model the New Plan
Get Educated
Conduct An Assessment
Establish Principles
Lead the Design
1
2
Communicate
35
Set Up the Process

© 2013 The Alexander Group, Inc.® SARA – October 25, 2013
Use A Design Worksheet
Role
EligibilityTarget Total Comp
Pay Mix and
Leverage
Performance Measures
Weights MechanicsPerformance
PeriodPayout
Frequency
Sales Rep
National Account Manager
Vertical Marketing Rep
Channel Sales Manager
Sales Associate
1
36
© 2013 The Alexander Group, Inc.® SARA – October 25, 2013
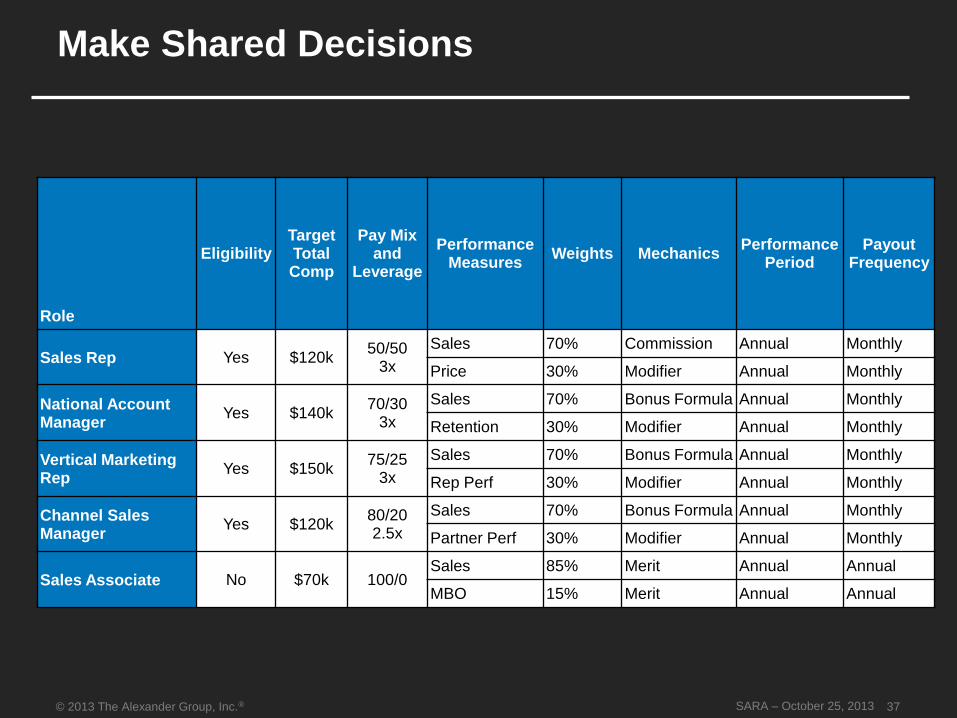
Make Shared Decisions
Role
EligibilityTarget Total Comp
Pay Mix and
Leverage
Performance Measures
Weights MechanicsPerformance
PeriodPayout
Frequency
Sales Rep Yes $120k50/50
3x
Sales 70% Commission Annual Monthly
Price 30% Modifier Annual Monthly
National Account Manager
Yes $140k70/30
3x
Sales 70% Bonus Formula Annual Monthly
Retention 30% Modifier Annual Monthly
Vertical Marketing Rep
Yes $150k75/25
3x
Sales 70% Bonus Formula Annual Monthly
Rep Perf 30% Modifier Annual Monthly
Channel Sales Manager
Yes $120k80/202.5x
Sales 70% Bonus Formula Annual Monthly
Partner Perf 30% Modifier Annual Monthly
Sales Associate No $70k 100/0Sales 85% Merit Annual Annual
MBO 15% Merit Annual Annual
37
© 2013 The Alexander Group, Inc.® SARA – October 25, 2013
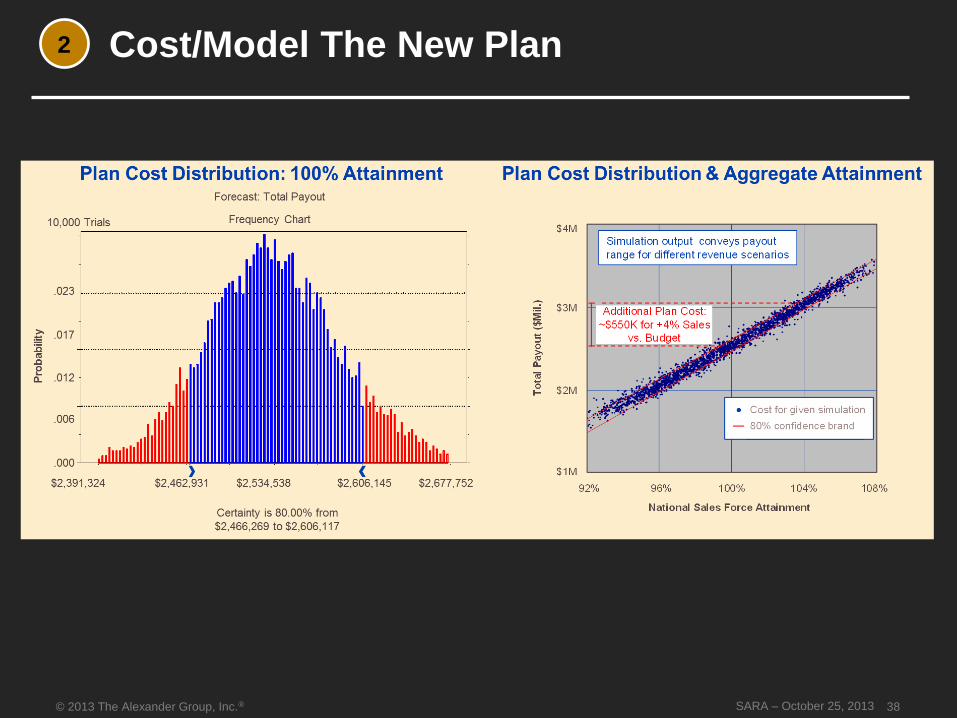
Cost/Model The New Plan2
38
© 2013 The Alexander Group, Inc.® SARA – October 25, 2013
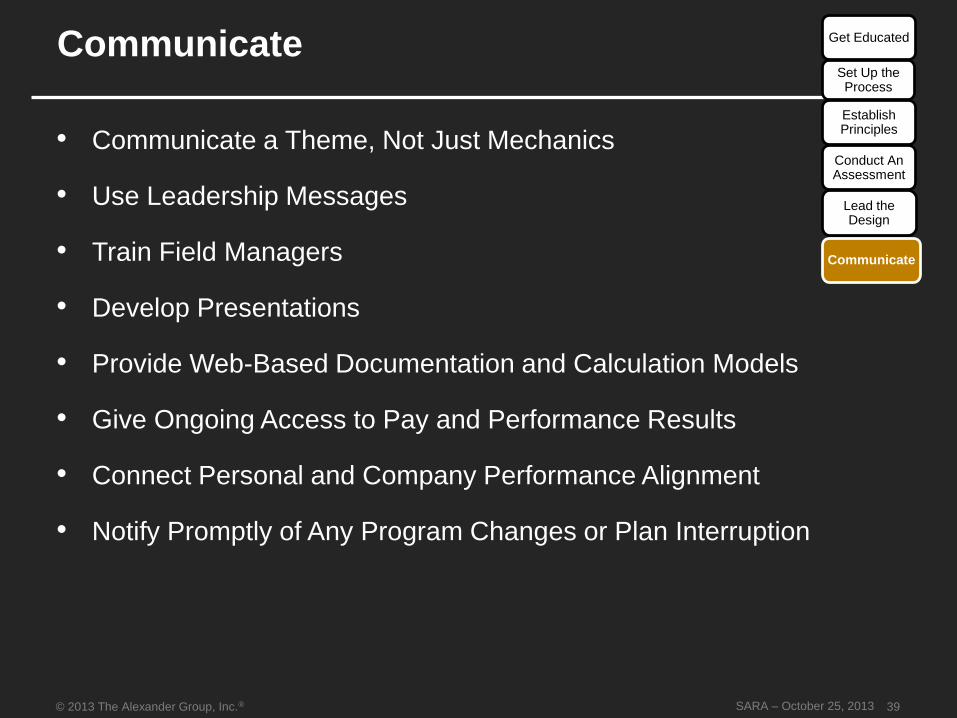
• Communicate a Theme, Not Just Mechanics
• Use Leadership Messages
• Train Field Managers
• Develop Presentations
• Provide Web-Based Documentation and Calculation Models
• Give Ongoing Access to Pay and Performance Results
• Connect Personal and Company Performance Alignment
• Notify Promptly of Any Program Changes or Plan Interruption
Communicate Get Educated
Conduct An Assessment
Establish Principles
Lead the Design
Communicate
39
Set Up the Process
© 2013 The Alexander Group, Inc.® SARA – October 25, 2013
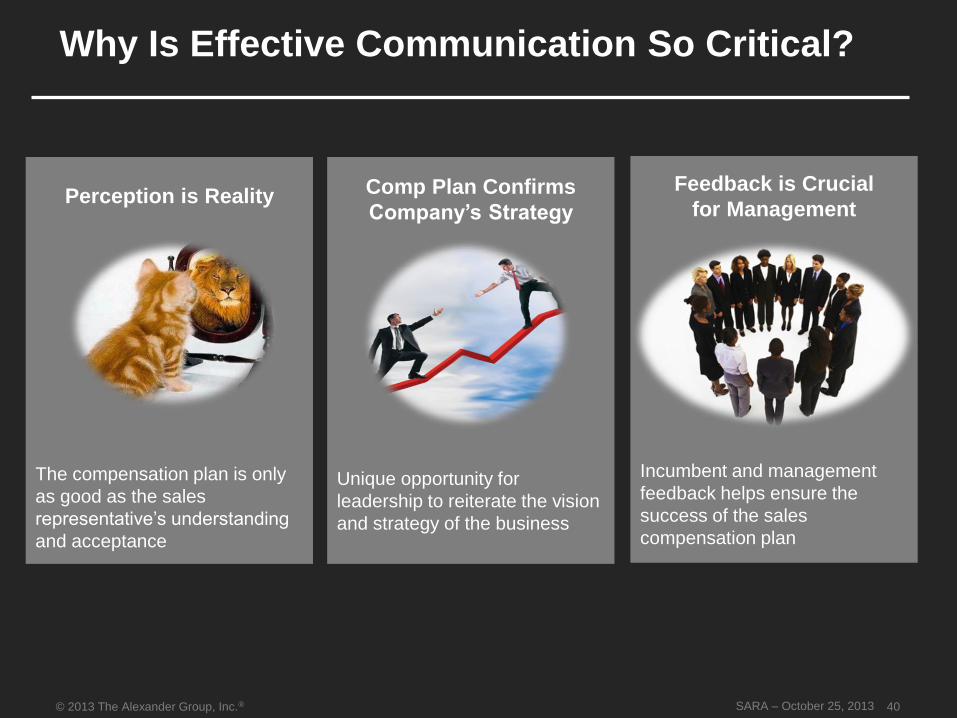
Why Is Effective Communication So Critical?
Perception is Reality
The compensation plan is only
as good as the sales
representative’s understanding
and acceptance
Comp Plan Confirms
Company’s Strategy
Unique opportunity for
leadership to reiterate the vision
and strategy of the business
Feedback is Crucial
for Management
Incumbent and management
feedback helps ensure the
success of the sales
compensation plan
40
© 2013 The Alexander Group, Inc.® SARA – October 25, 2013
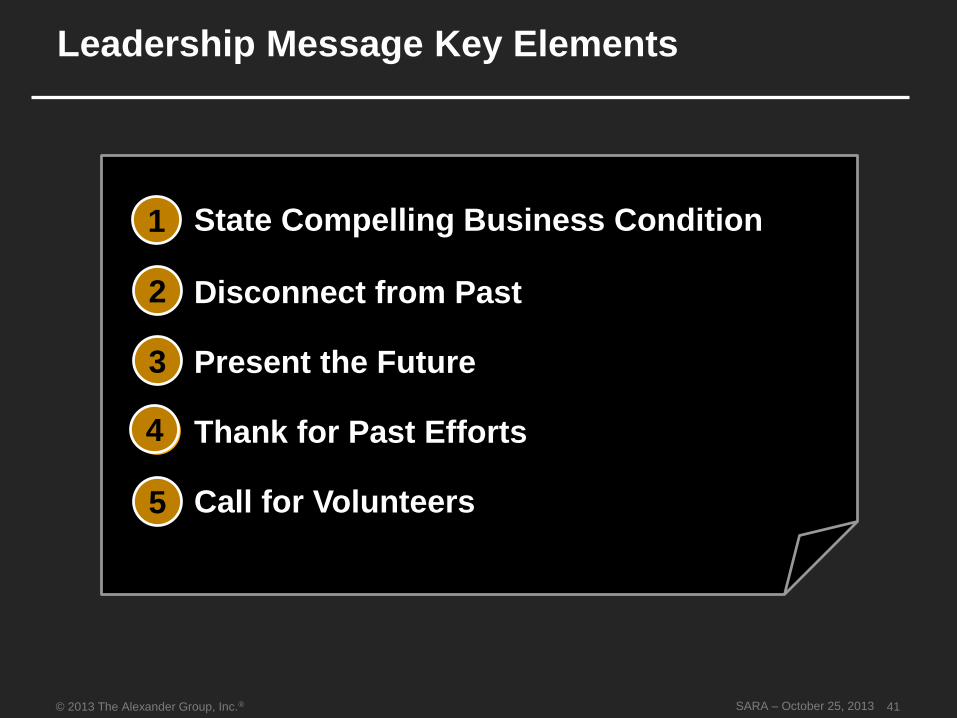
Leadership Message Key Elements
State Compelling Business Condition
Disconnect from Past
Present the Future
Thank for Past Efforts
Call for Volunteers
41
1
2
3
4
5
© 2013 The Alexander Group, Inc.® SARA – October 25, 2013
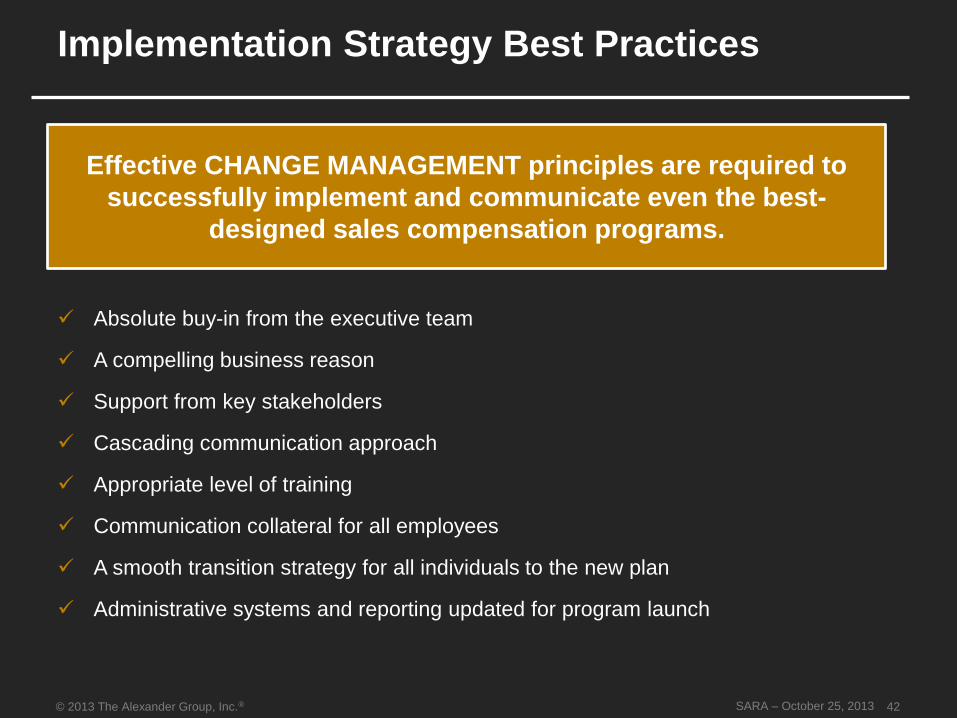
Absolute buy-in from the executive team
A compelling business reason
Support from key stakeholders
Cascading communication approach
Appropriate level of training
Communication collateral for all employees
A smooth transition strategy for all individuals to the new plan
Administrative systems and reporting updated for program launch
Implementation Strategy Best Practices
Effective CHANGE MANAGEMENT principles are required to
successfully implement and communicate even the best-
designed sales compensation programs.
42

© 2013 The Alexander Group, Inc.® SARA – October 25, 2013
Closing Remarks
Don’t miss your opportunity to leverage one of the most
powerful management tools the sales organization has
to drive results!
43

© 2013 The Alexander Group, Inc.® SARA – October 25, 2013
Sales Compensation Plans Produce
Results If You Invest the Time to
Design Them Correctly.
44
© 2013 The Alexander Group, Inc.® SARA – October 25, 2013 45
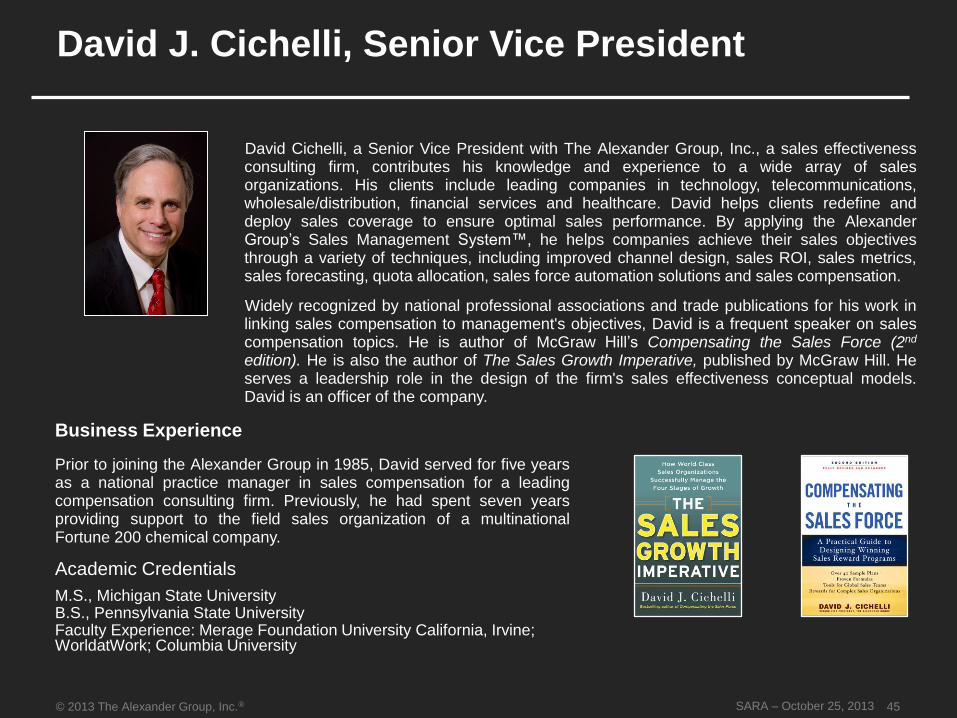
David J. Cichelli, Senior Vice President
Business Experience
Prior to joining the Alexander Group in 1985, David served for five yearsas a national practice manager in sales compensation for a leadingcompensation consulting firm. Previously, he had spent seven yearsproviding support to the field sales organization of a multinationalFortune 200 chemical company.
Academic Credentials
M.S., Michigan State UniversityB.S., Pennsylvania State UniversityFaculty Experience: Merage Foundation University California, Irvine; WorldatWork; Columbia University
David Cichelli, a Senior Vice President with The Alexander Group, Inc., a sales effectivenessconsulting firm, contributes his knowledge and experience to a wide array of salesorganizations. His clients include leading companies in technology, telecommunications,wholesale/distribution, financial services and healthcare. David helps clients redefine anddeploy sales coverage to ensure optimal sales performance. By applying the AlexanderGroup’s Sales Management System™, he helps companies achieve their sales objectivesthrough a variety of techniques, including improved channel design, sales ROI, sales metrics,sales forecasting, quota allocation, sales force automation solutions and sales compensation.
Widely recognized by national professional associations and trade publications for his work inlinking sales compensation to management's objectives, David is a frequent speaker on salescompensation topics. He is author of McGraw Hill’s Compensating the Sales Force (2nd
edition). He is also the author of The Sales Growth Imperative, published by McGraw Hill. Heserves a leadership role in the design of the firm's sales effectiveness conceptual models.David is an officer of the company.
© 2013 The Alexander Group, Inc.® SARA – October 25, 2013