Embed Size (px)
Citation preview

YOUTH IN INDIA:
CHALLENGES OF EMPLOYMENT AND EMPLOYABILITY
Rajendar P. Mamgain
Shivakar Tiwari
March 2015
Giri Institute of Development Studies
YOUTH IN INDIA:
CHALLENGES OF EMPLOYMENT AND EMPLOYABILITY
Rajendra P. Mamgain and Shivakar Tiwari1
Using the NSSO Employment and Unemployment Survey Rounds as the basis, this paper
examines questions of unemployment, employment and human capital formation among Indian
youth belonging to various social and religious groups across different regions since the advent
of the economic reforms in the early 1990s.The paper shows how an increasing proportion of the
youth population is facing situations of high open unemployment during a period of high
economic growth. The predominance of the poor quality of employment available to youths is
also a major issue of concern, especially for youths belonging to the Scheduled Castes (SCs),
Scheduled Tribes (STs) and Muslim communities. Using the Logit Model, the paper shows how
education, gender, social belonging and location play significant roles in determining the
participation of youths in both the labour force and education. It also brings out disparities in
the employment and human development outcomes of youths belonging to various socio-
religious groups in a comparative framework. The paper argues for strengthening measures to
create decent employment on a large scale and for improving the education and skill levels of
youths with a greater focus on those belonging to the marginalised groups of Indian society.
I. THE ISSUE
Accounting for a population of over333.4 million in 2011, the youth2 represent 27.5 per
cent of the Indian population (Population Census, 2011). India is among the few countries
having the advantage of being home to a relatively higher proportion of younger population.
Across the world, every fifth youth is an Indian. This demographic dividend of arising share of
the working age population (15-59 years),which came into effect in the early 1980sis likely to
remain till 2025 (ILO, 2013; Aiyar and Mody, 2011). About 2 per cent of the economic growth
in India has been attributed to this demographic transition (Aiyar and Mody, 2011). Such a huge
1The authors work with Giri Institute of Development Studies, Lucknow, as Professor and Senior Research Associate,
respectively. An earlier version of this paper was presented at the 57th Annual Conference of the Indian Society of Labour
Economics (ISLE) during 17-19 December 2014 at Birla Institute of Technology (BIT), Ranchi andat the Second International
Conference and Doctoral Colloquium on “Transformative Social Science Research: Disciplines, Collaborations and Think
Tanks”, Institute of Public Enterprise, Hyderabad, 3-4 March 2015.The authors express their thanks to the Conference
participants for their useful comments. However, the usual disclaimers apply.
2 The agebracket of youth is categorised differently by different agencies. For instance, ILO and other UN agencies categorise the
population aged 15-24 years as youth. According to these criteria, about 19.2 per cent of the Indian population can be classified
as youth. We consider the population aged 15-29 years as youth for our analysis in the present paper since a sizeable number of
youth up to the age of 24 years are pursuing higher education at various educational institutions. Many programmes of the
Government of India aimed at youth also cover the agegroup of 15-29 years.

2
proportion of a relatively young population in India is expected to add to both its economic
growth and the consequent demand for goods and services. This phenomenon of the
demographic dividendhas beenwidely discussed in development literature in recent years
(Bloom and Canning, 2004; Aiyar and Mody, 2011;Parasuraman,et al., 2009).However, it is
also argued that this „demographic dividend‟ can turn into a „demographic nightmare‟ if
opportunities are not created for the all-round development of the youth, including decent
employment (Chandrasekhar,et al., 2006; Papola and Sahu, 2012). The advent of the
information technology (IT) revolution has also made the youth increasingly interconnected and
aware of developments of their interest. Further, the use of social media has facilitated an
unprecedented mobilisation of the youth,which, in turn, has enabled them to show their
concerns (World Bank, 2013a). Examples of this mobilisation of the youth include is the
uprising in the Middle East, called the „Arab Spring‟, and the voices criticising corruption and
demanding clean governance in India, which highlight the potential of youth power to bring
about a change in the existing systems.
The major issues that confront the youth include the high incidence of unemployment as
well as under-employment, limited opportunities for remunerative jobs, low levels of education
and skills, and the quest for identity and dignity (ILO, 2013; FES, 2012, Mitra and Verick,
2013). All this applies to India as well. The youth suffer disproportionately more than others
from slow growth in employment opportunities and an economic slowdown (ILO, 2013).
Moreover, the growth process in India has also resulted in rising inequality in incomes and
human capital formations, which, in turn, has caused significant disparities across various social
groups and regions (Planning Commission, 2013). The marginalised sections of the population,
such as Scheduled Tribes (STs)and Scheduled Castes (SCs) still remain at the bottom of the
social hierarchy in terms of various socio-economic indicators of development (Mamgain,
2013). Much of their slow development is increasingly being attributed to social exclusion and
discrimination which they continue to face in their daily lives in various forms (World Bank,
2013b; Thorat and Newman, 2010).
Growing mismatches in the demand and supply of education and skills is yet another
dimension that affects the overall employability of youth in India and several other countries as
well (ILO, 2010;Chadha, 2000; Mamgain, 2010). While on one hand employers
complainagainst shortages of skilled manpower that pose hurdles in their expansion (India

3
Skills Report, 2014; ILO, 2013),on the other hand, there is a very rate of unemployment among
educated youth, particularly women (Dev and Venkatanarayana, 2011). Employers find a large
number of job-seekers unemployable due to insufficient exposure of the latter to practical
aspects of education. The present skill development structure also lacks inter-connections
between education, skills and on-the-job practical experience. Thus, the situation of over-supply
of educated labour force that has acquired only general education and limited vocational
training is juxtaposed against acute shortages of trained labour force in several industries
(FICCI, 2010; India Skills Report, 2014). The increasing inequality in the entire process of
human capital formation, beginning with school education itself, poses a major challenge in
terms of the poor quality of education for a large segment of children (Planning Commission,
2011; ASER, 2013),which eventually determines their employability (IRIS Knowledge
Foundation, 2013). A large number of students discontinue their education due to their poor
economic conditions and uncertainty about the future prospects of employment. The mobility of
youth, particularly women, is still low due to the interplay of various social and economic
factors, resulting in their overall low participation in the labour market (Mitra and Verick,
2013). The persistence ofdiscriminatory practices based on caste, ethnicity and religion in the
process of human capital formation and employment generation also adversely affect SCs, STs
and Muslims (Thorat and Newman, 2010; Papola and Mamgain, 2012).
It has also been observed that various Government policies and programmes such as the
National Youth Policy have hardly been able to make any major contribution towards improving
job opportunities for youth in India in the recent past. This has, in turn, resulted in a growing
stock of unemployed youths. There are also evidences of association between persistent poor
economic performance, including youth unemployment and conflict (Cramer, 2010; Planning
Commission, 2008). Research undertaken by the Institute of Criminology at Cambridge
University on the subject over nearly 50 years, established long ago that young people are more
likely to commit crime when they are out of work. These crimes may often be petty initially but
can turn into something more serious subsequently. Hence, if left untreated, the issue of youth
unemployment can destabilise fragile economies, become a breeding ground for extremism, and
cause a generation to be permanently scarred. If youth power is channelised successfully in
nation-building, this may, in fact, increase the pace of our development process at a faster pace
(Cramer, 2010).
4
In this light of this brief background, we examine the questions of unemployment,
employment and human capital formation of Indian youth belonging to various social and
religious groups across different regions since the advent of economic reforms in the early
1990s. The second section of the paper examines the pattern of participation of youths, both
employed and unemployed, in the labour force. The third section of the paper analyses the nature
and pattern of employment among youth. It focuses on the quality of employment of youth and
assesses whether educational levels do matter in improving the quality of their employment. The
fourth section analyses the situation of unemployment among the youth. Section five examines
the human capital base of the youth population and its quality, and shows how a large section of
the youth is still characterised by low levels of educational attainment and skill training. The
determinants of youth employment are discussed at length in Section six, while the policy
implications are discussed in the concluding section, with a focus on future policy interventions.
The paper is based on large sample unit level data of the „Employment and
Unemployment Surveys‟conducted by the National Sample Survey Organisation (NSSO) for the
years 1993-94, 2004-05 and 2011-12, which highlight the post-economic reform scenario with
regard to youth employment in India. The data have been taken for usual activity status of
persons. The analyses in the paper have been presented across the following five socio-religious
groups: (i) Scheduled Tribes (STs), (ii) Scheduled Castes (SCs), (iii) Other Backward Caste-
Muslims (OBC-M), (iv) Other Backward Caste-Hindus, (v) Other Caste-Muslims (OC-M), and
(vi) Others (OCs). This analysis facilitates a comparison of the situations pertaining to youths
belonging to various socio-religious groups and the inter-group disparities among them.
II. PARTICIPATION OF YOUTH IN THE LABOUR MARKET
The ideal situation would be when almost all persons up to the age of 24 years are able to
complete their tertiary level of education, which would imply their reduced participation in the
labour force as most of them would be studying. The reality, however, is that a large percentage
of the youth in the country today are either working or seeking work, which makes them a part of
the labour force. In 2011-12, about 146.8 million youths, representing over 44.4 per cent of the
youth population, were in the labour force, while 91.4million youth were unemployed.
An assessment of the labour force participation rates (LFPRs) of youth belonging to
various age groups reveals that youth in the 15-19 year age group account for the lowest LFPR.
Less than one-fourth of the youth population in this category is either working or looking for
5
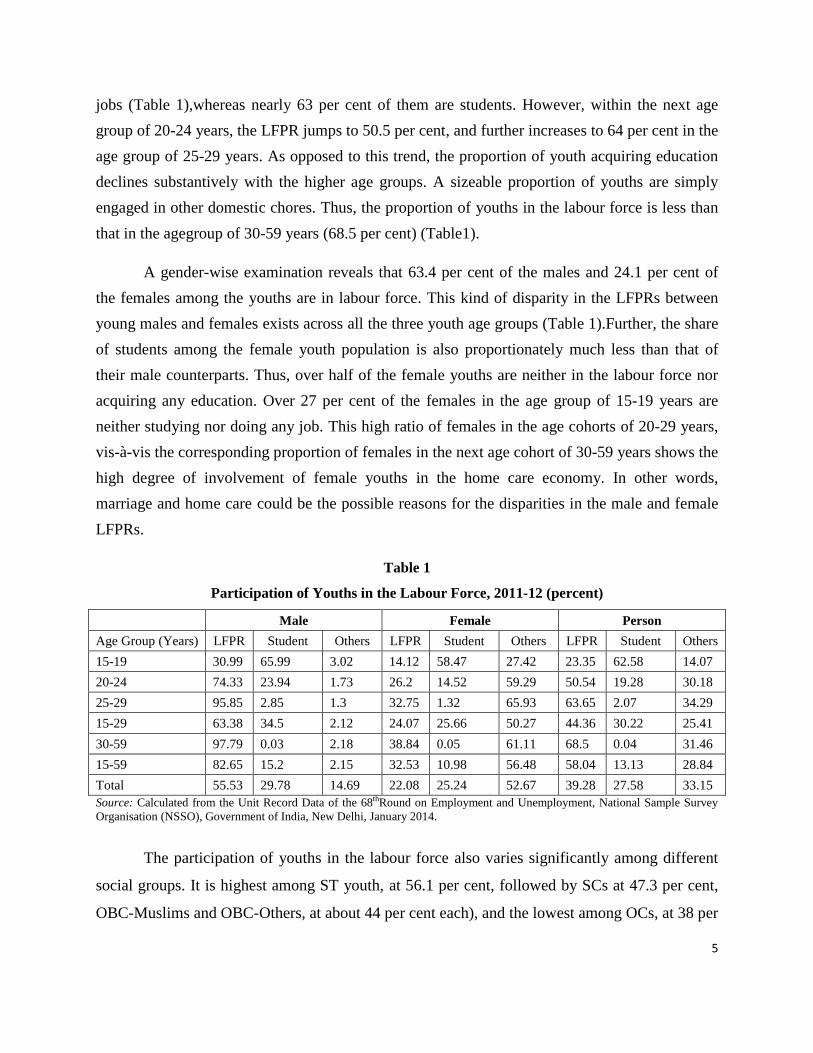
jobs (Table 1),whereas nearly 63 per cent of them are students. However, within the next age
group of 20-24 years, the LFPR jumps to 50.5 per cent, and further increases to 64 per cent in the
age group of 25-29 years. As opposed to this trend, the proportion of youth acquiring education
declines substantively with the higher age groups. A sizeable proportion of youths are simply
engaged in other domestic chores. Thus, the proportion of youths in the labour force is less than
that in the agegroup of 30-59 years (68.5 per cent) (Table1).
A gender-wise examination reveals that 63.4 per cent of the males and 24.1 per cent of
the females among the youths are in labour force. This kind of disparity in the LFPRs between
young males and females exists across all the three youth age groups (Table 1).Further, the share
of students among the female youth population is also proportionately much less than that of
their male counterparts. Thus, over half of the female youths are neither in the labour force nor
acquiring any education. Over 27 per cent of the females in the age group of 15-19 years are
neither studying nor doing any job. This high ratio of females in the age cohorts of 20-29 years,
vis-à-vis the corresponding proportion of females in the next age cohort of 30-59 years shows the
high degree of involvement of female youths in the home care economy. In other words,
marriage and home care could be the possible reasons for the disparities in the male and female
LFPRs.
Table 1
Participation of Youths in the Labour Force, 2011-12 (percent)
Male Female Person
Age Group (Years) LFPR Student Others LFPR Student Others LFPR Student Others
15-19 30.99 65.99 3.02 14.12 58.47 27.42 23.35 62.58 14.07
20-24 74.33 23.94 1.73 26.2 14.52 59.29 50.54 19.28 30.18
25-29 95.85 2.85 1.3 32.75 1.32 65.93 63.65 2.07 34.29
15-29 63.38 34.5 2.12 24.07 25.66 50.27 44.36 30.22 25.41
30-59 97.79 0.03 2.18 38.84 0.05 61.11 68.5 0.04 31.46
15-59 82.65 15.2 2.15 32.53 10.98 56.48 58.04 13.13 28.84
Total 55.53 29.78 14.69 22.08 25.24 52.67 39.28 27.58 33.15
Source: Calculated from the Unit Record Data of the 68thRound on Employment and Unemployment, National Sample Survey
Organisation (NSSO), Government of India, New Delhi, January 2014.
The participation of youths in the labour force also varies significantly among different
social groups. It is highest among ST youth, at 56.1 per cent, followed by SCs at 47.3 per cent,
OBC-Muslims and OBC-Others, at about 44 per cent each), and the lowest among OCs, at 38 per
6
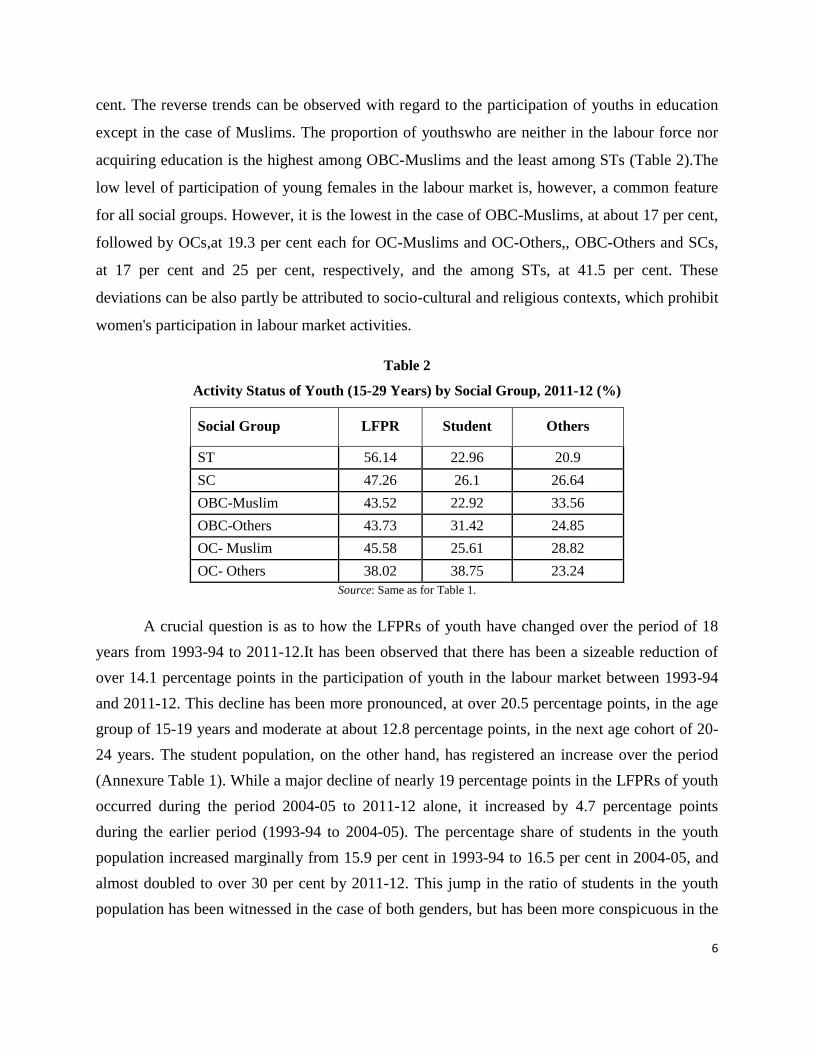
cent. The reverse trends can be observed with regard to the participation of youths in education
except in the case of Muslims. The proportion of youthswho are neither in the labour force nor
acquiring education is the highest among OBC-Muslims and the least among STs (Table 2).The
low level of participation of young females in the labour market is, however, a common feature
for all social groups. However, it is the lowest in the case of OBC-Muslims, at about 17 per cent,
followed by OCs,at 19.3 per cent each for OC-Muslims and OC-Others,, OBC-Others and SCs,
at 17 per cent and 25 per cent, respectively, and the among STs, at 41.5 per cent. These
deviations can be also partly be attributed to socio-cultural and religious contexts, which prohibit
women's participation in labour market activities.
Table 2
Activity Status of Youth (15-29 Years) by Social Group, 2011-12 (%)
Social Group LFPR Student Others
ST 56.14 22.96 20.9
SC 47.26 26.1 26.64
OBC-Muslim 43.52 22.92 33.56
OBC-Others 43.73 31.42 24.85
OC- Muslim 45.58 25.61 28.82
OC- Others 38.02 38.75 23.24
Source: Same as for Table 1.
A crucial question is as to how the LFPRs of youth have changed over the period of 18
years from 1993-94 to 2011-12.It has been observed that there has been a sizeable reduction of
over 14.1 percentage points in the participation of youth in the labour market between 1993-94
and 2011-12. This decline has been more pronounced, at over 20.5 percentage points, in the age
group of 15-19 years and moderate at about 12.8 percentage points, in the next age cohort of 20-
24 years. The student population, on the other hand, has registered an increase over the period
(Annexure Table 1). While a major decline of nearly 19 percentage points in the LFPRs of youth
occurred during the period 2004-05 to 2011-12 alone, it increased by 4.7 percentage points
during the earlier period (1993-94 to 2004-05). The percentage share of students in the youth
population increased marginally from 15.9 per cent in 1993-94 to 16.5 per cent in 2004-05, and
almost doubled to over 30 per cent by 2011-12. This jump in the ratio of students in the youth
population has been witnessed in the case of both genders, but has been more conspicuous in the

7
case of females. There has also been a big jump of 12 percentage points in the female youth
population categorised as „Others, who mainly comprise young women engaged in domestic
chores and other homecare works, in the age-group of 25-29 years during the period 1993-94 to
2011-12. Similar declines of 5 percentage points has been noticed for females in the age group of
20-24 years and of about 12 percentage points for those in the age group of 30-59 years. Thus,
the decline in the LFPRs of youth can be explained in terms of their rising enrolment/retention in
the spheres of secondary and tertiary education, to a large extent, and is partly caused by the
withdrawal of females from the labour market with their rising household income and also
withdrawal from the labour force due to the lack of remunerative employment opportunities
(Neff et al, 2012; Rangarajan, et al. 2011). The non- recording of women‟s work in recent years
has also been cited as yet another reason for the low LFPR among women.
In terms of social groups, the LFPRs of ST youth declined by the highest proportion of
20.4 percentage points between 1993-94 and 2011-12,while the corresponding figure for SCs
was nearly 16.8 percentage points. The next highest decline in the youth LFPRs has been
observed in the case of OBC-Others, while the least decline has been seen in the case of Muslims
(both OBC and Others) (Annexure Table 2). The corresponding increase in the proportion of
students has been highest for OBC-Others, at 12.9 percentage points, followed by OC-Others,
at10.7 percentage points, and SCs, at10.3 percentage points, while the least decline has been
observed in the case of OBC-Muslims, at 6.9 percentage points, during the period 2004-05 to
2011-12. These vast disparities with regard to the participation of youth in education have not
been able to bridge the gap in the educational development of youth belonging to various socio-
religious groups over the past years. These differentials in the educational development of youth
belonging to various social groups also have implications for their employment prospects, as
discussed in the later sections.
The LFPRs of youths vary significantly across states. Over half of the youth population was
accounted for by the labour force in the states of Chhattisgarh, Gujarat, Himachal Pradesh and
Andhra Pradesh in 2011-12. In states like Bihar, however, less than one-third of the youth
population constitutes its labour force. The other states exhibiting a far lower participation of
youth in the labour market than the national average are Arunachal Pradesh, Manipur, Delhi,
Assam, Uttarakhand and Haryana, in that order. The pattern of youth LFPRs across states also
shows a mixed pattern along with their levels of economic development. For example, low-
income states such as Jharkhand have very low youth LFPRs whereas the corresponding figures

8
are much higher in high-income states such as Gujarat. It is assumed that in high-income states,
the participation of the youth in the labour market would be low as most of them are able to
continue their educational development. This also applies to some extent in the case of the youth
population in the age group of 15-19 years but certainly not to the next age groups of 20-24 and
25-29 years, respectively. The LFPRs of youths declined substantially by over 18 percentage
points between 1993-94 and 2011-12 in the 11 states of Andhra Pradesh, Rajasthan, Karnataka,
Tamil Nadu, Madhya Pradesh, Haryana, Himachal Pradesh, Uttarakhand, Chhattisgarh,
Meghalaya and Arunachal Pradesh. However, states such as Orissa, West Bengal, Gujarat, Uttar
Pradesh and Jharkhand witnessed a lower decline in their youth LFPRs, and thus had relatively
high youth LFPRs in 2011-12 (Annexure Table 3).
Briefly, therefore, the youth LFPRs significantly differ across gender, social groups and regions.
The factors determining the probability of participation of youths in the labour market are
discussed in Section V.
III. THE EMPLOYMENT CHALLENGE
1. Employment among Youth
About 137.6 million youth were reportedlyworkers in 2011-12,accounting for 29.1 per cent of
the total workforce in India. Over 60 per cent of the male and nearly two-fifths of the female
youth population are observed to be workers (NSSO, 2014). The growth rate of the youth
employment increased by about 1.3 per cent per annum during the period 1993-94 to 2004-
05,but thereafter declined in absolute terms between 2004-05 and 2011-12,at the rate of -1.39 per
cent per annum. This decline has been mainly witnessed in the case of the female youth
population (Table 3).
Table 3: Growth Rate of Employment among Youth
Gender
Youth Adult
1993-94 to
2004-05
2004-05 to
2011-12
1993-94 to
2004-05
2004-05 to
2011-12
Male 1.46 -0.39 2.38 2.77
Female 0.89 -3.83 2.73 -0.81
Total 1.28 -1.39 2.50 1.66 Source: NSSO Rounds on Employment and Unemployment in India.
9
In the following section, we analyse the nature and quality of youth employment and the
prevalent trends therein since the advent of economic reforms in the 1990s.
2. The Quality of Employment
Employment is generally categorised in terms of self- and wage employment. The self-
employed category under employment is a mixed bag, accounting for employment with a large
range of income from very high to very low, and therefore, cannot be clearly ranked in terms of
the quality of employment. Wage employment consists of regular salaried workers and casual
wage workers. Regular salaried work is generally considered as a decent form of employment
with the lowest incidence of poverty among such workers. Casual wage work is generally the
worst form of wage work with uncertainties and fluctuations in income. The incidence of poverty
among casual wage labourers is the highest of all forms of employment. The self-employed
category of workers is marginally better than casual wage workers because of the prevalence of
comparatively low levels of poverty among them.
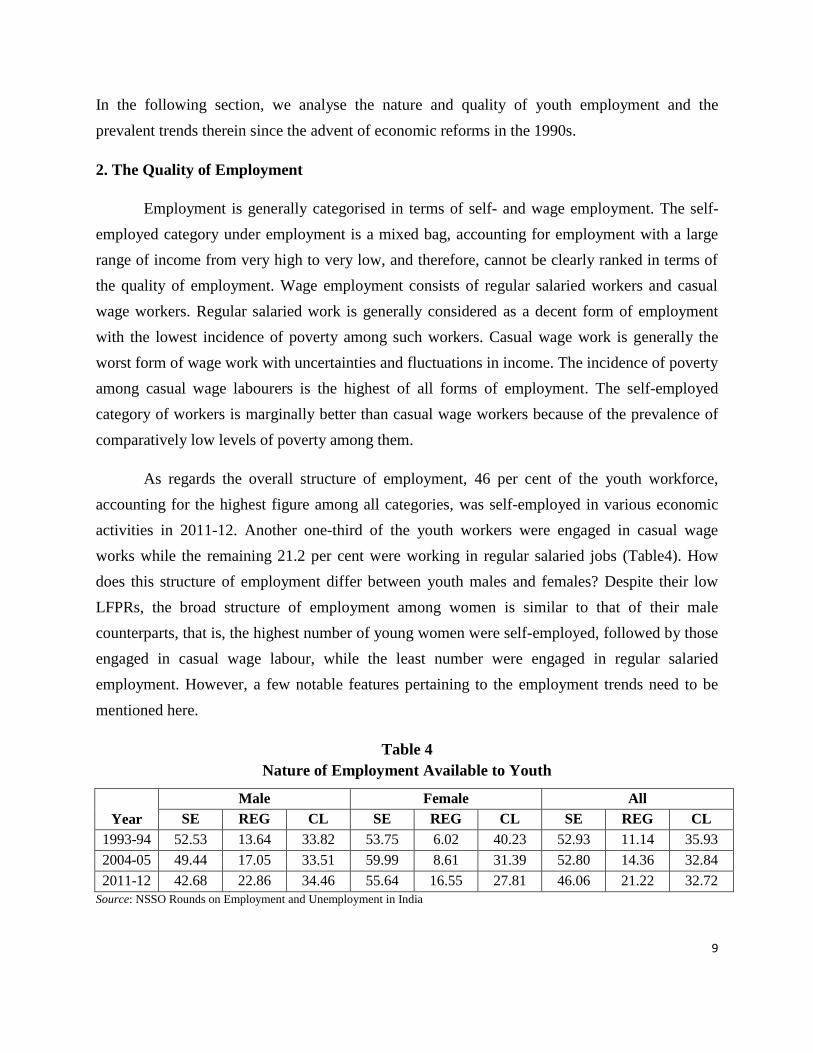
As regards the overall structure of employment, 46 per cent of the youth workforce,
accounting for the highest figure among all categories, was self-employed in various economic
activities in 2011-12. Another one-third of the youth workers were engaged in casual wage
works while the remaining 21.2 per cent were working in regular salaried jobs (Table4). How
does this structure of employment differ between youth males and females? Despite their low
LFPRs, the broad structure of employment among women is similar to that of their male
counterparts, that is, the highest number of young women were self-employed, followed by those
engaged in casual wage labour, while the least number were engaged in regular salaried
employment. However, a few notable features pertaining to the employment trends need to be
mentioned here.
Table 4
Nature of Employment Available to Youth
Year
Male Female All
SE REG CL SE REG CL SE REG CL
1993-94 52.53 13.64 33.82 53.75 6.02 40.23 52.93 11.14 35.93
2004-05 49.44 17.05 33.51 59.99 8.61 31.39 52.80 14.36 32.84
2011-12 42.68 22.86 34.46 55.64 16.55 27.81 46.06 21.22 32.72
Source: NSSO Rounds on Employment and Unemployment in India
10
The percentages of young female workers who were self-employed and also those
engaged as casual wage labourers were substantially higher than the corresponding figures for
their male counterparts. However, the opposite is the case with respect to regular salaried
employment. This pattern holds true for women belonging to various social groups except OCs
(Annexure Table 4).
The structure of youth employment varies significantly across different socio-religious
groups. Nearly half of the youth workers except SCs were self-employed during 2011-12. About
half of the SC youths were working as casual wage labourers. The low proportion of SCs in self-
employment and the corresponding high percentage of this social group in casual wage labour,
unlike other social groups including the OBCs, STs, OCs and Muslims, is largely associated with
the highest incidence of landlessness among SCs. This historical disadvantage still continues
wherein a large majority of the SC youth workers continue to work as casual wage labourers.
The situation of ST youths is similar to that of their SC counterparts, as nearly 42 per cent of the
ST youth were found to be engaged in casual wage works during the period under study. This
pattern is largely the result of growing landlessness among the STs, which, in turn, has been
associated with their displacement in recent years. The situation of OBCs and OC-Muslims falls
somewhere between that of the STs and the OC-Others. In contrast, the proportion of casual
labourers is the lowest (14 per cent) among youths included in the category of OC-Others
(Annexure Table 4).
This kind of divergence in the structure of youth employment is also visible during an
analysis of their share in regular salaried employment. While the highest proportion of 37 per
cent of the OC-Others youth workers were employed in regular salaried jobs, merely 8 per cent
of the ST youths were employed in such jobs. The share of OBCs, Muslims and SCs in such
employment ranged from 18 to 20 per cent, respectively, during the year 2011-12.
It is also interesting to note how the structure of youth employment has changed over the
past 18 years since 1993-94. In this context, the following questions need to be considered: Have
the marginalised groups experienced larger mobility from the casual to the regular category of
wage employment? Have they moved out of self-employment in the same way and extent as the
OCs have done; and if so, where have they moved more often—in the category of regular

11
employees or that of casual wage workers? The long-term trend pertaining to the total youth
workforce has shown a decline in the proportion of the self-employed, and an increase in the
share of regular salaried workers. The proportion of casual workers among youths has witnessed
a decreasing trend. Thus, the share of self-employed youth in employment decreased by about
seven percentage points over the period 1993-94 to 2011-12. The decline in the proportion of
self-employed youth mainly occurred between 2004-05 and 2011-12, while the corresponding
increase was largely seen in regular salaried work (Table 4). In other words, a significant
structural shift in youth employment has occurred, largely during the recent period, that is, 2004-
05 to 2011-12, leading to a significant growth in regular salaried jobs.
Youth workers from all social groups exhibit the same pattern of change in the structure
of their employment, but to varying extents. The highest decline of nearly 12 percentage points
in the share of self-employed was observed in case of OBC-Muslim youths and OC-Other youths
during the period 2004-05 to 2011-12.The categories of OBC-Others, SCs and OC-Muslim
youths also witnessed a substantial shift of about 8, 5 and 3, respectively from self- to wage
employment. Thus, much of the shift away from self-employment has been towards a faster
increase in the share of regular salaried employment for all socio-religious groups except in the
case of OBC-Muslim youth, whose share in both casual as well as regular employment increased
during the period 2004-05 to 2011-12. Contrary to this, the decrease in the share of self-
employed among OCs occurred largely in favour of regular salaried jobs. The proportion of
young OC-Others workers in regular salaried jobs increased by about 7 percentage points from
23.6 per cent in 2004-05 to 37 per cent in 2011-12, which accounts for the highest increase in
their share in such regular salaried jobs as compared to the corresponding figure for the
marginalised social groups. The proportion of SC youth workers in regular salaried jobs more
than doubled from 7.7 percent in 1993-94 to 17.7 percent in 2011-12.This increase for SCs is the
second highest, next only to OCs. This can be termed as a healthy trend for SCs despite a largest
proportion (about 49.8 per cent) of them still working as casual wage labourers (Annexure Table
4).
The question as to whether the structural shift in women‟s employment differs from that
for their male counterparts also needs to be examined in detail. The data show a remarkable
increase in the share of regular salaried workers among female youth during the period 1993-94

12
to 2011-12. This category of workers also witnessed a significant decline of about 12 percentage
points in their share of casual wage labour. In other words, there has been an improvement in the
choice of work for females, and a substantial number of them have withdrawn from casual wage
work. In the case of male youths, their share in casual wage employment almost remained
constant over the period, while the corresponding decline in self-employment has been in favour
of regular salaried jobs (Table 4).
Briefly, therefore, there has been a comparatively faster increase in the number of regular
wage employment opportunities for youths belonging to various social groups in recent years.
However, their dependence on casual wage employment has not decreased significantly, and this
has been more so in the case of STs and SCs than the other social groups.
3. The Industrial Structure of Youth Employment
It is important to examine how youth workers are distributed across different industrial
sectors of the Indian economy. The important questions in this context are: Is employment
concentrated in a few sectors or diversified among three major sectors, namely, agriculture,
industry and services? Although there has been a significant shift of the entire Indian workforce
from agriculture to the industry and service sectors over the past two or three decades, have
youth workers, particularly those belonging to the marginalised social groups also experienced a
similar, larger or small shift? The data pertaining to these questions are presented in Table5.
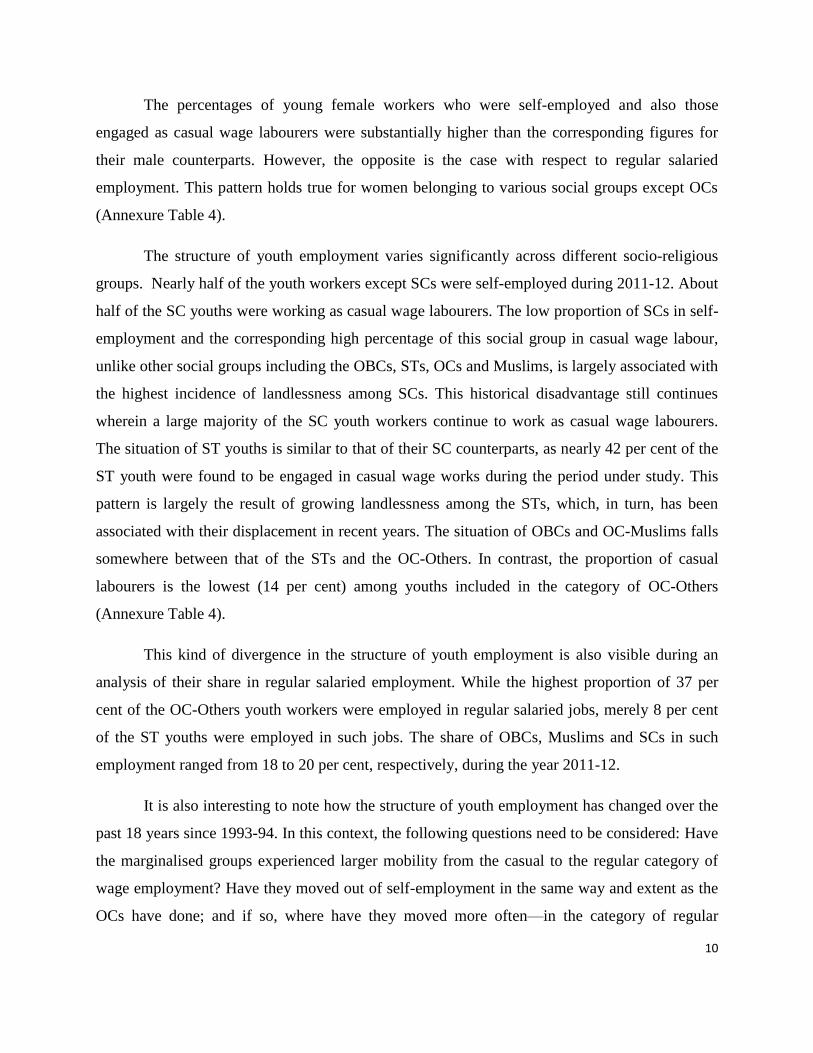
As regards the broad national pattern, nearly 43 per cent of the youth workers are seen to
be engaged in agriculture and allied activities, making this sector the largest sector employing
the youth workforce. The next important industrial sectors are manufacturing and construction,
with each of them employing about 16 per cent and 13 per cent of youth workforce, respectively,
in 2011-12. Over one-tenth of the youth workers were employed in trade and other services each.
There has also been a significant structural shift of youth employment in favour of non-farm
based jobs. Between 2004-05 and 2011-12, the share of youth in agriculture declined by 15.6
percentage points. These workers were mainly absorbed by the construction sector and other
services, accounting for 5.4 percentage points and 3.7 percentage points, respectively, of the shift
from agriculture.. The manufacturing sector also improved its share in youth employment by 2.4
percentage points during the period under study.
13
Table 5
Industrial Structure of Youth Employment, 2011-12
Industry Group STs SCs OBC-
Muslims
OBC-
Others
Others-
Muslims
Others-
Others
Total
Agriculture 68.16 42.34 21.68 48.62 24.92 33.86 43.26
Mining and Quarrying 0.62 0.77 0.7 0.6 0.16 0.52 0.60
Manufacturing 5.82 13.3 28.33 13.92 31.94 19.2 16.13
Electricity, Gas and Water Supply 0.3 0.4 0.26 0.72 0.74 0.43 0.52
Construction 14.45 20.54 16.91 10.6 13.06 6.48 12.96
Trade, Hotels and Restaurant 3.87 7.15 17.06 10.86 16.63 16.66 11.21
Transport Storage and Communication 2.08 5.29 8.0 5.12 6.61 6.16 5.31
Other Services 4.7 10.21 7.07 9.56 5.93 16.69 10.01
Total 100 100 100 100 100 100 100.00
Source: Same as for Table 1.
The industrial composition of youth employment varies substantially across different
social groups. While well over two-thirds of ST youths are employed in the agriculture sector,
the proportion of workers engaged in this sector, at one-fifth of their total population, was that of
OBC-Muslim youths. Less than half of the youth workers in the category of OBC-Others are
employed in agriculture. About 42.3 per cent of the SC youths have been found to be engaged in
agriculture, mainly as casual wage workers. In other words, the dependence on agriculture is the
least among Muslim and OC youths—the Muslims are largely concentrated in urban areas
whereas the OCs have been observed to be possessing land in the rural areas.
While the construction remains the second largest employer of SC youth workers
(accounting for 21 per cent of their total employment), this position is occupied by the
manufacturing sectorin the case of youths included in the categories of Muslims and OC-Others.
Nearly 17 per cent of the youths in the categories of Muslims and OC-Other have been found to
be working in the hotel, restaurant and trade sector, whereas the corresponding share of SCs and
STs is much lower, at7.2 and 3.9 per cent, respectively. About 17 per cent of the youths in the
category of OC-Others have been observed to be working in the „Other Services‟ sector. About
one-tenth of the youths belonging to the SC and OBC-Other categories are also employed in the
„Other Services‟ sector. However, a similar increase has not been witnessed in the proportion of
workers in these sectors from among the OBC-Muslims and STs, who also have reservation in
public sector employment (Table 5). In other words, while reservation has led to an improvement
14
in the representation of OBC-Others and SCs in public sector employment, the same advantage
has been realised at a very slow pace in the case of ST and OBC-Muslim youths.
In sum it may be said that the industrial composition of youth employment clearly shows
a relatively larger dependence of STs and SCs on the agriculture and construction sectors. The
employment structure of OC and Muslim workforce is highly diversified, with these categories
of youths having overcome their dependence on agriculture and shifted in large numbers to the
services sector. As would be seen later, this shift in their employment, particularly in the case of
youths in the category of OC-Others, has been significantly facilitated by favourable economic
and social endowments in terms of land, education, and social status, among other things.
Another question that needs to be considered is: What is the sectoral composition of youth
employment across various regions of the country? The share ofthe primary sector in youth
employment varied from the highest figure of 69 per cent in Chhattisgarh to less than one-tenth
of the total in Kerala among the major Indian states in 2011-12. The other states exhibiting a
predominance of youth employment in the primary sector are Bihar, Himachal Pradesh, Madhya
Pradesh, Orissa and Assam. The secondary sector, which includes manufacturing and
construction, accounted for the highest share of youth employment in Tamil Nadu, West Bengal,
Haryana and Punjab. The services sector, on the other hand, accounted for the highest share of
youth employment in Kerala, with over 54 per cent of the youths in the state engaged in this
sector. The other states characterised by a high share of services in youth employment are the
relatively more developed states such as Tamil Nadu, Maharashtra, Karnataka, Punjab,
Uttarakhand, Haryana and Andhra Pradesh (Annexure Table 5).
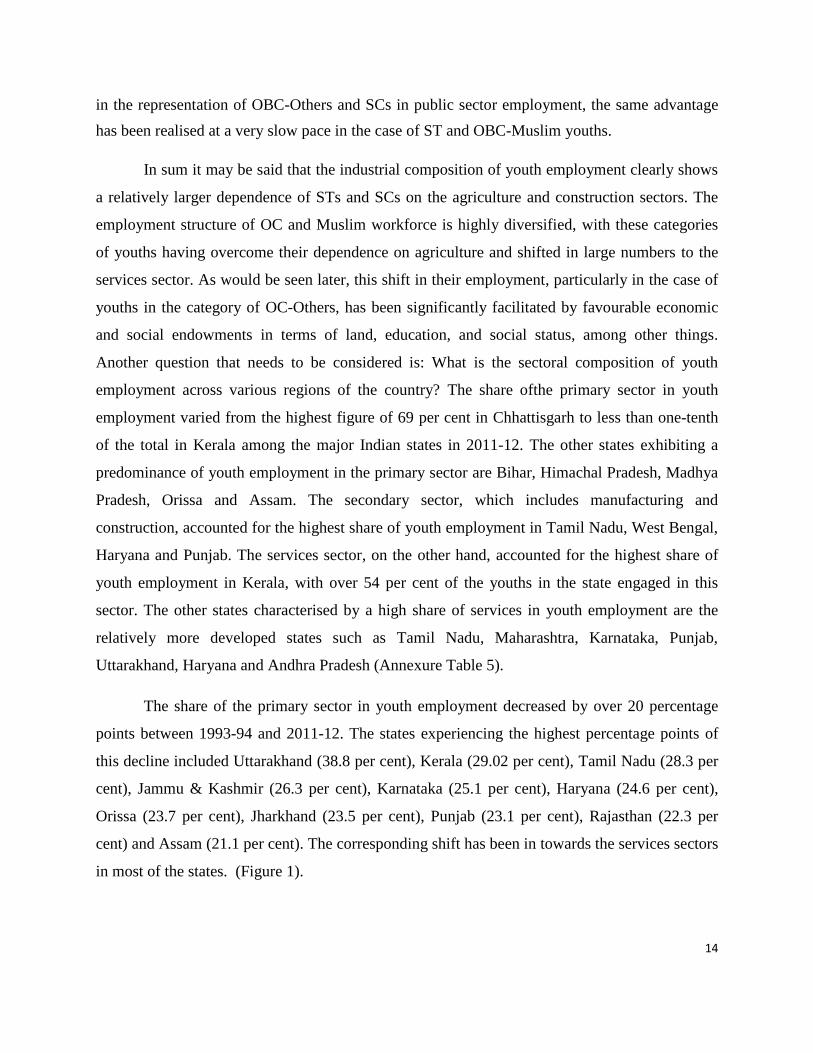
The share of the primary sector in youth employment decreased by over 20 percentage
points between 1993-94 and 2011-12. The states experiencing the highest percentage points of
this decline included Uttarakhand (38.8 per cent), Kerala (29.02 per cent), Tamil Nadu (28.3 per
cent), Jammu & Kashmir (26.3 per cent), Karnataka (25.1 per cent), Haryana (24.6 per cent),
Orissa (23.7 per cent), Jharkhand (23.5 per cent), Punjab (23.1 per cent), Rajasthan (22.3 per
cent) and Assam (21.1 per cent). The corresponding shift has been in towards the services sectors
in most of the states. (Figure 1).
15
Figure 1: Structural Shift in Youth Employment from the Primary to the Secondary and
Services Sectors between 1993-94 and 2011-12
Source: Calculated from NSSO Unit Level Data on Employment and Unemployment, Various Rounds.
4. The Working Poor
The incidence of poverty among workers is one of the indicators of the quality of
available employment. For this, we have used Tendulkar Poverty Line approach on monthly
consumption expenditure data obtained from the Employment and Unemployment Surveys
(EUS) conducted by the NSSO. According to this method, nearly 28 per cent of youth workers
were engaged in a poor quality of employment in 2011-12, as their incomes were insufficient to
take them out of the poverty threshold income. The category of the population suffering from
this syndrome is described as the „working poor‟. The proportion of working poor is marginally
high among youth than among adult workers. The proportion of working poor is the highest
among casual labourers and the least among those employed in regular salaried jobs. The
proportion of youth in the category of working poor declined by about 17 percentage points
between the years 1993-94 and 2011-12. This decline was the highest in the case of casual wage
labourers, followed by those who were self-employed (Figure 2).
0.0
5.0
10.0
15.0
20.0
25.0
30.0
35.0
40.0
45.0
Secondary Services

16
Figure 2: Working Poor among Youth Workers, 1994-2012
Note: The headcount ratio has been calculated for the MPCE data as has been collected in EUS. This may lead to an over-
estimation of the poverty numbers as calculated from the MPCE data and collected in the CES. Moreover, the magnitude and
direction of change in the poverty ratios are more or less similar.
Source: Same as for Fig. 1.
As regards the pattern of poverty in India, over half of the youth workers among STs fall
under the category of the working poor. Nearly one-third of the SC and OBC-Muslim workers
are poor. The proportion of the working poor is the least among Other Caste Hindus (Table 6).
This pattern of the working poor exists among social groups in the case of casual wage
employment, and to some extent in the case of self-employment and regular wage employment
as well. This clearly shows that the quality of employment available to the ST, SC and Muslim
youths is significantly inferior than that accessible to the youth classified under the categories
OBC-Others and Others.
The reasons for the proportionately high number of working poor among these
marginalised groups across all types of employment could be due to the lack of quality assets,
poor education, locational disadvantages, and persisting discrimination against them during their
human capital formation stage and later, even in the labour market.
44.9
27.3
65.6
45.4
27.4
10.8
39.6
27.9
0.0
10.0
20.0
30.0
40.0
50.0
60.0
70.0
SE RE CL All
1993-94 2011-12
17
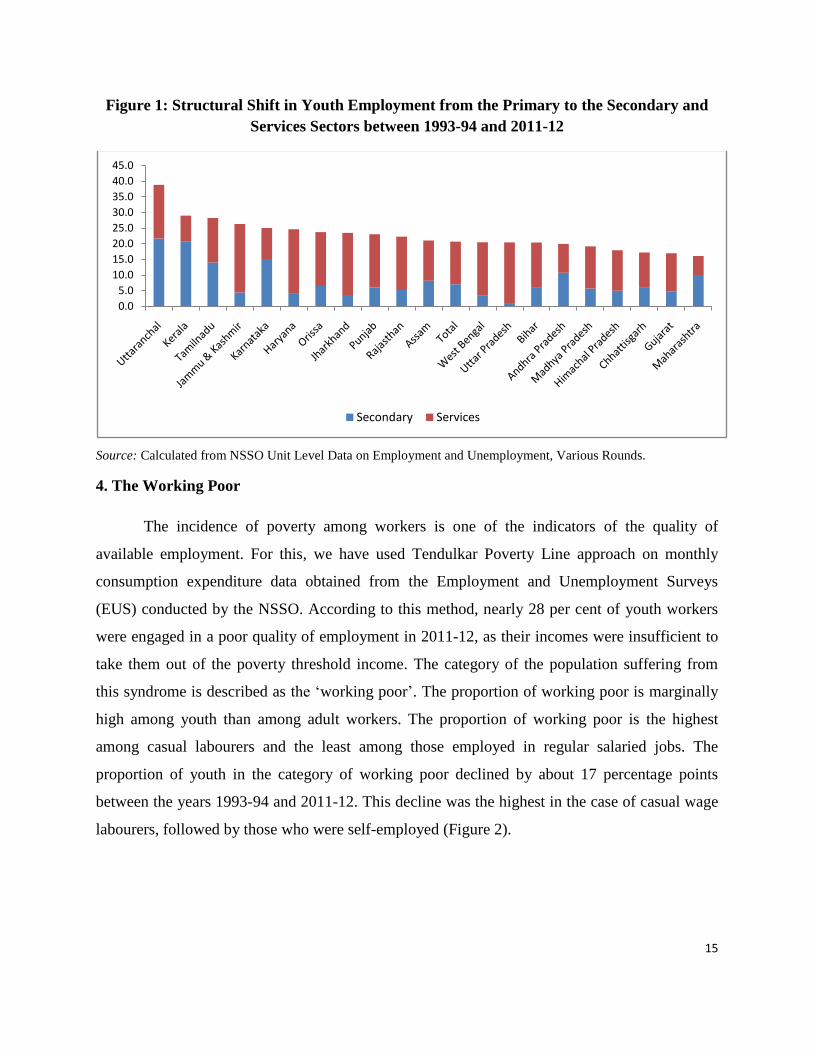
Table 6
Percentage of Working Poor among Youths across different Categories of Employment, 2011-12
Socio-religious Group Self-employed Regular Salaried Casual Labour Total
ST 50.17 16.11 57.45 50.48
SC 29.72 17.79 41.01 33.23
OBC-M 34.05 19.42 37.31 32.14
OBC-O 25.38 10.00 33.25 24.70
OTHER-M 24.80 13.07 39.55 26.75
OTHER 13.73 4.76 31.07 12.86
ALL 27.43 10.78 39.64 27.90
Source: Same as for Table 1.
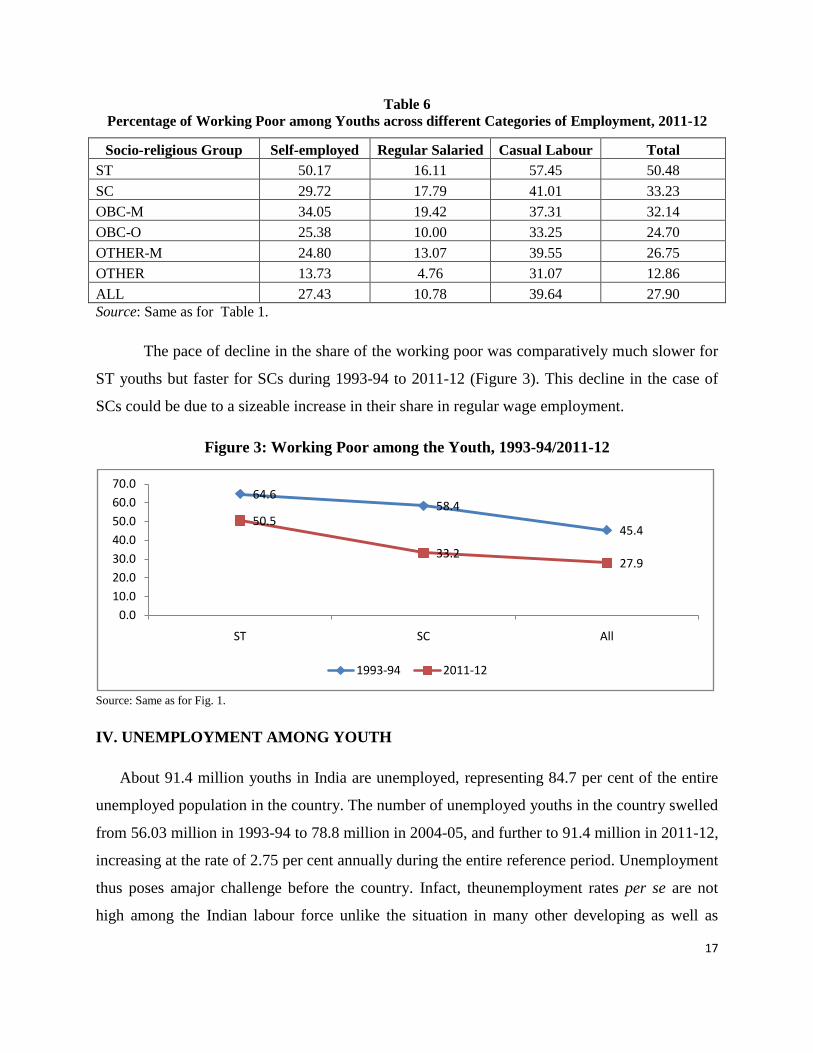
The pace of decline in the share of the working poor was comparatively much slower for
ST youths but faster for SCs during 1993-94 to 2011-12 (Figure 3). This decline in the case of
SCs could be due to a sizeable increase in their share in regular wage employment.
Figure 3: Working Poor among the Youth, 1993-94/2011-12
Source: Same as for Fig. 1.
IV. UNEMPLOYMENT AMONG YOUTH
About 91.4 million youths in India are unemployed, representing 84.7 per cent of the entire
unemployed population in the country. The number of unemployed youths in the country swelled
from 56.03 million in 1993-94 to 78.8 million in 2004-05, and further to 91.4 million in 2011-12,
increasing at the rate of 2.75 per cent annually during the entire reference period. Unemployment
thus poses amajor challenge before the country. Infact, theunemployment rates per se are not
high among the Indian labour force unlike the situation in many other developing as well as
64.658.4
45.450.5
33.227.9
0.0
10.0
20.0
30.0
40.0
50.0
60.0
70.0
ST SC All
1993-94 2011-12
18
developed countries, rather the problem is one of under-employment and poor quality of
employment, predominantly in the informal sector (Papola and Sahu 2012; Kannan, 2014; ISLE,
2014). This issue has also found a prominent place in election manifestoes of almost all the
major political parties in India in recent years. The latest estimates for the year 2011-12 show
about 2.2 per cent of the labour force being unemployed. The incidence of unemployment is
almost three times higher (6.2 per cent) among youths. Gender-wise, the rate of unemployment is
higher among young females, particularly in the urban areas (14.1 per cent). The corresponding
figure for rural areas is about 5 per cent each for males and females. The rate of unemployment
among the youth increased steadily from nearly 4 per cent in 1993-94 to 5.4 per cent in 2004-
05,and to 6.2 per cent by 2011-12 (Table 7).
1. Mismatch between Education and Employability
It has also been estimated that about 20 per cent of the labour force among the youth,
who have degree and professional educational attainments, were unemployed in 2011-12.The
unemployment rate is also high among those having technical degrees and diplomas. A similar
pattern was also observed earlier (Mathur and Mamgain, 2004). It is important to examine how
this pattern has changed over the years. While there was an overall increase in the incidence of
unemployment among youth during the period 1993-94 to 2011-12, the unemployment also
decreased significantly in the case of those having attained higher levels of education, barring
those with technical degrees (Table8). In fact, the unemployment rate among graduates with
technical degrees jumped from 7.7 per cent in 1993-94 to 18.2 per cent in 2004-05, and increased
further to nearly 21 per cent in 2011-12. The rate of decline in the incidence of unemployment
has been substantive (ranging from 2 to 3 percentage points) for those with technical diplomas
and high school graduates. The category of unemployed youth in recent years thus largely
includes those having acquired middle level education as also those with technical degrees.
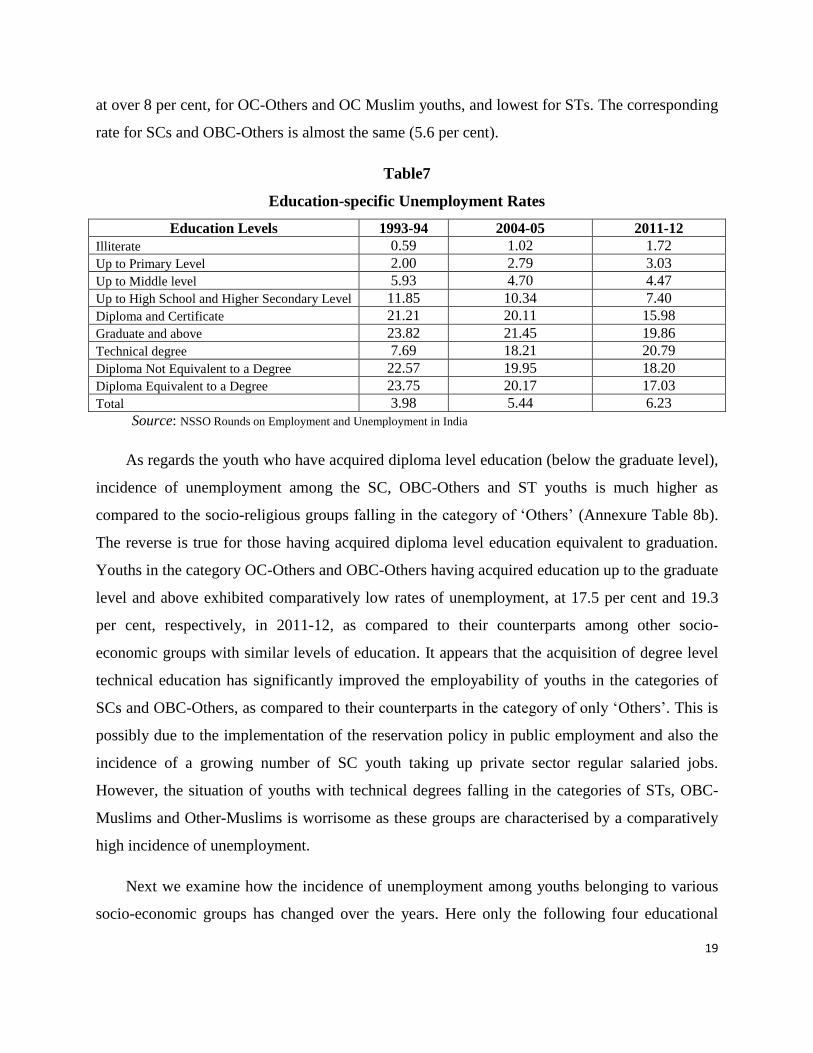
We also need to explore how the pattern of unemployment differs for youths belonging to
various socio-religious backgrounds with similar educational levels. While the broad pattern of
an increasing unemployment rate with increasing educational levels does prevail, it varies
significantly across social groups with similar educational attainments. Overall, it is the highest
19
at over 8 per cent, for OC-Others and OC Muslim youths, and lowest for STs. The corresponding
rate for SCs and OBC-Others is almost the same (5.6 per cent).
Table7
Education-specific Unemployment Rates
Education Levels 1993-94 2004-05 2011-12
Illiterate 0.59 1.02 1.72
Up to Primary Level 2.00 2.79 3.03
Up to Middle level 5.93 4.70 4.47
Up to High School and Higher Secondary Level 11.85 10.34 7.40
Diploma and Certificate 21.21 20.11 15.98
Graduate and above 23.82 21.45 19.86
Technical degree 7.69 18.21 20.79
Diploma Not Equivalent to a Degree 22.57 19.95 18.20
Diploma Equivalent to a Degree 23.75 20.17 17.03
Total 3.98 5.44 6.23
Source: NSSO Rounds on Employment and Unemployment in India
As regards the youth who have acquired diploma level education (below the graduate level),
incidence of unemployment among the SC, OBC-Others and ST youths is much higher as
compared to the socio-religious groups falling in the category of „Others‟ (Annexure Table 8b).
The reverse is true for those having acquired diploma level education equivalent to graduation.
Youths in the category OC-Others and OBC-Others having acquired education up to the graduate
level and above exhibited comparatively low rates of unemployment, at 17.5 per cent and 19.3
per cent, respectively, in 2011-12, as compared to their counterparts among other socio-
economic groups with similar levels of education. It appears that the acquisition of degree level
technical education has significantly improved the employability of youths in the categories of
SCs and OBC-Others, as compared to their counterparts in the category of only „Others‟. This is
possibly due to the implementation of the reservation policy in public employment and also the
incidence of a growing number of SC youth taking up private sector regular salaried jobs.
However, the situation of youths with technical degrees falling in the categories of STs, OBC-
Muslims and Other-Muslims is worrisome as these groups are characterised by a comparatively
high incidence of unemployment.
Next we examine how the incidence of unemployment among youths belonging to various
socio-economic groups has changed over the years. Here only the following four educational

20
levels have been considered, that is, those having acquired (a) High school and higher secondary
level of education, (b) Diploma and certificate level, (c) Graduation and above, and (d) Technical
diplomas not equivalent to degrees. The youths among the OBC-Muslims have seen a significant
improvement in their employability with a reduction in their unemployment rates—about 11.8
percentage points at the high school level and nearly 16 per cent at the diploma level between
2004-05 and 2011-12. Similarly, the unemployment rate among SC and OBC-Muslim graduates
declined by 5.9 and 3.7 percentage points, respectively, during the period 2004-05 to 2011-12.
The situation of ST youths with high school and technician diploma level education has,
however, worsened in recent times with an increased incidence of unemployment (Annexure
Tables7and 8).
Briefly, therefore, it can be said that the overall employability of youths has declined over
the years, which is largely due to the rising incidence of unemployment among youths with
education levels up to or below middle school. The reduction in unemployment rates among
those with educational levels up to secondary school and higher except graduates with technical
degrees largely confirm that an improvement in the education levels of youths has led to a
concomitant improvement in their employability over the years. However, the prevalence of a
high rate of unemployment among graduates and technical degree-/diploma-holders is still a
matter of concern. This also justifies the concerns of employers regarding the poor education and
skill levels of youths passing out of higher and technical educational institutions. There is a huge
disconnect between the theoretical learning and practical knowledge being imparted in
educational institutions. Moreover, the mushrooming growth of technical education institutions
during the last two decades has grossly undermined the quality of vocational and technical
education in the country. The emphasis of Prime Minister Narendra Modi on imparting skills
among Indian youths for helping them improve their employment prospects, coupled with the
current initiatives under the National Skill Development Mission, should ensure that the gap
between current education levels and needs of the industryis bridged needs by ensuring both the
quality and the relevance of technical education in the country.
21
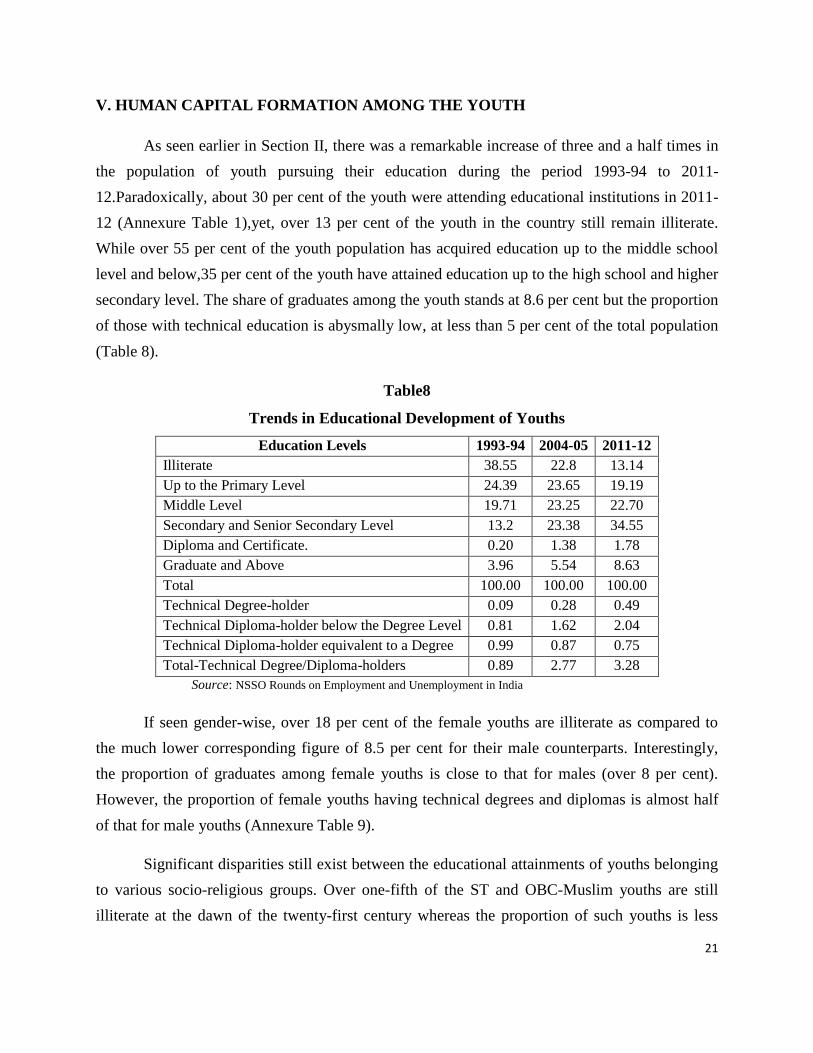
V. HUMAN CAPITAL FORMATION AMONG THE YOUTH
As seen earlier in Section II, there was a remarkable increase of three and a half times in
the population of youth pursuing their education during the period 1993-94 to 2011-
12.Paradoxically, about 30 per cent of the youth were attending educational institutions in 2011-
12 (Annexure Table 1),yet, over 13 per cent of the youth in the country still remain illiterate.
While over 55 per cent of the youth population has acquired education up to the middle school
level and below,35 per cent of the youth have attained education up to the high school and higher
secondary level. The share of graduates among the youth stands at 8.6 per cent but the proportion
of those with technical education is abysmally low, at less than 5 per cent of the total population
(Table 8).
Table8
Trends in Educational Development of Youths
Education Levels 1993-94 2004-05 2011-12
Illiterate 38.55 22.8 13.14
Up to the Primary Level 24.39 23.65 19.19
Middle Level 19.71 23.25 22.70
Secondary and Senior Secondary Level 13.2 23.38 34.55
Diploma and Certificate. 0.20 1.38 1.78
Graduate and Above 3.96 5.54 8.63
Total 100.00 100.00 100.00
Technical Degree-holder 0.09 0.28 0.49
Technical Diploma-holder below the Degree Level 0.81 1.62 2.04
Technical Diploma-holder equivalent to a Degree 0.99 0.87 0.75
Total-Technical Degree/Diploma-holders 0.89 2.77 3.28
Source: NSSO Rounds on Employment and Unemployment in India
If seen gender-wise, over 18 per cent of the female youths are illiterate as compared to
the much lower corresponding figure of 8.5 per cent for their male counterparts. Interestingly,
the proportion of graduates among female youths is close to that for males (over 8 per cent).
However, the proportion of female youths having technical degrees and diplomas is almost half
of that for male youths (Annexure Table 9).
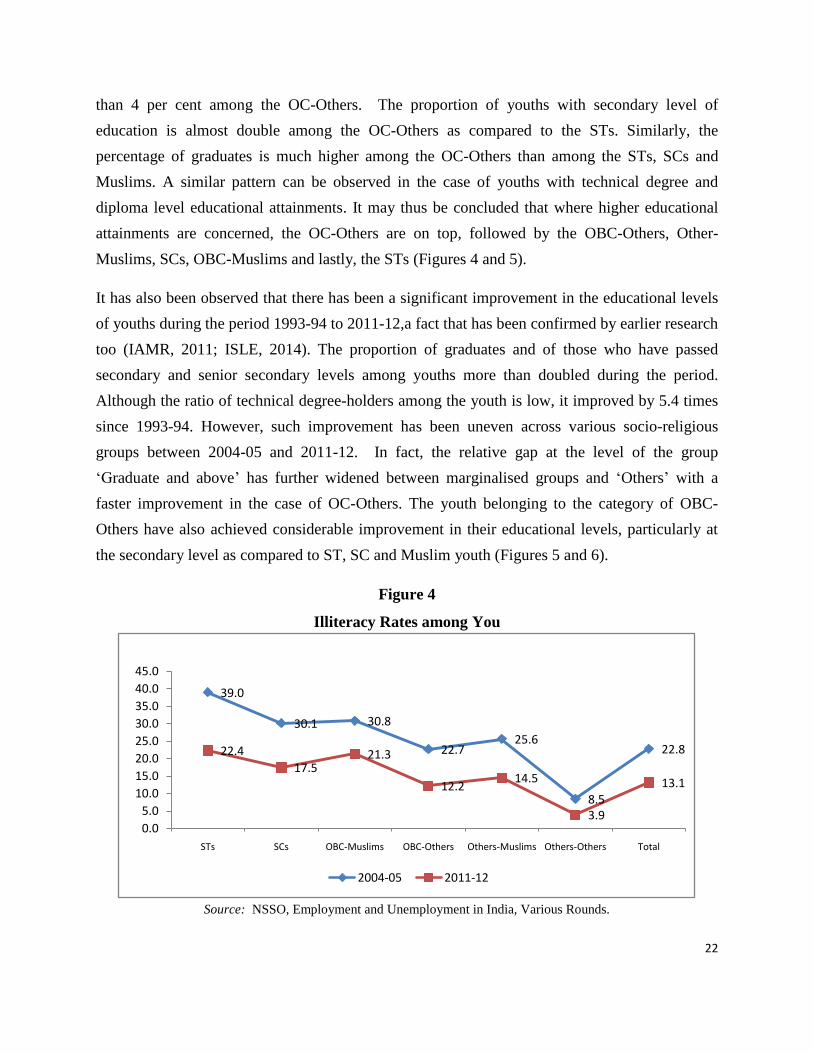
Significant disparities still exist between the educational attainments of youths belonging
to various socio-religious groups. Over one-fifth of the ST and OBC-Muslim youths are still
illiterate at the dawn of the twenty-first century whereas the proportion of such youths is less
22
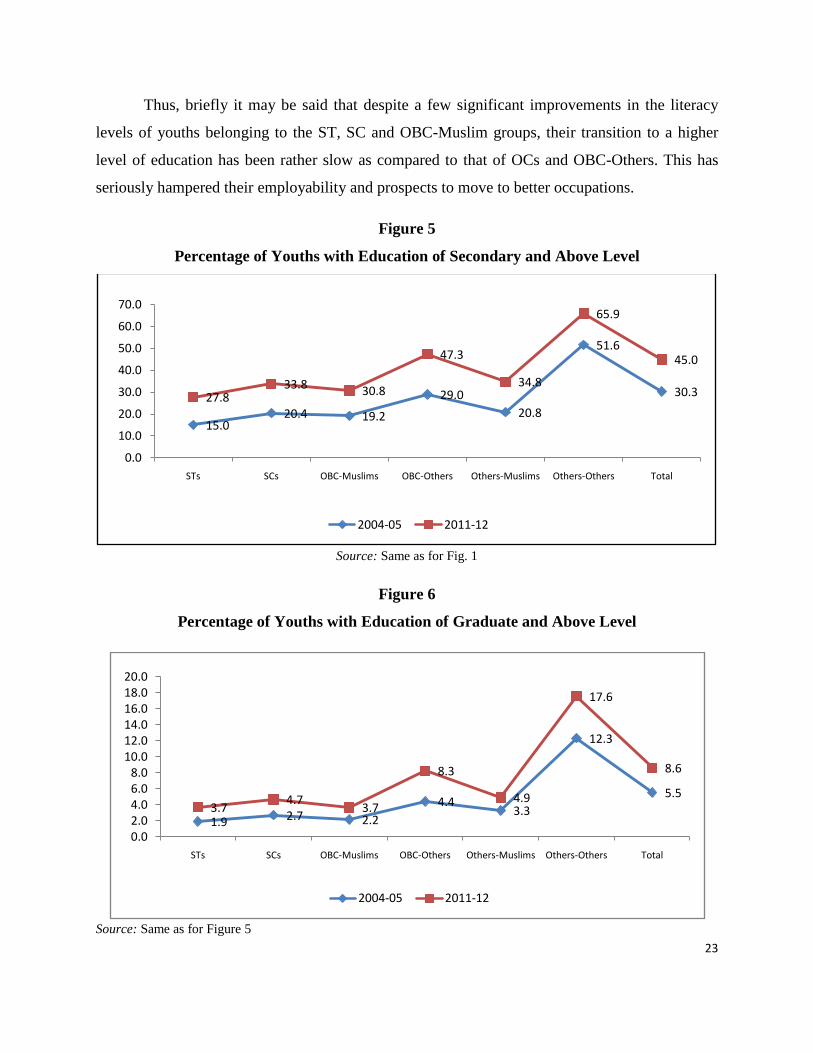
than 4 per cent among the OC-Others. The proportion of youths with secondary level of
education is almost double among the OC-Others as compared to the STs. Similarly, the
percentage of graduates is much higher among the OC-Others than among the STs, SCs and
Muslims. A similar pattern can be observed in the case of youths with technical degree and
diploma level educational attainments. It may thus be concluded that where higher educational
attainments are concerned, the OC-Others are on top, followed by the OBC-Others, Other-
Muslims, SCs, OBC-Muslims and lastly, the STs (Figures 4 and 5).
It has also been observed that there has been a significant improvement in the educational levels
of youths during the period 1993-94 to 2011-12,a fact that has been confirmed by earlier research
too (IAMR, 2011; ISLE, 2014). The proportion of graduates and of those who have passed
secondary and senior secondary levels among youths more than doubled during the period.
Although the ratio of technical degree-holders among the youth is low, it improved by 5.4 times
since 1993-94. However, such improvement has been uneven across various socio-religious
groups between 2004-05 and 2011-12. In fact, the relative gap at the level of the group
„Graduate and above‟ has further widened between marginalised groups and „Others‟ with a
faster improvement in the case of OC-Others. The youth belonging to the category of OBC-
Others have also achieved considerable improvement in their educational levels, particularly at
the secondary level as compared to ST, SC and Muslim youth (Figures 5 and 6).
Figure 4
Illiteracy Rates among You
Source: NSSO, Employment and Unemployment in India, Various Rounds.
39.0
30.1 30.8
22.725.6
8.5
22.822.4
17.521.3
12.214.5
3.9
13.1
0.0
5.0
10.0
15.0
20.0
25.0
30.0
35.0
40.0
45.0
STs SCs OBC-Muslims OBC-Others Others-Muslims Others-Others Total
2004-05 2011-12
23
Thus, briefly it may be said that despite a few significant improvements in the literacy
levels of youths belonging to the ST, SC and OBC-Muslim groups, their transition to a higher
level of education has been rather slow as compared to that of OCs and OBC-Others. This has
seriously hampered their employability and prospects to move to better occupations.
Figure 5
Percentage of Youths with Education of Secondary and Above Level
Source: Same as for Fig. 1
Figure 6
Percentage of Youths with Education of Graduate and Above Level
Source: Same as for Figure 5
15.020.4 19.2
29.0
20.8
51.6
30.327.833.8 30.8
47.3
34.8
65.9
45.0
0.0
10.0
20.0
30.0
40.0
50.0
60.0
70.0
STs SCs OBC-Muslims OBC-Others Others-Muslims Others-Others Total
2004-05 2011-12
1.9 2.7 2.2
4.43.3
12.3
5.53.7
4.73.7
8.3
4.9
17.6
8.6
0.02.04.06.08.0
10.012.014.016.018.020.0
STs SCs OBC-Muslims OBC-Others Others-Muslims Others-Others Total
2004-05 2011-12
24
VI. DETERMINANTS OF PARTICIPATION OF YOUTHS IN LABOUR MARKET
The following important questions need to be considered with regard to the participation
of youths in the labour market: Do household characteristics influence the participation of its
youths in the labour market? Do educational levels and experience improve the chances of the
persons concerned of getting regular salaried jobs? How does caste matter in deciding the
participation of youth in work, education or leisure activities? How does the location of a
household (rural/urban/state of residence) interact with personal and household characteristics in
determining the participation of youth in work? The effects of these covariates on the
participation of youths are analysed here with the help of the multinomial logit regression model
through the use of the NSSO data on employment and unemployment for the year 2011-12. The
predicted probabilities of multinomial estimate are shown in Tables9and 10.
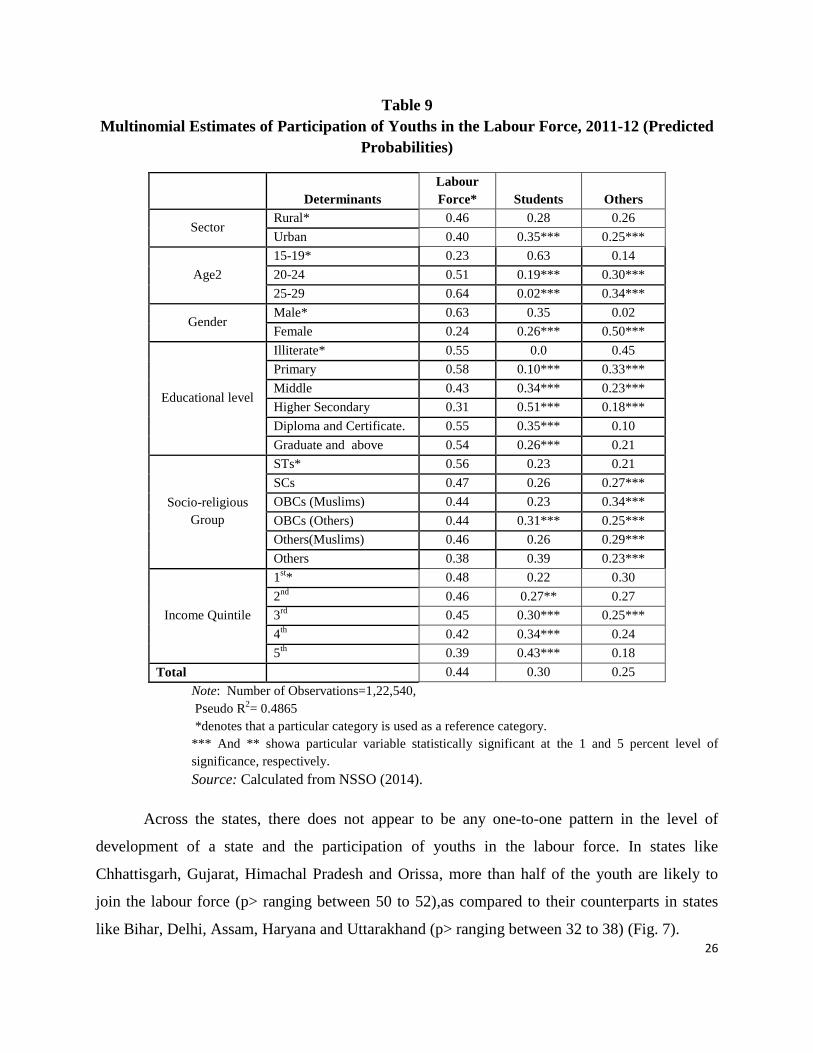
After controlling for factors including age as the proxy of experience, gender, education,
socio-religious characteristics and income, in reference to urban areas, the likelihood of youths
joining the labour force is higher by 6 percentage points in rural areas. The chances of joining the
labour force improve with a rise in age and experience. In reference to the age group of 15-19
years, the probabilities of the youth joining the labour force in the age group of 20-24 years has
been double (p> 51).
Gender has a significant impact on the decision of youths to join the labour market, as the
likelihood of young males joining the labour force is 2.6 times higher than that of their female
counterparts (p> 63 for males and p> 24 for females). The likelihood of the male youths
continuing their education is also high by about 9 percentage points. This also confirms the fact
that the likelihood of young females remaining out of the labour market as well as in education is
very high (p> 50 for females and p> 2 for males). Even after controlling for the income of
households, the likelihood of the participation of young females in the labour market and/or
education is significantly lower than that of young males. The available literature showsthe
increasing participation of females including youths in education and an improvement in income
levels as the main reasons for the recent decline in the participation of females in the labour
market in India (Neff et al, 2012; Rangarajan,et al., 2011). Our results, however, partly explain
such reasons for the lower female participation. There are, therefore, other issues such as
25
deteriorating working conditions; increasing casualisation of employment; and restrictions on
free mobility, safety and dignity at the workplace, which discourage women's participation in
work. The underlying reasons for the decisions of young females to refrain from taking up work
thus need further explanations.
How do the educational levels of youths determine the probability of their joining the
labour force? The likelihood of the youth joining the labour force is comparatively the least (p>
31) among those with secondary level of education as compared to illiterates and graduates. This
trend may be due to the stronger preference among youths with secondary level of education for
continuing their education and skill development. This finding underscores the need to reduce
the higher number of drop outs among youths at the primary and middle levels of education.
As discussed above, the socio-religious backgrounds of the youths also have a significant
influence in determining their participation in the labour market vis-à-vis their counterparts from
other backgrounds despite both groups having similar levels of education, age, gender and places
of residence. This is confirmed by multinomial estimates. As regards STs, the probability of their
joining the labour force is one and a half times less among youths belonging to the OC-Other
group (p> 38 for OC-Others and p> 56 for STs). Next to STs, the other groups from which
youths have higher chances of joining the labour force include SCs (p> 47), closely followed by
Other-Muslims (p> 46) and OBCs (p> 44). In other words, the likelihood of youths continuing
their education is much higher for OC-Others and OBC-Others as compared to youths from other
socio-religious groups. This adversely affects the educational development of SC/ST youths and
consequently their chances of securing high-quality employment.
After controlling for other factors, the probability of youths joining the labour force declines
among the higher income group with the gap in the lowest and the highest income quintile being
9 percentage points. Similarly, the probability of youths in the lowest income quintile continuing
their education has been more than double that of their counterparts in the highest income
quintile.
26
Table 9
Multinomial Estimates of Participation of Youths in the Labour Force, 2011-12 (Predicted
Probabilities)
Determinants
Labour
Force* Students Others
Sector Rural* 0.46 0.28 0.26
Urban 0.40 0.35*** 0.25***
Age2
15-19* 0.23 0.63 0.14
20-24 0.51 0.19*** 0.30***
25-29 0.64 0.02*** 0.34***
Gender Male* 0.63 0.35 0.02
Female 0.24 0.26*** 0.50***
Educational level
Illiterate* 0.55 0.0 0.45
Primary 0.58 0.10*** 0.33***
Middle 0.43 0.34*** 0.23***
Higher Secondary 0.31 0.51*** 0.18***
Diploma and Certificate. 0.55 0.35*** 0.10
Graduate and above 0.54 0.26*** 0.21
Socio-religious
Group
STs* 0.56 0.23 0.21
SCs 0.47 0.26 0.27***
OBCs (Muslims) 0.44 0.23 0.34***
OBCs (Others) 0.44 0.31*** 0.25***
Others(Muslims) 0.46 0.26 0.29***
Others 0.38 0.39 0.23***
Income Quintile
1st* 0.48 0.22 0.30
2nd
0.46 0.27** 0.27
3rd
0.45 0.30*** 0.25***
4th
0.42 0.34*** 0.24
5th
0.39 0.43*** 0.18
Total 0.44 0.30 0.25
Note: Number of Observations=1,22,540,
Pseudo R2= 0.4865
*denotes that a particular category is used as a reference category.
*** And ** showa particular variable statistically significant at the 1 and 5 percent level of
significance, respectively.
Source: Calculated from NSSO (2014).
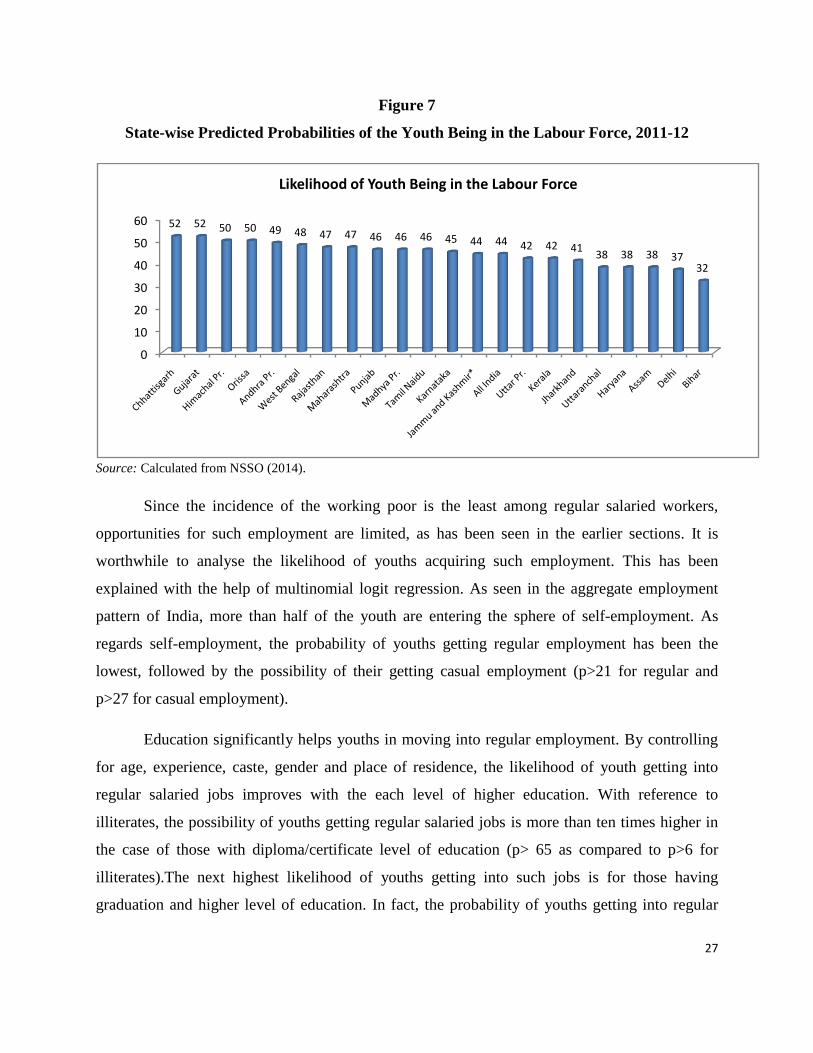
Across the states, there does not appear to be any one-to-one pattern in the level of
development of a state and the participation of youths in the labour force. In states like
Chhattisgarh, Gujarat, Himachal Pradesh and Orissa, more than half of the youth are likely to
join the labour force (p> ranging between 50 to 52),as compared to their counterparts in states
like Bihar, Delhi, Assam, Haryana and Uttarakhand (p> ranging between 32 to 38) (Fig. 7).
27
Figure 7
State-wise Predicted Probabilities of the Youth Being in the Labour Force, 2011-12
Source: Calculated from NSSO (2014).
Since the incidence of the working poor is the least among regular salaried workers,
opportunities for such employment are limited, as has been seen in the earlier sections. It is
worthwhile to analyse the likelihood of youths acquiring such employment. This has been
explained with the help of multinomial logit regression. As seen in the aggregate employment
pattern of India, more than half of the youth are entering the sphere of self-employment. As
regards self-employment, the probability of youths getting regular employment has been the
lowest, followed by the possibility of their getting casual employment (p>21 for regular and
p>27 for casual employment).
Education significantly helps youths in moving into regular employment. By controlling
for age, experience, caste, gender and place of residence, the likelihood of youth getting into
regular salaried jobs improves with the each level of higher education. With reference to
illiterates, the possibility of youths getting regular salaried jobs is more than ten times higher in
the case of those with diploma/certificate level of education (p> 65 as compared to p>6 for
illiterates).The next highest likelihood of youths getting into such jobs is for those having
graduation and higher level of education. In fact, the probability of youths getting into regular
0
10
20
30
40
50
60 52 52 50 50 49 48 47 47 46 46 46 45 44 44 42 42 4138 38 38 37
32
Likelihood of Youth Being in the Labour Force
28
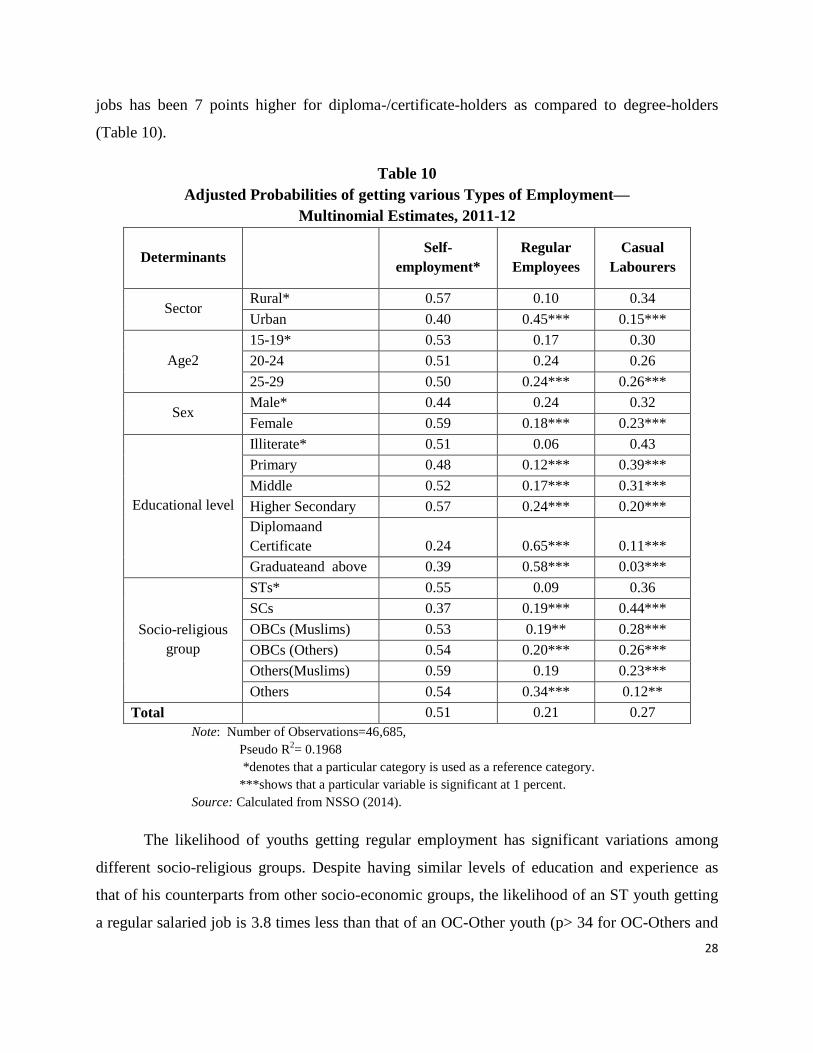
jobs has been 7 points higher for diploma-/certificate-holders as compared to degree-holders
(Table 10).
Table 10
Adjusted Probabilities of getting various Types of Employment—
Multinomial Estimates, 2011-12
Determinants
Self-
employment*
Regular
Employees
Casual
Labourers
Sector Rural* 0.57 0.10 0.34
Urban 0.40 0.45*** 0.15***
Age2
15-19* 0.53 0.17 0.30
20-24 0.51 0.24 0.26
25-29 0.50 0.24*** 0.26***
Sex Male* 0.44 0.24 0.32
Female 0.59 0.18*** 0.23***
Educational level
Illiterate* 0.51 0.06 0.43
Primary 0.48 0.12*** 0.39***
Middle 0.52 0.17*** 0.31***
Higher Secondary 0.57 0.24*** 0.20***
Diplomaand
Certificate 0.24 0.65*** 0.11***
Graduateand above 0.39 0.58*** 0.03***
Socio-religious
group
STs* 0.55 0.09 0.36
SCs 0.37 0.19*** 0.44***
OBCs (Muslims) 0.53 0.19** 0.28***
OBCs (Others) 0.54 0.20*** 0.26***
Others(Muslims) 0.59 0.19 0.23***
Others 0.54 0.34*** 0.12**
Total 0.51 0.21 0.27
Note: Number of Observations=46,685,
Pseudo R2= 0.1968
*denotes that a particular category is used as a reference category.
***shows that a particular variable is significant at 1 percent.
Source: Calculated from NSSO (2014).
The likelihood of youths getting regular employment has significant variations among
different socio-religious groups. Despite having similar levels of education and experience as
that of his counterparts from other socio-economic groups, the likelihood of an ST youth getting
a regular salaried job is 3.8 times less than that of an OC-Other youth (p> 34 for OC-Others and
29
p> 9 for ST). The probabilities of SC, OBC and OC-Muslim youths getting regular salaried jobs
are more or less similar, at 19-20 per cent, and are much higher than the probabilities of ST
youths getting jobs but far less than those for youths belonging to the OC-Others group. Their
likelihood of remaining in such jobs is about 1.8 times less as compared to that of OC-Others.
The prevalence of such huge differences also shows discrimination in the regular salaried labour
market as employers often give preference to OCs while hiring workers. The existence of such
discrimination in the hiring of workers in the urban labour market has been well-documented in
India (Thorat and Newman, 2010). Similarly, gender discrimination among socio-religious
groups also persists in the labour market as the probability of females getting regular jobs is
around 6 percentage points lower than that of males.
1. Marginal Effects of Getting Quality Employment
In order to measure the differences in the predicted probabilities of youths getting regular
employment over other forms of employment with reference to a reference group, we have
calculated the average marginal effects from ourLogit model (Table 11).The average marginal
effect for a particular group is calculated as the difference of:(a) Marginal probability when all
individuals are from a particular group less, (b) Marginal probability when all individuals are
from the reference group. The marginal effects for youth and adult workers getting regular jobs
are reported in Table 10. The results show that if all youths possess the mean attributes of STs,
then the marginal effect of STs in comparison to the reference group (OC-Other) becomes lower
by -8.5 points in getting regular employment over other kinds of employment. Such marginal
effects are significantly lower by 1.4, 1.8 and 2.5 points for SCs, OBC-Muslims and OBC-Non-
Muslims, respectively, as compared to OC-Others. The likelihood of females getting regular
employment is lower by 3.5 points in comparison to males. Further, youths from urban areas are
more likely to get regular employment by 21 points.
In the case of adult workers, the values of the marginal effect are positive and highest for
SCs by +3.6 points, followed by those for STs (+0.3 points) with reference to OC-Others. The
corresponding value is negative in the case of Muslims. The differing values of the marginal
effects also indicate that SC/ST adult workers have benefited in large numbers from reservation
in public sector employment till its decline in the early 1990s. The negative sign of the marginal
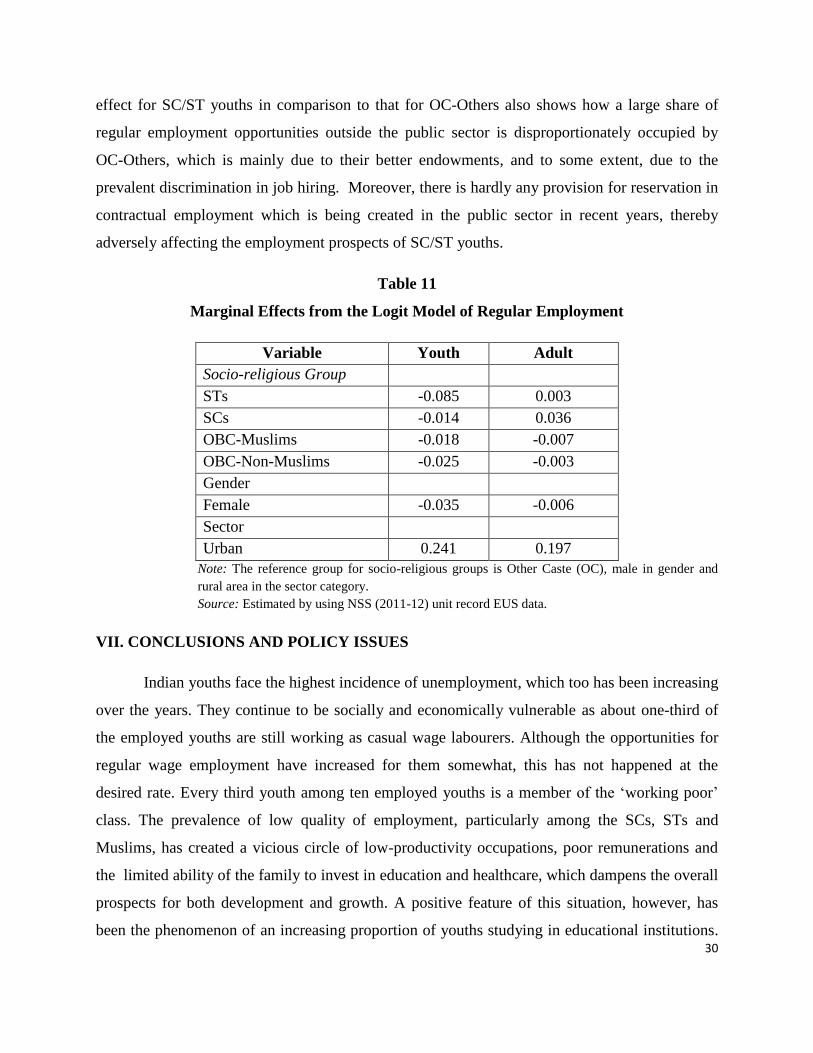
30
effect for SC/ST youths in comparison to that for OC-Others also shows how a large share of
regular employment opportunities outside the public sector is disproportionately occupied by
OC-Others, which is mainly due to their better endowments, and to some extent, due to the
prevalent discrimination in job hiring. Moreover, there is hardly any provision for reservation in
contractual employment which is being created in the public sector in recent years, thereby
adversely affecting the employment prospects of SC/ST youths.
Table 11
Marginal Effects from the Logit Model of Regular Employment
Variable Youth Adult
Socio-religious Group
STs -0.085 0.003
SCs -0.014 0.036
OBC-Muslims -0.018 -0.007
OBC-Non-Muslims -0.025 -0.003
Gender
Female -0.035 -0.006
Sector
Urban 0.241 0.197
Note: The reference group for socio-religious groups is Other Caste (OC), male in gender and
rural area in the sector category.
Source: Estimated by using NSS (2011-12) unit record EUS data.
VII. CONCLUSIONS AND POLICY ISSUES
Indian youths face the highest incidence of unemployment, which too has been increasing
over the years. They continue to be socially and economically vulnerable as about one-third of
the employed youths are still working as casual wage labourers. Although the opportunities for
regular wage employment have increased for them somewhat, this has not happened at the
desired rate. Every third youth among ten employed youths is a member of the „working poor‟
class. The prevalence of low quality of employment, particularly among the SCs, STs and
Muslims, has created a vicious circle of low-productivity occupations, poor remunerations and
the limited ability of the family to invest in education and healthcare, which dampens the overall
prospects for both development and growth. A positive feature of this situation, however, has
been the phenomenon of an increasing proportion of youths studying in educational institutions.
31
However, this transition in favour of education is not uniform across social groups, thereby
leading to a widening of the gap among them in terms of their participation in both work and
education. The likelihood of ST, SC and OBC-Muslim youths continuing their education is
significantly lower than that of their counterparts in the OC group.
The challenge, therefore, is to create a large number of remunerative employment
opportunities with adequate social security for both youths as well as others in the coming years.
This would necessitate an increase in investment in the labour-intensive sectors, especially in the
industrially backward and remote areas. It is thus imperative to intensify policy initiatives to
promote enterprise development, particularly among SCs/STs, in a big way. For this purpose, the
finances earmarked under the special component plan for SCs and STs can be used along with
other sources.
Another major challenge is to improve the educational development of youths. As has
been seen earlier, education significantly enhances the probability of getting better jobs.
Therefore, efforts need to be made to ensure the higher transition of youths to vocational and
technical education, and also to higher education. Although the measures towards educational
development of SCs/STs such as the grant of scholarships and free uniforms, provision of
coaching for competitive examinations, and imposition of reservation in educational institutions
have improved their participation in education at various levels, these measures need to be
strengthened further. An alarming aspect of the educational development of youths is the
increasing deficit of quality education and skill training. Public educational institutions, at both
the school and higher levels, also need to be strengthened and made accountable for their quality
and relevance. Private educational and training institutions, on the other hand, need to be
monitored closely for the quality of teaching they offer, and their fee structures. The current
measures of skill development under the National Skill Development Mission need to be pegged
up in a big way in order to address the skill shortages being faced by the Indian industry. Unlike
in the past, today‟s youths are more informed and keen to be a part of the IT revolution. They are
justifiably asserting their concerns for a decent and dignified life. Politicians and policy-makers
must, therefore, come forward in a big way to facilitate the overall development of youths in the
country and to ensure decent employment opportunities for them.
32
References
Aiyar, Shekar and Ashoka Mody (2011),“The Demographic Dividend: Evidence from the Indian States”,
IMF Working Paper WP/11/38.
ASER (2013), Ninth Annual Status of Education Report (ASER), ASER Centre, New Delhi.
Bloom, D. and D. Canning, (2004), “Global Demographic Change: Dimensions and Economic
Significance”, NBER Working Paper 10817, National Bureau of Economic Research, Cambridge MA.
Chadha, G.K. (2000), “Youth Unemployment in India: Past Policy Gaps and Future Strategic Options”,
The Indian Journal of Labour Economics, Vol. 43, No. 4.
Chandrasekhar, C.P., Jayati Ghosh and A. Roychowdhury (2006), “The Demographic Dividend and
Young India‟s Economic Future”, Economic and Political Weekly, Vol. 41, No.49
Cramer, Christopher (2010), "Unemployment and Participation in Violence", World Development Report
2011 Background Paper, School of Oriental and African Studies, London, 16 November.
Dev, Mahendra S. and Venkatanarayana (2011), “Youth Employment and Unemployment in India”, WP-
2011-009, Indira Gandhi Institute of Development Research (IGIDR), Mumbai.
FICCI (2010), “The Skill Development Landscape in India and Implementing Quality Skills Training”,
Federation of Indian Chambers of Commerce and Industry, New Delhi.
Freidrich Ebert Stiftung (FES) (2012), Youth Agenda for India: A Study, Young Leaders Think Tank,
Friedrich-Ebert -Stiftung, New Delhi.
IAMR (2011), India Human Development Report, Oxford University Press, New Delhi.
Indian Society of Labour Economics (ISLE) (2014),India Labour and Employment Report 2013-Workers
in the Era of Globalisation, Academic Foundation, New Delhi.
India Skills Report (2014) by PeopleStrong, Confederation of Indian Industry (CII) and Wheelbox,
Gurgaon, Haryana.
International Labour Organisation (ILO) 2013),Global Employment Trends for Youth: A Generation at
Risk, Geneva.
IRIS Knowledge Foundation (2013), State of Urban Youth in India, 2012—Employment, Livelihoods,
Skills, IRIS Knowledge Foundation, Mumbai.
Kannan, K.P. (2014), “Interrogating Inclusive Growth”, The Indian Journal of Labour Economics, Vol.
57, No. 1.
Mamgain, Rajendra P. (2010), “Tackling High Level Skills Shortages in India”, Paper prepared for ILO
G20 Meeting of Experts on Skills to Meet Global Challenges, (memeio) International Training Centre-
ILO, Turin, March.
——— (2013),“Situating Scheduled Castes and Scheduled Tribes in the Post-2015 Development
Framework”, Oxfam India Working Papers Series, June, New Delhi.
33
Mathur, Ashok and Rajendra P. Mamgain (2004), “Human Capital Stocks, Their Level of Utilisation and
Economic Development in India”, The Indian Journal of Labour Economics, Vol. 47. No.4.
Mitra, Arup and Sher Verick (2013), “Youth Employment and Unemployment: An Indian Perspective”,
ILO Asia Pacific Working Paper Series, March, New Delhi.
Neff, Daniel ; Kunal Sen and Veronika Kling (2012), " The Puzzling Decline in Rural Women‟s Labour
Force Participation in India: A Reexamination", GIGA Research Unit: Institute of Asian Studies, No. 196,
May.
NSSO (2014), "Employment and Unemployment Situation in India", 68th Round, National Sample
Survey Organisation, New Delhi.
Papola, T.S. and Rajendra P. Mamgain (2012), “Trends in Employment among Marginalised Groups”,
Indian Institute of Dalit Studies, New Delhi (mimeo).
Papola, T.S. and Partha Pratim Sahu (2012),“Growth and Structure of Employment: Long-Term and Post-
Reform Performance and Emerging Challenges”, , Occasional Paper Series, 2012/1, ISID, New Delhi.
Parasuraman, Sulabha, Sunita Kishor, Shri Kant Singh, and Y. Vaidehi (2009),A Profile of Youth in
India,National Family Health Survey (NFHS-3), India, 2005-06, International Institute for Population
Sciences (IIPS), Mumbai.
Planning Commission (2008), “Development Challenges in Extremist-affected Areas”, Report of Expert
Group to the Planning Commission, April.
——— (2011), India Human Development Report 2011—Towards Social Inclusion, Oxford University
Press, New Delhi.
——— (2013), “Faster, Sustainable and More Inclusive Growth”,Twelfth Five Year Plan 2012-2017,
Vol. 1,, Sage Publications, New Delhi.
Rangarajan, C., Padma Iyer Kaul and Seema (2011),“Where Is the Missing Labour Force?”,Economic
and Political Weekly, Vol. XLVI No. 39, 24 September.
Thorat, Sukhadeo and Katherine Newman (2010), Blocked By Caste: Economic Discrimination in
Modern India, Oxford University Press, New Delhi.
World Bank (2013a), “Youth Employment—A Human Development Agenda for the Next Decade”, by
David Robalino, David Margolis, Friederike Rother, David Newhouse and Mattias Lundberg, Social
Protection and Labour, Working Paper No. 1308, Washington D.C, June.
——— (2013b), Inclusion Matters—The Foundation for Shared Prosperity,Washington D.C.
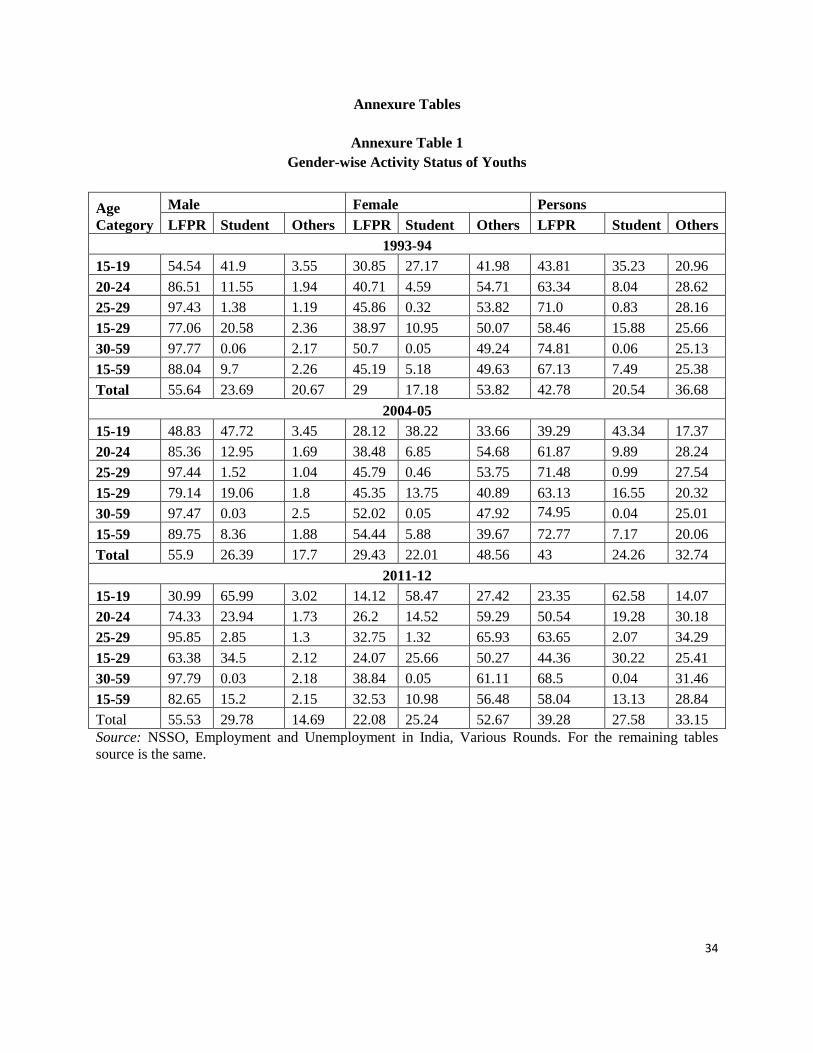
34
Annexure Tables
Annexure Table 1
Gender-wise Activity Status of Youths
Age
Category
Male Female Persons
LFPR Student Others LFPR Student Others LFPR Student Others
1993-94
15-19 54.54 41.9 3.55 30.85 27.17 41.98 43.81 35.23 20.96
20-24 86.51 11.55 1.94 40.71 4.59 54.71 63.34 8.04 28.62
25-29 97.43 1.38 1.19 45.86 0.32 53.82 71.0 0.83 28.16
15-29 77.06 20.58 2.36 38.97 10.95 50.07 58.46 15.88 25.66
30-59 97.77 0.06 2.17 50.7 0.05 49.24 74.81 0.06 25.13
15-59 88.04 9.7 2.26 45.19 5.18 49.63 67.13 7.49 25.38
Total 55.64 23.69 20.67 29 17.18 53.82 42.78 20.54 36.68
2004-05
15-19 48.83 47.72 3.45 28.12 38.22 33.66 39.29 43.34 17.37
20-24 85.36 12.95 1.69 38.48 6.85 54.68 61.87 9.89 28.24
25-29 97.44 1.52 1.04 45.79 0.46 53.75 71.48 0.99 27.54
15-29 79.14 19.06 1.8 45.35 13.75 40.89 63.13 16.55 20.32
30-59 97.47 0.03 2.5 52.02 0.05 47.92 74.95 0.04 25.01
15-59 89.75 8.36 1.88 54.44 5.88 39.67 72.77 7.17 20.06
Total 55.9 26.39 17.7 29.43 22.01 48.56 43 24.26 32.74
2011-12
15-19 30.99 65.99 3.02 14.12 58.47 27.42 23.35 62.58 14.07
20-24 74.33 23.94 1.73 26.2 14.52 59.29 50.54 19.28 30.18
25-29 95.85 2.85 1.3 32.75 1.32 65.93 63.65 2.07 34.29
15-29 63.38 34.5 2.12 24.07 25.66 50.27 44.36 30.22 25.41
30-59 97.79 0.03 2.18 38.84 0.05 61.11 68.5 0.04 31.46
15-59 82.65 15.2 2.15 32.53 10.98 56.48 58.04 13.13 28.84
Total 55.53 29.78 14.69 22.08 25.24 52.67 39.28 27.58 33.15
Source: NSSO, Employment and Unemployment in India, Various Rounds. For the remaining tables
source is the same.
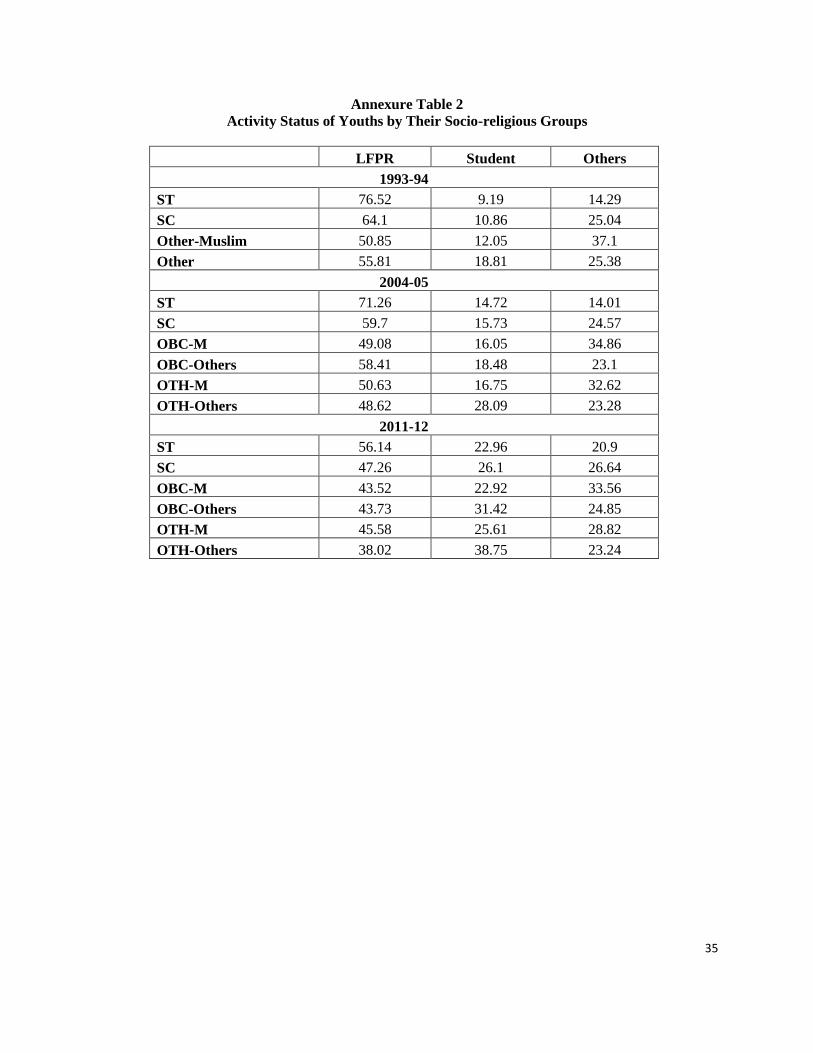
35
Annexure Table 2
Activity Status of Youths by Their Socio-religious Groups
LFPR Student Others
1993-94
ST 76.52 9.19 14.29
SC 64.1 10.86 25.04
Other-Muslim 50.85 12.05 37.1
Other 55.81 18.81 25.38
2004-05
ST 71.26 14.72 14.01
SC 59.7 15.73 24.57
OBC-M 49.08 16.05 34.86
OBC-Others 58.41 18.48 23.1
OTH-M 50.63 16.75 32.62
OTH-Others 48.62 28.09 23.28
2011-12
ST 56.14 22.96 20.9
SC 47.26 26.1 26.64
OBC-M 43.52 22.92 33.56
OBC-Others 43.73 31.42 24.85
OTH-M 45.58 25.61 28.82
OTH-Others 38.02 38.75 23.24
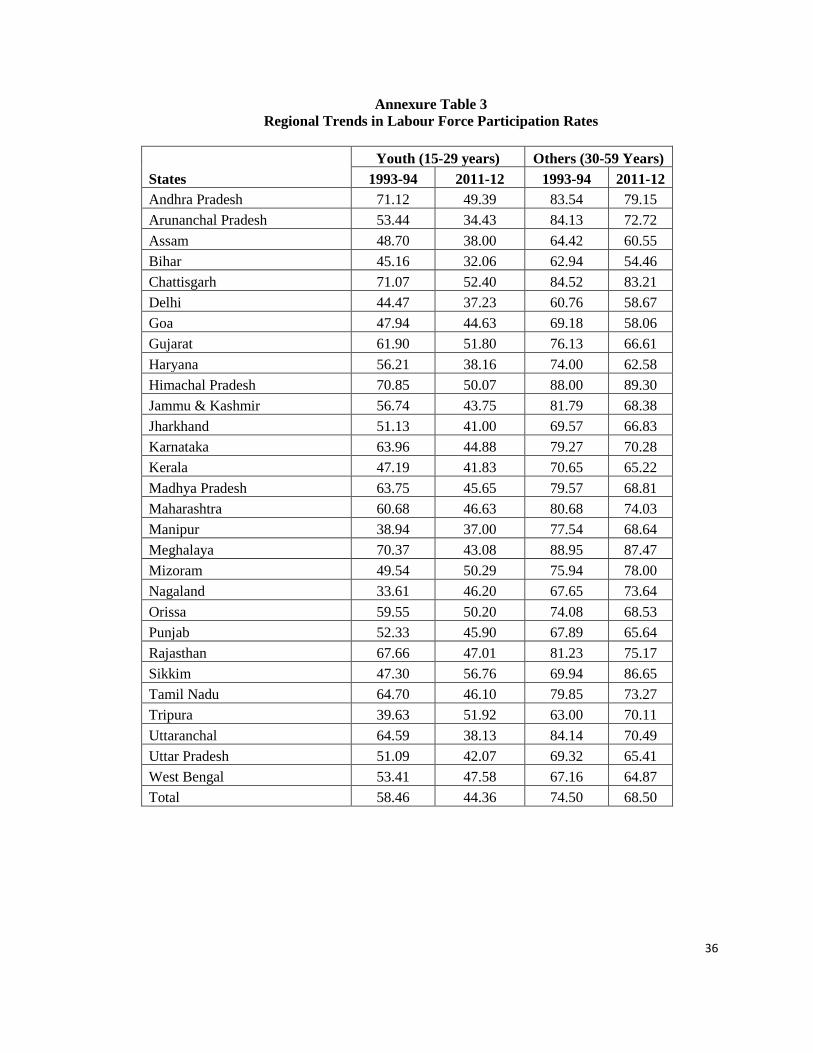
36
Annexure Table 3
Regional Trends in Labour Force Participation Rates
States
Youth (15-29 years) Others (30-59 Years)
1993-94 2011-12 1993-94 2011-12
Andhra Pradesh 71.12 49.39 83.54 79.15
Arunanchal Pradesh 53.44 34.43 84.13 72.72
Assam 48.70 38.00 64.42 60.55
Bihar 45.16 32.06 62.94 54.46
Chattisgarh 71.07 52.40 84.52 83.21
Delhi 44.47 37.23 60.76 58.67
Goa 47.94 44.63 69.18 58.06
Gujarat 61.90 51.80 76.13 66.61
Haryana 56.21 38.16 74.00 62.58
Himachal Pradesh 70.85 50.07 88.00 89.30
Jammu & Kashmir 56.74 43.75 81.79 68.38
Jharkhand 51.13 41.00 69.57 66.83
Karnataka 63.96 44.88 79.27 70.28
Kerala 47.19 41.83 70.65 65.22
Madhya Pradesh 63.75 45.65 79.57 68.81
Maharashtra 60.68 46.63 80.68 74.03
Manipur 38.94 37.00 77.54 68.64
Meghalaya 70.37 43.08 88.95 87.47
Mizoram 49.54 50.29 75.94 78.00
Nagaland 33.61 46.20 67.65 73.64
Orissa 59.55 50.20 74.08 68.53
Punjab 52.33 45.90 67.89 65.64
Rajasthan 67.66 47.01 81.23 75.17
Sikkim 47.30 56.76 69.94 86.65
Tamil Nadu 64.70 46.10 79.85 73.27
Tripura 39.63 51.92 63.00 70.11
Uttaranchal 64.59 38.13 84.14 70.49
Uttar Pradesh 51.09 42.07 69.32 65.41
West Bengal 53.41 47.58 67.16 64.87
Total 58.46 44.36 74.50 68.50
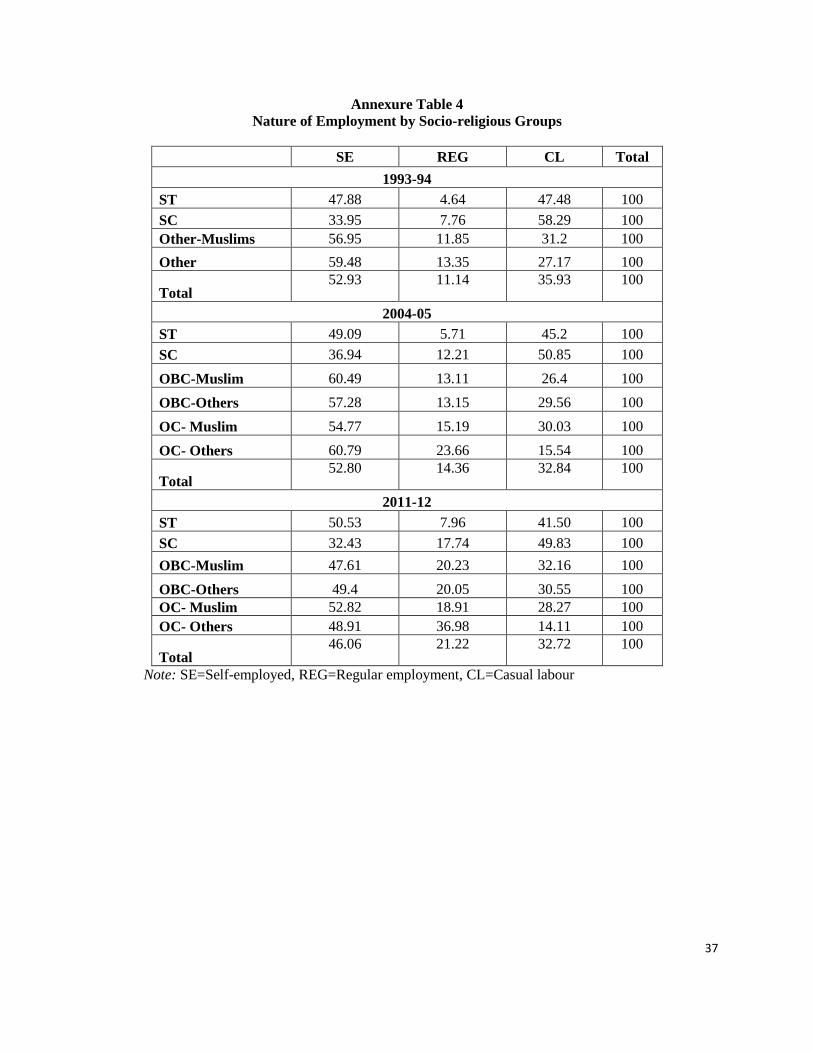
37
Annexure Table 4
Nature of Employment by Socio-religious Groups
SE REG CL Total
1993-94
ST 47.88 4.64 47.48 100
SC 33.95 7.76 58.29 100
Other-Muslims 56.95 11.85 31.2 100
Other 59.48 13.35 27.17 100
Total 52.93 11.14 35.93 100
2004-05
ST 49.09 5.71 45.2 100
SC 36.94 12.21 50.85 100
OBC-Muslim 60.49 13.11 26.4 100
OBC-Others 57.28 13.15 29.56 100
OC- Muslim 54.77 15.19 30.03 100
OC- Others 60.79 23.66 15.54 100
Total 52.80 14.36 32.84 100
2011-12
ST 50.53 7.96 41.50 100
SC 32.43 17.74 49.83 100
OBC-Muslim 47.61 20.23 32.16 100
OBC-Others 49.4 20.05 30.55 100
OC- Muslim 52.82 18.91 28.27 100
OC- Others 48.91 36.98 14.11 100
Total 46.06 21.22 32.72 100
Note: SE=Self-employed, REG=Regular employment, CL=Casual labour

38
Annexure Table 5
Nature of Youth Employment across States
State 1993-94 2011-12
SE REG CASUAL SE REG CASUAL
Andhra Pradesh 42.25 9.73 48.02 36.90 22.46 40.64
Arunanchal Pradesh 79.63 15.84 4.53 76.61 13.05 10.34
Assam 57.25 11.95 30.79 64.20 12.20 23.61
Bihar 48.37 3.27 48.36 49.25 4.32 46.43
Chhattisgarh 58.33 4.36 37.31 47.79 10.29 41.92
Delhi 38.87 46.66 14.47 23.03 72.75 4.22
Goa 30.90 37.02 32.08 12.20 71.32 16.49
Gujarat 43.89 13.46 42.65 40.79 34.71 24.50
Haryana 59.70 13.64 26.67 45.49 32.36 22.15
Himachal Pradesh 83.53 7.02 9.45 67.27 18.20 14.54
Jammu & Kashmir 77.78 12.63 9.59 57.36 20.03 22.61
Jharkhand 58.89 5.05 36.06 58.85 7.71 33.43
Karnataka 51.35 11.31 37.35 38.63 30.50 30.87
Kerala 35.88 15.00 49.12 21.80 34.74 43.46
Madhya Pradesh 57.59 7.12 35.29 52.57 10.44 36.99
Maharashtra 42.86 19.60 37.53 39.80 32.55 27.65
Manipur 85.81 9.06 5.13 63.72 9.68 26.60
Meghalaya 77.33 7.69 14.98 62.05 15.33 22.63
Mizoram 84.22 11.98 3.81 73.41 11.62 14.96
Nagaland 77.69 18.63 3.68 88.08 7.17 4.75
Orissa 52.32 7.20 40.48 58.81 11.01 30.18
Punjab 55.23 18.25 26.51 43.42 32.96 23.62
Rajasthan 71.17 8.79 20.04 55.92 14.49 29.59
Sikkim 51.52 26.46 22.02 72.78 22.55 4.66
Tamil Nadu 35.45 17.90 46.65 22.96 38.34 38.70
Tripura 47.38 11.61 41.01 38.94 16.04 45.02
Uttaranchal 83.65 6.36 9.99 62.10 24.36 13.54
Uttar Pradesh 70.56 6.58 22.86 57.04 11.51 31.45
West Bengal 50.64 12.90 36.46 41.14 17.46 41.40
Total 53.05 11.47 35.48 46.06 21.22 32.72
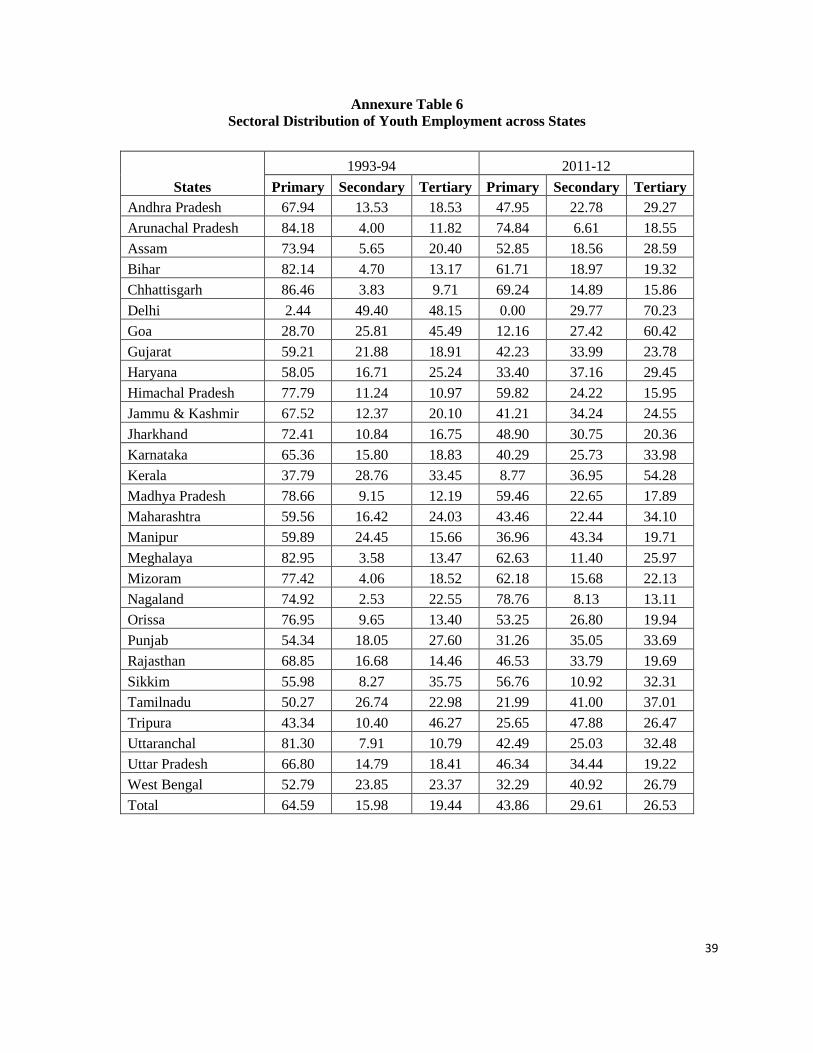
39
Annexure Table 6
Sectoral Distribution of Youth Employment across States
States
1993-94 2011-12
Primary Secondary Tertiary Primary Secondary Tertiary
Andhra Pradesh 67.94 13.53 18.53 47.95 22.78 29.27
Arunachal Pradesh 84.18 4.00 11.82 74.84 6.61 18.55
Assam 73.94 5.65 20.40 52.85 18.56 28.59
Bihar 82.14 4.70 13.17 61.71 18.97 19.32
Chhattisgarh 86.46 3.83 9.71 69.24 14.89 15.86
Delhi 2.44 49.40 48.15 0.00 29.77 70.23
Goa 28.70 25.81 45.49 12.16 27.42 60.42
Gujarat 59.21 21.88 18.91 42.23 33.99 23.78
Haryana 58.05 16.71 25.24 33.40 37.16 29.45
Himachal Pradesh 77.79 11.24 10.97 59.82 24.22 15.95
Jammu & Kashmir 67.52 12.37 20.10 41.21 34.24 24.55
Jharkhand 72.41 10.84 16.75 48.90 30.75 20.36
Karnataka 65.36 15.80 18.83 40.29 25.73 33.98
Kerala 37.79 28.76 33.45 8.77 36.95 54.28
Madhya Pradesh 78.66 9.15 12.19 59.46 22.65 17.89
Maharashtra 59.56 16.42 24.03 43.46 22.44 34.10
Manipur 59.89 24.45 15.66 36.96 43.34 19.71
Meghalaya 82.95 3.58 13.47 62.63 11.40 25.97
Mizoram 77.42 4.06 18.52 62.18 15.68 22.13
Nagaland 74.92 2.53 22.55 78.76 8.13 13.11
Orissa 76.95 9.65 13.40 53.25 26.80 19.94
Punjab 54.34 18.05 27.60 31.26 35.05 33.69
Rajasthan 68.85 16.68 14.46 46.53 33.79 19.69
Sikkim 55.98 8.27 35.75 56.76 10.92 32.31
Tamilnadu 50.27 26.74 22.98 21.99 41.00 37.01
Tripura 43.34 10.40 46.27 25.65 47.88 26.47
Uttaranchal 81.30 7.91 10.79 42.49 25.03 32.48
Uttar Pradesh 66.80 14.79 18.41 46.34 34.44 19.22
West Bengal 52.79 23.85 23.37 32.29 40.92 26.79
Total 64.59 15.98 19.44 43.86 29.61 26.53
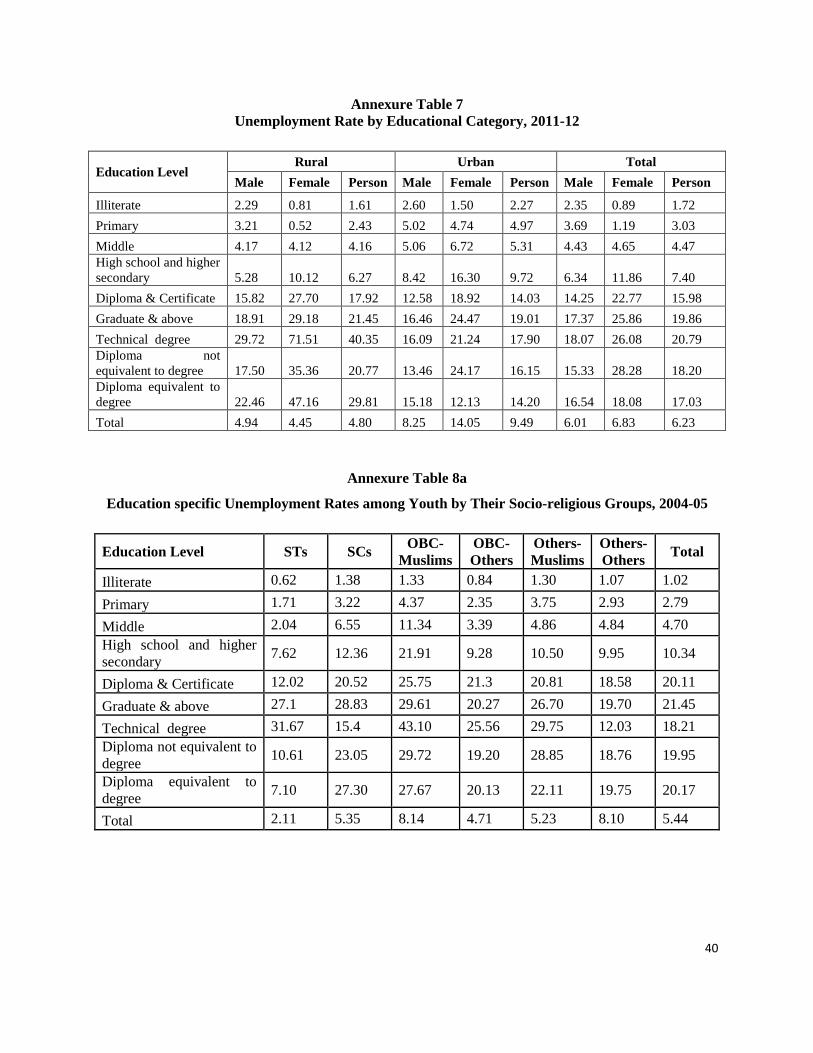
40
Annexure Table 7
Unemployment Rate by Educational Category, 2011-12
Education Level Rural Urban Total
Male Female Person Male Female Person Male Female Person
Illiterate 2.29 0.81 1.61 2.60 1.50 2.27 2.35 0.89 1.72
Primary 3.21 0.52 2.43 5.02 4.74 4.97 3.69 1.19 3.03
Middle 4.17 4.12 4.16 5.06 6.72 5.31 4.43 4.65 4.47
High school and higher
secondary 5.28 10.12 6.27 8.42 16.30 9.72 6.34 11.86 7.40
Diploma & Certificate 15.82 27.70 17.92 12.58 18.92 14.03 14.25 22.77 15.98
Graduate & above 18.91 29.18 21.45 16.46 24.47 19.01 17.37 25.86 19.86
Technical degree 29.72 71.51 40.35 16.09 21.24 17.90 18.07 26.08 20.79
Diploma not
equivalent to degree 17.50 35.36 20.77 13.46 24.17 16.15 15.33 28.28 18.20
Diploma equivalent to
degree 22.46 47.16 29.81 15.18 12.13 14.20 16.54 18.08 17.03
Total 4.94 4.45 4.80 8.25 14.05 9.49 6.01 6.83 6.23
Annexure Table 8a
Education specific Unemployment Rates among Youth by Their Socio-religious Groups, 2004-05
Education Level STs SCs OBC-
Muslims
OBC-
Others
Others-
Muslims
Others-
Others Total
Illiterate 0.62 1.38 1.33 0.84 1.30 1.07 1.02
Primary 1.71 3.22 4.37 2.35 3.75 2.93 2.79
Middle 2.04 6.55 11.34 3.39 4.86 4.84 4.70
High school and higher
secondary 7.62 12.36 21.91 9.28 10.50 9.95 10.34
Diploma & Certificate 12.02 20.52 25.75 21.3 20.81 18.58 20.11
Graduate & above 27.1 28.83 29.61 20.27 26.70 19.70 21.45
Technical degree 31.67 15.4 43.10 25.56 29.75 12.03 18.21
Diploma not equivalent to
degree 10.61 23.05 29.72 19.20 28.85 18.76 19.95
Diploma equivalent to
degree 7.10 27.30 27.67 20.13 22.11 19.75 20.17
Total 2.11 5.35 8.14 4.71 5.23 8.10 5.44
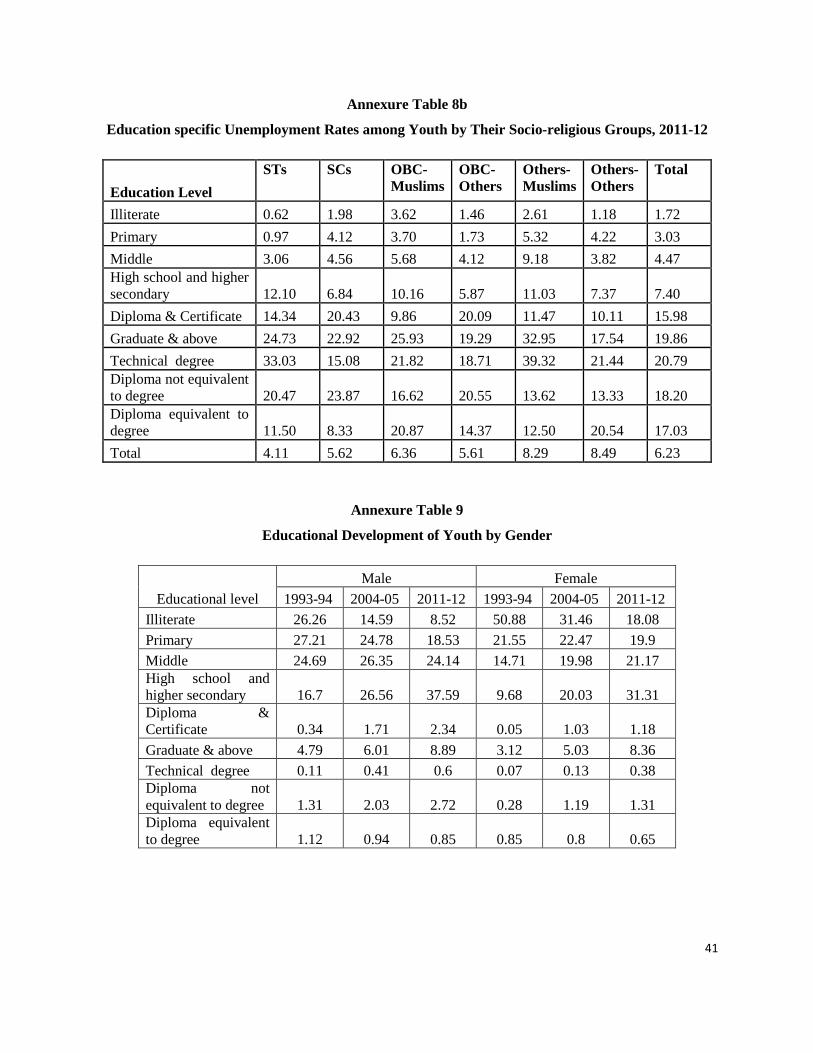
41
Annexure Table 8b
Education specific Unemployment Rates among Youth by Their Socio-religious Groups, 2011-12
Education Level
STs SCs OBC-
Muslims
OBC-
Others
Others-
Muslims
Others-
Others
Total
Illiterate 0.62 1.98 3.62 1.46 2.61 1.18 1.72
Primary 0.97 4.12 3.70 1.73 5.32 4.22 3.03
Middle 3.06 4.56 5.68 4.12 9.18 3.82 4.47
High school and higher
secondary 12.10 6.84 10.16 5.87 11.03 7.37 7.40
Diploma & Certificate 14.34 20.43 9.86 20.09 11.47 10.11 15.98
Graduate & above 24.73 22.92 25.93 19.29 32.95 17.54 19.86
Technical degree 33.03 15.08 21.82 18.71 39.32 21.44 20.79
Diploma not equivalent
to degree 20.47 23.87 16.62 20.55 13.62 13.33 18.20
Diploma equivalent to
degree 11.50 8.33 20.87 14.37 12.50 20.54 17.03
Total 4.11 5.62 6.36 5.61 8.29 8.49 6.23
Annexure Table 9
Educational Development of Youth by Gender
Educational level
Male Female
1993-94 2004-05 2011-12 1993-94 2004-05 2011-12
Illiterate 26.26 14.59 8.52 50.88 31.46 18.08
Primary 27.21 24.78 18.53 21.55 22.47 19.9
Middle 24.69 26.35 24.14 14.71 19.98 21.17
High school and
higher secondary 16.7 26.56 37.59 9.68 20.03 31.31
Diploma &
Certificate 0.34 1.71 2.34 0.05 1.03 1.18
Graduate & above 4.79 6.01 8.89 3.12 5.03 8.36
Technical degree 0.11 0.41 0.6 0.07 0.13 0.38
Diploma not
equivalent to degree 1.31 2.03 2.72 0.28 1.19 1.31
Diploma equivalent
to degree 1.12 0.94 0.85 0.85 0.8 0.65