Embed Size (px)
Citation preview

Z O D I A C 1

2 Z O D I A C


Z O D I A C 5
ZODIAC CLOTHING COMPANY LTD. 29th ANNUAL REPORT 2012-2013

Z O D I A C 7
C O N T E N T S
Page
Board of Directors 08
Directors’ Biographies 10
Chairman’s Statement 12
Directors’ Report 18
Annexure to Directors’ Report 23
Report on Corporate Governance 25
Management Discussion & Analysis 44
Independent Auditors’ Report 55
Annexure to the Independent Auditors’ Report 56
Balance Sheet 58
Statement of Profit & Loss 59
Cash Flow Statement 60
Notes Forming Part of Financial Statements 61
Consolidated Group Accounts with Auditors’ Report 97
8 Z O D I A C
B O A R D O F D I R E C T O R S
Mr. M. Y. Noorani Chairman
Dr. S. Abid Hussain (01.02.1994 to 21.06.2012)
Mr. M. L. Apte
Mr. Bernhard Steinruecke
Mr. S. M. Datta
Dr. Heinrich D. Dieckmann
Mr. Deepak Parekh (Alternate Director to Dr. Heinrich D. Dieckmann)
Mr. S. R. Iyer
Mr. Y. P. Trivedi
Mr. A. Y. Noorani Vice Chairman & Managing Director
Mr. S. Y. Noorani Managing Director & President
Z O D I A C 9
REGISTERED OFFICE
Nyloc House, 254, D-2, Dr. Annie Besant Road, Worli, Mumbai - 400 030.Tel. : 022-66677000Fax : 022-66677279
COMPANY SECRETARY
Mr. Omprakash Singh
STATUTORY AUDITORSDeloitte Haskins & SellsChartered AccountantsTower 3, 27th - 32nd Floor,India Bulls Finance Centre,Elphinstone Mills Compound,Senapati Bapat Marg,Elphinstone (W)Mumbai - 400 013.
FACTORIES
• Yelahanka, Bangalore - 560 063.
• Whitefield Road, Bangalore - 560 048.
• Koramangala, Bangalore - 560 095.
• Bommasandra, Bangalore - 560 099.
• A-1, 181/1, GIDC, Umbergaon, Valsad, Gujarat - 396 171
• C-2/7, GIDC Industrial Area, Umbergaon, Valsad, Gujarat - 396 171
• Plot No. 411, GIDC, Umbergaon, Valsad, Gujarat - 396 171
• Shed No. A/2/507, GIDC Industrial Area, Umbergaon, Valsad, Gujarat - 396 171
• A to Z Industrial Premises Co-op. Soc. Ltd., Lower Parel, Mumbai - 400 013
SOLICITORS
M/s. A.H. Parpia & Co. 203/204 Prabhat House, 2nd Floor, 92, S.V. Road, Khar (W), Mumbai - 400 052
M/s. Kanga & Co. Readymoney Mansion, 43, Veer Nariman Road, Mumbai - 400 001.
REGISTRAR & TRANSFER AGENTS OFFICE
Karvy Computershare Pvt. Ltd. Karvy House, 46, Avenue 4, Street No. 1, Banjara Hills, Hyderabad - 500 034.
BANKERS
Citi Bank N.A. Citi Bank Centre, Bandra-Kurla Complex, Bandra (East), Mumbai - 400 051.
The Royal Bank of Scotland N.V. 74, Sakhar Bhavan, Nariman Point, Mumbai - 400 021.
HDFC Bank Limited Trade World, A Wing, Kamala Mills Compound, Lower Parel, Mumbai - 400 013.
First Rand Bank TCG Financial Centre, 5th Floor, C-53, G Block, Bandra-Kurla Complex, Bandra (E), Mumbai - 400 051.
SUBSIDIARIES
• Zodiac Finsec and Holdings Ltd. (erstwhile Multiplex Collapsible Tubes Limited)• Zodiac Clothing Co. S.A. (Switzerland)• Zodiac Clothing Company (UAE) LLC• Zodiac Clothing Company Inc.• Zodiac Properties Limited
10 Z O D I A C
DIRECTORS’ BIOGRAPHIES
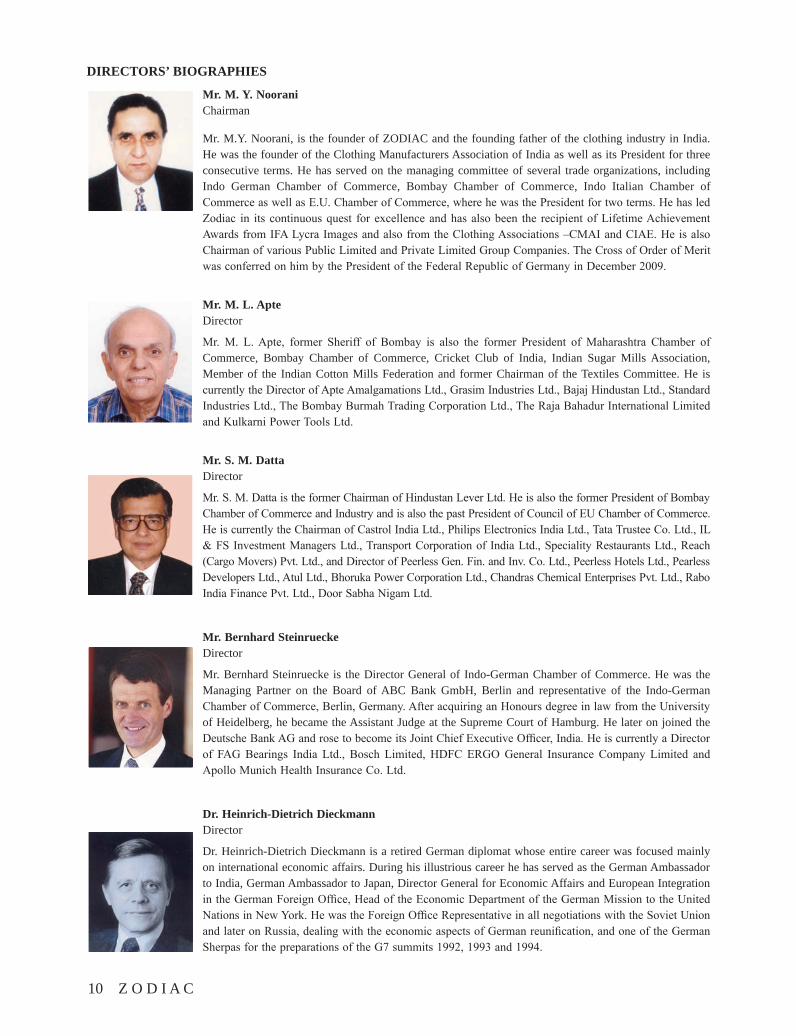
Mr. M. Y. Noorani Chairman
Mr. M.Y. Noorani, is the founder of ZODIAC and the founding father of the clothing industry in India. He was the founder of the Clothing Manufacturers Association of India as well as its President for three consecutive terms. He has served on the managing committee of several trade organizations, including Indo German Chamber of Commerce, Bombay Chamber of Commerce, Indo Italian Chamber of Commerce as well as E.U. Chamber of Commerce, where he was the President for two terms. He has led Zodiac in its continuous quest for excellence and has also been the recipient of Lifetime Achievement Awards from IFA Lycra Images and also from the Clothing Associations –CMAI and CIAE. He is also Chairman of various Public Limited and Private Limited Group Companies. The Cross of Order of Merit was conferred on him by the President of the Federal Republic of Germany in December 2009.
Mr. M. L. Apte Director
Mr. M. L. Apte, former Sheriff of Bombay is also the former President of Maharashtra Chamber of Commerce, Bombay Chamber of Commerce, Cricket Club of India, Indian Sugar Mills Association, Member of the Indian Cotton Mills Federation and former Chairman of the Textiles Committee. He is currently the Director of Apte Amalgamations Ltd., Grasim Industries Ltd., Bajaj Hindustan Ltd., Standard Industries Ltd., The Bombay Burmah Trading Corporation Ltd., The Raja Bahadur International Limited and Kulkarni Power Tools Ltd.
Mr. S. M. Datta Director
Mr. S. M. Datta is the former Chairman of Hindustan Lever Ltd. He is also the former President of Bombay Chamber of Commerce and Industry and is also the past President of Council of EU Chamber of Commerce. He is currently the Chairman of Castrol India Ltd., Philips Electronics India Ltd., Tata Trustee Co. Ltd., IL & FS Investment Managers Ltd., Transport Corporation of India Ltd., Speciality Restaurants Ltd., Reach (Cargo Movers) Pvt. Ltd., and Director of Peerless Gen. Fin. and Inv. Co. Ltd., Peerless Hotels Ltd., Pearless Developers Ltd., Atul Ltd., Bhoruka Power Corporation Ltd., Chandras Chemical Enterprises Pvt. Ltd., Rabo India Finance Pvt. Ltd., Door Sabha Nigam Ltd.
Mr. Bernhard Steinruecke Director
Mr. Bernhard Steinruecke is the Director General of Indo-German Chamber of Commerce. He was the Managing Partner on the Board of ABC Bank GmbH, Berlin and representative of the Indo-German Chamber of Commerce, Berlin, Germany. After acquiring an Honours degree in law from the University of Heidelberg, he became the Assistant Judge at the Supreme Court of Hamburg. He later on joined the Deutsche Bank AG and rose to become its Joint Chief Executive Officer, India. He is currently a Director of FAG Bearings India Ltd., Bosch Limited, HDFC ERGO General Insurance Company Limited and Apollo Munich Health Insurance Co. Ltd.
Dr. Heinrich-Dietrich Dieckmann Director
Dr. Heinrich-Dietrich Dieckmann is a retired German diplomat whose entire career was focused mainly on international economic affairs. During his illustrious career he has served as the German Ambassador to India, German Ambassador to Japan, Director General for Economic Affairs and European Integration in the German Foreign Office, Head of the Economic Department of the German Mission to the United Nations in New York. He was the Foreign Office Representative in all negotiations with the Soviet Union and later on Russia, dealing with the economic aspects of German reunification, and one of the German Sherpas for the preparations of the G7 summits 1992, 1993 and 1994.
Z O D I A C 11
Mr. Deepak Parekh DirectorMr. Deepak Parekh (Padma Bhushan, 2006) is a Fellow of the Institute of Chartered Accountants (England and Wales). He is the Chairman of Housing Development Finance Corporation Ltd., Infrastructure Development & Finance Co. Ltd., Glaxo Smithkline Pharmaceuticals Ltd., Siemens Ltd., HDFC Asset Management Co. Ltd., HDFC ERGO General Insurance Co.Ltd., HDFC Standard Life Insurance Co. Limited. He is a Director of Mahindra and Mahindra Ltd. and The Indian Hotels Co. Limited and DP World He is an Alternate Director of Exide Industries Limited. He has been a member of several Committees set up by the Government of India, especially in the field of Finance and Capital Markets, the recent one being the Investment Commission Committee. Mr. Parekh has won several accolades and awards. He was the youngest recipient of the ‘Corporate Award for Life Time Achievement’, from the Economic Times. He was awarded the ‘Businessman of the Year – 1996’ by Business India, and the ‘JRD Tata Corporate Leadership Award’ from the All-India Management Association. He was the first recipient of the ‘Qimpro Platinum Award’ for Quality for his contributions to the services sector. He is the first international recipient of the Institute of Chartered Accountants in England and Wales Outstanding Achievements award 2010.
Mr. Y. P. Trivedi DirectorMr. Y. P. Trivedi a member of Rajya Sabha, is the former President of Indian Merchants Chamber, The Chamber of Income Tax Consultants, Indo-African Chamber of Commerce, a member of the Managing Committee of Indian Merchants’ Chamber. He is currently the Chairman of Sai Service Station Ltd. and Trivedi Consultants Pvt. Ltd., and also a Director of Reliance Industries Ltd., Metro Exporters Pvt. Ltd., Supreme Industries Ltd., Seksaria Biswan Sugar Factory Limited, New Consolidated Construction Co. Ltd., Emami Limited. Mr. Trivedi has also served as a Director of Central Bank of India, Dena Bank and Central Bank Executors and Trustee Company Ltd.
Mr. S. R. Iyer DirectorMr. S.R. Iyer retired as Managing Director of the State Bank of India. He is the former Chairman and Director of the Credit Information Bureau (India) Limited. He was also the Managing Director of State Bank of Mysore, Director of the National Stock Exchange of India Ltd. and GE Capital Business Process Management Services Pvt. Ltd. He has vast knowledge and rich experience in banking. He is presently Chairman of Can Fin Homes Limited and Writer Relocasia, Hong Kong and Director of KSK Energy Ventures Ltd., KSK Power Venture Plc. Isle of Man, P.N. Writer & Co. Pvt. Ltd., Writer Lifestyle P.Ltd, Writer Safeguard P.Ltd., IDMC Limited, Kannada Prabha Publications Ltd., Wardha Power Company Limited, KSK Mahanadi Power Company Limited and Water Field Advisors Pvt. Ltd.
Mr. A. Y. Noorani Vice-Chairman & Managing DirectorMr. A.Y. Noorani joined the House of Zodiac in 1968 and after successfully developing its export business and scaling up its overall operations, became Managing Director of the organisation in 1980. He completed the Advance Management Programme at Harvard Business School, Boston, and is responsible for overseeing the management of the organisation, corporate affairs and finance. Mr. Noorani is Past President of the Indo-German Chamber of Commerce and is presently on the Managing Committee of the Chamber and a member of the Indo-German Consultative Group. He was a member of the Managing Committee of the Apparel Export Promotion Council, the Bombay Chamber of Commerce & Industry, the Clothing Manufacturers’ Association of India, member of the Board of Governors of the National Institute of Fashion Technology and member of the Steering Group on Investment and Growth in the Textile Industry. He is director of Public Limited and Private Limited companies of the House of Zodiac. He was also Director of Indian Oil Corporation until 14th September, 2012.
Mr. S. Y. Noorani Managing Director & President
Mr. S. Y. Noorani joined the House of ZODIAC in 1982. He is responsible for setting up the company’s state-of-the-art of manufacturing facilities and international marketing operations in London, Dusseldorf and New York. He leads a dynamic team of professionals in the running of the organization ranging from design and manufacturing to sales and marketing which has successfully launched the brand ZOD! and Z3 in the Indian market. Mr. S. Y. Noorani has also served on the Managing Committees of Indo- Italian Chamber of Commerce as well as CMAI. He is a member of the Regional Council of CII [Western Region].
12 Z O D I A C
CHAIRMAN'S STATEMENT
The export of clothing from India (all fibres) declined during the financial year 2013 to USD 12.7 bn from USD 13.4 bn in the previous year, a decline of 5.5% in USD terms. However, in Rupee terms, the total exports were ` 69,000 crore vs. ` 64,341 crore the previous year, an increase of approximately 7% due to INR depreciation.
The company's design-driven international business has been most challenging due to the economic situation in the EU, the UK and the US. It was further de-stabilised by the sharp forex fluctuation. The Rupee depreciation has been neutralised greatly, due to pressure from customers to lower USD prices, and by stubborn inflation. The company has met with some success in increasing its business in its hitherto smaller markets, as well as entering some new markets, which show early promise.
With the economic problems faced by the Euro Zone continuing, the serious decline in demand is of concern. In a futile attempt to induce volume growth, the retail prices offered to end consumers in the EU for like-to-like products (albeit of lower quality) have been reduced considerably, despite the brands and retailers enjoying healthier margins.
The demand situation in the US, although somewhat better than in the EU, continues to be weak. Consumer behaviour, prices and margins mirrored that of the EU.
The margins have been made possible by exploiting the situation in Bangladesh and other countries who also have the benefit of lower tariffs, besides Government subsidies, as well as the enviable co-operation between Government and industry in these countries.
Despite Bangladesh enjoying preferential tariffs of “zero” duty in the EU, wages paid to the workers have been abysmally low, i.e. the equivalent of ` 2,000/- per month, for much longer working hours than those permitted in law-abiding countries like India, with human rights violations, non-enforcement of already-weak labour laws; working conditions there are hazardous, resulting in several widely-reported industrial accidents, one of which resulted in as many casualties as the Bhopal disaster. Will the uproar generated globally endure? Consumer polls in the US and some European countries show a significant number of consumers there are checking the “country of origin” labels on clothing and refusing to buy Bangladeshi origin.
The situation vis-a-vis competition is that China has had to perforce divert production of clothing for export because of its demographics, rising labour costs propelling available labour away from labour-intensive industries like clothing to higher value added industries – besides, China is also making a conscious effort to increase consumer demand within China, resulting in some production being diverted for consumption within China. However, they have diversified significant portions of their export production base offshore, to countries like Bangladesh, Myanmar, Vietnam and Cambodia.
The design-driven international business, notwithstanding lower volumes, increase in fabric prices during the second half of the year and higher depreciation, has remained profitable.
There was a 10% increase in prices of cotton fabrics produced in India, in the second half. International fabric
Z O D I A C 13
prices also, in Rupee terms, have been higher due to sharp depreciation of the Rupee. This has impacted profit margins, which have been exacerbated because of other factors as well. Notwithstanding this, as well as lower volumes, this business remained profitable.
During the financial year 2012-13, the Company reported Standalone gross operational revenues of ` 31,584 lakhs against ` 31,595 lakhs the previous year. The Standalone net profit, after tax, was ` 1,106 lakhs for the year, compared to ` 1,098 lakhs in 2011-12.
The FTA with the EU which has been under discussion since 2007, has been in the final stages with just a few products continuing to be discussed, for nearly a year. There is also discussion on IPR, resulting from Indian Court judgements, which have adversely impacted the sentiment of large Pharma companies. Agreement has also to be reached in declaring India “Data Secure”.
Should the FTA be signed before elections in Germany and India, it would enable India to increase their exports to the EU, despite the weak market, and also to regain some of the market share lost to Bangladesh in the past.
Consumer demand for branded clothing in India has fluctuated widely - the first two quarters were extremely difficult, the third quarter fluctuated from month to month, showing substantial growth in December. The last quarter showed tepid growth, with the year ending with marginal increase in sales, resulting from negative sentiment generated by adverse economic, social and political developments. As a result, our competitors held large inventories which required them to discount and/or allow terms like consignment basis or stock correction, which in turn, undermined their brands, though they were able to show slightly higher growth. The consumer has the spending power – but the consistent barrage of negative developments result in the sentiment swinging from positive to negative. When the economy resumes its growth trajectory, which is when the demographic dividend would also kick-in by the addition of new consumers, is when the Indian market will reach the inflection point.
The industry has been excluded from the purview of Excise from March 2013. The benefit for the Branded segment will become evident in terms of volume growth over time. The export segment is greatly benefited, because they have been spared the cost and onerous job
of coping (without the simplified procedure) with the compliance of Excise formalities needlessly.
The Company's own retail business grew in double digits, with like-to-like stores registering a growth of just under 10%. The share of pie of own retail has grown 10%. Given the market scenario, and the fact that the company does not discount or offer soft terms on Zodiac, Z3 as well as ZOD!, this is no mean achievement. This has also made up the for the weak sales through the independent retailers' channel, as well as the national chains, because of which the total branded business grew marginally.
The brands continue to strengthen because of non-discounting and not offering easy terms and because of the continuing focus on value added innovations and the constant pursuit of high quality, which resulted in the company's product extensions like suits continuing to gain ground.
The company's focus remains on growing the branded business with conservative aggressiveness across all channels (independents, national chains, own retail) with own retail continuing to be an extreme focus area, notwithstanding the current situation.
This year the company opened 11 new stores and closed down 10 non-viable stores, a net increase of 1 store, taking the total of company stores to 105 as of 31st March 2013.
It is very heartening that the Standalone EBIDTA margin has reversed direction and has increased from 7% to approximately 9% during the year. The Standalone PBT also has increased by 14%, which is heartening, given the market situation. Cost reduction/control (despite increase in rentals in pursuance of the focus on own retail) and proviso for discarded assets of the non-viable stores closed during the year) has contributed to this. The company will strive to improve further on this with improvement in sentiment in our markets
The PAT has not grown pro-rata because of high provision for deferred taxes, arising from higher depreciation.
The company's subsidiary in the UAE did not perform as well as in the past, although it continues to be profitable. This was attributable to the market situation in the Middle East (besides the EU and the US) being what it has been, which affected the top line of the company.
14 Z O D I A C
Besides, the strength of the Dollar (with which the UAE Dirham is pegged) not only eroded competitiveness, and therefore sales, but also had a negative impact on profitability.
The Company looks forward to overcoming this negative phase of the business cycle in this subsidiary at the earliest.
As you know, one has aspired long for Government and the industry to work as a team in complete unison to achieve maximum competitive advantage for the nation. The industry looks to the Government to take the lead role in (a) fast track negotiation of favourable Trade Agreements (especially concretising EU before elections in India/Germany); (b) helping eliminate the “export” of India's taxes by virtue of an efficient mechanism to fully insulate and reimburse taxes of any type with a delivery system that eliminates delays; (c) minor tweaking of labour laws; (d) encouraging the export segment of the industry to diversify into the Indian market as well to enable them to build themselves into truly strong globally competitive players/brands; (e) encouraging building of “Brand India”, besides innovation and product development.
One also looks to the Government to review the Advance Licence /EODC system, which belong to a different era. In the past, several items of textiles were not permitted to be imported, and those that were, attracted rates of duty, which were much higher than they are today. Most of our competitor countries have a system where data is maintained of the value of fabric imported duty free and value of total clothing exports, with a separate reconciliation in value terms of exports (without claiming of Drawback) against duty free imports, which is submitted to the authorities periodically, and compulsorily squared up at the end of each financial year. The export obligation discharge certification is an extremely painful and time-consuming process, which requires an entire department working full time only on fulfilling this onerous/unproductive task.
A simple method, as is followed in competitor countries, is the need of the hour.
The Government has, consequent to the changes in the budget, re-constituted a high-powered Committee for reviewing the rate of duty drawback. The industry awaits the decision of this Committee with great anticipation as
a step forward in combating the “export” of India's taxes.
The above steps would result in helping achieve higher unit realisation in some cases, and reduction in cost in all cases. They would sharpen India's competitiveness considerably and enable us to gain substantial market share in new markets, as also in recapturing lost market share in the EU and the US when their economies stabilise – the US is already showing signs of improvement.
This is one industry which can definitely address the most serious problem the country is facing, i.e. the Current Account Deficit, besides creating gender-sensitive employment, in compliance with prevalent Laws of the Land.
Looking back, one can only say that the year has been one of hitherto unseen volatility. Renowned Economists have opined that this decade could be a “Decade of Volatility” - the effort, therefore, has to be to see to what extent our competitive strengths can be leveraged to convert this volatility into opportunity.
Of the 8,64,000 (including bonus entitlement) stock options granted to employees of the company and its subsidiaries/Directors of the company (other than Promoter Directors or their relatives) which has been duly approved by the shareholders at the Annual General Meeting held on 31st August, 2006, the company allotted 119,700 shares (including the bonus entitlement thereon) on receipt of valid applications along with the necessary application money during the year. The paid-up share capital of the company as on 31st March 2013, increased from ` 19,27,02,980/- to ` 19,38,99,980/-.
The Board had declared an interim dividend of ` 1.50 during the year 2012-2013. Considering the profitability of the company during the year, as well as to be in line with best practices vis-à-vis dividend pay out ratio, your Directors are pleased to declare a final dividend of ` 2/- per equity share of the face value of ` 10/- on the enhanced paid-up capital of ` 19,38,99,980/-.
ICRA (an associate of Moody’s Investor Service) has yet again reaffirmed the Company’s rating of A1+ for its short-term fund based/non fund based facilities, of ` 70 crores, for the financial year 2013-14. (Within the A1 category, which is ICRA’s highest quality rating denoting
Z O D I A C 15
lowest credit risk in the short term, certain instruments are assigned A1+ rating denoting their stronger credit quality).
Zodiac Properties Limited (the SPV for the property for the UK operations) had gainfully employed the residential floor by leasing that portion. The UK operations have been moved into the refurbished office portion, which is generating additional rental income from 1st January, 2013.
I sincerely thank all our stakeholders – our shareholders, customers, the Government, banks, solicitors, distributors, suppliers and other business associates – all of whom have supported and helped the company in achieving the results it has in this volatile period.
My grateful thanks to our eminent Board of Directors
for their valuable guidance and advice, which have steered the company’s progress and profitability over the decades, and helped sustain highest standards of Corporate Governance.
My deepest appreciation and thanks to our employees at all levels for their excellent performance, strong work ethic, teamwork, solidarity and commitment to the Company at all times, which has contributed to our consistent profitability in challenging times.
Thank you for the trust and confidence reposed in our organisation, especially during these turbulent times. We assure you we remain as committed as ever to the company’s goals.
M.Y. Noorani Chairman

Z O D I A C 17
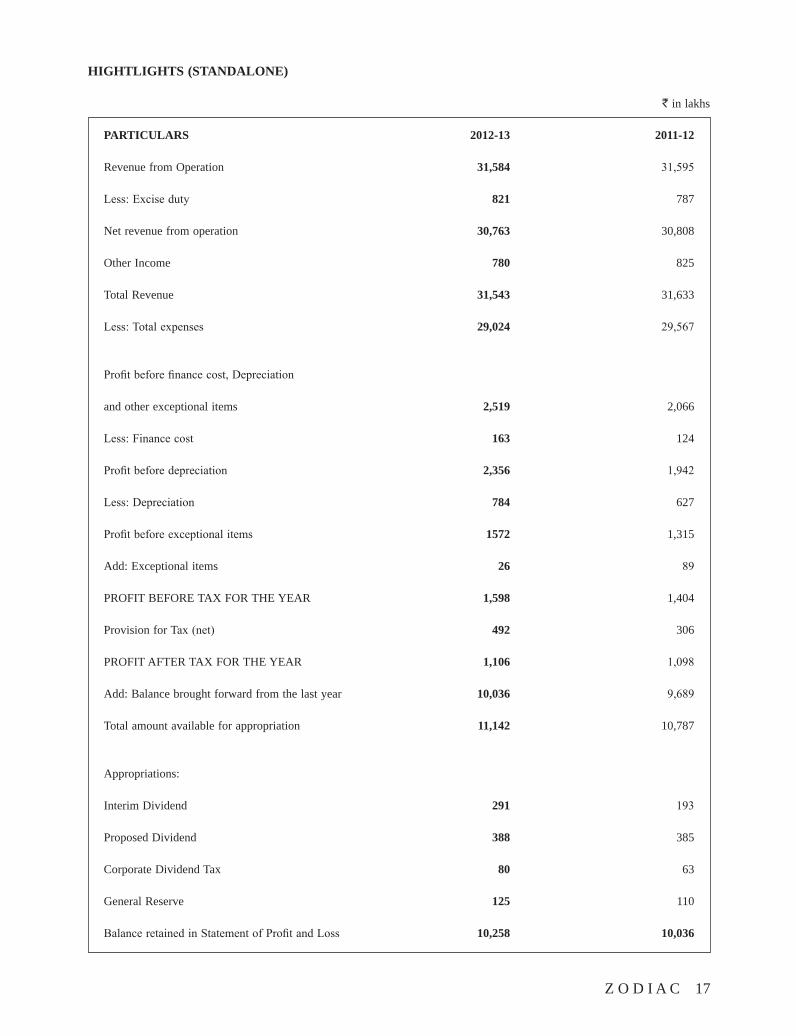
HIGHTLIGHTS (STANDALONE)
` in lakhs
PARTICULARS 2012-13 2011-12
Revenue from Operation 31,584 31,595
Less: Excise duty 821 787
Net revenue from operation 30,763 30,808
Other Income 780 825
Total Revenue 31,543 31,633
Less: Total expenses 29,024 29,567
Profit before finance cost, Depreciation
and other exceptional items 2,519 2,066
Less: Finance cost 163 124
Profit before depreciation 2,356 1,942
Less: Depreciation 784 627
Profit before exceptional items 1572 1,315
Add: Exceptional items 26 89
PROFIT BEFORE TAX FOR THE YEAR 1,598 1,404
Provision for Tax (net) 492 306
PROFIT AFTER TAX FOR THE YEAR 1,106 1,098
Add: Balance brought forward from the last year 10,036 9,689
Total amount available for appropriation 11,142 10,787
Appropriations:
Interim Dividend 291 193
Proposed Dividend 388 385
Corporate Dividend Tax 80 63
General Reserve 125 110
Balance retained in Statement of Profit and Loss 10,258 10,036
18 Z O D I A C
DIRECTORS’ REPORT TO THE MEMBERS
To,The Members,Zodiac Clothing Company Limited.
Your Directors hereby present the 29th Annual Report with the Audited Statements of Accounts for the Financial Year ended 31st March 2013.
1. BUSINESS:
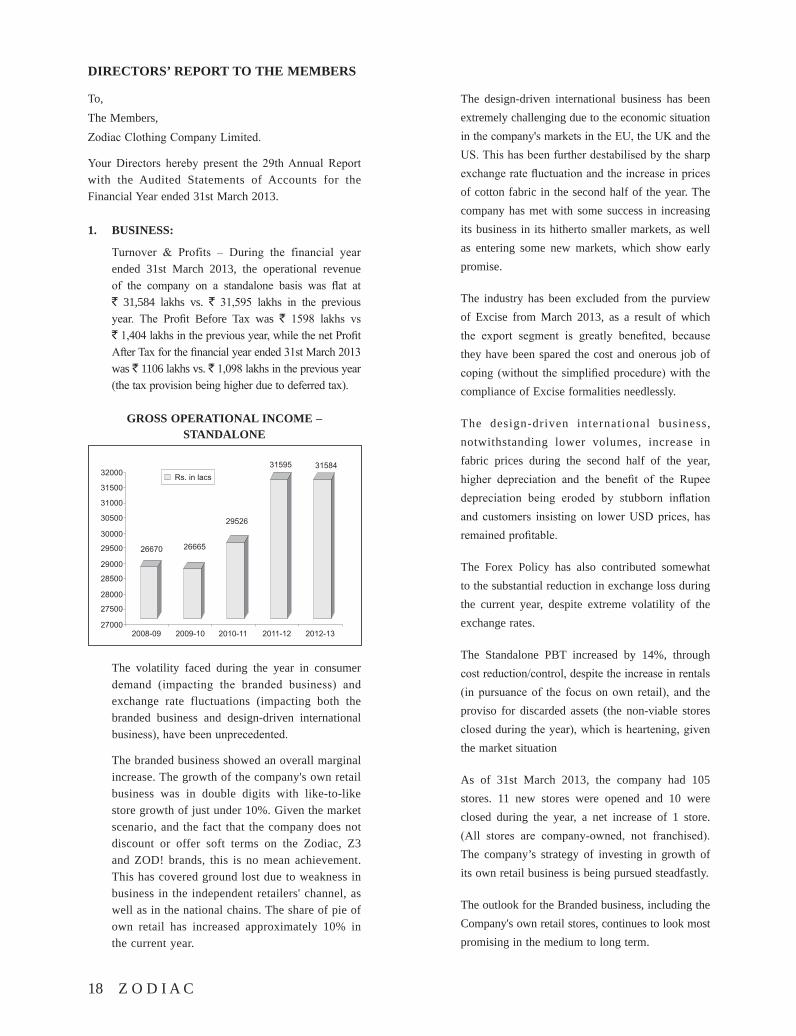
Turnover & Profits – During the financial year ended 31st March 2013, the operational revenue of the company on a standalone basis was flat at ` 31,584 lakhs vs. ` 31,595 lakhs in the previous year. The Profit Before Tax was ` 1598 lakhs vs ` 1,404 lakhs in the previous year, while the net Profit After Tax for the financial year ended 31st March 2013 was ` 1106 lakhs vs. ` 1,098 lakhs in the previous year (the tax provision being higher due to deferred tax).
GROSS OPERATIONAL INCOME – STANDALONE
The volatility faced during the year in consumer demand (impacting the branded business) and exchange rate fluctuations (impacting both the branded business and design-driven international business), have been unprecedented.
The branded business showed an overall marginal increase. The growth of the company's own retail business was in double digits with like-to-like store growth of just under 10%. Given the market scenario, and the fact that the company does not discount or offer soft terms on the Zodiac, Z3 and ZOD! brands, this is no mean achievement. This has covered ground lost due to weakness in business in the independent retailers' channel, as well as in the national chains. The share of pie of own retail has increased approximately 10% in the current year.
The design-driven international business has been extremely challenging due to the economic situation in the company's markets in the EU, the UK and the US. This has been further destabilised by the sharp exchange rate fluctuation and the increase in prices of cotton fabric in the second half of the year. The company has met with some success in increasing its business in its hitherto smaller markets, as well as entering some new markets, which show early promise.
The industry has been excluded from the purview of Excise from March 2013, as a result of which the export segment is greatly benefited, because they have been spared the cost and onerous job of coping (without the simplified procedure) with the compliance of Excise formalities needlessly.
The design-driven international business, notwithstanding lower volumes, increase in fabric prices during the second half of the year, higher depreciation and the benefit of the Rupee depreciation being eroded by stubborn inflation and customers insisting on lower USD prices, has remained profitable.
The Forex Policy has also contributed somewhat to the substantial reduction in exchange loss during the current year, despite extreme volatility of the exchange rates.
The Standalone PBT increased by 14%, through cost reduction/control, despite the increase in rentals (in pursuance of the focus on own retail), and the proviso for discarded assets (the non-viable stores closed during the year), which is heartening, given the market situation
As of 31st March 2013, the company had 105 stores. 11 new stores were opened and 10 were closed during the year, a net increase of 1 store. (All stores are company-owned, not franchised). The company’s strategy of investing in growth of its own retail business is being pursued steadfastly.
The outlook for the Branded business, including the Company's own retail stores, continues to look most promising in the medium to long term.
Z O D I A C 19
FINANCIAL RESULTS: (` in Lakhs)
Standalone Consolidated
2012-13 2011-12 2012-13 2011-12
Total Revenue from operations 31,584 31,595 36,818 38,540
PROFIT BEFORE TAXATION 1,598 1,404 2,016 2,203
Provision for Taxation:
Current Tax 406 322 528 444
Deferred Tax 86 (16) 86 (16)
PROFIT AFTER TAXATION 1,106 1,098 1402 1,775
Balance of Profit Brought forward 10,036 9,689 15,480 14,613
Transfer from General Reserves – – – 7
Profit Available for Appropriation 111,42 10,787 16,882 16,395
2. RESULTS OF OPERATIONS:
companies. The Consolidated Financial Statements presented by the Company include the financial results of its subsidiary companies.
4. CASH FLOW STATEMENT:
In conformity with the provisions of Clause 32 of the Listing Agreement with Stock Exchanges, the Cash Flow Statement for the year ended 31st March 2013 is annexed hereto.
5. CONSOLIDATED FINANCIAL STATEMENTS:
In accordance with the requirements of Accounting Standards AS-21 notified under the Companies (Accounting Standard) Rules 2006, the Consolidated Accounts of the company and its subsidiaries are annexed to this Report.
6. RATING:
ICRA (an associate of Moody’s Investor Service) has reaffirmed the Company’s rating of A1 + for its short term fund based/non fund based facilities, which have been maintained at ` 70 crores.
A1 is the highest credit quality rating assigned by ICRA to short term debt instruments, which carry the lowest credit risk in the short term. Within this category, certain instruments are assigned the rating of A1 + to reflect their relatively stronger credit quality.
7. CAPEX :
Capex (on standalone) was incurred predominantly on the new company run Stores (` 389 lakhs),
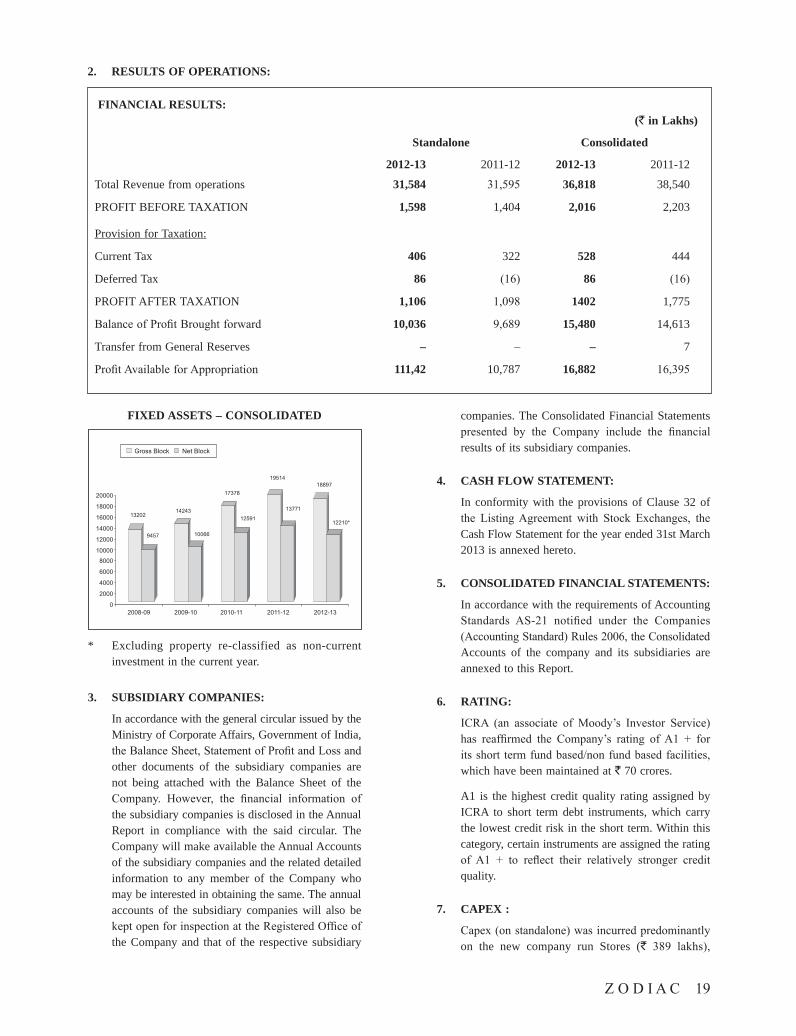
FIXED ASSETS – CONSOLIDATED
* Excluding property re-classified as non-current investment in the current year.
3. SUBSIDIARY COMPANIES:
In accordance with the general circular issued by the Ministry of Corporate Affairs, Government of India, the Balance Sheet, Statement of Profit and Loss and other documents of the subsidiary companies are not being attached with the Balance Sheet of the Company. However, the financial information of the subsidiary companies is disclosed in the Annual Report in compliance with the said circular. The Company will make available the Annual Accounts of the subsidiary companies and the related detailed information to any member of the Company who may be interested in obtaining the same. The annual accounts of the subsidiary companies will also be kept open for inspection at the Registered Office of the Company and that of the respective subsidiary
20 Z O D I A C
balancing machinery and equipment (` 207 lakhs), refurbishing of the Corporate Headquarters (` 435 lakhs), as well as on building & others (` 165 lakhs). Rental deposits (` 1,447lakhs) are not booked as Capex.
During the year, the Capex aggregated ` 1,196 lakhs (as against ` 1,852 lakhs last year) on a standalone basis and ` 1,387 lakhs (as against ` 2,150 lakhs last year) on a consolidated basis.
8. LIQUIDITY:
The Debt Equity Ratio as on 31st March 2013 was 0.26 on a standalone basis and 0.22 on a consolidated basis.
The cash and bank balances/cash equivalents along with liquid investments (free reserves - on consolidated basis) were ` 2,924 lakhs in March 2013, as against ` 2,209 lakhs last year.
9. INCREASE IN SHARE CAPITAL:
During the year under review, the paid-up share capital of the company has increased from ` 19,27,02,980/- to ` 19,38,99,980/- as a result of allotment of 119,700 shares issued under the ESOP Scheme.
10. APPROPRIATIONS:
Dividends – Your Directors have recommended a final dividend at ` 2/- per Equity Share of ` 10/- each on 1,93,89,998 Equity Shares (previous year ` 2/- per Equity Share of ` 10/- each on 1,92,70,298 Equity Shares). The company had distributed an interim dividend of ` 1.50 per equity share during the year (previous year ` 1.00 per equity share). The total dividend (interim and final) amount (when approved by the shareholders) including dividend distribution tax would be ` 759 lakhs, (previous year ` 641 lakhs). Dividend (including dividend distribution tax) as a percentage of profit after tax is 69%.
Transfer to Reserves: Your Directors propose to transfer ` 125 lakhs (11% of the net profit for the year) to the General Reserve. An amount of ` 10,258 lakhs is proposed to be retained in the Statement of Profit and Loss.
11. CORPORATE GOVERNANCE:
The process of sharpening of, and consistent improvement in the already high standards of Corporate Governance continues. As required under the revised Clause 49 of the Listing Agreement with the Stock Exchanges, a detailed note on Corporate
Governance is annexed to this Report. The company is in full compliance with the requirements and disclosures that have to be made in this regard. The Auditors’ Certificate confirming compliance of the Corporate Governance requirements by the company is attached to the Report on Corporate Governance.
12. QUALITY:
The company continues to pursue its policy of quality, productivity, value addition and innovation. To combat the economic situation globally, cost control measures are being pursued vigourously.
13. BRANDING:
Zodiac, Z3 and ZOD! brands were neither discounted nor offered on soft terms, underscoring the increasing strength of the brands by virtue of the brands' continuing focus on value added innovation and consistent pursuit of higher quality. This has resulted in the company's product extensions continuing to gain ground.
The industry has been excluded from the purview of Excise from March 2013. The benefit for the Branded segment will become evident in terms of volume growth over a period of time. The export segment is greatly benefited, because they have been spared the cost and onerous job of coping (without the simplified procedure) with the compliance of Excise formalities needlessly.
14. INFORMATION UNDER SECTION 217(1)(E) OF THE COMPANIES ACT, 1956, READ WITH COMPANIES (DISCLOSURE OF PARTICULARS IN THE REPORT OF THE BOARD OF DIRECTORS) RULES 1988:
(A) Conservation of Energy
Energy efficiency has been a key focus area for the organisation. Regular audits to fine tune already tight systems put in place has resulted in a further drop in energy consumption, despite the unit rates going up, as well as increase in the number of equipment.
Special emphasis is given to the major contributors of energy consumption – heating, cooling and lighting. Working closely with specialists in each field, the company is constantly striving to outperform not only industry standards, but its own already-achieved benchmarks.
Innovative solutions like microprocessor based equipment and controls, LED, web monitoring,
Z O D I A C 21
highly efficient steam systems, etc. used in conjunction with each other, as well as in combination with still-evolving technologies like solar, have already resulted in the reduction of minimum electricity demand at the plants.
(B) Pollution Control
The company is very sensitive about the environment. Its belief in running its business in an ecologically responsible manner has not only become a way of life, but also one of its business goals.
This quest for excellence resulted in a natural teaming up with the best in the field of air and water. After a lot of R&D and application of these technologies in its process, the company has under-implementation solutions, which will result in the drop of water consumed in its manufacturing process by over 50%. The eventual goal is to become “water positive”.
(C) Technology, Absorption, Adaptations & Innovation : Not applicable
(D) Foreign Exchange Earnings and Outgo:
Total Foreign Exchange Earned ` 13,890 lakhs
Total Foreign Exchange Outgo ` 5,687 lakhs
15. CORPORATE SOCIAL RESPONSIBILITY:
The company continues to lay emphasis on discharging its social responsibility in line with the policy renewed by the Board of Directors on 24th June 2009 for contribution by way of Charitable Funds not related to the business of the company. This is within the limit approved by the shareholders.
16. DIRECTORS:
In accordance with the provisions of the Companies Act, 1956, and the Articles of Association of the Company, Mr. S.R Iyer, Mr. Bernhard Steinruecke and Mr. M.L. Apte, Directors of the Company, shall retire by rotation at the ensuing Annual General Meeting and, being eligible, have offered themselves for re-appointment. A brief resume of Mr. S.R Iyer, Mr. Bernhard Steinruecke and Mr. M.L. Apte, Directors, as required by Clause 49 of the Listing Agreement with the Stock Exchanges,
is provided in the Notice convening the Annual General Meeting of the Company.
17. DIRECTORS’ RESPONSIBILITY STATEMENT:
Pursuant to the requirement under Section 217(2AA) of the Companies Act, 1956 with respect to Directors’ Responsibility Statement, it is hereby confirmed:
(i) that in the preparation of the annual accounts for the financial year ended 31st March 2013, the applicable accounting standards have been followed along with proper explanation;
(ii) that the directors have selected such accounting policies and applied them consistently and made judgments and estimates that are reasonable and prudent so as to give a true and fair view of the state of affairs of the Company at the end of the financial year and of the profit of the Company for the year under review;
(iii) that the directors have taken proper and sufficient care for the maintenance of adequate accounting records in accordance with the provisions of the Companies Act, 1956 for safeguarding the assets of the Company and for preventing and detecting fraud and other irregularities;
(iv) that the directors have prepared the accounts for the financial year ended 31st March 2013 on a ‘going concern’ basis.
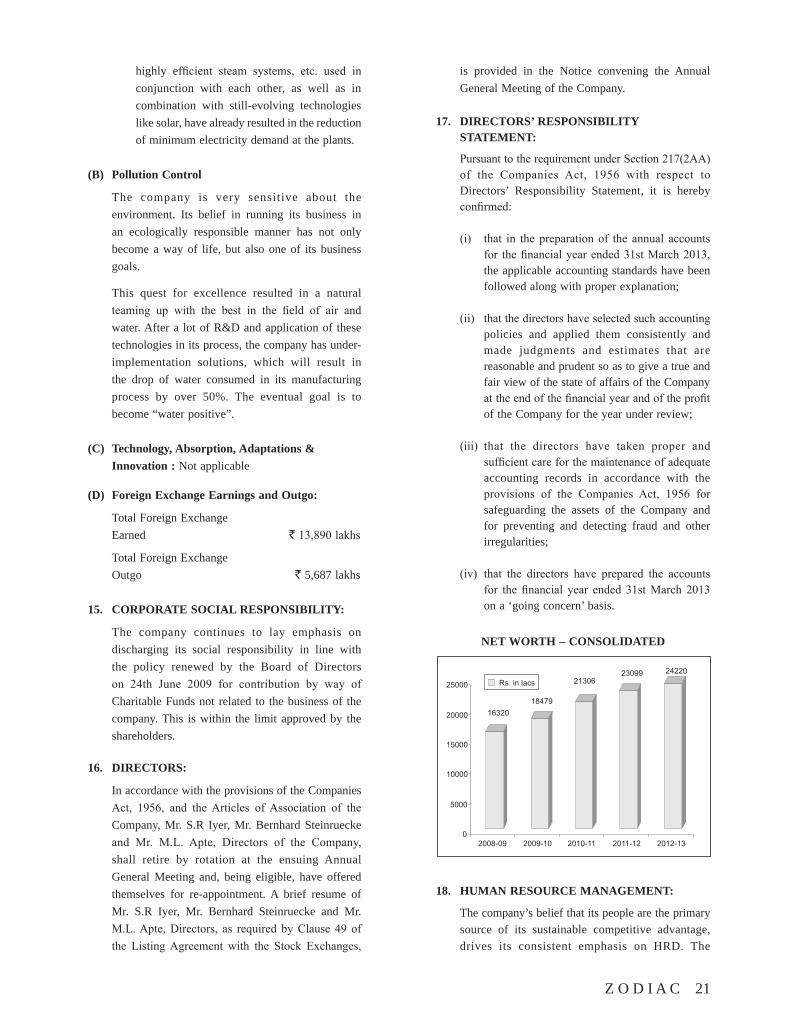
NET WORTH – CONSOLIDATED
18. HUMAN RESOURCE MANAGEMENT:
The company’s belief that its people are the primary source of its sustainable competitive advantage, drives its consistent emphasis on HRD. The
22 Z O D I A C
performance driven culture is bearing fruit. Cordial employee relations, in keeping with tradition, are being pursued vigorously with the variable component also including rewards for contribution to the profitability of the company. The Board wishes to place on record its appreciation to all the employees of the company for their sustained efforts and immense contribution to the high level of performance and efficiency of the business during the year.
19. ZODIAC EMPLOYEES’ STOCK OPTION PLAN 2006:
At the Annual General Meeting held on August 31, 2006, the shareholders of the Company had approved the grant of 5,00,000 Stock Option to employees of the Company and its subsidiaries / Directors of the Company (other than Promoter Directors or their relatives).
The Company granted 2,91,000 stock options and 2,67,350 stock options on 27th December 2006 and 20th January 2011 at an exercise price of ` 255.40 and ` 346.00 per equity share respectively (each option carried an entitlement of one equity share of face value of ` 10/- each). Both grants were duly approved by the Compensation Committee/Board of Directors.
During the year under review, the Company allotted 119,700 equity shares, including the bonus entitlement thereon, (to eligible Directors and Employees of the Company under Zodiac Clothing Company Limited – Employees Stock Option Plan – 2006) on receipt of valid applications along with the necessary application money. The said allotment was done successfully on receipt of confirmation given by National Securities Depository Limited and Central Depository Services (India) Ltd. The Company has also received trading permission from The BSE Limited and National Stock Exchange of India Limited in respect of 119,700 equity shares allotted under ESOP. The particulars with regard to the stock options as on March 31, 2013 as required to be disclosed pursuant to Clause 12 of SEBI (Employees Stock Option Scheme and Employee Stock Purchase Scheme) Guidelines 1999 are enclosed as Annexure 1 to this Report. The Company has obtained a certificate from the auditors stating that ESOP has been implemented in accordance with SEBI (ESOS and ESPS) Guidelines, 1999 and the resolution of the Company passed in the Annual General Meeting held on August 31, 2006.
20. COMPLIANCE WITH THE CODE OF CONDUCT:
The Code of Conduct adopted by the Company for its Board of Directors and its Managerial Personnel has been uploaded on the company’s website. The declaration of compliance with the Code of Conduct has been received from all Board Members and the Managerial Personnel. A certificate to this effect from Mr. A.Y. Noorani, Vice Chairman and Managing Director, forms part of this Report.
21. MANAGEMENT DISCUSSION AND ANALYSIS:
The Management Discussion and Analysis of the Company is provided under the separate section and forms part of this report.
22. FIXED DEPOSIT:
The Company has not accepted any Fixed Deposits from the public under Section 58A of the Companies Act, 1956.
23. COMPANY'S WEBSITE:
The Financial Statements, Annual Report including Corporate Governance Report, Shareholding Pattern etc. are displayed interse with the other information on the company’s website viz. www.zodiaconline.com.
24. DONATIONS:
During the financial year, the Company has contributed a sum of ` 106 lacs to various Charitable and Educational Institutions.
25. INSURANCE:
All the properties/assets including buildings, furniture/fixtures, etc. and insurable interests of the Company are adequately insured. The international debtors enjoying credit facilities are also insured, despite their flawless record, as a measure of abundant precaution.
26. AUDITORS:
The Auditors M/s. Deloitte Haskins and Sells, Chartered Accountants, retire at the ensuing Annual General Meeting of the Company and, being eligible, have offered themselves for
Z O D I A C 23
re-appointment. The Audit Committee and Board of Directors recommend the re-appointment of M/s. Deloitte Haskins & Sells, Chartered Accountants, as Statutory Auditors of the Company.
27. COST AUDITOR:
Pursuant to the provisions under Section 233B of the Companies Act, 1956. M/s. N. Ritesh & Associates, Cost Accountants, has been appointed as Cost Auditors of the Company for the financial year 2013-14.
28. AUDIT COMMITTEE:
In accordance with Section 292A of the Companies Act, 1956 and Clause 49 of the Listing Agreement, the Company has constituted an Audit Committee, which consists of three Non-Executive Independent Directors of the Company viz Mr. S.R Iyer (Chairman of the Audit Committee), Mr. Y.P Trivedi and Mr. M.L Apte (Members). The Audit Committee functions in terms of the powers and role delegated by the Board of Directors keeping in view the provisions of Section 292A of the Companies Act, 1956 and Clause 49 of the Listing Agreement, have been described separately under the head Audit Committee on Report of Corporate Governance.
29. PARTICULARS OF EMPLOYEES:
The Particulars of Employees required to be furnished under Section 217(2A) of the Companies Act, 1956, read with the Companies (Particulars of Employees) Rules, 1975, as amended, forms part of
this Report and have been annexed herewith.
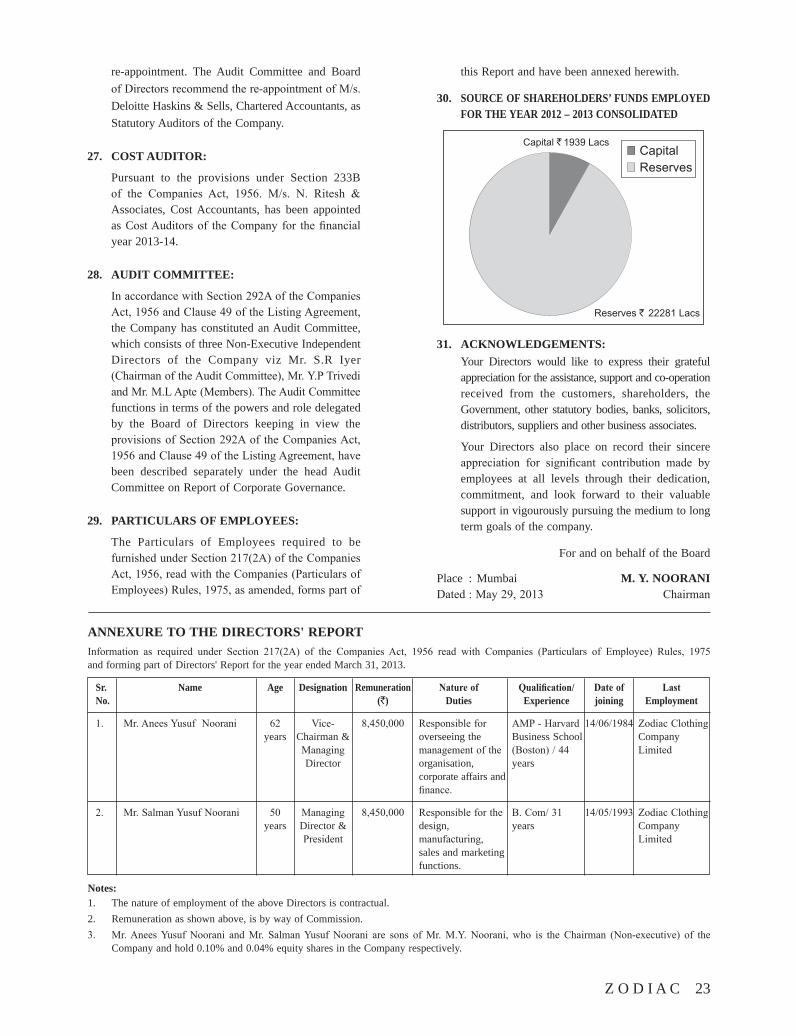
30. SOURCE OF SHAREHOLDERS’ FUNDS EMPLOYED FOR THE YEAR 2012 – 2013 CONSOLIDATED
31. ACKNOWLEDGEMENTS: Your Directors would like to express their grateful
appreciation for the assistance, support and co-operation received from the customers, shareholders, the Government, other statutory bodies, banks, solicitors, distributors, suppliers and other business associates.
Your Directors also place on record their sincere appreciation for significant contribution made by employees at all levels through their dedication, commitment, and look forward to their valuable support in vigourously pursuing the medium to long term goals of the company.
For and on behalf of the Board
Place : Mumbai M. Y. NOORANI Dated : May 29, 2013 Chairman
ANNEXURE TO THE DIRECTORS' REPORTInformation as required under Section 217(2A) of the Companies Act, 1956 read with Companies (Particulars of Employee) Rules, 1975 and forming part of Directors' Report for the year ended March 31, 2013.
Sr. Name Age Designation Remuneration Natureof Qualification/ Dateof Last No. (`) Duties Experience joining Employment
1. Mr. Anees Yusuf Noorani 62 Vice- 8,450,000 Responsible for AMP - Harvard 14/06/1984 Zodiac Clothing years Chairman & overseeing the Business School Company Managing management of the (Boston) / 44 Limited Director organisation, years corporate affairs and finance.
2. Mr. Salman Yusuf Noorani 50 Managing 8,450,000 Responsible for the B. Com/ 31 14/05/1993 Zodiac Clothing years Director & design, years Company President manufacturing, Limited sales and marketing functions.
Notes:1. The nature of employment of the above Directors is contractual.2. Remuneration as shown above, is by way of Commission.3. Mr. Anees Yusuf Noorani and Mr. Salman Yusuf Noorani are sons of Mr. M.Y. Noorani, who is the Chairman (Non-executive) of the
Company and hold 0.10% and 0.04% equity shares in the Company respectively.
24 Z O D I A C
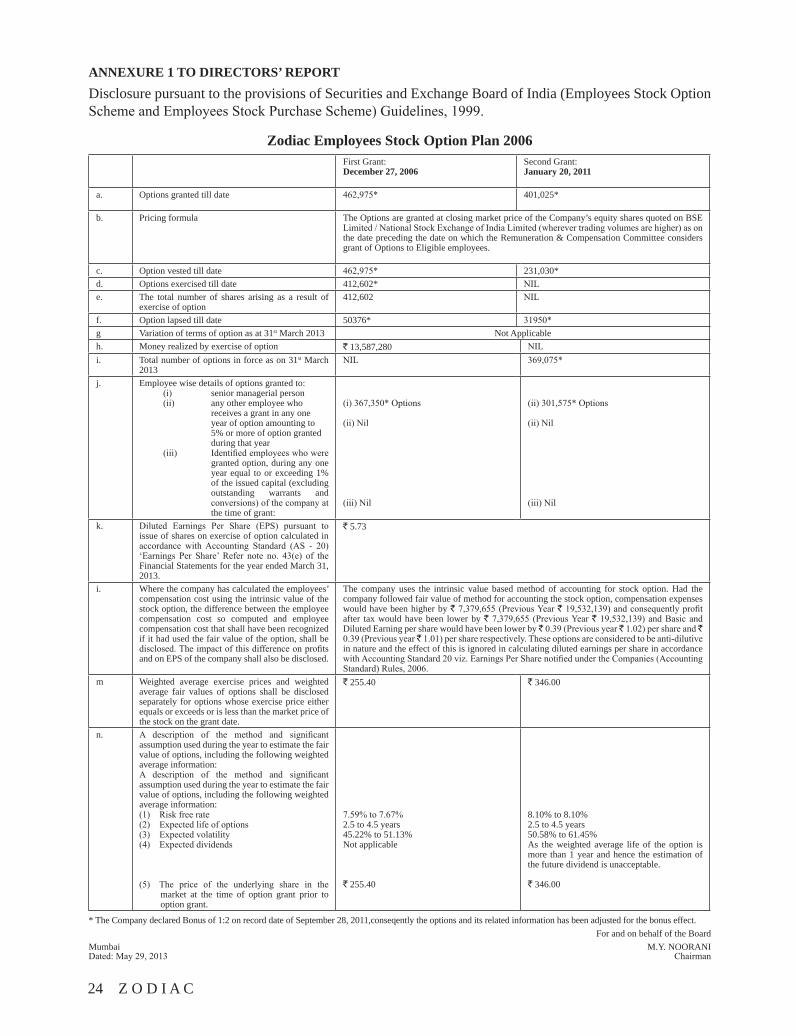
ANNEXURE 1 TO DIRECTORS’ REPORTDisclosure pursuant to the provisions of Securities and Exchange Board of India (Employees Stock Option Scheme and Employees Stock Purchase Scheme) Guidelines, 1999.
Zodiac Employees Stock Option Plan 2006First Grant:December 27, 2006
Second Grant:January 20, 2011
a. Options granted till date 462,975* 401,025*
b. Pricing formula The Options are granted at closing market price of the Company’s equity shares quoted on BSE Limited / National Stock Exchange of India Limited (wherever trading volumes are higher) as on the date preceding the date on which the Remuneration & Compensation Committee considers grant of Options to Eligible employees.
c. Option vested till date 462,975* 231,030*d. Options exercised till date 412,602* NILe. The total number of shares arising as a result of
exercise of option 412,602 NIL
f. Option lapsed till date 50376* 31950*g Variation of terms of option as at 31st March 2013 Not Applicableh. Money realized by exercise of option ` 13,587,280 NILi. Total number of options in force as on 31st March
2013NIL 369,075*
j. Employee wise details of options granted to:(i) senior managerial person(ii) any other employee who
receives a grant in any one year of option amounting to 5% or more of option granted during that year
(iii) Identified employees who were granted option, during any one year equal to or exceeding 1% of the issued capital (excluding outstanding warrants and conversions) of the company at the time of grant:
(i) 367,350* Options
(ii) Nil
(iii) Nil
(ii) 301,575* Options
(ii) Nil
(iii) Nil
k. Diluted Earnings Per Share (EPS) pursuant to issue of shares on exercise of option calculated in accordance with Accounting Standard (AS - 20) ‘Earnings Per Share’ Refer note no. 43(e) of the Financial Statements for the year ended March 31, 2013.
` 5.73
i. Where the company has calculated the employees’ compensation cost using the intrinsic value of the stock option, the difference between the employee compensation cost so computed and employee compensation cost that shall have been recognized if it had used the fair value of the option, shall be disclosed. The impact of this difference on profits and on EPS of the company shall also be disclosed.
The company uses the intrinsic value based method of accounting for stock option. Had the company followed fair value of method for accounting the stock option, compensation expenses would have been higher by ` 7,379,655 (Previous Year ` 19,532,139) and consequently profit after tax would have been lower by ` 7,379,655 (Previous Year ` 19,532,139) and Basic and Diluted Earning per share would have been lower by ̀ 0.39 (Previous year ̀ 1.02) per share and ̀ 0.39 (Previous year ̀ 1.01) per share respectively. These options are considered to be anti-dilutive in nature and the effect of this is ignored in calculating diluted earnings per share in accordance with Accounting Standard 20 viz. Earnings Per Share notified under the Companies (Accounting Standard) Rules, 2006.
m Weighted average exercise prices and weighted average fair values of options shall be disclosed separately for options whose exercise price either equals or exceeds or is less than the market price of the stock on the grant date.
` 255.40 ` 346.00
n. A description of the method and significant assumption used during the year to estimate the fair value of options, including the following weighted average information:A description of the method and significant assumption used during the year to estimate the fair value of options, including the following weighted average information:(1) Risk free rate(2) Expected life of options(3) Expected volatility(4) Expected dividends
(5) The price of the underlying share in the market at the time of option grant prior to option grant.
7.59% to 7.67%2.5 to 4.5 years45.22% to 51.13%Not applicable
` 255.40
8.10% to 8.10%2.5 to 4.5 years50.58% to 61.45%As the weighted average life of the option is more than 1 year and hence the estimation of the future dividend is unacceptable.
` 346.00
* The Company declared Bonus of 1:2 on record date of September 28, 2011,conseqently the options and its related information has been adjusted for the bonus effect.For and on behalf of the Board
Mumbai M.Y. NOORANI Dated: May 29, 2013 Chairman
Z O D I A C 25
CORPORATE GOVERNANCE REPORT FOR THE YEAR 2012-2013
Corporate Governance is a process that aims to meet stakeholders’ aspirations and expectations. Corporate Governance is much more than complying with the legal and regulatory requirements. The cardinal principles such as independence, accountability, responsibility, transparency, fair and timely disclosures etc. serve as the means for implementing the philosophy of corporate governance. The Company’s policies on Corporate Governance and compliance thereof in respect of specific areas for the year ended March 31, 2013, as per the format prescribed by SEBI and as incorporated in the revised Clause 49 of the Listing agreement with the Stock Exchanges, are set out below for the information of the shareholders and investors of the Company.
I. Company’s Philosophy on Code of Corporate Governance
The Company’s endeavor is to follow the spirit of good governance rather than mere compliance with the conditions specified by regulatory authorities. The Company has a strong legacy of fair, transparent and ethical governance practices. The Company has formulated, interalia, various policy documents and introduced best practices of governance like Code of Conduct, Prohibition of insider trading policy and risk management policy. For the Company, Corporate Governance is not a destination but a continuous journey that seeks to provide an enabling environment to harmonise the goals of maximising stakeholders’ value and maintaining a strong customer focus.
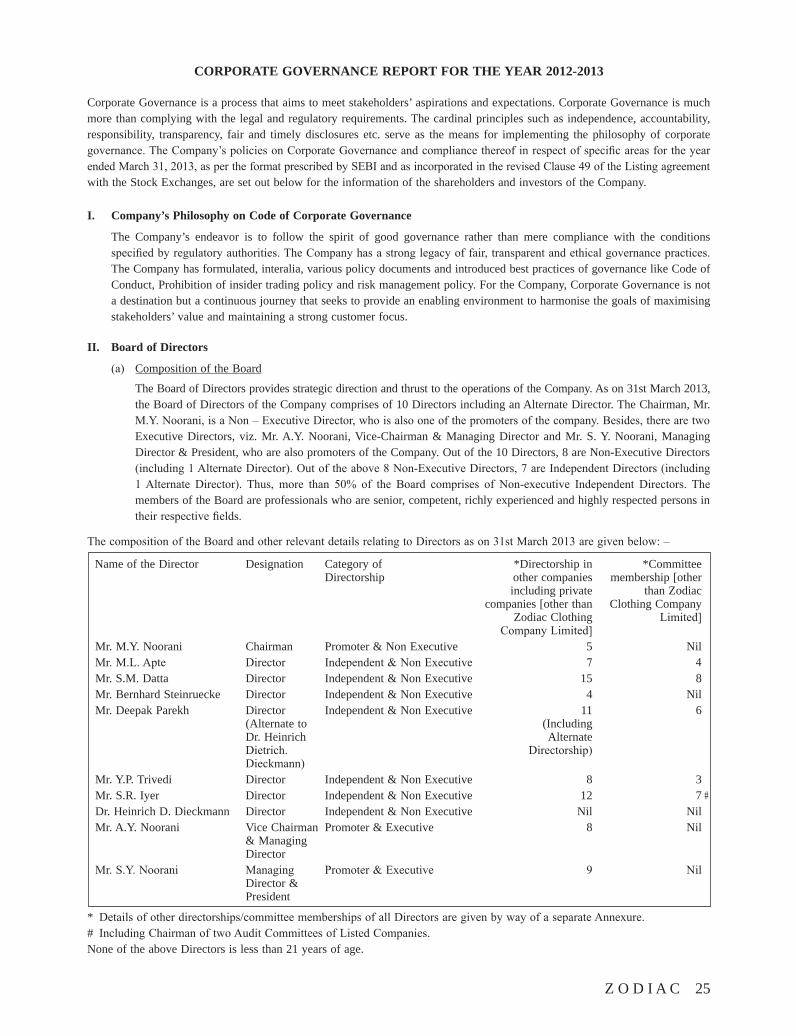
II. Board of Directors
(a) Composition of the Board
The Board of Directors provides strategic direction and thrust to the operations of the Company. As on 31st March 2013, the Board of Directors of the Company comprises of 10 Directors including an Alternate Director. The Chairman, Mr. M.Y. Noorani, is a Non – Executive Director, who is also one of the promoters of the company. Besides, there are two Executive Directors, viz. Mr. A.Y. Noorani, Vice-Chairman & Managing Director and Mr. S. Y. Noorani, Managing Director & President, who are also promoters of the Company. Out of the 10 Directors, 8 are Non-Executive Directors (including 1 Alternate Director). Out of the above 8 Non-Executive Directors, 7 are Independent Directors (including 1 Alternate Director). Thus, more than 50% of the Board comprises of Non-executive Independent Directors. The members of the Board are professionals who are senior, competent, richly experienced and highly respected persons in their respective fields.
The composition of the Board and other relevant details relating to Directors as on 31st March 2013 are given below: –
Name of the Director Designation Category of *Directorship in *Committee Directorship other companies membership [other including private than Zodiac companies [other than Clothing Company Zodiac Clothing Limited] Company Limited]
Mr. M.Y. Noorani Chairman Promoter & Non Executive 5 NilMr. M.L. Apte Director Independent & Non Executive 7 4Mr. S.M. Datta Director Independent & Non Executive 15 8Mr. Bernhard Steinruecke Director Independent & Non Executive 4 NilMr. Deepak Parekh Director Independent & Non Executive 11 6 (Alternate to (Including Dr. Heinrich Alternate Dietrich. Directorship) Dieckmann) Mr. Y.P. Trivedi Director Independent & Non Executive 8 3Mr. S.R. Iyer Director Independent & Non Executive 12 7 #Dr. Heinrich D. Dieckmann Director Independent & Non Executive Nil NilMr. A.Y. Noorani Vice Chairman Promoter & Executive 8 Nil & Managing DirectorMr. S.Y. Noorani Managing Promoter & Executive 9 Nil Director & President
* Details of other directorships/committee memberships of all Directors are given by way of a separate Annexure.# Including Chairman of two Audit Committees of Listed Companies.None of the above Directors is less than 21 years of age.
26 Z O D I A C
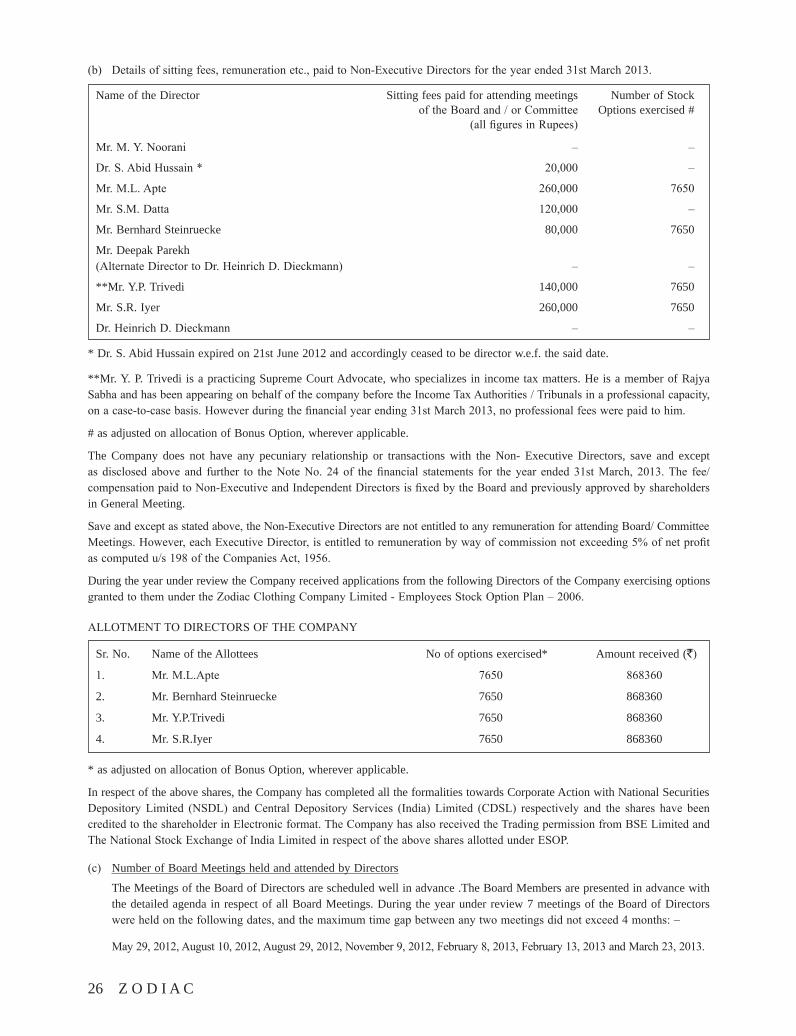
(b) Details of sitting fees, remuneration etc., paid to Non-Executive Directors for the year ended 31st March 2013.
Name of the Director Sitting fees paid for attending meetings Number of Stock of the Board and / or Committee Options exercised # (all figures in Rupees)
Mr. M. Y. Noorani – –
Dr. S. Abid Hussain * 20,000 –
Mr. M.L. Apte 260,000 7650
Mr. S.M. Datta 120,000 –
Mr. Bernhard Steinruecke 80,000 7650
Mr. Deepak Parekh (Alternate Director to Dr. Heinrich D. Dieckmann) – –
**Mr. Y.P. Trivedi 140,000 7650
Mr. S.R. Iyer 260,000 7650
Dr. Heinrich D. Dieckmann – –
* Dr. S. Abid Hussain expired on 21st June 2012 and accordingly ceased to be director w.e.f. the said date.
**Mr. Y. P. Trivedi is a practicing Supreme Court Advocate, who specializes in income tax matters. He is a member of Rajya Sabha and has been appearing on behalf of the company before the Income Tax Authorities / Tribunals in a professional capacity, on a case-to-case basis. However during the financial year ending 31st March 2013, no professional fees were paid to him.
# as adjusted on allocation of Bonus Option, wherever applicable.
The Company does not have any pecuniary relationship or transactions with the Non- Executive Directors, save and except as disclosed above and further to the Note No. 24 of the financial statements for the year ended 31st March, 2013. The fee/compensation paid to Non-Executive and Independent Directors is fixed by the Board and previously approved by shareholders in General Meeting.
Save and except as stated above, the Non-Executive Directors are not entitled to any remuneration for attending Board/ Committee Meetings. However, each Executive Director, is entitled to remuneration by way of commission not exceeding 5% of net profit as computed u/s 198 of the Companies Act, 1956.
During the year under review the Company received applications from the following Directors of the Company exercising options granted to them under the Zodiac Clothing Company Limited - Employees Stock Option Plan – 2006.
ALLOTMENT TO DIRECTORS OF THE COMPANY
Sr. No. Name of the Allottees No of options exercised* Amount received (`)
1. Mr. M.L.Apte 7650 868360
2. Mr. Bernhard Steinruecke 7650 868360
3. Mr. Y.P.Trivedi 7650 868360
4. Mr. S.R.Iyer 7650 868360
* as adjusted on allocation of Bonus Option, wherever applicable.
In respect of the above shares, the Company has completed all the formalities towards Corporate Action with National Securities Depository Limited (NSDL) and Central Depository Services (India) Limited (CDSL) respectively and the shares have been credited to the shareholder in Electronic format. The Company has also received the Trading permission from BSE Limited and The National Stock Exchange of India Limited in respect of the above shares allotted under ESOP.
(c) Number of Board Meetings held and attended by Directors
The Meetings of the Board of Directors are scheduled well in advance .The Board Members are presented in advance with the detailed agenda in respect of all Board Meetings. During the year under review 7 meetings of the Board of Directors were held on the following dates, and the maximum time gap between any two meetings did not exceed 4 months: –
May 29, 2012, August 10, 2012, August 29, 2012, November 9, 2012, February 8, 2013, February 13, 2013 and March 23, 2013.
Z O D I A C 27
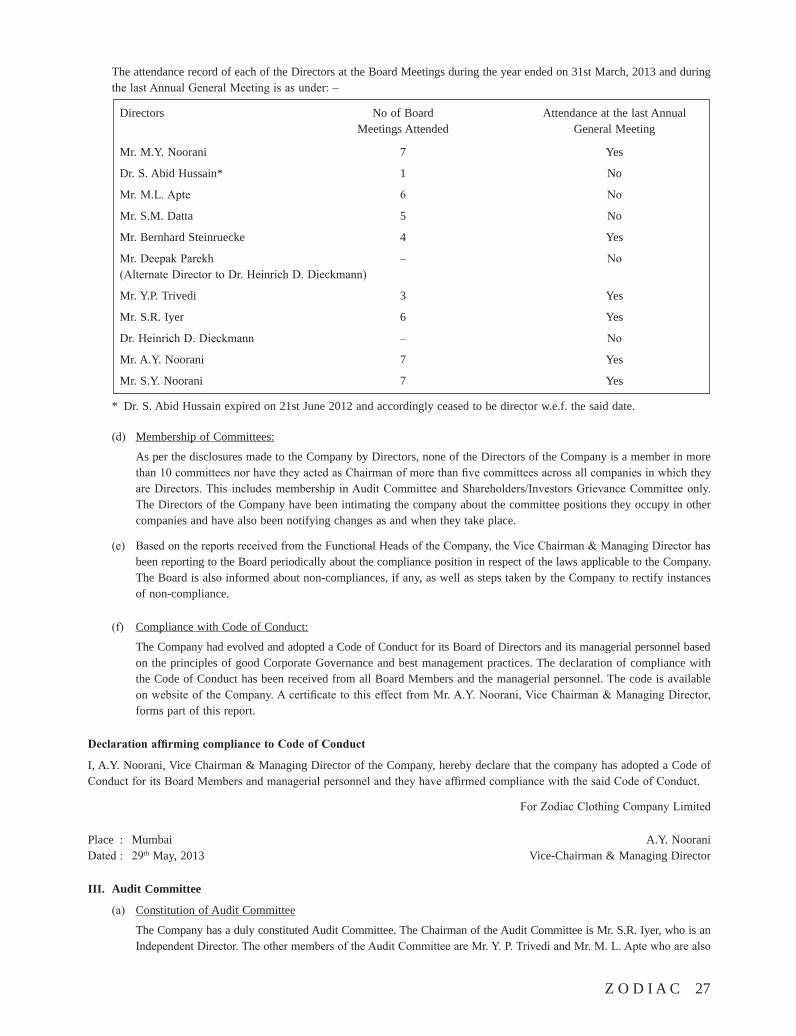
The attendance record of each of the Directors at the Board Meetings during the year ended on 31st March, 2013 and during the last Annual General Meeting is as under: –
Directors No of Board Attendance at the last Annual Meetings Attended General Meeting
Mr. M.Y. Noorani 7 Yes
Dr. S. Abid Hussain* 1 No
Mr. M.L. Apte 6 No
Mr. S.M. Datta 5 No
Mr. Bernhard Steinruecke 4 Yes
Mr. Deepak Parekh – No (Alternate Director to Dr. Heinrich D. Dieckmann)
Mr. Y.P. Trivedi 3 Yes
Mr. S.R. Iyer 6 Yes
Dr. Heinrich D. Dieckmann – No
Mr. A.Y. Noorani 7 Yes
Mr. S.Y. Noorani 7 Yes
* Dr. S. Abid Hussain expired on 21st June 2012 and accordingly ceased to be director w.e.f. the said date.
(d) Membership of Committees:
As per the disclosures made to the Company by Directors, none of the Directors of the Company is a member in more than 10 committees nor have they acted as Chairman of more than five committees across all companies in which they are Directors. This includes membership in Audit Committee and Shareholders/Investors Grievance Committee only. The Directors of the Company have been intimating the company about the committee positions they occupy in other companies and have also been notifying changes as and when they take place.
(e) Based on the reports received from the Functional Heads of the Company, the Vice Chairman & Managing Director has been reporting to the Board periodically about the compliance position in respect of the laws applicable to the Company. The Board is also informed about non-compliances, if any, as well as steps taken by the Company to rectify instances of non-compliance.
(f) Compliance with Code of Conduct:
The Company had evolved and adopted a Code of Conduct for its Board of Directors and its managerial personnel based on the principles of good Corporate Governance and best management practices. The declaration of compliance with the Code of Conduct has been received from all Board Members and the managerial personnel. The code is available on website of the Company. A certificate to this effect from Mr. A.Y. Noorani, Vice Chairman & Managing Director, forms part of this report.
DeclarationaffirmingcompliancetoCodeofConduct
I, A.Y. Noorani, Vice Chairman & Managing Director of the Company, hereby declare that the company has adopted a Code of Conduct for its Board Members and managerial personnel and they have affirmed compliance with the said Code of Conduct.
For Zodiac Clothing Company Limited
Place : Mumbai A.Y. Noorani Dated : 29th May, 2013 Vice-Chairman & Managing Director
III. Audit Committee
(a) Constitution of Audit Committee
The Company has a duly constituted Audit Committee. The Chairman of the Audit Committee is Mr. S.R. Iyer, who is an Independent Director. The other members of the Audit Committee are Mr. Y. P. Trivedi and Mr. M. L. Apte who are also
28 Z O D I A C
Independent Directors. The Committee presently consists of three Directors all being non–executive and independent. All the members of the Audit Committee are financially literate and two of the members have accounting or related financial management expertise [viz. Mr. S. R. Iyer and Mr. Y. P. Trivedi]. The Company Secretary acts as the Secretary to the Audit Committee. At the Annual General Meeting held on August 29, 2012, Mr. S.R. Iyer, Chairman of the Audit Committee was present to answer the queries of the shareholders.
(b) Role and Powers of Audit Committee: –
The terms of reference of the Audit Committee includes:
Powers
1. To investigate any activity within its terms of reference.
2. To seek information from any employee.
3. To obtain outside legal or other professional advice.
4. To secure attendance of outsiders with relevant expertise, if it considers necessary.
Role:
1. To oversee of the Company’s financial reporting process and the disclosure of its financial information to ensure that the financial statement is correct, sufficient and credible.
2. To recommend to the Board, the appointment, re-appointment and, if required, the replacement or removal of the Statutory Auditors and the fixation of audit fees.
3. To approve payment to Statutory Auditors for any other services rendered by them.
4. To review with the management, the annual financial statements before submission to the Board for approval, with particular reference to:
a. Matters required to be included in the Director’s Responsibility Statement to be included in the Board’s Report in terms of clause (2AA) of Section 217 of the Companies Act, 1956.
b. Changes, if any, in accounting policies and practices and reasons for the same.
c. Major accounting entries involving estimates based on the exercise of judgment by management.
d. Significant adjustments made in the financial statements arising out of audit findings.
e. Compliance with listing and other legal requirements relating to financial statements.
f. Disclosure of any related party transactions.
g. Qualifications in the draft audit report.
5. To review with the management, the quarterly financial statements before submission to the Board for approval.
5A To Review, with the management, the statement of uses / application of funds raised through an issue (Public issue, rights issue, preferential issue, etc), the statement of funds utilized for purposes other than those stated in the offer document/Prospectus/notice and the report submitted by the monitoring agency monitoring the utilization of proceeds of a public or rights issue, and making appropriate recommendations to the Board to take up steps in this matter.
6. To review with the management, performance of statutory and internal auditors, adequacy of the internal control systems.
7. To review the adequacy of internal audit function, if any, including the structure of the internal audit department, staffing and seniority of the official heading the department, reporting structure coverage and frequency of internal audit.
8. Discussion with internal auditors, any significant findings and follow up there on.
9. Reviewing the findings of any internal investigations by the internal auditors into matters where there is suspected fraud or irregularity or a failure of internal control systems of a material nature and reporting the matter to the Board.
10. Discussion with statutory auditors before the audit commences, about the nature and scope of audit as well as post-audit discussion to ascertain any area of concern.
Z O D I A C 29
11. To look into the reasons for substantial defaults in the payment to the depositors, debenture holders, shareholders (in case of non payment of declared dividends) and creditors.
12. To review the functioning of the Whistle Blower mechanism, in case the same is existing.
12A To Approve the appointment of CFO (i.e., the whole-time Finance Director or any other person heading the finance function or discharging that function) after assessing the qualifications, experience & background, etc. of the candidate.
13. To carry out any other function as is mentioned in the terms of reference of the Audit Committee.
The Audit Committee mandatorily reviews the following:
i. Management discussion and analysis of financial condition and results of operation,
ii. Statement of significant related party transactions
iii. Management letters / letters of internal control weaknesses issued by the statutory auditors
iv. Internal audit reports relating to internal control weaknesses and
v. The appointment, removal and terms of remuneration of the chief internal auditor.
(c) Meetings of Audit Committee:
During the year ended 31st March 2013, Seven Audit Committee Meetings were held on May 16, 2012, May 29, 2012, August 10, 2012, November 9, 2012, January 2, 2013, February 8, 2013, and March 23, 2013. The attendance of each Audit Committee member in the above meetings is given hereunder: –
Name of the Audit committee Member No. of meetings held No. of meetings attended
Mr. S.R. Iyer – Chairman 7 7
Mr. M.L. Apte – Member 7 7
Mr. Y.P. Trivedi, - Member 7 4
Attendees:
The Audit Committee invites such of the executives and directors, as it considers appropriate to be present at its meeting. The Chairman, Managing Directors, the Vice- President - Accounts, the Internal Auditor and the Statutory Auditors are normally invited to these meetings.
IV. Compensation Committee:
The Company has constituted Compensation Committee on 31st October 2006, with the following Board Members:
Mr. Y. P. Trivedi – Member
Mr. M. L. Apte – Member
Mr. Bernhard Steinruecke – Member
The scope of the activities of the Compensation Committee is formulations and implementations of Employee Stock Option Plans (ESOP) schemes in the Company.
At the Annual General Meeting held on August 31, 2006, the shareholders of the Company have approved the grant of Stock Option to employees of the Company and its subsidiaries / Directors of the Company (other than Promoter Directors or their relatives).
At the first meeting of the Compensation Committee held on December 27, 2006, the Committee approved grant of 2,31,500 Stock Options to employees of the Company and 34,000 Stock Options were granted to eligible Directors of the Company at a price of ` 255.40 per option. The Board of Directors approved the grant of 25,500 Stock Options to members of Compensation Committee at a price of ` 255.40 per option on the said date. No meeting of Compensation Committee was held during the year under review.
At the meeting of the Committee held on January 20, 2011, the Committee approved the Second Grant of 2,14,850 Stock Options to employees of the Company and 30,000 Stock Options were granted to eligible Directors of the Company at a price of ` 346.00 per option. The Board of Directors approved the grant of 22,500 Stock Options to members of the Compensation Committee at a price of ` 346.00 per option on the said date. Accordingly, an aggregate of 2,67,350 Stock Options were granted during the year 2010-11 at a price of ` 346.00 per share pursuant to Employee Stock Option Scheme 2006 of the Company.
30 Z O D I A C
During the year under review, the Company allotted 1,19,700 equity shares (as adjusted on allocation of Bonus Option wherever applicable) to eligible Employees / Directors of the Company under Zodiac Clothing Company Limited – Employees Stock Option Plan- 2006 after receiving full consideration on the shares. The allotment was done successfully on receipt of confirmation given by National Securities Depository Limited and Central Depository Services (India) Limited respectively. The Company has also received the trading permission from The BSE Limited and National Stock Exchange of India Limited in respect of all the above shares.
Continuous learning is the cornerstone of the Company’s human resource policy. The Company’s Human Resource Policy is structured to meet the aspirations of employees as well as of the organization. The Company has a progressive HR policy of continuous development of employees by training and motivating them to attain greater efficiency and competency.
V. Forex Committee:
The Forex Committee was constituted on June 24, 2009 with the following members of the Board:
Mr. S.M Datta
Mr. M.Y Noorani
Mr. A.Y Noorani
Mr. S.Y Noorani
VI. Investment Committee:
The Investment committee was constituted on August 10, 2010 consisting of the following members of the Board:
Mr. S.M. Datta
Mr. S.R. Iyer
Mr. M.Y. Noorani
Mr. A.Y. Noorani
Mr. S.Y. Noorani
VII. Subsidiary Companies:
The Company has five subsidiary companies namely:
(1) Zodiac Finsec and Holdings Limited
(2) Zodiac Clothing Company S.A. (Switzerland)
(3) Zodiac Clothing Company (U.A.E.) LLC (step down Subsidiary)
(4) Zodiac Clothing Company INC (step down Subsidiary)
(5) Zodiac Properties Limited (step down Subsidiary)
The revised Clause 49 defines a ‘material non-listed Indian subsidiary’ as an unlisted subsidiary, incorporated in India, whose turnover or net worth (i.e. paid up capital and free reserves) exceeds 20% of the consolidated turnover or net worth respectively, of the listed holding Company and its subsidiaries in the immediately preceding accounting year.
Zodiac Clothing Company Limited does not have a ‘material non-listed Indian subsidiary’ within the meaning of the above definition.
The Audit Committee reviews the financial statements of its unlisted subsidiaries, in particular the investments made by the unlisted subsidiary companies, if any.
The Minutes of the Board Meetings of the above unlisted subsidiary companies are periodically placed before the Board of Directors of the Company. The management also brings to the attention of the Board of Directors of the Company periodically, the statement of significant transactions entered into by the unlisted subsidiaries of the company, if any.
VIII. Disclosures:i. Disclosure on materially significant related party transactions None of the transactions with any of the related parties were in conflict with the interest of the Company. The details of
all transactions with related parties in the manner required to be tabled before the Audit Committee as per the revised
Z O D I A C 31
Clause 49 of the Listing Agreement, are placed before the Audit Committee on quarterly basis. Attention of the members is drawn to the disclosures of transactions with related parties set out in the Note No. 38 of the Financial Statements for the year ended 31st March 2013.
ii. No penalties or strictures have been imposed on the Company by the Stock Exchanges or SEBI or any other Statutory Authority on any matter related to capital market during the last three years.
iii. The Board hereby confirms that no personnel have been denied access to the Audit Committee.
iv. Disclosure of Accounting Treatment
In the preparation of financial statements, no treatment materially different from that prescribed in the Accounting Standards issued by the Institute of Chartered Accountants of India as applicable has been followed.
v. Disclosure on Risk Management
The Company has laid down policies and procedures to inform Board members about the risk assessment and minimization procedures. The main objective of the Risk Management policy, as defined in manual, is to protect the property, earnings and personnel of the company against losses and legal liabilities that may be incurred due to various risks.
vi. Remuneration of Directors
Non-Executive Directors:
1. The pecuniary relationship or transactions of the Non-Executive Directors vis-à-vis the company further to note under point II [b] above have been disclosed in Note No. 38 of the Financial Statements for the year ended 31st March 2013.
2. Criteria of making payments to Non-Executive Directors:
The Non-Executive Directors are entitled to sitting fees for attending Board/ Committee Meetings, as the case may be. However, the Chairman, a Non-Executive Director, does not take sitting fees for attending Board Meetings. In addition to the above the following may also be noted:
a. Mr. Y. P. Trivedi, a Non-Executive Director, is a leading Income Tax Practitioner and a noted Supreme Court lawyer. He is a member of the Rajya Sabha. The Professional fees paid to Mr. Y.P.Trivedi are based upon his expertise in income tax matters for which the company avails his services on case-to-case basis. However, during the financial year ending 31st March 2013, no professional fees were paid to him.
b. Seven Non – Executive Independent Directors (out of the eight on the Board) have been offered 8,500 Stock Options each at a price of ` 255.40 per share in terms of ‘Zodiac Employees Stock Option Plan – 2006’.
During the Financial Year 2010-11, further 7,500 Stock Options (Second Grant) each at a price of ` 346.00 per share in terms of ‘Zodiac Employees Stock Option Plan – 2006’ have been offered to the Non –Executive Independent Directors. The Directors have the option to exercise their right of subscription for these shares in one or more tranches, within a period of 3 years commencing from January 20, 2012.
Executive Directors:
1. Each Executive Director of the Company is entitled to remuneration by way of commission not exceeding 5% of net profit as computed u/s 198 of the Companies Act, 1956 in terms of their appointment.
2. Remuneration paid/payable to Managing / Executive Directors for the year ended March 31,2013:
Name of the Director Designation Commission Contract PeriodMr. A.Y. Noorani Vice-Chairman & ` 8,450,000 April1, 2010 to Managing Director February 28, 2014Mr.S.Y. Noorani Managing Director & ` 8,450,000 April1, 2010 to President February 28, 2014
The above Executive Directors are not entitled to any sitting fees for attending the Board Meeting / Committee Meeting.
vii. Management A Management Discussion and Analysis Report forms part of the Annual Report and includes discussions on various
matters specified under clause 49(IV)(F) of the Listing Agreement.
32 Z O D I A C
There are no material Financial and commercial transactions, with Senior management personnel, where there is a personal interest that may have a potential conflict with the interest of the company at large.
viii. Prevention of Insider Trading:
The Company has framed its Insider Trading Regulations wherein rules for the preservation of price sensitive information, pre-clearance of trade, monitoring and implementation of the code of conduct are framed. This code is applicable to all Directors and such employees of the Company who are expected to have access to unpublished price sensitive information relating to the Company. Transaction for dealing in the securities of the Company during the prescribed time requires prior approval from the Company.
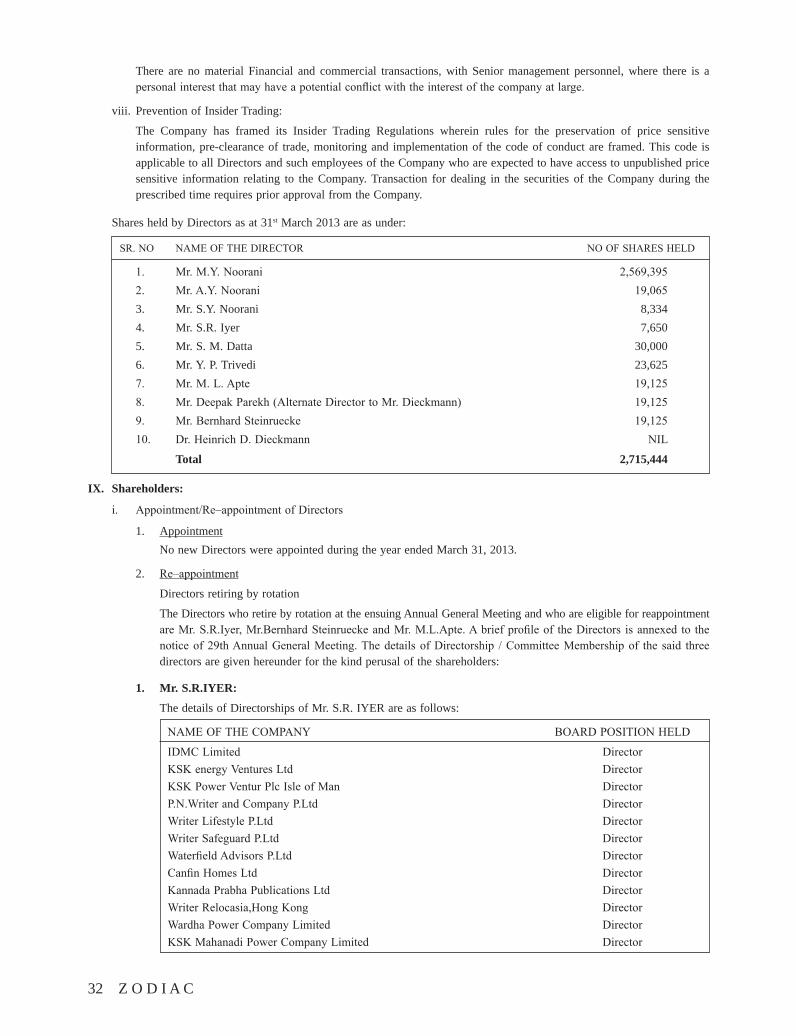
Shares held by Directors as at 31st March 2013 are as under:
SR. NO NAME OF THE DIRECTOR NO OF SHARES HELD
1. Mr. M.Y. Noorani 2,569,395 2. Mr. A.Y. Noorani 19,065 3. Mr. S.Y. Noorani 8,334 4. Mr. S.R. Iyer 7,650 5. Mr. S. M. Datta 30,000 6. Mr. Y. P. Trivedi 23,625 7. Mr. M. L. Apte 19,125 8. Mr. Deepak Parekh (Alternate Director to Mr. Dieckmann) 19,125 9. Mr. Bernhard Steinruecke 19,125 10. Dr. Heinrich D. Dieckmann NIL
Total 2,715,444
IX. Shareholders:
i. Appointment/Re–appointment of Directors
1. Appointment No new Directors were appointed during the year ended March 31, 2013.
2. Re–appointment
Directors retiring by rotation
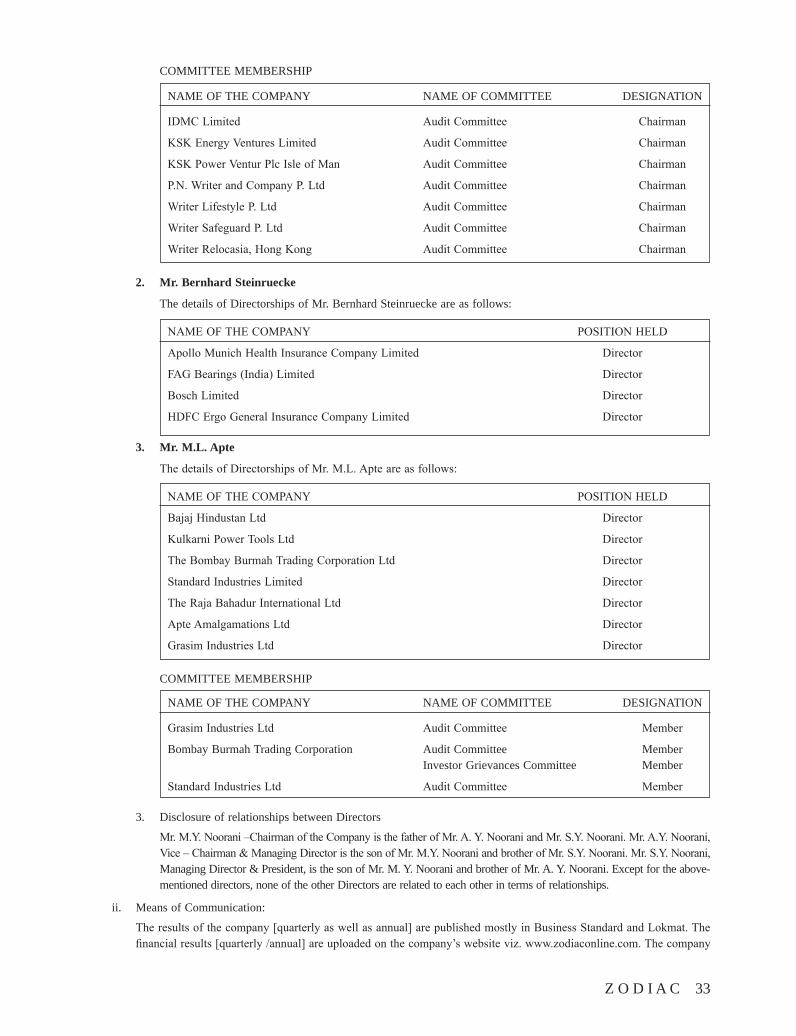
The Directors who retire by rotation at the ensuing Annual General Meeting and who are eligible for reappointment are Mr. S.R.Iyer, Mr.Bernhard Steinruecke and Mr. M.L.Apte. A brief profile of the Directors is annexed to the notice of 29th Annual General Meeting. The details of Directorship / Committee Membership of the said three directors are given hereunder for the kind perusal of the shareholders:
1. Mr. S.R.IYER:
The details of Directorships of Mr. S.R. IYER are as follows:
NAME OF THE COMPANY BOARD POSITION HELD
IDMC Limited DirectorKSK energy Ventures Ltd DirectorKSK Power Ventur Plc Isle of Man DirectorP.N.Writer and Company P.Ltd DirectorWriter Lifestyle P.Ltd DirectorWriter Safeguard P.Ltd DirectorWaterfield Advisors P.Ltd DirectorCanfin Homes Ltd DirectorKannada Prabha Publications Ltd DirectorWriter Relocasia,Hong Kong DirectorWardha Power Company Limited DirectorKSK Mahanadi Power Company Limited Director
Z O D I A C 33
COMMITTEE MEMBERSHIP
NAME OF THE COMPANY NAME OF COMMITTEE DESIGNATION
IDMC Limited Audit Committee Chairman
KSK Energy Ventures Limited Audit Committee Chairman
KSK Power Ventur Plc Isle of Man Audit Committee Chairman
P.N. Writer and Company P. Ltd Audit Committee Chairman
Writer Lifestyle P. Ltd Audit Committee Chairman
Writer Safeguard P. Ltd Audit Committee Chairman
Writer Relocasia, Hong Kong Audit Committee Chairman
2. Mr. Bernhard Steinruecke
The details of Directorships of Mr. Bernhard Steinruecke are as follows:
NAME OF THE COMPANY POSITION HELD
Apollo Munich Health Insurance Company Limited Director
FAG Bearings (India) Limited Director
Bosch Limited Director
HDFC Ergo General Insurance Company Limited Director
3. Mr. M.L. Apte
The details of Directorships of Mr. M.L. Apte are as follows:
NAME OF THE COMPANY POSITION HELD
Bajaj Hindustan Ltd Director
Kulkarni Power Tools Ltd Director
The Bombay Burmah Trading Corporation Ltd Director
Standard Industries Limited Director
The Raja Bahadur International Ltd Director
Apte Amalgamations Ltd Director
Grasim Industries Ltd Director
COMMITTEE MEMBERSHIP
NAME OF THE COMPANY NAME OF COMMITTEE DESIGNATION
Grasim Industries Ltd Audit Committee Member
Bombay Burmah Trading Corporation Audit Committee Member Investor Grievances Committee Member
Standard Industries Ltd Audit Committee Member
3. Disclosure of relationships between Directors
Mr. M.Y. Noorani –Chairman of the Company is the father of Mr. A. Y. Noorani and Mr. S.Y. Noorani. Mr. A.Y. Noorani, Vice – Chairman & Managing Director is the son of Mr. M.Y. Noorani and brother of Mr. S.Y. Noorani. Mr. S.Y. Noorani, Managing Director & President, is the son of Mr. M. Y. Noorani and brother of Mr. A. Y. Noorani. Except for the above-mentioned directors, none of the other Directors are related to each other in terms of relationships.
ii. Means of Communication:
The results of the company [quarterly as well as annual] are published mostly in Business Standard and Lokmat. The financial results [quarterly /annual] are uploaded on the company’s website viz. www.zodiaconline.com. The company
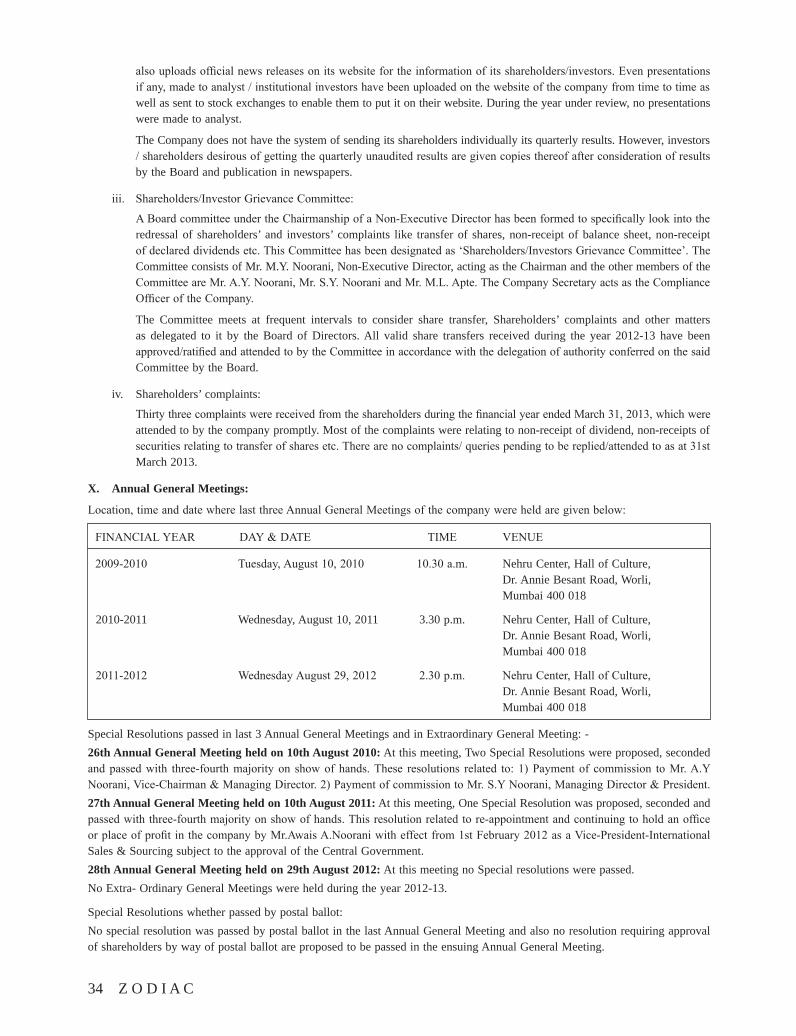
34 Z O D I A C
also uploads official news releases on its website for the information of its shareholders/investors. Even presentations if any, made to analyst / institutional investors have been uploaded on the website of the company from time to time as well as sent to stock exchanges to enable them to put it on their website. During the year under review, no presentations were made to analyst.
The Company does not have the system of sending its shareholders individually its quarterly results. However, investors / shareholders desirous of getting the quarterly unaudited results are given copies thereof after consideration of results by the Board and publication in newspapers.
iii. Shareholders/Investor Grievance Committee:
A Board committee under the Chairmanship of a Non-Executive Director has been formed to specifically look into the redressal of shareholders’ and investors’ complaints like transfer of shares, non-receipt of balance sheet, non-receipt of declared dividends etc. This Committee has been designated as ‘Shareholders/Investors Grievance Committee’. The Committee consists of Mr. M.Y. Noorani, Non-Executive Director, acting as the Chairman and the other members of the Committee are Mr. A.Y. Noorani, Mr. S.Y. Noorani and Mr. M.L. Apte. The Company Secretary acts as the Compliance Officer of the Company.
The Committee meets at frequent intervals to consider share transfer, Shareholders’ complaints and other matters as delegated to it by the Board of Directors. All valid share transfers received during the year 2012-13 have been approved/ratified and attended to by the Committee in accordance with the delegation of authority conferred on the said Committee by the Board.
iv. Shareholders’ complaints:
Thirty three complaints were received from the shareholders during the financial year ended March 31, 2013, which were attended to by the company promptly. Most of the complaints were relating to non-receipt of dividend, non-receipts of securities relating to transfer of shares etc. There are no complaints/ queries pending to be replied/attended to as at 31st March 2013.
X. Annual General Meetings:
Location, time and date where last three Annual General Meetings of the company were held are given below:
FINANCIAL YEAR DAY & DATE TIME VENUE
2009-2010 Tuesday, August 10, 2010 10.30 a.m. Nehru Center, Hall of Culture, Dr. Annie Besant Road, Worli, Mumbai 400 018
2010-2011 Wednesday, August 10, 2011 3.30 p.m. Nehru Center, Hall of Culture, Dr. Annie Besant Road, Worli, Mumbai 400 018
2011-2012 Wednesday August 29, 2012 2.30 p.m. Nehru Center, Hall of Culture, Dr. Annie Besant Road, Worli, Mumbai 400 018
Special Resolutions passed in last 3 Annual General Meetings and in Extraordinary General Meeting: -26th Annual General Meeting held on 10th August 2010: At this meeting, Two Special Resolutions were proposed, seconded and passed with three-fourth majority on show of hands. These resolutions related to: 1) Payment of commission to Mr. A.Y Noorani, Vice-Chairman & Managing Director. 2) Payment of commission to Mr. S.Y Noorani, Managing Director & President.27th Annual General Meeting held on 10th August 2011: At this meeting, One Special Resolution was proposed, seconded and passed with three-fourth majority on show of hands. This resolution related to re-appointment and continuing to hold an office or place of profit in the company by Mr.Awais A.Noorani with effect from 1st February 2012 as a Vice-President-International Sales & Sourcing subject to the approval of the Central Government.28th Annual General Meeting held on 29th August 2012: At this meeting no Special resolutions were passed.No Extra- Ordinary General Meetings were held during the year 2012-13.
Special Resolutions whether passed by postal ballot:No special resolution was passed by postal ballot in the last Annual General Meeting and also no resolution requiring approval of shareholders by way of postal ballot are proposed to be passed in the ensuing Annual General Meeting.
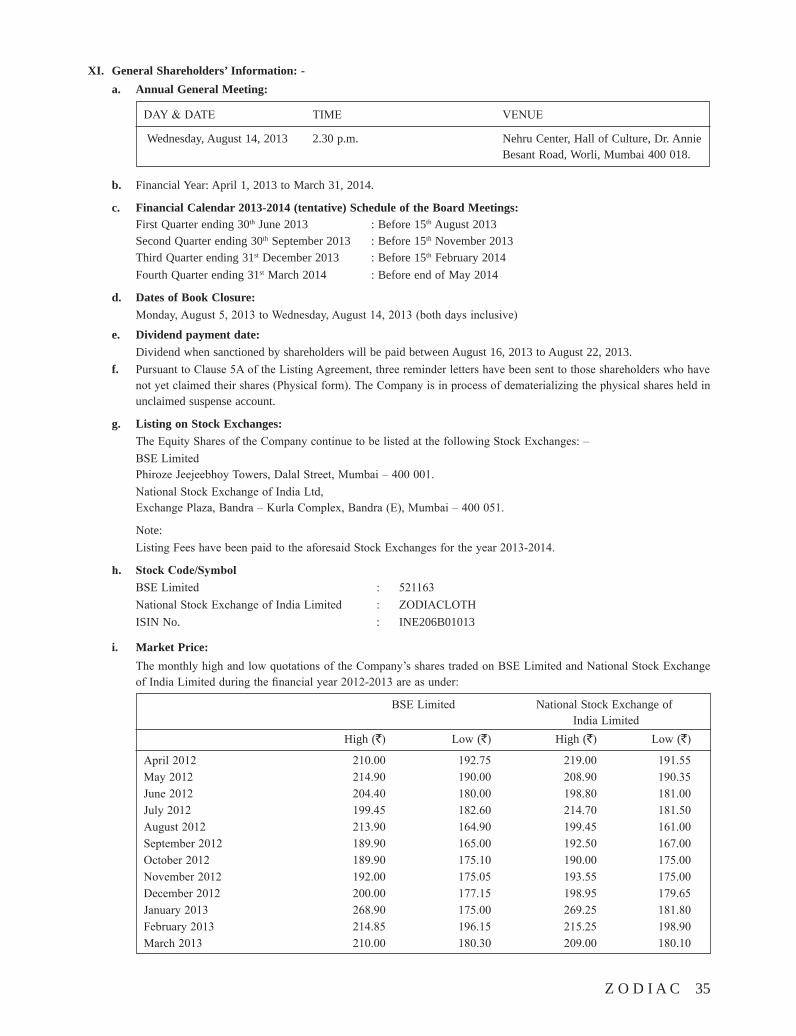
Z O D I A C 35
XI. General Shareholders’ Information: -a. Annual General Meeting:
DAY & DATE TIME VENUE
Wednesday, August 14, 2013 2.30 p.m. Nehru Center, Hall of Culture, Dr. Annie Besant Road, Worli, Mumbai 400 018.
b. Financial Year: April 1, 2013 to March 31, 2014.
c. Financial Calendar 2013-2014 (tentative) Schedule of the Board Meetings: First Quarter ending 30th June 2013 : Before 15th August 2013 Second Quarter ending 30th September 2013 : Before 15th November 2013 Third Quarter ending 31st December 2013 : Before 15th February 2014 Fourth Quarter ending 31st March 2014 : Before end of May 2014
d. Dates of Book Closure: Monday, August 5, 2013 to Wednesday, August 14, 2013 (both days inclusive)
e. Dividend payment date: Dividend when sanctioned by shareholders will be paid between August 16, 2013 to August 22, 2013.f. Pursuant to Clause 5A of the Listing Agreement, three reminder letters have been sent to those shareholders who have
not yet claimed their shares (Physical form). The Company is in process of dematerializing the physical shares held in unclaimed suspense account.
g. Listing on Stock Exchanges: The Equity Shares of the Company continue to be listed at the following Stock Exchanges: – BSE Limited
Phiroze Jeejeebhoy Towers, Dalal Street, Mumbai – 400 001. National Stock Exchange of India Ltd,
Exchange Plaza, Bandra – Kurla Complex, Bandra (E), Mumbai – 400 051.
Note: Listing Fees have been paid to the aforesaid Stock Exchanges for the year 2013-2014.
h. StockCode/Symbol BSE Limited : 521163 National Stock Exchange of India Limited : ZODIACLOTH ISIN No. : INE206B01013
i. Market Price: The monthly high and low quotations of the Company’s shares traded on BSE Limited and National Stock Exchange
of India Limited during the financial year 2012-2013 are as under:
BSE Limited National Stock Exchange of India Limited High (`) Low (`) High (`) Low (`)
April 2012 210.00 192.75 219.00 191.55May 2012 214.90 190.00 208.90 190.35June 2012 204.40 180.00 198.80 181.00July 2012 199.45 182.60 214.70 181.50August 2012 213.90 164.90 199.45 161.00September 2012 189.90 165.00 192.50 167.00October 2012 189.90 175.10 190.00 175.00November 2012 192.00 175.05 193.55 175.00December 2012 200.00 177.15 198.95 179.65January 2013 268.90 175.00 269.25 181.80February 2013 214.85 196.15 215.25 198.90March 2013 210.00 180.30 209.00 180.10
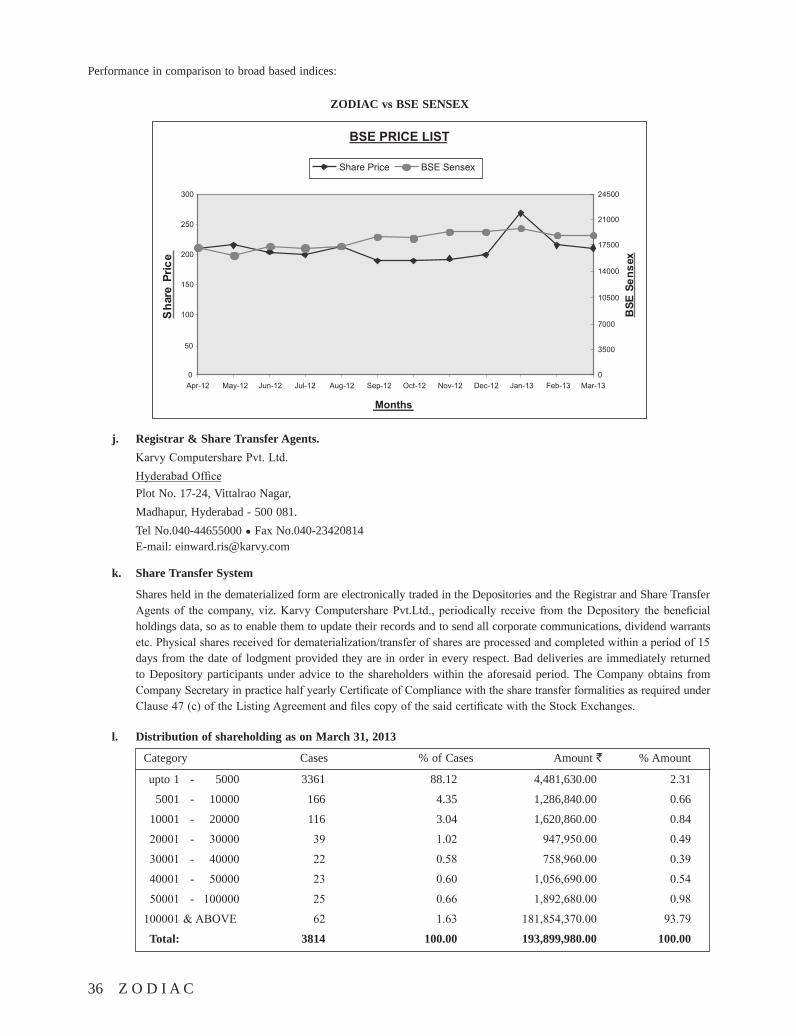
36 Z O D I A C
Performance in comparison to broad based indices:
ZODIAC vs BSE SENSEX
j. Registrar & Share Transfer Agents. Karvy Computershare Pvt. Ltd.
Hyderabad Office Plot No. 17-24, Vittalrao Nagar, Madhapur, Hyderabad - 500 081. Tel No.040-44655000 ● Fax No.040-23420814
E-mail: [email protected]
k. Share Transfer System
Shares held in the dematerialized form are electronically traded in the Depositories and the Registrar and Share Transfer Agents of the company, viz. Karvy Computershare Pvt.Ltd., periodically receive from the Depository the beneficial holdings data, so as to enable them to update their records and to send all corporate communications, dividend warrants etc. Physical shares received for dematerialization/transfer of shares are processed and completed within a period of 15 days from the date of lodgment provided they are in order in every respect. Bad deliveries are immediately returned to Depository participants under advice to the shareholders within the aforesaid period. The Company obtains from Company Secretary in practice half yearly Certificate of Compliance with the share transfer formalities as required under Clause 47 (c) of the Listing Agreement and files copy of the said certificate with the Stock Exchanges.
l. Distribution of shareholding as on March 31, 2013
Category Cases % of Cases Amount ` % Amount
upto 1 - 5000 3361 88.12 4,481,630.00 2.31
5001 - 10000 166 4.35 1,286,840.00 0.66
10001 - 20000 116 3.04 1,620,860.00 0.84
20001 - 30000 39 1.02 947,950.00 0.49
30001 - 40000 22 0.58 758,960.00 0.39
40001 - 50000 23 0.60 1,056,690.00 0.54
50001 - 100000 25 0.66 1,892,680.00 0.98
100001 & ABOVE 62 1.63 181,854,370.00 93.79
Total: 3814 100.00 193,899,980.00 100.00
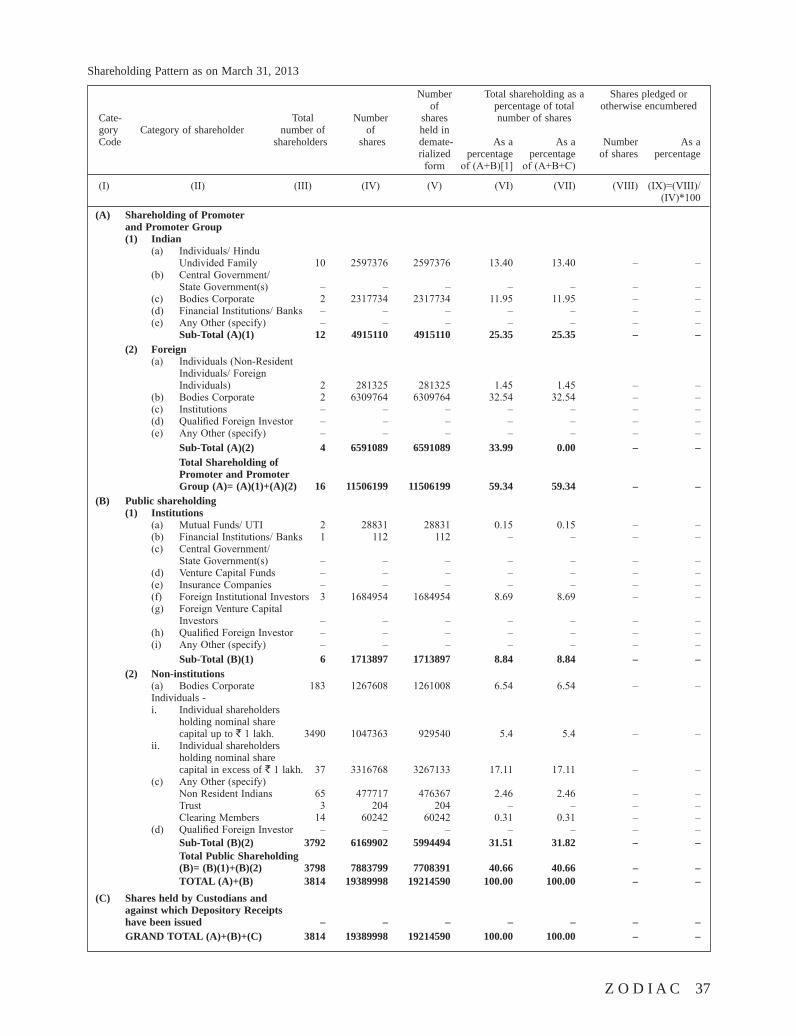
Z O D I A C 37
Shareholding Pattern as on March 31, 2013
Number Total shareholding as a Shares pledged or of percentage of total otherwise encumbered Cate- Total Number shares number of shares gory Category of shareholder number of of held in Code shareholders shares demate- As a As a Number As a rialized percentage percentage of shares percentage form of (A+B)[1] of (A+B+C)
(I) (II) (III) (IV) (V) (VI) (VII) (VIII) (IX)=(VIII)/ (IV)*100
(A) Shareholding of Promoter and Promoter Group (1) Indian (a) Individuals/ Hindu Undivided Family 10 2597376 2597376 13.40 13.40 – – (b) Central Government/ State Government(s) – – – – – – – (c) Bodies Corporate 2 2317734 2317734 11.95 11.95 – – (d) Financial Institutions/ Banks – – – – – – – (e) Any Other (specify) – – – – – – – Sub-Total (A)(1) 12 4915110 4915110 25.35 25.35 – – (2) Foreign (a) Individuals (Non-Resident Individuals/ Foreign Individuals) 2 281325 281325 1.45 1.45 – – (b) Bodies Corporate 2 6309764 6309764 32.54 32.54 – – (c) Institutions – – – – – – – (d) Qualified Foreign Investor – – – – – – – (e) Any Other (specify) – – – – – – – Sub-Total (A)(2) 4 6591089 6591089 33.99 0.00 – – Total Shareholding of Promoter and Promoter Group (A)= (A)(1)+(A)(2) 16 11506199 11506199 59.34 59.34 – –(B) Public shareholding (1) Institutions (a) Mutual Funds/ UTI 2 28831 28831 0.15 0.15 – – (b) Financial Institutions/ Banks 1 112 112 – – – – (c) Central Government/ State Government(s) – – – – – – – (d) Venture Capital Funds – – – – – – – (e) Insurance Companies – – – – – – – (f) Foreign Institutional Investors 3 1684954 1684954 8.69 8.69 – – (g) Foreign Venture Capital Investors – – – – – – – (h) Qualified Foreign Investor – – – – – – – (i) Any Other (specify) – – – – – – – Sub-Total (B)(1) 6 1713897 1713897 8.84 8.84 – – (2) Non-institutions (a) Bodies Corporate 183 1267608 1261008 6.54 6.54 – – Individuals - i. Individual shareholders holding nominal share capital up to ` 1 lakh. 3490 1047363 929540 5.4 5.4 – – ii. Individual shareholders holding nominal share capital in excess of ` 1 lakh. 37 3316768 3267133 17.11 17.11 – – (c) Any Other (specify) Non Resident Indians 65 477717 476367 2.46 2.46 – – Trust 3 204 204 – – – – Clearing Members 14 60242 60242 0.31 0.31 – – (d) Qualified Foreign Investor – – – – – – – Sub-Total (B)(2) 3792 6169902 5994494 31.51 31.82 – – Total Public Shareholding (B)= (B)(1)+(B)(2) 3798 7883799 7708391 40.66 40.66 – – TOTAL (A)+(B) 3814 19389998 19214590 100.00 100.00 – –(C) Shares held by Custodians and against which Depository Receipts have been issued – – – – – – – GRAND TOTAL (A)+(B)+(C) 3814 19389998 19214590 100.00 100.00 – –
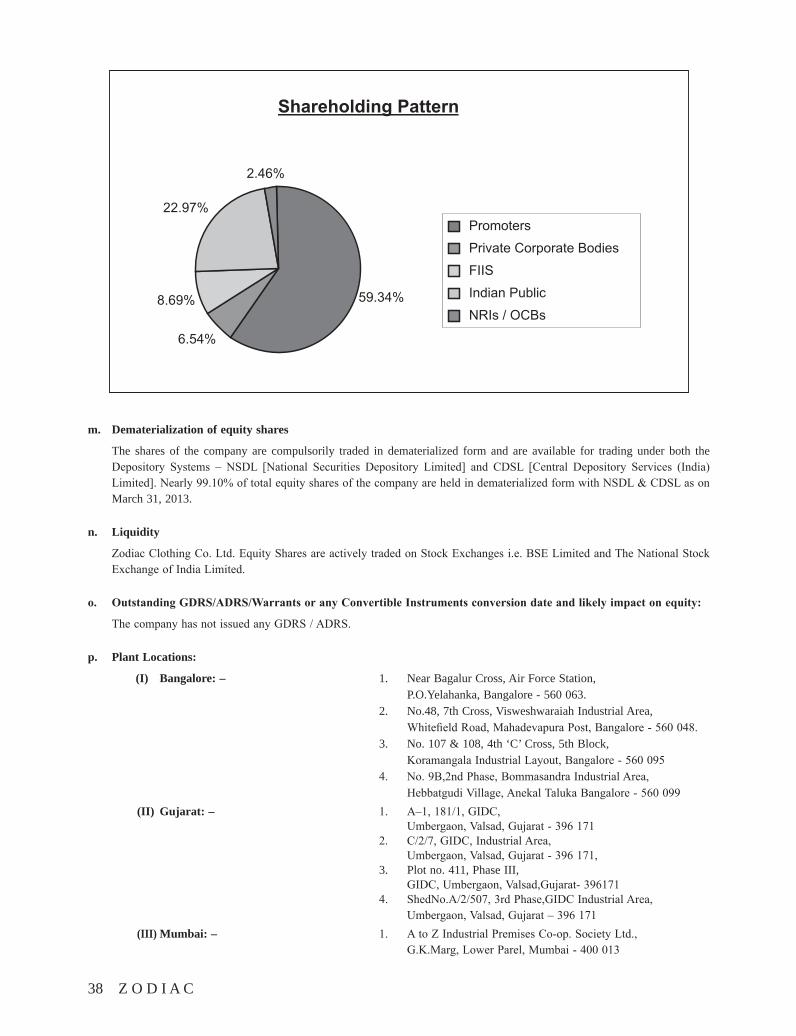
38 Z O D I A C
m. Dematerialization of equity shares
The shares of the company are compulsorily traded in dematerialized form and are available for trading under both the Depository Systems – NSDL [National Securities Depository Limited] and CDSL [Central Depository Services (India) Limited]. Nearly 99.10% of total equity shares of the company are held in dematerialized form with NSDL & CDSL as on March 31, 2013.
n. Liquidity
Zodiac Clothing Co. Ltd. Equity Shares are actively traded on Stock Exchanges i.e. BSE Limited and The National Stock Exchange of India Limited.
o. OutstandingGDRS/ADRS/WarrantsoranyConvertibleInstrumentsconversiondateandlikelyimpactonequity:
The company has not issued any GDRS / ADRS.
p. Plant Locations:
(I) Bangalore: – 1. Near Bagalur Cross, Air Force Station, P.O.Yelahanka, Bangalore - 560 063. 2. No.48, 7th Cross, Visweshwaraiah Industrial Area, Whitefield Road, Mahadevapura Post, Bangalore - 560 048. 3. No. 107 & 108, 4th ‘C’ Cross, 5th Block, Koramangala Industrial Layout, Bangalore - 560 095 4. No. 9B,2nd Phase, Bommasandra Industrial Area, Hebbatgudi Village, Anekal Taluka Bangalore - 560 099 (II) Gujarat: – 1. A–1, 181/1, GIDC, Umbergaon, Valsad, Gujarat - 396 171 2. C/2/7, GIDC, Industrial Area, Umbergaon, Valsad, Gujarat - 396 171, 3. Plot no. 411, Phase III, GIDC, Umbergaon, Valsad,Gujarat- 396171 4. ShedNo.A/2/507, 3rd Phase,GIDC Industrial Area, Umbergaon, Valsad, Gujarat – 396 171 (III) Mumbai: – 1. A to Z Industrial Premises Co-op. Society Ltd., G.K.Marg, Lower Parel, Mumbai - 400 013
Z O D I A C 39
q. Address for Investor Correspondence:
For any assistance regarding dematerialization of shares, share transfers, transmissions, change of address, non–receipt of dividend or any other query relating to shares, please write to:–
M/s. Karvy Computer Share Pvt. Ltd, at the addresses mentioned at (h) above.
For general correspondence write to: Zodiac Clothing Company Limited Nyloc House, 254, D-2, Dr. Annie Besant Road Worli Mumbai 400 030 or mail to Email: [email protected]
Shareholders holding shares in the electronic form should address their correspondence, except those relating to dividend, to their respective Depository Participants.
Note:
In terms of SEBI (Prohibition of Insider Trading) Regulations, 1992, as amended, the Board of Directors of the Company have formulated a formal ‘ Code of Conduct for Prevention of Insider Trading’ in the equity shares of the Company and the Corporate Disclosure Practices and the applicable provisions are being complied with.
In terms of Section 205C of the Companies Act, 1956 read with the Investors Education & Protection Fund (Awareness and Protection of Investor) Rules, 2001, the Company has credited to Investors Education & Protection Fund pertaining to unclaimed amount of dividend for the financial year ended March 31, 2005.
r. CEO/CFOcertification
As required by Clause 49 of the Listing Agreement, the CEO / CFO certificate is provided certificate is provided on page no.43.
s. Auditors’certificateoncorporategovernance
As required by Clause 49 of the Listing Agreement, the auditor’ certificate is given as an annexure to the Directors’ report.
t. Mandatory/Non-Mandatoryrequirements:
During the financial year 2012-13, the Company has duly complied with all mandatory requirements of Clause 49 of the Listing Agreement. Save and except, the Compensation Committee, the Company will implement other non mandatory requirements as stated in Clause 49 of the Listing Agreement at the appropriate time.
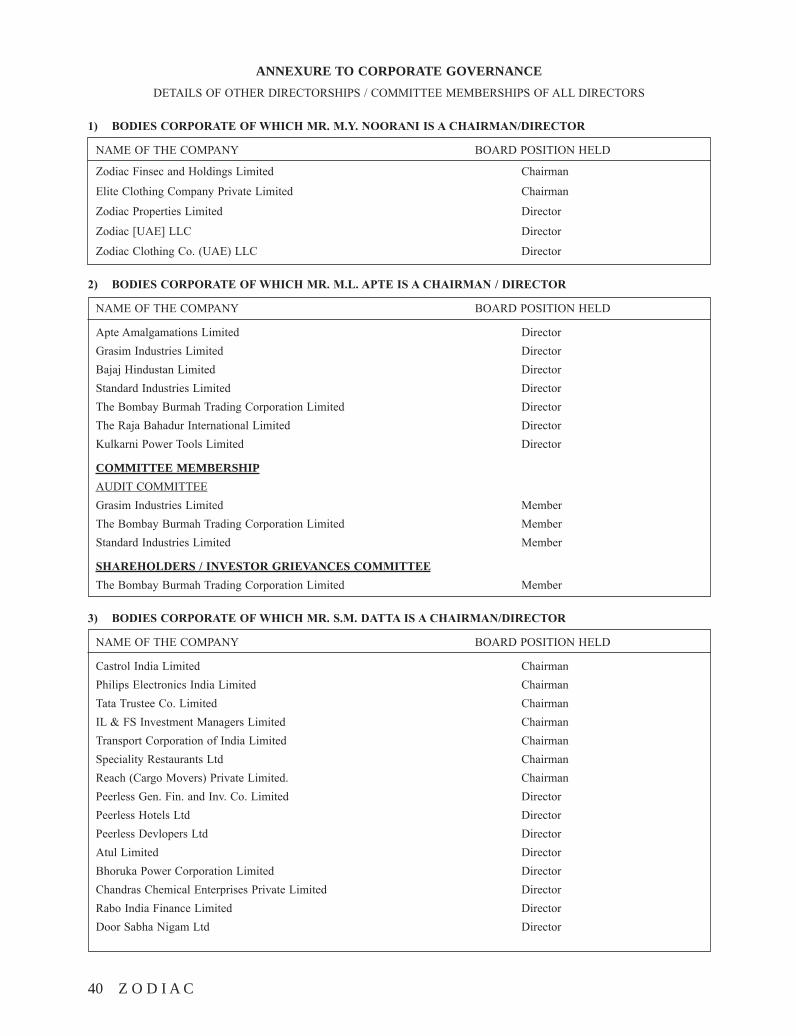
40 Z O D I A C
ANNEXURE TO CORPORATE GOVERNANCEDETAILS OF OTHER DIRECTORSHIPS / COMMITTEE MEMBERSHIPS OF ALL DIRECTORS
1) BODIESCORPORATEOFWHICHMR.M.Y.NOORANIISACHAIRMAN/DIRECTOR
NAME OF THE COMPANY BOARD POSITION HELD
Zodiac Finsec and Holdings Limited Chairman
Elite Clothing Company Private Limited Chairman
Zodiac Properties Limited Director
Zodiac [UAE] LLC Director
Zodiac Clothing Co. (UAE) LLC Director
2) BODIESCORPORATEOFWHICHMR.M.L.APTEISACHAIRMAN/DIRECTOR
NAME OF THE COMPANY BOARD POSITION HELD
Apte Amalgamations Limited DirectorGrasim Industries Limited DirectorBajaj Hindustan Limited DirectorStandard Industries Limited DirectorThe Bombay Burmah Trading Corporation Limited DirectorThe Raja Bahadur International Limited DirectorKulkarni Power Tools Limited Director
COMMITTEE MEMBERSHIPAUDIT COMMITTEEGrasim Industries Limited MemberThe Bombay Burmah Trading Corporation Limited MemberStandard Industries Limited Member
SHAREHOLDERS/INVESTORGRIEVANCESCOMMITTEEThe Bombay Burmah Trading Corporation Limited Member
3) BODIESCORPORATEOFWHICHMR.S.M.DATTAISACHAIRMAN/DIRECTOR
NAME OF THE COMPANY BOARD POSITION HELD
Castrol India Limited ChairmanPhilips Electronics India Limited ChairmanTata Trustee Co. Limited ChairmanIL & FS Investment Managers Limited ChairmanTransport Corporation of India Limited ChairmanSpeciality Restaurants Ltd ChairmanReach (Cargo Movers) Private Limited. ChairmanPeerless Gen. Fin. and Inv. Co. Limited DirectorPeerless Hotels Ltd DirectorPeerless Devlopers Ltd DirectorAtul Limited DirectorBhoruka Power Corporation Limited DirectorChandras Chemical Enterprises Private Limited DirectorRabo India Finance Limited DirectorDoor Sabha Nigam Ltd Director
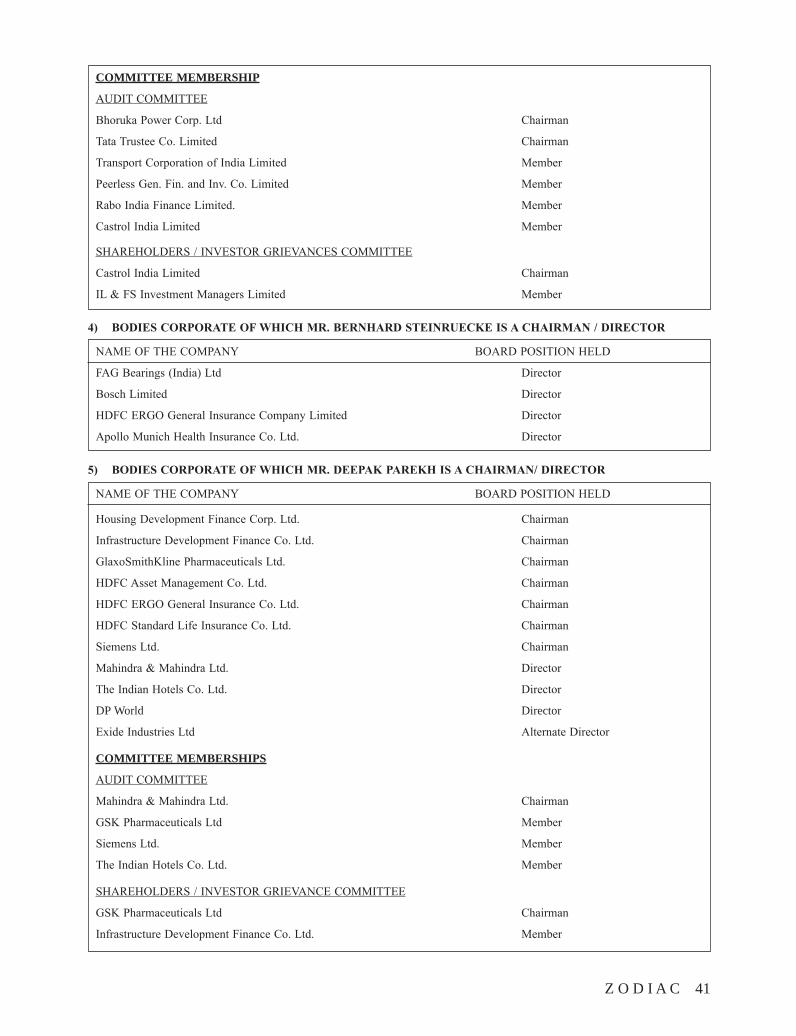
Z O D I A C 41
COMMITTEE MEMBERSHIP
AUDIT COMMITTEE
Bhoruka Power Corp. Ltd Chairman
Tata Trustee Co. Limited Chairman
Transport Corporation of India Limited Member
Peerless Gen. Fin. and Inv. Co. Limited Member
Rabo India Finance Limited. Member
Castrol India Limited Member
SHAREHOLDERS / INVESTOR GRIEVANCES COMMITTEE
Castrol India Limited Chairman
IL & FS Investment Managers Limited Member
4) BODIESCORPORATEOFWHICHMR.BERNHARDSTEINRUECKEISACHAIRMAN/DIRECTOR
NAME OF THE COMPANY BOARD POSITION HELD
FAG Bearings (India) Ltd Director
Bosch Limited Director
HDFC ERGO General Insurance Company Limited Director
Apollo Munich Health Insurance Co. Ltd. Director
5) BODIESCORPORATEOFWHICHMR.DEEPAKPAREKHISACHAIRMAN/DIRECTOR
NAME OF THE COMPANY BOARD POSITION HELD
Housing Development Finance Corp. Ltd. Chairman
Infrastructure Development Finance Co. Ltd. Chairman
GlaxoSmithKline Pharmaceuticals Ltd. Chairman
HDFC Asset Management Co. Ltd. Chairman
HDFC ERGO General Insurance Co. Ltd. Chairman
HDFC Standard Life Insurance Co. Ltd. Chairman
Siemens Ltd. Chairman
Mahindra & Mahindra Ltd. Director
The Indian Hotels Co. Ltd. Director
DP World Director
Exide Industries Ltd Alternate Director
COMMITTEE MEMBERSHIPS
AUDIT COMMITTEE
Mahindra & Mahindra Ltd. Chairman
GSK Pharmaceuticals Ltd Member
Siemens Ltd. Member
The Indian Hotels Co. Ltd. Member
SHAREHOLDERS / INVESTOR GRIEVANCE COMMITTEE
GSK Pharmaceuticals Ltd Chairman
Infrastructure Development Finance Co. Ltd. Member
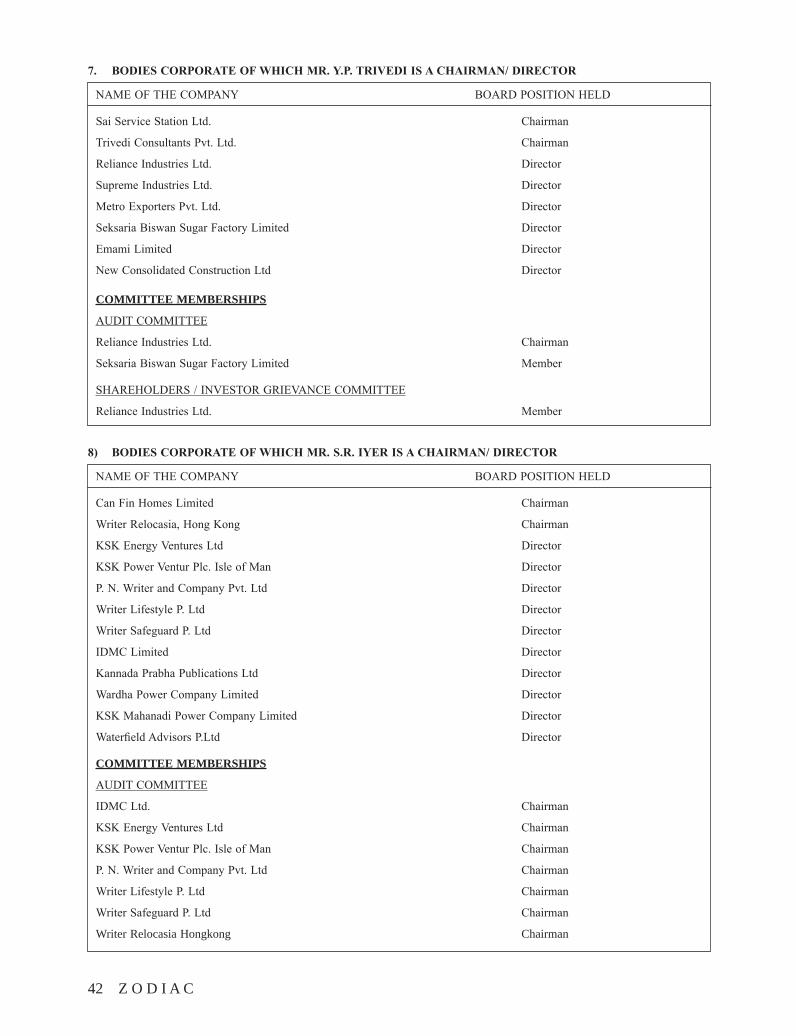
42 Z O D I A C
7. BODIESCORPORATEOFWHICHMR.Y.P.TRIVEDIISACHAIRMAN/DIRECTOR
NAME OF THE COMPANY BOARD POSITION HELD
Sai Service Station Ltd. Chairman
Trivedi Consultants Pvt. Ltd. Chairman
Reliance Industries Ltd. Director
Supreme Industries Ltd. Director
Metro Exporters Pvt. Ltd. Director
Seksaria Biswan Sugar Factory Limited Director
Emami Limited Director
New Consolidated Construction Ltd Director
COMMITTEE MEMBERSHIPS
AUDIT COMMITTEE
Reliance Industries Ltd. Chairman
Seksaria Biswan Sugar Factory Limited Member
SHAREHOLDERS / INVESTOR GRIEVANCE COMMITTEE
Reliance Industries Ltd. Member
8) BODIESCORPORATEOFWHICHMR.S.R.IYERISACHAIRMAN/DIRECTOR
NAME OF THE COMPANY BOARD POSITION HELD
Can Fin Homes Limited Chairman
Writer Relocasia, Hong Kong Chairman
KSK Energy Ventures Ltd Director
KSK Power Ventur Plc. Isle of Man Director
P. N. Writer and Company Pvt. Ltd Director
Writer Lifestyle P. Ltd Director
Writer Safeguard P. Ltd Director
IDMC Limited Director
Kannada Prabha Publications Ltd Director
Wardha Power Company Limited Director
KSK Mahanadi Power Company Limited Director
Waterfield Advisors P.Ltd Director
COMMITTEE MEMBERSHIPS
AUDIT COMMITTEE
IDMC Ltd. Chairman
KSK Energy Ventures Ltd Chairman
KSK Power Ventur Plc. Isle of Man Chairman
P. N. Writer and Company Pvt. Ltd Chairman
Writer Lifestyle P. Ltd Chairman
Writer Safeguard P. Ltd Chairman
Writer Relocasia Hongkong Chairman
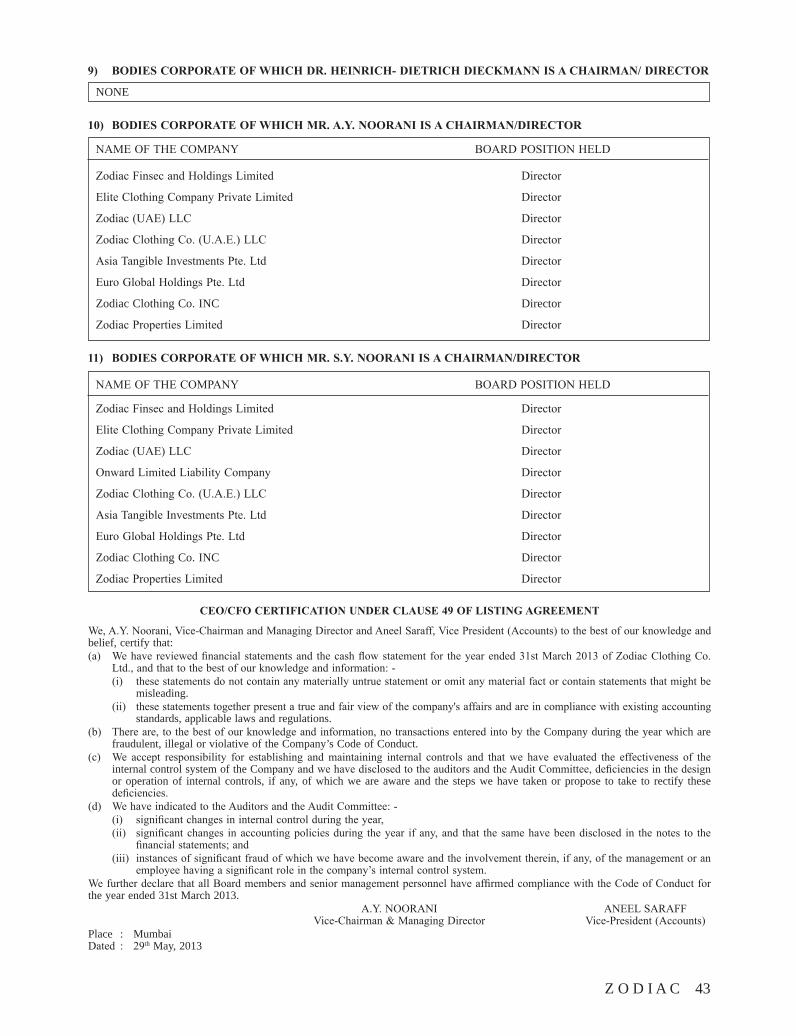
Z O D I A C 43
9) BODIESCORPORATEOFWHICHDR.HEINRICH-DIETRICHDIECKMANNISACHAIRMAN/DIRECTOR
NONE
10) BODIESCORPORATEOFWHICHMR.A.Y.NOORANIISACHAIRMAN/DIRECTOR
NAME OF THE COMPANY BOARD POSITION HELD
Zodiac Finsec and Holdings Limited Director
Elite Clothing Company Private Limited Director
Zodiac (UAE) LLC Director
Zodiac Clothing Co. (U.A.E.) LLC Director
Asia Tangible Investments Pte. Ltd Director
Euro Global Holdings Pte. Ltd Director
Zodiac Clothing Co. INC Director
Zodiac Properties Limited Director
11) BODIESCORPORATEOFWHICHMR.S.Y.NOORANIISACHAIRMAN/DIRECTOR
NAME OF THE COMPANY BOARD POSITION HELD
Zodiac Finsec and Holdings Limited Director
Elite Clothing Company Private Limited Director
Zodiac (UAE) LLC Director
Onward Limited Liability Company Director
Zodiac Clothing Co. (U.A.E.) LLC Director
Asia Tangible Investments Pte. Ltd Director
Euro Global Holdings Pte. Ltd Director
Zodiac Clothing Co. INC Director
Zodiac Properties Limited Director
CEO/CFOCERTIFICATIONUNDERCLAUSE49OFLISTINGAGREEMENT
We, A.Y. Noorani, Vice-Chairman and Managing Director and Aneel Saraff, Vice President (Accounts) to the best of our knowledge and belief, certify that:(a) We have reviewed financial statements and the cash flow statement for the year ended 31st March 2013 of Zodiac Clothing Co.
Ltd., and that to the best of our knowledge and information: - (i) these statements do not contain any materially untrue statement or omit any material fact or contain statements that might be
misleading.(ii) these statements together present a true and fair view of the company's affairs and are in compliance with existing accounting
standards, applicable laws and regulations.(b) There are, to the best of our knowledge and information, no transactions entered into by the Company during the year which are
fraudulent, illegal or violative of the Company’s Code of Conduct.(c) We accept responsibility for establishing and maintaining internal controls and that we have evaluated the effectiveness of the
internal control system of the Company and we have disclosed to the auditors and the Audit Committee, deficiencies in the design or operation of internal controls, if any, of which we are aware and the steps we have taken or propose to take to rectify these deficiencies.
(d) We have indicated to the Auditors and the Audit Committee: -(i) significant changes in internal control during the year,(ii) significant changes in accounting policies during the year if any, and that the same have been disclosed in the notes to the
financial statements; and(iii) instances of significant fraud of which we have become aware and the involvement therein, if any, of the management or an
employee having a significant role in the company’s internal control system.We further declare that all Board members and senior management personnel have affirmed compliance with the Code of Conduct for the year ended 31st March 2013. A.Y. NOORANI ANEEL SARAFF Vice-Chairman & Managing Director Vice-President (Accounts)Place : Mumbai Dated : 29th May, 2013
44 Z O D I A C
MANAGEMENT DISCUSSION AND ANALYSIS
A. OVERVIEW:
The demand situation for the branded clothing industry in India has been extremely volatile throughout the financial year, with wide fluctuations. The first two quarters were extremely difficult; the third quarter fluctuated from month to month, ending with substantial growth in December. The last quarter showed tepid growth, with the year ending with a marginal increase in sales. This naturally resulted in competition holding large inventories (planned on the basis of those periods during the year when the demand showed very promising trends), due to the negative sentiment generated by adverse economic, social and political developments. Distress caused by large inventories again resulted in almost consistent discounting by the several players in the industry as well as soft terms like consignment sale/stock correction being offered by them. This resulted in these players being able to show small growth, while players that did not offer discounts/soft terms, showed marginal growth. The brands from the House of Zodiac continue to neither discount nor offer soft terms.
An analysis published by a credible institution projects growth in clothing sales to improve marginally on account of better consumer sentiment in 2013-14.
With the economic problems faced by the Euro Zone continuing, the serious decline in demand is of concern. In a futile attempt to induce volume growth, the retail prices offered to end consumers in the EU for like-to-like products (albeit of lower quality) were reduced considerably, despite which brands and retailers enjoying healthier margins.
The demand situation in the US, although somewhat better than in the EU, continued to be weak. Consumers there too enjoy lower prices at retail, with better margins for brands/retailers.
Pricing and margins in Europe as well as in the US were facilitated by the now well-known malpractices in Bangladesh. Despite Bangladesh enjoying preferential tariffs of “zero” duty in the EU, wages paid to the workers have been abysmally low, i.e. the equivalent of ` 2,000/- per month, for much longer working hours than those permitted in law-abiding countries like India, with human rights violations, non-enforcement of already-weak labour laws; working conditions there are hazardous, resulting in several widely-reported industrial accidents, one of which resulted in as many casualties as the Bhopal disaster. Will the uproar generated globally endure? Consumer polls in the US and some European countries show a significant number of consumers there are checking the “country of origin” labels on clothing and refusing to buy clothing of Bangladeshi origin.
Bangladesh has been one of the biggest beneficiaries of India's biggest weakness - the failure to correct the situation with regard to “export” of its taxes, as well as address its cost disabilities. This resulted in a situation where the export of clothing from India (cotton / man-made fibres / wool / others) has declined for the period April 2012 to March 2013 to USD 12.7 bn from USD 13.4 bn in the previous year, a decline of 5.5% in USD terms. However, in Rupee terms, the total exports are worth ` 69,000 crores vs. ` 64,341 crores in the previous year, an increase of approximately 7% due to the sharp depreciation of the Rupee.
Importers of clothing invoke the depreciation of the rupee as a reason for demanding lower prices, which results in lower USD realisation. This means that the exporter of clothing would not receive very much more in Rupees, despite depreciation of the INR. Besides, the small gain in rupee terms has been considerably eroded by inflation, which remained stubbornly high throughout the year.
The relevant Accounting Standards requiring MTM of Forex gains and losses has had a somewhat lower impact during the year than it did in the previous year. In case of the company, the Forex Policy has also played a part in the reduction of profits for the year.
The industry has made strong efforts to build other markets, which is beginning to show some positive signs. This has also been made possible due to the Government policy encouraging the development of new markets through the Special Focus Market Scheme and Market-Linked Focus Product Scrip.
The situation vis-a-vis competition is that China has had to perforce divert production of clothing for export because of its demographics (aging population), rising labour costs propelling available labour away from labour-intensive industries like clothing to higher value added industries – besides, China has also been making a conscious effort to increase consumer demand within China, resulting in some production being diverted for consumption within China. However, they have shifted significant portions of their export production base offshore, to countries like Bangladesh, Myanmar, Vietnam and Cambodia.
There has been a clear trend in increase in prices of cotton yarn and fabrics produced in India,with the second half showing a 10% increase in prices. International fabric prices in Rupee terms, have also been higher due to sharp depreciation of the Rupee. This has impacted profit margins, which have been exacerbated because of other factors as well.
Z O D I A C 45
The FTA with the EU which has been under discussion since 2007, has been in the final stages with just a few products continuing to be discussed, for nearly a year. There is also discussion on IPR, resulting from recent Court judgements in India which have adversely impacted the sentiment of large Pharma companies. Agreement has yet to be reached in declaring India “Data Secure” as well.
Should the FTA be concretised in meetings scheduled in June, as well as if the anti-Bangladesh consumer pressure in the markets pushes EU/US buyers to reduce their exposure to sourcing clothing from Bangladesh, this would work in India's favour to regain market share lost to Bangladesh in the last few years.
During the year, the Government has excluded the clothing industry from the purview of Central Excise, which is a major relief for the industry in branded business in India, as well as for the international business. The relief is particularly appreciated by the export segment of the industry as the transaction costs incurred in compliance with Excise formalities (by virtue of the simplified procedures not having been notified for the industry when Excise was reintroduced in March 2011, in line with the simplified procedure prevalent when the industry was brought under Excise in 2001) could cease.
The industry looks to the Government to take the lead role in (a) fast track negotiation of favourable Trade Agreements (especially concretising the FTA with the EU before elections in India/Germany); (b) helping eliminate the “export” of India's taxes by virtue of an efficient mechanism to fully insulate and reimburse taxes of any type, with a delivery system that eliminates delays; (c) minor tweaking of labour laws; (d) encouraging the export segment of the industry to diversify into the Indian market as well to enable them to build themselves into truly strong globally competitive players/brands; (e) encouraging building of “Brand India”,besides innovation and product development.
The above suggestions would result in helping achieve higher unit realisation in some cases, and reduction in cost in all cases. They would sharpen India's competitiveness considerably and enable us to gain substantial market share in new markets, as also in recapturing lost market share in the EU and the US when their economies stabilise – the US is already showing signs of improvement.
This is one industry which can definitely address the most serious problem the country is facing, i.e. the Current Account deficit, besides creating gender-sensitive employment, in compliance with prevalent Laws of the Land.
B. INDUSTRY STRUCTURE AND DEVELOPMENTWith the evolving global scenario, the market situation in the EU and the US offers no scope for growth in the
near term. The industry will have to seek opportunities from other countries, in some of which a beginning has already been made. From these new markets a few have shown a trend of promising growth, while others have the potential to grow rapidly. It would be feasible to attempt to aspire to cover deficits if any, (in the EU /US), plus show a moderate overall growth by intensifying efforts in new markets. This could convert the weakness of the EU/US into an opportunity. Business built in new markets would result in substantial overall growth when the EU/US revert to normalcy in due course. As pointed out repeatedly, this would require Government and business, to act in total unison as a team, in the national interest.
The situation in the competing countries is that China directly would probably yield ground, notwithstanding the fact that they are building offshore production bases in countries where wages are abysmally low, and where there are preferential tariffs and treaties like FTA/RTA - within this group is Bangladesh, which has its own set of serious problems, and which may also yield market share consequently, at least in the near term. Myanmar, Vietnam and Cambodia will continue to be a force to reckon with.
The other block of competition is from countries like Turkey, East European countries (decreasingly) and North African countries. From these, Turkey continues to be a strong player, although if the current unrest there escalates, Turkey could yield some ground. East Europe is already yielding ground. North African countries are becoming more important because of their geographical and Treaty benefits and could stand to gain, but would not be able to absorb all the ground that will be yielded specially by the East European countries. This could be another opportunity for India, for which a strategic initiative has to be evolved by Government and industry jointly.
With regard to capturing the evolving opportunities, one has to be realistic that India cannot compete with low-wage countries (with human rights violations and unfair labour practices, to boot), on matching labour costs, given the need in India for inclusive growth. India, therefore, would need to combat this by a strategy of reduction in cost combined with achieving higher unit realisation. To do this, it would mean that favourable Trade Agreements (the Indo-EU FTA being the lowest hanging fruit), are absolutely vital and doable, because of the reciprocity that India can offer by way of access to the Indian market, which the entire world is lusting after.
Drastic reduction in the time to market is something which India will have to tackle on a war footing. We desperately need deep water ports on each of the east and west coasts of India. This would help in reducing time
46 Z O D I A C
to market, besides driving down freight costs for both exports, as well as for import of raw material.
It is remarkable that China has started a Container Rail Service from Chongqing to the heart of Europe (Leipzig, Duisburg and Hamburg) via Russia, Kazakhstan, Belarus and Poland. The transit time is 15 - 16 days and there is a daily service. Another Container Rail Service from Schenzen to Rotterdam will be via Myanmar, Bangladesh, India, Pakistan, Iran and Turkey. It is reported that Deutsche Bahn and Schenker (both German companies) are involved in Container Rail Service as well.
A Container Rail Service from India (immediately by hooking on to the Schenzen – Rotterdam service, which will pass through India) and subsequently our own service originating in India, would not only bring a dramatic transformation to our two-way trade with Europe, but also address our infrastructure/logistics deficiencies (for export) post haste.
Time to Market will also be driven by rationalisation in Licensing as was done in 1991 (which was the turning point for our economy). We need to scrap the the Advance Licence/EODC system, which system belongs to a different era - several items of textiles were not permitted to be imported, and if they were, the rates of duty were much higher than they are today. Most of our competitor countries have a system where data is maintained of the value of fabric imported duty free and value of total clothing exports, with a separate reconciliation in value terms of exports (without claiming of Drawback) against duty free imports, and is submitted to the authorities periodically, and compulsorily squared up at the end of each financial year.
The discharge of Advance Licence applications is an extremely painful and time-consuming process, which requires an entire department working full time only on fulfilling this onerous/unproductive task. A simple method, as is followed in competitor countries is the need of the hour.
The immediate arrest of “export” of India's taxes and a mechanism to fully insulate and reimburse taxes of any kind via a delivery system that totally eliminates delays is vital.
Seamless disbursement of Drawback (including Refund of Service Tax via drawback) in full and in a timely manner without arbitrary deductions and without demands for repayment of Drawback disbursed because the Bank Realisation Certificate/CA's Certificate are not traceable at the port (where they have been furnished by Speed Post, and in some cases, also by Registered AD as a measure of abundant precaution) is an absolute prerequisite.
While the interest rate subvention is a step in the right direction, the differential between international cost of funds (Libor + 100 to 300 BPS, depending on the credit rating of a company) and the rate of interest after subvention, is unsustainable. Funds must be made available at international pricing, preferably in Rupees.
Minor Tweaking of Labour Laws (Overtime)
Under the Factories Act, the quantum of overtime (with a 100% surcharge, i.e. double the wages) is restricted to 2 hours a day. China allows upto 4 hours overtime in a day. It is good for India to take a stand of not allowing more than 2 hours a day to prevent exploitation of labour. The limit provided under the Act is 48 hours a month, which is in keeping with the policy of 2 hours a day. However, what is completely illogical is that the Act also provides, in the next sentence, a cap of 50 hours a quarter. Whereas if overtime is limited to 2 hours per day, 24 working days a month which is 48 hours a month, the limit of 50 hours a quarter needs to be revised upwards to 144 hours a quarter, to be consistent with 2 hours a day and 48 hours a month.
Reduction/Elimination of invisible costs including“Transaction Costs” and change in Adminisrative Laws
The arbitrariness/perversity in the interpretation/implementation of laws, now sought to be armed with powers to categorise them into cognizable, non-bailable offences has to be eliminated. Unsustainable demands, merely to meet revenue targets/ timelines drag people into needless expensive litigation, a national waste.
TDS
Today, TDS is required to be deducted on commission remitted to a person not resident in India, providing the service of obtaining export orders outside India, for the export of goods from India.
Alternatively, the Indian company is required to obtain a NOC under section 195 from the Assessing Officer in advance.
CBDT's Circular No. 786 dated 07.02.2000 was in force until 22.10.2009, when it was inexplicably withdrawn. After withdrawal of this Circular, the Assessing Officers have raised huge demands on exporters on a retrospective basis, i.e., for the period even before the withdrawal of Circular No. 786 in some instances. This creates unproductive work in terms of appeals/litigation, besides loss of liquidity pending disbursal of refunds.
The export sector needs a Circular to be issued by CBDT to reinstate Circular No. 786; a stoppage of retrospective demands from being issued for the period prior to the withdrawal of Circular No. 786; withdrawal of demands
Z O D I A C 47
raised under the retrospective demands raised after withdrawal of Circular No. 786 are also necessary.
SERVICE TAX
The three items impacting the exporter are the increase in the rate of Service Tax, the number of services on which Service Tax is payable by the exporter being widened very considerably, (i.e., they are not in the exempted/negative category as they were hitherto E.g. Insurance Service, Testing, Certification, Clearing Services at Port, Storage Warehousing, Courier Agency Services, which play a vital role and have a direct impact on the cost of goods exported, eroding India's competitiveness), and are certain services where Service Tax is to be partly paid by the receiver of services and partly by the provider of services, which is a formula for disaster, because in the first place, there is no clarity, and secondly, the procedural formalities are highly onerous and time consuming and, therefore, expensive.
To recap, exporters deserve that services not requiring exporters to pay Service Tax in the first instance (as per policy in force hitherto), needs to be restored forthwith i.e., that no Service Tax should be payable on these services – or better still, on ANY service, as per global practice.
If at all Service Tax has to be paid and refunded, items hitherto exempted should continue to remain exempted, as stated above, i.e. no Service Tax should be payable by exporters on these, in the first instance. The all-industry rate for ready made garments should be revised from 0.18% (18 BPS) i.e., suitably enhanced to reflect the impact of the new services that have been brought under the scope of Service Tax, which would impact the cost of goods exported, some of which are hidden/embedded/not easily identifiable.
COST AUDIT
The Government has made it mandatory for all companies fulfilling certain criteria to appoint Cost Auditors for Cost Compliance Reports. They have subsequently further made it mandatory for Cost Accounting records to also be audited. Not only is this adding to complexity for exporters, it is also imposing a fresh burden in terms of money.
International customers are increasingly demanding “open costings” - the GOI order would give this to the international buyer on a platter, because currently with tremendous efforts exporters have been able to withhold costing data from the buyers.
The request is to modify the order of 24.01.2012 increasing the turnover criteria from ` 100 crores and above to ` 1,000 crores and above. The criteria of including Listed Companies, even otherwise, should be dropped.
This would give relief to companies with a turnover below ` 1,000 crores and exporters who are listed on the Stock Exchanges.
These are some issues Government and industry have to tackle jointly, on a war footing, in a time-bound manner.
With liberalisation of FDI in retailing in September 2012, one hoped for a rush of international companies, who were waiting anxiously to build a presence in India. Sadly, the implementation of the policy guidelines has not captured its spirit (because it is so micro-managed and complicated), making large international players hold back. One cannot blame them for being wary, given the experience of several international companies in the recent past with regard to grey areas in taxation and in various other regulations. Complete clarity needs to be achieved at the earliest to ensure that India does not get a go by, miss the bus at this juncture, and lose the chance to attract sorely needed foreign capital to pull the economy out of the rut it is in.
Above all, the Government needs, as we have stated before, to eliminate the negative sentiment and to re-kindle demand in India. The opportunities presented by the steps taken in this direction need to be captured fully by clear cut and transparent guidelines, which do not undergo frequent changes.
The perception globally is that India is not moving fast enough, and when it moves, it is moving haltingly with complexity added, and not speedily enough.
C. OPPORTUNITIES AND THREATSOpportunities that emerged because of the demographic changes in China - their workforce migrating to higher value added industries and the economic situation in China necessitating greater focus by China on increasing domestic consumption, present the opportunity of capturing some of the ground that China would yield directly, notwithstanding their attempt to substitute their own production with offshore production to hold on to their dominant market share.
Only India and China have the entire clothing chain, i.e. from raw material to finished goods.
The big opportunity is that of the much-delayed possible FTA with the EU. Despite the travails of the EU presently, India should certainly be able to capture greater market share, although of a smaller market in the near term.
The recent depreciation of the Rupee has opened possibilities to sharpen India's competitiveness somewhat, although a handful of experts opine that the Rupee is still over valued considering the rate of Indian/Global inflation.
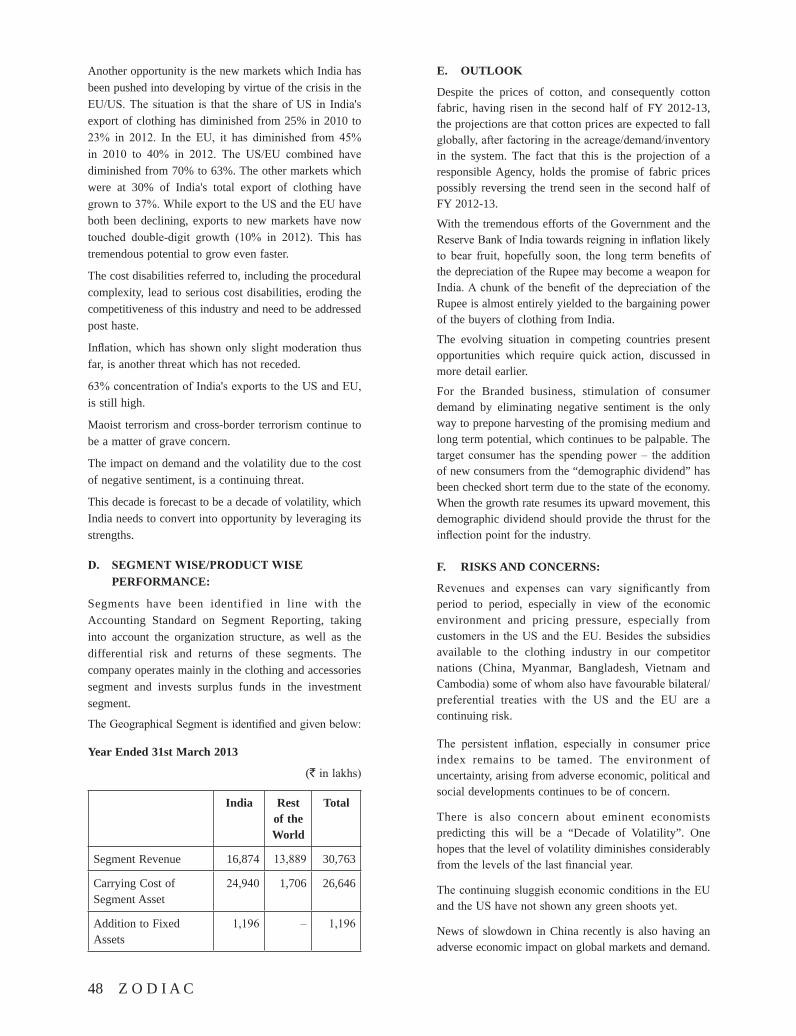
48 Z O D I A C
Another opportunity is the new markets which India has been pushed into developing by virtue of the crisis in the EU/US. The situation is that the share of US in India's export of clothing has diminished from 25% in 2010 to 23% in 2012. In the EU, it has diminished from 45% in 2010 to 40% in 2012. The US/EU combined have diminished from 70% to 63%. The other markets which were at 30% of India's total export of clothing have grown to 37%. While export to the US and the EU have both been declining, exports to new markets have now touched double-digit growth (10% in 2012). This has tremendous potential to grow even faster.
The cost disabilities referred to, including the procedural complexity, lead to serious cost disabilities, eroding the competitiveness of this industry and need to be addressed post haste.
Inflation, which has shown only slight moderation thus far, is another threat which has not receded.
63% concentration of India's exports to the US and EU, is still high.
Maoist terrorism and cross-border terrorism continue to be a matter of grave concern.
The impact on demand and the volatility due to the cost of negative sentiment, is a continuing threat.
This decade is forecast to be a decade of volatility, which India needs to convert into opportunity by leveraging its strengths.
D. SEGMENTWISE/PRODUCTWISE PERFORMANCE:
Segments have been identified in line with the Accounting Standard on Segment Reporting, taking into account the organization structure, as well as the differential risk and returns of these segments. The company operates mainly in the clothing and accessories segment and invests surplus funds in the investment segment.
The Geographical Segment is identified and given below:
Year Ended 31st March 2013
(` in lakhs)
India Rest of the World
Total
Segment Revenue 16,874 13,889 30,763
Carrying Cost of Segment Asset
24,940 1,706 26,646
Addition to Fixed Assets
1,196 – 1,196
E. OUTLOOK
Despite the prices of cotton, and consequently cotton fabric, having risen in the second half of FY 2012-13, the projections are that cotton prices are expected to fall globally, after factoring in the acreage/demand/inventory in the system. The fact that this is the projection of a responsible Agency, holds the promise of fabric prices possibly reversing the trend seen in the second half of FY 2012-13.
With the tremendous efforts of the Government and the Reserve Bank of India towards reigning in inflation likely to bear fruit, hopefully soon, the long term benefits of the depreciation of the Rupee may become a weapon for India. A chunk of the benefit of the depreciation of the Rupee is almost entirely yielded to the bargaining power of the buyers of clothing from India.
The evolving situation in competing countries present opportunities which require quick action, discussed in more detail earlier.
For the Branded business, stimulation of consumer demand by eliminating negative sentiment is the only way to prepone harvesting of the promising medium and long term potential, which continues to be palpable. The target consumer has the spending power – the addition of new consumers from the “demographic dividend” has been checked short term due to the state of the economy. When the growth rate resumes its upward movement, this demographic dividend should provide the thrust for the inflection point for the industry.
F. RISKS AND CONCERNS:
Revenues and expenses can vary significantly from period to period, especially in view of the economic environment and pricing pressure, especially from customers in the US and the EU. Besides the subsidies available to the clothing industry in our competitor nations (China, Myanmar, Bangladesh, Vietnam and Cambodia) some of whom also have favourable bilateral/preferential treaties with the US and the EU are a continuing risk.
The persistent inflation, especially in consumer price index remains to be tamed. The environment of uncertainty, arising from adverse economic, political and social developments continues to be of concern.
There is also concern about eminent economists predicting this will be a “Decade of Volatility”. One hopes that the level of volatility diminishes considerably from the levels of the last financial year.
The continuing sluggish economic conditions in the EU and the US have not shown any green shoots yet.
News of slowdown in China recently is also having an adverse economic impact on global markets and demand.
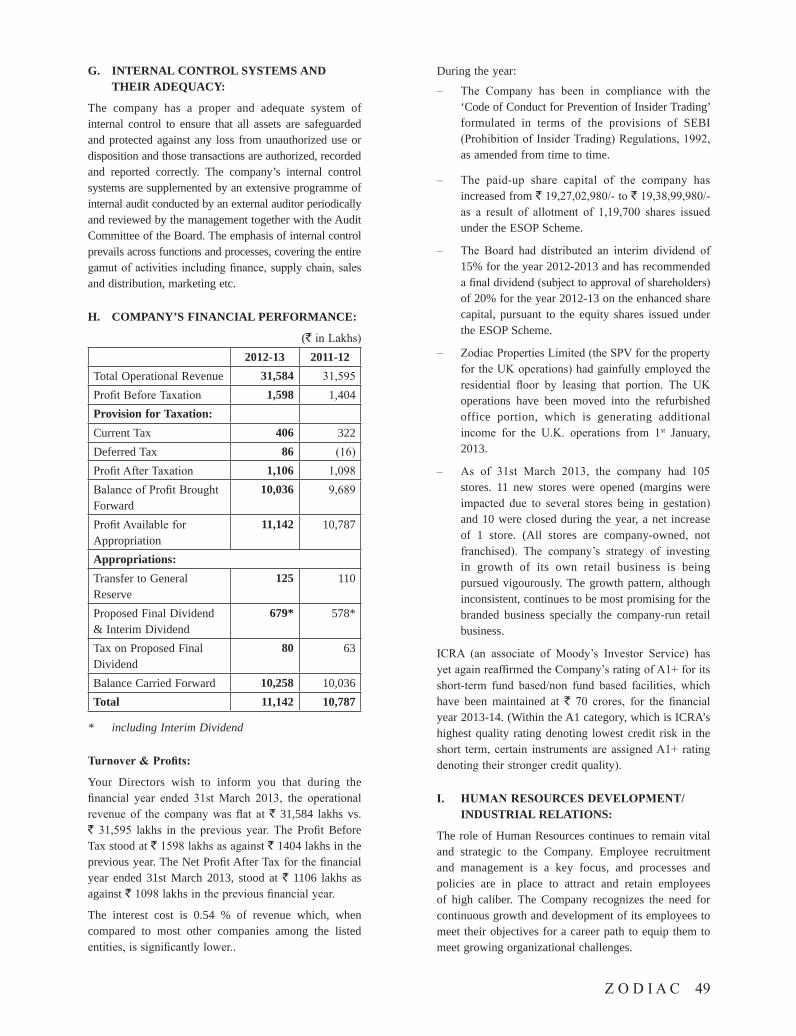
Z O D I A C 49
G. INTERNAL CONTROL SYSTEMS AND THEIR ADEQUACY:
The company has a proper and adequate system of internal control to ensure that all assets are safeguarded and protected against any loss from unauthorized use or disposition and those transactions are authorized, recorded and reported correctly. The company’s internal control systems are supplemented by an extensive programme of internal audit conducted by an external auditor periodically and reviewed by the management together with the Audit Committee of the Board. The emphasis of internal control prevails across functions and processes, covering the entire gamut of activities including finance, supply chain, sales and distribution, marketing etc.
H. COMPANY’S FINANCIAL PERFORMANCE:
(` in Lakhs)2012-13 2011-12
Total Operational Revenue 31,584 31,595Profit Before Taxation 1,598 1,404Provision for Taxation:Current Tax 406 322Deferred Tax 86 (16)Profit After Taxation 1,106 1,098Balance of Profit Brought Forward
10,036 9,689
Profit Available for Appropriation
11,142 10,787
Appropriations:Transfer to General Reserve
125 110
Proposed Final Dividend & Interim Dividend
679* 578*
Tax on Proposed Final Dividend
80 63
Balance Carried Forward 10,258 10,036Total 11,142 10,787
* including Interim Dividend
Turnover&Profits:
Your Directors wish to inform you that during the financial year ended 31st March 2013, the operational revenue of the company was flat at ` 31,584 lakhs vs. ` 31,595 lakhs in the previous year. The Profit Before Tax stood at ` 1598 lakhs as against ` 1404 lakhs in the previous year. The Net Profit After Tax for the financial year ended 31st March 2013, stood at ` 1106 lakhs as against ` 1098 lakhs in the previous financial year.
The interest cost is 0.54 % of revenue which, when compared to most other companies among the listed entities, is significantly lower..
During the year:
– The Company has been in compliance with the ‘Code of Conduct for Prevention of Insider Trading’ formulated in terms of the provisions of SEBI (Prohibition of Insider Trading) Regulations, 1992, as amended from time to time.
– The paid-up share capital of the company has increased from ` 19,27,02,980/- to ` 19,38,99,980/- as a result of allotment of 1,19,700 shares issued under the ESOP Scheme.
– The Board had distributed an interim dividend of 15% for the year 2012-2013 and has recommended a final dividend (subject to approval of shareholders) of 20% for the year 2012-13 on the enhanced share capital, pursuant to the equity shares issued under the ESOP Scheme.
– Zodiac Properties Limited (the SPV for the property for the UK operations) had gainfully employed the residential floor by leasing that portion. The UK operations have been moved into the refurbished office portion, which is generating additional income for the U.K. operations from 1st January, 2013.
– As of 31st March 2013, the company had 105 stores. 11 new stores were opened (margins were impacted due to several stores being in gestation) and 10 were closed during the year, a net increase of 1 store. (All stores are company-owned, not franchised). The company’s strategy of investing in growth of its own retail business is being pursued vigourously. The growth pattern, although inconsistent, continues to be most promising for the branded business specially the company-run retail business.
ICRA (an associate of Moody’s Investor Service) has yet again reaffirmed the Company’s rating of A1+ for its short-term fund based/non fund based facilities, which have been maintained at ` 70 crores, for the financial year 2013-14. (Within the A1 category, which is ICRA’s highest quality rating denoting lowest credit risk in the short term, certain instruments are assigned A1+ rating denoting their stronger credit quality).
I. HUMANRESOURCESDEVELOPMENT/ INDUSTRIAL RELATIONS:
The role of Human Resources continues to remain vital and strategic to the Company. Employee recruitment and management is a key focus, and processes and policies are in place to attract and retain employees of high caliber. The Company recognizes the need for continuous growth and development of its employees to meet their objectives for a career path to equip them to meet growing organizational challenges.
50 Z O D I A C
COMPLIANCE CERTIFICATE
Auditors’CertificatetotheMembersofZodiacClothingCompanyLimitedonCompliancewiththeConditionsof Corporate Governance for the Year Ended 31st March, 2013, Under Clause 49 of the Listing Agreements with Relevant Stock Exchanges.
1. We have examined the compliance of the conditions of Corporate Governance by Zodiac Clothing Company Limited (“the Company”), for the year ended 31st March 2013, as stipulated in clause 49 of the listing agreements of the said Company with relevant stock exchanges in India (hereinafter referred to as clause 49).
2. The compliance of the conditions of corporate governance is the responsibility of the management. Our examination has been limited to a review of procedures and implementation thereof, adopted by the Company for ensuring compliance with the conditions of Corporate Governance as stipulated in the said clause. It is neither an audit nor an expression of opinion on the financial statements of the Company.
3. In our opinion and to the best of our information and according to the explanations given to us,
and the representations made by the Directors and the Management, we certify that the Company has complied, in all material respects, with the conditions of corporate governance as stipulated in Clause 49.
4. We further state that such compliance is neither an assurance as to the future viability of the Company nor of efficiency or effectiveness with which the management has conducted the state of affairs of the Company.
FOR DELOITTE HASKINS & SELLS Chartered Accountants
(Registration No.117366W)
Rajesh K. Hiranandani Place: Mumbai Partner Dated: 29th May, 2013 (Membership No : 36920)
Industrial relations have continued to be harmonious at all units throughout the year. Measures for safety of employees, welfare and development continue to receive top priority.
J. CAUTIONARY STATEMENT:
Statements in this report on Management Discussion and Analysis describing the company’s objectives, expectations or predictions may be forward looking statements within the meaning of applicable security laws or regulations. These statements are based on certain assumptions and expectations of future events. Actual results could however differ materially from those
expressed or implied. Important factors that could make a difference to the company’s operation include global demand-supply conditions, finished goods prices, raw materials cost and availability, changes in government regulations and tax structure, economic developments within India and the countries with which the company has business contacts and other factors such as litigation and industrial relations in India, trade agreements, especially with the EU & the U.S.
The company assumes no responsibility in respect of forward looking statements herein which may undergo changes in future on the basis of subsequent developments, information or events.

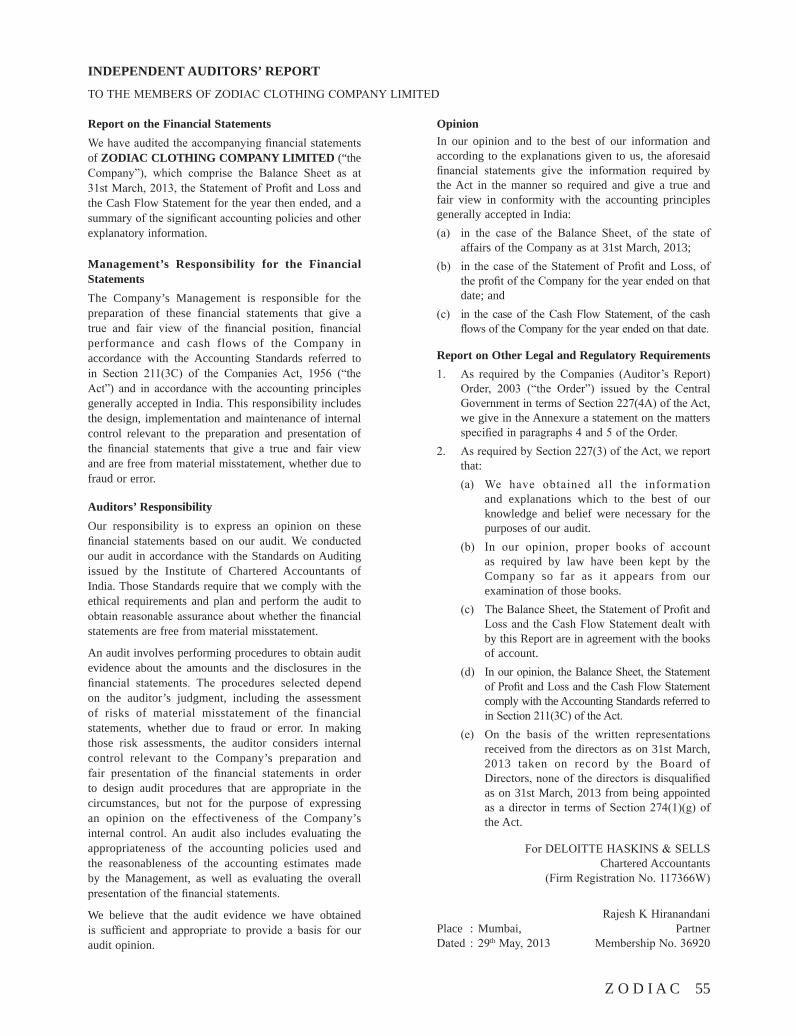
Z O D I A C 55
Report on the Financial Statements We have audited the accompanying financial statements of ZODIAC CLOTHING COMPANY LIMITED (“the Company”), which comprise the Balance Sheet as at 31st March, 2013, the Statement of Profit and Loss and the Cash Flow Statement for the year then ended, and a summary of the significant accounting policies and other explanatory information.
Management’s Responsibility for the Financial StatementsThe Company’s Management is responsible for the preparation of these financial statements that give a true and fair view of the financial position, financial performance and cash flows of the Company in accordance with the Accounting Standards referred to in Section 211(3C) of the Companies Act, 1956 (“the Act”) and in accordance with the accounting principles generally accepted in India. This responsibility includes the design, implementation and maintenance of internal control relevant to the preparation and presentation of the financial statements that give a true and fair view and are free from material misstatement, whether due to fraud or error.
Auditors’ ResponsibilityOur responsibility is to express an opinion on these financial statements based on our audit. We conducted our audit in accordance with the Standards on Auditing issued by the Institute of Chartered Accountants of India. Those Standards require that we comply with the ethical requirements and plan and perform the audit to obtain reasonable assurance about whether the financial statements are free from material misstatement.
An audit involves performing procedures to obtain audit evidence about the amounts and the disclosures in the financial statements. The procedures selected depend on the auditor’s judgment, including the assessment of risks of material misstatement of the financial statements, whether due to fraud or error. In making those risk assessments, the auditor considers internal control relevant to the Company’s preparation and fair presentation of the financial statements in order to design audit procedures that are appropriate in the circumstances, but not for the purpose of expressing an opinion on the effectiveness of the Company’s internal control. An audit also includes evaluating the appropriateness of the accounting policies used and the reasonableness of the accounting estimates made by the Management, as well as evaluating the overall presentation of the financial statements.
We believe that the audit evidence we have obtained is sufficient and appropriate to provide a basis for our audit opinion.
INDEPENDENT AUDITORS’ REPORT
TO THE MEMBERS OF ZODIAC CLOTHING COMPANY LIMITED
OpinionIn our opinion and to the best of our information and according to the explanations given to us, the aforesaid financial statements give the information required by the Act in the manner so required and give a true and fair view in conformity with the accounting principles generally accepted in India:(a) in the case of the Balance Sheet, of the state of
affairs of the Company as at 31st March, 2013;(b) in the case of the Statement of Profit and Loss, of
the profit of the Company for the year ended on that date; and
(c) in the case of the Cash Flow Statement, of the cash flows of the Company for the year ended on that date.
Report on Other Legal and Regulatory Requirements1. As required by the Companies (Auditor’s Report)
Order, 2003 (“the Order”) issued by the Central Government in terms of Section 227(4A) of the Act, we give in the Annexure a statement on the matters specified in paragraphs 4 and 5 of the Order.
2. As required by Section 227(3) of the Act, we report that:(a) We have obtained all the information
and explanations which to the best of our knowledge and belief were necessary for the purposes of our audit.
(b) In our opinion, proper books of account as required by law have been kept by the Company so far as it appears from our examination of those books.
(c) The Balance Sheet, the Statement of Profit and Loss and the Cash Flow Statement dealt with by this Report are in agreement with the books of account.
(d) In our opinion, the Balance Sheet, the Statement of Profit and Loss and the Cash Flow Statement comply with the Accounting Standards referred to in Section 211(3C) of the Act.
(e) On the basis of the written representations received from the directors as on 31st March, 2013 taken on record by the Board of Directors, none of the directors is disqualified as on 31st March, 2013 from being appointed as a director in terms of Section 274(1)(g) of the Act.
For DELOITTE HASKINS & SELLS Chartered Accountants
(Firm Registration No. 117366W)
Rajesh K Hiranandani Place : Mumbai, Partner Dated : 29th May, 2013 Membership No. 36920
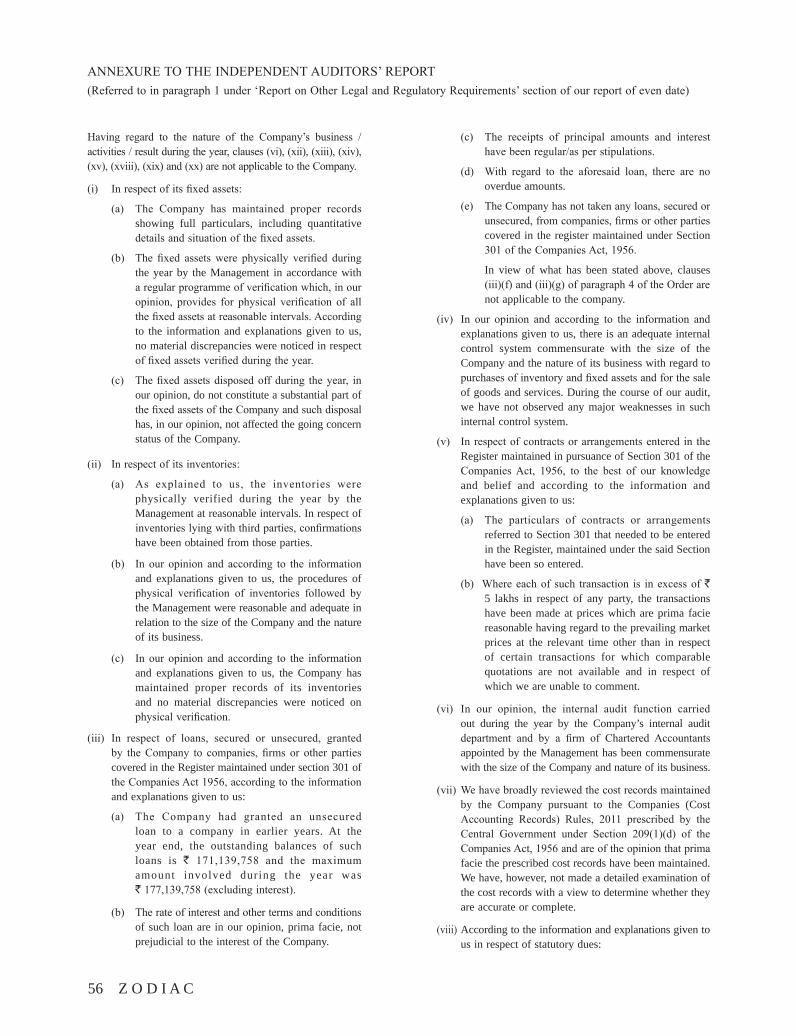
56 Z O D I A C
ANNEXURE TO THE INDEPENDENT AUDITORS’ REPORT(Referred to in paragraph 1 under ‘Report on Other Legal and Regulatory Requirements’ section of our report of even date)
Having regard to the nature of the Company’s business / activities / result during the year, clauses (vi), (xii), (xiii), (xiv), (xv), (xviii), (xix) and (xx) are not applicable to the Company.
(i) In respect of its fixed assets:
(a) The Company has maintained proper records showing full particulars, including quantitative details and situation of the fixed assets.
(b) The fixed assets were physically verified during the year by the Management in accordance with a regular programme of verification which, in our opinion, provides for physical verification of all the fixed assets at reasonable intervals. According to the information and explanations given to us, no material discrepancies were noticed in respect of fixed assets verified during the year.
(c) The fixed assets disposed off during the year, in our opinion, do not constitute a substantial part of the fixed assets of the Company and such disposal has, in our opinion, not affected the going concern status of the Company.
(ii) In respect of its inventories:
(a) As explained to us, the inventories were physically verified during the year by the Management at reasonable intervals. In respect of inventories lying with third parties, confirmations have been obtained from those parties.
(b) In our opinion and according to the information and explanations given to us, the procedures of physical verification of inventories followed by the Management were reasonable and adequate in relation to the size of the Company and the nature of its business.
(c) In our opinion and according to the information and explanations given to us, the Company has maintained proper records of its inventories and no material discrepancies were noticed on physical verification.
(iii) In respect of loans, secured or unsecured, granted by the Company to companies, firms or other parties covered in the Register maintained under section 301 of the Companies Act 1956, according to the information and explanations given to us:
(a) The Company had granted an unsecured loan to a company in earlier years. At the year end, the outstanding balances of such loans is ` 171,139,758 and the maximum amount involved during the year was ` 177,139,758 (excluding interest).
(b) The rate of interest and other terms and conditions of such loan are in our opinion, prima facie, not prejudicial to the interest of the Company.
(c) The receipts of principal amounts and interest have been regular/as per stipulations.
(d) With regard to the aforesaid loan, there are no overdue amounts.
(e) The Company has not taken any loans, secured or unsecured, from companies, firms or other parties covered in the register maintained under Section 301 of the Companies Act, 1956.
In view of what has been stated above, clauses (iii)(f) and (iii)(g) of paragraph 4 of the Order are not applicable to the company.
(iv) In our opinion and according to the information and explanations given to us, there is an adequate internal control system commensurate with the size of the Company and the nature of its business with regard to purchases of inventory and fixed assets and for the sale of goods and services. During the course of our audit, we have not observed any major weaknesses in such internal control system.
(v) In respect of contracts or arrangements entered in the Register maintained in pursuance of Section 301 of the Companies Act, 1956, to the best of our knowledge and belief and according to the information and explanations given to us:
(a) The particulars of contracts or arrangements referred to Section 301 that needed to be entered in the Register, maintained under the said Section have been so entered.
(b) Where each of such transaction is in excess of ` 5 lakhs in respect of any party, the transactions have been made at prices which are prima facie reasonable having regard to the prevailing market prices at the relevant time other than in respect of certain transactions for which comparable quotations are not available and in respect of which we are unable to comment.
(vi) In our opinion, the internal audit function carried out during the year by the Company’s internal audit department and by a firm of Chartered Accountants appointed by the Management has been commensurate with the size of the Company and nature of its business.
(vii) We have broadly reviewed the cost records maintained by the Company pursuant to the Companies (Cost Accounting Records) Rules, 2011 prescribed by the Central Government under Section 209(1)(d) of the Companies Act, 1956 and are of the opinion that prima facie the prescribed cost records have been maintained. We have, however, not made a detailed examination of the cost records with a view to determine whether they are accurate or complete.
(viii) According to the information and explanations given to us in respect of statutory dues:
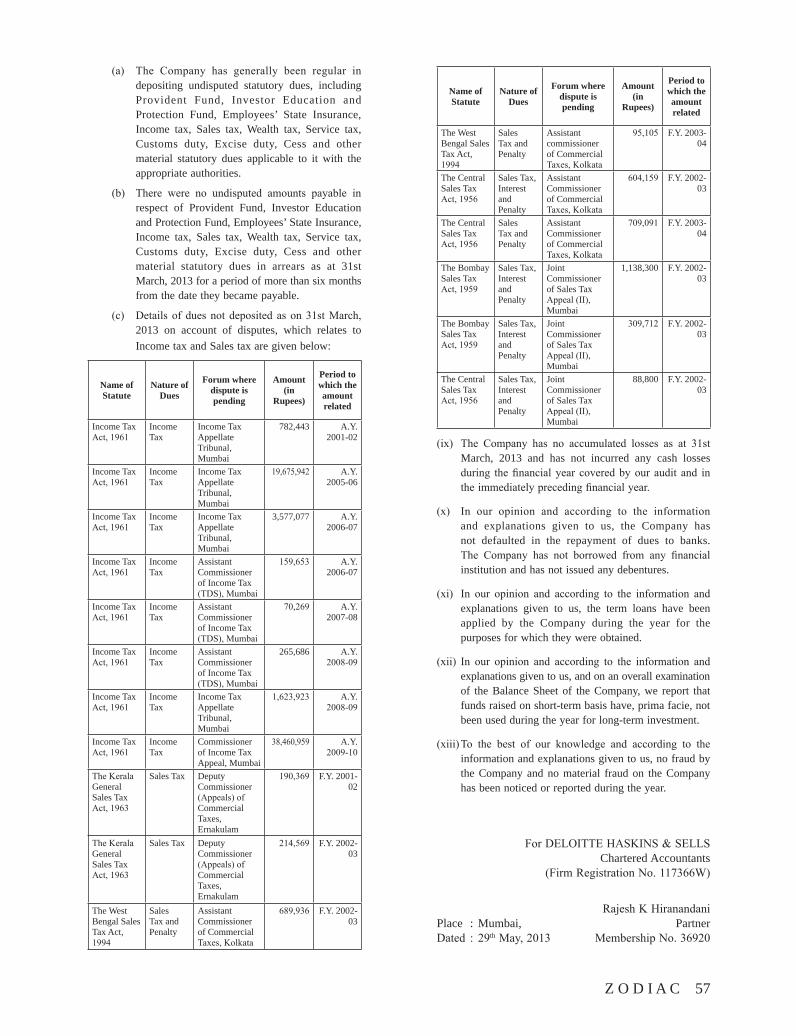
Z O D I A C 57
(a) The Company has generally been regular in depositing undisputed statutory dues, including Provident Fund, Investor Education and Protection Fund, Employees’ State Insurance, Income tax, Sales tax, Wealth tax, Service tax, Customs duty, Excise duty, Cess and other material statutory dues applicable to it with the appropriate authorities.
(b) There were no undisputed amounts payable in respect of Provident Fund, Investor Education and Protection Fund, Employees’ State Insurance, Income tax, Sales tax, Wealth tax, Service tax, Customs duty, Excise duty, Cess and other material statutory dues in arrears as at 31st March, 2013 for a period of more than six months from the date they became payable.
(c) Details of dues not deposited as on 31st March, 2013 on account of disputes, which relates to Income tax and Sales tax are given below:
Name of Statute
Nature of Dues
Forum where dispute is pending
Amount(in
Rupees)
Period to which the amount related
Income Tax Act, 1961
Income Tax
Income Tax Appellate Tribunal, Mumbai
782,443 A.Y. 2001-02
Income Tax Act, 1961
Income Tax
Income Tax Appellate Tribunal, Mumbai
19,675,942 A.Y. 2005-06
Income Tax Act, 1961
Income Tax
Income Tax Appellate Tribunal, Mumbai
3,577,077 A.Y. 2006-07
Income Tax Act, 1961
Income Tax
Assistant Commissioner of Income Tax (TDS), Mumbai
159,653 A.Y. 2006-07
Income Tax Act, 1961
Income Tax
Assistant Commissioner of Income Tax (TDS), Mumbai
70,269 A.Y. 2007-08
Income Tax Act, 1961
Income Tax
Assistant Commissioner of Income Tax (TDS), Mumbai
265,686 A.Y. 2008-09
Income Tax Act, 1961
Income Tax
Income Tax Appellate Tribunal, Mumbai
1,623,923 A.Y. 2008-09
Income Tax Act, 1961
Income Tax
Commissioner of Income Tax Appeal, Mumbai
38,460,959 A.Y. 2009-10
The Kerala General Sales Tax Act, 1963
Sales Tax Deputy Commissioner (Appeals) of Commercial Taxes, Ernakulam
190,369 F.Y. 2001-02
The Kerala General Sales Tax Act, 1963
Sales Tax Deputy Commissioner (Appeals) of Commercial Taxes, Ernakulam
214,569 F.Y. 2002-03
The West Bengal Sales Tax Act, 1994
Sales Tax and Penalty
Assistant Commissioner of Commercial Taxes, Kolkata
689,936 F.Y. 2002-03
Name of Statute
Nature of Dues
Forum where dispute is pending
Amount(in
Rupees)
Period to which the amount related
The West Bengal Sales Tax Act, 1994
Sales Tax and Penalty
Assistant commissioner of Commercial Taxes, Kolkata
95,105 F.Y. 2003-04
The Central Sales Tax Act, 1956
Sales Tax, Interest and Penalty
Assistant Commissioner of Commercial Taxes, Kolkata
604,159 F.Y. 2002-03
The Central Sales Tax Act, 1956
Sales Tax and Penalty
Assistant Commissioner of Commercial Taxes, Kolkata
709,091 F.Y. 2003-04
The Bombay Sales Tax Act, 1959
Sales Tax, Interest and Penalty
Joint Commissioner of Sales Tax Appeal (II), Mumbai
1,138,300 F.Y. 2002-03
The Bombay Sales Tax Act, 1959
Sales Tax, Interest and Penalty
Joint Commissioner of Sales Tax Appeal (II), Mumbai
309,712 F.Y. 2002-03
The Central Sales Tax Act, 1956
Sales Tax, Interest and Penalty
Joint Commissioner of Sales Tax Appeal (II), Mumbai
88,800 F.Y. 2002-03
(ix) The Company has no accumulated losses as at 31st March, 2013 and has not incurred any cash losses during the financial year covered by our audit and in the immediately preceding financial year.
(x) In our opinion and according to the information and explanations given to us, the Company has not defaulted in the repayment of dues to banks. The Company has not borrowed from any financial institution and has not issued any debentures.
(xi) In our opinion and according to the information and explanations given to us, the term loans have been applied by the Company during the year for the purposes for which they were obtained.
(xii) In our opinion and according to the information and explanations given to us, and on an overall examination of the Balance Sheet of the Company, we report that funds raised on short-term basis have, prima facie, not been used during the year for long-term investment.
(xiii) To the best of our knowledge and according to the information and explanations given to us, no fraud by the Company and no material fraud on the Company has been noticed or reported during the year.
For DELOITTE HASKINS & SELLS Chartered Accountants
(Firm Registration No. 117366W)
Rajesh K Hiranandani Place : Mumbai, Partner Dated : 29th May, 2013 Membership No. 36920
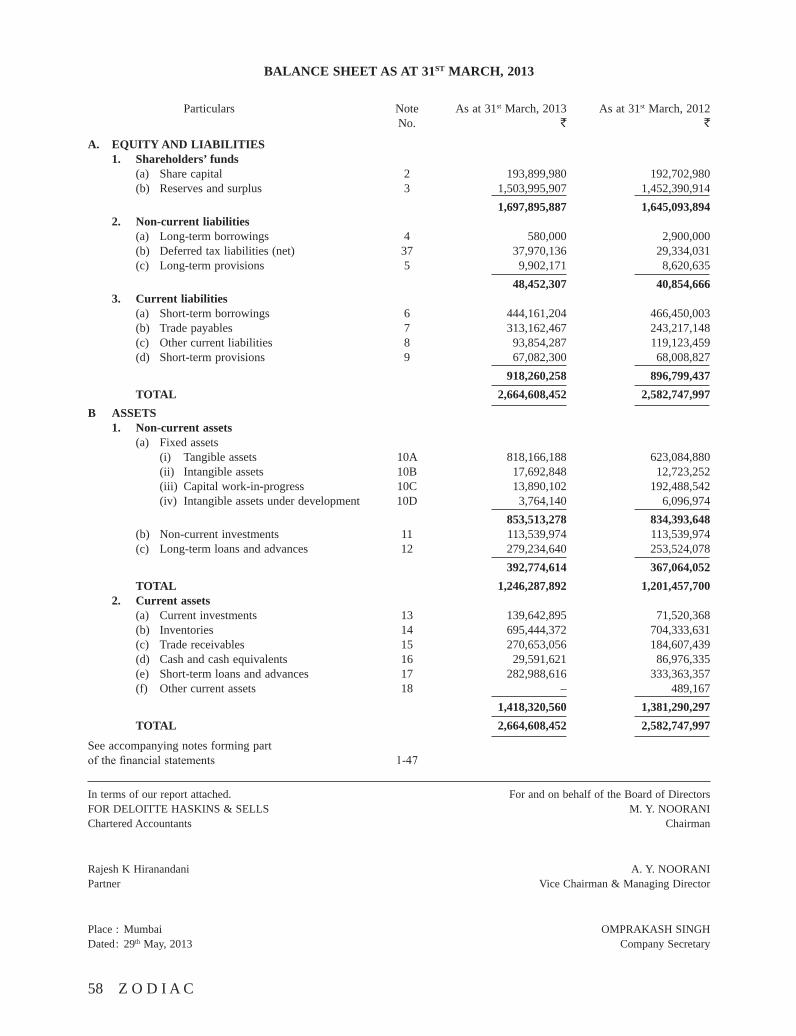
58 Z O D I A C
BALANCE SHEET AS AT 31ST MARCH, 2013
Particulars Note As at 31st March, 2013 As at 31st March, 2012 No. ` `
A. EQUITY AND LIABILITIES 1. Shareholders’ funds (a) Share capital 2 193,899,980 192,702,980 (b) Reserves and surplus 3 1,503,995,907 1,452,390,914 1,697,895,887 1,645,093,894 2. Non-current liabilities (a) Long-term borrowings 4 580,000 2,900,000 (b) Deferred tax liabilities (net) 37 37,970,136 29,334,031 (c) Long-term provisions 5 9,902,171 8,620,635 48,452,307 40,854,666 3. Current liabilities (a) Short-term borrowings 6 444,161,204 466,450,003 (b) Trade payables 7 313,162,467 243,217,148 (c) Other current liabilities 8 93,854,287 119,123,459 (d) Short-term provisions 9 67,082,300 68,008,827 918,260,258 896,799,437 TOTAL 2,664,608,452 2,582,747,997B ASSETS 1. Non-current assets (a) Fixed assets (i) Tangible assets 10A 818,166,188 623,084,880 (ii) Intangible assets 10B 17,692,848 12,723,252 (iii) Capital work-in-progress 10C 13,890,102 192,488,542 (iv) Intangible assets under development 10D 3,764,140 6,096,974 853,513,278 834,393,648 (b) Non-current investments 11 113,539,974 113,539,974 (c) Long-term loans and advances 12 279,234,640 253,524,078 392,774,614 367,064,052 TOTAL 1,246,287,892 1,201,457,700 2. Current assets (a) Current investments 13 139,642,895 71,520,368 (b) Inventories 14 695,444,372 704,333,631 (c) Trade receivables 15 270,653,056 184,607,439 (d) Cash and cash equivalents 16 29,591,621 86,976,335 (e) Short-term loans and advances 17 282,988,616 333,363,357 (f) Other current assets 18 – 489,167 1,418,320,560 1,381,290,297 TOTAL 2,664,608,452 2,582,747,997
See accompanying notes forming part of the financial statements 1-47
In terms of our report attached. For and on behalf of the Board of Directors FOR DELOITTE HASKINS & SELLS M. Y. NOORANI Chartered Accountants Chairman
Rajesh K Hiranandani A. Y. NOORANI Partner Vice Chairman & Managing Director
Place : Mumbai OMPRAKASH SINGH Dated : 29th May, 2013 Company Secretary
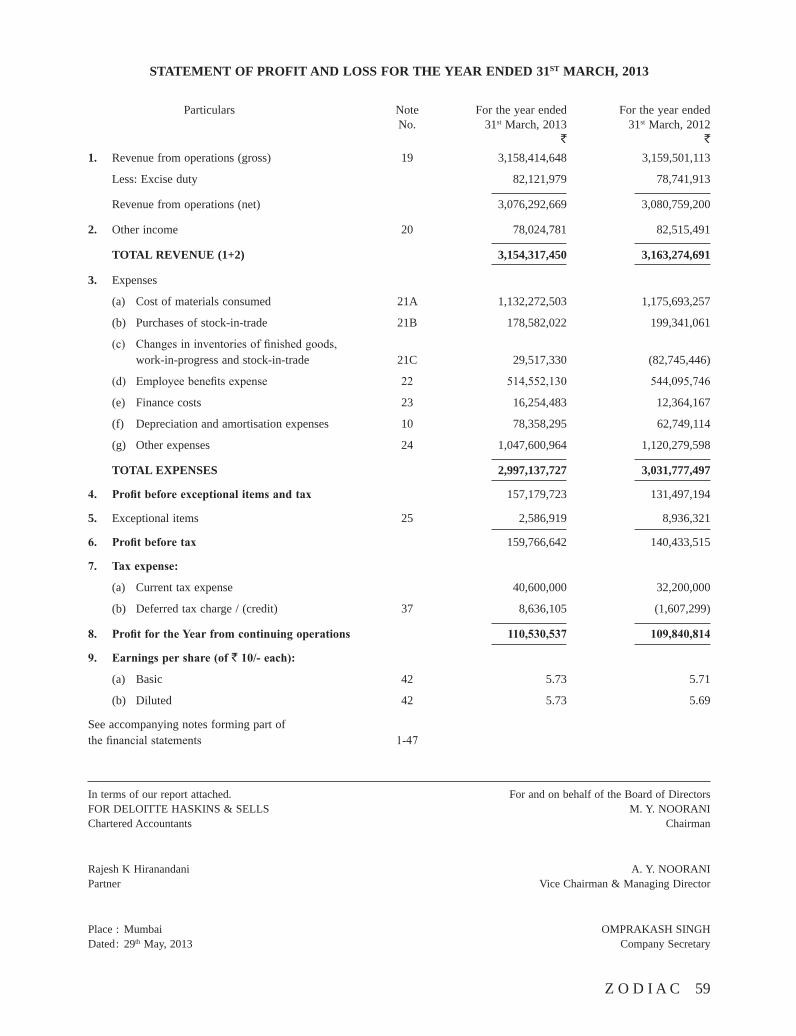
Z O D I A C 59
In terms of our report attached. For and on behalf of the Board of Directors FOR DELOITTE HASKINS & SELLS M. Y. NOORANI Chartered Accountants Chairman
Rajesh K Hiranandani A. Y. NOORANI Partner Vice Chairman & Managing Director
Place : Mumbai OMPRAKASH SINGH Dated : 29th May, 2013 Company Secretary
STATEMENT OF PROFIT AND LOSS FOR THE YEAR ENDED 31ST MARCH, 2013
Particulars Note For the year ended For the year ended No. 31st March, 2013 31st March, 2012 ` `
1. Revenue from operations (gross) 19 3,158,414,648 3,159,501,113
Less: Excise duty 82,121,979 78,741,913
Revenue from operations (net) 3,076,292,669 3,080,759,200
2. Other income 20 78,024,781 82,515,491
TOTAL REVENUE (1+2) 3,154,317,450 3,163,274,691
3. Expenses
(a) Cost of materials consumed 21A 1,132,272,503 1,175,693,257
(b) Purchases of stock-in-trade 21B 178,582,022 199,341,061
(c) Changes in inventories of finished goods, work-in-progress and stock-in-trade 21C 29,517,330 (82,745,446)
(d) Employee benefits expense 22 514,552,130 544,095,746
(e) Finance costs 23 16,254,483 12,364,167
(f) Depreciation and amortisation expenses 10 78,358,295 62,749,114
(g) Other expenses 24 1,047,600,964 1,120,279,598
TOTAL EXPENSES 2,997,137,727 3,031,777,497
4. Profitbeforeexceptionalitemsandtax 157,179,723 131,497,194
5. Exceptional items 25 2,586,919 8,936,321
6. Profitbeforetax 159,766,642 140,433,515
7. Taxexpense:
(a) Current tax expense 40,600,000 32,200,000
(b) Deferred tax charge / (credit) 37 8,636,105 (1,607,299)
8. ProfitfortheYearfromcontinuingoperations 110,530,537 109,840,814
9. Earningspershare(of`10/-each):
(a) Basic 42 5.73 5.71
(b) Diluted 42 5.73 5.69
See accompanying notes forming part of the financial statements 1-47
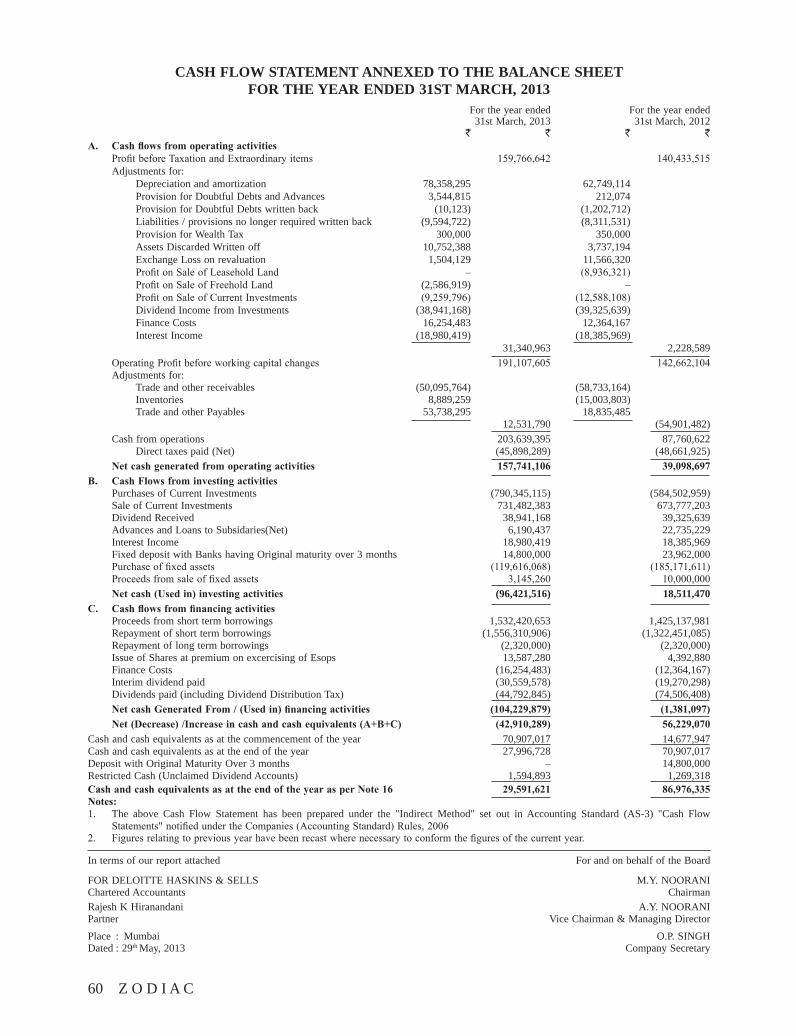
60 Z O D I A C
CASH FLOW STATEMENT ANNEXED TO THE BALANCE SHEET FOR THE YEAR ENDED 31ST MARCH, 2013
For the year ended For the year ended 31st March, 2013 31st March, 2012 ` ` ` `A. Cashflowsfromoperatingactivities Profit before Taxation and Extraordinary items 159,766,642 140,433,515 Adjustments for: Depreciation and amortization 78,358,295 62,749,114 Provision for Doubtful Debts and Advances 3,544,815 212,074 Provision for Doubtful Debts written back (10,123) (1,202,712) Liabilities / provisions no longer required written back (9,594,722) (8,311,531) Provision for Wealth Tax 300,000 350,000 Assets Discarded Written off 10,752,388 3,737,194 Exchange Loss on revaluation 1,504,129 11,566,320 Profit on Sale of Leasehold Land – (8,936,321) Profit on Sale of Freehold Land (2,586,919) – Profit on Sale of Current Investments (9,259,796) (12,588,108) Dividend Income from Investments (38,941,168) (39,325,639) Finance Costs 16,254,483 12,364,167 Interest Income (18,980,419) (18,385,969) 31,340,963 2,228,589 Operating Profit before working capital changes 191,107,605 142,662,104 Adjustments for: Trade and other receivables (50,095,764) (58,733,164) Inventories 8,889,259 (15,003,803) Trade and other Payables 53,738,295 18,835,485 12,531,790 (54,901,482) Cash from operations 203,639,395 87,760,622 Direct taxes paid (Net) (45,898,289) (48,661,925) Netcashgeneratedfromoperatingactivities 157,741,106 39,098,697B. CashFlowsfrominvestingactivities Purchases of Current Investments (790,345,115) (584,502,959) Sale of Current Investments 731,482,383 673,777,203 Dividend Received 38,941,168 39,325,639 Advances and Loans to Subsidaries(Net) 6,190,437 22,735,229 Interest Income 18,980,419 18,385,969 Fixed deposit with Banks having Original maturity over 3 months 14,800,000 23,962,000 Purchase of fixed assets (119,616,068) (185,171,611) Proceeds from sale of fixed assets 3,145,260 10,000,000 Netcash(Usedin)investingactivities (96,421,516) 18,511,470C. Cashflowsfromfinancingactivities Proceeds from short term borrowings 1,532,420,653 1,425,137,981 Repayment of short term borrowings (1,556,310,906) (1,322,451,085) Repayment of long term borrowings (2,320,000) (2,320,000) Issue of Shares at premium on excercising of Esops 13,587,280 4,392,880 Finance Costs (16,254,483) (12,364,167) Interim dividend paid (30,559,578) (19,270,298) Dividends paid (including Dividend Distribution Tax) (44,792,845) (74,506,408) NetcashGeneratedFrom/(Usedin)financingactivities (104,229,879) (1,381,097) Net(Decrease)/Increaseincashandcashequivalents(A+B+C) (42,910,289) 56,229,070Cash and cash equivalents as at the commencement of the year 70,907,017 14,677,947Cash and cash equivalents as at the end of the year 27,996,728 70,907,017Deposit with Original Maturity Over 3 months – 14,800,000Restricted Cash (Unclaimed Dividend Accounts) 1,594,893 1,269,318CashandcashequivalentsasattheendoftheyearasperNote16 29,591,621 86,976,335Notes:1. The above Cash Flow Statement has been prepared under the "Indirect Method" set out in Accounting Standard (AS-3) "Cash Flow
Statements" notified under the Companies (Accounting Standard) Rules, 20062. Figures relating to previous year have been recast where necessary to conform the figures of the current year.
In terms of our report attached For and on behalf of the Board
FOR DELOITTE HASKINS & SELLS M.Y. NOORANIChartered Accountants ChairmanRajesh K Hiranandani A.Y. NOORANIPartner Vice Chairman & Managing DirectorPlace : Mumbai O.P. SINGHDated : 29th May, 2013 Company Secretary
Z O D I A C 61
NOTES FORMING PART OF FINANCIAL STATEMENTS
1. SIGNIFICANTACCOUNTINGPOLICIES:
(a) BASIS OF ACCOUNTING
The Accounts are prepared on accrual basis under the historical cost convention and to comply in all material aspects with the applicable accounting principles in India, the accounting standards issued by the Institute of Chartered Accountants of India and the relevant provisions of the Companies Act, 1956.
The preparation of financial statements in conformity with generally accepted accounting principles in India requires the Management to make estimates and assumptions considered in the reported amounts of assets and liabilities (including contingent liabilities) as of the date of the financial statements and the reported income and expenses during the reported period. Management believes that the estimates used in preparation of the financial statements are prudent and reasonable. Future results could differ from these estimates.
(b) REVENUE RECOGNITION
Sales are recognised when goods are supplied to customers and are recorded net of sales tax/value added tax, trade Discounts, Rebate and Returns but includes excise duty. Dividend income on investments is accounted when the right to receive the dividend is established.
Revenue in respect of Insurance/other claims, interest etc. is recognised only when it is reasonably certain that the ultimate collection will be made.
(c) EXPORT BENEFITS
Export benefits under various schemes of Government of India are accounted on accrual basis on the basis of exports made and the value of imports made/ to be made there against.
(d) FIXED ASSETS
Fixed Assets are recorded at Cost of acquisition. They are stated at historical costs including incidental expenses.
(e) DEPRECIATION/AMORTISATION
(i) On Tangible Assets:
Depreciation has been calculated on straight-line basis in accordance with the
provisions of section 205(2)(b) of the Companies Act, 1956 at the rates and in the manner specified in schedule XIV of the said act.
Cost of Leasehold Land is amortised over the period of lease.
Cost of Leasehold improvements is amortised over the primary period of lease. However, in cases where the company as a lessee has the right of renewal of lease and it is intended to renew for further periods, then the cost of such leasehold improvements is amortised over such extended period.
ii) On Intangible Assets:
(a) Goodwill
At the time of acquisition of the business, the difference between the cost of investments and the fair value of assets as at the date of acquisition is accounted for as goodwill. Goodwill is amortised over a period of 10 years.
Goodwill on amalgamation in the nature of merger is amortised over a period of 5 years.
(b) Computer software is amortised on straight line basis over a period of 6 years.
(f) IMPAIRMENT OF ASSETS
An asset is treated as impaired when the carrying cost of asset exceeds its recoverable value. Recoverable amount is the higher of an asset's net selling price and its value in use. Value in use is the present value of estimated future cash flows expected to arise from the continuing use of the asset and from its disposal at the end of its useful life. Net selling price is the amount obtainable from sale of the asset in an arm's length transaction between knowledgeable, willing parties, less the costs of disposal. An impairment loss is charged to the Statement of Profit and Loss in the year in which an asset is identified as impaired. The impaired loss recognised in prior accounting periods is reversed if there has been a change in the estimate of the recoverable value.
62 Z O D I A C
(g) INVESTMENTS
Investments are classified into non-current investments and current investments. Investments, which are intended to be held for more than one year, are classified as non-current investments and investments, which are intended to be held for less than one year, are classified as current investments. Non-current investments are accounted at cost and a provision for diminution is made to recognize a decline other than temporary in the value of long term investments. Current investments are valued at cost or fair value whichever is lower.
Investments include investments in shares of a company registered outside India. They are stated at cost by converting at the rate of exchange prevalent at the time of acquisition thereof.
Any profit or loss on sale of investments is determined on the basis of the average cost of acquisition.
(h) T R A N S A C T I O N S I N F O R E I G N CURRENCY
Transactions in foreign currencies are recorded at the exchange rate prevailing on the date of the transaction. Monetary items denominated in foreign currencies are restated at the exchange rate prevailing on the balance sheet date. Exchange differences arising on settlement of the transaction and on account of restatement of monetary items are dealt with in the Statement of Profit and Loss .
Forward exchange contracts entered into to hedge the foreign currency risk and outstanding as on balance sheet date are translated at year end exchange rates. The premium or discount arising at the inception of such forward exchange contracts are amortised as income or expense over the life of the contract.
Gains/Losses on settlement of transactions arising on cancellation/renewal of forward exchange contracts are recognized as income or expense.
(i) HEDGE ACCOUNTING
The Company uses foreign currency forward contracts to hedge its risks associated with foreign currency fluctuations relating to certain firm commitments and forecasted transactions. The Company designates these hedging instruments as cash flow hedges applying the recognition and measurement principles set
out in the Accounting Standard 30 “Financial Instruments: Recognition and Measurement” (AS–30).
The use of hedging instruments is governed by the Company’s policies approved by the board of directors, which provide written principles on the use of such financial derivatives consistent with the Company’s risk management strategy.
Hedging instruments are initially measured at fair value, and are remeasured at subsequent reporting dates.
Changes in the fair value of these derivatives that are designated and effective as hedges of future cash flows are recognised directly in shareholders’ funds and the ineffective portion is recognised immediately in the Statement of Profit and Loss.
Changes in the fair value of derivative financial instruments that do not qualify for hedge accounting are recognised in the Statement of Profit and Loss as they arise.
If a hedged transaction is no longer expected to occur, the net cumulative gain or loss recognised in shareholders’ funds is transferred to the Statement of Profit and Loss for the period.
(j) INVENTORIES
(a) Raw materials are valued at cost or net realisable value whichever is lower. The cost includes purchase price as well as incidental expenses. The cost formulae used are First In First Out, Weighted average cost or Specific identification method, as applicable and found appropriate.
(b) Work -in - progress is valued at cost calculated on the basis of absorption costing or net realisable value whichever is lower.
(c) Finished goods are valued at cost or net realisable value whichever is lower. Cost is determined on the basis of absorption costing.
(d) Packing materials and accessories are valued at First in First out cost or net realisable value whichever is lower.
(e) Stores and spare parts are valued at First in First out cost or net realisable value whichever is lower.
Z O D I A C 63
(k) EMPLOYEE BENEFITS
(a) The contribution to Provident Fund as required under the statute is made to the Government Provident Fund and is debited to Statement of Profit and Loss.
(b) Gratuity liability is a defined benefit obligation. The Company has taken Group gratuity- cum-life assurance (cash accumulation) Scheme offered by Life Insurance Corporation of India (LIC) . Annual contributions are made on the basis of intimation received from LIC. The company accounts for liability for future gratuity benefits based on actuarial valuation carried out as at the end of each financial year. Actuarial gains and losses are recognized in full in Statement of Profit and Loss for the period in which they occur.
(c) Benefits in the form of vesting and non-vesting compensated absences are accounted as per actuarial valuation carried out as at the year end.
l) TAXES ON INCOME
Income Taxes are accounted for in accordance with Accounting Standard (AS 22) – Accounting for Taxes on Income, notified under the Companies (Accounting Standard) Rules, 2006. Income Tax comprises both current and deferred tax.
Current tax is measured at the amount expected to be paid to/recovered from the revenue authorities, using applicable tax rates and laws.
The tax effect of the timing differences that result between taxable income and accounting income and are capable of reversal in one or more subsequent periods are recorded as a deferred tax asset or deferred tax liability. They are measured using the substantively enacted
tax rates and tax regulations as of the Balance Sheet date.
Deferred tax assets arising mainly on account of brought forward losses and unabsorbed depreciation under tax laws are recognised only if there is virtual certainty of its realisation, supported by convincing evidence. Deferred tax assets on account of other timing differences are recognized only to the extent there is a reasonable certainty of its realisation.
m) BORROWINGCOST
Interest and other costs in connection with the borrowing of the funds to the extent related/attributed to the acquisition/construction of qualifying fixed assets are capitalised up to the date when such assets are ready for its intended use and all other borrowing costs are recognised as an expense in the period in which they are incurred.
n) LEASES
Assets taken / given on lease by which all significant risks and rewards of ownership are retained by the lessor are classified as operating leases. Lease payment/receipts under operating leases are recognized as expense/income on straight line basis over the lease term.
o) PROVISIONS AND CONTINGENCIES
Provisions are recognized when the Company has a legal and constructive obligation as a result of a past event, for which it is probable that cash outflow will be required and a reliable estimate can be made of the amount of the obligation. Contingent liabilities are disclosed when the Company has a possible or present obligation where it is not probable that an outflow of resources will be required to settle it. Contingent assets are neither recognized nor disclosed.
64 Z O D I A C
NOTES FORMING PART OF THE FINANCIAL STATEMENTS
As at 31st March, 2013 As at 31st March, 2012 Particulars Number ` Number ` of shares of sharesNOTE2:SHARECAPITAL(a) Authorised Equity shares of ` 10/- each 30,000,000 300,000,000 30,000,000 300,000,000(b) Issued, Subscribed and fully paid up Equity shares of ` 10/- each 19,389,998 193,899,980 19,270,298 192,702,980
TOTAL 19,389,998 193,899,980 19,270,298 192,702,980
Notes:(i) Rights, preferences and restrictions attached to equity shares : The company has only one class of shares referred to as equity shares having a par value of ` 10/- per share. Each holder
of equity shares is entitled to one vote per share. The company declares and pays dividend in Indian Rupees. The dividend recommended by the Board of Directors is subject to the approval of the shareholders at the ensuing annual general meeting, except in the case of Interim dividend . In the event of the liquidation of the company the holders of equity shares will be entitled to receive remaining assets of the company, after distribution of all preferential amounts in the proportion of equity shares held.
(ii) Reconciliation of the number of shares and amount outstanding at the beginning and at the end of the reporting period: Particulars Opening Balance Bonus ESOP Closing BalanceEquity sharesYear ended 31 March, 2013 – Number of shares 19,270,298 – 119,700 19,389,998 – Amount (`) 192,702,980 – 1,197,000 193,899,980Year ended 31 March, 2012 – Number of shares 12,821,064 6,410,532 38,702 19,270,298 – Amount (`) 128,210,640 64,105,320 387,020 192,702,980(iii) Details of shares held by each shareholder holding more than 5% shares: As at 31st March, 2013 As at 31st March, 2012 Class of shares / Name of shareholder Number of % of Number of % of shares held holding shares held holding Equity shares with voting rights: Asia Tangible Investments Pte Ltd. 3,154,882 16.27 3,154,882 16.37 Euro Global Holdings Pte. Ltd. 3,154,882 16.27 3,154,882 16.37 Miraj Marketing Company LLP 2,317,734 11.95 2,317,734 12.03 Mohammed Yusuf Noorani ** 2,569,395 13.25 1,691,448 8.78 Akash Bhanshali 2,025,000 10.44 – – India Capital Fund Ltd – – 1,840,873 9.55 Pari Washington Company Pvt. Ltd. A/C Pari Washington India Master Fund, Ltd 979,032 5.05 404,492 2.10**Out of 2,569,395 shares held by Mr Mohammed Yusuf Noorani, (previous year ` 1,691,448/-), following shares are held by him (a) as Partner for and on behalf of – 244,170 Metropolitan Trading Company (b) as Trustee for and on behalf of 18,990 18,990 Yusuf Noorani Family Trust (c) as Trustee for and on behalf of 8,334 8,334 Anees Yusuf Noorani Family Benefit Trust(iv) As at 31st March, 2013, 369,075 shares (As at 31 March, 2012, 520,722 shares) were reserved for issuance towards
outstanding employee stock options granted (Refer Note 43)(v) Aggregate number and class of shares allotted as fully paid up pursuant to contract(s) without payment being received in
cash, bonus shares and shares bought back for the period of 5 years immediately preceding the Balance Sheet date:
Particulars Aggregate number of shares As at 31st March, 2013 As at 31st March, 2012Equity sharesFully paid up by way of bonus shares 10,614,770 10,614,770
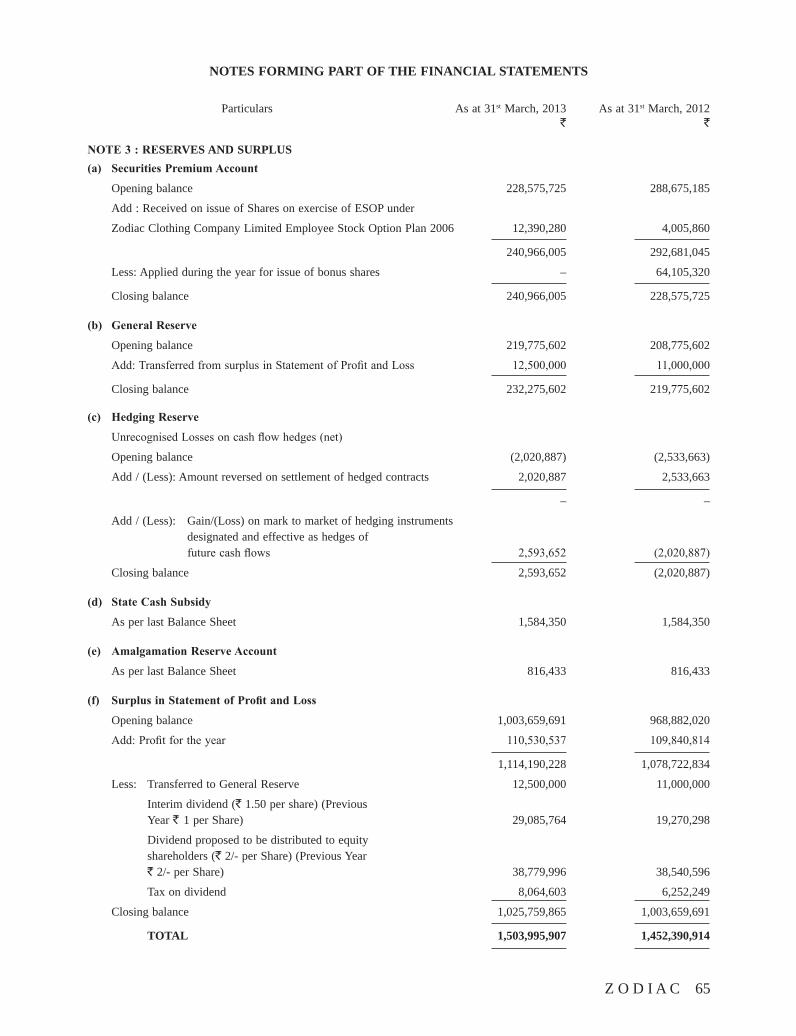
Z O D I A C 65
NOTES FORMING PART OF THE FINANCIAL STATEMENTS
Particulars As at 31st March, 2013 As at 31st March, 2012 ` `
NOTE3:RESERVES AND SURPLUS(a) SecuritiesPremiumAccount
Opening balance 228,575,725 288,675,185
Add : Received on issue of Shares on exercise of ESOP under
Zodiac Clothing Company Limited Employee Stock Option Plan 2006 12,390,280 4,005,860
240,966,005 292,681,045
Less: Applied during the year for issue of bonus shares – 64,105,320
Closing balance 240,966,005 228,575,725
(b) GeneralReserve
Opening balance 219,775,602 208,775,602
Add: Transferred from surplus in Statement of Profit and Loss 12,500,000 11,000,000
Closing balance 232,275,602 219,775,602
(c) HedgingReserve
Unrecognised Losses on cash flow hedges (net)
Opening balance (2,020,887) (2,533,663)
Add / (Less): Amount reversed on settlement of hedged contracts 2,020,887 2,533,663
– –
Add / (Less): Gain/(Loss) on mark to market of hedging instruments designated and effective as hedges of future cash flows 2,593,652 (2,020,887)
Closing balance 2,593,652 (2,020,887)
(d) StateCashSubsidy
As per last Balance Sheet 1,584,350 1,584,350
(e) AmalgamationReserveAccount
As per last Balance Sheet 816,433 816,433
(f) SurplusinStatementofProfitandLoss
Opening balance 1,003,659,691 968,882,020
Add: Profit for the year 110,530,537 109,840,814
1,114,190,228 1,078,722,834
Less: Transferred to General Reserve 12,500,000 11,000,000
Interim dividend (` 1.50 per share) (Previous Year ` 1 per Share) 29,085,764 19,270,298
Dividend proposed to be distributed to equity shareholders (` 2/- per Share) (Previous Year ` 2/- per Share) 38,779,996 38,540,596
Tax on dividend 8,064,603 6,252,249
Closing balance 1,025,759,865 1,003,659,691
TOTAL 1,503,995,907 1,452,390,914
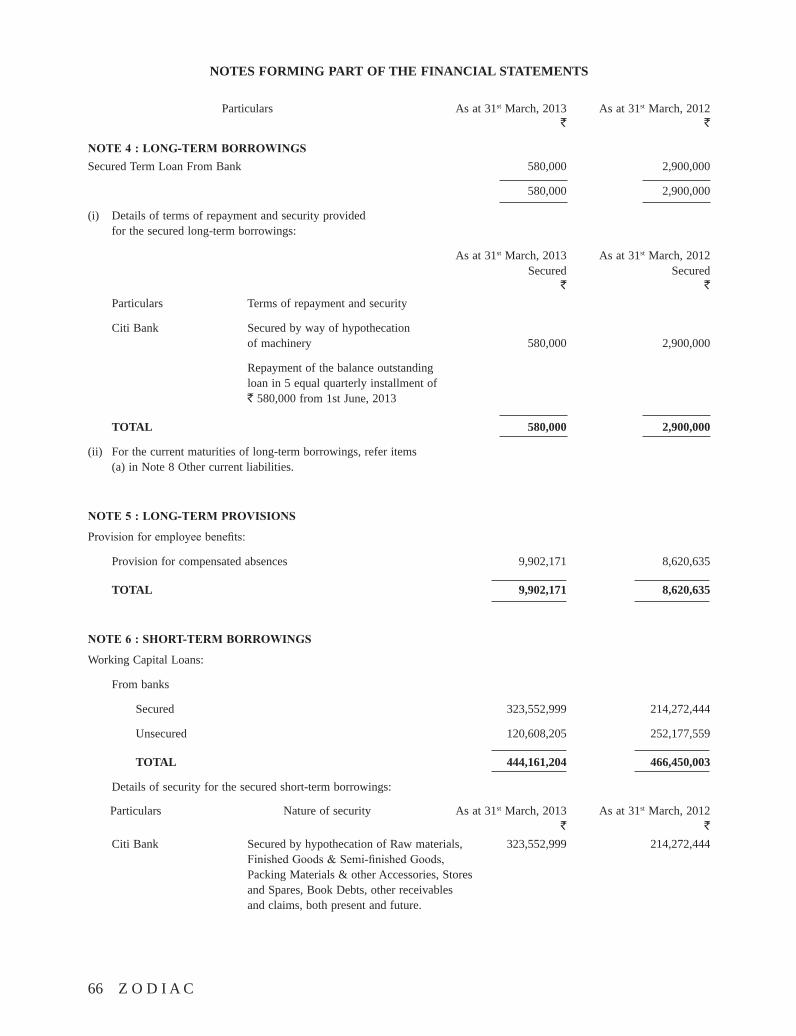
66 Z O D I A C
NOTES FORMING PART OF THE FINANCIAL STATEMENTS
Particulars As at 31st March, 2013 As at 31st March, 2012 ` `
NOTE4:LONG-TERMBORROWINGSSecured Term Loan From Bank 580,000 2,900,000
580,000 2,900,000
(i) Details of terms of repayment and security provided for the secured long-term borrowings:
As at 31st March, 2013 As at 31st March, 2012 Secured Secured ` `
Particulars Terms of repayment and security
Citi Bank Secured by way of hypothecation of machinery 580,000 2,900,000
Repayment of the balance outstanding loan in 5 equal quarterly installment of ` 580,000 from 1st June, 2013
TOTAL 580,000 2,900,000
(ii) For the current maturities of long-term borrowings, refer items (a) in Note 8 Other current liabilities.
NOTE5:LONG-TERMPROVISIONS
Provision for employee benefits:
Provision for compensated absences 9,902,171 8,620,635
TOTAL 9,902,171 8,620,635
NOTE6:SHORT-TERMBORROWINGS
Working Capital Loans:
From banks
Secured 323,552,999 214,272,444
Unsecured 120,608,205 252,177,559
TOTAL 444,161,204 466,450,003
Details of security for the secured short-term borrowings:
Particulars Nature of security As at 31st March, 2013 As at 31st March, 2012 ` `
Citi Bank Secured by hypothecation of Raw materials, 323,552,999 214,272,444 Finished Goods & Semi-finished Goods, Packing Materials & other Accessories, Stores and Spares, Book Debts, other receivables and claims, both present and future.
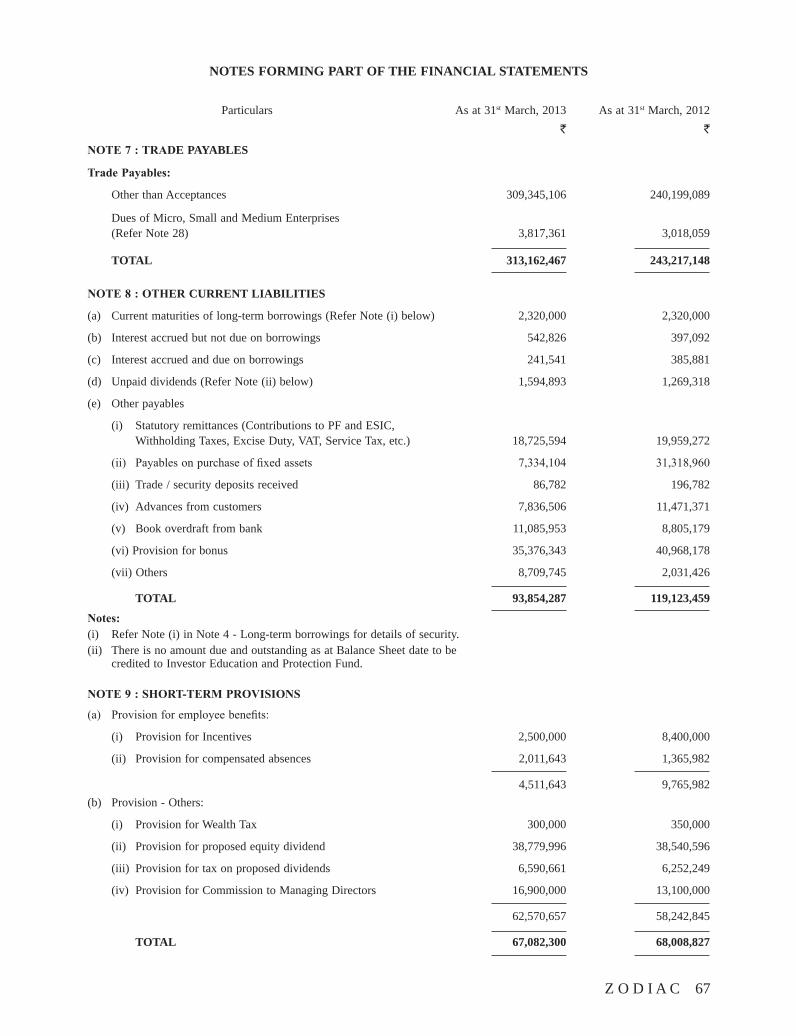
Z O D I A C 67
NOTES FORMING PART OF THE FINANCIAL STATEMENTS
Particulars As at 31st March, 2013 As at 31st March, 2012 ` `
NOTE7:TRADE PAYABLES
TradePayables:
Other than Acceptances 309,345,106 240,199,089
Dues of Micro, Small and Medium Enterprises (Refer Note 28) 3,817,361 3,018,059
TOTAL 313,162,467 243,217,148
NOTE8:OTHER CURRENT LIABILITIES
(a) Current maturities of long-term borrowings (Refer Note (i) below) 2,320,000 2,320,000
(b) Interest accrued but not due on borrowings 542,826 397,092
(c) Interest accrued and due on borrowings 241,541 385,881
(d) Unpaid dividends (Refer Note (ii) below) 1,594,893 1,269,318
(e) Other payables
(i) Statutory remittances (Contributions to PF and ESIC, Withholding Taxes, Excise Duty, VAT, Service Tax, etc.) 18,725,594 19,959,272
(ii) Payables on purchase of fixed assets 7,334,104 31,318,960
(iii) Trade / security deposits received 86,782 196,782
(iv) Advances from customers 7,836,506 11,471,371
(v) Book overdraft from bank 11,085,953 8,805,179
(vi) Provision for bonus 35,376,343 40,968,178
(vii) Others 8,709,745 2,031,426
TOTAL 93,854,287 119,123,459
Notes:(i) Refer Note (i) in Note 4 - Long-term borrowings for details of security.(ii) There is no amount due and outstanding as at Balance Sheet date to be credited to Investor Education and Protection Fund.
NOTE9:SHORT-TERMPROVISIONS
(a) Provision for employee benefits:
(i) Provision for Incentives 2,500,000 8,400,000
(ii) Provision for compensated absences 2,011,643 1,365,982
4,511,643 9,765,982(b) Provision - Others:
(i) Provision for Wealth Tax 300,000 350,000
(ii) Provision for proposed equity dividend 38,779,996 38,540,596
(iii) Provision for tax on proposed dividends 6,590,661 6,252,249
(iv) Provision for Commission to Managing Directors 16,900,000 13,100,000
62,570,657 58,242,845
TOTAL 67,082,300 68,008,827
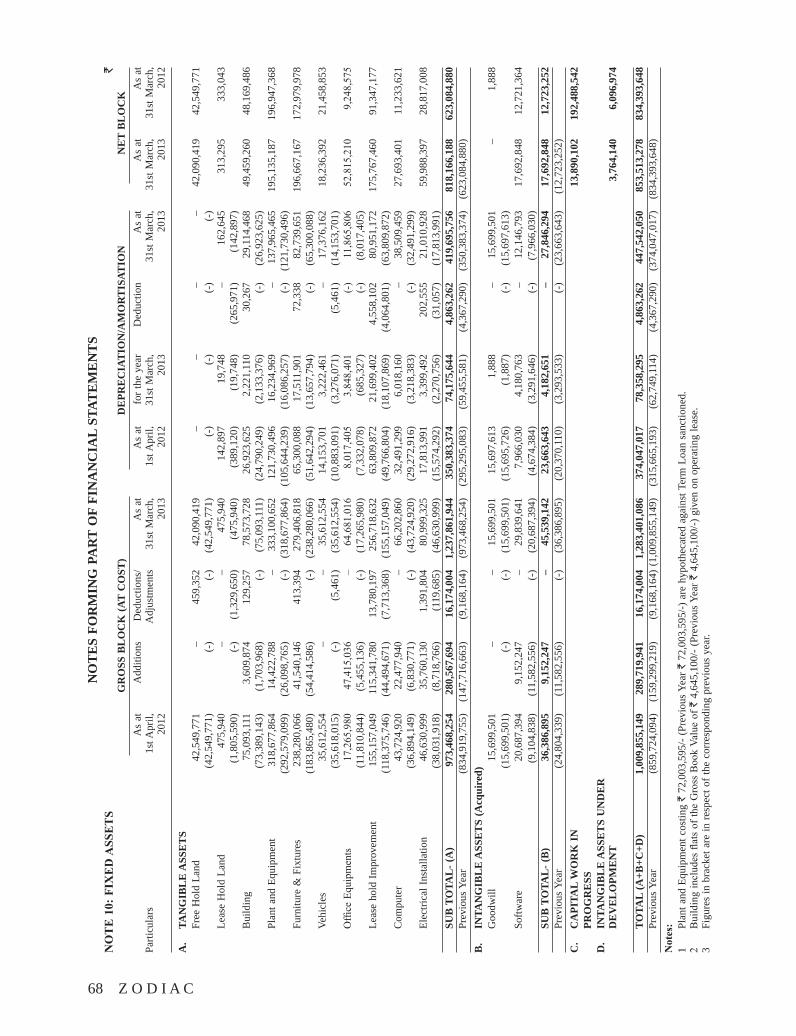
68 Z O D I A C
NO
TE
S FO
RM
ING
PA
RT
OF
FIN
AN
CIA
L ST
ATE
ME
NT
SNOTE10:FIXEDASSETS
`
GR
OSS
BL
OC
K (A
T C
OST
) D
EPR
EC
IAT
ION
/AM
OR
TIS
ATIO
N
NE
T B
LO
CK
A
s at
A
dditi
ons
Ded
uctio
ns/
As
at
As
at
for t
he y
ear
Ded
uctio
n A
s at
A
s at
A
s at
Pa
rticu
lars
1s
t Apr
il,
A
djus
tmen
ts
31st
Mar
ch,
1st A
pril,
31
st M
arch
,
31st
Mar
ch,
31st
Mar
ch,
31st
Mar
ch,
20
12
2013
20
12
2013
2013
20
13
2012
A.
TAN
GIB
LE
ASS
ET
S
Free
Hol
d La
nd
42,5
49,7
71
– 45
9,35
2 42
,090
,419
–
– –
– 42
,090
,419
42
,549
,771
(42,
549,
771)
(-
) (-
) (4
2,54
9,77
1)
(-)
(-)
(-)
(-)
Le
ase
Hol
d La
nd
475,
940
– –
475,
940
142,
897
19,7
48
– 16
2,64
5 31
3,29
5 33
3,04
3
(1
,805
,590
) (-
) (1
,329
,650
) (4
75,9
40)
(389
,120
) (1
9,74
8)
(265
,971
) (1
42,8
97)
B
uild
ing
75,0
93,1
11
3,60
9,87
4 12
9,25
7 78
,573
,728
26
,923
,625
2,
221,
110
30,2
67
29,1
14,4
68
49,4
59,2
60
48,1
69,4
86
(7
3,38
9,14
3)
(1,7
03,9
68)
(-)
(75,
093,
111)
(2
4,79
0,24
9)
(2,1
33,3
76)
(-)
(26,
923,
625)
Pl
ant a
nd E
quip
men
t 31
8,67
7,86
4 14
,422
,788
–
333,
100,
652
121,
730,
496
16,2
34,9
69
– 13
7,96
5,46
5 19
5,13
5,18
7 19
6,94
7,36
8
(2
92,5
79,0
99)
(26,
098,
765)
(-
) (3
18,6
77,8
64)
(105
,644
,239
) (1
6,08
6,25
7)
(-)
(121
,730
,496
)
Furn
iture
& F
ixtu
res
238,
280,
066
41,5
40,1
46
413,
394
279,
406,
818
65,3
00,0
88
17,5
11,9
01
72,3
38
82,7
39,6
51
196,
667,
167
172,
979,
978
(183
,865
,480
) (5
4,41
4,58
6)
(-)
(238
,280
,066
) (5
1,64
2,29
4)
(13,
657,
794)
(-
) (6
5,30
0,08
8)
Vehi
cles
35
,612
,554
–
– 35
,612
,554
14
,153
,701
3,
222,
461
– 17
,376
,162
18
,236
,392
21
,458
,853
(35,
618,
015)
(-
) (5
,461
) (3
5,61
2,55
4)
(10,
883,
091)
(3
,276
,071
) (5
,461
) (1
4,15
3,70
1)
Offi
ce E
quip
men
ts
17,2
65,9
80
47,4
15,0
36
– 64
,681
,016
8,
017,
405
3,84
8,40
1 (-
) 11
,865
,806
52
,815
,210
9,
248,
575
(11,
810,
844)
(5
,455
,136
) (-
) (1
7,26
5,98
0)
(7,3
32,0
78)
(685
,327
) (-
) (8
,017
,405
)
Leas
e ho
ld Im
prov
emen
t 15
5,15
7,04
9 11
5,34
1,78
0 13
,780
,197
25
6,71
8,63
2 63
,809
,872
21
,699
,402
4,
558,
102
80,9
51,1
72
175,
767,
460
91,3
47,1
77
(1
18,3
75,7
46)
(44,
494,
671)
(7
,713
,368
) (1
55,1
57,0
49)
(49,
766,
804)
(1
8,10
7,86
9)
(4,0
64,8
01)
(63,
809,
872)
C
ompu
ter
43,7
24,9
20
22,4
77,9
40
– 66
,202
,860
32
,491
,299
6,
018,
160
– 38
,509
,459
27
,693
,401
11
,233
,621
(36,
894,
149)
(6
,830
,771
) (-
) (4
3,72
4,92
0)
(29,
272,
916)
(3
,218
,383
) (-
) (3
2,49
1,29
9)
Elec
trica
l Ins
talla
tion
46,6
30,9
99
35,7
60,1
30
1,39
1,80
4 80
,999
,325
17
,813
,991
3,
399,
492
202,
555
21,0
10,9
28
59,9
88,3
97
28,8
17,0
08
(3
8,03
1,91
8)
(8,7
18,7
66)
(119
,685
) (4
6,63
0,99
9)
(15,
574,
292)
(2
,270
,756
) (3
1,05
7)
(17,
813,
991)
SU
B T
OTA
L- (
A)
973,
468,
254
280,
567,
694
16,1
74,0
04
1,23
7,86
1,94
4 35
0,38
3,37
4 74
,175
,644
4,
863,
262
419,
695,
756
818,
166,
188
623,
084,
880
Pr
evio
us Y
ear
(834
,919
,755
) (1
47,7
16,6
63)
(9,1
68,1
64)
(973
,468
,254
) (2
95,2
95,0
83)
(59,
455,
581)
(4
,367
,290
) (3
50,3
83,3
74)
(623
,084
,880
) B
. IN
TAN
GIB
LE
ASS
ET
S (A
cqui
red)
G
oodw
ill
15,6
99,5
01
– –
15,6
99,5
01
15,6
97,6
13
1,88
8 –
15,6
99,5
01
– 1,
888
(15,
699,
501)
(-
) (-
) (1
5,69
9,50
1)
(15,
695,
726)
(1
,887
) (-
) (1
5,69
7,61
3)
Softw
are
20,6
87,3
94
9,15
2,24
7 –
29,8
39,6
41
7,96
6,03
0 4,
180,
763
– 12
,146
,793
17
,692
,848
12
,721
,364
(9,1
04,8
38)
(11,
582,
556)
(-
) (2
0,68
7,39
4)
(4,6
74,3
84)
(3,2
91,6
46)
(-)
(7,9
66,0
30)
SUB
TO
TAL
- (B
) 36
,386
,895
9,
152,
247
– 45
,539
,142
23
,663
,643
4,
182,
651
– 27
,846
,294
17
,692
,848
12
,723
,252
Pr
evio
us Y
ear
(24,
804,
339)
(1
1,58
2,55
6)
(-)
(36,
386,
895)
(2
0,37
0,11
0)
(3,2
93,5
33)
(-)
(23,
663,
643)
(1
2,72
3,25
2)
C.
CA
PITA
L W
OR
K I
N
13,8
90,1
02
192,
488,
542
PR
OG
RE
SS
D
. IN
TAN
GIB
LE
ASS
ET
S U
ND
ER
DE
VE
LO
PME
NT
3,76
4,14
0 6,
096,
974
TOTA
L (A
+B+C
+D)
1,00
9,85
5,14
9 28
9,71
9,94
1 16
,174
,004
1,
283,
401,
086
374,
047,
017
78,3
58,2
95
4,86
3,26
2 44
7,54
2,05
0 85
3,51
3,27
8 83
4,39
3,64
8
Prev
ious
Yea
r (8
59,7
24,0
94)
(159
,299
,219
) (9
,168
,164
) (1
,009
,855
,149
) (3
15,6
65,1
93)
(62,
749,
114)
(4
,367
,290
) (3
74,0
47,0
17)
(834
,393
,648
) Notes:
1 Pl
ant a
nd E
quip
men
t cos
ting
` 72
,003
,595
/- (P
revi
ous Y
ear `
72,
003,
595/
-) a
re h
ypot
heca
ted
agai
nst T
erm
Loa
n sa
nctio
ned.
2 B
uild
ing
incl
udes
flat
s of
the
Gro
ss B
ook
Valu
e of
` 4
,645
,100
/- (P
revi
ous Y
ear `
4,6
45,1
00/-)
giv
en o
n op
erat
ing
leas
e.3
Figu
res
in b
rack
et a
re in
resp
ect o
f the
cor
resp
ondi
ng p
revi
ous
year
.
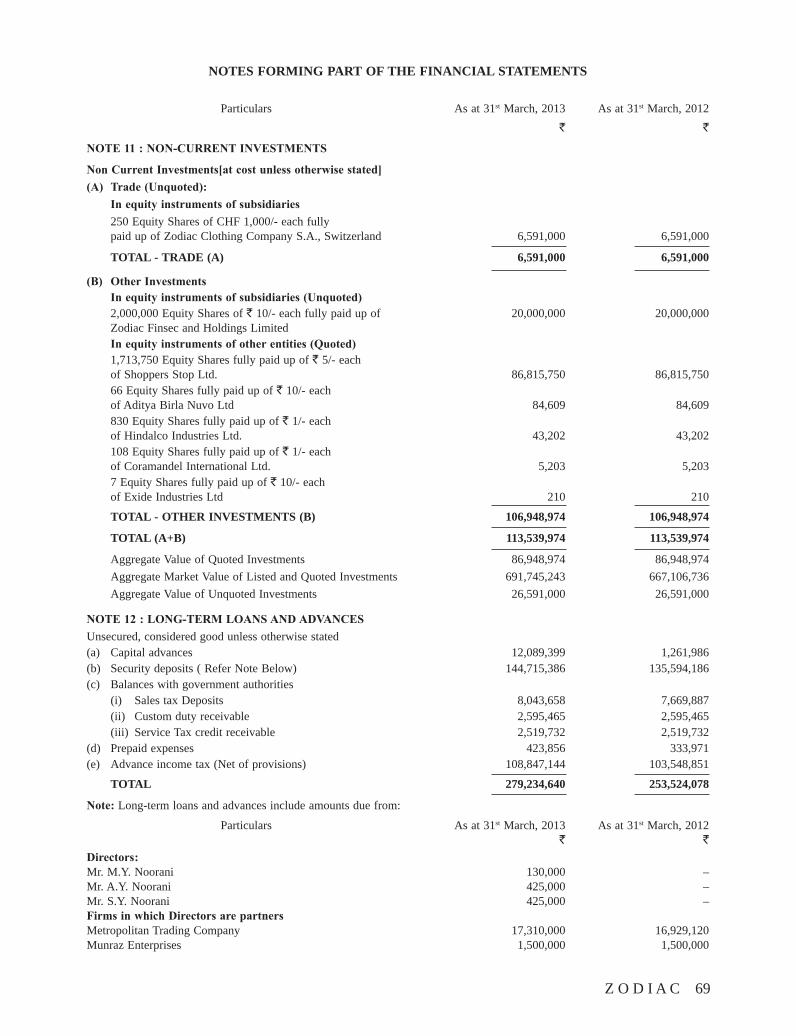
Z O D I A C 69
NOTES FORMING PART OF THE FINANCIAL STATEMENTS
Particulars As at 31st March, 2013 As at 31st March, 2012 ` `
NOTE11:NON-CURRENTINVESTMENTS
NonCurrentInvestments[atcostunlessotherwisestated](A) Trade(Unquoted): Inequityinstrumentsofsubsidiaries 250 Equity Shares of CHF 1,000/- each fully paid up of Zodiac Clothing Company S.A., Switzerland 6,591,000 6,591,000
TOTAL - TRADE (A) 6,591,000 6,591,000
(B) OtherInvestments Inequityinstrumentsofsubsidiaries(Unquoted) 2,000,000 Equity Shares of ` 10/- each fully paid up of 20,000,000 20,000,000 Zodiac Finsec and Holdings Limited Inequityinstrumentsofotherentities(Quoted) 1,713,750 Equity Shares fully paid up of ` 5/- each of Shoppers Stop Ltd. 86,815,750 86,815,750 66 Equity Shares fully paid up of ` 10/- each of Aditya Birla Nuvo Ltd 84,609 84,609 830 Equity Shares fully paid up of ` 1/- each of Hindalco Industries Ltd. 43,202 43,202 108 Equity Shares fully paid up of ` 1/- each of Coramandel International Ltd. 5,203 5,203 7 Equity Shares fully paid up of ` 10/- each of Exide Industries Ltd 210 210
TOTAL - OTHER INVESTMENTS (B) 106,948,974 106,948,974
TOTAL (A+B) 113,539,974 113,539,974
Aggregate Value of Quoted Investments 86,948,974 86,948,974 Aggregate Market Value of Listed and Quoted Investments 691,745,243 667,106,736 Aggregate Value of Unquoted Investments 26,591,000 26,591,000
NOTE12:LONG-TERMLOANSANDADVANCESUnsecured, considered good unless otherwise stated(a) Capital advances 12,089,399 1,261,986(b) Security deposits ( Refer Note Below) 144,715,386 135,594,186(c) Balances with government authorities (i) Sales tax Deposits 8,043,658 7,669,887 (ii) Custom duty receivable 2,595,465 2,595,465 (iii) Service Tax credit receivable 2,519,732 2,519,732(d) Prepaid expenses 423,856 333,971(e) Advance income tax (Net of provisions) 108,847,144 103,548,851
TOTAL 279,234,640 253,524,078
Note:Long-term loans and advances include amounts due from:
Particulars As at 31st March, 2013 As at 31st March, 2012 ` `Directors: Mr. M.Y. Noorani 130,000 –Mr. A.Y. Noorani 425,000 –Mr. S.Y. Noorani 425,000 –FirmsinwhichDirectorsarepartnersMetropolitan Trading Company 17,310,000 16,929,120Munraz Enterprises 1,500,000 1,500,000
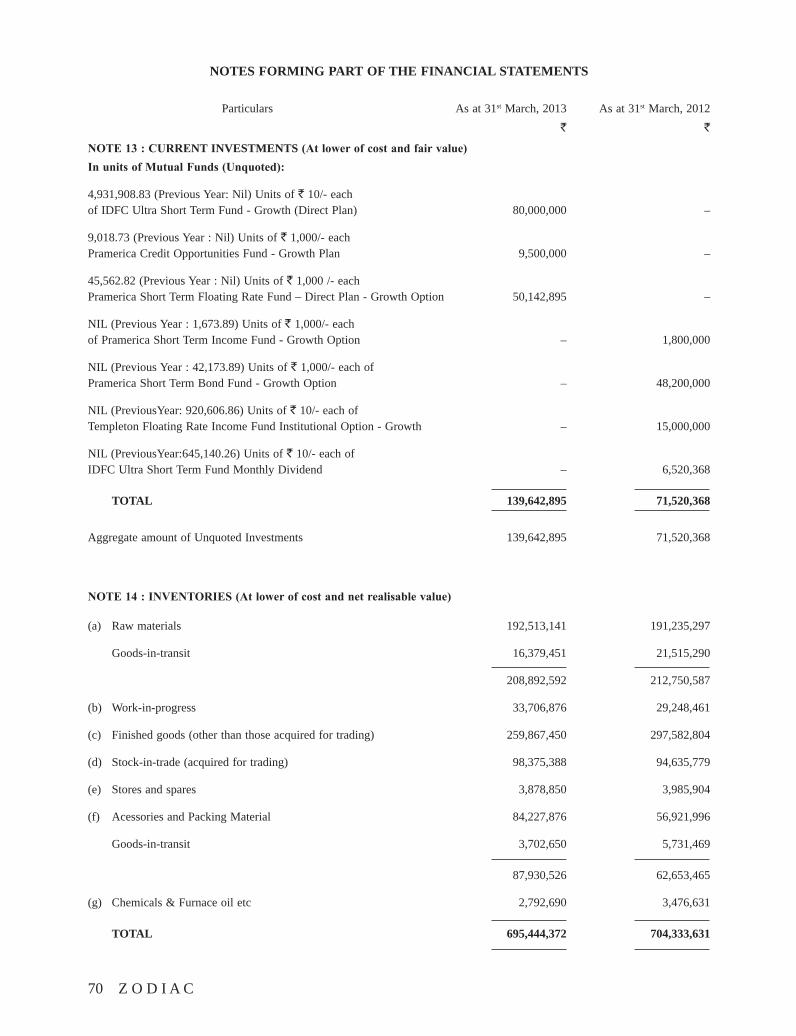
70 Z O D I A C
NOTES FORMING PART OF THE FINANCIAL STATEMENTS
Particulars As at 31st March, 2013 As at 31st March, 2012 ` `
NOTE13:CURRENT INVESTMENTS (Atlowerofcostandfairvalue)InunitsofMutualFunds(Unquoted):
4,931,908.83 (Previous Year: Nil) Units of ` 10/- each of IDFC Ultra Short Term Fund - Growth (Direct Plan) 80,000,000 –
9,018.73 (Previous Year : Nil) Units of ` 1,000/- each Pramerica Credit Opportunities Fund - Growth Plan 9,500,000 –
45,562.82 (Previous Year : Nil) Units of ` 1,000 /- each Pramerica Short Term Floating Rate Fund – Direct Plan - Growth Option 50,142,895 –
NIL (Previous Year : 1,673.89) Units of ` 1,000/- each of Pramerica Short Term Income Fund - Growth Option – 1,800,000
NIL (Previous Year : 42,173.89) Units of ` 1,000/- each of Pramerica Short Term Bond Fund - Growth Option – 48,200,000
NIL (PreviousYear: 920,606.86) Units of ` 10/- each of Templeton Floating Rate Income Fund Institutional Option - Growth – 15,000,000
NIL (PreviousYear:645,140.26) Units of ` 10/- each of IDFC Ultra Short Term Fund Monthly Dividend – 6,520,368
TOTAL 139,642,895 71,520,368
Aggregate amount of Unquoted Investments 139,642,895 71,520,368
NOTE14:INVENTORIES(Atlowerofcostandnetrealisablevalue)
(a) Raw materials 192,513,141 191,235,297
Goods-in-transit 16,379,451 21,515,290
208,892,592 212,750,587
(b) Work-in-progress 33,706,876 29,248,461
(c) Finished goods (other than those acquired for trading) 259,867,450 297,582,804
(d) Stock-in-trade (acquired for trading) 98,375,388 94,635,779
(e) Stores and spares 3,878,850 3,985,904
(f) Acessories and Packing Material 84,227,876 56,921,996
Goods-in-transit 3,702,650 5,731,469
87,930,526 62,653,465
(g) Chemicals & Furnace oil etc 2,792,690 3,476,631
TOTAL 695,444,372 704,333,631
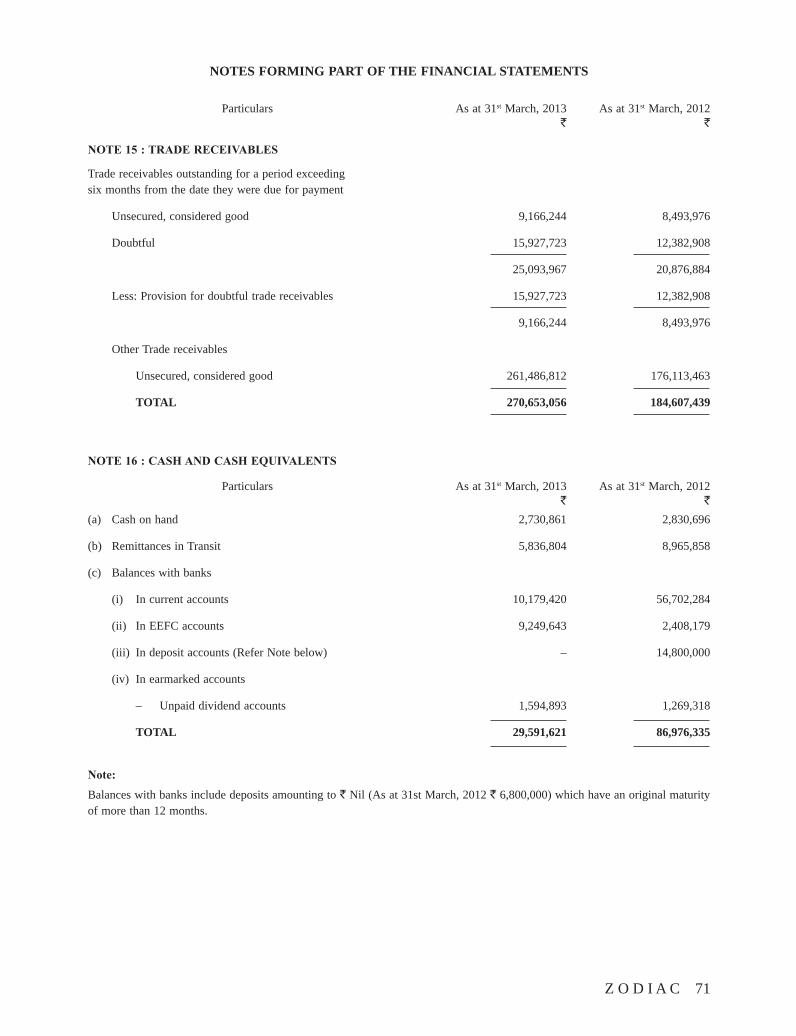
Z O D I A C 71
NOTES FORMING PART OF THE FINANCIAL STATEMENTS
Particulars As at 31st March, 2013 As at 31st March, 2012 ` `
NOTE15:TRADERECEIVABLES
Trade receivables outstanding for a period exceeding six months from the date they were due for payment
Unsecured, considered good 9,166,244 8,493,976
Doubtful 15,927,723 12,382,908
25,093,967 20,876,884
Less: Provision for doubtful trade receivables 15,927,723 12,382,908
9,166,244 8,493,976
Other Trade receivables
Unsecured, considered good 261,486,812 176,113,463
TOTAL 270,653,056 184,607,439
NOTE16:CASHANDCASHEQUIVALENTS
Particulars As at 31st March, 2013 As at 31st March, 2012 ` `
(a) Cash on hand 2,730,861 2,830,696
(b) Remittances in Transit 5,836,804 8,965,858
(c) Balances with banks
(i) In current accounts 10,179,420 56,702,284
(ii) In EEFC accounts 9,249,643 2,408,179
(iii) In deposit accounts (Refer Note below) – 14,800,000
(iv) In earmarked accounts
– Unpaid dividend accounts 1,594,893 1,269,318
TOTAL 29,591,621 86,976,335
Note:
Balances with banks include deposits amounting to ` Nil (As at 31st March, 2012 ` 6,800,000) which have an original maturity of more than 12 months.
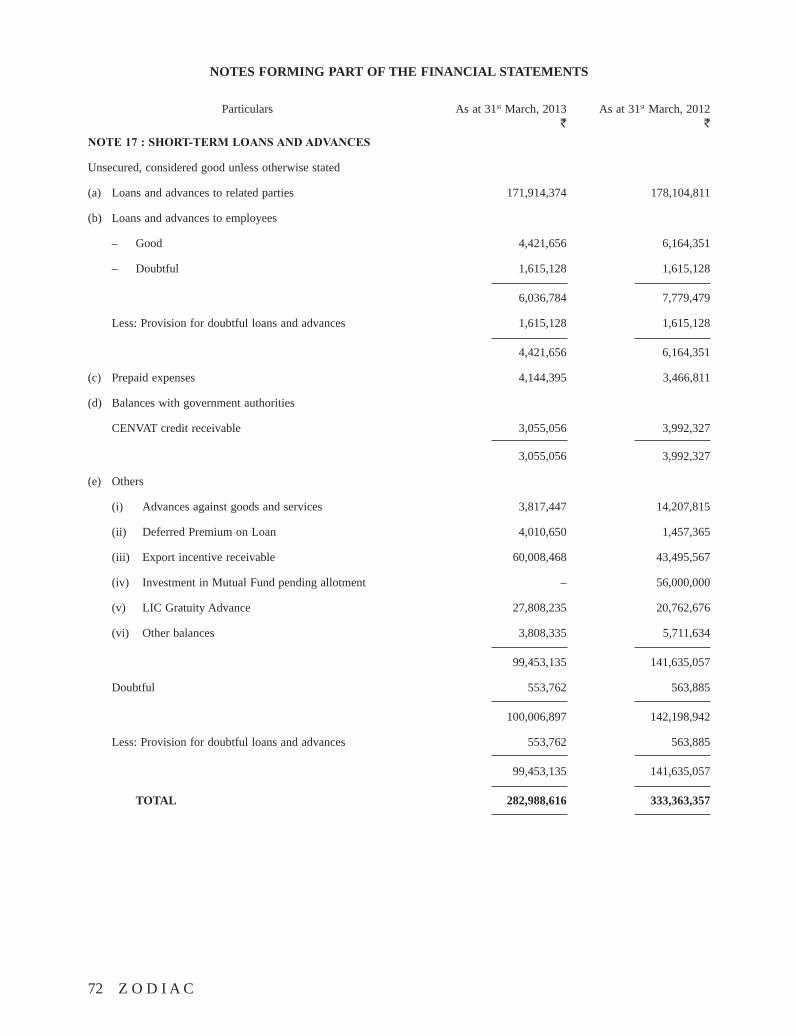
72 Z O D I A C
NOTES FORMING PART OF THE FINANCIAL STATEMENTS
Particulars As at 31st March, 2013 As at 31st March, 2012 ` `
NOTE17:SHORT-TERMLOANSANDADVANCES
Unsecured, considered good unless otherwise stated
(a) Loans and advances to related parties 171,914,374 178,104,811
(b) Loans and advances to employees
– Good 4,421,656 6,164,351
– Doubtful 1,615,128 1,615,128
6,036,784 7,779,479
Less: Provision for doubtful loans and advances 1,615,128 1,615,128
4,421,656 6,164,351
(c) Prepaid expenses 4,144,395 3,466,811
(d) Balances with government authorities
CENVAT credit receivable 3,055,056 3,992,327
3,055,056 3,992,327
(e) Others
(i) Advances against goods and services 3,817,447 14,207,815
(ii) Deferred Premium on Loan 4,010,650 1,457,365
(iii) Export incentive receivable 60,008,468 43,495,567
(iv) Investment in Mutual Fund pending allotment – 56,000,000
(v) LIC Gratuity Advance 27,808,235 20,762,676
(vi) Other balances 3,808,335 5,711,634
99,453,135 141,635,057
Doubtful 553,762 563,885
100,006,897 142,198,942
Less: Provision for doubtful loans and advances 553,762 563,885
99,453,135 141,635,057
TOTAL 282,988,616 333,363,357
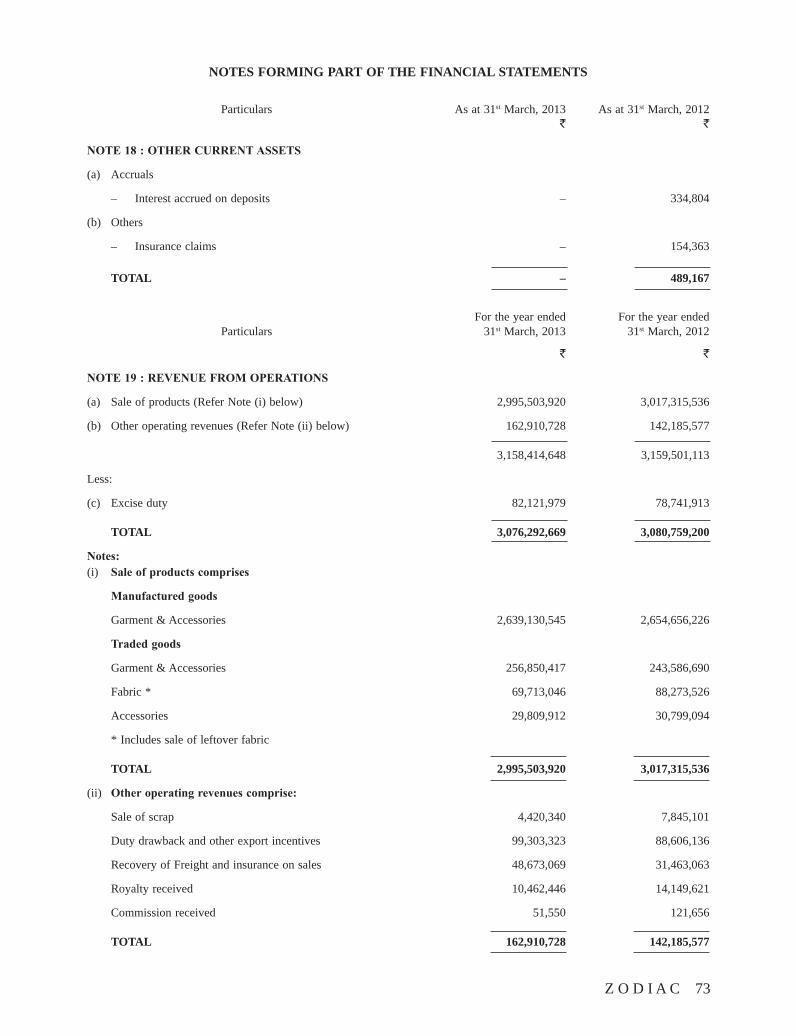
Z O D I A C 73
NOTES FORMING PART OF THE FINANCIAL STATEMENTS
Particulars As at 31st March, 2013 As at 31st March, 2012 ` `
NOTE18:OTHERCURRENTASSETS
(a) Accruals
– Interest accrued on deposits – 334,804
(b) Others
– Insurance claims – 154,363
TOTAL – 489,167
For the year ended For the year ended Particulars 31st March, 2013 31st March, 2012
` `
NOTE19:REVENUEFROMOPERATIONS
(a) Sale of products (Refer Note (i) below) 2,995,503,920 3,017,315,536
(b) Other operating revenues (Refer Note (ii) below) 162,910,728 142,185,577
3,158,414,648 3,159,501,113
Less:
(c) Excise duty 82,121,979 78,741,913
TOTAL 3,076,292,669 3,080,759,200
Notes:(i) Saleofproductscomprises
Manufacturedgoods
Garment & Accessories 2,639,130,545 2,654,656,226
Tradedgoods
Garment & Accessories 256,850,417 243,586,690
Fabric * 69,713,046 88,273,526
Accessories 29,809,912 30,799,094
* Includes sale of leftover fabric
TOTAL 2,995,503,920 3,017,315,536
(ii) Otheroperatingrevenuescomprise:
Sale of scrap 4,420,340 7,845,101
Duty drawback and other export incentives 99,303,323 88,606,136
Recovery of Freight and insurance on sales 48,673,069 31,463,063
Royalty received 10,462,446 14,149,621
Commission received 51,550 121,656
TOTAL 162,910,728 142,185,577
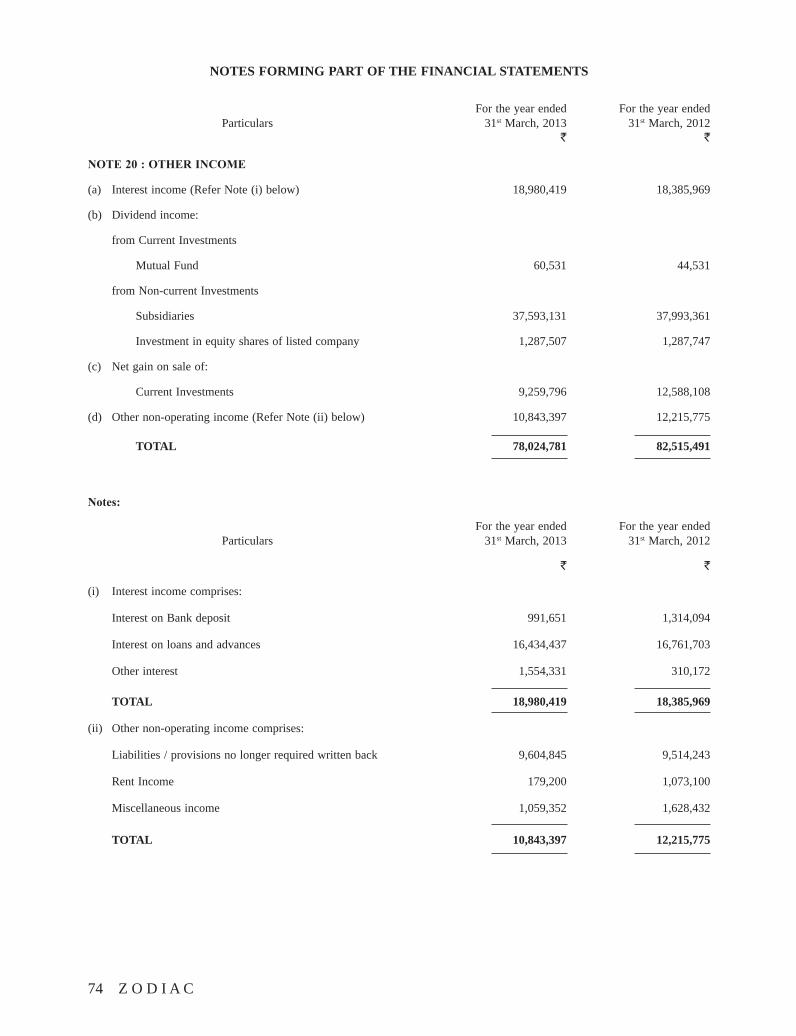
74 Z O D I A C
NOTES FORMING PART OF THE FINANCIAL STATEMENTS
For the year ended For the year ended Particulars 31st March, 2013 31st March, 2012 ` `
NOTE20:OTHERINCOME
(a) Interest income (Refer Note (i) below) 18,980,419 18,385,969
(b) Dividend income:
from Current Investments
Mutual Fund 60,531 44,531
from Non-current Investments
Subsidiaries 37,593,131 37,993,361
Investment in equity shares of listed company 1,287,507 1,287,747
(c) Net gain on sale of:
Current Investments 9,259,796 12,588,108
(d) Other non-operating income (Refer Note (ii) below) 10,843,397 12,215,775
TOTAL 78,024,781 82,515,491
Notes:
For the year ended For the year ended Particulars 31st March, 2013 31st March, 2012
` `
(i) Interest income comprises:
Interest on Bank deposit 991,651 1,314,094
Interest on loans and advances 16,434,437 16,761,703
Other interest 1,554,331 310,172
TOTAL 18,980,419 18,385,969
(ii) Other non-operating income comprises:
Liabilities / provisions no longer required written back 9,604,845 9,514,243
Rent Income 179,200 1,073,100
Miscellaneous income 1,059,352 1,628,432
TOTAL 10,843,397 12,215,775
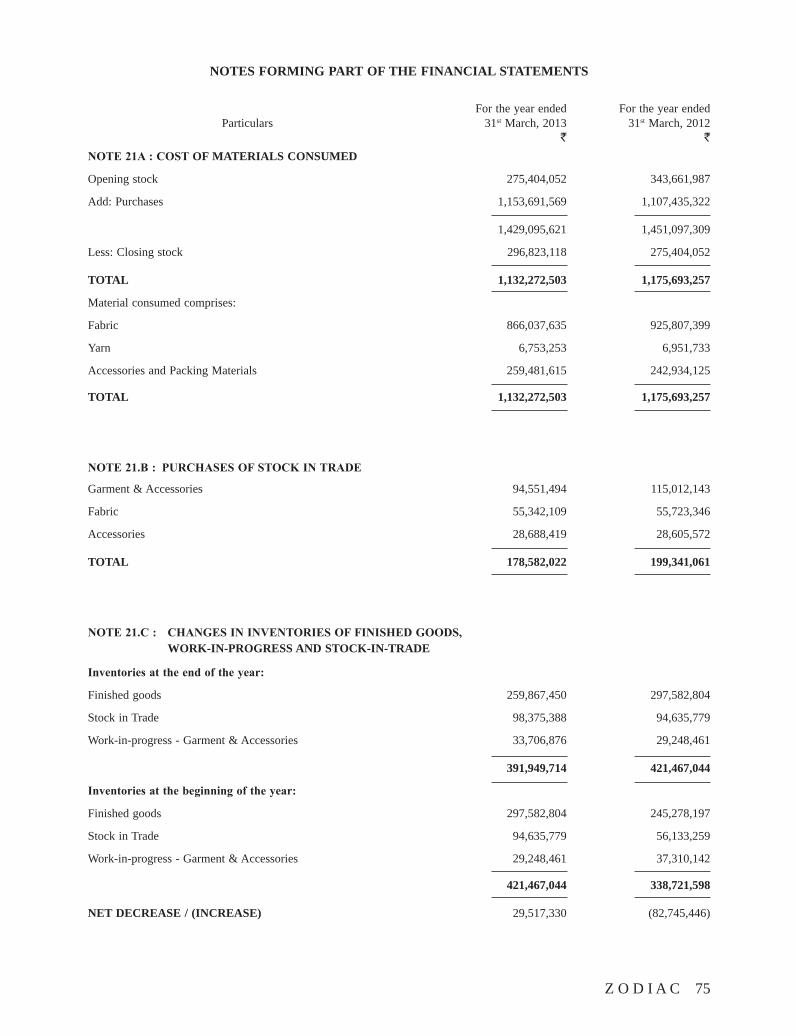
Z O D I A C 75
NOTES FORMING PART OF THE FINANCIAL STATEMENTS
For the year ended For the year ended Particulars 31st March, 2013 31st March, 2012 ` `
NOTE21A:COSTOF MATERIALS CONSUMED
Opening stock 275,404,052 343,661,987
Add: Purchases 1,153,691,569 1,107,435,322
1,429,095,621 1,451,097,309
Less: Closing stock 296,823,118 275,404,052
TOTAL 1,132,272,503 1,175,693,257
Material consumed comprises:
Fabric 866,037,635 925,807,399
Yarn 6,753,253 6,951,733
Accessories and Packing Materials 259,481,615 242,934,125
TOTAL 1,132,272,503 1,175,693,257
NOTE21.B: PURCHASESOFSTOCKINTRADE
Garment & Accessories 94,551,494 115,012,143
Fabric 55,342,109 55,723,346
Accessories 28,688,419 28,605,572
TOTAL 178,582,022 199,341,061
NOTE21.C: CHANGESININVENTORIESOFFINISHEDGOODS, WORK-IN-PROGRESS AND STOCK-IN-TRADE
Inventoriesattheendoftheyear:
Finished goods 259,867,450 297,582,804
Stock in Trade 98,375,388 94,635,779
Work-in-progress - Garment & Accessories 33,706,876 29,248,461
391,949,714 421,467,044
Inventoriesatthebeginningoftheyear:
Finished goods 297,582,804 245,278,197
Stock in Trade 94,635,779 56,133,259
Work-in-progress - Garment & Accessories 29,248,461 37,310,142
421,467,044 338,721,598
NET DECREASE / (INCREASE) 29,517,330 (82,745,446)
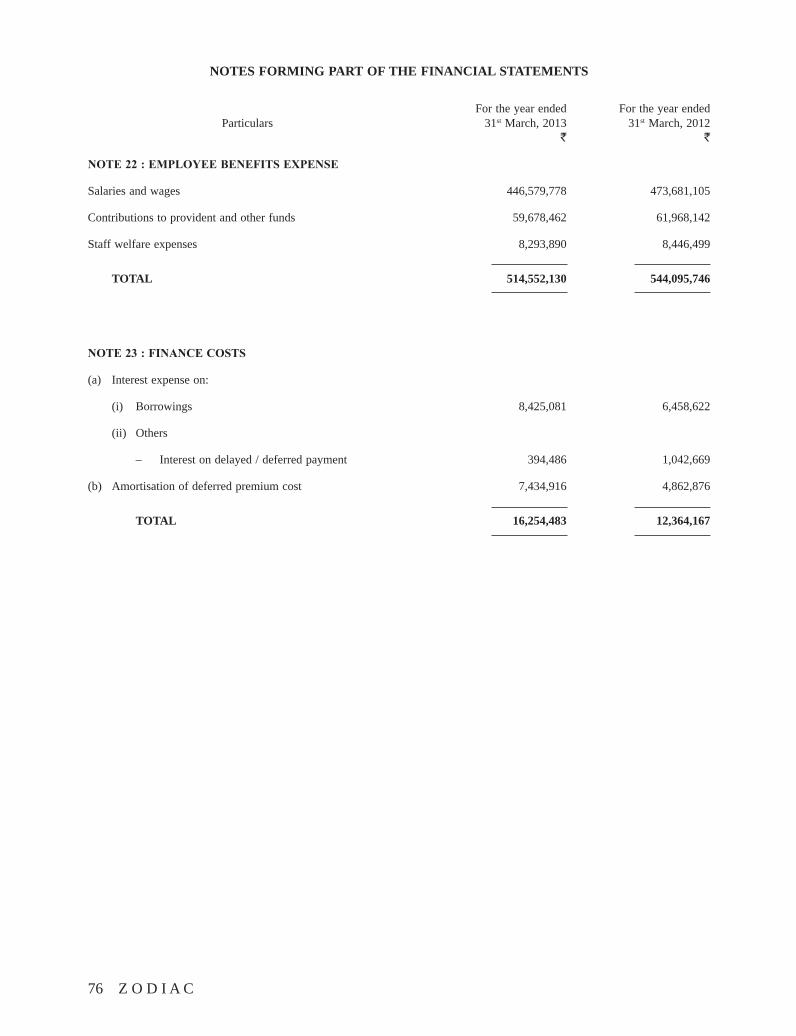
76 Z O D I A C
NOTES FORMING PART OF THE FINANCIAL STATEMENTS
For the year ended For the year ended Particulars 31st March, 2013 31st March, 2012 ` `
NOTE22:EMPLOYEEBENEFITSEXPENSE
Salaries and wages 446,579,778 473,681,105
Contributions to provident and other funds 59,678,462 61,968,142
Staff welfare expenses 8,293,890 8,446,499
TOTAL 514,552,130 544,095,746
NOTE23:FINANCECOSTS
(a) Interest expense on:
(i) Borrowings 8,425,081 6,458,622
(ii) Others
– Interest on delayed / deferred payment 394,486 1,042,669
(b) Amortisation of deferred premium cost 7,434,916 4,862,876
TOTAL 16,254,483 12,364,167
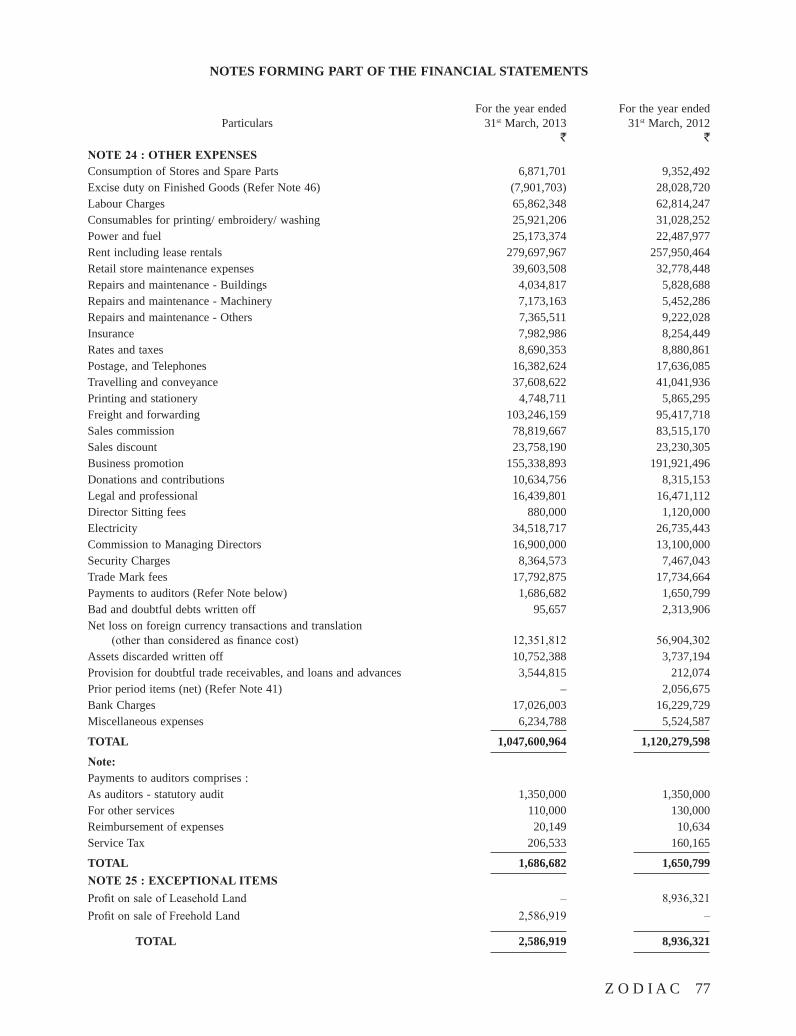
Z O D I A C 77
NOTES FORMING PART OF THE FINANCIAL STATEMENTS
For the year ended For the year ended Particulars 31st March, 2013 31st March, 2012 ` `NOTE24:OTHEREXPENSESConsumption of Stores and Spare Parts 6,871,701 9,352,492Excise duty on Finished Goods (Refer Note 46) (7,901,703) 28,028,720Labour Charges 65,862,348 62,814,247Consumables for printing/ embroidery/ washing 25,921,206 31,028,252Power and fuel 25,173,374 22,487,977Rent including lease rentals 279,697,967 257,950,464Retail store maintenance expenses 39,603,508 32,778,448Repairs and maintenance - Buildings 4,034,817 5,828,688Repairs and maintenance - Machinery 7,173,163 5,452,286Repairs and maintenance - Others 7,365,511 9,222,028Insurance 7,982,986 8,254,449Rates and taxes 8,690,353 8,880,861Postage, and Telephones 16,382,624 17,636,085Travelling and conveyance 37,608,622 41,041,936Printing and stationery 4,748,711 5,865,295Freight and forwarding 103,246,159 95,417,718Sales commission 78,819,667 83,515,170Sales discount 23,758,190 23,230,305Business promotion 155,338,893 191,921,496Donations and contributions 10,634,756 8,315,153Legal and professional 16,439,801 16,471,112Director Sitting fees 880,000 1,120,000Electricity 34,518,717 26,735,443Commission to Managing Directors 16,900,000 13,100,000Security Charges 8,364,573 7,467,043Trade Mark fees 17,792,875 17,734,664Payments to auditors (Refer Note below) 1,686,682 1,650,799Bad and doubtful debts written off 95,657 2,313,906Net loss on foreign currency transactions and translation (other than considered as finance cost) 12,351,812 56,904,302Assets discarded written off 10,752,388 3,737,194Provision for doubtful trade receivables, and loans and advances 3,544,815 212,074Prior period items (net) (Refer Note 41) – 2,056,675Bank Charges 17,026,003 16,229,729Miscellaneous expenses 6,234,788 5,524,587
TOTAL 1,047,600,964 1,120,279,598
Note:Payments to auditors comprises :As auditors - statutory audit 1,350,000 1,350,000For other services 110,000 130,000Reimbursement of expenses 20,149 10,634Service Tax 206,533 160,165
TOTAL 1,686,682 1,650,799NOTE25:EXCEPTIONALITEMSProfit on sale of Leasehold Land – 8,936,321Profit on sale of Freehold Land 2,586,919 –
TOTAL 2,586,919 8,936,321
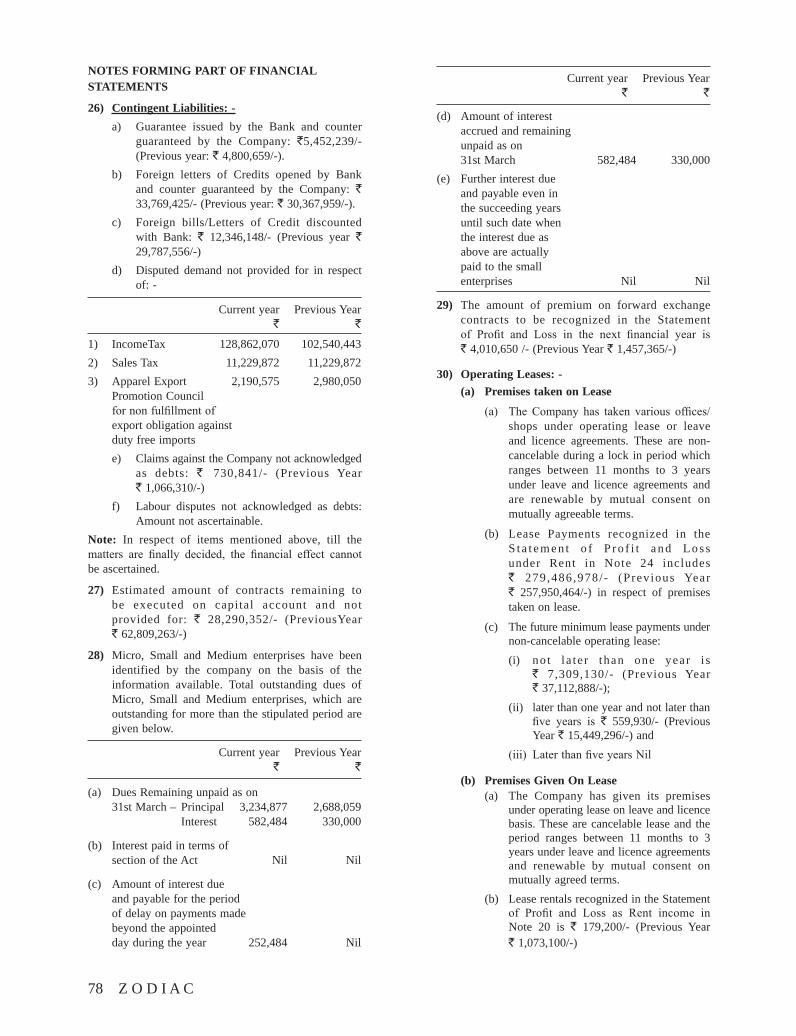
78 Z O D I A C
NOTES FORMING PART OF FINANCIAL STATEMENTS
26) Contingent Liabilities: - a) Guarantee issued by the Bank and counter
guaranteed by the Company: `5,452,239/- (Previous year: ` 4,800,659/-).
b) Foreign letters of Credits opened by Bank and counter guaranteed by the Company: ` 33,769,425/- (Previous year: ` 30,367,959/-).
c) Foreign bills/Letters of Credit discounted with Bank: ` 12,346,148/- (Previous year ` 29,787,556/-)
d) Disputed demand not provided for in respect of: -
Current year Previous Year ` `
1) IncomeTax 128,862,070 102,540,4432) Sales Tax 11,229,872 11,229,8723) Apparel Export 2,190,575 2,980,050 Promotion Council fornonfulfillmentof export obligation against duty free imports
e) Claims against the Company not acknowledged as debts: ` 730,841/- (Previous Year ` 1,066,310/-)
f) Labour disputes not acknowledged as debts: Amount not ascertainable.
Note: In respect of items mentioned above, till the matters are finally decided, the financial effect cannotbe ascertained.
27) Estimated amount of contracts remaining to be executed on capital account and not provided for: ` 28,290,352/- (PreviousYear ` 62,809,263/-)
28) Micro, Small and Medium enterprises have been identified by the company on the basis of the information available. Total outstanding dues of Micro, Small and Medium enterprises, which are outstanding for more than the stipulated period are given below.
Current year Previous Year ` `
(a) Dues Remaining unpaid as on 31st March – Principal 3,234,877 2,688,059 Interest 582,484 330,000
(b) Interest paid in terms of section of the Act Nil Nil
(c) Amount of interest due and payable for the period of delay on payments made beyond the appointed day during the year 252,484 Nil
(d) Amount of interest accrued and remaining unpaid as on 31st March 582,484 330,000(e) Further interest due and payable even in the succeeding years until such date when the interest due as above are actually paid to the small enterprises Nil Nil
29) The amount of premium on forward exchange contracts to be recognized in the Statement of Profit and Loss in the next financial year is ` 4,010,650 /- (Previous Year ` 1,457,365/-)
30) Operating Leases: - (a) Premises taken on Lease
(a) The Company has taken various offices/shops under operating lease or leave and licence agreements. These are non-cancelable during a lock in period which ranges between 11 months to 3 years under leave and licence agreements and are renewable by mutual consent on mutually agreeable terms.
(b) Lease Payments recognized in the S t a t e m e n t o f P r o f i t a n d L o s s under Rent in Note 24 includes ` 279 ,486,978/ - (Previous Year ` 257,950,464/-) in respect of premises taken on lease.
(c) The future minimum lease payments under non-cancelable operating lease:
(i) no t l a te r than one year i s ` 7,309,130/- (Previous Year ` 37,112,888/-);
(ii) later than one year and not later than five years is ` 559,930/- (Previous Year ` 15,449,296/-) and
(iii) LaterthanfiveyearsNil
(b) Premises Given On Lease (a) The Company has given its premises
under operating lease on leave and licence basis. These are cancelable lease and the period ranges between 11 months to 3 years under leave and licence agreements and renewable by mutual consent on mutually agreed terms.
(b) Lease rentals recognized in the Statement of Profit and Loss as Rent income inNote 20 is ` 179,200/- (Previous Year ` 1,073,100/-)
Current year Previous Year ` `
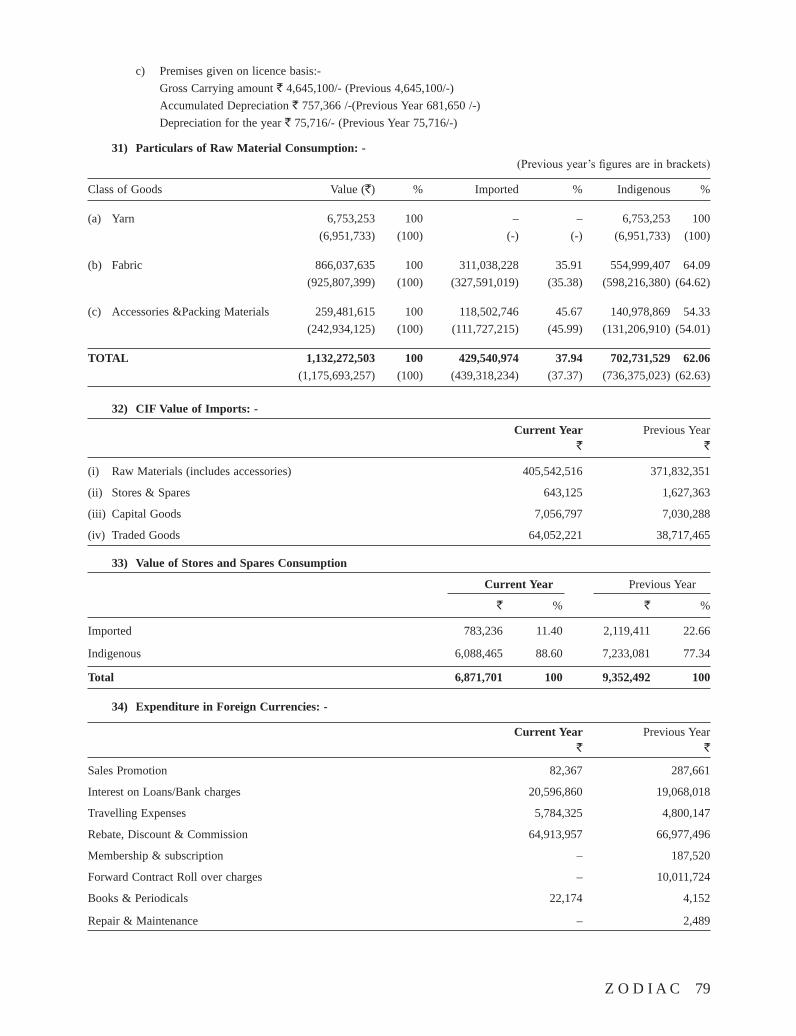
Z O D I A C 79
c) Premises given on licence basis:- Gross Carrying amount ` 4,645,100/- (Previous 4,645,100/-) Accumulated Depreciation ` 757,366 /-(Previous Year 681,650 /-) Depreciation for the year ` 75,716/- (Previous Year 75,716/-)
31) Particulars of Raw Material Consumption: -(Previousyear’sfiguresareinbrackets)
Class of Goods Value (`) % Imported % Indigenous %
(a) Yarn 6,753,253 100 – – 6,753,253 100 (6,951,733) (100) (-) (-) (6,951,733) (100)
(b) Fabric 866,037,635 100 311,038,228 35.91 554,999,407 64.09 (925,807,399) (100) (327,591,019) (35.38) (598,216,380) (64.62)
(c) Accessories &Packing Materials 259,481,615 100 118,502,746 45.67 140,978,869 54.33 (242,934,125) (100) (111,727,215) (45.99) (131,206,910) (54.01)
TOTAL 1,132,272,503 100 429,540,974 37.94 702,731,529 62.06 (1,175,693,257) (100) (439,318,234) (37.37) (736,375,023) (62.63)
32) CIF Value of Imports: -
Current Year Previous Year ` `
(i) Raw Materials (includes accessories) 405,542,516 371,832,351
(ii) Stores & Spares 643,125 1,627,363
(iii) Capital Goods 7,056,797 7,030,288
(iv) Traded Goods 64,052,221 38,717,465
33) Value of Stores and Spares Consumption
Current Year Previous Year
` % ` %
Imported 783,236 11.40 2,119,411 22.66
Indigenous 6,088,465 88.60 7,233,081 77.34
Total 6,871,701 100 9,352,492 100
34) Expenditure in Foreign Currencies: -
Current Year Previous Year ` `
Sales Promotion 82,367 287,661
Interest on Loans/Bank charges 20,596,860 19,068,018
Travelling Expenses 5,784,325 4,800,147
Rebate, Discount & Commission 64,913,957 66,977,496
Membership & subscription – 187,520
Forward Contract Roll over charges – 10,011,724
Books & Periodicals 22,174 4,152
Repair & Maintenance – 2,489
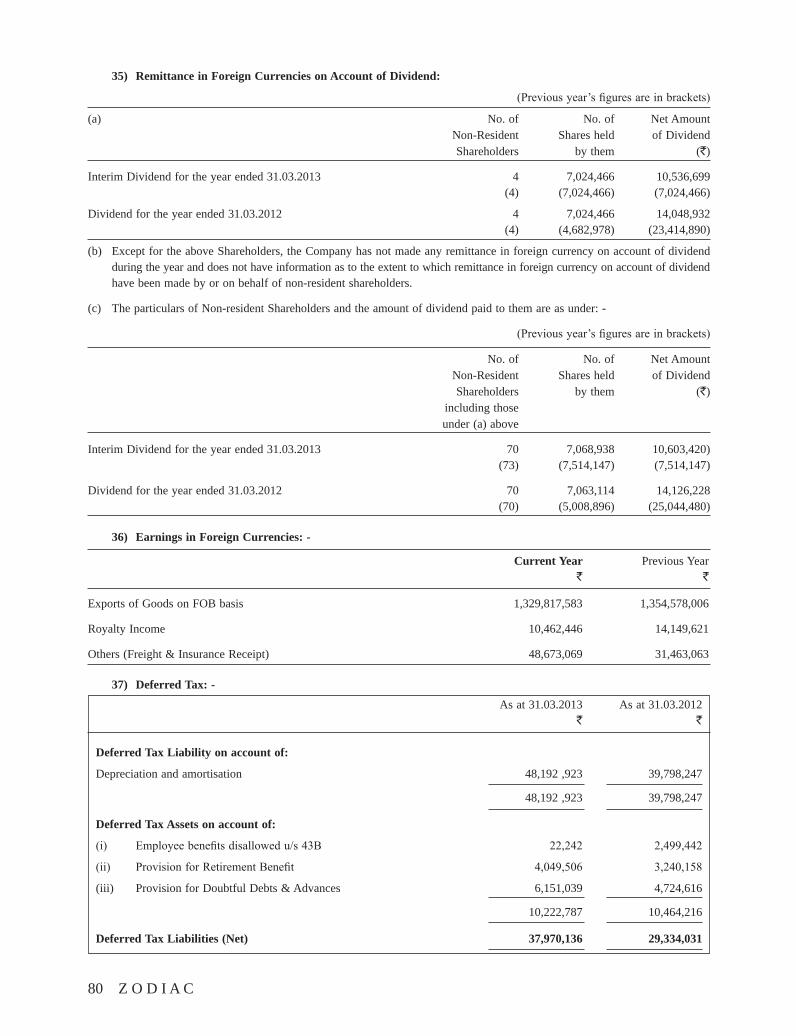
80 Z O D I A C
35) Remittance in Foreign Currencies on Account of Dividend:
(Previousyear’sfiguresareinbrackets)
(a) No. of No. of Net Amount Non-Resident Shares held of Dividend Shareholders by them (`)
Interim Dividend for the year ended 31.03.2013 4 7,024,466 10,536,699 (4) (7,024,466) (7,024,466)
Dividend for the year ended 31.03.2012 4 7,024,466 14,048,932 (4) (4,682,978) (23,414,890)
(b) Except for the above Shareholders, the Company has not made any remittance in foreign currency on account of dividend during the year and does not have information as to the extent to which remittance in foreign currency on account of dividend have been made by or on behalf of non-resident shareholders.
(c) The particulars of Non-resident Shareholders and the amount of dividend paid to them are as under: -
(Previousyear’sfiguresareinbrackets)
No. of No. of Net Amount Non-Resident Shares held of Dividend Shareholders by them (`) including those under (a) above
Interim Dividend for the year ended 31.03.2013 70 7,068,938 10,603,420) (73) (7,514,147) (7,514,147)
Dividend for the year ended 31.03.2012 70 7,063,114 14,126,228 (70) (5,008,896) (25,044,480)
36) Earnings in Foreign Currencies: -
Current Year Previous Year ` `
Exports of Goods on FOB basis 1,329,817,583 1,354,578,006
Royalty Income 10,462,446 14,149,621
Others (Freight & Insurance Receipt) 48,673,069 31,463,063
37) Deferred Tax: -
As at 31.03.2013 As at 31.03.2012 ` `
Deferred Tax Liability on account of:
Depreciation and amortisation 48,192 ,923 39,798,247
48,192 ,923 39,798,247
Deferred Tax Assets on account of:
(i) Employeebenefitsdisallowedu/s43B 22,242 2,499,442
(ii) ProvisionforRetirementBenefit 4,049,506 3,240,158
(iii) Provision for Doubtful Debts & Advances 6,151,039 4,724,616
10,222,787 10,464,216
Deferred Tax Liabilities (Net) 37,970,136 29,334,031
Z O D I A C 81
The Net Deferred tax charge of ` 8,636,105/- (Previous year (credit) ` 1,607,299/-) for the year has been recognized in the StatementofProfitandLoss.
The deferred tax asset and deferred tax liability is calculated by applying tax rate and tax laws that have been enacted or substantially enacted by the Balance Sheet date.
38) Related Party Disclosures: -
Related party disclosures as required by (AS-18) “Related Party Disclosures” are given below:
(i) Relationships: -
(a) Subsidiary Companies (including sub-subsidiaries): -
Zodiac Finsec and Holdings Ltd.
Zodiac Clothing Company S. A.
Zodiac Clothing Co (U.A.E.) LLC.
Zodiac Clothing Company INC
Zodiac Properties Ltd
(b) Key Management Personnel: -
Mr. M. Y. Noorani
Mr. A. Y. Noorani
Mr. S. Y. Noorani
(c) Other Related Parties:-
i. The enterprises where control of key management personnel and/or their relatives exist and with whom the transactions have taken place :
Zodiac Metropolitan Clothing Gmbh
Asia Tangible Investments Pte. Ltd.
Metropolitan Trading Company
Montage Corporation
Munraz Enterprises
Mariambai & Haji Noor Mohamad Noorani Foundation Trust
Mustang Manufacturing Company
Mashal Enterprises
Euro Global Holdings Pte Ltd
Onward LLC
Miraj Marketing Company LLP
ii. Relatives of key management personnel with whom the transactions have taken place :
Mr. Awais A. Noorani
Mr. Musaed A. Noorani
Mrs. Muna A. Noorani
Mrs. Zehra S. Noorani
Mrs. Saniyya A. Noorani
Note:RelatedpartyrelationshipisasidentifiedbytheCompanyandrelieduponbytheAuditors.
82 Z O D I A C
II) The following transactions were carried out with the related parties in the ordinary course of business.
(Previousyear’sfiguresareinbrackets)
Key Other Subsidiaries Management Related Personnel Parties Total ` ` ` `
Sale of Goods
Mashal Enterprises – – 6,827,490 6,827,490 (-) (-) (7,047,227) (7,047,227)
Zodiac Clothing Co (U.A.E.) LLC 96,846,728 – – 96,846,728 (97,763,458) (-) (-) (97,763,458)
Zodiac Metropolitan Clothing Gmbh – – 149,293,611 149,293,611 (-) (-) (163,139,982) (163,139,982)
Onward LLC – – 100,911,352 100,911,352 (-) (-) (160,377,002) (160,377,002)
Interest Income Received
Zodiac Finsec and Holdings Ltd 16,434,437 – – 16,434,437 (16,761,703) (-) (-) (16,761,703)
Royalty Income Received
Zodiac Clothing Co (U.A.E.) LLC 10,462,446 – – 10,462,446 (14,149,621) (-) (-) (14,149,621)
Dividend Income Received
Zodiac Finsec and Holdings Ltd 20,000,000 – – 20,000,000 (20,000,000) (-) (-) (20,000,000)
Zodiac Clothing Company S.A 17,593,131 – – 17,593,131 (17,993,361) (-) (-) (17,993,361)
Trade Mark fees Accrued
Metropolitan Trading Company – – 19,928,766 19,928,766 (-) (-) (19,421,503) (19,421,503)
Rent Accrued
Metropolitan Trading Company – – 14,193,066 14,193,066 (-) (-) (20,364,456) (20,364,456)
Mustang Manufacturing Company – – 207,600 207,600 (-) (-) (207,600) (207,600)
Munraz Enterprises – – 388,800 388,800 (-) (-) (388,800) (388,800)
Montage Corporation – – 62,316 62,316 (-) (-) (62,616) (62,616)
Miraj Marketing Company LLP – – 1,089,888 1,089,888 (-) (-) (825,000) (825,000)
Mr. A.Y. Noorani – 473,700 – 473,700 (-) (433,405) (-) (433,405)
Z O D I A C 83
Mr. S.Y. Noorani – 473,700 – 473,700 (-) (433,405) (-) (433,405)Mr. M.Y. Noorani – 133,056 – 133,056 (-) (133,056) (-) (133,056)Zodiac Finsec and Holdings Ltd 54,142,464 – – 54,142,464 (53,149,824) (-) (-) (53,149,824)
Salary PaidMr. Awais A. Noorani – – 3,998,060 3,998,060 (-) (-) (4,709,059) (4,709,059)
Expenses RecoveredMashal Enterprises – – 558,218 558,218 (-) (-) (519,923) (519,923)Zodiac Finsec and Holdings Ltd 26,993 – – 26,993 (50,913) (-) (-) (50,913)Zodiac Metropolitan Clothing Gmbh – – 134,542 134,542 (-) (-) (-) (-)Metropolitan Trading Company – – 1,627,712 1,627,712 (-) (-) (788,259) (788,259)Munraz Enterprises – – 2,500 2,500 (-) (-) (390) (390)Zodiac Clothing Co (U.A.E.) LLC 1,295,204 – – 1,295,204 (970,507) (-) (-) (970,507)
Other Income ReceivedZodiac Clothing Co (U.A.E.) LLC 4,277,482 – – 4,277,482 (4,578,300) (-) (-) (4,578,300)Zodiac Metropolitan Clothing Gmbh – – 5,109,194 5,109,194 (-) (-) (5,555,287) (5,555,287)Onward LLC – – 1,423,305 1,423,305 (-) (-) (363,310) (363,310)
Expenses ReimbursedMetropolitan Trading Company – – 39,963 39,963 (-) (-) (2,910) (2,910)Mashal Enterprises – – 226,696 226,696 (-) (-) (143,384) (143,384)Munraz Enterprises – – 342,120 342,120 (-) (-) (342,331) (342,331)Zodiac Clothing Co (U.A.E.) LLC 1,185,015 – – 1,185,015 (1,052,122) (-) (-) (1,052,122)Zodiac Metropolitan Clothing Gmbh – – – – (-) (-) (327,547) (327,547)Zodiac Finsec and Holdings Ltd 1,036,049 – – 1,036,049 (1,219,862) (-) (-) (1,219,862)
Loans/Advances Repaid byZodiac Finsec and Holdings Ltd 6,000,000 – – 6,000,000 (22,510,000) (-) (-) (22,510,000)
Key Other Subsidiaries Management Related Personnel Parties Total ` ` ` `
84 Z O D I A C
Dividend Paid
Miraj Marketing Company LLP – – 8,112,070 8,112,070 (-) (-) (10,043,514) (10,043,514)
Metropolitan Trading Company – – 1,546,545 1,546,545 (-) (-) (5,744,310) (5,744,310)
Asia Tangible Investments Pte. Ltd. – – 11,042,087 11,042,087 (-) (-) (13,671,157) (13,671,157)
Euro Global Holdings Pte Ltd – – 11,042,087 11,042,087 (-) (-) (13,671,157) (13,671,157)
Mr. M.Y. Noorani – 7,446,338 – 7,446,338 (-) (4,933,976) (-) (4,933,976)
Mr. A.Y. Noorani – 66,728 – 66,728 (-) (82,615) (-) (82,615)
Mr. S.Y. Noorani – 29,169 – 29,169 (-) (456,358) (-) (456,358)
Mr. Awais A. Noorani – – 263 263 (-) (-) (-) (-)
Mr. Musaed A. Noorani – – 263 263 (-) (-) (325) (325)
Mrs. Saniyya A. Noorani – – 263 263 (-) (-) (-) (-)
Mrs. Muna A. Noorani – – 263 263 (-) (-) (325) (325)
Mrs. Zehra S. Noorani – – 1,250 1,250 (-) (-) (1,547) (1,547)
Donation given
Mariambai & Haji Noor – – – –
Mohamed Noorani Foundation Trust (-) (-) (500,000) (500,000)
Commission Accrued
Zodiac Metropolitan Clothing Gmbh – – 11,824,737 11,824,737 (-) (-) (13,685,494) (13,685,494)
Mr. A.Y. Noorani – 8,450,000 – 8,450,000 (-) (6,550,000) (-) (6,550,000)
Mr. S.Y. Noorani – 8,450,000 – 8,450,000 (-) (6,550,000) (-) (6,550,000)
Export Claims
Zodiac Metropolitan Clothing Gmbh – – 7,500,000 7,500,000 (-) (-) (-) (-)
Key Other Subsidiaries Management Related Personnel Parties Total ` ` ` `
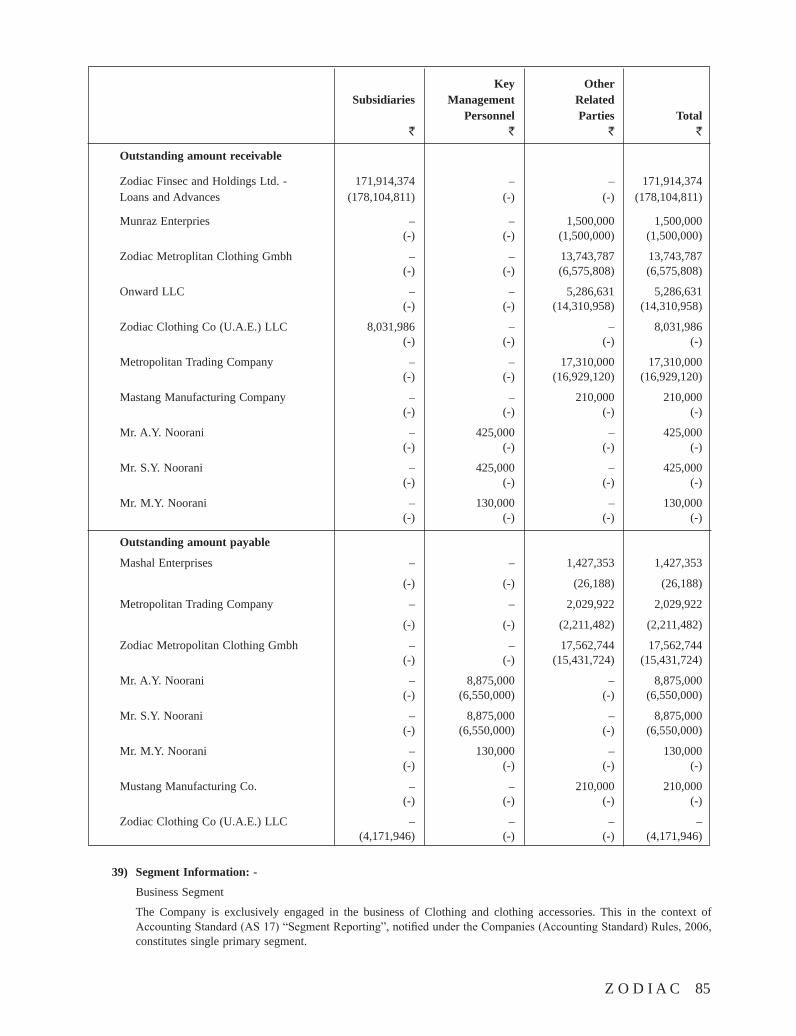
Z O D I A C 85
Key Other Subsidiaries Management Related Personnel Parties Total ` ` ` `
Outstanding amount receivable
Zodiac Finsec and Holdings Ltd. - 171,914,374 – – 171,914,374 Loans and Advances (178,104,811) (-) (-) (178,104,811)
Munraz Enterpries – – 1,500,000 1,500,000 (-) (-) (1,500,000) (1,500,000)
Zodiac Metroplitan Clothing Gmbh – – 13,743,787 13,743,787 (-) (-) (6,575,808) (6,575,808)
Onward LLC – – 5,286,631 5,286,631 (-) (-) (14,310,958) (14,310,958)
Zodiac Clothing Co (U.A.E.) LLC 8,031,986 – – 8,031,986 (-) (-) (-) (-)
Metropolitan Trading Company – – 17,310,000 17,310,000 (-) (-) (16,929,120) (16,929,120)
Mastang Manufacturing Company – – 210,000 210,000 (-) (-) (-) (-)
Mr. A.Y. Noorani – 425,000 – 425,000 (-) (-) (-) (-)
Mr. S.Y. Noorani – 425,000 – 425,000 (-) (-) (-) (-)
Mr. M.Y. Noorani – 130,000 – 130,000 (-) (-) (-) (-)
Outstanding amount payable
Mashal Enterprises – – 1,427,353 1,427,353
(-) (-) (26,188) (26,188)
Metropolitan Trading Company – – 2,029,922 2,029,922
(-) (-) (2,211,482) (2,211,482)
Zodiac Metropolitan Clothing Gmbh – – 17,562,744 17,562,744 (-) (-) (15,431,724) (15,431,724)
Mr. A.Y. Noorani – 8,875,000 – 8,875,000 (-) (6,550,000) (-) (6,550,000)
Mr. S.Y. Noorani – 8,875,000 – 8,875,000 (-) (6,550,000) (-) (6,550,000)
Mr. M.Y. Noorani – 130,000 – 130,000 (-) (-) (-) (-)
Mustang Manufacturing Co. – – 210,000 210,000 (-) (-) (-) (-)
Zodiac Clothing Co (U.A.E.) LLC – – – – (4,171,946) (-) (-) (4,171,946)
39) Segment Information: -
Business Segment
The Company is exclusively engaged in the business of Clothing and clothing accessories. This in the context of AccountingStandard(AS17)“SegmentReporting”,notifiedundertheCompanies(AccountingStandard)Rules,2006,constitutes single primary segment.
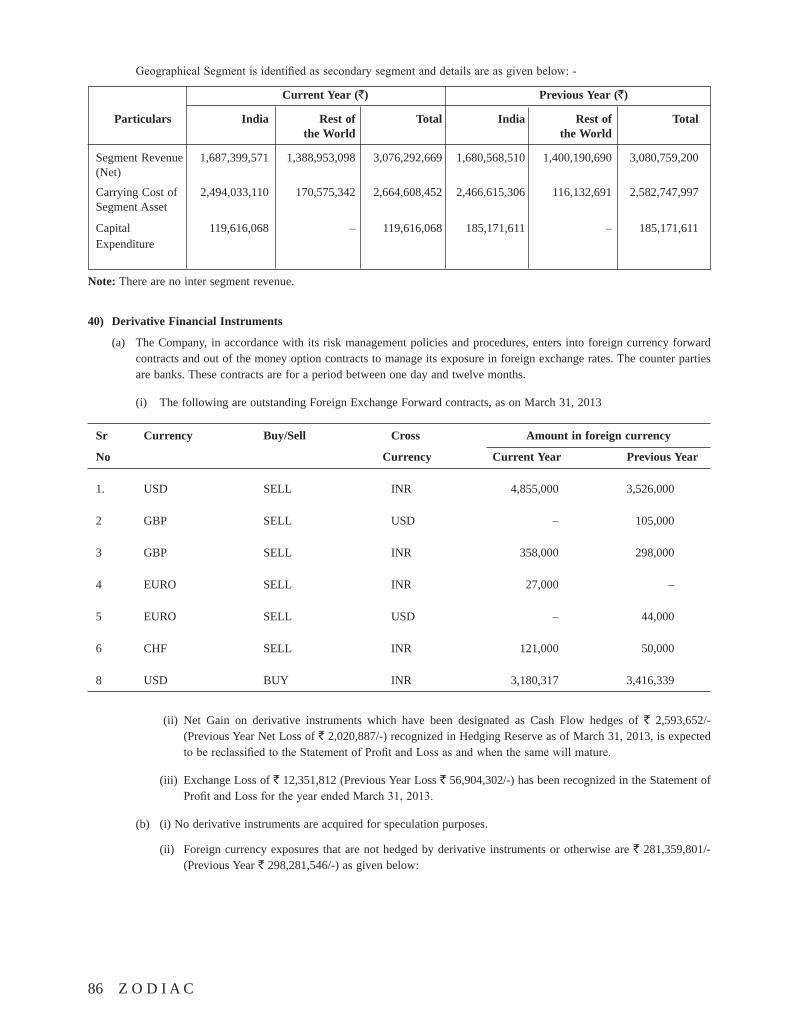
86 Z O D I A C
GeographicalSegmentisidentifiedassecondarysegmentanddetailsareasgivenbelow:-
Current Year (`) Previous Year (`)
Particulars India Rest of Total India Rest of Total the World the World
Segment Revenue 1,687,399,571 1,388,953,098 3,076,292,669 1,680,568,510 1,400,190,690 3,080,759,200 (Net)
Carrying Cost of 2,494,033,110 170,575,342 2,664,608,452 2,466,615,306 116,132,691 2,582,747,997 Segment Asset
Capital 119,616,068 – 119,616,068 185,171,611 – 185,171,611 Expenditure
Note: There are no inter segment revenue.
40) Derivative Financial Instruments
(a) The Company, in accordance with its risk management policies and procedures, enters into foreign currency forward contracts and out of the money option contracts to manage its exposure in foreign exchange rates. The counter parties are banks. These contracts are for a period between one day and twelve months.
(i) The following are outstanding Foreign Exchange Forward contracts, as on March 31, 2013
Sr Currency Buy/Sell Cross Amount in foreign currency
No Currency Current Year Previous Year
1. USD SELL INR 4,855,000 3,526,000
2 GBP SELL USD – 105,000
3 GBP SELL INR 358,000 298,000
4 EURO SELL INR 27,000 –
5 EURO SELL USD – 44,000
6 CHF SELL INR 121,000 50,000
8 USD BUY INR 3,180,317 3,416,339
(ii) Net Gain on derivative instruments which have been designated as Cash Flow hedges of ` 2,593,652/- (Previous Year Net Loss of ` 2,020,887/-) recognized in Hedging Reserve as of March 31, 2013, is expected tobereclassifiedtotheStatementofProfitandLossasandwhenthesamewillmature.
(iii) Exchange Loss of ` 12,351,812 (Previous Year Loss ` 56,904,302/-) has been recognized in the Statement of ProfitandLossfortheyearendedMarch31,2013.
(b) (i) No derivative instruments are acquired for speculation purposes.
(ii) Foreign currency exposures that are not hedged by derivative instruments or otherwise are ` 281,359,801/- (Previous Year ` 298,281,546/-) as given below:
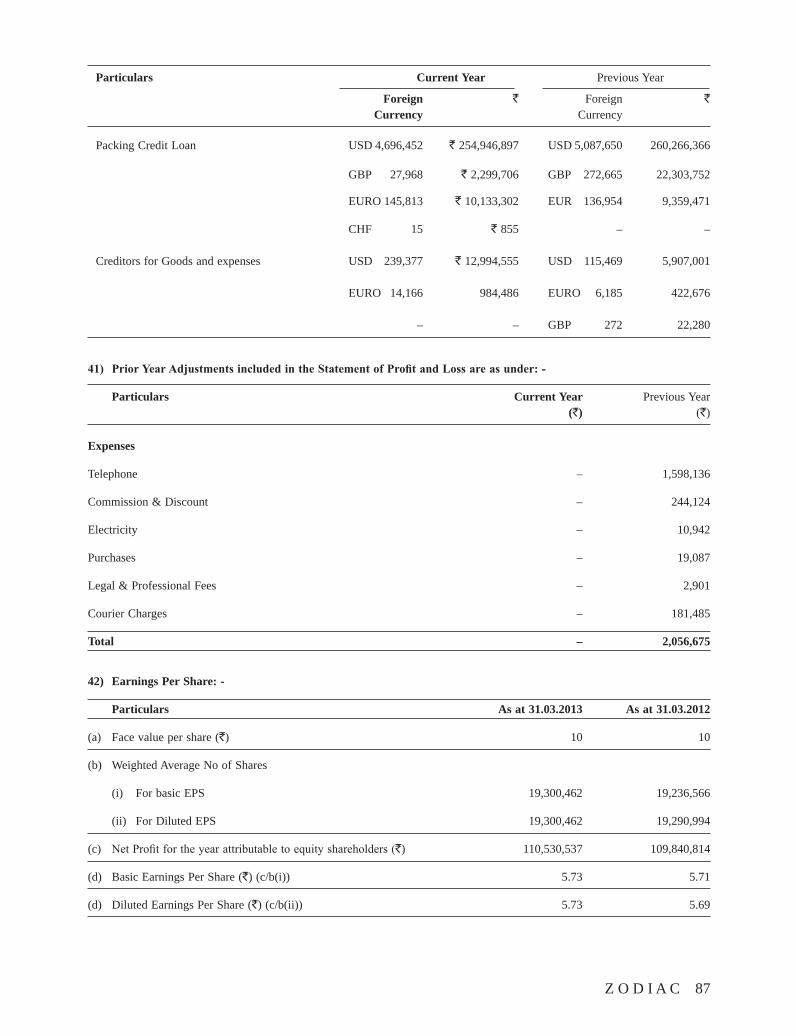
Z O D I A C 87
Particulars Current Year Previous Year
Foreign ` Foreign ` Currency Currency
Packing Credit Loan USD 4,696,452 ` 254,946,897 USD 5,087,650 260,266,366
GBP 27,968 ` 2,299,706 GBP 272,665 22,303,752
EURO 145,813 ` 10,133,302 EUR 136,954 9,359,471
CHF 15 ` 855 – –
Creditors for Goods and expenses USD 239,377 ` 12,994,555 USD 115,469 5,907,001
EURO 14,166 984,486 EURO 6,185 422,676
– – GBP 272 22,280
41) PriorYearAdjustmentsincludedintheStatementofProfitandLossareasunder:-
Particulars Current Year Previous Year (`) (`)
Expenses
Telephone – 1,598,136
Commission & Discount – 244,124
Electricity – 10,942
Purchases – 19,087
Legal & Professional Fees – 2,901
Courier Charges – 181,485
Total – 2,056,675
42) Earnings Per Share: -
Particulars As at 31.03.2013 As at 31.03.2012
(a) Face value per share (`) 10 10
(b) Weighted Average No of Shares
(i) For basic EPS 19,300,462 19,236,566
(ii) For Diluted EPS 19,300,462 19,290,994
(c) NetProfitfortheyearattributabletoequityshareholders(`) 110,530,537 109,840,814
(d) Basic Earnings Per Share (`) (c/b(i)) 5.73 5.71
(d) Diluted Earnings Per Share (`) (c/b(ii)) 5.73 5.69
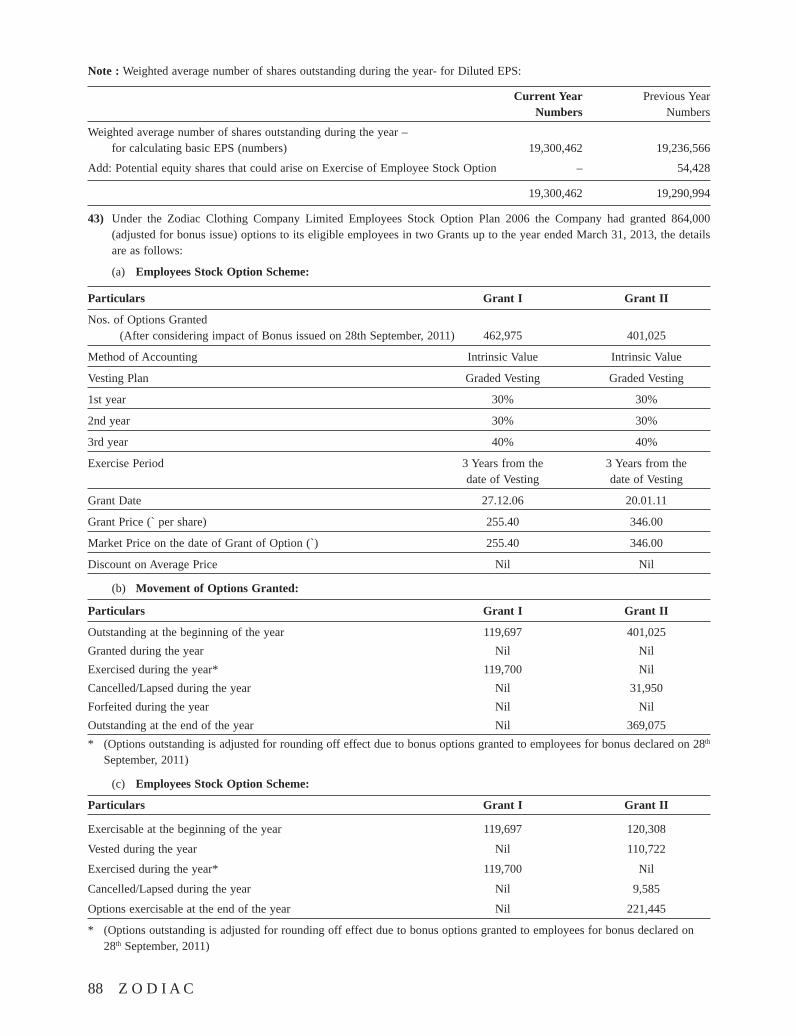
88 Z O D I A C
Note : Weighted average number of shares outstanding during the year- for Diluted EPS:
Current Year Previous Year Numbers Numbers
Weighted average number of shares outstanding during the year – for calculating basic EPS (numbers) 19,300,462 19,236,566
Add: Potential equity shares that could arise on Exercise of Employee Stock Option – 54,428
19,300,462 19,290,994
43) Under the Zodiac Clothing Company Limited Employees Stock Option Plan 2006 the Company had granted 864,000 (adjusted for bonus issue) options to its eligible employees in two Grants up to the year ended March 31, 2013, the details are as follows:
(a) Employees Stock Option Scheme:
Particulars Grant I Grant II
Nos. of Options Granted (After considering impact of Bonus issued on 28th September, 2011) 462,975 401,025
Method of Accounting Intrinsic Value Intrinsic Value
Vesting Plan Graded Vesting Graded Vesting
1st year 30% 30%
2nd year 30% 30%
3rd year 40% 40%
Exercise Period 3 Years from the 3 Years from the date of Vesting date of Vesting
Grant Date 27.12.06 20.01.11
Grant Price (` per share) 255.40 346.00
Market Price on the date of Grant of Option (`) 255.40 346.00
Discount on Average Price Nil Nil
(b) Movement of Options Granted:
Particulars Grant I Grant II
Outstanding at the beginning of the year 119,697 401,025Granted during the year Nil NilExercised during the year* 119,700 NilCancelled/Lapsed during the year Nil 31,950Forfeited during the year Nil NilOutstanding at the end of the year Nil 369,075* (Options outstanding is adjusted for rounding off effect due to bonus options granted to employees for bonus declared on 28th
September, 2011)
(c) Employees Stock Option Scheme:
Particulars Grant I Grant II
Exercisable at the beginning of the year 119,697 120,308
Vested during the year Nil 110,722
Exercised during the year* 119,700 Nil
Cancelled/Lapsed during the year Nil 9,585
Options exercisable at the end of the year Nil 221,445
* (Options outstanding is adjusted for rounding off effect due to bonus options granted to employees for bonus declared on 28th September, 2011)
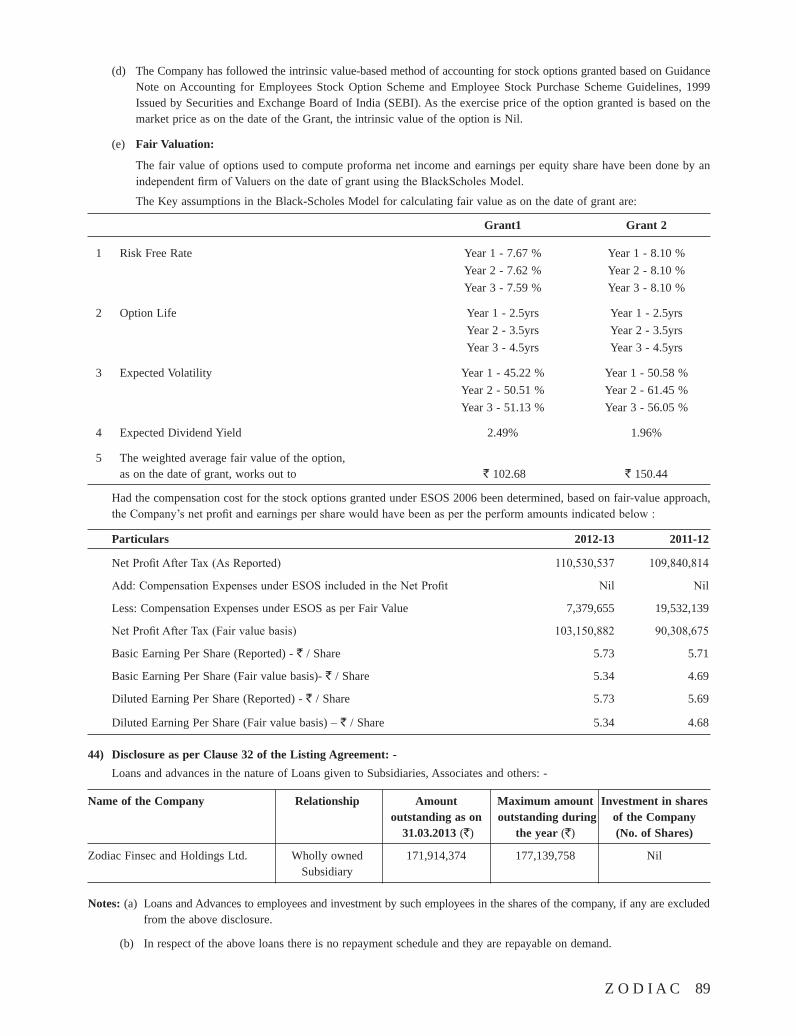
Z O D I A C 89
(d) The Company has followed the intrinsic value-based method of accounting for stock options granted based on Guidance Note on Accounting for Employees Stock Option Scheme and Employee Stock Purchase Scheme Guidelines, 1999 Issued by Securities and Exchange Board of India (SEBI). As the exercise price of the option granted is based on the market price as on the date of the Grant, the intrinsic value of the option is Nil.
(e) Fair Valuation:
The fair value of options used to compute proforma net income and earnings per equity share have been done by an independentfirmofValuersonthedateofgrantusingtheBlackScholesModel.
The Key assumptions in the Black-Scholes Model for calculating fair value as on the date of grant are:
Grant1 Grant 2
1 Risk Free Rate Year 1 - 7.67 % Year 1 - 8.10 % Year 2 - 7.62 % Year 2 - 8.10 % Year 3 - 7.59 % Year 3 - 8.10 %
2 Option Life Year 1 - 2.5yrs Year 1 - 2.5yrs Year 2 - 3.5yrs Year 2 - 3.5yrs Year 3 - 4.5yrs Year 3 - 4.5yrs
3 Expected Volatility Year 1 - 45.22 % Year 1 - 50.58 % Year 2 - 50.51 % Year 2 - 61.45 % Year 3 - 51.13 % Year 3 - 56.05 %
4 Expected Dividend Yield 2.49% 1.96%
5 The weighted average fair value of the option, as on the date of grant, works out to ` 102.68 ` 150.44
Had the compensation cost for the stock options granted under ESOS 2006 been determined, based on fair-value approach, theCompany’snetprofitandearningspersharewouldhavebeenaspertheperformamountsindicatedbelow:
Particulars 2012-13 2011-12
Net ProfitAfterTax(AsReported) 110,530,537 109,840,814
Add:CompensationExpensesunderESOSincludedintheNetProfit Nil Nil
Less: Compensation Expenses under ESOS as per Fair Value 7,379,655 19,532,139
NetProfitAfterTax(Fairvaluebasis) 103,150,882 90,308,675
Basic Earning Per Share (Reported) - ` / Share 5.73 5.71
Basic Earning Per Share (Fair value basis)- ` / Share 5.34 4.69
Diluted Earning Per Share (Reported) - ` / Share 5.73 5.69
Diluted Earning Per Share (Fair value basis) – ` / Share 5.34 4.68
44) Disclosure as per Clause 32 of the Listing Agreement: - Loans and advances in the nature of Loans given to Subsidiaries, Associates and others: -
Name of the Company Relationship Amount Maximum amount Investment in shares outstanding as on outstanding during of the Company 31.03.2013 (`) the year (`) (No. of Shares)
Zodiac Finsec and Holdings Ltd. Wholly owned 171,914,374 177,139,758 Nil Subsidiary
Notes: (a) Loans and Advances to employees and investment by such employees in the shares of the company, if any are excluded from the above disclosure.
(b) In respect of the above loans there is no repayment schedule and they are repayable on demand.
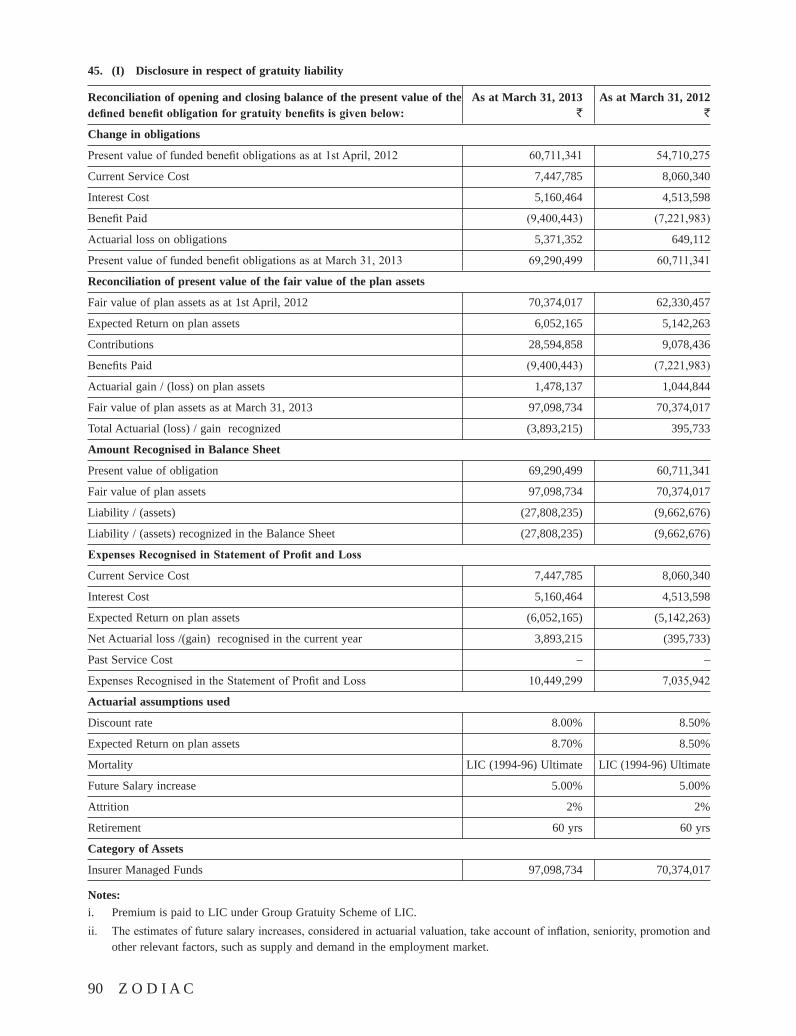
90 Z O D I A C
45. (I) Disclosure in respect of gratuity liability
Reconciliation of opening and closing balance of the present value of the As at March 31, 2013 As at March 31, 2012 definedbenefitobligationforgratuitybenefitsisgivenbelow: ` `
Change in obligations
Presentvalueoffundedbenefitobligationsasat1stApril,2012 60,711,341 54,710,275
Current Service Cost 7,447,785 8,060,340
Interest Cost 5,160,464 4,513,598
BenefitPaid (9,400,443) (7,221,983)
Actuarial loss on obligations 5,371,352 649,112
PresentvalueoffundedbenefitobligationsasatMarch31,2013 69,290,499 60,711,341
Reconciliation of present value of the fair value of the plan assets
Fair value of plan assets as at 1st April, 2012 70,374,017 62,330,457
Expected Return on plan assets 6,052,165 5,142,263
Contributions 28,594,858 9,078,436
BenefitsPaid (9,400,443) (7,221,983)
Actuarial gain / (loss) on plan assets 1,478,137 1,044,844
Fair value of plan assets as at March 31, 2013 97,098,734 70,374,017
Total Actuarial (loss) / gain recognized (3,893,215) 395,733
Amount Recognised in Balance Sheet
Present value of obligation 69,290,499 60,711,341
Fair value of plan assets 97,098,734 70,374,017
Liability / (assets) (27,808,235) (9,662,676)
Liability / (assets) recognized in the Balance Sheet (27,808,235) (9,662,676)
ExpensesRecognisedinStatementofProfitandLoss
Current Service Cost 7,447,785 8,060,340
Interest Cost 5,160,464 4,513,598
Expected Return on plan assets (6,052,165) (5,142,263)
Net Actuarial loss /(gain) recognised in the current year 3,893,215 (395,733)
Past Service Cost – –
ExpensesRecognisedintheStatementofProfitandLoss 10,449,299 7,035,942
Actuarial assumptions used
Discount rate 8.00% 8.50%
Expected Return on plan assets 8.70% 8.50%
Mortality LIC (1994-96) Ultimate LIC (1994-96) Ultimate
Future Salary increase 5.00% 5.00%
Attrition 2% 2%
Retirement 60 yrs 60 yrs
Category of Assets
Insurer Managed Funds 97,098,734 70,374,017
Notes:i. Premium is paid to LIC under Group Gratuity Scheme of LIC.ii. Theestimatesoffuturesalaryincreases,consideredinactuarialvaluation,takeaccountofinflation,seniority,promotionand
other relevant factors, such as supply and demand in the employment market.
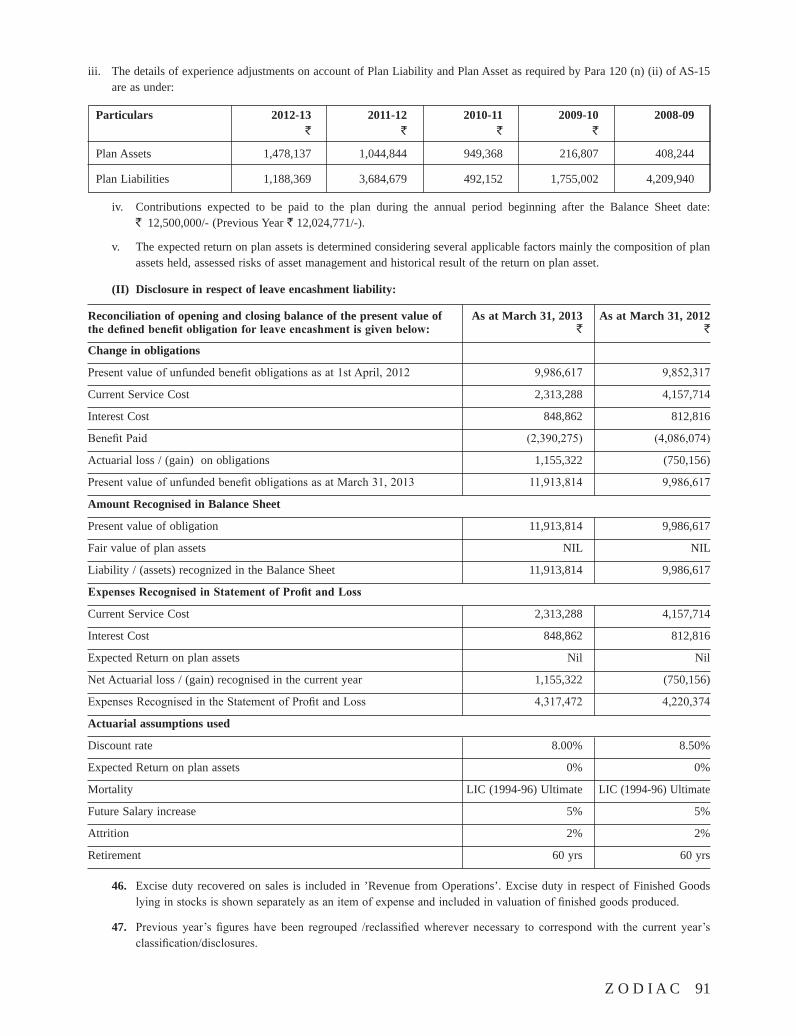
Z O D I A C 91
iii. The details of experience adjustments on account of Plan Liability and Plan Asset as required by Para 120 (n) (ii) of AS-15 are as under:
Particulars 2012-13 2011-12 2010-11 2009-10 2008-09 ` ` ` `
Plan Assets 1,478,137 1,044,844 949,368 216,807 408,244
Plan Liabilities 1,188,369 3,684,679 492,152 1,755,002 4,209,940
iv. Contributions expected to be paid to the plan during the annual period beginning after the Balance Sheet date: ` 12,500,000/- (Previous Year ` 12,024,771/-).
v. The expected return on plan assets is determined considering several applicable factors mainly the composition of plan assets held, assessed risks of asset management and historical result of the return on plan asset.
(II) Disclosure in respect of leave encashment liability:
Reconciliation of opening and closing balance of the present value of As at March 31, 2013 As at March 31, 2012 thedefinedbenefitobligationforleaveencashmentisgivenbelow: ` `
Change in obligations
Presentvalueofunfundedbenefitobligationsasat1stApril,2012 9,986,617 9,852,317
Current Service Cost 2,313,288 4,157,714
Interest Cost 848,862 812,816
BenefitPaid (2,390,275) (4,086,074)
Actuarial loss / (gain) on obligations 1,155,322 (750,156)
PresentvalueofunfundedbenefitobligationsasatMarch31,2013 11,913,814 9,986,617
Amount Recognised in Balance Sheet
Present value of obligation 11,913,814 9,986,617
Fair value of plan assets NIL NIL
Liability / (assets) recognized in the Balance Sheet 11,913,814 9,986,617
ExpensesRecognisedinStatementofProfitandLoss
Current Service Cost 2,313,288 4,157,714
Interest Cost 848,862 812,816
Expected Return on plan assets Nil Nil
Net Actuarial loss / (gain) recognised in the current year 1,155,322 (750,156)
ExpensesRecognisedintheStatementofProfitandLoss 4,317,472 4,220,374
Actuarial assumptions used
Discount rate 8.00% 8.50%
Expected Return on plan assets 0% 0%
Mortality LIC (1994-96) Ultimate LIC (1994-96) Ultimate
Future Salary increase 5% 5%
Attrition 2% 2%
Retirement 60 yrs 60 yrs
46. Excise duty recovered on sales is included in ’Revenue from Operations’. Excise duty in respect of Finished Goods lyinginstocksisshownseparatelyasanitemofexpenseandincludedinvaluationoffinishedgoodsproduced.
47. Previous year’s figures have been regrouped /reclassifiedwherever necessary to correspondwith the current year’sclassification/disclosures.
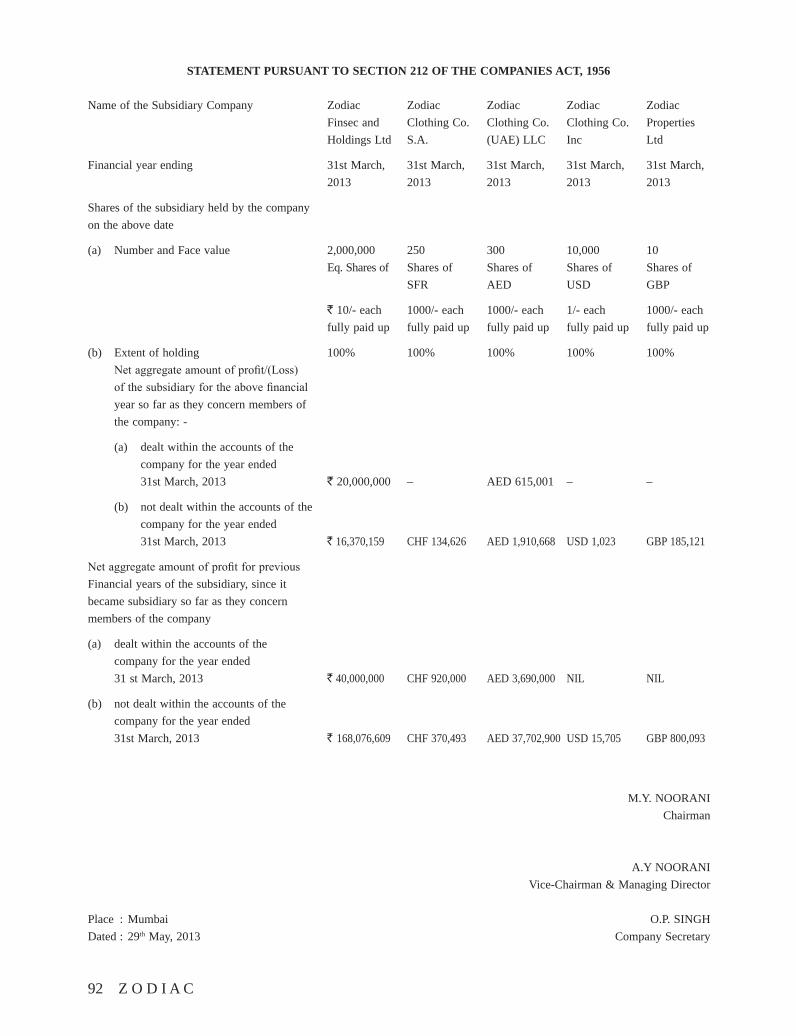
92 Z O D I A C
STATEMENT PURSUANT TO SECTION 212 OF THE COMPANIES ACT, 1956
Name of the Subsidiary Company Zodiac Zodiac Zodiac Zodiac Zodiac Finsec and Clothing Co. Clothing Co. Clothing Co. Properties Holdings Ltd S.A. (UAE) LLC Inc Ltd
Financial year ending 31st March, 31st March, 31st March, 31st March, 31st March, 2013 2013 2013 2013 2013
Shares of the subsidiary held by the company on the above date
(a) Number and Face value 2,000,000 250 300 10,000 10 Eq. Shares of Shares of Shares of Shares of Shares of SFR AED USD GBP
` 10/- each 1000/- each 1000/- each 1/- each 1000/- each fully paid up fully paid up fully paid up fully paid up fully paid up
(b) Extent of holding 100% 100% 100% 100% 100% Netaggregateamountofprofit/(Loss) ofthesubsidiaryfortheabovefinancial year so far as they concern members of the company: -
(a) dealt within the accounts of the company for the year ended 31st March, 2013 ` 20,000,000 – AED 615,001 – –
(b) not dealt within the accounts of the company for the year ended 31st March, 2013 ` 16,370,159 CHF 134,626 AED 1,910,668 USD 1,023 GBP 185,121
Netaggregateamountofprofitforprevious Financial years of the subsidiary, since it became subsidiary so far as they concern members of the company
(a) dealt within the accounts of the company for the year ended 31 st March, 2013 ` 40,000,000 CHF 920,000 AED 3,690,000 NIL NIL
(b) not dealt within the accounts of the company for the year ended 31st March, 2013 ` 168,076,609 CHF 370,493 AED 37,702,900 USD 15,705 GBP 800,093
M.Y. NOORANI Chairman
A.Y NOORANI Vice-Chairman & Managing Director
Place : Mumbai O.P. SINGH Dated : 29th May, 2013 Company Secretary


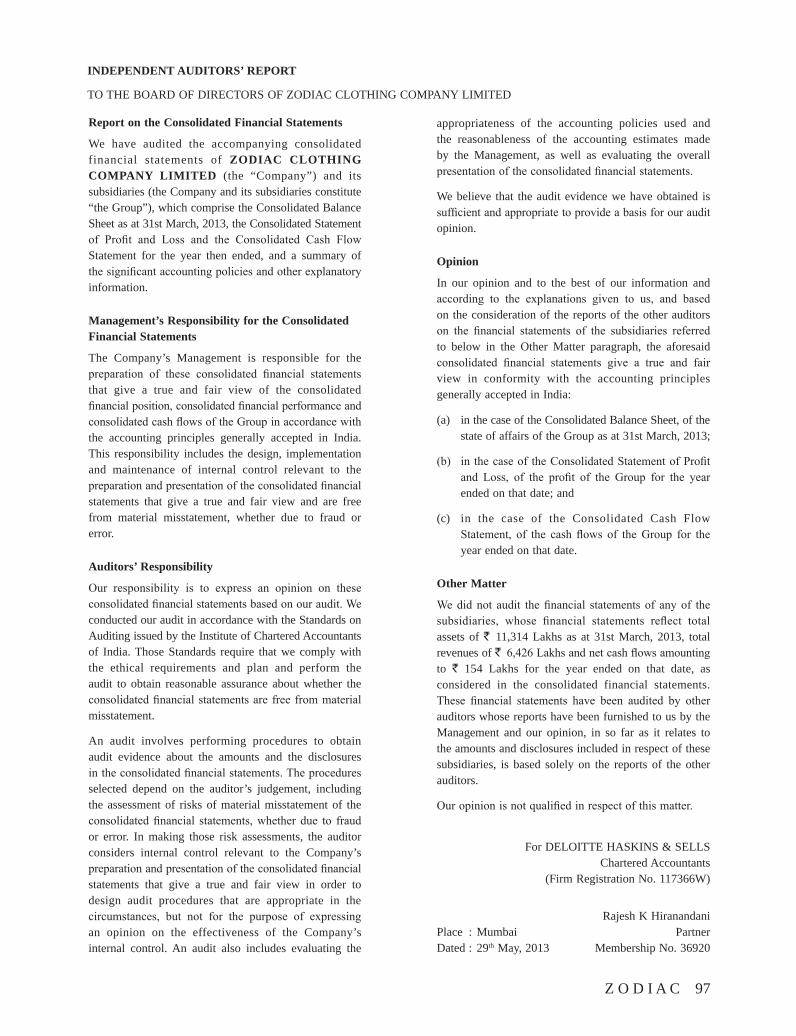
Z O D I A C 97
INDEPENDENT AUDITORS’ REPORT
TO THE BOARD OF DIRECTORS OF ZODIAC CLOTHING COMPANY LIMITED
Report on the Consolidated Financial Statements
We have audited the accompanying consolidated financial statements of ZODIAC CLOTHING COMPANY LIMITED (the “Company”) and its subsidiaries (the Company and its subsidiaries constitute “the Group”), which comprise the Consolidated Balance Sheet as at 31st March, 2013, the Consolidated Statement of Profit and Loss and the Consolidated Cash Flow Statement for the year then ended, and a summary of the significant accounting policies and other explanatory information.
Management’s Responsibility for the Consolidated Financial Statements
The Company’s Management is responsible for the preparation of these consolidated financial statements that give a true and fair view of the consolidated financial position, consolidated financial performance and consolidated cash flows of the Group in accordance with the accounting principles generally accepted in India. This responsibility includes the design, implementation and maintenance of internal control relevant to the preparation and presentation of the consolidated financial statements that give a true and fair view and are free from material misstatement, whether due to fraud or error.
Auditors’ Responsibility
Our responsibility is to express an opinion on these consolidated financial statements based on our audit. We conducted our audit in accordance with the Standards on Auditing issued by the Institute of Chartered Accountants of India. Those Standards require that we comply with the ethical requirements and plan and perform the audit to obtain reasonable assurance about whether the consolidated financial statements are free from material misstatement.
An audit involves performing procedures to obtain audit evidence about the amounts and the disclosures in the consolidated financial statements. The procedures selected depend on the auditor’s judgement, including the assessment of risks of material misstatement of the consolidated financial statements, whether due to fraud or error. In making those risk assessments, the auditor considers internal control relevant to the Company’s preparation and presentation of the consolidated financial statements that give a true and fair view in order to design audit procedures that are appropriate in the circumstances, but not for the purpose of expressing an opinion on the effectiveness of the Company’s internal control. An audit also includes evaluating the
appropriateness of the accounting policies used and the reasonableness of the accounting estimates made by the Management, as well as evaluating the overall presentation of the consolidated financial statements.
We believe that the audit evidence we have obtained is sufficient and appropriate to provide a basis for our audit opinion.
Opinion
In our opinion and to the best of our information and according to the explanations given to us, and based on the consideration of the reports of the other auditors on the financial statements of the subsidiaries referred to below in the Other Matter paragraph, the aforesaid consolidated financial statements give a true and fair view in conformity with the accounting principles generally accepted in India:
(a) in the case of the Consolidated Balance Sheet, of the state of affairs of the Group as at 31st March, 2013;
(b) in the case of the Consolidated Statement of Profit and Loss, of the profit of the Group for the year ended on that date; and
(c) in the case of the Consolidated Cash Flow Statement, of the cash flows of the Group for the year ended on that date.
Other Matter
We did not audit the financial statements of any of the subsidiaries, whose financial statements reflect total assets of ` 11,314 Lakhs as at 31st March, 2013, total revenues of ` 6,426 Lakhs and net cash flows amounting to ` 154 Lakhs for the year ended on that date, as considered in the consolidated financial statements. These financial statements have been audited by other auditors whose reports have been furnished to us by the Management and our opinion, in so far as it relates to the amounts and disclosures included in respect of these subsidiaries, is based solely on the reports of the other auditors.
Our opinion is not qualified in respect of this matter.
For DELOITTE HASKINS & SELLS Chartered Accountants
(Firm Registration No. 117366W)
Rajesh K Hiranandani Place : Mumbai Partner Dated : 29th May, 2013 Membership No. 36920
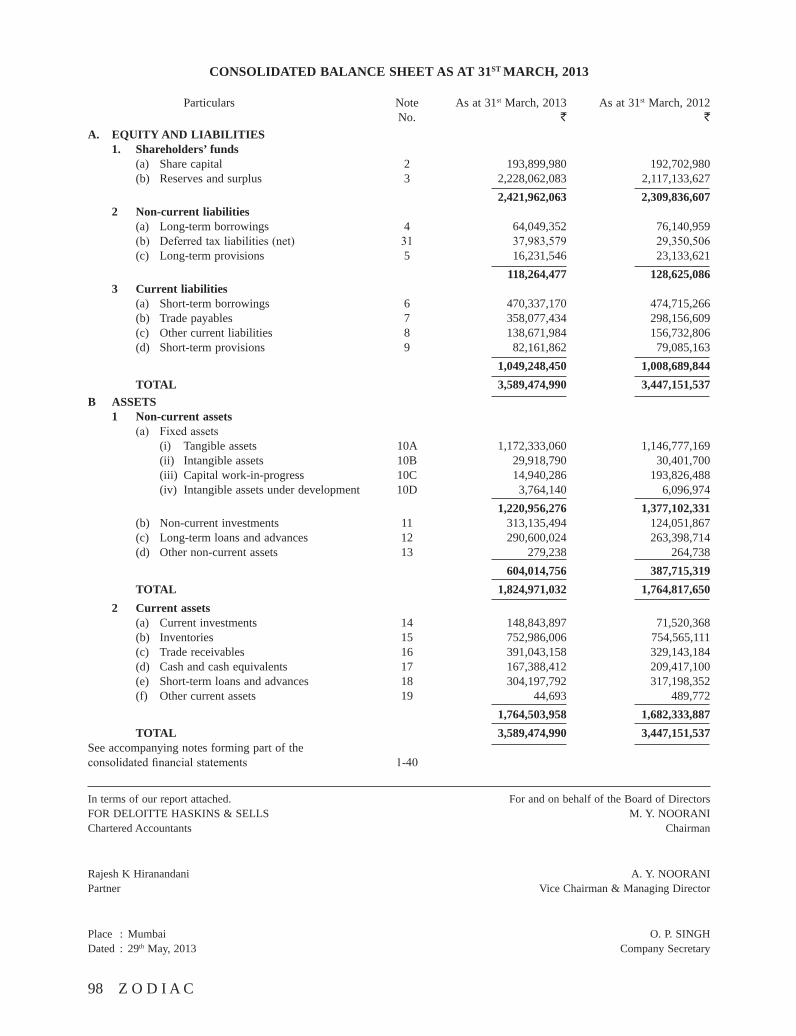
98 Z O D I A C
In terms of our report attached. For and on behalf of the Board of Directors FOR DELOITTE HASKINS & SELLS M. Y. NOORANI Chartered Accountants Chairman
Rajesh K Hiranandani A. Y. NOORANI Partner Vice Chairman & Managing Director
Place : Mumbai O. P. SINGH Dated : 29th May, 2013 Company Secretary
CONSOLIDATED BALANCE SHEET AS AT 31ST MARCH, 2013
Particulars Note As at 31st March, 2013 As at 31st March, 2012 No. ` `A. EQUITY AND LIABILITIES 1. Shareholders’ funds (a) Share capital 2 193,899,980 192,702,980 (b) Reserves and surplus 3 2,228,062,083 2,117,133,627 2,421,962,063 2,309,836,607 2 Non-current liabilities (a) Long-term borrowings 4 64,049,352 76,140,959 (b) Deferred tax liabilities (net) 31 37,983,579 29,350,506 (c) Long-term provisions 5 16,231,546 23,133,621 118,264,477 128,625,086 3 Current liabilities (a) Short-term borrowings 6 470,337,170 474,715,266 (b) Trade payables 7 358,077,434 298,156,609 (c) Other current liabilities 8 138,671,984 156,732,806 (d) Short-term provisions 9 82,161,862 79,085,163 1,049,248,450 1,008,689,844 TOTAL 3,589,474,990 3,447,151,537B ASSETS 1 Non-current assets (a) Fixed assets (i) Tangible assets 10A 1,172,333,060 1,146,777,169 (ii) Intangible assets 10B 29,918,790 30,401,700 (iii) Capital work-in-progress 10C 14,940,286 193,826,488 (iv) Intangible assets under development 10D 3,764,140 6,096,974 1,220,956,276 1,377,102,331 (b) Non-current investments 11 313,135,494 124,051,867 (c) Long-term loans and advances 12 290,600,024 263,398,714 (d) Other non-current assets 13 279,238 264,738 604,014,756 387,715,319 TOTAL 1,824,971,032 1,764,817,650 2 Current assets (a) Current investments 14 148,843,897 71,520,368 (b) Inventories 15 752,986,006 754,565,111 (c) Trade receivables 16 391,043,158 329,143,184 (d) Cash and cash equivalents 17 167,388,412 209,417,100 (e) Short-term loans and advances 18 304,197,792 317,198,352 (f) Other current assets 19 44,693 489,772 1,764,503,958 1,682,333,887 TOTAL 3,589,474,990 3,447,151,537See accompanying notes forming part of the consolidated financial statements 1-40
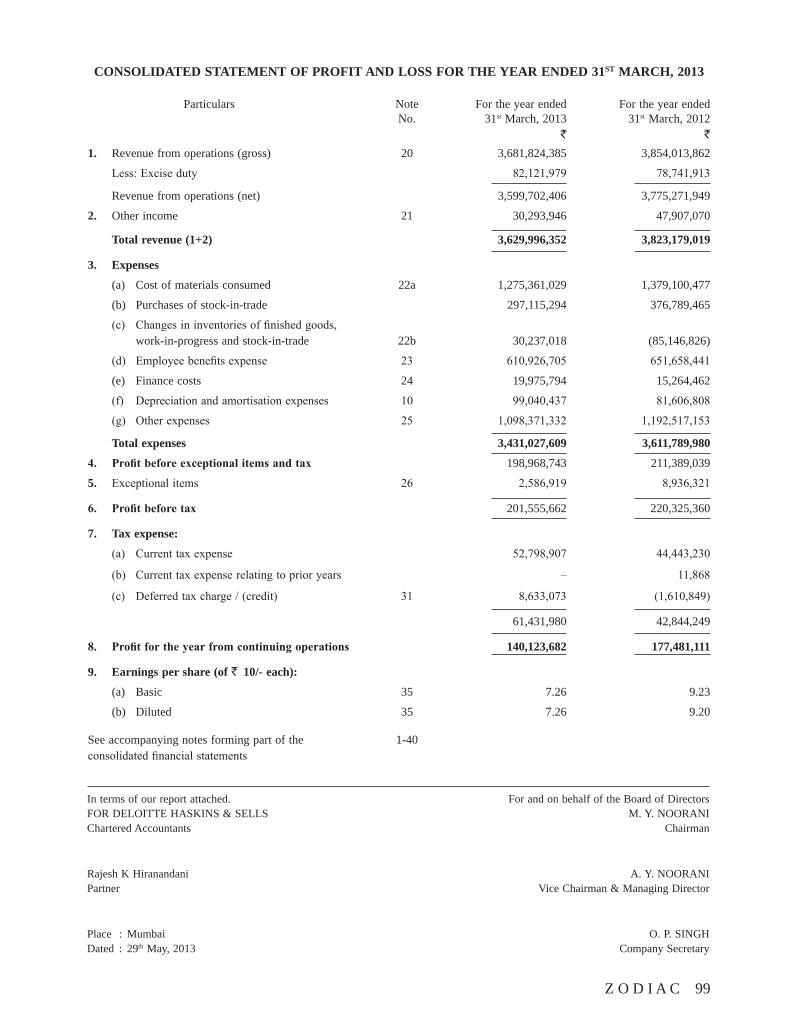
Z O D I A C 99
In terms of our report attached. For and on behalf of the Board of Directors FOR DELOITTE HASKINS & SELLS M. Y. NOORANI Chartered Accountants Chairman
Rajesh K Hiranandani A. Y. NOORANI Partner Vice Chairman & Managing Director
Place : Mumbai O. P. SINGH Dated : 29th May, 2013 Company Secretary
CONSOLIDATED STATEMENT OF PROFIT AND LOSS FOR THE YEAR ENDED 31ST MARCH, 2013
Particulars Note For the year ended For the year ended No. 31st March, 2013 31st March, 2012 ` `
1. Revenue from operations (gross) 20 3,681,824,385 3,854,013,862
Less: Excise duty 82,121,979 78,741,913
Revenue from operations (net) 3,599,702,406 3,775,271,949
2. Other income 21 30,293,946 47,907,070
Total revenue (1+2) 3,629,996,352 3,823,179,019
3. Expenses
(a) Cost of materials consumed 22a 1,275,361,029 1,379,100,477
(b) Purchases of stock-in-trade 297,115,294 376,789,465
(c) Changes in inventories of finished goods, work-in-progress and stock-in-trade 22b 30,237,018 (85,146,826)
(d) Employee benefits expense 23 610,926,705 651,658,441
(e) Finance costs 24 19,975,794 15,264,462
(f) Depreciation and amortisation expenses 10 99,040,437 81,606,808
(g) Other expenses 25 1,098,371,332 1,192,517,153
Total expenses 3,431,027,609 3,611,789,980
4. Profitbeforeexceptionalitemsandtax 198,968,743 211,389,039
5. Exceptional items 26 2,586,919 8,936,321
6. Profitbeforetax 201,555,662 220,325,360
7. Tax expense:
(a) Current tax expense 52,798,907 44,443,230
(b) Current tax expense relating to prior years – 11,868
(c) Deferred tax charge / (credit) 31 8,633,073 (1,610,849)
61,431,980 42,844,249
8. Profitfortheyearfromcontinuingoperations 140,123,682 177,481,111
9. Earnings per share (of ` 10/- each):
(a) Basic 35 7.26 9.23
(b) Diluted 35 7.26 9.20
See accompanying notes forming part of the 1-40 consolidated financial statements
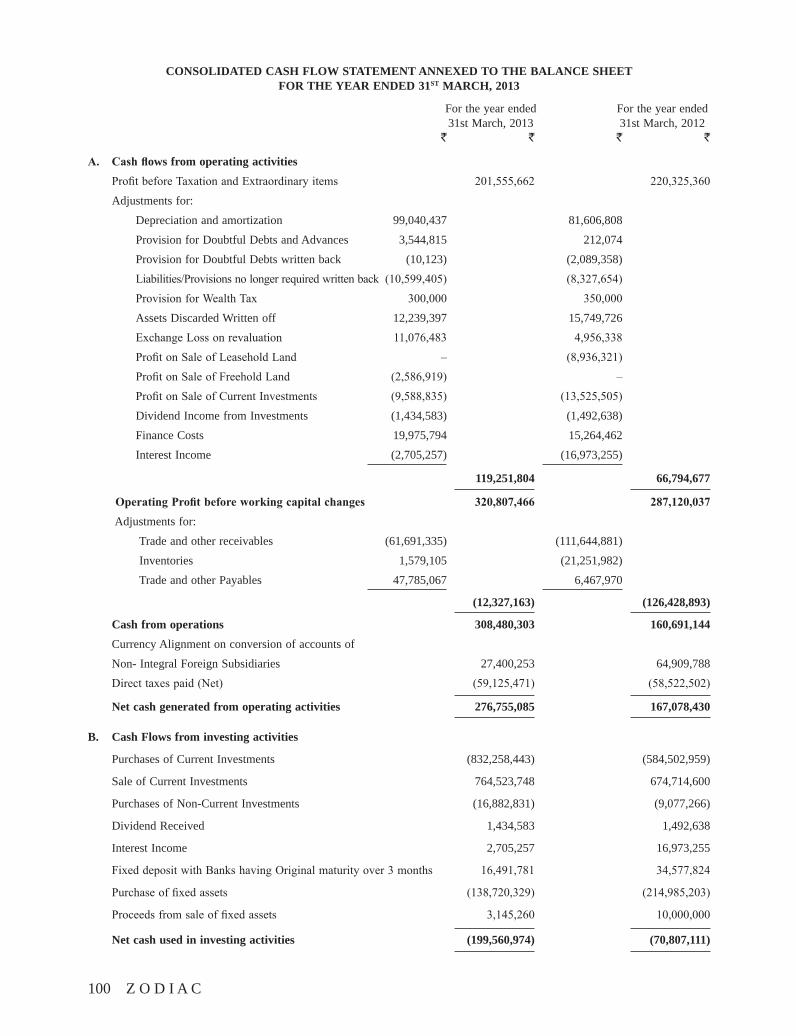
100 Z O D I A C
CONSOLIDATED CASH FLOW STATEMENT ANNEXED TO THE BALANCE SHEET FOR THE YEAR ENDED 31ST MARCH, 2013
For the year ended For the year ended 31st March, 2013 31st March, 2012 ` ` ` `
A. Cashflows from operating activities Profit before Taxation and Extraordinary items 201,555,662 220,325,360 Adjustments for: Depreciation and amortization 99,040,437 81,606,808 Provision for Doubtful Debts and Advances 3,544,815 212,074 Provision for Doubtful Debts written back (10,123) (2,089,358) Liabilities/Provisions no longer required written back (10,599,405) (8,327,654) Provision for Wealth Tax 300,000 350,000 Assets Discarded Written off 12,239,397 15,749,726 Exchange Loss on revaluation 11,076,483 4,956,338 Profit on Sale of Leasehold Land – (8,936,321) Profit on Sale of Freehold Land (2,586,919) – Profit on Sale of Current Investments (9,588,835) (13,525,505) Dividend Income from Investments (1,434,583) (1,492,638) Finance Costs 19,975,794 15,264,462 Interest Income (2,705,257) (16,973,255)
119,251,804 66,794,677
OperatingProfitbeforeworkingcapitalchanges 320,807,466 287,120,037 Adjustments for: Trade and other receivables (61,691,335) (111,644,881) Inventories 1,579,105 (21,251,982) Trade and other Payables 47,785,067 6,467,970
(12,327,163) (126,428,893)
Cash from operations 308,480,303 160,691,144 Currency Alignment on conversion of accounts of Non- Integral Foreign Subsidiaries 27,400,253 64,909,788 Direct taxes paid (Net) (59,125,471) (58,522,502)
Net cash generated from operating activities 276,755,085 167,078,430
B. Cash Flows from investing activities
Purchases of Current Investments (832,258,443) (584,502,959)
Sale of Current Investments 764,523,748 674,714,600
Purchases of Non-Current Investments (16,882,831) (9,077,266)
Dividend Received 1,434,583 1,492,638
Interest Income 2,705,257 16,973,255
Fixed deposit with Banks having Original maturity over 3 months 16,491,781 34,577,824
Purchase of fixed assets (138,720,329) (214,985,203)
Proceeds from sale of fixed assets 3,145,260 10,000,000
Net cash used in investing activities (199,560,974) (70,807,111)
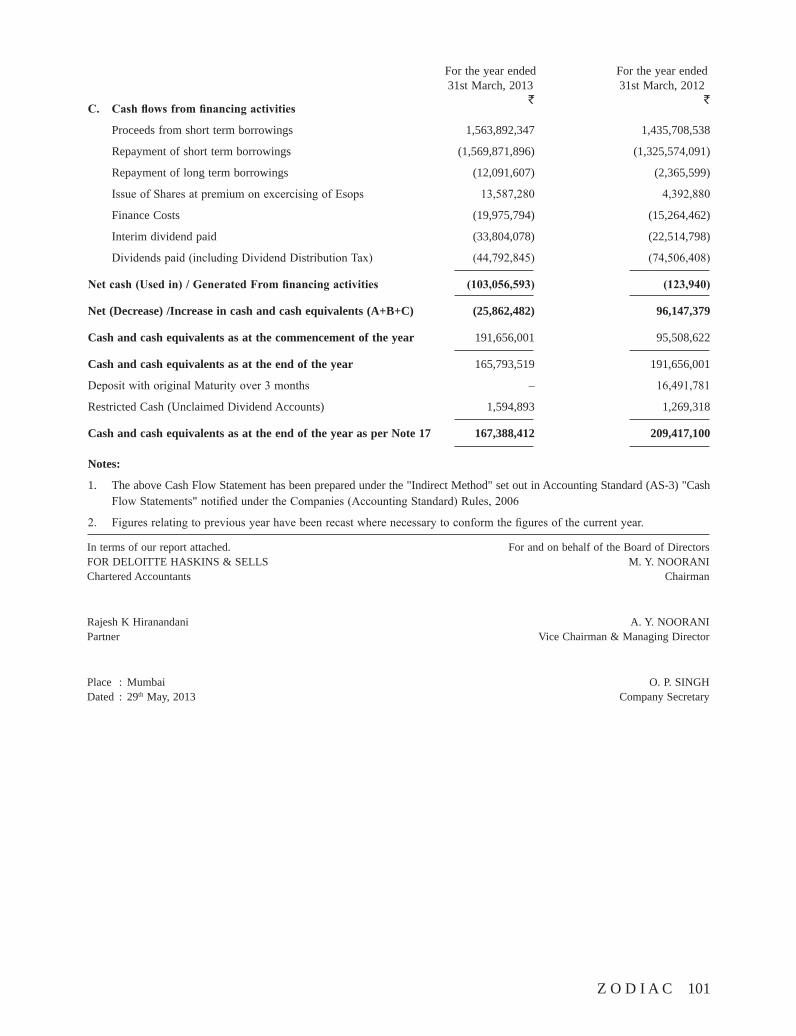
Z O D I A C 101
For the year ended For the year ended 31st March, 2013 31st March, 2012 ` `C. Cashflowsfromfinancingactivities
Proceeds from short term borrowings 1,563,892,347 1,435,708,538
Repayment of short term borrowings (1,569,871,896) (1,325,574,091)
Repayment of long term borrowings (12,091,607) (2,365,599)
Issue of Shares at premium on excercising of Esops 13,587,280 4,392,880
Finance Costs (19,975,794) (15,264,462)
Interim dividend paid (33,804,078) (22,514,798)
Dividends paid (including Dividend Distribution Tax) (44,792,845) (74,506,408)
Netcash(Usedin)/GeneratedFromfinancingactivities (103,056,593) (123,940)
Net (Decrease) /Increase in cash and cash equivalents (A+B+C) (25,862,482) 96,147,379
Cash and cash equivalents as at the commencement of the year 191,656,001 95,508,622
Cash and cash equivalents as at the end of the year 165,793,519 191,656,001
Deposit with original Maturity over 3 months – 16,491,781
Restricted Cash (Unclaimed Dividend Accounts) 1,594,893 1,269,318
Cash and cash equivalents as at the end of the year as per Note 17 167,388,412 209,417,100
Notes:
1. The above Cash Flow Statement has been prepared under the "Indirect Method" set out in Accounting Standard (AS-3) "Cash Flow Statements" notified under the Companies (Accounting Standard) Rules, 2006
2. Figures relating to previous year have been recast where necessary to conform the figures of the current year.
In terms of our report attached. For and on behalf of the Board of Directors FOR DELOITTE HASKINS & SELLS M. Y. NOORANI Chartered Accountants Chairman
Rajesh K Hiranandani A. Y. NOORANI Partner Vice Chairman & Managing Director
Place : Mumbai O. P. SINGH Dated : 29th May, 2013 Company Secretary
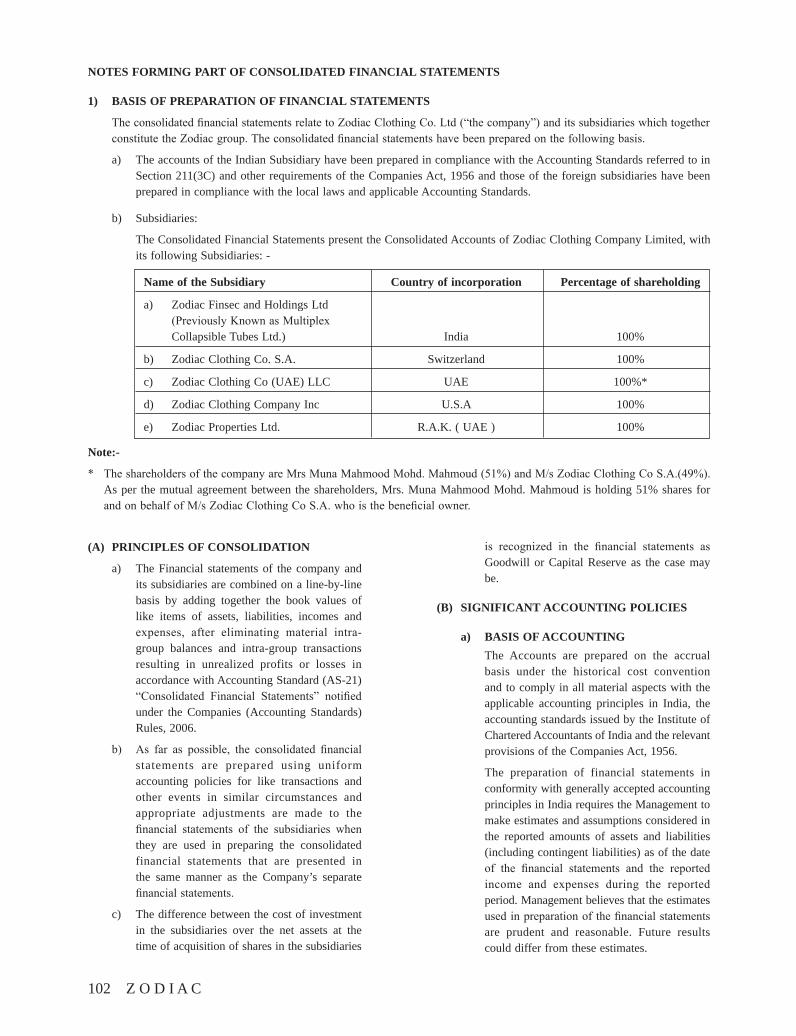
102 Z O D I A C
NOTES FORMING PART OF CONSOLIDATED FINANCIAL STATEMENTS
1) BASIS OF PREPARATION OF FINANCIAL STATEMENTS
The consolidated financial statements relate to Zodiac Clothing Co. Ltd (“the company”) and its subsidiaries which together constitute the Zodiac group. The consolidated financial statements have been prepared on the following basis.
a) The accounts of the Indian Subsidiary have been prepared in compliance with the Accounting Standards referred to in Section 211(3C) and other requirements of the Companies Act, 1956 and those of the foreign subsidiaries have been prepared in compliance with the local laws and applicable Accounting Standards.
b) Subsidiaries:
The Consolidated Financial Statements present the Consolidated Accounts of Zodiac Clothing Company Limited, with its following Subsidiaries: -
Name of the Subsidiary Country of incorporation Percentage of shareholding
a) Zodiac Finsec and Holdings Ltd (Previously Known as Multiplex Collapsible Tubes Ltd.) India 100%
b) Zodiac Clothing Co. S.A. Switzerland 100%
c) Zodiac Clothing Co (UAE) LLC UAE 100%*
d) Zodiac Clothing Company Inc U.S.A 100%
e) Zodiac Properties Ltd. R.A.K. ( UAE ) 100%
Note:-
* The shareholders of the company are Mrs Muna Mahmood Mohd. Mahmoud (51%) and M/s Zodiac Clothing Co S.A.(49%).As per the mutual agreement between the shareholders, Mrs. Muna Mahmood Mohd. Mahmoud is holding 51% shares for and on behalf of M/s Zodiac Clothing Co S.A. who is the beneficial owner.
(A) PRINCIPLES OF CONSOLIDATION
a) The Financial statements of the company and its subsidiaries are combined on a line-by-line basis by adding together the book values of like items of assets, liabilities, incomes and expenses, after eliminating material intra-group balances and intra-group transactions resulting in unrealized profits or losses in accordance with Accounting Standard (AS-21) “Consolidated Financial Statements” notified under the Companies (Accounting Standards) Rules, 2006.
b) As far as possible, the consolidated financial statements are prepared using uniform accounting policies for like transactions and other events in similar circumstances and appropriate adjustments are made to the financial statements of the subsidiaries when they are used in preparing the consolidated financial statements that are presented in the same manner as the Company’s separate financial statements.
c) The difference between the cost of investment in the subsidiaries over the net assets at the time of acquisition of shares in the subsidiaries
is recognized in the financial statements as Goodwill or Capital Reserve as the case may be.
(B) SIGNIFICANT ACCOUNTING POLICIES
a) BASIS OF ACCOUNTING The Accounts are prepared on the accrual
basis under the historical cost convention and to comply in all material aspects with the applicable accounting principles in India, the accounting standards issued by the Institute of Chartered Accountants of India and the relevant provisions of the Companies Act, 1956.
The preparation of financial statements in conformity with generally accepted accounting principles in India requires the Management to make estimates and assumptions considered in the reported amounts of assets and liabilities (including contingent liabilities) as of the date of the financial statements and the reported income and expenses during the reported period. Management believes that the estimates used in preparation of the financial statements are prudent and reasonable. Future results could differ from these estimates.
Z O D I A C 103
b) REVENUE RECOGNITION
Sales are recognised when goods are supplied to customers and are recorded net of sales tax/value added tax, trade Discounts, Rebate and Returns but includes excise duty. Dividend income on investments is accounted when the right to receive the dividend is established.
Revenue in respect of Insurance/other claims, interest etc. is recognised only when it is reasonably certain that the ultimate collection will be made.
c) EXPORT BENEFITS
Export benefits under various schemes of Government of India are accounted on accrual basis on the basis of exports made and the value of imports made/ to be made there against.
d) FIXED ASSETS
Fixed Assets are recorded at Cost of acquisition. They are stated at historical costs including incidental expenses.
e) DEPRECIATION/AMORTISATION i) On Tangible Assets:
Depreciation has been calculated on straight-line basis in accordance with the provisions of section 205(2)(b) of the Companies Act, 1956 at the rates that are equal to or higher than those prescribed under Schedule XIV to the Companies Act, 1956 based on the management’s estimate of useful lives of the assets. The estimated useful lives that are different from those prescribed under schedule XIV in respect of one of the subsidiaries are as follows: -
Factory Building 10 Years Plant and Machinery 8 Years Furniture and Office Equipment 10 Years Vehicles 5 Years
Cost of Leasehold Land is amortised over the period of lease.
Cost of Leasehold improvements is amortised over the primary period of lease. However, in cases where the company as a lessee has the right of renewal and it is intended to renew for further periods, then the cost of such leasehold improvements is amortised over such extended period.
ii) On Intangible Assets:
a) Goodwill
At the time of acquisition of the business, the difference between
the cost of investments and the fair value of assets as at the date of acquisition is accounted for as goodwill. Goodwill is amortised over a period of 10 years.
Goodwill on amalgamation in the nature of merger is amortised over a period of 5 years.
b) Computer software is amortised on straight-line basis over a period of 6 years.
f) IMPAIRMENT OF ASSETS
An asset is treated as impaired when the carrying cost of asset exceeds its recoverable value. Recoverable amount is the higher of an asset's net selling price and its value in use. Value in use is the present value of estimated future cash flows expected to arise from the continuing use of the asset and from its disposal at the end of its useful life. Net selling price is the amount obtainable from sale of the asset in an arm's length transaction between knowledgeable, willing parties, less the costs of disposal. An impairment loss is charged to the Statement of Profit and Loss in the year in which an asset is identified as impaired. The impaired loss recognised in prior accounting periods is reversed if there has been a change in the estimate of the recoverable value.
g) INVESTMENTS
Investments are classified into non-current investments and current investments. Investments, which are intended to be held for more than one year are classified as non-current investments and investments which are intended to be held for less than one year, are classified as current investments. Non-current investments are accounted at cost and a provision for diminution is made to recognize a decline other than temporary in the value of non-current investment. Current investments are valued at cost or fair value whichever is lower.
Any profit or loss on sale of investments is determined on the basis of the average cost of acquisition
Investment Property held for the purpose of generating rental income or capital appreciation or both, are classified as investment property and are stated at cost. Investment properties are initially measured at cost and transaction
104 Z O D I A C
costs less any accumulated depreciation and any accumulated impairment losses. Any expenditure that results in maintenance of property to acceptable standard or specification is treated as repairs and maintenance expenses and is expensed in the year in which it is incurred.
Investment properties are capitalised and depreciated on a straight line basis over the period of 61 years. Impairment of investment property is determined in accordance with the policy stated for Impairment of Assets.
h) T R A N S A C T I O N S I N F O R E I G N CURRENCY
i) Foreign Subsidiaries (Non integral operation)
In case of foreign subsidiaries Income and Expenses are converted at the average rate prevailing during the year. All assets and liabilities are converted at rates prevailing at the end of the year. All resulting exchange differences are accumulated in a foreign currency translation reserve until the disposal of the net investment in the subsidiaries.
ii) Other Transactions Transactions in foreign currencies
are recorded at the exchange rate prevailing on the date of the transaction. Monetary items denominated in foreign currencies are restated at the exchange rate prevailing on the balance sheet date. Exchange differences arising on settlement of the transaction and on account of restatement of monetary items are dealt with in the Statement of Profit and Loss.
Forward exchange contracts entered into to hedge the foreign currency risk and outstanding as on balance sheet date are translated at year end exchange rates. The premium or discount arising at the inception of such forward exchange contracts are amortised as income or expense over the life of the contract.
Gains /Losses on se t t lement of transactions arising on cancellation/renewal of forward exchange contracts are recognized as income or expense.
i) HEDGE ACCOUNTING
The Company uses foreign currency forward contracts to hedge its risks associated with foreign currency fluctuations relating to certain firm commitments and forecasted transactions. The Company designates these hedging instruments as cash flow hedges applying the recognition and measurement principles set out in the Accounting Standard 30 “Financial Instruments: Recognition and Measurement” (AS–30).
The use of hedging instruments is governed by the Company’s policies approved by the board of directors, which provides written principles on the use of such financial derivatives consistent with the Company’s risk management strategy.
Hedging instruments are initially measured at fair value, and are remeasured at subsequent reporting dates.
Changes in the fair value of these derivatives that are designated and effective as hedges of future cash flows are recognised directly in shareholders’ funds and the ineffective portion is recognised immediately in the Statement of Profit and Loss.
Changes in the fair value of derivative financial instruments that do not qualify for hedge accounting are recognised in the Statement of Profit and Loss as they arise.
If a hedged transaction is no longer expected to occur, the net cumulative gain or loss recognised in shareholders’ funds is transferred to the Statement of Profit and Loss for the period.
j) INVENTORIES
a) Raw materials are valued at cost or net realisable value whichever is lower. The cost includes purchase price as well as incidental expenses. The cost formulae used are First In First Out, weighted average cost or Specific identification method, as applicable and found appropriate.
b) Work - in - progress is valued at cost calculated on the basis of absorption costing or net realisable value whichever is lower.
c) Finished goods are valued at cost or net realisable value whichever is lower. Cost
Z O D I A C 105
is determined on the basis of absorption costing.
d) Packing materials and accessories are valued at First in First out cost or net realisable value whichever is lower.
e) Stores and spare parts are valued at First in First out cost or net realisable value whichever is lower.
f) Stock of shares is valued at the lower of cost computed on First in First out basis and fair value.
k) EMPLOYEEBENEFITS
a) The contribution to Provident Fund as required under the statute is made to the Government Provident Fund and is debited to Statement of Profit and Loss.
b) Gratuity liability is a defined benefit obligation. The Company has taken Group gratuity- cum-life assurance (cash accumulation) Scheme offered by Life Insurance Corporation of India (LIC) . Annual contributions are made on the basis of intimation received from LIC. The company accounts for liability for future gratuity benefits based on actuarial valuation carried out as at the end of each financial year. Actuarial gains and losses are recognized in full in Statement of Profit and Loss for the period in which they occur.
c) Benefits in the form of vesting and non-vesting compensated absences are accounted as per actuarial valuation carried out as at the year end.
d) In case of a Foreign Subsidiary, provision for retirement benefits is made on actual basis in accordance with the applicable local labour laws.
l) TAXES ON INCOME
Income Taxes are accounted for in accordance with Accounting Standard (AS 22) – Accounting for Taxes on Income, notified under the Companies (Accounting Standard) Rules, 2006. Income Tax comprises both current and deferred tax.
Current tax is measured at the amount expected to be paid to/recovered from the revenue authorities, using applicable tax rates and laws.
The tax effect of the timing differences that result between taxable income and accounting income and are capable of reversal in one or more subsequent periods are recorded as a deferred tax asset or deferred tax liability. They are measured using the substantively enacted tax rates and tax regulations as of the Balance Sheet date.
Deferred tax assets arising on account of brought forward losses and unabsorbed depreciation under tax laws are recognised only if there is virtual certainty of its realisation, supported by convincing evidence. Deferred tax assets on account of other timing differences are recognized only to the extent there is a reasonable certainty of its realisation.
m) BORROWING COST Interest and other costs in connection with the
borrowing of the funds to the extent related/ attributed to the acquisition/construction of qualifying fixed assets are capitalized up to the date when such assets are ready for its intended use and all other borrowing costs are recognised as an expense in the period in which they are incurred.
n) LEASES Assets taken / given on lease by which all
significant risks and rewards of ownership are retained by the lessor are classified as operating leases. Lease payment/receipts under operating leases are recognized as expense/income on straight line basis over the lease term.
o) PROVISIONS AND CONTINGENCIES
Provisions are recognized when the Company has a legal and constructive obligation as a result of a past event, for which it is probable that cash outflow will be required and a reliable estimate can be made of the amount of the obligation. Contingent liabilities are disclosed when the Company has a possible or present obligation where it is not probable that an outflow of resources will be required to settle it. Contingent assets are neither recognized nor disclosed.
106 Z O D I A C
NOTES FORMING PART OF THE CONSOLIDATED FINANCIAL STATEMENTS
As at 31st March, 2013 As at 31st March, 2012 Particulars Number ` Number ` of shares of sharesNOTE 2 : SHARE CAPITAL(a) Authorised Equity shares of ` 10/- each 30,000,000 300,000,000 30,000,000 300,000,000(b) Issued, Subscribed and fully paid up Equity shares of ` 10/- each 19,389,998 193,899,980 19,270,298 192,702,980
TOTAL 19,389,998 193,899,980 19,270,298 192,702,980Notes :(i) Rights, preferences and restrictions attached to equity shares : The company has only one class of shares referred to as equity shares having a par value of ` 10/- per share. Each holder
of equity shares is entitled to one vote per share. The company declares and pays dividend in Indian Rupees. The dividend recommended by the Board of Directors is subject to the approval of the shareholders at the ensuing annual general meeting, except in the case of Interim dividend. In the event of the liquidation of the company the holders of equity shares will be entitled to receive remaining assets of the company, after distribution of all preferential amounts in the proportion of equity shares held.
(ii) Reconciliation of the number of shares and amount outstanding at the beginning and at the end of the reporting period: Particulars Opening Balance Bonus ESOP Closing Balance Equity shares Year ended 31 March, 2013 – Number of shares 19,270,298 – 119,700 19,389,998 – Amount (`) 192,702,980 – 1,197,000 193,899,980 Year ended 31 March, 2012 – Number of shares 12,821,064 6,410,532 38,702 19,270,298 – Amount (`) 128,210,640 64,105,320 387,020 192,702,980(iii) Details of shares held by each shareholder holding more than 5% shares: As at 31st March, 2013 As at 31st March, 2012 Class of shares / Name of shareholder Number of % of Number of % of shares held holding shares held holding Equity shares with voting rights : Asia Tangible Investments Pte Ltd. 3,154,882 16.27 3,154,882 16.37 Euro Global Holdings Pte. Ltd. 3,154,882 16.27 3,154,882 16.37 Miraj Marketing Company LLP 2,317,734 11.95 2,317,734 12.03 Mohammed Yusuf Noorani ** 2,569,395 13.25 1,691,448 8.78 Akash Bhanshali 2,025,000 10.44 – – India Capital Fund Ltd – – 1,840,873 9.55 Pari Washington Company Pvt. Ltd. A/C Pari Washington India Master Fund, Ltd 979,032 5.05 404,492 2.10 **Out of 2,569,395 shares held by Mr Mohammed Yusuf Noorani, (previous year 1,691,448), following shares are held by him a) as Partner for and on behalf of – 244,170 Metropolitan Trading Company b) as Trustee for and on behalf of 18,990 18,990 Yusuf Noorani Family Trust c) as Trustee for and on behalf of 8,334 8,334 Anees Yusuf Noorani Family Benefit Trust(iv) As at 31st March, 2013, 369,075 shares (As at 31st March, 2012, 520,722 shares) were reserved for issuance towards
outstanding employee stock options granted (Refer Note 36)(v) Aggregate number and class of shares allotted as fully paid up pursuant to contract(s) without payment being received in
cash, bonus shares and shares bought back for the period of 5 years immediately preceding the Balance Sheet date:
Particulars Aggregate number of shares As at 31st March, 2013 As at 31st March, 2012Equity sharesFully paid up by way of bonus shares 10,614,770 10,614,770
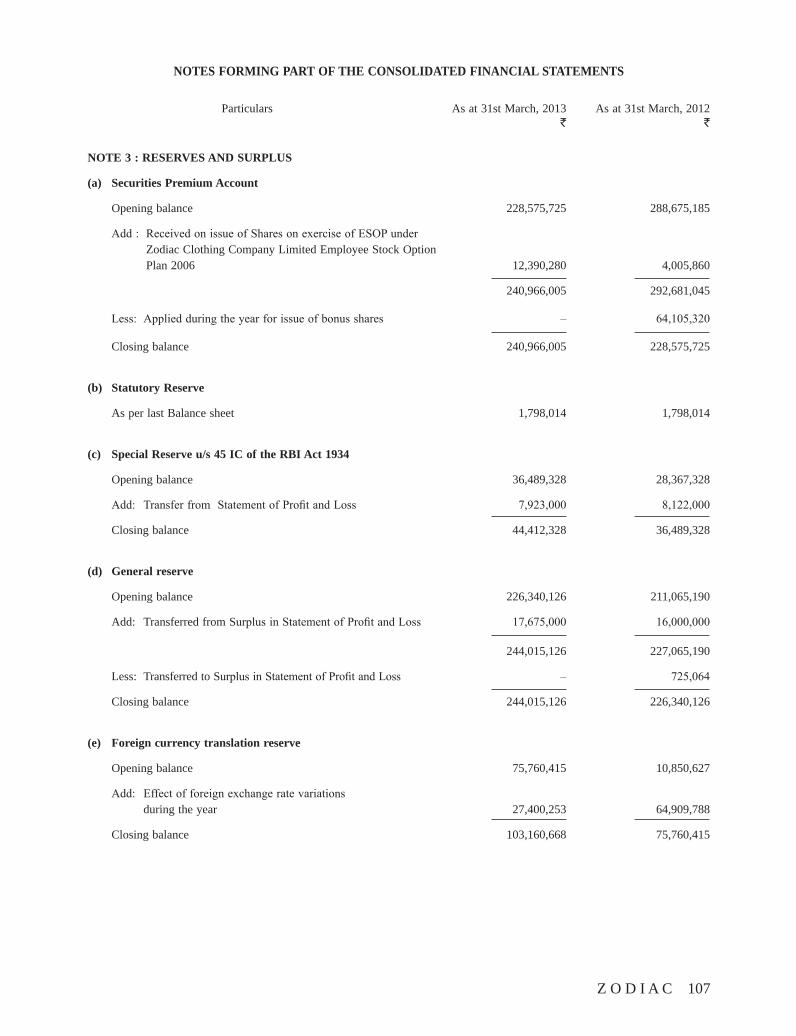
Z O D I A C 107
NOTES FORMING PART OF THE CONSOLIDATED FINANCIAL STATEMENTS
Particulars As at 31st March, 2013 As at 31st March, 2012 ` `
NOTE 3 : RESERVES AND SURPLUS
(a) Securities Premium Account
Opening balance 228,575,725 288,675,185
Add : Received on issue of Shares on exercise of ESOP under Zodiac Clothing Company Limited Employee Stock Option Plan 2006 12,390,280 4,005,860
240,966,005 292,681,045
Less: Applied during the year for issue of bonus shares – 64,105,320
Closing balance 240,966,005 228,575,725
(b) Statutory Reserve
As per last Balance sheet 1,798,014 1,798,014
(c) Special Reserve u/s 45 IC of the RBI Act 1934
Opening balance 36,489,328 28,367,328
Add: Transfer from Statement of Profit and Loss 7,923,000 8,122,000
Closing balance 44,412,328 36,489,328
(d) General reserve
Opening balance 226,340,126 211,065,190
Add: Transferred from Surplus in Statement of Profit and Loss 17,675,000 16,000,000
244,015,126 227,065,190
Less: Transferred to Surplus in Statement of Profit and Loss – 725,064
Closing balance 244,015,126 226,340,126
(e) Foreign currency translation reserve
Opening balance 75,760,415 10,850,627
Add: Effect of foreign exchange rate variations during the year 27,400,253 64,909,788
Closing balance 103,160,668 75,760,415
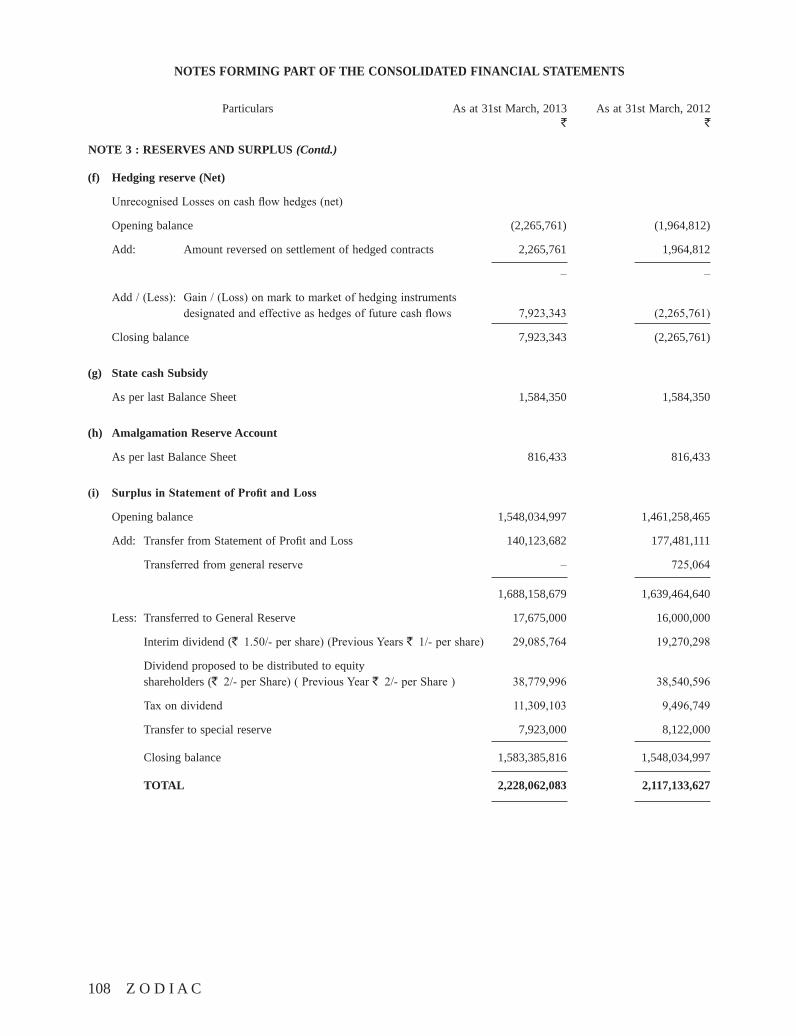
108 Z O D I A C
NOTES FORMING PART OF THE CONSOLIDATED FINANCIAL STATEMENTS
Particulars As at 31st March, 2013 As at 31st March, 2012 ` `
NOTE 3 : RESERVES AND SURPLUS (Contd.)
(f) Hedging reserve (Net)
Unrecognised Losses on cash flow hedges (net)
Opening balance (2,265,761) (1,964,812)
Add: Amount reversed on settlement of hedged contracts 2,265,761 1,964,812
– –
Add / (Less): Gain / (Loss) on mark to market of hedging instruments designated and effective as hedges of future cash flows 7,923,343 (2,265,761)
Closing balance 7,923,343 (2,265,761)
(g) State cash Subsidy
As per last Balance Sheet 1,584,350 1,584,350
(h) Amalgamation Reserve Account
As per last Balance Sheet 816,433 816,433
(i) SurplusinStatementofProfitandLoss
Opening balance 1,548,034,997 1,461,258,465
Add: Transfer from Statement of Profit and Loss 140,123,682 177,481,111
Transferred from general reserve – 725,064
1,688,158,679 1,639,464,640
Less: Transferred to General Reserve 17,675,000 16,000,000
Interim dividend (` 1.50/- per share) (Previous Years ` 1/- per share) 29,085,764 19,270,298
Dividend proposed to be distributed to equity shareholders (` 2/- per Share) ( Previous Year ` 2/- per Share ) 38,779,996 38,540,596
Tax on dividend 11,309,103 9,496,749
Transfer to special reserve 7,923,000 8,122,000
Closing balance 1,583,385,816 1,548,034,997
TOTAL 2,228,062,083 2,117,133,627
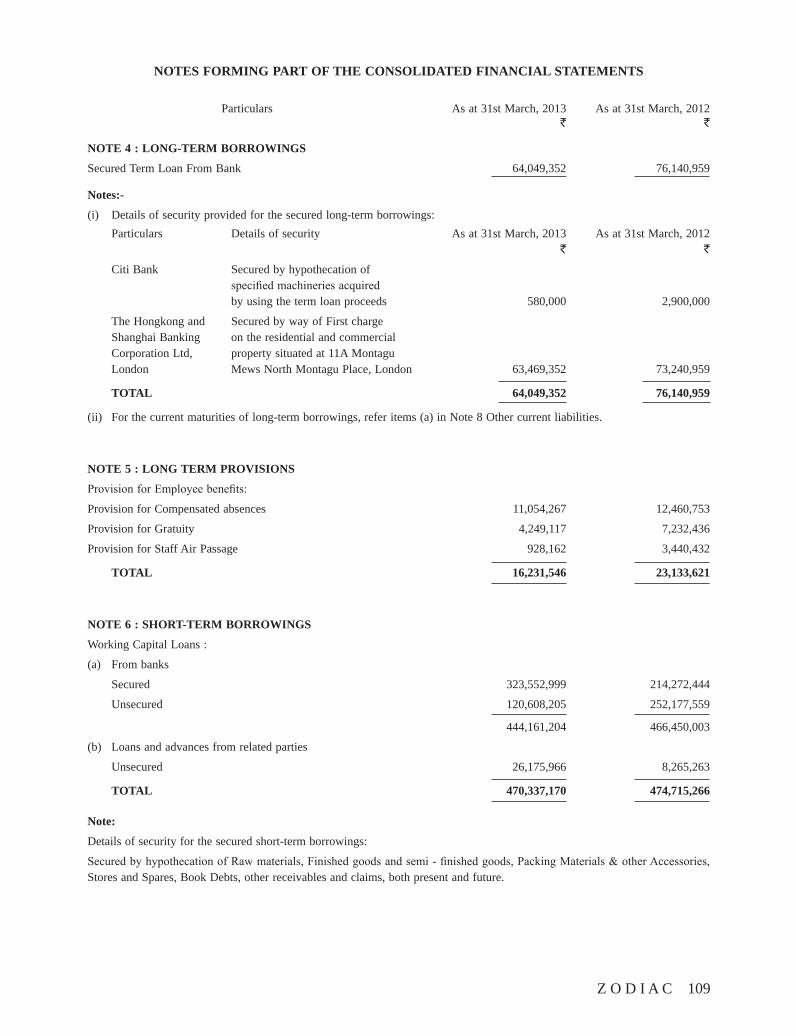
Z O D I A C 109
NOTES FORMING PART OF THE CONSOLIDATED FINANCIAL STATEMENTS
Particulars As at 31st March, 2013 As at 31st March, 2012 ` `
NOTE 4 : LONG-TERM BORROWINGS
Secured Term Loan From Bank 64,049,352 76,140,959
Notes:-
(i) Details of security provided for the secured long-term borrowings: Particulars Details of security As at 31st March, 2013 As at 31st March, 2012 ` `
Citi Bank Secured by hypothecation of specified machineries acquired by using the term loan proceeds 580,000 2,900,000
The Hongkong and Secured by way of First charge Shanghai Banking on the residential and commercial Corporation Ltd, property situated at 11A Montagu London Mews North Montagu Place, London 63,469,352 73,240,959
TOTAL 64,049,352 76,140,959
(ii) For the current maturities of long-term borrowings, refer items (a) in Note 8 Other current liabilities.
NOTE 5 : LONG TERM PROVISIONS
Provision for Employee benefits:
Provision for Compensated absences 11,054,267 12,460,753
Provision for Gratuity 4,249,117 7,232,436
Provision for Staff Air Passage 928,162 3,440,432
TOTAL 16,231,546 23,133,621
NOTE 6 : SHORT-TERM BORROWINGS
Working Capital Loans :
(a) From banks
Secured 323,552,999 214,272,444
Unsecured 120,608,205 252,177,559
444,161,204 466,450,003
(b) Loans and advances from related parties
Unsecured 26,175,966 8,265,263
TOTAL 470,337,170 474,715,266
Note:
Details of security for the secured short-term borrowings:
Secured by hypothecation of Raw materials, Finished goods and semi - finished goods, Packing Materials & other Accessories, Stores and Spares, Book Debts, other receivables and claims, both present and future.
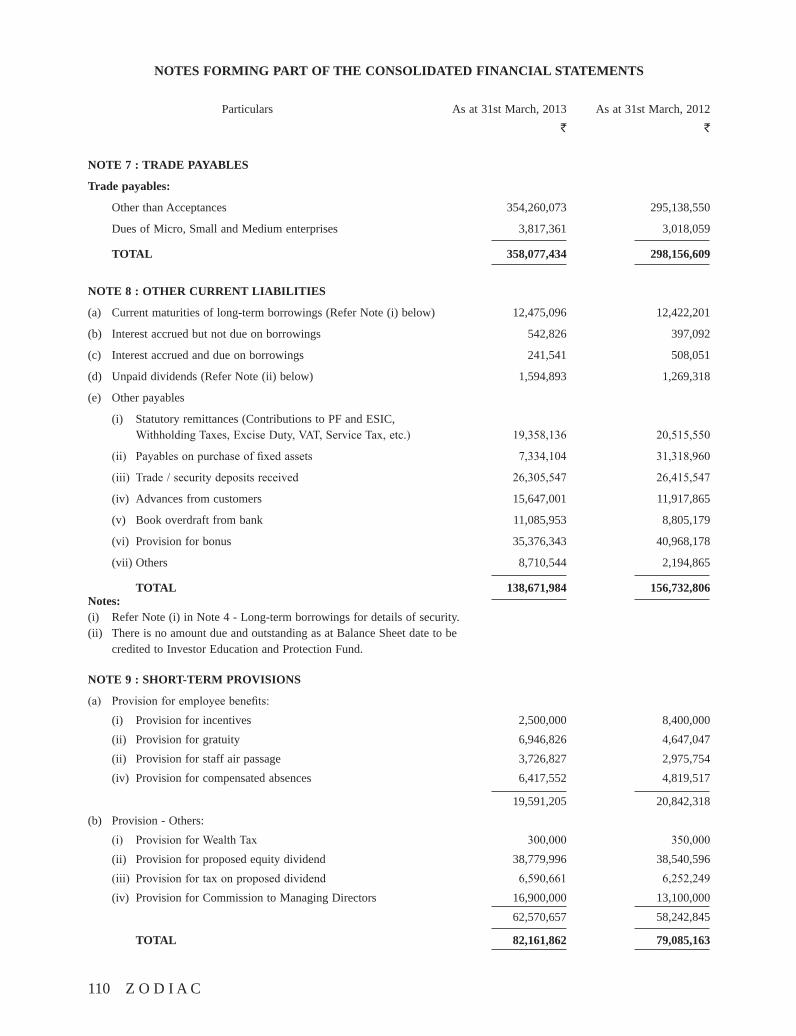
110 Z O D I A C
NOTES FORMING PART OF THE CONSOLIDATED FINANCIAL STATEMENTS
Particulars As at 31st March, 2013 As at 31st March, 2012 ` `
NOTE 7 : TRADE PAYABLES
Trade payables:
Other than Acceptances 354,260,073 295,138,550
Dues of Micro, Small and Medium enterprises 3,817,361 3,018,059
TOTAL 358,077,434 298,156,609
NOTE 8 : OTHER CURRENT LIABILITIES
(a) Current maturities of long-term borrowings (Refer Note (i) below) 12,475,096 12,422,201
(b) Interest accrued but not due on borrowings 542,826 397,092
(c) Interest accrued and due on borrowings 241,541 508,051
(d) Unpaid dividends (Refer Note (ii) below) 1,594,893 1,269,318
(e) Other payables
(i) Statutory remittances (Contributions to PF and ESIC, Withholding Taxes, Excise Duty, VAT, Service Tax, etc.) 19,358,136 20,515,550
(ii) Payables on purchase of fixed assets 7,334,104 31,318,960
(iii) Trade / security deposits received 26,305,547 26,415,547
(iv) Advances from customers 15,647,001 11,917,865
(v) Book overdraft from bank 11,085,953 8,805,179
(vi) Provision for bonus 35,376,343 40,968,178
(vii) Others 8,710,544 2,194,865
TOTAL 138,671,984 156,732,806Notes:(i) Refer Note (i) in Note 4 - Long-term borrowings for details of security.(ii) There is no amount due and outstanding as at Balance Sheet date to be credited to Investor Education and Protection Fund.
NOTE 9 : SHORT-TERM PROVISIONS
(a) Provision for employee benefits: (i) Provision for incentives 2,500,000 8,400,000 (ii) Provision for gratuity 6,946,826 4,647,047 (ii) Provision for staff air passage 3,726,827 2,975,754 (iv) Provision for compensated absences 6,417,552 4,819,517
19,591,205 20,842,318(b) Provision - Others: (i) Provision for Wealth Tax 300,000 350,000 (ii) Provision for proposed equity dividend 38,779,996 38,540,596 (iii) Provision for tax on proposed dividend 6,590,661 6,252,249 (iv) Provision for Commission to Managing Directors 16,900,000 13,100,000 62,570,657 58,242,845
TOTAL 82,161,862 79,085,163
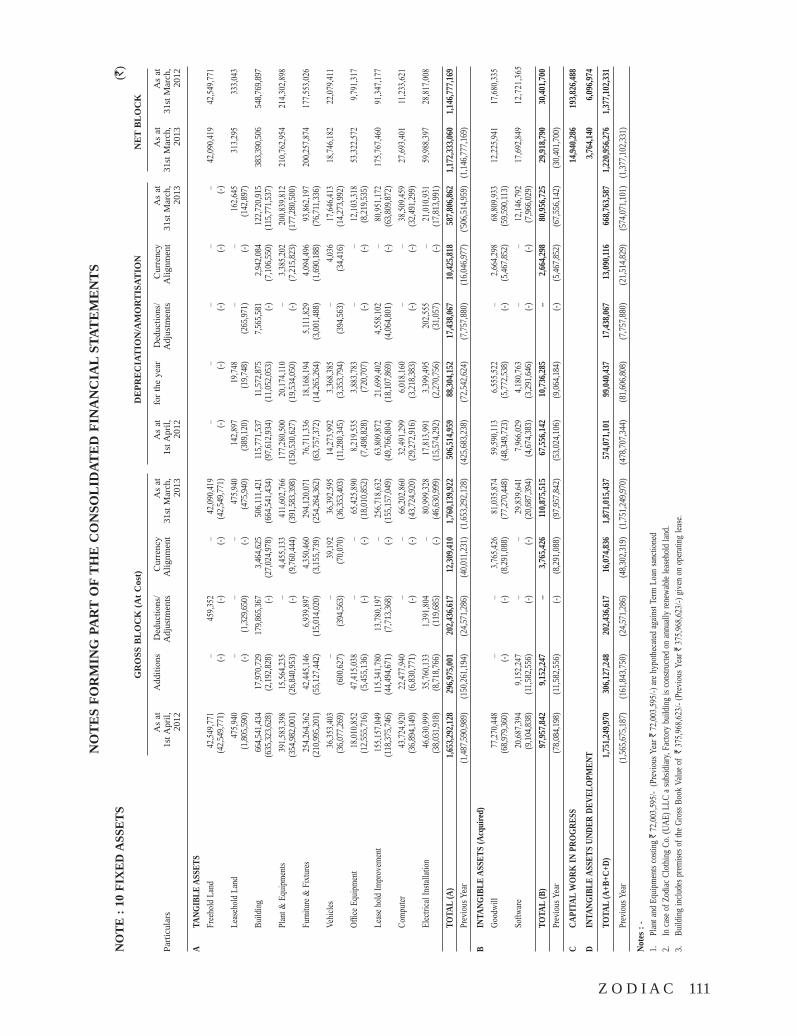
Z O D I A C 111
NO
TE
S FO
RM
ING
PA
RT
OF
TH
E C
ON
SOL
IDAT
ED
FIN
AN
CIA
L ST
ATE
ME
NT
S
NO
TE
: 10
FIX
ED
ASS
ET
S (`
)
GR
OSS
BL
OC
K (A
t Cos
t)
DE
PRE
CIA
TIO
N/A
MO
RT
ISAT
ION
N
ET
BL
OC
K
As
at
Add
ition
s D
educ
tions
/ C
urre
ncy
As
at
As
at
for t
he y
ear
Ded
uctio
ns/
Cur
renc
y A
s at
A
s at
A
s at
Pa
rticu
lars
1s
t Apr
il,
A
djus
tmen
ts
Alig
nmen
t 31
st M
arch
, 1s
t Apr
il,
A
djus
tmen
ts
Alig
nmen
t 31
st M
arch
, 31
st M
arch
, 31
st M
arch
,
20
12
20
13
2012
2013
20
13
2012
A TA
NGIB
LE A
SSET
S
Free
hold
Lan
d 42
,549,7
71
– 45
9,352
–
42,09
0,419
–
– –
– –
42,09
0,419
42
,549,7
71
(42,5
49,77
1)
(-)
(-)
(-)
(42,5
49,77
1)
(-)
(-)
(-)
(-)
(-)
Leas
ehol
d La
nd
475,9
40
– –
– 47
5,940
14
2,897
19
,748
– –
162,6
45
313,2
95
333,0
43
(1,80
5,590
) (-)
(1
,329,6
50)
(-)
(475
,940)
(3
89,12
0)
(19,7
48)
(265
,971)
(-)
(1
42,89
7)
Bu
ildin
g 66
4,541
,434
17,97
0,729
17
9,865
,367
3,464
,625
506,1
11,42
1 11
5,771
,537
11,57
2,875
7,5
65,58
1 2,9
42,08
4 12
2,720
,915
383,3
90,50
6 54
8,769
,897
(635
,323,6
28)
(2,19
2,828
) (-)
(2
7,024
,978)
(6
64,54
1,434
) (9
7,612
,934)
(1
1,052
,053)
(-)
(7
,106,5
50)
(115
,771,5
37)
Pl
ant &
Equ
ipm
ents
391,5
83,39
8 15
,564,2
35
– 4,4
55,13
3 41
1,602
,766
177,2
80,50
0 20
,174,1
10
– 3,3
85,20
2 20
0,839
,812
210,7
62,95
4 21
4,302
,898
(354
,982,0
01)
(26,8
40,95
3)
(-)
(9,76
0,444
) (3
91,58
3,398
) (1
50,53
0,627
) (1
9,534
,050)
(-)
(7
,215,8
23)
(177
,280,5
00)
Fu
rnitu
re &
Fix
ture
s 25
4,264
,362
42,44
5,146
6,9
39,89
7 4,3
50,46
0 29
4,120
,071
76,71
1,336
18
,168,1
94
5,111
,829
4,094
,496
93,86
2,197
20
0,257
,874
177,5
53,02
6
(2
10,99
5,201
) (5
5,127
,442)
(1
5,014
,020)
(3
,155,7
39)
(254
,264,3
62)
(63,7
57,37
2)
(14,2
65,26
4)
(3,00
1,488
) (1
,690,1
88)
(76,7
11,33
6)
Ve
hicle
s 36
,353,4
03
– –
39,19
2 36
,392,5
95
14,27
3,992
3,3
68,38
5 –
4,036
17
,646,4
13
18,74
6,182
22
,079,4
11
(36,0
77,26
9)
(600
,627)
(3
94,56
3)
(70,0
70)
(36,3
53,40
3)
(11,2
80,34
5)
(3,35
3,794
) (3
94,56
3)
(34,4
16)
(14,2
73,99
2)
Of
fice E
quip
men
t 18
,010,8
52
47,41
5,038
–
– 65
,425,8
90
8,219
,535
3,883
,783
– –
12,10
3,318
53
,322,5
72
9,791
,317
(12,5
55,71
6)
(5,45
5,136
) (-)
(-)
(1
8,010
,852)
(7
,498,8
28)
(720
,707)
(-)
(-)
(8
,219,5
35)
Le
ase h
old
Impr
ovem
ent
155,1
57,04
9 11
5,341
,780
13,78
0,197
–
256,7
18,63
2 63
,809,8
72
21,69
9,402
4,5
58,10
2 –
80,95
1,172
17
5,767
,460
91,34
7,177
(1
18,37
5,746
) (4
4,494
,671)
(7
,713,3
68)
(-)
(155
,157,0
49)
(49,7
66,80
4)
(18,1
07,86
9)
(4,06
4,801
) (-)
(6
3,809
,872)
Com
puter
43
,724,9
20
22,47
7,940
–
– 66
,202,8
60
32,49
1,299
6,0
18,16
0 –
– 38
,509,4
59
27,69
3,401
11
,233,6
21
(36,8
94,14
9)
(6,83
0,771
) (-)
(-)
(4
3,724
,920)
(2
9,272
,916)
(3
,218,3
83)
(-)
(-)
(32,4
91,29
9)
El
ectri
cal I
nstal
latio
n 46
,630,9
99
35,76
0,133
1,3
91,80
4 –
80,99
9,328
17
,813,9
91
3,399
,495
202,5
55
– 21
,010,9
31
59,98
8,397
28
,817,0
08
(38,0
31,91
8)
(8,71
8,766
) (1
19,68
5)
(-)
(46,6
30,99
9)
(15,5
74,29
2)
(2,27
0,756
) (3
1,057
) (-)
(1
7,813
,991)
TOTA
L (A
) 1,6
53,29
2,128
29
6,975
,001
202,4
36,61
7 12
,309,4
10
1,760
,139,9
22
506,5
14,95
9 88
,304,1
52
17,43
8,067
10
,425,8
18
587,8
06,86
2 1,1
72,33
3,060
1,1
46,77
7,169
Pr
evio
us Y
ear
(1,48
7,590
,989)
(1
50,26
1,194
) (2
4,571
,286)
(4
0,011
,231)
(1
,653,2
92,12
8)
(425
,683,2
38)
(72,5
42,62
4)
(7,75
7,880
) (1
6,046
,977)
('5
06,51
4,959
) (1
,146,7
77,16
9)
B IN
TANG
IBLE
ASS
ETS
(Acq
uire
d)
Good
will
77,27
0,448
–
– 3,7
65,42
6 81
,035,8
74
59,59
0,113
6,5
55,52
2 –
2,664
,298
68,80
9,933
12
,225,9
41
17,68
0,335
(6
8,979
,360)
(-)
(-)
(8
,291,0
88)
(77,2
70,44
8)
(48,3
49,72
3)
(5,77
2,538
) (-)
(5
,467,8
52)
(59,5
90,11
3)
So
ftwar
e 20
,687,3
94
9,152
,247
– –
29,83
9,641
7,9
66,02
9 4,1
80,76
3 –
– 12
,146,7
92
17,69
2,849
12
,721
,365
(9
,104,8
38)
(11,5
82,55
6)
(-)
(-)
(20,6
87,39
4)
(4,67
4,383
) (3
,291,6
46)
(-)
(-)
(7,96
6,029
)
TOTA
L (B
) 97
,957,8
42
9,152
,247
– 3,7
65,42
6 11
0,875
,515
67,55
6,142
10
,736,2
85
– 2,6
64,29
8 80
,956,7
25
29,91
8,790
30
,401,7
00
Prev
ious
Yea
r (7
8,084
,198)
(1
1,582
,556)
(-)
(8
,291,0
88)
(97,9
57,84
2)
(53,0
24,10
6)
(9,06
4,184
) (-)
(5
,467,8
52)
(67,5
56,14
2)
(30,4
01,70
0)
C CA
PITA
L W
ORK
IN P
ROGR
ESS
14,94
0,286
19
3,826
,488
D IN
TANG
IBLE
ASS
ETS
UNDE
R DE
VELO
PMEN
T
3,7
64,14
0 6,0
96,97
4
TO
TAL
(A+B
+C+D
) 1,7
51,24
9,970
30
6,127
,248
202,4
36,61
7 16
,074,8
36
1,871
,015,4
37
574,0
71,10
1 99
,040,4
37
17,43
8,067
13
,090,1
16
668,7
63,58
7 1,2
20,95
6,276
1,3
77,10
2,331
Pr
evio
us Y
ear
(1,56
5,675
,187)
(1
61,84
3,750
) (2
4,571
,286)
(4
8,302
,319)
(1
,751,2
49,97
0)
(478
,707,3
44)
(81,6
06,80
8)
(7,75
7,880
) (2
1,514
,829)
(5
74,07
1,101
) (1
,377,1
02,33
1)
Note
s : -
1. Pl
ant a
nd E
quip
men
ts co
sting
` 7
2,003
,595/
- (P
revi
ous Y
ear `
72,0
03,59
5/-)
are h
ypot
heca
ted ag
ainst
Term
Loa
n sa
nctio
ned
2. In
case
of Z
odiac
Clo
thin
g Co
. (UA
E) L
LC a
subs
idiar
y, Fa
ctory
bui
ldin
g is
cons
tructe
d on
annu
ally
rene
wabl
e lea
seho
ld la
nd.
3. Bu
ildin
g in
clude
s pre
mise
s of t
he G
ross
Boo
k Va
lue o
f `
375,9
68,62
3/- (
Prev
ious
Yea
r ` 3
75,96
8,623
/-) g
iven
on
oper
ating
leas
e.
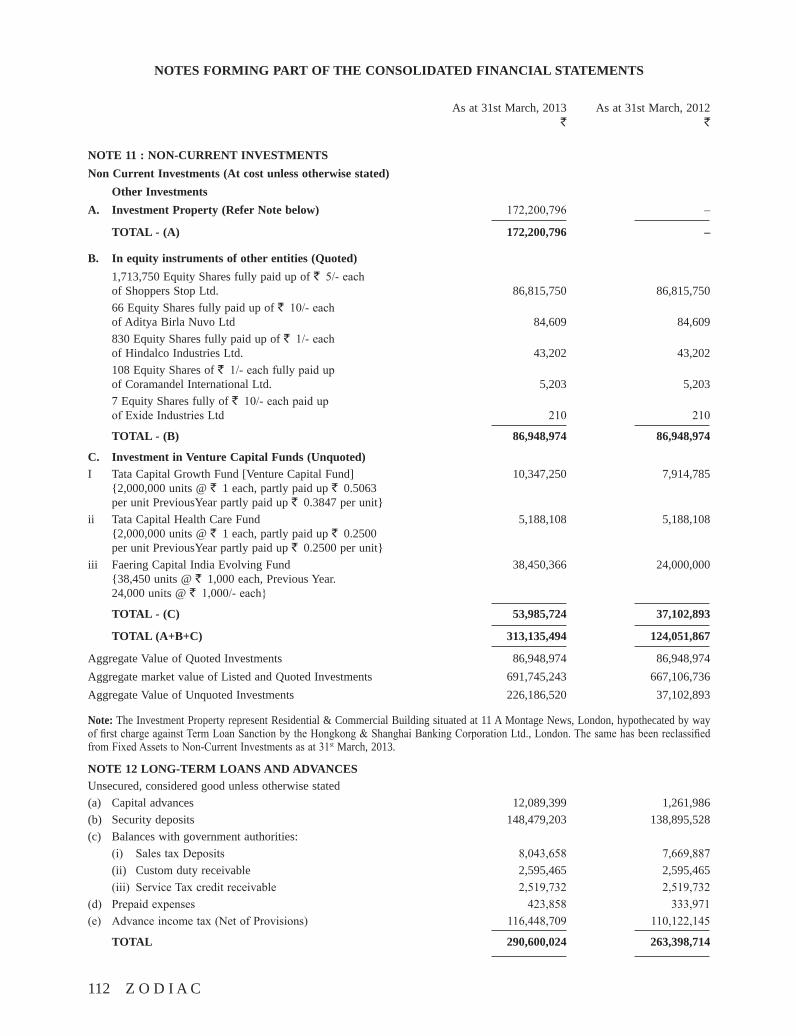
112 Z O D I A C
NOTES FORMING PART OF THE CONSOLIDATED FINANCIAL STATEMENTS
As at 31st March, 2013 As at 31st March, 2012 ` `
NOTE 11 : NON-CURRENT INVESTMENTSNon Current Investments (At cost unless otherwise stated) Other InvestmentsA. Investment Property (Refer Note below) 172,200,796 –
TOTAL - (A) 172,200,796 –
B. In equity instruments of other entities (Quoted) 1,713,750 Equity Shares fully paid up of ` 5/- each of Shoppers Stop Ltd. 86,815,750 86,815,750 66 Equity Shares fully paid up of ` 10/- each of Aditya Birla Nuvo Ltd 84,609 84,609 830 Equity Shares fully paid up of ` 1/- each of Hindalco Industries Ltd. 43,202 43,202 108 Equity Shares of ` 1/- each fully paid up of Coramandel International Ltd. 5,203 5,203 7 Equity Shares fully of ` 10/- each paid up of Exide Industries Ltd 210 210
TOTAL - (B) 86,948,974 86,948,974
C. Investment in Venture Capital Funds (Unquoted)I Tata Capital Growth Fund [Venture Capital Fund] 10,347,250 7,914,785 {2,000,000 units @ ` 1 each, partly paid up ` 0.5063 per unit PreviousYear partly paid up ` 0.3847 per unit}ii Tata Capital Health Care Fund 5,188,108 5,188,108 {2,000,000 units @ ` 1 each, partly paid up ` 0.2500 per unit PreviousYear partly paid up ` 0.2500 per unit}iii Faering Capital India Evolving Fund 38,450,366 24,000,000 {38,450 units @ ` 1,000 each, Previous Year. 24,000 units @ ` 1,000/- each}
TOTAL - (C) 53,985,724 37,102,893
TOTAL (A+B+C) 313,135,494 124,051,867
Aggregate Value of Quoted Investments 86,948,974 86,948,974Aggregate market value of Listed and Quoted Investments 691,745,243 667,106,736Aggregate Value of Unquoted Investments 226,186,520 37,102,893
Note: The Investment Property represent Residential & Commercial Building situated at 11 A Montage News, London, hypothecated by way of first charge against Term Loan Sanction by the Hongkong & Shanghai Banking Corporation Ltd., London. The same has been reclassified from Fixed Assets to Non-Current Investments as at 31st March, 2013.
NOTE 12 LONG-TERM LOANS AND ADVANCESUnsecured, considered good unless otherwise stated(a) Capital advances 12,089,399 1,261,986(b) Security deposits 148,479,203 138,895,528(c) Balances with government authorities: (i) Sales tax Deposits 8,043,658 7,669,887 (ii) Custom duty receivable 2,595,465 2,595,465 (iii) Service Tax credit receivable 2,519,732 2,519,732(d) Prepaid expenses 423,858 333,971(e) Advance income tax (Net of Provisions) 116,448,709 110,122,145
TOTAL 290,600,024 263,398,714
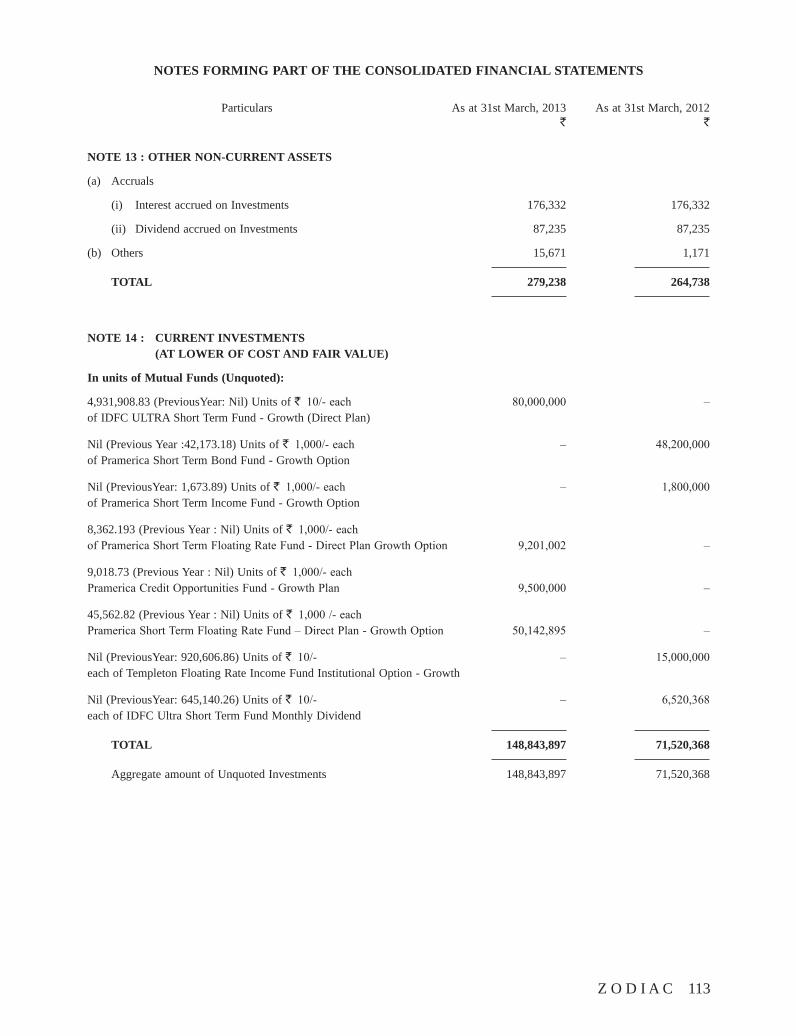
Z O D I A C 113
NOTES FORMING PART OF THE CONSOLIDATED FINANCIAL STATEMENTS
Particulars As at 31st March, 2013 As at 31st March, 2012 ` `
NOTE 13 : OTHER NON-CURRENT ASSETS
(a) Accruals
(i) Interest accrued on Investments 176,332 176,332
(ii) Dividend accrued on Investments 87,235 87,235
(b) Others 15,671 1,171
TOTAL 279,238 264,738
NOTE 14 : CURRENT INVESTMENTS (AT LOWER OF COST AND FAIR VALUE)
In units of Mutual Funds (Unquoted):
4,931,908.83 (PreviousYear: Nil) Units of ` 10/- each 80,000,000 – of IDFC ULTRA Short Term Fund - Growth (Direct Plan)
Nil (Previous Year :42,173.18) Units of ` 1,000/- each – 48,200,000 of Pramerica Short Term Bond Fund - Growth Option
Nil (PreviousYear: 1,673.89) Units of ` 1,000/- each – 1,800,000 of Pramerica Short Term Income Fund - Growth Option
8,362.193 (Previous Year : Nil) Units of ` 1,000/- each of Pramerica Short Term Floating Rate Fund - Direct Plan Growth Option 9,201,002 –
9,018.73 (Previous Year : Nil) Units of ` 1,000/- each Pramerica Credit Opportunities Fund - Growth Plan 9,500,000 –
45,562.82 (Previous Year : Nil) Units of ` 1,000 /- each Pramerica Short Term Floating Rate Fund – Direct Plan - Growth Option 50,142,895 –
Nil (PreviousYear: 920,606.86) Units of ` 10/- – 15,000,000 each of Templeton Floating Rate Income Fund Institutional Option - Growth
Nil (PreviousYear: 645,140.26) Units of ` 10/- – 6,520,368 each of IDFC Ultra Short Term Fund Monthly Dividend
TOTAL 148,843,897 71,520,368
Aggregate amount of Unquoted Investments 148,843,897 71,520,368
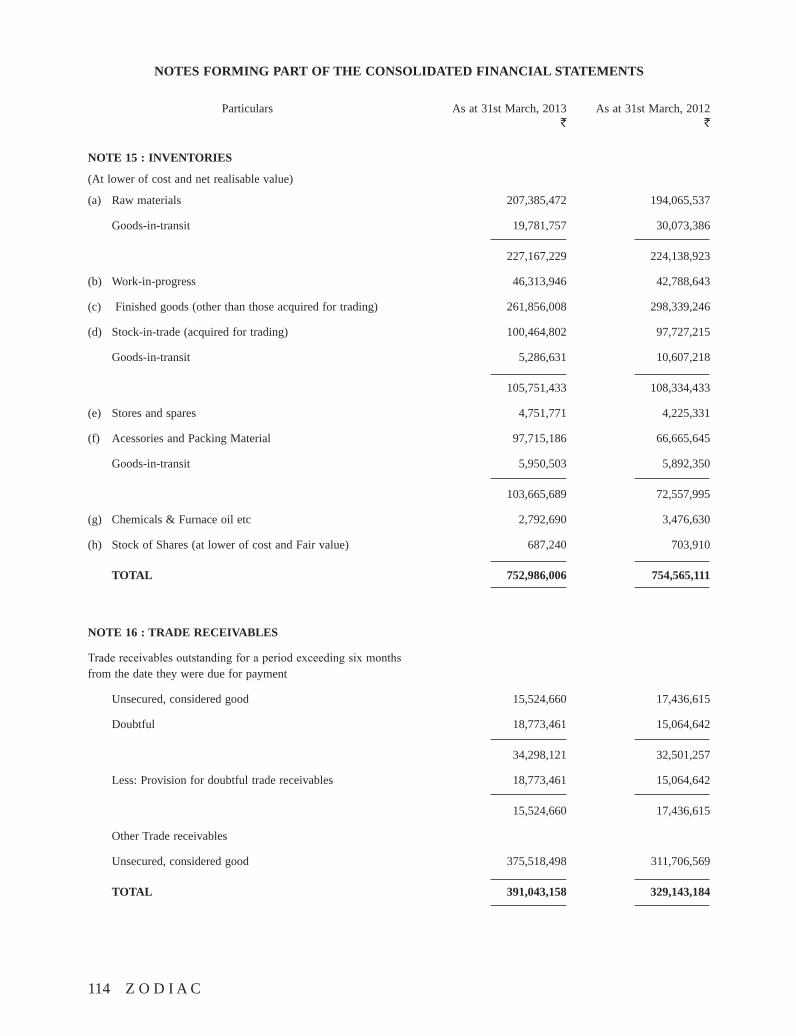
114 Z O D I A C
NOTES FORMING PART OF THE CONSOLIDATED FINANCIAL STATEMENTS
Particulars As at 31st March, 2013 As at 31st March, 2012 ` `
NOTE 15 : INVENTORIES
(At lower of cost and net realisable value)
(a) Raw materials 207,385,472 194,065,537
Goods-in-transit 19,781,757 30,073,386
227,167,229 224,138,923
(b) Work-in-progress 46,313,946 42,788,643
(c) Finished goods (other than those acquired for trading) 261,856,008 298,339,246
(d) Stock-in-trade (acquired for trading) 100,464,802 97,727,215
Goods-in-transit 5,286,631 10,607,218
105,751,433 108,334,433
(e) Stores and spares 4,751,771 4,225,331
(f) Acessories and Packing Material 97,715,186 66,665,645
Goods-in-transit 5,950,503 5,892,350
103,665,689 72,557,995
(g) Chemicals & Furnace oil etc 2,792,690 3,476,630
(h) Stock of Shares (at lower of cost and Fair value) 687,240 703,910
TOTAL 752,986,006 754,565,111
NOTE 16 : TRADE RECEIVABLES
Trade receivables outstanding for a period exceeding six months from the date they were due for payment
Unsecured, considered good 15,524,660 17,436,615
Doubtful 18,773,461 15,064,642
34,298,121 32,501,257
Less: Provision for doubtful trade receivables 18,773,461 15,064,642
15,524,660 17,436,615
Other Trade receivables
Unsecured, considered good 375,518,498 311,706,569
TOTAL 391,043,158 329,143,184
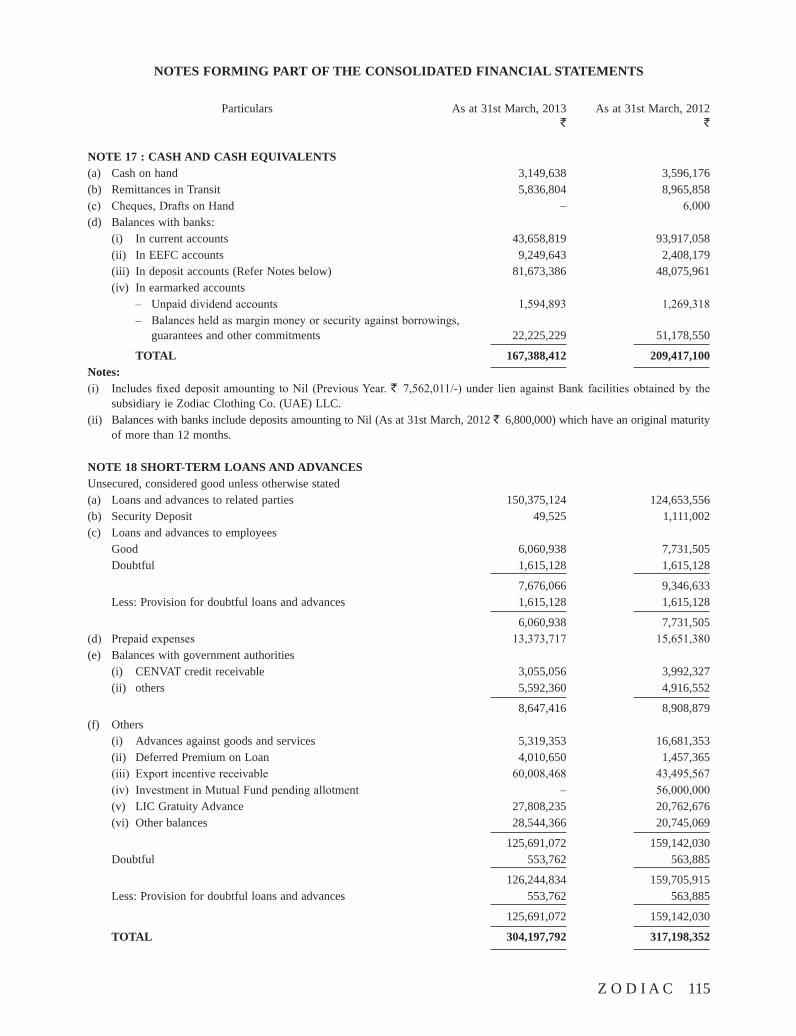
Z O D I A C 115
NOTES FORMING PART OF THE CONSOLIDATED FINANCIAL STATEMENTS
Particulars As at 31st March, 2013 As at 31st March, 2012 ` `
NOTE 17 : CASH AND CASH EQUIVALENTS(a) Cash on hand 3,149,638 3,596,176(b) Remittances in Transit 5,836,804 8,965,858(c) Cheques, Drafts on Hand – 6,000(d) Balances with banks: (i) In current accounts 43,658,819 93,917,058 (ii) In EEFC accounts 9,249,643 2,408,179 (iii) In deposit accounts (Refer Notes below) 81,673,386 48,075,961 (iv) In earmarked accounts – Unpaid dividend accounts 1,594,893 1,269,318 – Balances held as margin money or security against borrowings, guarantees and other commitments 22,225,229 51,178,550
TOTAL 167,388,412 209,417,100Notes:(i) Includes fixed deposit amounting to Nil (Previous Year. ` 7,562,011/-) under lien against Bank facilities obtained by the
subsidiary ie Zodiac Clothing Co. (UAE) LLC.(ii) Balances with banks include deposits amounting to Nil (As at 31st March, 2012 ` 6,800,000) which have an original maturity
of more than 12 months.
NOTE 18 SHORT-TERM LOANS AND ADVANCESUnsecured, considered good unless otherwise stated(a) Loans and advances to related parties 150,375,124 124,653,556(b) Security Deposit 49,525 1,111,002(c) Loans and advances to employees Good 6,060,938 7,731,505 Doubtful 1,615,128 1,615,128
7,676,066 9,346,633 Less: Provision for doubtful loans and advances 1,615,128 1,615,128
6,060,938 7,731,505(d) Prepaid expenses 13,373,717 15,651,380(e) Balances with government authorities (i) CENVAT credit receivable 3,055,056 3,992,327 (ii) others 5,592,360 4,916,552
8,647,416 8,908,879(f) Others (i) Advances against goods and services 5,319,353 16,681,353 (ii) Deferred Premium on Loan 4,010,650 1,457,365 (iii) Export incentive receivable 60,008,468 43,495,567 (iv) Investment in Mutual Fund pending allotment – 56,000,000 (v) LIC Gratuity Advance 27,808,235 20,762,676 (vi) Other balances 28,544,366 20,745,069
125,691,072 159,142,030 Doubtful 553,762 563,885
126,244,834 159,705,915 Less: Provision for doubtful loans and advances 553,762 563,885
125,691,072 159,142,030
TOTAL 304,197,792 317,198,352
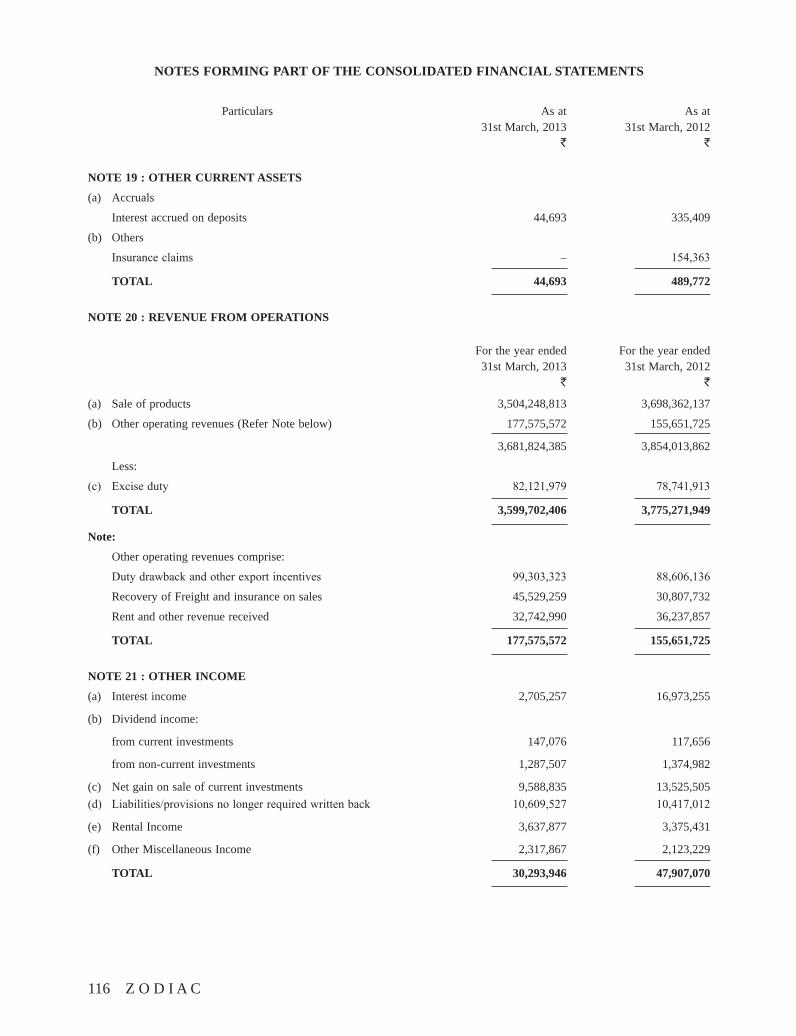
116 Z O D I A C
NOTES FORMING PART OF THE CONSOLIDATED FINANCIAL STATEMENTS
Particulars As at As at 31st March, 2013 31st March, 2012 ` `
NOTE 19 : OTHER CURRENT ASSETS
(a) Accruals
Interest accrued on deposits 44,693 335,409
(b) Others
Insurance claims – 154,363
TOTAL 44,693 489,772
NOTE 20 : REVENUE FROM OPERATIONS
For the year ended For the year ended 31st March, 2013 31st March, 2012 ` `
(a) Sale of products 3,504,248,813 3,698,362,137
(b) Other operating revenues (Refer Note below) 177,575,572 155,651,725
3,681,824,385 3,854,013,862
Less:
(c) Excise duty 82,121,979 78,741,913
TOTAL 3,599,702,406 3,775,271,949
Note:
Other operating revenues comprise:
Duty drawback and other export incentives 99,303,323 88,606,136
Recovery of Freight and insurance on sales 45,529,259 30,807,732
Rent and other revenue received 32,742,990 36,237,857
TOTAL 177,575,572 155,651,725
NOTE 21 : OTHER INCOME
(a) Interest income 2,705,257 16,973,255
(b) Dividend income:
from current investments 147,076 117,656
from non-current investments 1,287,507 1,374,982
(c) Net gain on sale of current investments 9,588,835 13,525,505(d) Liabilities/provisions no longer required written back 10,609,527 10,417,012
(e) Rental Income 3,637,877 3,375,431
(f) Other Miscellaneous Income 2,317,867 2,123,229
TOTAL 30,293,946 47,907,070
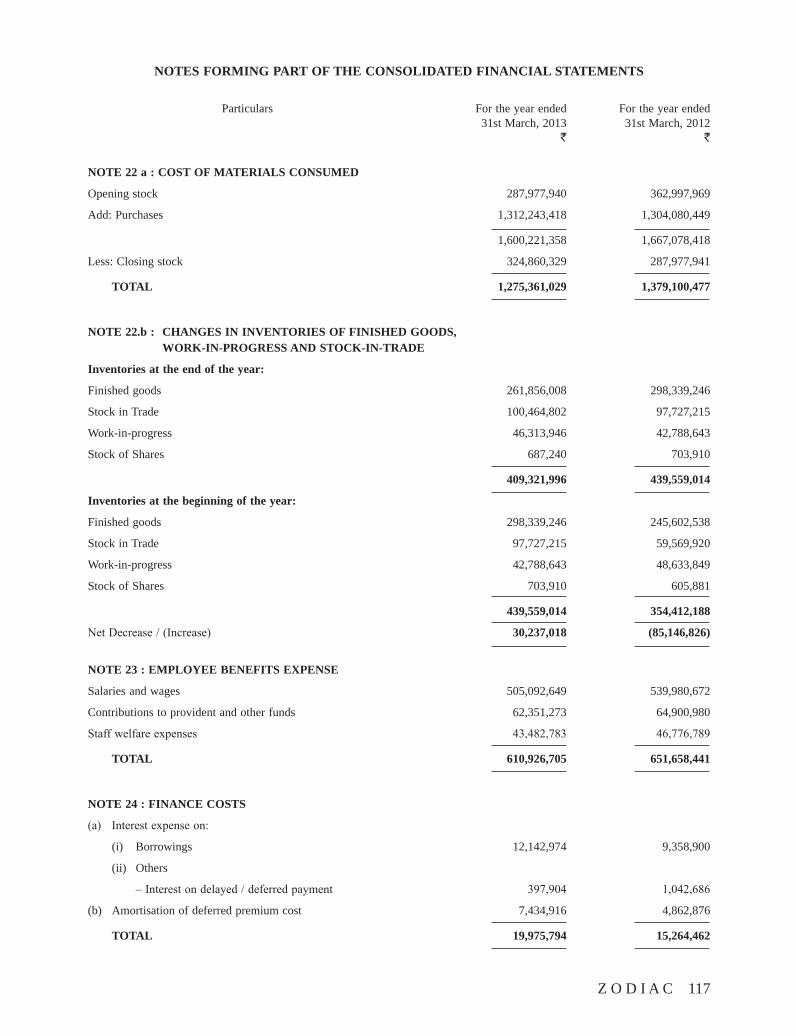
Z O D I A C 117
NOTES FORMING PART OF THE CONSOLIDATED FINANCIAL STATEMENTS
Particulars For the year ended For the year ended 31st March, 2013 31st March, 2012 ` `
NOTE 22 a : COST OF MATERIALS CONSUMED
Opening stock 287,977,940 362,997,969
Add: Purchases 1,312,243,418 1,304,080,449
1,600,221,358 1,667,078,418
Less: Closing stock 324,860,329 287,977,941
TOTAL 1,275,361,029 1,379,100,477
NOTE 22.b : CHANGES IN INVENTORIES OF FINISHED GOODS, WORK-IN-PROGRESS AND STOCK-IN-TRADE
Inventories at the end of the year:
Finished goods 261,856,008 298,339,246
Stock in Trade 100,464,802 97,727,215
Work-in-progress 46,313,946 42,788,643
Stock of Shares 687,240 703,910
409,321,996 439,559,014
Inventories at the beginning of the year:
Finished goods 298,339,246 245,602,538
Stock in Trade 97,727,215 59,569,920
Work-in-progress 42,788,643 48,633,849
Stock of Shares 703,910 605,881
439,559,014 354,412,188
Net Decrease / (Increase) 30,237,018 (85,146,826)
NOTE 23 : EMPLOYEE BENEFITS EXPENSE
Salaries and wages 505,092,649 539,980,672
Contributions to provident and other funds 62,351,273 64,900,980
Staff welfare expenses 43,482,783 46,776,789
TOTAL 610,926,705 651,658,441
NOTE 24 : FINANCE COSTS
(a) Interest expense on:
(i) Borrowings 12,142,974 9,358,900
(ii) Others
– Interest on delayed / deferred payment 397,904 1,042,686
(b) Amortisation of deferred premium cost 7,434,916 4,862,876
TOTAL 19,975,794 15,264,462
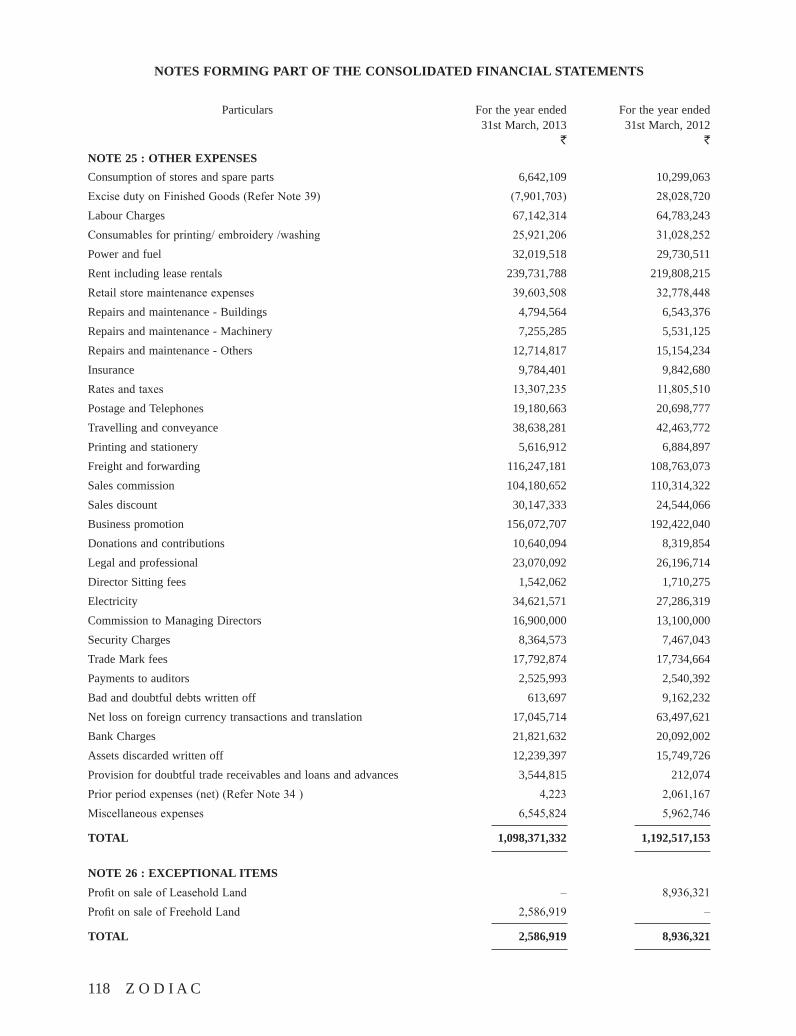
118 Z O D I A C
NOTES FORMING PART OF THE CONSOLIDATED FINANCIAL STATEMENTS
Particulars For the year ended For the year ended 31st March, 2013 31st March, 2012 ` `
NOTE 25 : OTHER EXPENSESConsumption of stores and spare parts 6,642,109 10,299,063Excise duty on Finished Goods (Refer Note 39) (7,901,703) 28,028,720Labour Charges 67,142,314 64,783,243Consumables for printing/ embroidery /washing 25,921,206 31,028,252Power and fuel 32,019,518 29,730,511Rent including lease rentals 239,731,788 219,808,215Retail store maintenance expenses 39,603,508 32,778,448Repairs and maintenance - Buildings 4,794,564 6,543,376Repairs and maintenance - Machinery 7,255,285 5,531,125Repairs and maintenance - Others 12,714,817 15,154,234Insurance 9,784,401 9,842,680Rates and taxes 13,307,235 11,805,510Postage and Telephones 19,180,663 20,698,777Travelling and conveyance 38,638,281 42,463,772Printing and stationery 5,616,912 6,884,897Freight and forwarding 116,247,181 108,763,073Sales commission 104,180,652 110,314,322Sales discount 30,147,333 24,544,066Business promotion 156,072,707 192,422,040Donations and contributions 10,640,094 8,319,854Legal and professional 23,070,092 26,196,714Director Sitting fees 1,542,062 1,710,275Electricity 34,621,571 27,286,319Commission to Managing Directors 16,900,000 13,100,000Security Charges 8,364,573 7,467,043Trade Mark fees 17,792,874 17,734,664Payments to auditors 2,525,993 2,540,392Bad and doubtful debts written off 613,697 9,162,232Net loss on foreign currency transactions and translation 17,045,714 63,497,621Bank Charges 21,821,632 20,092,002Assets discarded written off 12,239,397 15,749,726Provision for doubtful trade receivables and loans and advances 3,544,815 212,074Prior period expenses (net) (Refer Note 34 ) 4,223 2,061,167Miscellaneous expenses 6,545,824 5,962,746
TOTAL 1,098,371,332 1,192,517,153
NOTE 26 : EXCEPTIONAL ITEMSProfit on sale of Leasehold Land – 8,936,321Profit on sale of Freehold Land 2,586,919 –
TOTAL 2,586,919 8,936,321
Z O D I A C 119
27) Contingent Liabilities:-
a) Guarantee issued by the Bank and counter guaranteed by the Company: ` 26,696,129/- (Previous year ` 29,318,998/-)
b) Foreign letters of Credits opened by Bank and counter guaranteed by the Company: ` 33,769,425/- (Previous year ` 33,804,442/-)
c) Foreign bills/ Letters of Credit discounted with Bank ` 12,346,148/- ( Previous year ` 29,787,556/- )
d) Disputed demand not provided for in respect of: -
Current Previous year Year ` `
1) Income Tax 145,017,945 108,190,480
2) Sales Tax 11,229,872 11,229,872
3) Apparel Export Promotion Council for non fulfillment of export obligation against duty free imports 2,190,575 2,980,050
e) Claims against the Company not acknowledged as debts ` 730,841/- (Previous Year ` 1,066,310)
f) Labour disputes not acknowledged as debts: Amount not ascertainable.
Note:- In respect of items mentioned above, till the matters are finally decided, the financial effect cannot be ascertained.
g) Significant Capital Commitment in respect of contribution in Venture Capital Funds amounting to ` 86,014,276/-(Previous Year ` 102,897,107/-).
28) Estimated amount of contracts remaining to be executed on capital account and not provided for ` 28,290,352/- ( Previous year ` 62,809,263/- )
29) The amount of premium on forward exchange contracts to be recognised in the Statement of Profit and Loss in the next financial year is ` 4,010,650/- (Previous Year ` 1,457,365/-)
30) Operating Leases: -
A)PremisesTakenOnLease
a) The Company has taken various offices/shops under operating lease or leave
and license agreements. These are non cancelable during a lock in period which ranges between 11 months to 3 years under leave and license agreements and are renewable by mutual consent on mutually agreeable terms.
b) Lease Payments recognized in the Statement of Profit & Loss under rent in Note 25 includes ` 239,520,799/- - (Previous Year: ` 219,808,215/-) in respect of premises taken on lease.
c) The future minimum lease payments under non-cancelable operating lease :
(i) no t l a te r than one year i s ` 7,309,130/-(Previous Year: ` 37,112,888/-); and
(ii) Later than one year and not later than five years is ` 559,930/- (Previous Year: ` 15,449,296/-).
(iii) Later than five years ` Nil (Previous Year : Nil).
B) Premises Given On Lease
a) The Company has given its premises under operating lease on leave and licence basis. These are cancelable lease and the period ranges between 11 months to 3 years under leave and licence agreements and renewable by mutual consent on mutually agreed terms.
b) Lease rentals recognized in the Statement of Profit & Loss under Rent in Note 20 and 21 is ` 31,908,977/- (Previous Year ` 31,646,531/-)
c) The future minimum Lease rentals under non-cancelable operating leases:
(i) Not la te r than one year i s ` 28,271,100/-(Previous Year ` Nil)
(ii) Later than one year and not later than 5 year ` 7,067,775/- (Previous Year : ` Nil)
(iii) Later than 5 years ` Nil (Previous Year: ` Nil)
d) Premises given on licence basis including Investment Property:-
Gross Carrying amount ` 555,704,733/- (Previous Year ` 375,968,623/-)
Accumulated Depreciation ` 48,635,718/- (Previous Year ` 34,972,115/-)
Depreciation for the year ` 9,039,125/- (PreviousYear 6,128,289/-)
120 Z O D I A C
31) Deferred Tax: -
As at As at 31.03.2013 31.03.2012 ` `
Deferred Tax Liability on account of:
Depreciation and amortisation 48,206,366 39,814,722
48,206,366 39,814,722
Deferred Tax Assets on account of:
(i) Employee benefits disallowed u/s 43B 22,242 24,99,442
(ii) Provision for Retirement Benefit 4,049,506 3,240,158
(iii) Provision for Doubtful Debts & Advances 6,151,039 47,24,616
10,222,787 10,464,216
Deferred Tax Liabilities (Net) 37,983,579 29,350,506
32) Related Party Disclosures: -
Related party disclosures as required by (AS-18) “Related Party Disclosures” are given below:
1. Relationships: -
(a) Key Management Personnel: -
Mr. M. Y. Noorani
Mr. A. Y. Noorani
Mr. S. Y. Noorani
(b) Other Related Parties:-
i. The enterprises where control of key management personnel and/or their relatives exist and with whom the transactions have taken place : -
Zodiac Metropolitan Clothing Gmbh Asia Tangible Investments Pte. Ltd. Metropolitan Trading Company Montage Corporation Munraz Enterprises Mariambai & Haji Noor Mohamad Noorani Foundation Trust Mustang Manufacturing Company Mashal Enterprises Elite Clothing Co.Pvt Ltd Euro Global Holding Pte Ltd Milano Apparel Pvt Ltd Onward LLC Zodiac UAE LLC Miraj Marketing Company LLP
ii. Relatives of key management personnel with whom the transactions have taken place : -
Mr. Awais A. Noorani
Mr. Musaed A. Noorani
Mrs. Muna A. Noorani
Mrs Zehra .S.Noorani
Mrs Saniyya A.Noorani
Note: Related party relationship is as identified by the Company and relied upon by the Auditors.
Z O D I A C 121
ii. The following transactions were carried out with the related parties in the ordinary course of business.
(Previous year figures are in brackets)
Key Other Management Related Personnel Parties Total
` ` `
Sale of GoodsOnward LLC – 100,911,352 100,911,352 (-) (160,377,002) (160,377,002)Mashal Enterprises – 6,827,490 6,827,490 (-) (7,047,227) (7,047,227)Zodiac Metropolitan Clothing Gmbh – 204,426,314 204,426,314 (-) (297,729,721) (297,729,721)
Purchases of Goods and Materials AccruedZodiac Metropolitan Clothing Gmbh – 2,341,934 2,341,934 (-) (6,388,754) (6,388,754)Onward LLC – 109,505,352 109,505,352 (-) (177,871,884) (177,871,884)
Interest IncomeZodiac Metropolitan Clothing Gmbh – Nil Nil (-) (14,836,017) (14,836,017)
Interest PaidElite Clothing Co. Pvt. Ltd. – 1,097,195 1,097,195 (-) (135,745) (135,745)
Export Claims Zodiac Metropolitan Clothing Gmbh – 12,519,214 12,519,214 (-) (-) (-)
TradeMarkfeesAccrued Metropolitan Trading Company – 19,928,766 19,928,766 (-) (19,421,503) (19,421,503)
Rent AccruedMetropolitan Trading Company – 14,193,066 14,193,066 (-) (20,364,456) (20,364,456)Mustang Manufacturing Company – 207,600 207,600 (-) (207,600) (207,600)Munraz Enterprises – 388,800 388,800 (-) (388,800) (388,800)Montage Corporation – 62,316 62,316 (-) (62,616) (62,616)Miraj Marketing Company LLP – 1,089,888 1,089,888 (-) (825,000) (825,000)Mr. A.Y. Noorani 473,700 – 473,700 (433,405) (-) (433,405)Mr. S.Y. Noorani 473,700 – 473,700 (433,405) (-) (433,405)Mr. M.Y. Noorani 133,056 – 133,056 (133,056) (-) (133,056)
Salary PaidMr.Awais A.Noorani – 3,998,060 3,998,060 (-) (4,709,059) (4,709,059)
122 Z O D I A C
Expenses Recovered
Mashal Enterprises – 558,218 558,218 (-) (525,923) (525,923)Munraz Enterprises – 2,500 2,500 (-) (3,390) (3,390)Metropolitan Trading Company – 1,627,712 1,627,712 (-) (788,259) (788,259)Zodiac Metropolitan Clothing GmbH – 134,542 134,542 (-) (-) (-)Miraj Marketing Company LLP – – – (-) (3,000) (3,000)Milano Apparels Pvt. Ltd. – – – (-) (3,000) (3,000)Mustang Manufacturing Company – – – (-) (3,000) (3,000)Montage Corporation – – – (-) (3,000) (3,000)Elite Clothing Co. Pvt. Ltd. – – – (-) (3,000) (3,000)Onward LLC – 7,816,182 7,816,182 (-) (9,884,732) (9,884,732)
Other Income Received
Zodiac Metropolitan Clothing Gmbh – 6,181,246 6,181,246 (-) (9,412,877) (9,412,877)
Onward LLC – 1,423,305 1,423,305 (-) (363,310) (363,310)
Expenses ReimbursedMetropolitan Trading Company – 39,963 39,963 (-) (2,910) (2,910)Mashal Enterprises – 226,696 226,696 (-) (143,384) (143,384)Munraz Enterprises – 342,120 342,120 (-) (342,331) (342,331)Zodiac Metropolitan Clothing Gmbh – 9,902,030 9,902,030 (-) (2,758,292) (2,758,292)Onward LLC – 3,844,932 3,844,932 (-) (6,864,502) (6,864,502)
Loans Repaid byZodiac Metropolitan Clothing Gmbh – 122,183,155 122,183,155 (-) (168,034,812) (168,034,812)
Loan Paid toZodiac Metropolitan Clothing Gmbh – 156,439,940 156,439,940 (-) (180,032,598) (180,032,598)Onward LLC – 28,849,291 28,849,291 (-) (20,944,924) (20,944,924)
Key Other Management Related Total Personnel Parties ` ` `
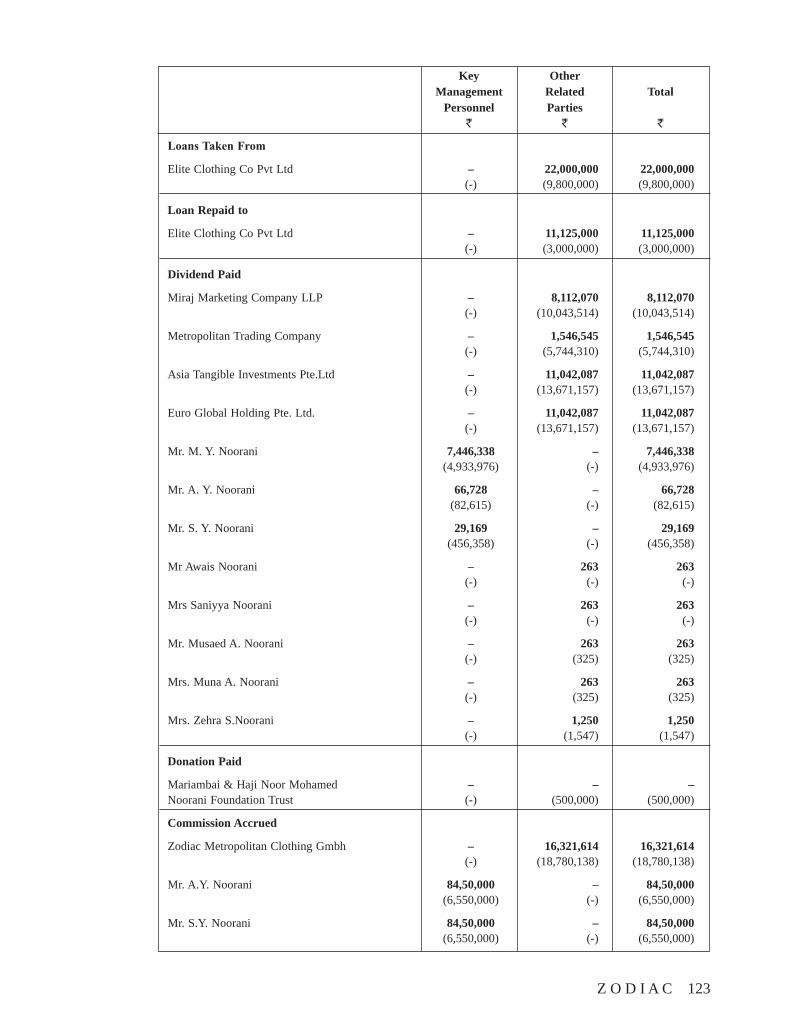
Z O D I A C 123
LoansTakenFrom
Elite Clothing Co Pvt Ltd – 22,000,000 22,000,000 (-) (9,800,000) (9,800,000)
Loan Repaid to
Elite Clothing Co Pvt Ltd – 11,125,000 11,125,000 (-) (3,000,000) (3,000,000)
Dividend Paid
Miraj Marketing Company LLP – 8,112,070 8,112,070 (-) (10,043,514) (10,043,514)
Metropolitan Trading Company – 1,546,545 1,546,545 (-) (5,744,310) (5,744,310)
Asia Tangible Investments Pte.Ltd – 11,042,087 11,042,087 (-) (13,671,157) (13,671,157)
Euro Global Holding Pte. Ltd. – 11,042,087 11,042,087 (-) (13,671,157) (13,671,157)
Mr. M. Y. Noorani 7,446,338 – 7,446,338 (4,933,976) (-) (4,933,976)
Mr. A. Y. Noorani 66,728 – 66,728 (82,615) (-) (82,615)
Mr. S. Y. Noorani 29,169 – 29,169 (456,358) (-) (456,358)
Mr Awais Noorani – 263 263 (-) (-) (-)
Mrs Saniyya Noorani – 263 263 (-) (-) (-)
Mr. Musaed A. Noorani – 263 263 (-) (325) (325)
Mrs. Muna A. Noorani – 263 263 (-) (325) (325)
Mrs. Zehra S.Noorani – 1,250 1,250 (-) (1,547) (1,547)
Donation Paid
Mariambai & Haji Noor Mohamed – – – Noorani Foundation Trust (-) (500,000) (500,000)
Commission Accrued
Zodiac Metropolitan Clothing Gmbh – 16,321,614 16,321,614 (-) (18,780,138) (18,780,138)
Mr. A.Y. Noorani 84,50,000 – 84,50,000 (6,550,000) (-) (6,550,000)
Mr. S.Y. Noorani 84,50,000 – 84,50,000 (6,550,000) (-) (6,550,000)
Key Other Management Related Total Personnel Parties ` ` `
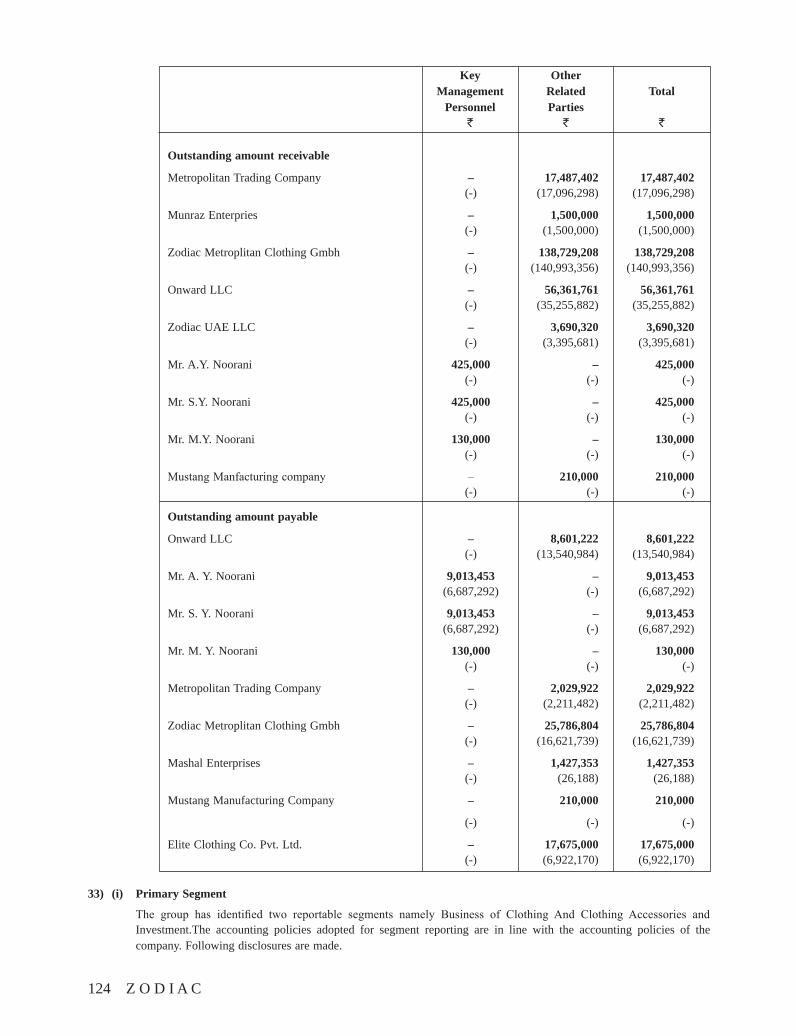
124 Z O D I A C
Outstanding amount receivable
Metropolitan Trading Company – 17,487,402 17,487,402 (-) (17,096,298) (17,096,298)
Munraz Enterpries – 1,500,000 1,500,000 (-) (1,500,000) (1,500,000)
Zodiac Metroplitan Clothing Gmbh – 138,729,208 138,729,208 (-) (140,993,356) (140,993,356)
Onward LLC – 56,361,761 56,361,761 (-) (35,255,882) (35,255,882)
Zodiac UAE LLC – 3,690,320 3,690,320 (-) (3,395,681) (3,395,681)
Mr. A.Y. Noorani 425,000 – 425,000 (-) (-) (-)
Mr. S.Y. Noorani 425,000 – 425,000 (-) (-) (-)
Mr. M.Y. Noorani 130,000 – 130,000 (-) (-) (-)
Mustang Manfacturing company – 210,000 210,000 (-) (-) (-)
Outstanding amount payable
Onward LLC – 8,601,222 8,601,222 (-) (13,540,984) (13,540,984)
Mr. A. Y. Noorani 9,013,453 – 9,013,453 (6,687,292) (-) (6,687,292)
Mr. S. Y. Noorani 9,013,453 – 9,013,453 (6,687,292) (-) (6,687,292)
Mr. M. Y. Noorani 130,000 – 130,000 (-) (-) (-)
Metropolitan Trading Company – 2,029,922 2,029,922 (-) (2,211,482) (2,211,482)
Zodiac Metroplitan Clothing Gmbh – 25,786,804 25,786,804 (-) (16,621,739) (16,621,739)
Mashal Enterprises – 1,427,353 1,427,353 (-) (26,188) (26,188)
Mustang Manufacturing Company – 210,000 210,000
(-) (-) (-)
Elite Clothing Co. Pvt. Ltd. – 17,675,000 17,675,000 (-) (6,922,170) (6,922,170)
33) (i) Primary Segment
The group has identified two reportable segments namely Business of Clothing And Clothing Accessories and Investment.The accounting policies adopted for segment reporting are in line with the accounting policies of the company. Following disclosures are made.
Key Other Management Related Total Personnel Parties ` ` `
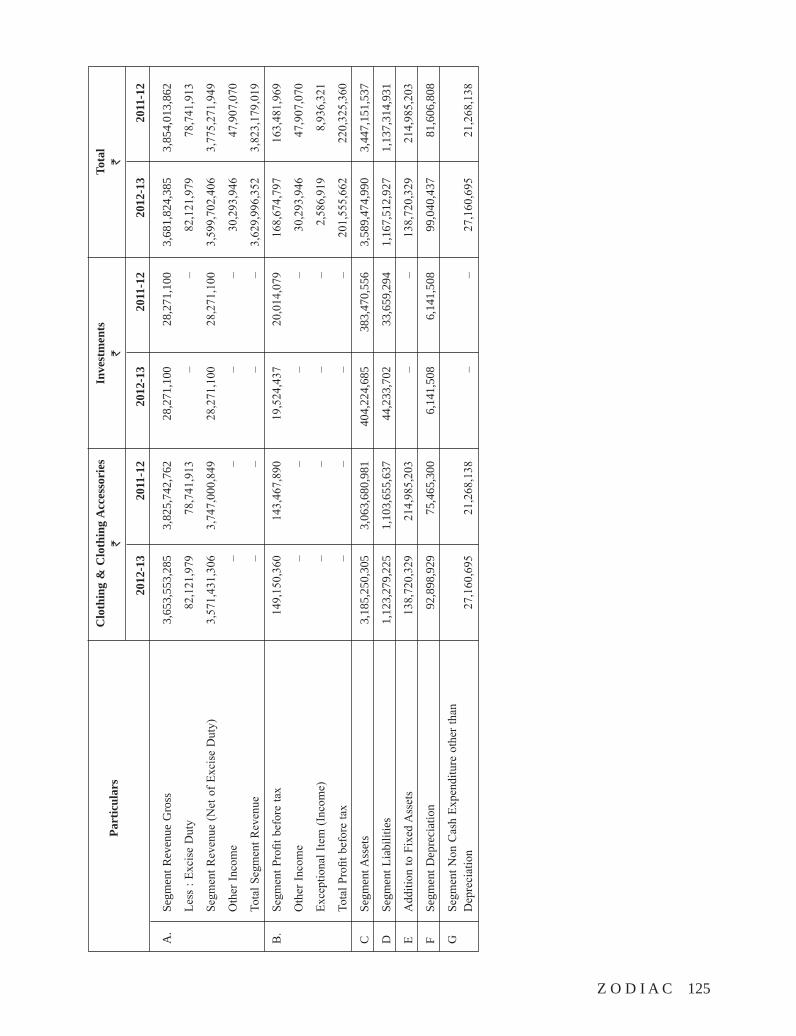
Z O D I A C 125
Pa
rtic
ular
s C
loth
ing
& C
loth
ing
Acc
esso
ries
In
vest
men
ts
Tota
l
`
` `
2012
-13
2011
-12
2012
-13
2011
-12
2012
-13
2011
-12
A.
Segm
ent R
even
ue G
ross
3,
653,
553,
285
3,82
5,74
2,76
2 28
,271
,100
28
,271
,100
3,
681,
824,
385
3,85
4,01
3,86
2
Le
ss :
Exci
se D
uty
82,1
21,9
79
78,7
41,9
13
– –
82,1
21,9
79
78,7
41,9
13
Se
gmen
t Rev
enue
(Net
of E
xcis
e D
uty)
3,
571,
431,
306
3,74
7,00
0,84
9 28
,271
,100
28
,271
,100
3,
599,
702,
406
3,77
5,27
1,94
9
O
ther
Inco
me
– –
– –
30,2
93,9
46
47,9
07,0
70
To
tal S
egm
ent R
even
ue
– –
– –
3,62
9,99
6,35
2 3,
823,
179,
019
B.
Segm
ent P
rofit
bef
ore
tax
149,
150,
360
143,
467,
890
19,5
24,4
37
20,0
14,0
79
168,
674,
797
163,
481,
969
O
ther
Inco
me
– –
– –
30,2
93,9
46
47,9
07,0
70
Ex
cept
iona
l Ite
m (I
ncom
e)
– –
– –
2,58
6,91
9 8,
936,
321
To
tal P
rofit
bef
ore
tax
– –
– –
201,
555,
662
220,
325,
360
C
Segm
ent A
sset
s 3,
185,
250,
305
3,06
3,68
0,98
1 40
4,22
4,68
5 38
3,47
0,55
6 3,
589,
474,
990
3,44
7,15
1,53
7
D
Segm
ent L
iabi
litie
s 1,
123,
279,
225
1,10
3,65
5,63
7 44
,233
,702
33
,659
,294
1,
167,
512,
927
1,13
7,31
4,93
1
E A
dditi
on to
Fix
ed A
sset
s 13
8,72
0,32
9 21
4,98
5,20
3 –
– 13
8,72
0,32
9 21
4,98
5,20
3
F Se
gmen
t Dep
reci
atio
n 92
,898
,929
75
,465
,300
6,
141,
508
6,14
1,50
8 99
,040
,437
81
,606
,808
G
Segm
ent N
on C
ash
Expe
nditu
re o
ther
than
Dep
reci
atio
n 27
,160
,695
21
,268
,138
–
–
27
,160
,695
2
1,26
8,13
8
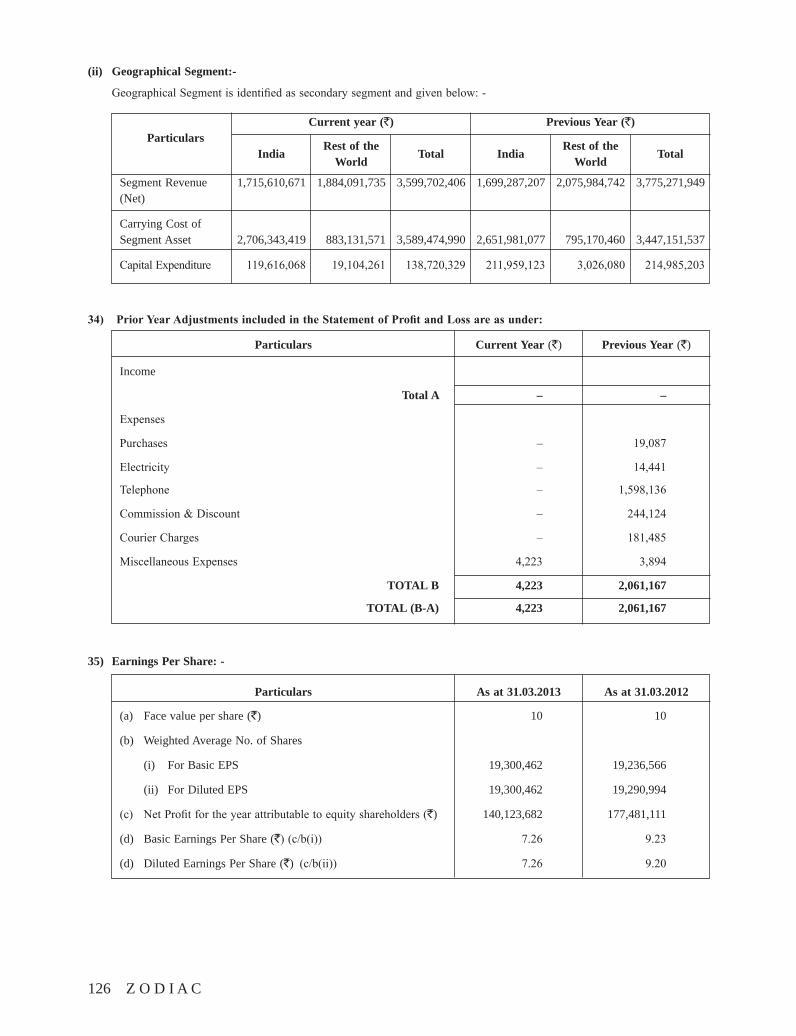
126 Z O D I A C
(ii) Geographical Segment:-
Geographical Segment is identified as secondary segment and given below: -
Current year (`) Previous Year (`)
Particulars
India
Rest of the Total India
Rest of the Total
World World
Segment Revenue 1,715,610,671 1,884,091,735 3,599,702,406 1,699,287,207 2,075,984,742 3,775,271,949 (Net)
Carrying Cost of Segment Asset 2,706,343,419 883,131,571 3,589,474,990 2,651,981,077 795,170,460 3,447,151,537
Capital Expenditure 119,616,068 19,104,261 138,720,329 211,959,123 3,026,080 214,985,203
34) PriorYearAdjustmentsincludedintheStatementofProfitandLossareasunder:
Particulars Current Year (`) Previous Year (`)
Income
Total A – –
Expenses
Purchases – 19,087
Electricity – 14,441
Telephone – 1,598,136
Commission & Discount – 244,124
Courier Charges – 181,485
Miscellaneous Expenses 4,223 3,894
TOTAL B 4,223 2,061,167
TOTAL (B-A) 4,223 2,061,167
35) Earnings Per Share: -
Particulars As at 31.03.2013 As at 31.03.2012
(a) Face value per share (`) 10 10
(b) Weighted Average No. of Shares
(i) For Basic EPS 19,300,462 19,236,566
(ii) For Diluted EPS 19,300,462 19,290,994
(c) Net Profit for the year attributable to equity shareholders (`) 140,123,682 177,481,111
(d) Basic Earnings Per Share (`) (c/b(i)) 7.26 9.23
(d) Diluted Earnings Per Share (`) (c/b(ii)) 7.26 9.20
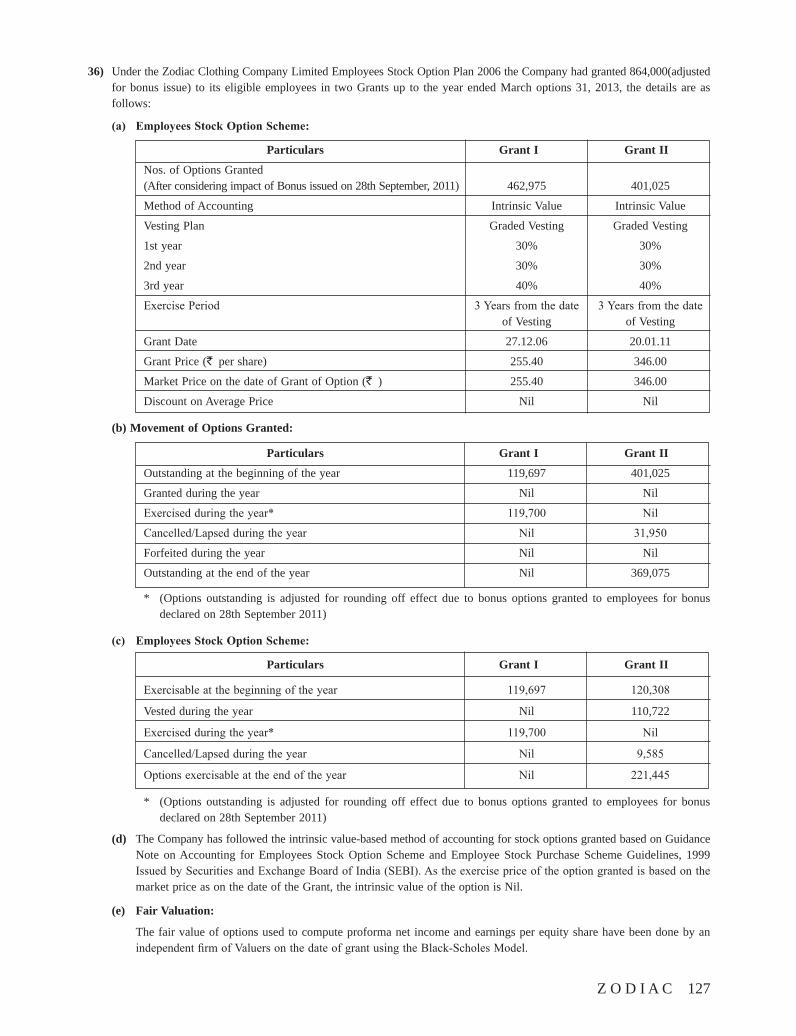
Z O D I A C 127
36) Under the Zodiac Clothing Company Limited Employees Stock Option Plan 2006 the Company had granted 864,000(adjusted for bonus issue) to its eligible employees in two Grants up to the year ended March options 31, 2013, the details are as follows:
(a) EmployeesStockOptionScheme:
Particulars Grant I Grant II
Nos. of Options Granted (After considering impact of Bonus issued on 28th September, 2011) 462,975 401,025
Method of Accounting Intrinsic Value Intrinsic Value
Vesting Plan Graded Vesting Graded Vesting
1st year 30% 30%
2nd year 30% 30%
3rd year 40% 40%
Exercise Period 3 Years from the date 3 Years from the date of Vesting of Vesting
Grant Date 27.12.06 20.01.11
Grant Price (` per share) 255.40 346.00
Market Price on the date of Grant of Option (` ) 255.40 346.00
Discount on Average Price Nil Nil
(b) Movement of Options Granted:
Particulars Grant I Grant II
Outstanding at the beginning of the year 119,697 401,025
Granted during the year Nil Nil
Exercised during the year* 119,700 Nil
Cancelled/Lapsed during the year Nil 31,950
Forfeited during the year Nil Nil
Outstanding at the end of the year Nil 369,075
* (Options outstanding is adjusted for rounding off effect due to bonus options granted to employees for bonus declared on 28th September 2011)
(c) EmployeesStockOptionScheme:
Particulars Grant I Grant II
Exercisable at the beginning of the year 119,697 120,308
Vested during the year Nil 110,722
Exercised during the year* 119,700 Nil
Cancelled/Lapsed during the year Nil 9,585
Options exercisable at the end of the year Nil 221,445
* (Options outstanding is adjusted for rounding off effect due to bonus options granted to employees for bonus declared on 28th September 2011)
(d) The Company has followed the intrinsic value-based method of accounting for stock options granted based on Guidance Note on Accounting for Employees Stock Option Scheme and Employee Stock Purchase Scheme Guidelines, 1999 Issued by Securities and Exchange Board of India (SEBI). As the exercise price of the option granted is based on the market price as on the date of the Grant, the intrinsic value of the option is Nil.
(e) Fair Valuation:
The fair value of options used to compute proforma net income and earnings per equity share have been done by an independent firm of Valuers on the date of grant using the Black-Scholes Model.
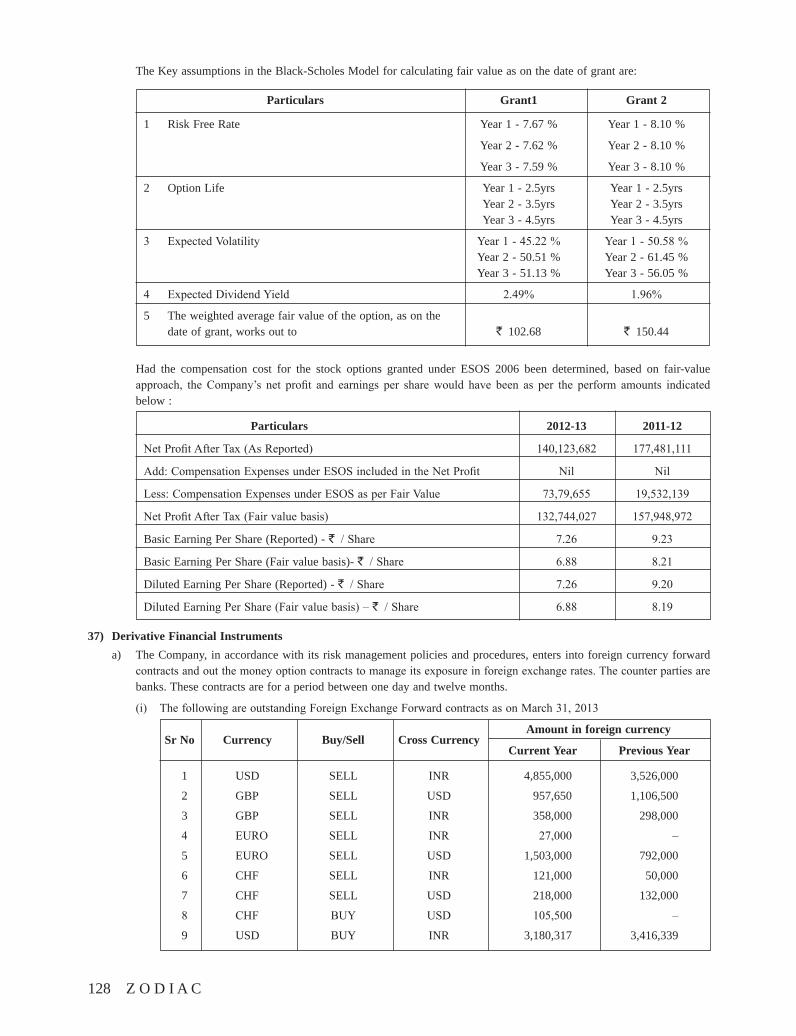
128 Z O D I A C
The Key assumptions in the Black-Scholes Model for calculating fair value as on the date of grant are:
Particulars Grant1 Grant 2
1 Risk Free Rate Year 1 - 7.67 % Year 1 - 8.10 %
Year 2 - 7.62 % Year 2 - 8.10 %
Year 3 - 7.59 % Year 3 - 8.10 %
2 Option Life Year 1 - 2.5yrs Year 1 - 2.5yrs Year 2 - 3.5yrs Year 2 - 3.5yrs Year 3 - 4.5yrs Year 3 - 4.5yrs
3 Expected Volatility Year 1 - 45.22 % Year 1 - 50.58 % Year 2 - 50.51 % Year 2 - 61.45 % Year 3 - 51.13 % Year 3 - 56.05 %
4 Expected Dividend Yield 2.49% 1.96%
5 The weighted average fair value of the option, as on the date of grant, works out to ` 102.68 ` 150.44
Had the compensation cost for the stock options granted under ESOS 2006 been determined, based on fair-value approach, the Company’s net profit and earnings per share would have been as per the perform amounts indicated below :
Particulars 2012-13 2011-12
Net Profit After Tax (As Reported) 140,123,682 177,481,111
Add: Compensation Expenses under ESOS included in the Net Profit Nil Nil
Less: Compensation Expenses under ESOS as per Fair Value 73,79,655 19,532,139
Net Profit After Tax (Fair value basis) 132,744,027 157,948,972
Basic Earning Per Share (Reported) - ` / Share 7.26 9.23
Basic Earning Per Share (Fair value basis)- ` / Share 6.88 8.21
Diluted Earning Per Share (Reported) - ` / Share 7.26 9.20
Diluted Earning Per Share (Fair value basis) – ` / Share 6.88 8.19
37) Derivative Financial Instrumentsa) The Company, in accordance with its risk management policies and procedures, enters into foreign currency forward
contracts and out the money option contracts to manage its exposure in foreign exchange rates. The counter parties are banks. These contracts are for a period between one day and twelve months.
(i) The following are outstanding Foreign Exchange Forward contracts as on March 31, 2013
Sr No Currency Buy/Sell Cross Currency
Amount in foreign currency
Current Year Previous Year
1 USD SELL INR 4,855,000 3,526,000
2 GBP SELL USD 957,650 1,106,500
3 GBP SELL INR 358,000 298,000
4 EURO SELL INR 27,000 –
5 EURO SELL USD 1,503,000 792,000
6 CHF SELL INR 121,000 50,000
7 CHF SELL USD 218,000 132,000
8 CHF BUY USD 105,500 –
9 USD BUY INR 3,180,317 3,416,339
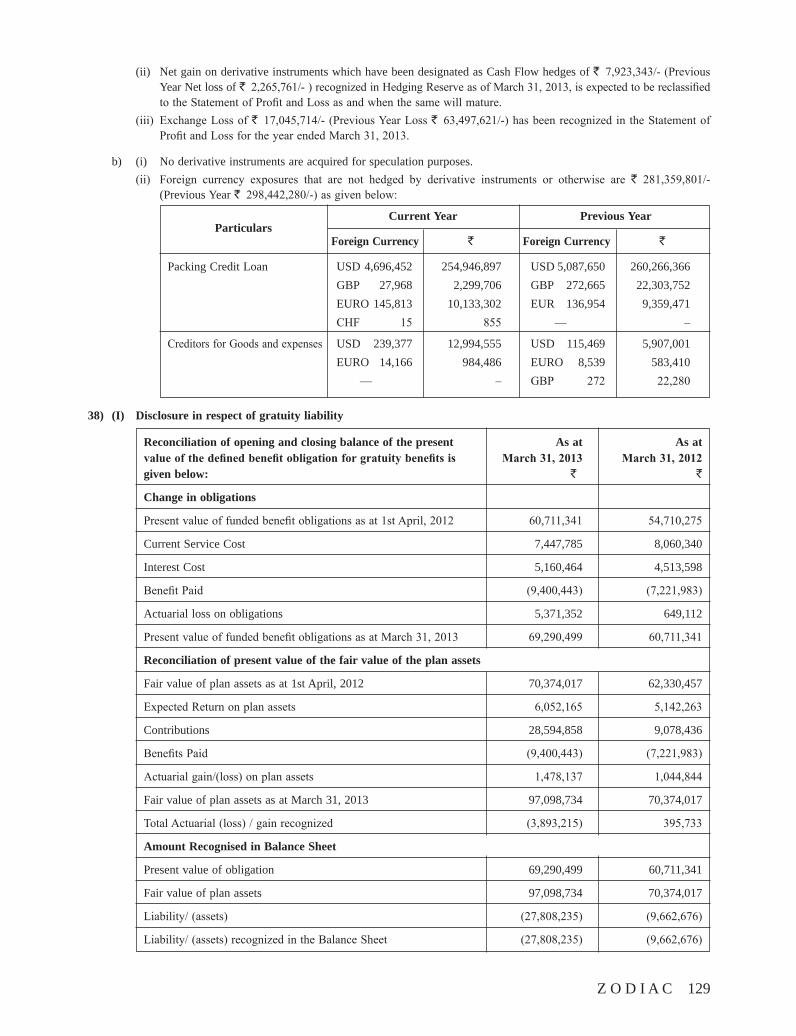
Z O D I A C 129
(ii) Net gain on derivative instruments which have been designated as Cash Flow hedges of ` 7,923,343/- (Previous Year Net loss of ` 2,265,761/- ) recognized in Hedging Reserve as of March 31, 2013, is expected to be reclassified to the Statement of Profit and Loss as and when the same will mature.
(iii) Exchange Loss of ` 17,045,714/- (Previous Year Loss ` 63,497,621/-) has been recognized in the Statement of Profit and Loss for the year ended March 31, 2013.
b) (i) No derivative instruments are acquired for speculation purposes. (ii) Foreign currency exposures that are not hedged by derivative instruments or otherwise are ` 281,359,801/-
(Previous Year ` 298,442,280/-) as given below:
Particulars
Current Year Previous Year
Foreign Currency ` Foreign Currency `
Packing Credit Loan USD 4,696,452 254,946,897 USD 5,087,650 260,266,366 GBP 27,968 2,299,706 GBP 272,665 22,303,752 EURO 145,813 10,133,302 EUR 136,954 9,359,471 CHF 15 855 — –
Creditors for Goods and expenses USD 239,377 12,994,555 USD 115,469 5,907,001 EURO 14,166 984,486 EURO 8,539 583,410 — – GBP 272 22,280
38) (I) Disclosure in respect of gratuity liability
Reconciliation of opening and closing balance of the present As at As at valueofthedefinedbenefitobligationforgratuitybenefitsis March31,2013 March31,2012 given below: ` `
Change in obligations
Present value of funded benefit obligations as at 1st April, 2012 60,711,341 54,710,275
Current Service Cost 7,447,785 8,060,340
Interest Cost 5,160,464 4,513,598
Benefit Paid (9,400,443) (7,221,983)
Actuarial loss on obligations 5,371,352 649,112
Present value of funded benefit obligations as at March 31, 2013 69,290,499 60,711,341
Reconciliation of present value of the fair value of the plan assets
Fair value of plan assets as at 1st April, 2012 70,374,017 62,330,457
Expected Return on plan assets 6,052,165 5,142,263
Contributions 28,594,858 9,078,436
Benefits Paid (9,400,443) (7,221,983)
Actuarial gain/(loss) on plan assets 1,478,137 1,044,844
Fair value of plan assets as at March 31, 2013 97,098,734 70,374,017
Total Actuarial (loss) / gain recognized (3,893,215) 395,733
Amount Recognised in Balance Sheet
Present value of obligation 69,290,499 60,711,341
Fair value of plan assets 97,098,734 70,374,017
Liability/ (assets) (27,808,235) (9,662,676)
Liability/ (assets) recognized in the Balance Sheet (27,808,235) (9,662,676)
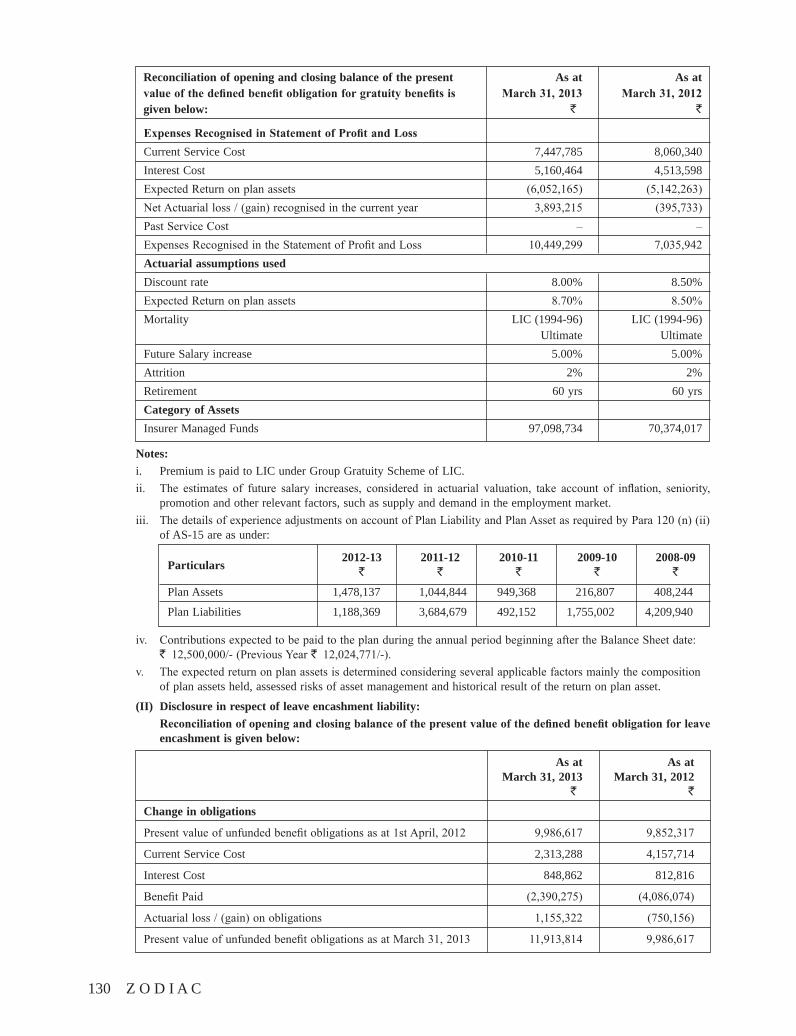
130 Z O D I A C
ExpensesRecognisedinStatementofProfitandLossCurrent Service Cost 7,447,785 8,060,340Interest Cost 5,160,464 4,513,598Expected Return on plan assets (6,052,165) (5,142,263)Net Actuarial loss / (gain) recognised in the current year 3,893,215 (395,733)Past Service Cost – –Expenses Recognised in the Statement of Profit and Loss 10,449,299 7,035,942Actuarial assumptions usedDiscount rate 8.00% 8.50%Expected Return on plan assets 8.70% 8.50%Mortality LIC (1994-96) LIC (1994-96) Ultimate UltimateFuture Salary increase 5.00% 5.00%Attrition 2% 2%Retirement 60 yrs 60 yrsCategory of AssetsInsurer Managed Funds 97,098,734 70,374,017
Notes:i. Premium is paid to LIC under Group Gratuity Scheme of LIC.ii. The estimates of future salary increases, considered in actuarial valuation, take account of inflation, seniority,
promotion and other relevant factors, such as supply and demand in the employment market.iii. The details of experience adjustments on account of Plan Liability and Plan Asset as required by Para 120 (n) (ii)
of AS-15 are as under:
Particulars 2012-13 2011-12 2010-11 2009-10 2008-09
` ` ` ` `
Plan Assets 1,478,137 1,044,844 949,368 216,807 408,244
Plan Liabilities 1,188,369 3,684,679 492,152 1,755,002 4,209,940
iv. Contributions expected to be paid to the plan during the annual period beginning after the Balance Sheet date: ` 12,500,000/- (Previous Year ` 12,024,771/-).
v. The expected return on plan assets is determined considering several applicable factors mainly the composition of plan assets held, assessed risks of asset management and historical result of the return on plan asset.
(II) Disclosure in respect of leave encashment liability: Reconciliationofopeningandclosingbalanceofthepresentvalueofthedefinedbenefitobligationforleave
encashment is given below:
As at As at March 31, 2013 March 31, 2012 ` `
Change in obligations
Present value of unfunded benefit obligations as at 1st April, 2012 9,986,617 9,852,317
Current Service Cost 2,313,288 4,157,714
Interest Cost 848,862 812,816
Benefit Paid (2,390,275) (4,086,074)
Actuarial loss / (gain) on obligations 1,155,322 (750,156)
Present value of unfunded benefit obligations as at March 31, 2013 11,913,814 9,986,617
Reconciliation of opening and closing balance of the present As at As at valueofthedefinedbenefitobligationforgratuitybenefitsis March31,2013 March31,2012 given below: ` `
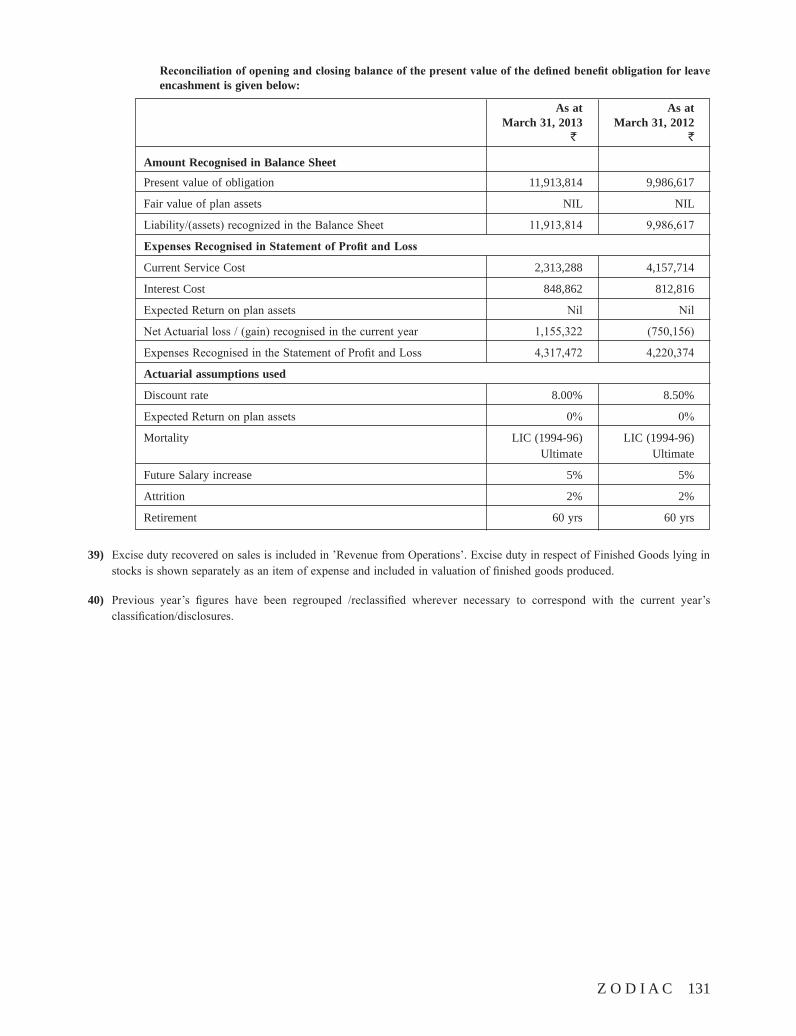
Z O D I A C 131
Reconciliationofopeningandclosingbalanceofthepresentvalueofthedefinedbenefitobligationforleaveencashment is given below:
As at As at March 31, 2013 March 31, 2012 ` `
Amount Recognised in Balance Sheet
Present value of obligation 11,913,814 9,986,617
Fair value of plan assets NIL NIL
Liability/(assets) recognized in the Balance Sheet 11,913,814 9,986,617
ExpensesRecognisedinStatementofProfitandLoss
Current Service Cost 2,313,288 4,157,714
Interest Cost 848,862 812,816
Expected Return on plan assets Nil Nil
Net Actuarial loss / (gain) recognised in the current year 1,155,322 (750,156)
Expenses Recognised in the Statement of Profit and Loss 4,317,472 4,220,374
Actuarial assumptions used
Discount rate 8.00% 8.50%
Expected Return on plan assets 0% 0%
Mortality LIC (1994-96) LIC (1994-96) Ultimate Ultimate
Future Salary increase 5% 5%
Attrition 2% 2%
Retirement 60 yrs 60 yrs
39) Excise duty recovered on sales is included in ’Revenue from Operations’. Excise duty in respect of Finished Goods lying in stocks is shown separately as an item of expense and included in valuation of finished goods produced.
40) Previous year’s figures have been regrouped /reclassified wherever necessary to correspond with the current year’s classification/disclosures.
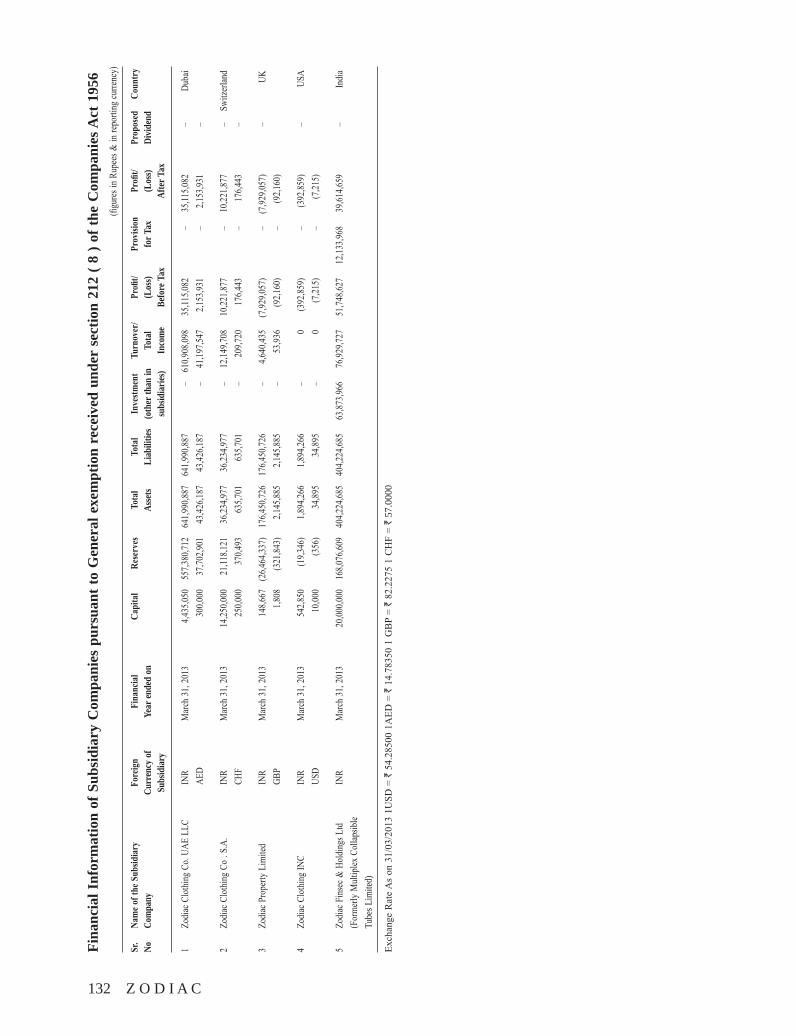
132 Z O D I A C
Fina
ncia
l Inf
orm
atio
n of
Sub
sidi
ary
Com
pani
es p
ursu
ant t
o G
ener
al e
xem
ptio
n re
ceiv
ed u
nder
sec
tion
212
( 8 )
of th
e C
ompa
nies
Act
195
6(fi
gure
s in
Rupe
es &
in re
porti
ng cu
rrenc
y)
Sr.
Nameo
ftheSubsid
iary
Foreign
Financial
Capital
Reserves
Total
Total
Investm
ent
Turnover/
Profit/
Provision
Profit/
Proposed
Country
No
Co
mpa
ny
Cu
rren
cy o
f Ye
ar en
ded
on
Asse
ts Li
abili
ties
(oth
er th
an in
To
tal
(Los
s) fo
r Tax
(L
oss)
Divid
end
Subs
idiar
y
subs
idiar
ies)
Inco
me
Befo
re T
ax
Af
ter T
ax
1 Zo
diac
Clo
thin
g Co
. UAE
LLC
IN
R M
arch
31,
2013
4,4
35,05
0 55
7,380
,712
641,9
90,88
7 64
1,990
,887
– 61
0,908
,098
35,11
5,082
–
35,11
5,082
–
Duba
i
AE
D
300,0
00
37,70
2,901
43
,426,1
87
43,42
6,187
–
41,19
7,547
2,1
53,93
1 –
2,153
,931
–
2 Zo
diac
Clo
thin
g Co
. S.
A.
INR
Mar
ch 3
1, 20
13
14,25
0,000
21
,118,1
21
36,23
4,977
36
,234,9
77
– 12
,149,7
08
10,22
1,877
–
10,22
1,877
–
Switz
erlan
d
CH
F
250,0
00
370,4
93
635,7
01
635,7
01
– 20
9,720
17
6,443
–
176,4
43
–
3 Zo
diac
Pro
perty
Lim
ited
INR
Mar
ch 3
1, 20
13
148,6
67
(26,4
64,33
7)
176,4
50,72
6 17
6,450
,726
– 4,6
40,43
5 (7
,929,0
57)
– (7
,929,0
57)
– UK
GB
P
1,808
(3
21,84
3)
2,145
,885
2,145
,885
– 53
,936
(92,1
60)
– (9
2,160
)
4 Zo
diac
Clo
thin
g IN
C IN
R M
arch
31,
2013
54
2,850
(1
9,346
) 1,8
94,26
6 1,8
94,26
6 –
0 (3
92,85
9)
– (3
92,85
9)
– US
A
US
D
10,00
0 (3
56)
34,89
5 34
,895
– 0
(7,21
5)
– (7
,215)
5 Zo
diac
Fin
sec &
Hol
ding
s Ltd
IN
R M
arch
31,
2013
20
,000,0
00
168,0
76,60
9 40
4,224
,685
404,2
24,68
5 63
,873,9
66
76,92
9,727
51
,748,6
27
12,13
3,968
39
,614,6
59
– In
dia
(F
orm
erly
Mul
tiplex
Col
lapsib
le
Tu
bes L
imite
d)
Exch
ange
Rat
e A
s on
31/
03/2
013
1USD
= `
54.
2850
0 1A
ED =
` 1
4.78
350
1 G
BP
= `
82.2
275
1 C
HF
= `
57.0
000
Z O D I A C 133
NOTES
134 Z O D I A C
NOTES