Embed Size (px)
Citation preview

Zain Group Financial Results
Q4 2017

Disclaimer ❖ Mobile Telecommunications Company KSCP “Zain Group” has prepared this presentation to the
best of its abilities, however, no warranty or representation, express or implied is made as to theadequacy, correctness, completeness or accuracy of any numbers, statements, opinions,estimates, or other information contained in this presentation.
❖ Certain portions of this document contain “forward-looking statements”, which are based oncurrent expectations and reasonable assumptions, we can however give no assurance they will beachieved.
❖ The information contained in this presentation is subject to change and we disclaim any obligationto update you of any such changes, particularly those pertaining to the forward-lookingstatements.
❖ Furthermore, it should be noted that there are a myriad potential risks, uncertainties andunforeseen factors that could cause the actual results to differ materially from the forward-lookingstatements made herein.
❖ Accordingly, this presentation does not constitute an offering of securities or otherwise constitutean invitation or inducement to any person to underwrite, subscribe for, or otherwise acquire ordispose of, securities in any company within Zain Group.
For further information about Zain Group, or the materials contained within this presentation, pleasedirect your enquiries to our Investor Relations team via email at [email protected] or visitwww.zain.com/en/investor-relations/
2

Content
1. Results Review
2. Operations review
3. Financial Statements
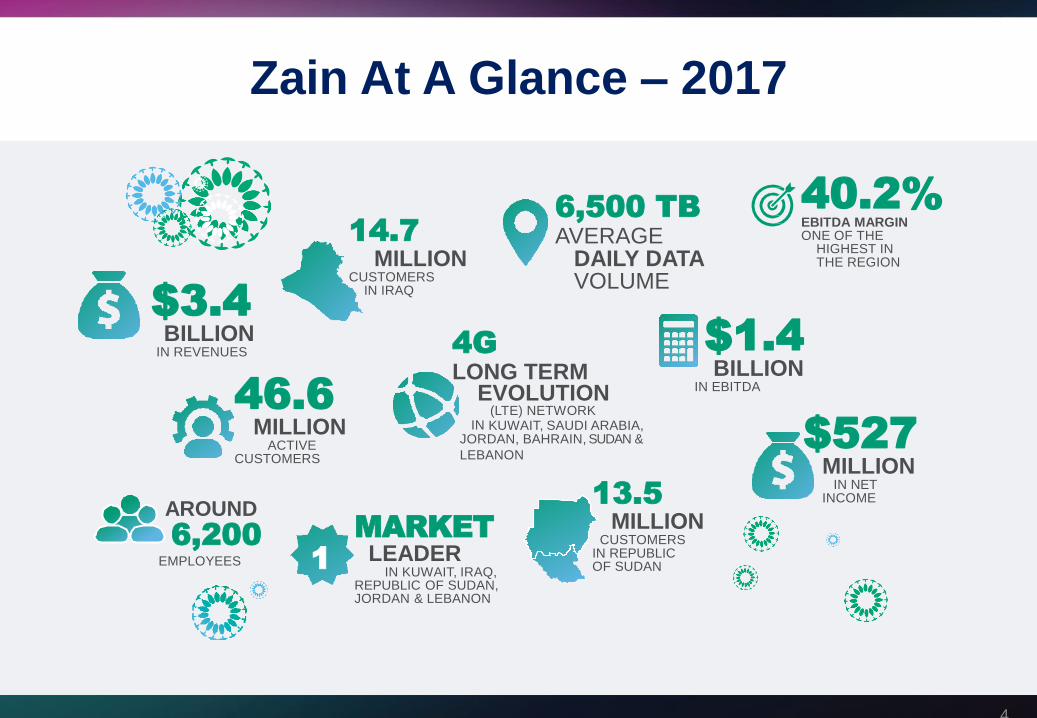
Zain At A Glance – 2017
46.6MILLION
ACTIVE CUSTOMERS
14.7MILLION
CUSTOMERSIN IRAQ
4GLONG TERM
EVOLUTION(LTE) NETWORK
IN KUWAIT, SAUDI ARABIA,JORDAN, BAHRAIN, SUDAN &
LEBANON
AROUND
6,200EMPLOYEES
MARKETLEADER
IN KUWAIT, IRAQ,REPUBLIC OF SUDAN, JORDAN & LEBANON
$1.4BILLION
IN EBITDA
13.5MILLION
CUSTOMERSIN REPUBLICOF SUDAN
$3.4BILLION
IN REVENUES
6,500 TBAVERAGE
DAILY DATA VOLUME
1
$527MILLION
IN NETINCOME
40.2%EBITDA MARGINONE OF THE
HIGHEST IN THE REGION
4
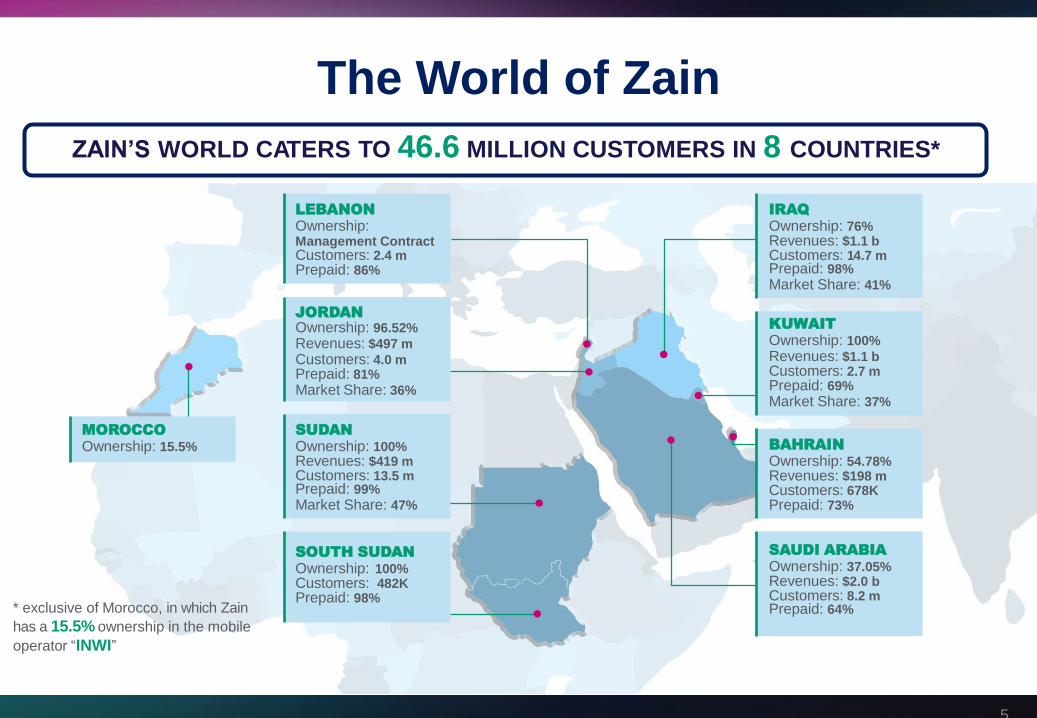
The World of Zain
IRAQOwnership: 76% Revenues: $1.1 bCustomers: 14.7 mPrepaid: 98%
Market Share: 41%
KUWAITOwnership: 100%
Revenues: $1.1 bCustomers: 2.7 mPrepaid: 69%
Market Share: 37%
BAHRAINOwnership: 54.78% Revenues: $198 m Customers: 678K Prepaid: 73%
SAUDI ARABIAOwnership: 37.05% Revenues: $2.0 bCustomers: 8.2 mPrepaid: 64%
MOROCCOOwnership: 15.5%
LEBANONOwnership: Management Contract Customers: 2.4 mPrepaid: 86%
JORDANOwnership: 96.52%
Revenues: $497 m
Customers: 4.0 mPrepaid: 81%
Market Share: 36%
SUDANOwnership: 100% Revenues: $419 m Customers: 13.5 mPrepaid: 99%
Market Share: 47%
SOUTH SUDANOwnership: 100%Customers: 482KPrepaid: 98%
* exclusive of Morocco, in which Zain
has a 15.5% ownership in the mobile
operator “INWI”
ZAIN’S WORLD CATERS TO 46.6 MILLION CUSTOMERS IN 8 COUNTRIES*
5

Group Financial Highlights – Q4 2017
106
124
Q4-16 Q4-17
400
326
Q4-16 Q4-17
860 868
Q4-16 Q4-17
CUSTOMERS (000)
47% 38% 3 3
REVENUES (USDm)
EBITDA (USDm) NET INCOME (USDm)
47,004 46,608
Q4-16 Q4-17
-1% +1%
-19%
Margin
%
+17%
6
EPS
(Cent)
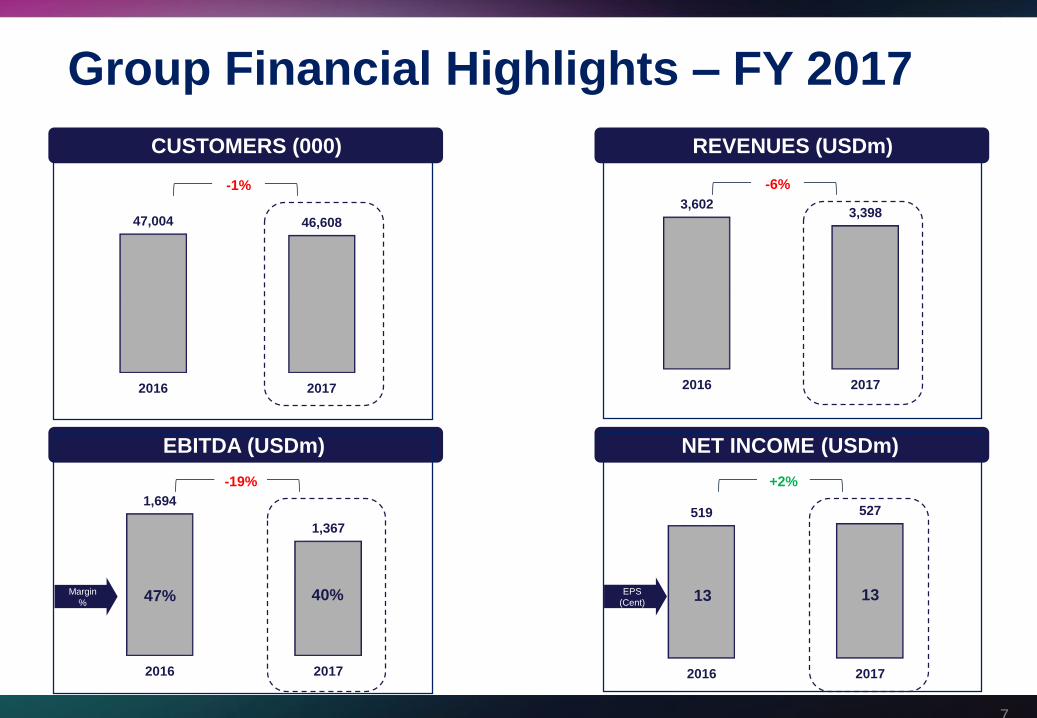
Group Financial Highlights – FY 2017
519 527
2016 2017
1,694
1,367
2016 2017
3,6023,398
2016 2017
CUSTOMERS (000) REVENUES (USDm)
EBITDA (USDm) NET INCOME (USDm)
47,004 46,608
2016 2017
-1% -6%
-19% +2%
7
47% 40% 13 13Margin
%
EPS
(Cent)

797
635
445
21%
18%
13%
2015 2016 2017
Capex Capex / Revenues
-20% -30%
CAPEX & CAPEX / REVENUES
8
* Capex excluding Zain KSA
* Capex includes only tangible assets
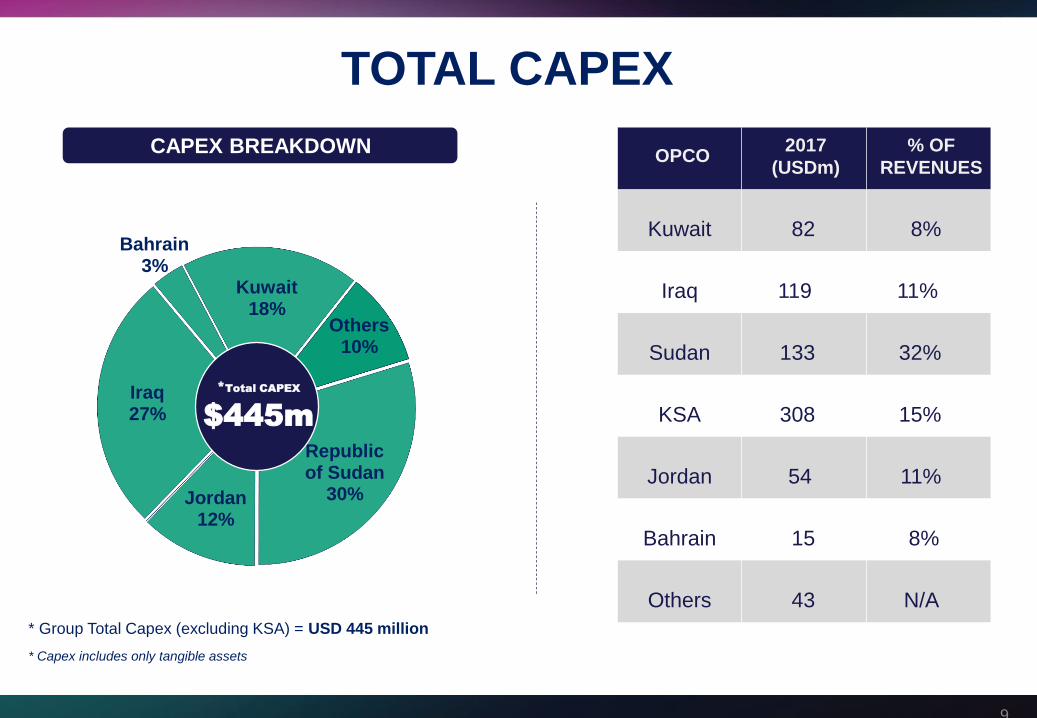
Republic of Sudan
30%Jordan12%
Iraq27%
Bahrain3%
Kuwait18%
Others10%
CAPEX BREAKDOWN
* Group Total Capex (excluding KSA) = USD 445 million
*Total CAPEX
$445m
Kuwait 82 8%
Iraq 119 11%
Sudan 133 32%
KSA 308 15%
Jordan 54 11%
Bahrain 15 8%
Others 43 N/A
OPCO2017
(USDm)
% OF
REVENUES
TOTAL CAPEX
9
* Capex includes only tangible assets

2,718
2,222
718 661
2016 2017
Long Term Short Term
2,752
2,074
1.6 1.5
2016 2017
Net Debt Net Debt/EBITDA
Net Debt = Total interest bearing debt (excluding letters of guarantee)
after deducting cash and cash equivalents
TOTAL DEBT (USDm) NET DEBT (USDm) & NET DEBT/EBITDA
2,883
3,436
-16% -25%
Group Financial Highlights
10
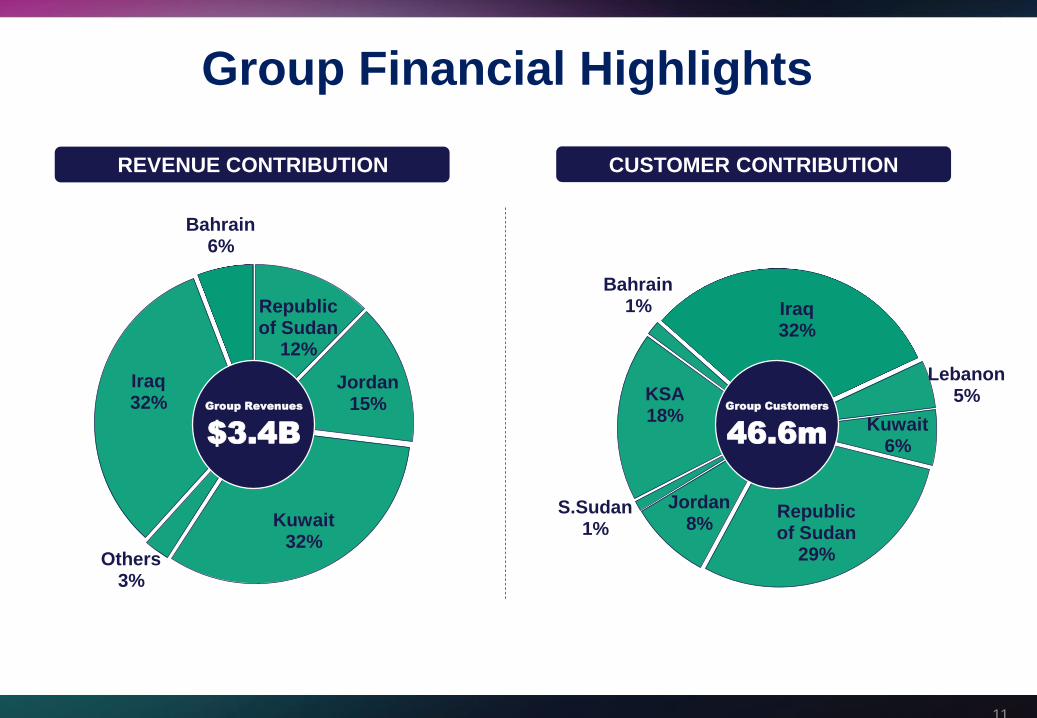
Kuwait6%
Republic of Sudan
29%
Jordan8%
S.Sudan1%
KSA18%
Bahrain1% Iraq
32%
Lebanon5%
Republic of Sudan
12%
Jordan15%
Kuwait32%
Others3%
Iraq32%
Bahrain6%
Group Customers
46.6m
REVENUE CONTRIBUTION CUSTOMER CONTRIBUTION
Group Revenues
$3.4B
Group Financial Highlights
11

77%
89%
80%
76%
87%
2012 2013 2014 2015 2016
7%
8% 8% 8%7%
2012 2013 2014 2015 2016
50 50
40
3035
2012 2013 2014 2015 2016
685 690
533
388447
2012 2013 2014 2015 2016
DIVIDEND PAYOUT RATIO DIVIDEND YIELD (%)
DIVIDEND PER SHARE (Fils) CASH DIVIDEND (USDm)
ZAIN DIVIDENDS
12

Content
1. Results Review
2. Operations review
3. Financial Statements
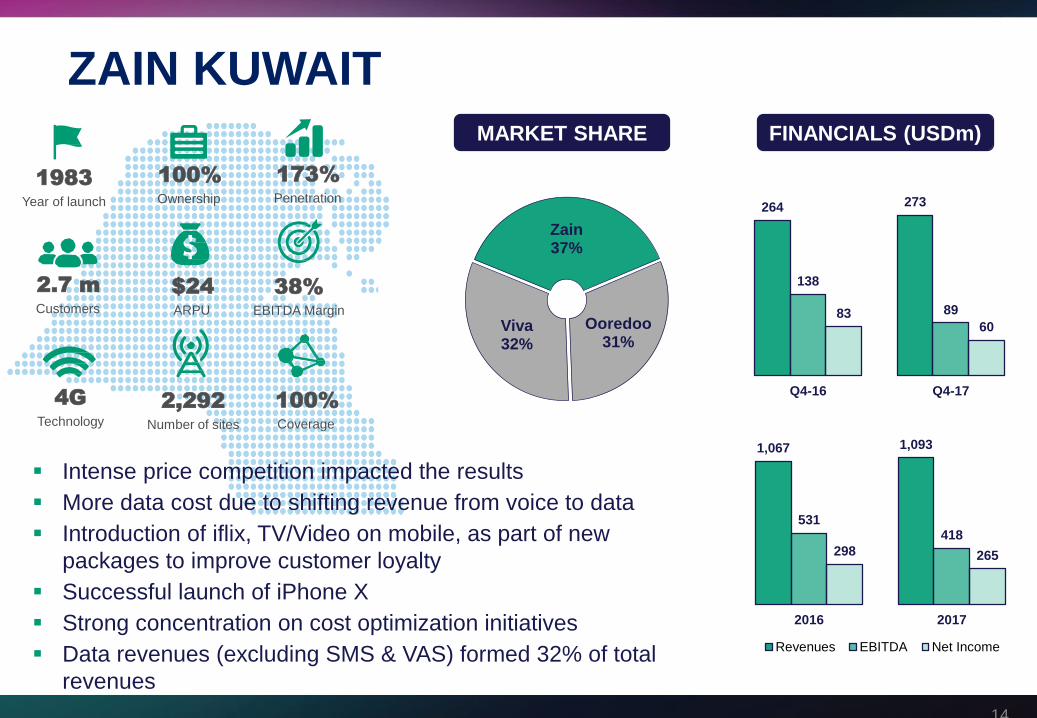
$24ARPU
173%Penetration
1983Year of launch
2.7 mCustomers
100%Ownership
▪ Intense price competition impacted the results
▪ More data cost due to shifting revenue from voice to data
▪ Introduction of iflix, TV/Video on mobile, as part of new
packages to improve customer loyalty
▪ Successful launch of iPhone X
▪ Strong concentration on cost optimization initiatives
▪ Data revenues (excluding SMS & VAS) formed 32% of total
revenues
ZAIN38%
OOREEDOO31%
VIVA31%
4GTechnology
100%Coverage
2,292Number of sites
264 273
138
898360
Q4-16 Q4-17
FINANCIALS (USDm)
Zain37%
Ooredoo31%
Viva32%
MARKET SHARE
38%EBITDA Margin
1,067 1,093
531418
298 265
2016 2017
Revenues EBITDA Net Income
ZAIN KUWAIT
14

$7ARPU
95%Penetration
2003Year of acquisition
14.7 mCustomers
76%Ownership
ZAIN38%
OOREEDOO31%
VIVA31%
3GTechnology
99%Coverage
4,482Number of sites
279 291
110 101
(34)
5
Q4-16 Q4-17
Zain41%
Korek 22%Asiacell
37%
MARKET SHARE
35%EBITDA Margin
▪ Solid FY performance, supported by strong acquisition
initiatives in the regions
▪ Stopped the irrational price war among operations
▪ Restore service in the liberated areas
▪ Customer base jumped by 16% to reach 14.7 million
▪ Strong focus on cost optimization
1,083 1,102
394 382
(5)
29
2016 2017
Revenues EBITDA Net Income
FINANCIALS (USDm)
ZAIN IRAQ
15
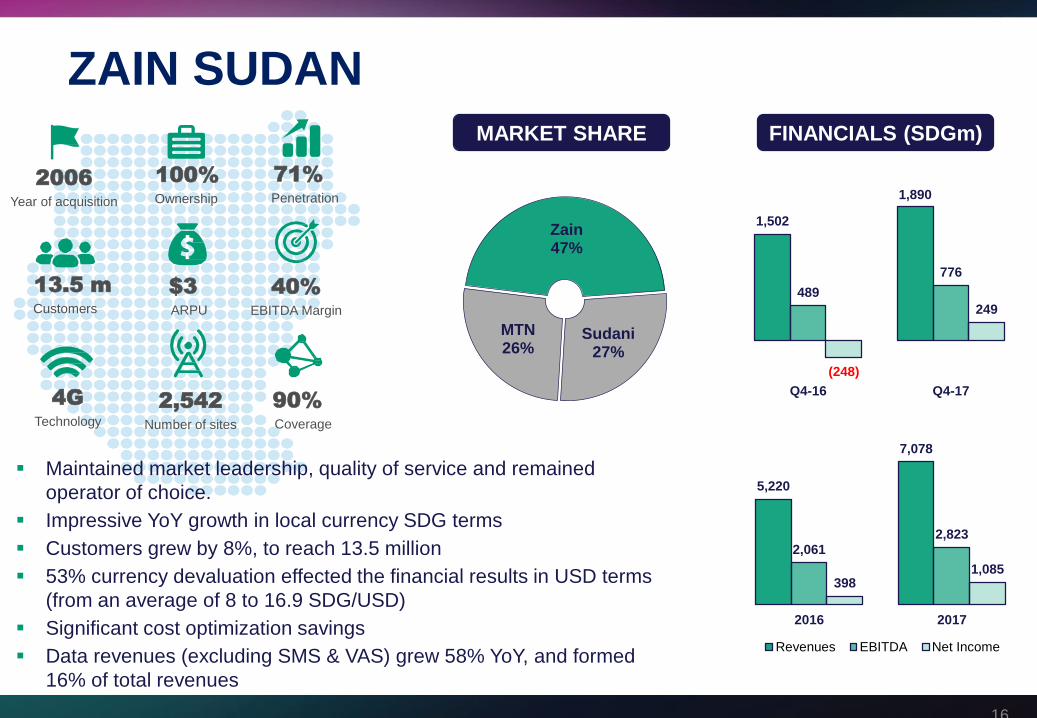
$3ARPU
71%Penetration
13.5 mCustomers
100%Ownership
ZAIN38%
OOREEDOO31%
VIVA31%
4GTechnology
90%Coverage
2,542Number of sites
1,502
1,890
489
776
(248)
249
Q4-16 Q4-17
Zain47%
Sudani27%
MTN26%
MARKET SHARE
40%EBITDA Margin
2006Year of acquisition
▪ Maintained market leadership, quality of service and remained
operator of choice.
▪ Impressive YoY growth in local currency SDG terms
▪ Customers grew by 8%, to reach 13.5 million
▪ 53% currency devaluation effected the financial results in USD terms
(from an average of 8 to 16.9 SDG/USD)
▪ Significant cost optimization savings
▪ Data revenues (excluding SMS & VAS) grew 58% YoY, and formed
16% of total revenues
5,220
7,078
2,0612,823
3981,085
2016 2017
Revenues EBITDA Net Income
FINANCIALS (SDGm)
ZAIN SUDAN
16
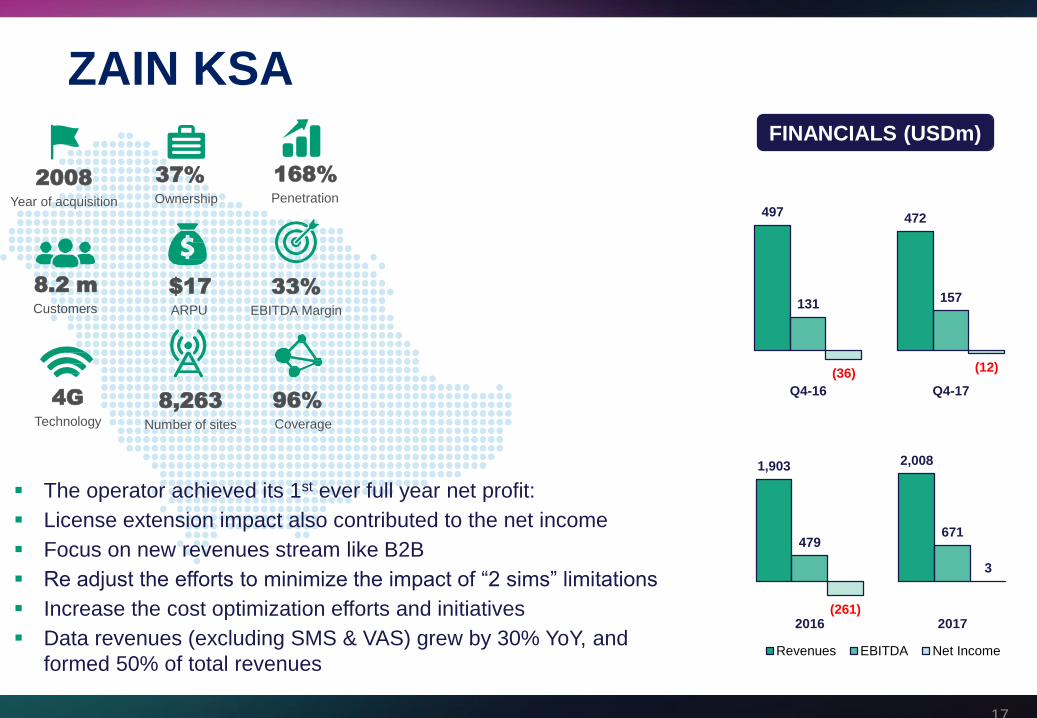
$17ARPU
168%Penetration
8.2 mCustomers
37%Ownership
ZAIN38%
OOREEDOO31%
VIVA31%
4GTechnology
96%Coverage
8,263Number of sites
497472
131157
(36) (12)
Q4-16 Q4-17
33%EBITDA Margin
▪ The operator achieved its 1st ever full year net profit:
▪ License extension impact also contributed to the net income
▪ Focus on new revenues stream like B2B
▪ Re adjust the efforts to minimize the impact of “2 sims” limitations
▪ Increase the cost optimization efforts and initiatives
▪ Data revenues (excluding SMS & VAS) grew by 30% YoY, and
formed 50% of total revenues
2008Year of acquisition
1,903 2,008
479671
(261)
3
2016 2017
Revenues EBITDA Net Income
FINANCIALS (USDm)
ZAIN KSA
17
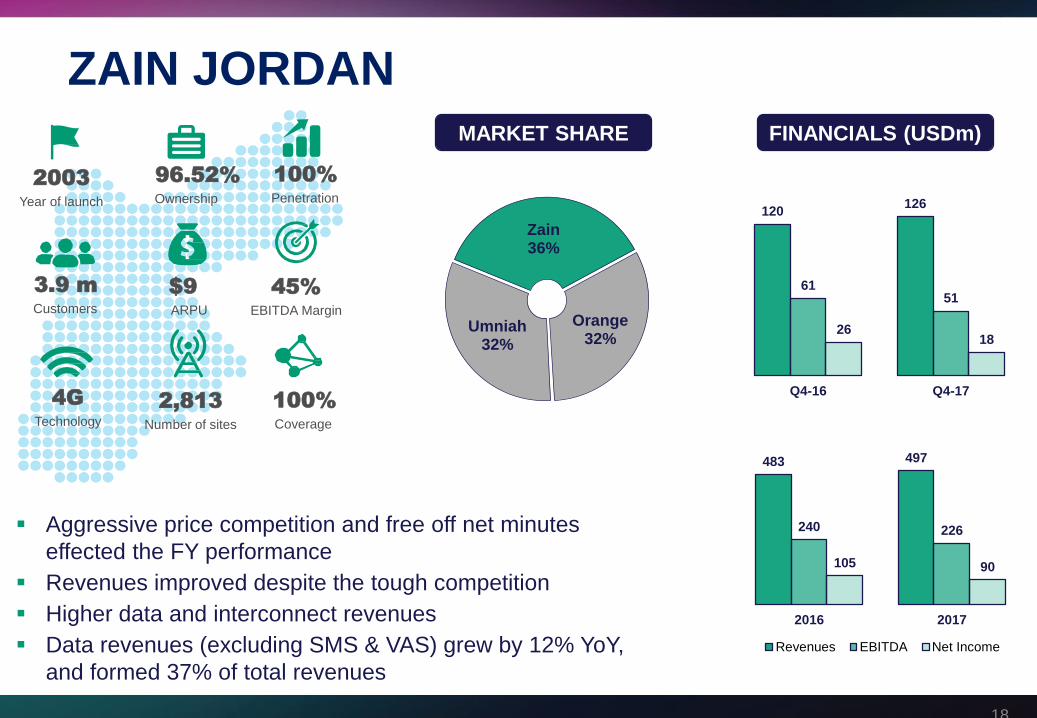
$9ARPU
100%Penetration
2003Year of launch
3.9 mCustomers
96.52%Ownership
ZAIN38%
OOREEDOO31%
VIVA31%
4GTechnology
100%Coverage
2,813Number of sites
120126
6151
2618
Q4-16 Q4-17
Zain36%
Orange32%
Umniah32%
MARKET SHARE
45%EBITDA Margin
▪ Aggressive price competition and free off net minutes
effected the FY performance
▪ Revenues improved despite the tough competition
▪ Higher data and interconnect revenues
▪ Data revenues (excluding SMS & VAS) grew by 12% YoY,
and formed 37% of total revenues
483 497
240 226
105 90
2016 2017
Revenues EBITDA Net Income
FINANCIALS (USDm)
ZAIN JORDAN
18
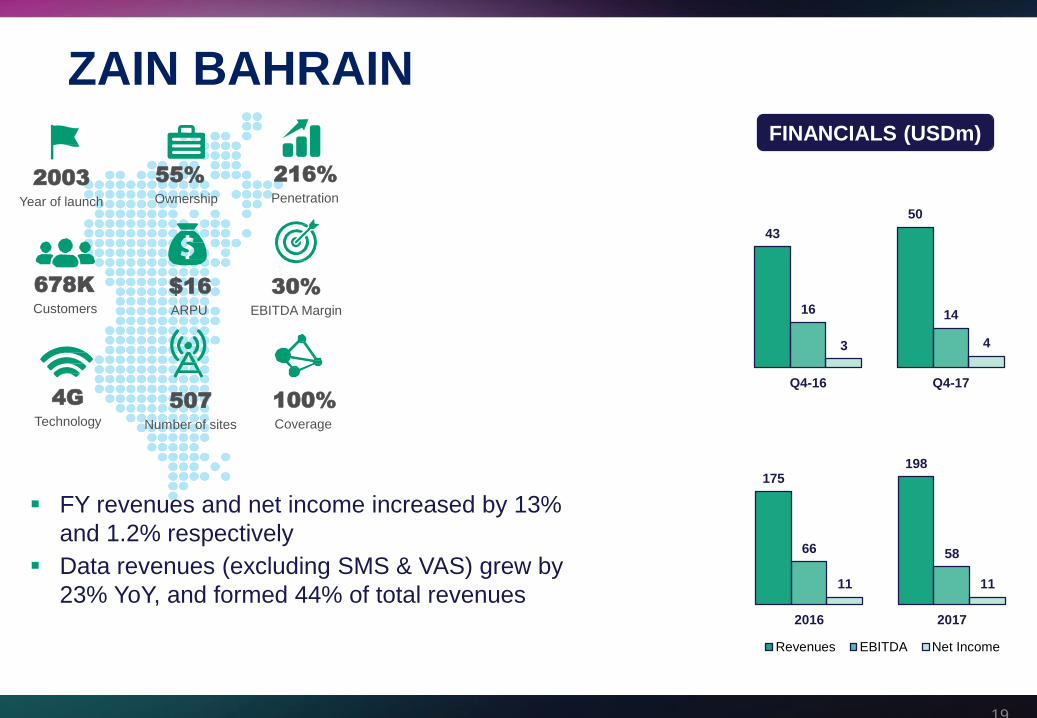
$16ARPU
216%Penetration
2003Year of launch
678KCustomers
55%Ownership
4GTechnology
100%Coverage
507Number of sites
43
50
16 14
3 4
Q4-16 Q4-17
30%EBITDA Margin
▪ FY revenues and net income increased by 13%
and 1.2% respectively
▪ Data revenues (excluding SMS & VAS) grew by
23% YoY, and formed 44% of total revenues
175198
66 58
11 11
2016 2017
Revenues EBITDA Net Income
FINANCIALS (USDm)
ZAIN BAHRAIN
19
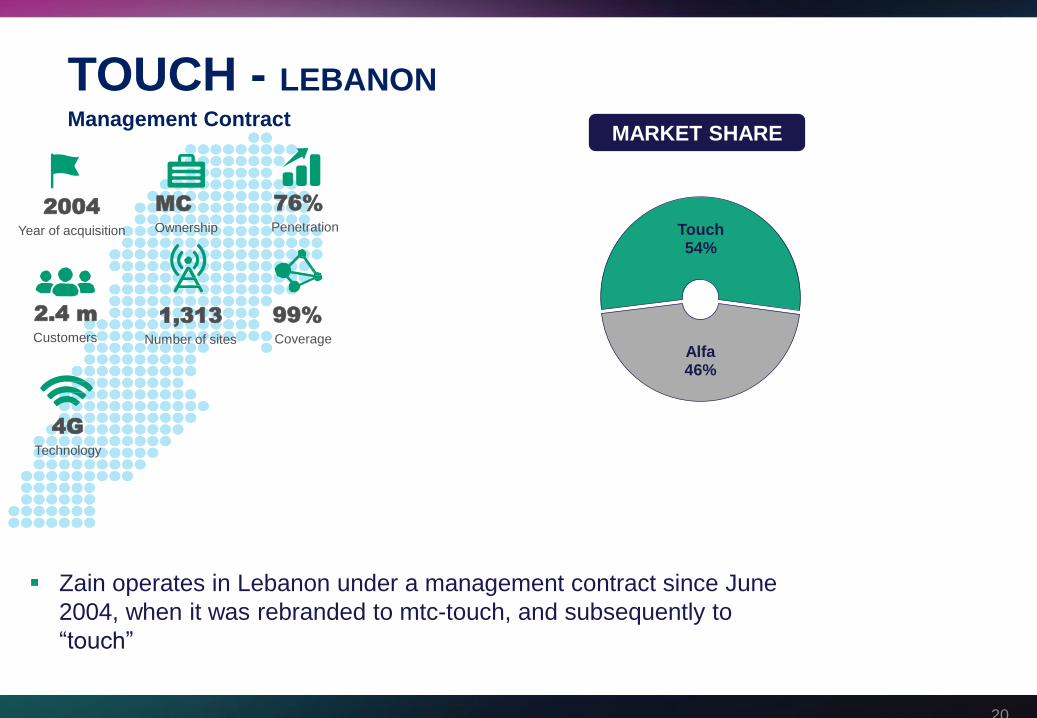
76%Penetration
2004Year of acquisition
2.4 mCustomers
MCOwnership
ZAIN38%
OOREEDOO31%
VIVA31%
4GTechnology
99%Coverage
1,313Number of sites
Touch54%
Alfa46%
MARKET SHARE
▪ Zain operates in Lebanon under a management contract since June
2004, when it was rebranded to mtc-touch, and subsequently to
“touch”
TOUCH - LEBANONManagement Contract
20

Content
1. Results Review
2. Operations review
3. Financial Statements
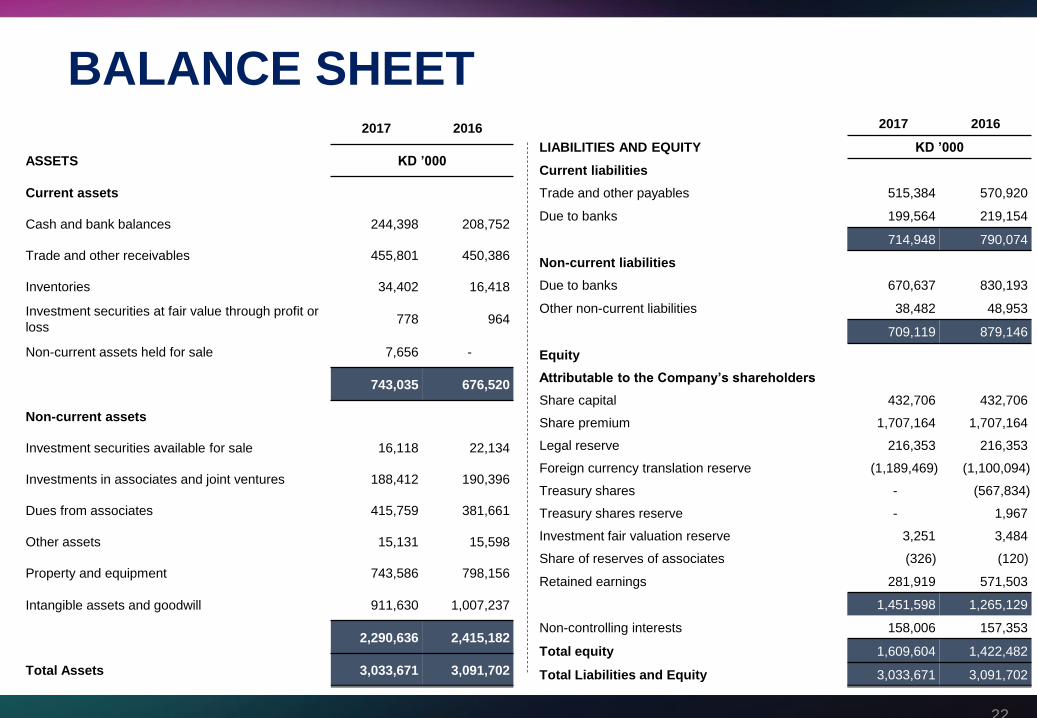
BALANCE SHEET
22
2017 2016
ASSETS KD ’000
Current assets
Cash and bank balances 244,398 208,752
Trade and other receivables 455,801 450,386
Inventories 34,402 16,418
Investment securities at fair value through profit or
loss778 964
Non-current assets held for sale 7,656 -
743,035 676,520
Non-current assets
Investment securities available for sale 16,118 22,134
Investments in associates and joint ventures 188,412 190,396
Dues from associates 415,759 381,661
Other assets 15,131 15,598
Property and equipment 743,586 798,156
Intangible assets and goodwill 911,630 1,007,237
2,290,636 2,415,182
Total Assets 3,033,671 3,091,702
2017 2016
LIABILITIES AND EQUITY KD ’000
Current liabilities
Trade and other payables 515,384 570,920
Due to banks 199,564 219,154
714,948 790,074
Non-current liabilities
Due to banks 670,637 830,193
Other non-current liabilities 38,482 48,953
709,119 879,146
Equity
Attributable to the Company’s shareholders
Share capital 432,706 432,706
Share premium 1,707,164 1,707,164
Legal reserve 216,353 216,353
Foreign currency translation reserve (1,189,469) (1,100,094)
Treasury shares - (567,834)
Treasury shares reserve - 1,967
Investment fair valuation reserve 3,251 3,484
Share of reserves of associates (326) (120)
Retained earnings 281,919 571,503
1,451,598 1,265,129
Non-controlling interests 158,006 157,353
Total equity 1,609,604 1,422,482
Total Liabilities and Equity 3,033,671 3,091,702

INCOME STATEMENT
23
2017 2016
KD ’000
Revenue 1,029,547 1,087,774
Cost of sales (290,891) (266,764)
Gross profit 738,656 821,010
Operating and administrative expenses (313,964) (308,174)
Depreciation and amortization (185,050) (222,307)
Provision for impairment – trade and other receivables (10,256) (1,296)
Operating profit 229,386 289,233
Interest income 27,850 5,992
Investment income 781 (3,925)
Share of results of associates and joint ventures 127 (30,781)
Other (expense)/income (12,207) (22,793)
Finance costs (40,100) (32,598)
Provision for impairment loss on property and equipment (37,826) -
Loss from currency revaluation (32,120) (42,044)
Net monetary gain 45,789 30,781
Profit before, contribution to KFAS, NLST, Zakat, 181,680 193,865
income taxes and Board of Directors’ remuneration
Contribution to Kuwait Foundation for Advancement of
Sciences(1,100) (666)
National Labour Support Tax and Zakat (5,753) (6,138)
Income tax expenses (10,400) (28,051)
Board of Directors’ remuneration (275) (275)
Profit for the year 164,152 158,735
Attributable to:
Shareholders of the Company 159,817 156,702
Non-controlling interests 4,335 2,033
164,152 158,735
2017 2016
Earnings per share (EPS) Fils
Basic – Fils 39 40
Diluted – Fils 39 40
24
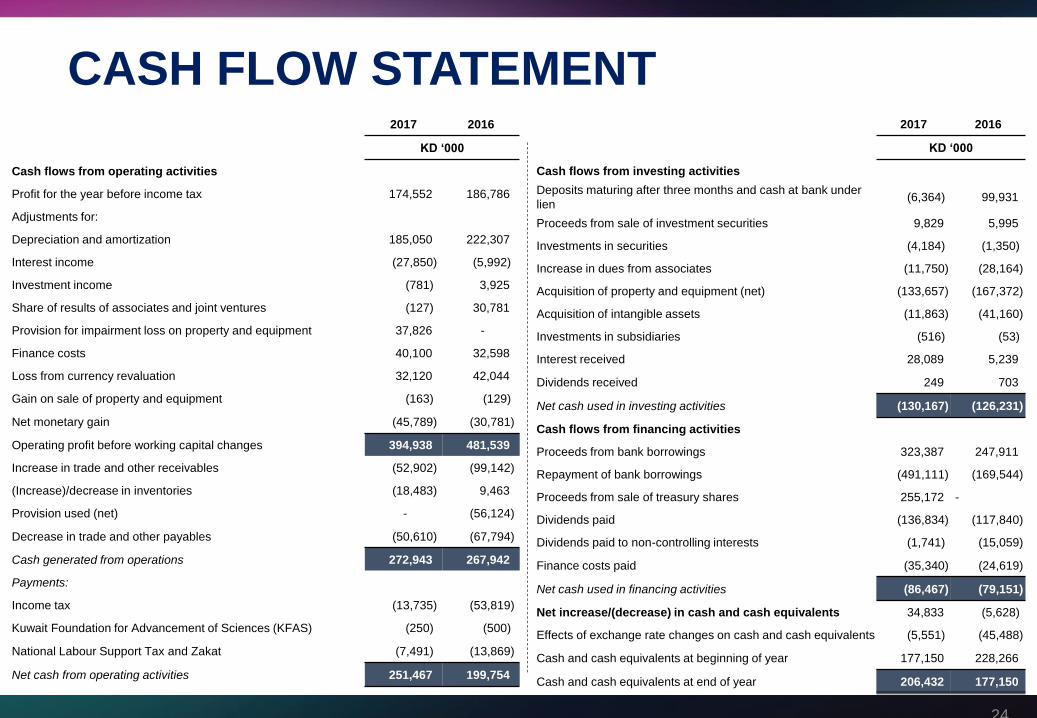
CASH FLOW STATEMENT 2017 2016
KD ‘000
Cash flows from operating activities
Profit for the year before income tax 174,552 186,786
Adjustments for:
Depreciation and amortization 185,050 222,307
Interest income (27,850) (5,992)
Investment income (781) 3,925
Share of results of associates and joint ventures (127) 30,781
Provision for impairment loss on property and equipment 37,826 -
Finance costs 40,100 32,598
Loss from currency revaluation 32,120 42,044
Gain on sale of property and equipment (163) (129)
Net monetary gain (45,789) (30,781)
Operating profit before working capital changes 394,938 481,539
Increase in trade and other receivables (52,902) (99,142)
(Increase)/decrease in inventories (18,483) 9,463
Provision used (net) - (56,124)
Decrease in trade and other payables (50,610) (67,794)
Cash generated from operations 272,943 267,942
Payments:
Income tax (13,735) (53,819)
Kuwait Foundation for Advancement of Sciences (KFAS) (250) (500)
National Labour Support Tax and Zakat (7,491) (13,869)
Net cash from operating activities 251,467 199,754
2017 2016
KD ‘000
Cash flows from investing activities
Deposits maturing after three months and cash at bank under
lien(6,364) 99,931
Proceeds from sale of investment securities 9,829 5,995
Investments in securities (4,184) (1,350)
Increase in dues from associates (11,750) (28,164)
Acquisition of property and equipment (net) (133,657) (167,372)
Acquisition of intangible assets (11,863) (41,160)
Investments in subsidiaries (516) (53)
Interest received 28,089 5,239
Dividends received 249 703
Net cash used in investing activities (130,167) (126,231)
Cash flows from financing activities
Proceeds from bank borrowings 323,387 247,911
Repayment of bank borrowings (491,111) (169,544)
Proceeds from sale of treasury shares 255,172 -
Dividends paid (136,834) (117,840)
Dividends paid to non-controlling interests (1,741) (15,059)
Finance costs paid (35,340) (24,619)
Net cash used in financing activities (86,467) (79,151)
Net increase/(decrease) in cash and cash equivalents 34,833 (5,628)
Effects of exchange rate changes on cash and cash equivalents (5,551) (45,488)
Cash and cash equivalents at beginning of year 177,150 228,266
Cash and cash equivalents at end of year 206,432 177,150

THANK YOU
Website : zain.com
Email : [email protected]
Note: Mobile Penetration rates are sourced from GSMA Intelligence as of Dec-17