Embed Size (px)
Citation preview

Zargon Oil & Gas Ltd.2 0 1 1 q 3 f i n a n c i a L R e p O R t
Focused on exploitation
403-264-9992 • www.zargon.ca
FINANCIAL & OPERATING HIGHLIGHTS
1 Z AR G O N O IL & G AS LT D.
Three Months Ended September 30, Nine Months Ended September 30,
(unaudited) 2011 2010
(restated) Percent Change 2011
2010 (restated)
Percent Change
Financial
Income and Investments ($ millions)
Petroleum and natural gas sales, before royalties 44.99 44.50 1 140.40 136.84 3
Funds flow from operating activities 14.59 18.31 (20) 43.57 58.53 (26)
Cash flows from operating activities 13.75 19.87 (31) 50.29 53.34 (6)
Cash dividends (net of Dividend Reinvestment Plan) 10.75 11.92 (10) 30.87 36.35 (15)
Net earnings 30.69 1.20 2,458 34.25 23.42 46
Net capital expenditures (4.61) (1.45) (218) 23.77 51.16 (54)
Per Share, Diluted
Funds flow from operating activities ($/share) 0.50 0.69 (28) 1.52 2.23 (32)
Cash flows from operating activities ($/share) 0.47 0.75 (37) 1.76 2.03 (13)
Net earnings ($/share) 1.05 0.05 2,000 1.20 0.89 35
Cash Dividends ($/common share) 0.42 0.54 (22) 1.26 1.62 (22)
Balance Sheet at Period End ($ millions)
Property and equipment (D&P) 427.67 427.25 –
Exploration and evaluation assets (E&E) 25.74 27.65 (7)
Bank debt 76.69 97.61 (21)
Shareholders’ equity 254.85 179.19 42
Total Common Shares Outstanding at Period End (millions) 29.24 26.81 9
Operating
Average Daily Production
Oil and liquids (bbl/d) 5,330 5,850 (9) 5,417 5,716 (5)
Natural gas (mmcf/d) 22.10 25.46 (13) 21.98 26.12 (16)
Equivalent (boe/d) 9,014 10,094 (11) 9,080 10,069 (10)
Oil and liquids per million common shares (bbl/d) 182 221 (18) 190 217 (12)
Average Selling Price (before the impact of financial risk management
contracts)
Oil and liquids ($/bbl) 77.18 67.64 14 80.33 69.43 16
Natural gas ($/mcf) 3.51 3.45 2 3.60 4.00 (10)
Wells Drilled, Net 14.2 4.8 196 23.8 23.8 –
Undeveloped Land at Period End (thousand net acres) 448 505 (11)
Notes:
- For the convenience of the reader, the comparative information presented in this schedule refers to common shares and cash dividends although, for the pre-
corporate conversion period, these items were trust units and cash distributions.
- Throughout this report, the calculation of barrels of oil equivalent (“boe”) is based on the conversion ratio that six thousand cubic feet of natural gas is equivalent to
one barrel of oil. For a further discussion about this term, refer to the Management’s Discussion and Analysis section in this report.
- For net capital expenditures, amounts include capital expenditures acquired for cash, equity issuances and net debt assumed on corporate acquisitions.
- Funds flow from operating activities is a non-GAAP term that represents net earnings/losses and asset retirement expenditures except for non-cash items. For a
further discussion about this term, refer to the Management’s Discussion and Analysis section in this report.
- Total shares outstanding for 2010 include trust units plus exchangeable shares outstanding at period end. The exchangeable shares were converted at the
exchange ratio at the end of the period.
- Average daily production per million common shares, for 2010, is calculated using the weighted average number of units outstanding during the period plus the
weighted average number of exchangeable shares outstanding for the period converted at the average exchange ratio for the period.
T H IR D Q U ART ER R EPO RT 20 11 2
FINANCIAL & OPERATING HIGHLIGHTS
Zargon Oil & Gas Ltd. (“Zargon” or the “Company”) reports its financial results for the third quarter of 2011.
Highlights from the three months ended September 30, 2011 are noted below:
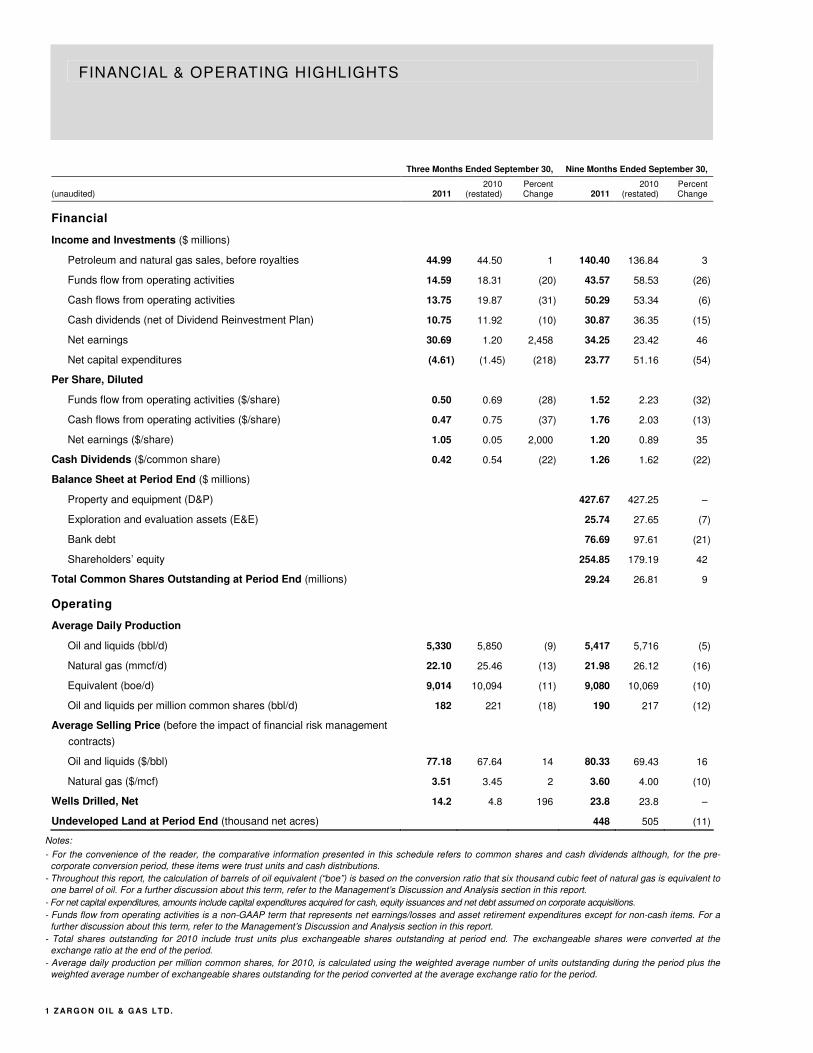
� Third quarter 2011 oil production averaged 5,330 barrels of oil and liquids per day, a six percent gain
over the preceding quarter. This increase in oil and liquids production was primarily due to the
reactivation of Williston Basin wells that had been shut-in due to spring and summer wet weather and
surface lease flooding. This increase was partially offset by Williston Basin Antler and Manor oil
property dispositions.
� Funds flow from operating activities of $14.59 million ($0.50 per diluted share) were six percent higher
than the $13.76 million ($0.47 per diluted share) recorded in the prior quarter, and 20 percent lower
than the $18.31 million ($0.69 per diluted share) reported in third quarter of 2010. Funds flow from
operating activities for the 2011 third quarter included reductions of $1.43 million of realized hedge
losses and $0.64 million of asset retirement expenses.
� Three monthly cash dividends of $0.14 per common share were declared in the third quarter of 2011 for
a total of $12.25 million ($10.75 million after accounting for the common shares issued under the
Dividend Reinvestment Plan (“DRIP”) in lieu of cash dividends). These cash dividends (net of the DRIP)
were equivalent to a payout ratio of 74 percent of funds flow from operating activities. As announced in
our September 12, 2011 press release, effective for the October 2011 dividend, to be paid on November
15, 2011, Zargon will reduce its monthly dividend to $0.10 per common share.
� During the quarter, exploration and development capital expenditures (excluding property acquisitions
and dispositions) were a robust $17.97 million as field and drilling programs were reactivated after
significant spring and summer delays related to flooding and surface access problems. Zargon also
closed $22.66 million of net property dispositions in the quarter which were highlighted by 260 barrels of
oil per day of dispositions at the Williston Basin Antler and Manor properties.
Production (1)
Zargon’s production averaged 9,014 barrels of oil equivalent per day in the third quarter and was four
percent higher than the preceding quarter and 11 percent lower than the corresponding 2010 quarter. Oil
and liquids production averaged 5,330 barrels per day in the 2011 third quarter, a six percent increase
from the 5,034 barrels per day produced in the prior quarter, but a nine percent decrease from the
corresponding 2010 quarter. Natural gas production averaged 22.10 million cubic feet per day, a one
percent increase from the previous quarter and a 13 percent decrease from the corresponding period in
2010. During the quarter, oil and liquids production represented 59 percent of total production based on a
6:1 equivalent basis.
The quarter’s oil and liquids production was highlighted by the July and August reactivation of the Williston
Basin wells that had been shut-in due to spring and summer wet weather and surface lease flooding.
Specifically during the quarter, shut-in volumes totalled 160 barrels of oil per day down from the 760
barrels of oil per day reported in the second quarter. Oil production volumes were also impacted by the
early July sale of 260 barrels of oil per day coming from the Williston Basin Antler and Manor properties.
Field Activities (1)
Zargon’s third quarter field capital program totalled $17.97 million, an increase of 132 percent over the
prior quarter and 73 percent over Zargon’s 2010 third quarter. During the quarter, Zargon drilled 18 gross
wells with a 100 percent success ratio that resulted in 14.2 net oil wells and took the year’s drilling total to
23.8 net wells. For the fourth quarter, an additional 11 net oil locations are scheduled.
The Alberta Plains North drilling program was highlighted by two Glauconite horizontal wells at Killam,
three wells at Bellshill Lake and one horizontal multi-frac well at Hamilton Lake. Four horizontal oil

3 Z AR G O N O IL & G AS LT D.
exploitation wells were drilled in the Taber Alberta Plains South property. Operated wells in the Williston
Basin core area included four horizontal wells at the Weyburn and Elswick, Saskatchewan properties.
At our wholly owned 47 section Hamilton Lake Viking Unit, production from the initial 16-16-36-11 W4
multi-frac horizontal well has continued to produce for the last four months at a stable rate of
approximately 50 barrels of oil per day with a 90 percent water cut. The steady production performance
provides encouragement to our view that this mature waterflood can be redeveloped by horizontal multi-
frac technology. A second multi-frac well has now been drilled and completed at 4-34-35-10 W4. The first
week’s production rates are averaging 80 barrels of oil per day with a 70 percent water cut. The third
multi-frac location at 16-24-36-12 W4 has been drilled and will be completed later this month. We are now
proceeding with the licensing of four additional locations that are scheduled to be drilled in the first quarter
of 2012. With further de-risking, the Hamilton Lake 33 degree API oil property could be a significant oil
resource opportunity that will take as many as 30 horizontal multi-frac drainage wells to optimally exploit
by waterflood.
Since spring break-up, Zargon has drilled four horizontal wells for Glauconite oil production at the Killam
property. The wells are part of an early stage project delineation program on a Zargon wholly owned four
section 27 degree API oil pool. The recently drilled fourth well provides another supporting data point for
our reservoir development model that predicts initial production rates of 40 barrels of oil per day and
significant unrealized reserve potential to be recovered through the implementation of a single leg parallel
producer-injector waterflood. We are now proceeding with the licensing of four additional locations that are
scheduled to be drilled in the first quarter of 2012. With further de-risking, the Killam property is expected
to be a significant oil exploitation project that could take as many as 20 horizontal drainage wells to
optimally exploit by waterflood.
In the 2011 third quarter, Zargon drilled four horizontal wells at Taber South for Sunburst 19 degree API oil
production. These field development wells have met expectations and, in aggregate, are currently
producing in excess of 250 barrels of oil per day. On the southern block, last winter’s waterflood
implementation has successfully stabilized oil production rates and we are moving forward to make the
next round of injector conversions by mid-2012.
In the Williston Basin core area, this spring and summer’s wet conditions and flooded surface leases
delayed the resumption of drilling operations until mid-August. During the quarter, four horizontal drainage
wells were drilled at Weyburn and Elswick, Saskatchewan that mostly targeted lower rate but shallower
decline Midale formations. These wells come from our 85 well inventory of Mississippian development
wells that will be methodically drilled over the next three years.
Dispositions and Acquisitions
During the quarter, Zargon completed numerous property transactions focused on maximizing returns
from non-core properties and on the consolidation of our core properties. In particular, the key transactions
included a July 7, 2011 sale of the Williston Basin Antler and Manor properties for $24.65 million, an
August 23, 2011 purchase of a partner’s interest in our operated Alberta Plains North Jarrow property for
$6.27 million and a September 6, 2011 sale of undeveloped Whitecourt Alberta lands for $5.00 million. In
aggregate, Zargon realized net cash proceeds of $22.66 million from third quarter property acquisition and
disposition transaction activities. With these transactions, Zargon sold 260 barrels of oil per day and
11,000 net acres of undeveloped land. These sales were offset by purchases of 1.30 million cubic feet per
day of natural gas production, and all remaining interests in two Jarrow Units and the related compression
and gathering facilities. For the first nine months of 2011, Zargon has concluded a total of $24.45 million of
net property dispositions.
Updated 2011 and First Look 2012 Capital Budgets (1)
Reflecting a very active and successful fall oil exploitation drilling program, Zargon's 2011 field capital
budget has been increased by $5 million to $70 million. These expenditures are offset by a budgeted net
T H IR D Q U ART ER R EPORT 20 11 4
$25 million of property dispositions that are mostly completed. The resulting 2011 net capital expenditures
are now forecasted at $45 million.
Zargon’s 2012 net capital budget has been set at $55 million, which is comprised of $65 million of field
capital expenditures that are offset by $10 million of net property dispositions. This capital budget does not
include an additional $25 million of capital that will be spent in 2012 if the Little Bow Alkaline Surfactant
Polymer project is sanctioned. Similar to the 2011 capital budget, field programs are focused entirely on oil
exploitation activities and do not include any natural gas drilling. The 2012 net capital program includes 32
net oil exploitation wells and is forecast to be funded from funds flow from operating activities and bank
debt. As at the end of the 2011 third quarter, Zargon’s debt net of working capital is $94.49 million, a level
that represents 52 percent of Zargon’s reaffirmed $180 million syndicated loan facility.
Little Bow Alkaline Surfactant Polymer (“ASP”) Project (1)
Capital expenditures related to our Little Bow ASP project are not included in the 2012 budgeted capital
projections. Zargon is currently finalizing laboratory studies, front-end engineering and design (“FEED”)
studies and preliminary detailed engineering for the Little Bow ASP project that entails the injection of
chemicals in a water solution into the Little Bow Upper Mannville I pool reservoir to recover incremental oil
reserves. The current project schedule anticipates first chemical injections in July 2013 with a significant
oil production response forecast by January 2014.
Third party reserves and design engineering are anticipated to be finalized by the end of the year, thereby
permitting the Little Bow ASP project to be presented to Zargon’s Board of Directors for sanctioning
approval. The total capital cost of phases 1 and 2 of the ASP project is approximately $37 million (constant
2011 dollars) with $25 million to be spent in 2012, of which the majority of the expenditures occur in the
second half of the year. Prior to proceeding with the significant capital expenditures in the second half of
2012, Zargon will carefully examine all available financing options for this project, which may include
forward hedges, if commodity pricing is supportive, sales of non-related properties or third party
participation in the project through partial farm-outs, sell-downs or joint ventures.
Production Guidance (1)
On July 19, 2011, Zargon provided an updated 2011 third quarter, fourth quarter and exit rate oil
production rate guidance of 5,200, 5,400 and 5,600 barrels of oil and liquids per day, respectively. Third
quarter actual volumes were 5,330 barrels of oil and liquids per day and exceeded guidance levels. On
September 12, 2011, Zargon provided an updated 2011 natural gas production guidance to incorporate a
Jarrow property partner interest acquisition. The revised guidance provided third and fourth quarter 2011
estimates of 22.00 and 21.60 million cubic feet per day, respectively. Third quarter actual volumes were
22.10 million cubic feet per day and exceeded guidance levels. Fourth quarter guidance levels of 5,400
barrels of oil and liquids per day and 21.60 million cubic feet per day are reaffirmed.
Commencing in July of this year, Zargon has set forward-looking production guidance estimates using a
“top-down” approach based on corporate declines and capital program production addition efficiencies.
Specifically, the calculation is based on an average 21 percent annual corporate oil production decline and
field capital program production addition efficiencies of $30,000 per barrel of oil per day (mid-year rates).
The production additions are calculated after the annual deduction of $10 million of capital related to
maintenance or future opportunities. These guidance estimates are then adjusted for acquisitions or
dispositions that may occur.
Based on $55 million of net (non-ASP) capital expenditures in 2012, Zargon’s average oil and liquids
production in 2012 is estimated at 5,650 barrels per day. On a quarterly basis, we are guiding production
volumes of 5,600, 5,400 (spring break-up), 5,700 and 5,900 barrels per day in the 2012 first, second, third
and fourth quarters, respectively. Reflecting essentially no natural gas related capital expenditures in
2012, natural gas production volumes are forecast to track the corporate 15 percent annual natural gas
decline rate and average 18.60 million cubic feet per day in 2012.
(1) Please see comments on “Forward-Looking Statements” in the Management’s Discussion and Analysis section in this report.
MANAGEMENT’S DISCUSSION AND ANALYSIS
5 Z AR G O N O IL & G AS LT D.
Management’s discussion and analysis (“MD&A”) is a review of Zargon Oil & Gas Ltd.’s 2011 third quarter financial results and should be read
in conjunction with the unaudited interim consolidated financial statements and related notes for the three and nine months ended September
30, 2011, the audited consolidated financial statements and related notes for the year ended December 31, 2010 and the unaudited interim
consolidated financial statements and related notes for the three months ended March 31, 2011. The consolidated financial statements have
been prepared in accordance with International Financial Reporting Standards (“IFRS”), which are also generally accepted accounting
principles (“GAAP”) for publicly accountable enterprises in Canada. All amounts are in Canadian dollars unless otherwise noted. All references
to “Zargon” or the “Company” refer to Zargon Oil & Gas Ltd.
In the MD&A, reserves and production are commonly stated in barrels of oil equivalent (“boe”) on the basis that six thousand cubic feet of
natural gas is equivalent to one barrel of oil. Boes may be misleading, particularly if used in isolation. A boe conversion ratio of six thousand
cubic feet of natural gas to one barrel of oil is based on an energy equivalent conversion method primarily applicable to the burner tip and does
not represent a value equivalent at the wellhead.
The following are descriptions of non-GAAP measures used in this MD&A:
� The MD&A contains the term “funds flow from operating activities” (“funds flow”), which should not be considered an alternative to, or more
meaningful than, “cash flows from operating activities” as determined in accordance with IFRS as an indicator of the Company’s financial
performance. This term does not have any standardized meaning as prescribed by IFRS and, therefore, the Company’s determination of
funds flow from operating activities may not be comparable to that reported by other companies. The reconciliation between cash flows from
operating activities and funds flow from operating activities can be found in the table below and in the consolidated statements of cash flows
in the consolidated financial statements. The Company evaluates its performance based on net earnings and funds flow from operating
activities. The Company considers funds flow from operating activities to be a key measure as it demonstrates the Company’s ability to
generate the cash necessary to pay dividends, repay debt and to fund future capital investment. It is also used by research analysts to value
and compare oil and gas companies, and it is frequently included in published research when providing investment recommendations. Funds
flow from operating activities per share is calculated using the diluted weighted average number of shares for the period.
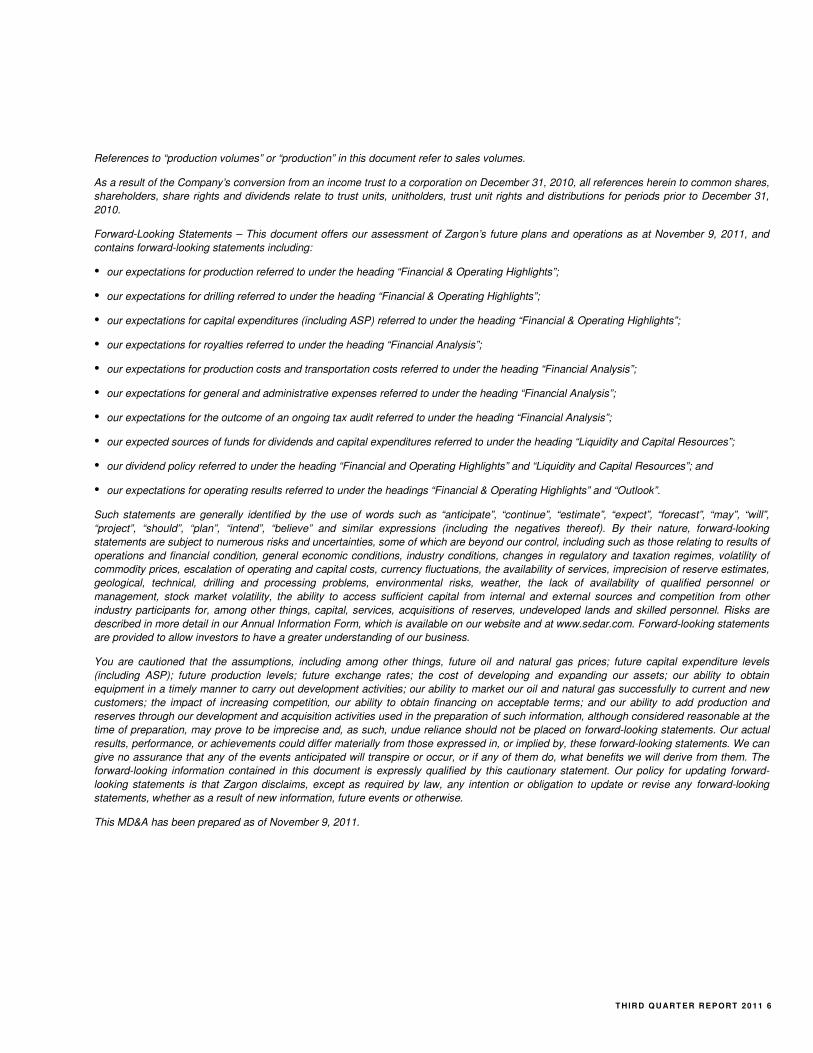
Funds Flow from Operating Activities Reconciliation
Three Months Ended September 30, Nine Months Ended September 30,
($ millions) 2011 2010 2011 2010
Cash flows from operating activities 13.75 19.87 50.29 53.34
Changes in non-cash operating working capital 0.84 (1.56) (6.72) 5.19
Funds flow from operating activities 14.59 18.31 43.57 58.53
� The Company also uses the term “debt net of working capital” or “net debt”. Debt net of working capital, as presented, does not have any
standardized meaning prescribed by IFRS and may not be comparable with the calculation of similar measures for other entities. Debt net of
working capital, as used by the Company, is calculated as bank debt and any working capital deficit excluding unrealized derivative
assets/liabilities and fair value of exchangeable shares.
� Operating netbacks per boe equal total petroleum and natural gas sales per boe adjusted for realized derivative gains and/or losses per boe,
royalties per boe, production costs per boe and transportation costs per boe. Operating netbacks are a useful measure to compare the
Company’s operations with those of its peers.
� Funds flow netbacks per boe are calculated as operating netbacks less general and administrative expenses per boe, transaction costs per
boe, interest and financing charges per boe, asset retirement expenditures per boe, cash portion of exploration and evaluation and other
expense per boe and current income taxes per boe. Funds flow netbacks are a useful measure to compare the Company’s operations with
those of its peers.
T H IR D Q U ART ER R EPORT 20 11 6
References to “production volumes” or “production” in this document refer to sales volumes.
As a result of the Company’s conversion from an income trust to a corporation on December 31, 2010, all references herein to common shares,
shareholders, share rights and dividends relate to trust units, unitholders, trust unit rights and distributions for periods prior to December 31,
2010.
Forward-Looking Statements – This document offers our assessment of Zargon’s future plans and operations as at November 9, 2011, and
contains forward-looking statements including:
� our expectations for production referred to under the heading “Financial & Operating Highlights”;
� our expectations for drilling referred to under the heading “Financial & Operating Highlights”;
� our expectations for capital expenditures (including ASP) referred to under the heading “Financial & Operating Highlights”;
� our expectations for royalties referred to under the heading “Financial Analysis”;
� our expectations for production costs and transportation costs referred to under the heading “Financial Analysis”;
� our expectations for general and administrative expenses referred to under the heading “Financial Analysis”;
� our expectations for the outcome of an ongoing tax audit referred to under the heading “Financial Analysis”;
� our expected sources of funds for dividends and capital expenditures referred to under the heading “Liquidity and Capital Resources”;
� our dividend policy referred to under the heading “Financial and Operating Highlights” and “Liquidity and Capital Resources”; and
� our expectations for operating results referred to under the headings “Financial & Operating Highlights” and “Outlook”.
Such statements are generally identified by the use of words such as “anticipate”, “continue”, “estimate”, “expect”, “forecast”, “may”, “will”,
“project”, “should”, “plan”, “intend”, “believe” and similar expressions (including the negatives thereof). By their nature, forward-looking
statements are subject to numerous risks and uncertainties, some of which are beyond our control, including such as those relating to results of
operations and financial condition, general economic conditions, industry conditions, changes in regulatory and taxation regimes, volatility of
commodity prices, escalation of operating and capital costs, currency fluctuations, the availability of services, imprecision of reserve estimates,
geological, technical, drilling and processing problems, environmental risks, weather, the lack of availability of qualified personnel or
management, stock market volatility, the ability to access sufficient capital from internal and external sources and competition from other
industry participants for, among other things, capital, services, acquisitions of reserves, undeveloped lands and skilled personnel. Risks are
described in more detail in our Annual Information Form, which is available on our website and at www.sedar.com. Forward-looking statements
are provided to allow investors to have a greater understanding of our business.
You are cautioned that the assumptions, including among other things, future oil and natural gas prices; future capital expenditure levels
(including ASP); future production levels; future exchange rates; the cost of developing and expanding our assets; our ability to obtain
equipment in a timely manner to carry out development activities; our ability to market our oil and natural gas successfully to current and new
customers; the impact of increasing competition, our ability to obtain financing on acceptable terms; and our ability to add production and
reserves through our development and acquisition activities used in the preparation of such information, although considered reasonable at the
time of preparation, may prove to be imprecise and, as such, undue reliance should not be placed on forward-looking statements. Our actual
results, performance, or achievements could differ materially from those expressed in, or implied by, these forward-looking statements. We can
give no assurance that any of the events anticipated will transpire or occur, or if any of them do, what benefits we will derive from them. The
forward-looking information contained in this document is expressly qualified by this cautionary statement. Our policy for updating forward-
looking statements is that Zargon disclaims, except as required by law, any intention or obligation to update or revise any forward-looking
statements, whether as a result of new information, future events or otherwise.
This MD&A has been prepared as of November 9, 2011.
7 Z AR G O N O IL & G AS LT D.
TRANSITION TO INTERNATIONAL FINANCIAL REPORTING STANDARDS
The financial information presented herein has been prepared on the basis of International Financial
Reporting Standards (“IFRS”) for the interim consolidated financial statements and is expressed in
Canadian dollars unless otherwise stated.
The amounts in this MD&A and the unaudited interim consolidated financial statements for the three and
nine months ended September 30, 2010 have been restated to reflect our adoption of IFRS, with effect
from January 1, 2010. Periods prior to January 1, 2010 have not been restated and are prepared in
accordance with accounting standards which were in effect in Canada prior to conversion to IFRS
(“Canadian GAAP”). Please refer to Note 19 of our September 30, 2011 unaudited interim consolidated
financial statements for a summary of the differences between our financial statements previously
prepared under Canadian GAAP and to those under IFRS as at and for the three and nine months ended
September 30, 2010 and as at December 31, 2010.
The September 30, 2011 unaudited interim consolidated financial statements and this MD&A have been
prepared using the standards and interpretations currently issued and expected to be effective at the end
of our first annual IFRS reporting period, which will be December 31, 2011. Subsequent changes to IFRS
may be given effect in the Company’s December 31, 2011 annual consolidated financial statements and
could result in a restatement of the September 30, 2011 unaudited interim statements and the January 1,
2010 underlying values prepared on a basis consistent with IFRS.
The key areas of adjustment to the January 1, 2010 and December 31, 2010 balance sheets as a result of
the transition to IFRS were as follows:
� Impairment of Property, Plant and Equipment (“PP&E”) under IFRS was tested as required on initial
transition to IFRS based on discounted cash flows for each Cash Generating Unit (“CGU”), which is a
more granular level than what was required under Canadian GAAP. Also, under Canadian GAAP, a
discounted cash flow analysis was not required if the undiscounted cash flows from proved reserves
exceeded the carrying amount. At January 1, 2010, no impairment was identified. Impairment of PP&E
must also be assessed whenever there is an indication of impairment such as changes in commodity
prices or operational performance. Based on the reduction in natural gas prices in the fourth quarter of
2010, an impairment test was undertaken which resulted in recording impairment losses to PP&E
totalling $22.87 million for four CGU’s at December 31, 2010.
� The provision for asset retirement obligations was re-measured at January 1, 2010 and each
subsequent reporting period using the risk-free discount rate in effect at that time. Under Canadian
GAAP, a credit-adjusted rate was used and, once recorded, asset retirement obligations were not
adjusted for future changes in discount rates.
� Exploration and Evaluation (“E&E”) expenditures were reclassified from PP&E and included as
“Exploration and evaluation assets” on the consolidated balance sheets and consist of undeveloped
land. The E&E assets will not be depleted and were evaluated each reporting period to determine
whether they should be reclassified to PP&E as developed and producing assets. E&E assets must be
assessed for impairment when indicators of impairment exist. No impairments were recorded.
� The Company’s exchangeable shares were reclassified to current liabilities and re-measured to fair
value at January 1, 2010 and at each reporting period. The resulting gains or losses were reported in
the statement of earnings. Under Canadian GAAP, the exchangeable shares were reported as a non-
controlling interest. All outstanding exchangeable shares were converted to common shares in
conjunction with the December 31, 2010 corporate conversion.
� The Zargon Energy Trust portion of the deferred tax liability was re-measured on transition at January
1, 2010 using the top personal marginal tax rate as required by IFRS due to the trust structure that
existed at the time. Upon the Company’s conversion to a corporate structure at December 31, 2010, the
T H IR D Q U ART ER R EPORT 20 11 8
deferred tax liability was re-measured using the applicable federal corporate income tax rate, which was
the rate that had been used under Canadian GAAP for both trust and corporate structures.
� For the reporting periods in which the Company was structured as an income trust, the unit-based
compensation was considered under IFRS to be cash-settled and was therefore classified as a liability
on the balance sheet and re-measured at fair value at each reporting period. Upon conversion to a
corporation, the unit-based compensation liability was reclassified to contributed surplus.
� The functional currency for the Company’s US subsidiaries was determined to be US dollars, while the
presentation currency for the consolidated entity is Canadian dollars. As a result, under IFRS, all items
on the US consolidated balance sheet with the exception of equity must be converted using the foreign
exchange rate in effect at the end of each reporting period. The initial adjustment was recorded against
retained earnings and adjustments for each subsequent reporting period are recorded to the currency
translation adjustment in equity and other comprehensive income.
The additional impacts of the IFRS transition on the Company’s statement of earnings are as follows:
� Depreciation and depletion costs have decreased due to an IFRS-permitted depletion policy utilizing
proved and probable reserves as the depletion base. Previously, the Company’s depletion was
calculated on proved reserves only.
� Under Canadian GAAP, gains and losses were not calculated on asset dispositions unless a significant
portion (generally 20 percent or more) of an asset pool was being disposed. Under IFRS, all asset
disposals must be assessed to determine whether a gain or loss has occurred. As a result, the
Company is reporting gains/losses on disposal of PP&E in its IFRS statement of earnings which were
previously not reported under Canadian GAAP.
� Exploration and evaluation expenses encompass pre-licence costs and expired lands.
� Share-based compensation expenses have been accelerated under IFRS as a result of the required
use of a graded vesting schedule versus the straight-line method which was permitted under Canadian
GAAP and the application of a forfeiture rate in the calculation under IFRS rather than recording
forfeitures as incurred, which was permissible under Canadian GAAP.
� Future income taxes are now referred to as deferred taxes.
Further details on the impacts of the IFRS transition can be found in Note 19 to the unaudited interim
consolidated financial statements.
SUMMARY OF SIGNIFICANT EVENTS IN THE THIRD QUARTER
� The Company realized funds flow from operating activities of $14.59 million and declared dividends of
$12.25 million ($10.75 million in cash after considering the common shares issued for the Dividend
Reinvestment Plan, (“DRIP”)) or $0.42 per common share to shareholders. For Canadian income tax
purposes, all dividends paid or to be paid on Zargon’s common shares are designated as "eligible
dividends".
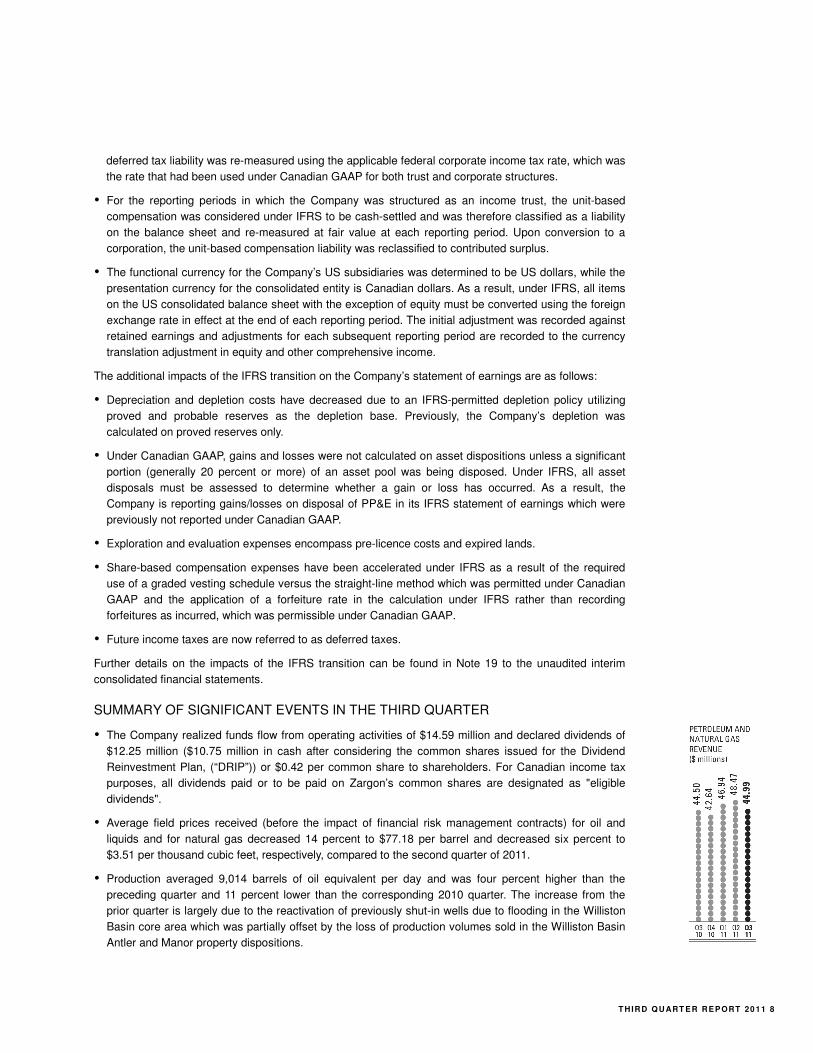
� Average field prices received (before the impact of financial risk management contracts) for oil and
liquids and for natural gas decreased 14 percent to $77.18 per barrel and decreased six percent to
$3.51 per thousand cubic feet, respectively, compared to the second quarter of 2011.
� Production averaged 9,014 barrels of oil equivalent per day and was four percent higher than the
preceding quarter and 11 percent lower than the corresponding 2010 quarter. The increase from the
prior quarter is largely due to the reactivation of previously shut-in wells due to flooding in the Williston
Basin core area which was partially offset by the loss of production volumes sold in the Williston Basin
Antler and Manor property dispositions.
9 Z AR G O N O IL & G AS LT D.
� During the third quarter of 2011, Zargon drilled 18 gross oil wells (14.2 net) with a 100 percent success
rate. Total field exploration and development capital expenditures (excluding corporate and net property
dispositions) were $17.97 million for the quarter compared to $7.73 million for the prior quarter. During
the quarter, Zargon closed $22.66 million of net property dispositions. The largest dispositions
comprised of two Williston Basin properties producing a total of 260 barrels of oil per day and the
acquisition comprised of consolidating our working interest in the Jarrow operated area.
� As announced in our September 12, 2011 press release, effective for the October 2011 dividend, to be
paid on November 15, 2011, Zargon will reduce its monthly dividend to $0.10 per common share from
the previous monthly rate of $0.14 per common share.
FINANCIAL ANALYSIS
Third quarter 2011 gross petroleum and natural gas sales of $44.99 million were seven percent lower than
the $48.47 million in the second quarter of 2011 and one percent above the $44.50 million in the third
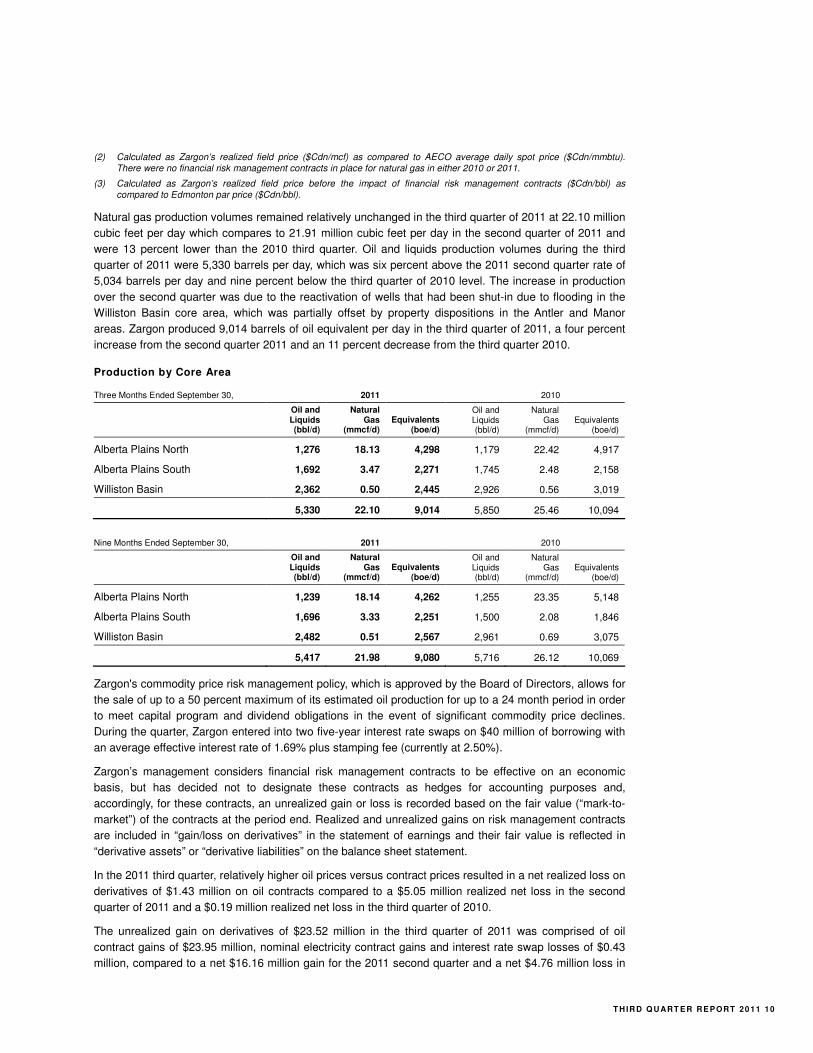
quarter of 2010. Third quarter 2011 realized oil and liquids field prices averaged $77.18 per barrel before
the impact of financial risk management contracts and were 14 percent lower than the preceding quarter’s
$89.55 per barrel and 14 percent higher than the $67.64 per barrel recorded in the 2010 third quarter.
Zargon’s crude oil field price differential from the Edmonton par price increased to $14.61 per barrel in the
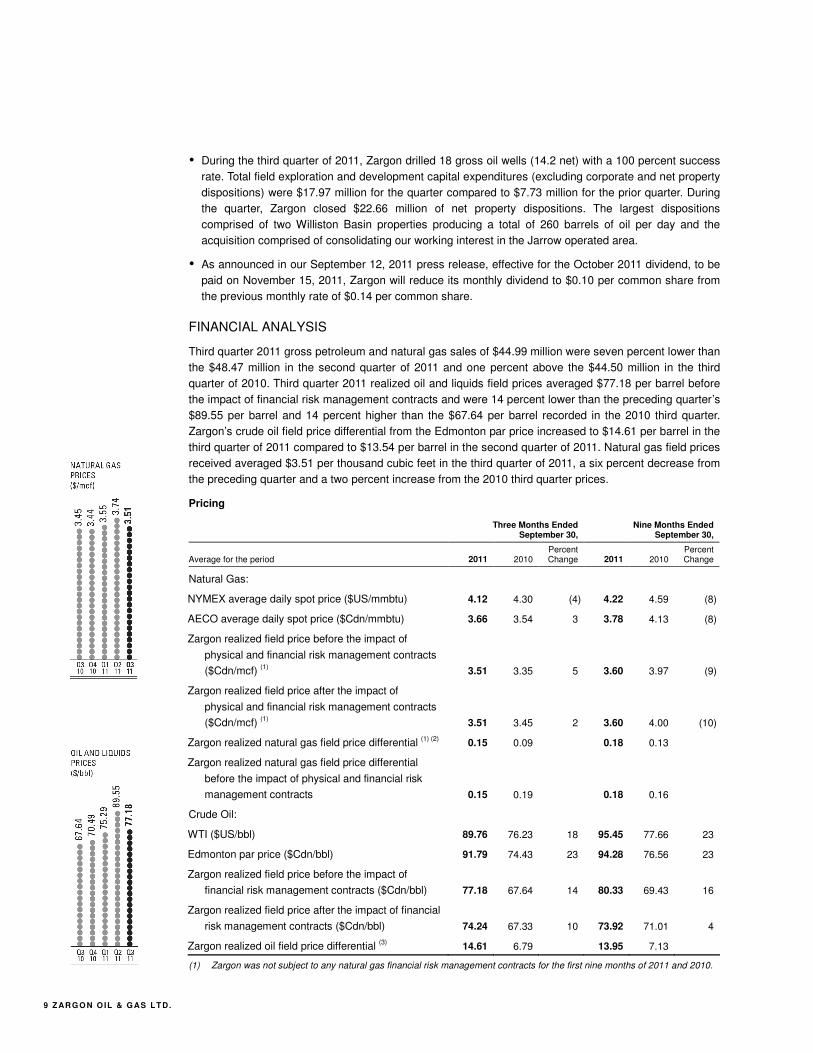
third quarter of 2011 compared to $13.54 per barrel in the second quarter of 2011. Natural gas field prices
received averaged $3.51 per thousand cubic feet in the third quarter of 2011, a six percent decrease from
the preceding quarter and a two percent increase from the 2010 third quarter prices.
Pricing
Three Months Ended
September 30, Nine Months Ended
September 30,
Average for the period 2011 2010 Percent Change 2011 2010
Percent Change
Natural Gas:
NYMEX average daily spot price ($US/mmbtu) 4.12 4.30 (4) 4.22 4.59 (8)
AECO average daily spot price ($Cdn/mmbtu) 3.66 3.54 3 3.78 4.13 (8)
Zargon realized field price before the impact of
physical and financial risk management contracts
($Cdn/mcf) (1) 3.51 3.35 5 3.60 3.97 (9)
Zargon realized field price after the impact of
physical and financial risk management contracts
($Cdn/mcf) (1) 3.51 3.45 2 3.60 4.00 (10)
Zargon realized natural gas field price differential (1) (2) 0.15 0.09 0.18 0.13
Zargon realized natural gas field price differential
before the impact of physical and financial risk
management contracts 0.15 0.19 0.18 0.16
Crude Oil:
WTI ($US/bbl) 89.76 76.23 18 95.45 77.66 23
Edmonton par price ($Cdn/bbl) 91.79 74.43 23 94.28 76.56 23
Zargon realized field price before the impact of
financial risk management contracts ($Cdn/bbl) 77.18 67.64 14 80.33 69.43 16
Zargon realized field price after the impact of financial
risk management contracts ($Cdn/bbl) 74.24 67.33 10 73.92 71.01 4
Zargon realized oil field price differential (3) 14.61 6.79 13.95 7.13
(1) Zargon was not subject to any natural gas financial risk management contracts for the first nine months of 2011 and 2010.
T H IR D Q U ART ER R EPORT 20 11 10
(2) Calculated as Zargon’s realized field price ($Cdn/mcf) as compared to AECO average daily spot price ($Cdn/mmbtu). There were no financial risk management contracts in place for natural gas in either 2010 or 2011.
(3) Calculated as Zargon’s realized field price before the impact of financial risk management contracts ($Cdn/bbl) as compared to Edmonton par price ($Cdn/bbl).
Natural gas production volumes remained relatively unchanged in the third quarter of 2011 at 22.10 million
cubic feet per day which compares to 21.91 million cubic feet per day in the second quarter of 2011 and
were 13 percent lower than the 2010 third quarter. Oil and liquids production volumes during the third
quarter of 2011 were 5,330 barrels per day, which was six percent above the 2011 second quarter rate of
5,034 barrels per day and nine percent below the third quarter of 2010 level. The increase in production
over the second quarter was due to the reactivation of wells that had been shut-in due to flooding in the
Williston Basin core area, which was partially offset by property dispositions in the Antler and Manor
areas. Zargon produced 9,014 barrels of oil equivalent per day in the third quarter of 2011, a four percent
increase from the second quarter 2011 and an 11 percent decrease from the third quarter 2010.
Production by Core Area
Three Months Ended September 30, 2011 2010
Oil and Liquids (bbl/d)
Natural Gas
(mmcf/d) Equivalents
(boe/d)
Oil and Liquids (bbl/d)
Natural Gas
(mmcf/d) Equivalents
(boe/d)
Alberta Plains North 1,276 18.13 4,298 1,179 22.42 4,917
Alberta Plains South 1,692 3.47 2,271 1,745 2.48 2,158
Williston Basin 2,362 0.50 2,445 2,926 0.56 3,019
5,330 22.10 9,014 5,850 25.46 10,094
Nine Months Ended September 30, 2011 2010
Oil and Liquids (bbl/d)
Natural Gas
(mmcf/d) Equivalents
(boe/d)
Oil and Liquids (bbl/d)
Natural Gas
(mmcf/d) Equivalents
(boe/d)
Alberta Plains North 1,239 18.14 4,262 1,255 23.35 5,148
Alberta Plains South 1,696 3.33 2,251 1,500 2.08 1,846
Williston Basin 2,482 0.51 2,567 2,961 0.69 3,075
5,417 21.98 9,080 5,716 26.12 10,069
Zargon's commodity price risk management policy, which is approved by the Board of Directors, allows for
the sale of up to a 50 percent maximum of its estimated oil production for up to a 24 month period in order
to meet capital program and dividend obligations in the event of significant commodity price declines.
During the quarter, Zargon entered into two five-year interest rate swaps on $40 million of borrowing with
an average effective interest rate of 1.69% plus stamping fee (currently at 2.50%).
Zargon’s management considers financial risk management contracts to be effective on an economic
basis, but has decided not to designate these contracts as hedges for accounting purposes and,
accordingly, for these contracts, an unrealized gain or loss is recorded based on the fair value (“mark-to-
market”) of the contracts at the period end. Realized and unrealized gains on risk management contracts
are included in “gain/loss on derivatives” in the statement of earnings and their fair value is reflected in
“derivative assets” or “derivative liabilities” on the balance sheet statement.
In the 2011 third quarter, relatively higher oil prices versus contract prices resulted in a net realized loss on
derivatives of $1.43 million on oil contracts compared to a $5.05 million realized net loss in the second
quarter of 2011 and a $0.19 million realized net loss in the third quarter of 2010.
The unrealized gain on derivatives of $23.52 million in the third quarter of 2011 was comprised of oil
contract gains of $23.95 million, nominal electricity contract gains and interest rate swap losses of $0.43
million, compared to a net $16.16 million gain for the 2011 second quarter and a net $4.76 million loss in
1 1 Z AR GO N O IL & G AS LT D .
the third quarter of 2010. These non-cash unrealized derivative gains or losses are generated by the
change over the reporting period in the mark-to-market valuation of Zargon’s risk management contracts.
Recent volatility in commodity prices has resulted in significant fluctuations in the mark-to-market amount
of unrealized derivative assets and liabilities. The period-over-period change in these valuations directly
impacts net earnings. Zargon’s commodity risk management positions are described in Note 4 to the
unaudited interim consolidated financial statements.
Royalties, inclusive of the Saskatchewan Resource Surcharge (“SRC”), totalled $8.62 million for the third
quarter of 2011, a decrease of nine percent from the $9.53 million preceding quarter expense and an
increase of 13 percent from $7.65 million in the third quarter of 2010. Although the variations in royalty
rates generally track changes in production volumes and prices, the increases in the 2011 second and
third quarters resulted mainly from a change in 2010 royalty and SRC estimates which were recorded in
the 2011 periods. Reflecting the 2011 commodity prices and the modified royalty structure, on a
consolidated basis, the third quarter of 2011 royalties resulted in a rate of 19.2 percent compared to 19.7
percent in the second quarter of 2011. For the remainder of 2011 and for the 2012 year, Zargon expects
its royalty rate to remain in the 17 to 19 percent range, but will ultimately depend on the actual price
received for our production.
On a unit of production basis, production costs (excluding transportation costs) of $16.37 per barrel of oil
equivalent in the third quarter of 2011 decreased five percent from the preceding quarter and increased 30
percent from the $12.57 per barrel of oil equivalent in the third quarter of 2010. Year-over-year, a
significant portion of the increase in the production costs stem from the change in accounting policy
regarding the capitalization of workovers, further costs incurred due to the flooding and surface access
problems experienced in the second and third quarters of 2011 as well as decreased production volumes
at fixed operating cost properties. Oil and natural gas liquids transportation costs in the third quarter of
2011 were $0.50 per barrel of oil equivalent, which compares to $0.57 per barrel of oil equivalent in the
previous quarter and $0.34 per barrel of oil equivalent in the third quarter of 2010. With the operating cost
challenges in the second and third quarter of this year relating to flooding and surface access problems
behind us, we anticipate that the summation of production and transportation costs can be held to less
than $17 per barrel of oil equivalent for the remainder of 2011 and 2012.
Operating Netbacks
Three Months Ended September 30, 2011 2010
Oil and Liquids
($/bbl)
Natural Gas
($/mcf)
Oil and Liquids ($/bbl)
Natural Gas
($/mcf)
Sales 77.18 3.51 67.64 3.45
Royalties (16.39) (0.29) (12.98) (0.29)
Realized gain/(loss) on derivatives (2.94) – (0.31) –
Production costs (17.72) (2.40) (13.09) (1.98)
Transportation costs (0.85) – (0.59) –
Operating netbacks 39.28 0.82 40.67 1.18

T H IR D Q U ART ER R EPORT 20 11 12
Nine Months Ended September 30, 2011 2010
Oil and Liquids
($/bbl)
Natural Gas
($/mcf)
Oil and Liquids ($/bbl)
Natural Gas
($/mcf)
Sales 80.33 3.60 69.43 4.00
Royalties (15.65) (0.43) (13.62) (0.47)
Realized gain/(loss) on derivatives (6.41) – 1.58 –
Production costs (16.18) (2.74) (12.70) (2.10)
Transportation costs (0.86) – (0.57) –
Operating netbacks 41.23 0.43 44.12 1.43
Measured on a unit of production basis (net of recoveries), general and administrative (“G&A”) expenses
were $4.76 per barrel of oil equivalent in the third quarter of 2011 compared to $4.26 in the third quarter of
2010 and $4.23 for the twelve month period of 2010. G&A expenses of $3.95 million for the third quarter of
2011 were nominally lower than the total G&A expenses for the prior quarter and for the third quarter of
2010. For the first nine months of 2011, the increase on a unit of production basis is due primarily to the
lower production volumes as G&A expenses decreased from $11.87 million in 2010 to $11.45 million in
2011. Going forward, Zargon anticipates that G&A expenses, exclusive of transaction costs or other one-
time adjustments can be held to less than $5 per barrel of oil equivalent for the remainder of 2011 and
2012.
Zargon’s borrowings are through its syndicated bank credit facilities. Interest and financing charges on
these facilities in the 2011 third quarter were $1.06 million, 18 percent lower than the previous quarter
amount of $1.30 million and 14 percent lower than the $1.23 million in the third quarter of 2010. In
particular, bank debt levels were decreased in July 2011, when Zargon closed the sale of two Williston
Basin properties for a cash consideration of $24.65 million. The lower interest and financing charges
compared to the third quarter of 2010 resulted from lower average borrow levels and lower average
borrowing costs.
Zargon is subject to normal course income tax audits by Canadian and US taxation authorities. During the
fourth quarter of 2010, the Canada Revenue Agency (“CRA”) commenced a flow-through share audit of a
predecessor company from a prior corporate acquisition. During the first quarter of 2011, Zargon recorded
a $1.27 million provision which was comprised of a $0.92 million charge to current income tax expense
and $0.35 million charge to interest expense for the related Part XII.6 tax, with respect to this ongoing
income tax audit. No additional charges were recorded in the 2011 second and third quarters and, at this
time, Zargon is uncertain of the timing and final outcome of this matter.
Current income taxes for the 2011 third quarter were $0.55 million, and relate to the US operations. When
compared to prior periods, current income taxes increased $0.23 million from the 2010 third quarter and
increased $0.31 million relative to the second quarter of 2011. Total corporate tax pools as at September
30, 2011, are approximately $331 million, which represents a decrease of four percent from the
comparable $346 million of tax pools available to Zargon at December 31, 2010, primarily as a result of
the 2011 property disposition program.
Exploration and evaluation expenses for the 2011 third quarter of $0.96 million were $0.24 million higher
than the $0.72 million incurred in the second quarter of 2011 and were $0.50 million higher than the third
quarter of 2010 expenses of $0.46 million. Exploration and evaluation expenses are mainly driven by land
expiries in a quarter.
1 3 Z AR GO N O IL & G AS LT D .
Corporate Netbacks
Three Months Ended
September 30, Nine Months Ended
September 30,
($/boe) 2011 2010 2011 2010
Petroleum and natural gas sales 54.25 47.91 56.64 49.78
Royalties (10.40) (8.24) (10.38) (8.95)
Realized gain/(loss) on derivatives (1.73) (0.21) (3.83) 0.88
Production costs (16.37) (12.57) (16.29) (12.65)
Transportation costs (0.50) (0.34) (0.51) (0.32)
Operating netbacks 25.25 26.55 25.63 28.74
General and administrative (4.76) (4.26) (4.62) (4.32)
Exploration and evaluation expense – (0.20) – (0.21)
Transaction costs (0.19) – (0.06) –
Interest and financing charges (1.28) (1.33) (1.69) (1.27)
Asset retirement expenditures (0.77) (0.71) (0.82) (0.96)
Capital and current income taxes (0.66) (0.35) (0.87) (0.69)
Funds flow netbacks 17.59 19.70 17.57 21.29
Depletion and depreciation expense for the third quarter of 2011 increased nine percent to $12.51 million
from $11.45 million in the prior quarter and decreased three percent when compared to the third quarter of
2010 expense of $12.94 million. On a per barrel of oil equivalent basis, the depletion and depreciation
rates were $15.08, $14.48 and $13.93 for the third and second quarters of 2011 and the third quarter of
2010, respectively. When compared to the prior quarter, the increased depletion expense and per barrel of
oil equivalent amount are primarily as a result of reactivated shut-in oil production in the Williston Basin
core area. The 2010 calendar year depletion and depreciation rate was $13.65 per barrel of oil equivalent.
Under pre-2011 Canadian GAAP, gains and losses were not calculated on asset dispositions unless a
significant portion (generally 20 percent or more) of an asset pool was being disposed. Under IFRS, all
asset disposals must be assessed to determine whether a gain or loss has occurred. As a result of the
2011 third quarter property dispositions, the Company is reporting third quarter gains of $18.12 million
($18.35 million for the first nine months of 2011) on disposal of capital assets in its statement of earnings
which were previously not reported under pre-2011 Canadian GAAP.
The accretion expense of asset retirement obligations for the first nine months of 2011 was $2.43 million,
a seven percent increase compared to the first nine months of 2010. The year-over-year increase is due
to changes in the estimated future liability for asset retirement obligations as a result of wells added
through Zargon’s drilling program inclusive of wells acquired/disposed of in the current year.
Expensing of share-based compensation in the third quarter of 2011 totalled $0.66 million, which is higher
than the $0.56 million incurred in the third quarter of 2010 mainly due to the new share-based plan
implemented on January 1, 2011 in conjunction with the corporate conversion, and is slightly higher than
the $0.51 million incurred in the second quarter of 2011, due to prior quarter forfeitures.
The deferred tax expense for the third quarter of 2011 was $11.18 million compared to an expense of
$4.26 million in the prior quarter and a recovery of $3.10 million in the third quarter of 2010. As a
corporation, Zargon’s deferred tax obligations are not reduced by dividend declarations. Prior to 2011, as
a trust, cash distributions were 100 percent deductible. This change in tax structure is the primary reason
for the 2011 third quarter tax expense relative to the 2010 third quarter recovery.
T H IR D Q U ART ER R EPORT 20 11 14
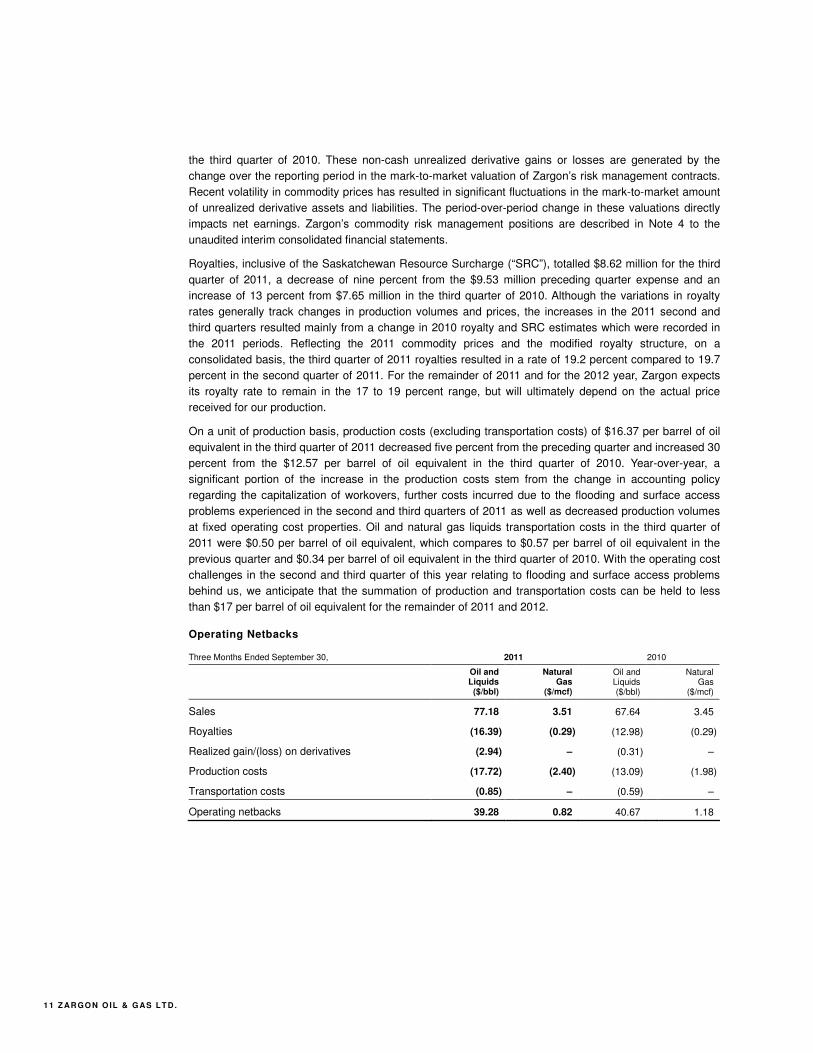
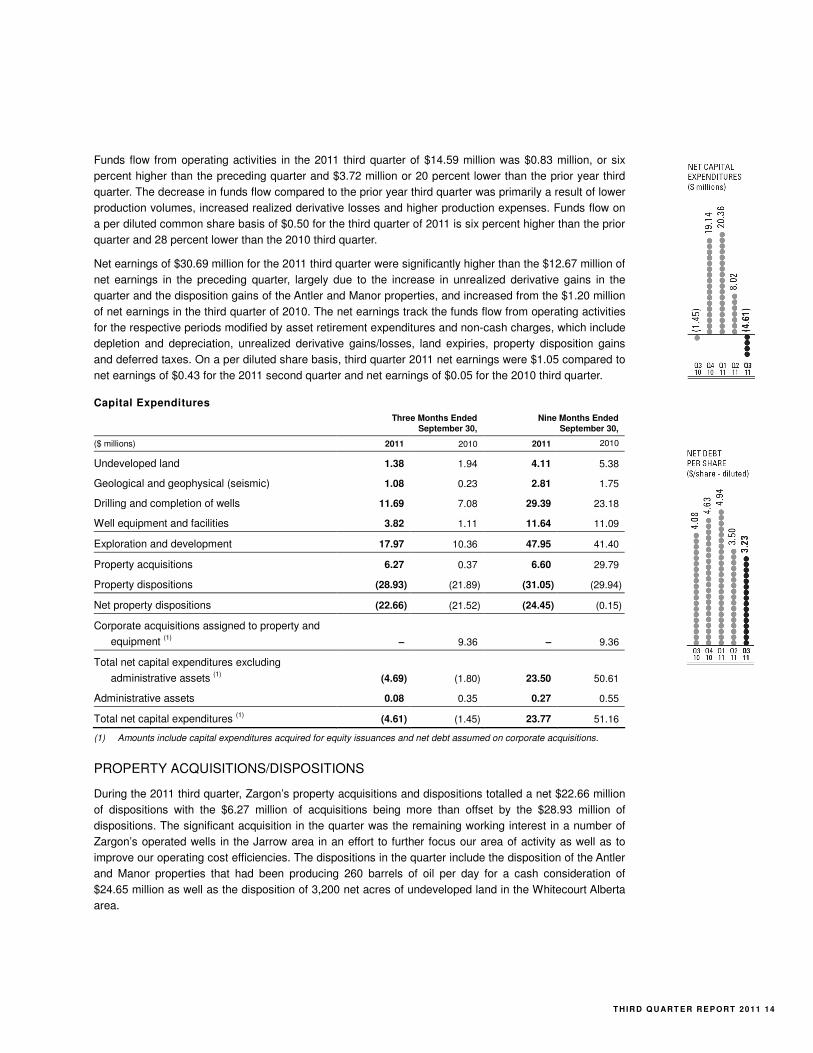
Funds flow from operating activities in the 2011 third quarter of $14.59 million was $0.83 million, or six
percent higher than the preceding quarter and $3.72 million or 20 percent lower than the prior year third
quarter. The decrease in funds flow compared to the prior year third quarter was primarily a result of lower
production volumes, increased realized derivative losses and higher production expenses. Funds flow on
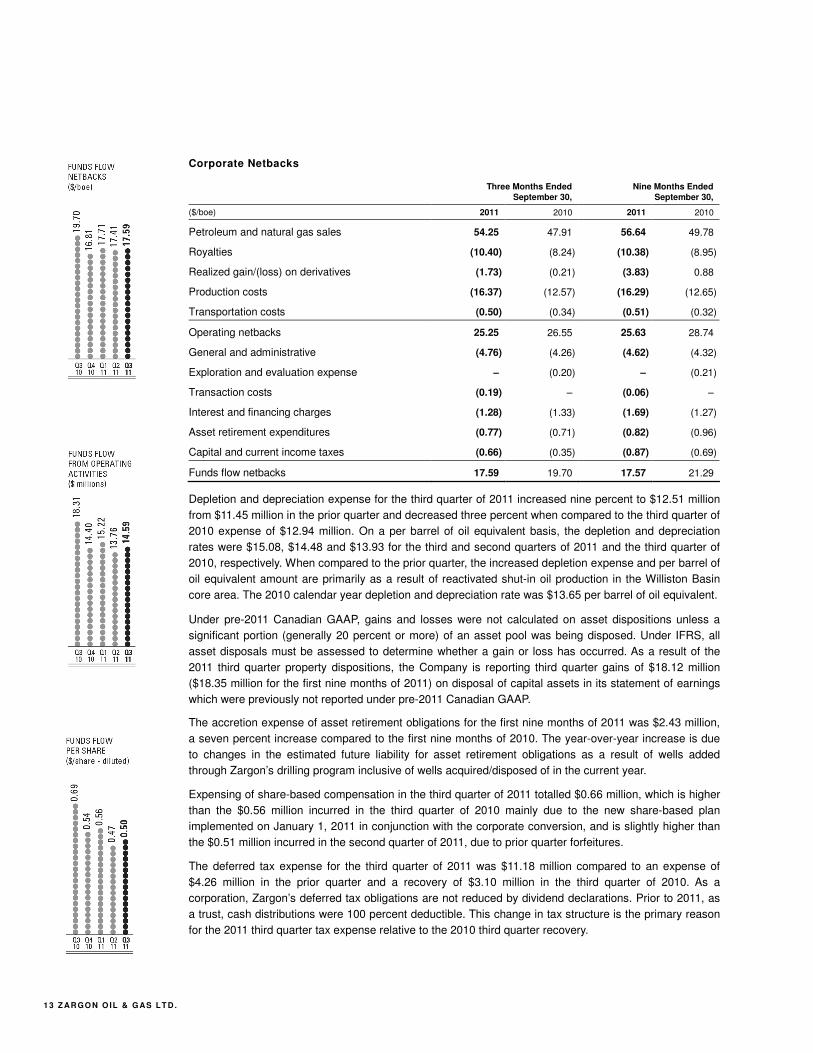
a per diluted common share basis of $0.50 for the third quarter of 2011 is six percent higher than the prior
quarter and 28 percent lower than the 2010 third quarter.
Net earnings of $30.69 million for the 2011 third quarter were significantly higher than the $12.67 million of
net earnings in the preceding quarter, largely due to the increase in unrealized derivative gains in the
quarter and the disposition gains of the Antler and Manor properties, and increased from the $1.20 million
of net earnings in the third quarter of 2010. The net earnings track the funds flow from operating activities
for the respective periods modified by asset retirement expenditures and non-cash charges, which include
depletion and depreciation, unrealized derivative gains/losses, land expiries, property disposition gains
and deferred taxes. On a per diluted share basis, third quarter 2011 net earnings were $1.05 compared to
net earnings of $0.43 for the 2011 second quarter and net earnings of $0.05 for the 2010 third quarter.
Capital Expenditures
Three Months Ended
September 30, Nine Months Ended
September 30,
($ millions) 2011 2010 2011 2010
Undeveloped land 1.38 1.94 4.11 5.38
Geological and geophysical (seismic) 1.08 0.23 2.81 1.75
Drilling and completion of wells 11.69 7.08 29.39 23.18
Well equipment and facilities 3.82 1.11 11.64 11.09
Exploration and development 17.97 10.36 47.95 41.40
Property acquisitions 6.27 0.37 6.60 29.79
Property dispositions (28.93) (21.89) (31.05) (29.94)
Net property dispositions (22.66) (21.52) (24.45) (0.15)
Corporate acquisitions assigned to property and
equipment (1) – 9.36 – 9.36
Total net capital expenditures excluding
administrative assets (1) (4.69) (1.80) 23.50 50.61
Administrative assets 0.08 0.35 0.27 0.55
Total net capital expenditures (1) (4.61) (1.45) 23.77 51.16
(1) Amounts include capital expenditures acquired for equity issuances and net debt assumed on corporate acquisitions.
PROPERTY ACQUISITIONS/DISPOSITIONS
During the 2011 third quarter, Zargon’s property acquisitions and dispositions totalled a net $22.66 million
of dispositions with the $6.27 million of acquisitions being more than offset by the $28.93 million of
dispositions. The significant acquisition in the quarter was the remaining working interest in a number of
Zargon’s operated wells in the Jarrow area in an effort to further focus our area of activity as well as to
improve our operating cost efficiencies. The dispositions in the quarter include the disposition of the Antler
and Manor properties that had been producing 260 barrels of oil per day for a cash consideration of
$24.65 million as well as the disposition of 3,200 net acres of undeveloped land in the Whitecourt Alberta
area.

1 5 Z AR GO N O IL & G AS LT D .
LIQUIDITY AND CAPITAL RESOURCES
Total net capital expenditures (including net property acquisitions) totalled a divestiture of $4.61 million in
the third quarter of 2011 and were 218 percent lower than the same period in 2010. Field expenditures of
$17.97 million for the third quarter of 2011 were 73 percent higher than the 2010 third quarter. Following
the Williston Basin, Alberta Plains North and Alberta Plains South drilling programs, Zargon drilled 14.2 net
wells in the third quarter compared to 4.8 net wells drilled in the same period in 2010. Field capital
expenditures (excluding net property dispositions) for the first nine months of 2011 were allocated to
Alberta Plains North – $16.60 million, Alberta Plains South – $11.09 million and Williston Basin – $20.26
million.
Funds flow from operating activities in the first nine months of 2011 of $43.57 million and proceeds from
the issuance of common shares of $42.48 million (due to share right exercises and the equity issuance)
funded the decrease in bank debt, the capital program, the changes in working capital and the cash
dividends to shareholders.
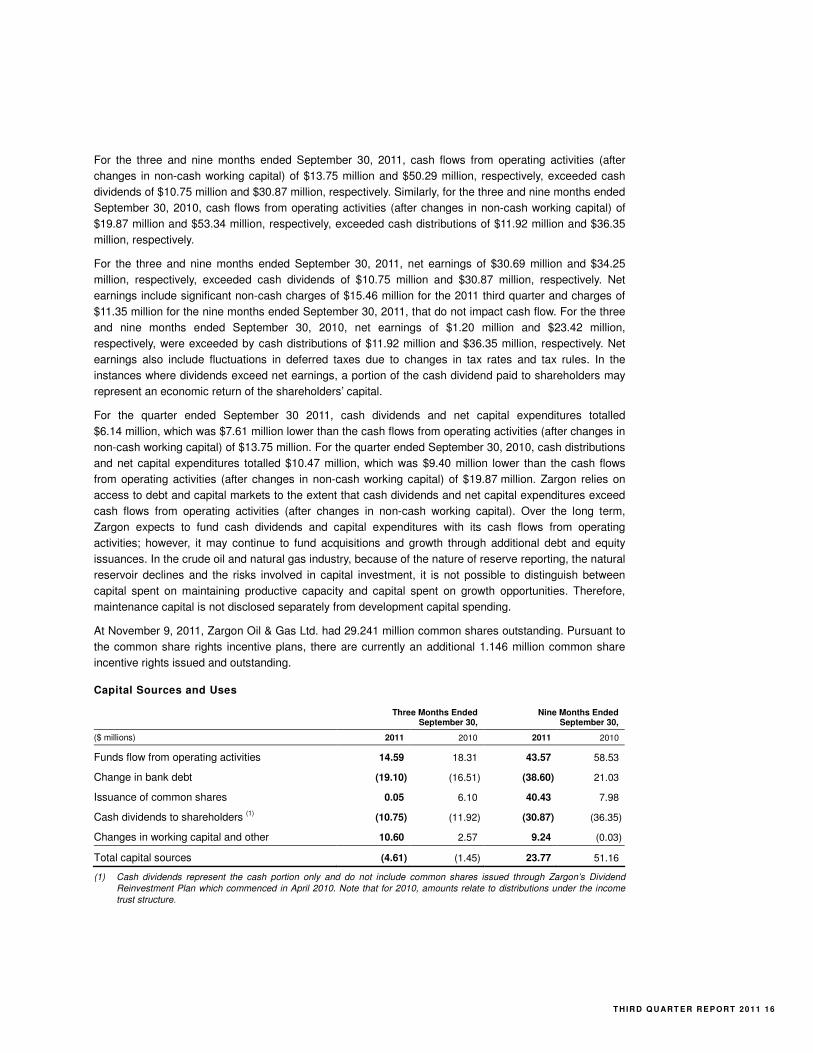
At September 30, 2011, the Company’s combined debt net of working capital (excluding unrealized
derivative assets/liabilities) was $94.49 million, which represents approximately 52 percent of the
Company’s available credit facilities at September 30, 2011 and compares to $124.39 million of net debt at
the end of 2010.
The volatility of oil and natural gas prices, uncertainty or modifications regarding royalties and Canadian
income tax rules and global economic/political concerns have, on occasion, restricted the oil and natural
gas industry’s ability to attract new capital from debt and equity markets.
Cash Dividends Analysis
Three Months Ended
September 30, Nine Months Ended
September 30,
($ millions) 2011 2010 2011 2010
Cash flows from operating activities 13.75 19.87 50.29 53.34
Net earnings 30.69 1.20 34.25 23.42
Actual cash dividends paid or payable relating to the
period (1) (10.75) (11.92) (30.87) (36.35)
Excess of cash flows from operating activities over
cash dividends paid 3.00 7.95 19.42 16.99
Excess (shortfall) of net earnings over cash
dividends paid 19.94 (10.72) 3.38 (12.93)
(1) Cash dividends represent the cash portion only and do not include common shares issued through Zargon’s Dividend Reinvestment Plan which commenced in April 2010. Note that for 2010, amounts relate to distributions under the income trust structure.
During the first nine months of 2011, Zargon has maintained a base monthly dividend of $0.14 per
common share. Management monitors the Company’s dividend policy with respect to forecasted net cash
flows, debt levels and capital expenditures. Zargon’s cash dividends are discretionary to the extent that
these dividends are in compliance with Section 43 of the Business Corporations Act (Alberta) and do not
cause a breach of the financial covenants under Zargon’s credit facilities. As a crude oil and natural gas
Company, Zargon’s reserve base is depleted with production and Zargon, therefore, relies on ongoing
exploration/exploitation, development and acquisition activities to replace reserves and to offset
production declines. The success of these exploration/exploitation, development and acquisition capital
programs, along with commodity price fluctuations and the Company’s ability to manage costs, are the
main factors influencing the sustainability of the Company’s dividends. Effective October 1, Zargon has
reduced its monthly dividend to $0.10 in order to provide an improved balance between cash flows, capital
expenditures and dividends.
T H IR D Q U ART ER R EPORT 20 11 16
For the three and nine months ended September 30, 2011, cash flows from operating activities (after
changes in non-cash working capital) of $13.75 million and $50.29 million, respectively, exceeded cash
dividends of $10.75 million and $30.87 million, respectively. Similarly, for the three and nine months ended
September 30, 2010, cash flows from operating activities (after changes in non-cash working capital) of
$19.87 million and $53.34 million, respectively, exceeded cash distributions of $11.92 million and $36.35
million, respectively.
For the three and nine months ended September 30, 2011, net earnings of $30.69 million and $34.25
million, respectively, exceeded cash dividends of $10.75 million and $30.87 million, respectively. Net
earnings include significant non-cash charges of $15.46 million for the 2011 third quarter and charges of
$11.35 million for the nine months ended September 30, 2011, that do not impact cash flow. For the three
and nine months ended September 30, 2010, net earnings of $1.20 million and $23.42 million,
respectively, were exceeded by cash distributions of $11.92 million and $36.35 million, respectively. Net
earnings also include fluctuations in deferred taxes due to changes in tax rates and tax rules. In the
instances where dividends exceed net earnings, a portion of the cash dividend paid to shareholders may
represent an economic return of the shareholders’ capital.
For the quarter ended September 30 2011, cash dividends and net capital expenditures totalled
$6.14 million, which was $7.61 million lower than the cash flows from operating activities (after changes in
non-cash working capital) of $13.75 million. For the quarter ended September 30, 2010, cash distributions
and net capital expenditures totalled $10.47 million, which was $9.40 million lower than the cash flows
from operating activities (after changes in non-cash working capital) of $19.87 million. Zargon relies on
access to debt and capital markets to the extent that cash dividends and net capital expenditures exceed
cash flows from operating activities (after changes in non-cash working capital). Over the long term,
Zargon expects to fund cash dividends and capital expenditures with its cash flows from operating
activities; however, it may continue to fund acquisitions and growth through additional debt and equity
issuances. In the crude oil and natural gas industry, because of the nature of reserve reporting, the natural
reservoir declines and the risks involved in capital investment, it is not possible to distinguish between
capital spent on maintaining productive capacity and capital spent on growth opportunities. Therefore,
maintenance capital is not disclosed separately from development capital spending.
At November 9, 2011, Zargon Oil & Gas Ltd. had 29.241 million common shares outstanding. Pursuant to
the common share rights incentive plans, there are currently an additional 1.146 million common share
incentive rights issued and outstanding.
Capital Sources and Uses
Three Months Ended
September 30, Nine Months Ended
September 30,
($ millions) 2011 2010 2011 2010
Funds flow from operating activities 14.59 18.31 43.57 58.53
Change in bank debt (19.10) (16.51) (38.60) 21.03
Issuance of common shares 0.05 6.10 40.43 7.98
Cash dividends to shareholders (1) (10.75) (11.92) (30.87) (36.35)
Changes in working capital and other 10.60 2.57 9.24 (0.03)
Total capital sources (4.61) (1.45) 23.77 51.16
(1) Cash dividends represent the cash portion only and do not include common shares issued through Zargon’s Dividend Reinvestment Plan which commenced in April 2010. Note that for 2010, amounts relate to distributions under the income trust structure.
1 7 Z AR GO N O IL & G AS LT D .
CHANGES IN ACCOUNTING POLICIES
Other than the changes previously discussed under “Transition to International Financial Reporting
Standards” the Company had no changes in accounting policies for the nine months ended September 30,
2011.
FUTURE CHANGES IN ACCOUNTING POLICIES
IFRS 9 “Financial Instruments”, which was issued in October 2010, is the first phase in the replacement of
IAS 39 “Financial Instruments: Recognition and Measurement”. IFRS 9 revises the current multiple
classification and measurement models for financial assets and liabilities and limits the models to two:
amortized cost or fair value. The new standard is effective for the Company’s interim and annual
consolidated financial statements commencing January 1, 2013. The Company is currently assessing the
impact of this standard on its consolidated financial statements.
IFRS 10 “Consolidated Financial Statements”, which was issued in May 2011, identifies the concept of
control as the determining factor in whether an investee should be included within the consolidated
financial statements of the parent. The guidance requires an entity to consolidate an investee when it has
exposure or rights to variable returns from its involvement with the investee and has the ability to affect
those returns. The standard applies to all investees, including special purpose entities and replaces SIC-
12 “Consolidation – Special Purpose Entities” and parts of IAS 27 “Consolidated and Separate Financial
Statements”. The new standard is effective for the Company’s interim and annual consolidated financial
statements commencing January 1, 2013. The Company is currently assessing the impact of this standard
on its consolidated financial statements.
IFRS 11 “Joint Arrangements” was issued in May 2011 and addresses two forms of joint arrangements
where there is joint control: joint operations and joint ventures. In a joint operation, each venturer will
recognize its share of the operation’s assets, liabilities, revenues and expenses. Joint ventures will be
required to use the equity method of accounting. IFRS 11 replaces IAS 31 “Interests in Joint Ventures” and
SIC-13 “Jointly-controlled Entities – Non-Monetary Contributions from Venturers”. The new standard is
effective for the Company’s interim and annual consolidated financial statements commencing January 1,
2013. The Company is currently assessing the impact of this standard on its consolidated financial
statements.
IFRS 12 “Disclosure of Interests in Other Entities” was issued in May 2011. It is a comprehensive standard
addressing disclosure requirements for all forms of interests in other entities, including joint arrangements,
associates, subsidiaries, special purpose entities and unconsolidated structured entities. The standard
aims to provide information to enable users to evaluate the nature of an entity’s interest in other entities
and the associated risks. IFRS 12 is effective for the Company’s interim and annual consolidated financial
statements commencing January 1, 2013. The Company is currently assessing the impact of this standard
on its consolidated financial statements.
IFRS 13 “Fair Value Measurement”, which was also issued in May 2011, replaces fair value measurement
and disclosure guidance throughout individual IFRS standards with one comprehensive source of fair
value measurement guidance. IFRS 13 defines fair value as the price that would be received to sell an
asset, or paid to transfer a liability, in an orderly transaction between market participants at the
measurement date. The standard also provides a framework for measurement of fair value and
establishes required disclosures. It is effective for the Company’s interim and annual consolidated
financial statements commencing January 1, 2013. The Company is currently assessing the impact of this
standard on its consolidated financial statements.
IAS 1 “Presentation of Items of Other Comprehensive Income” was amended in June 2011 to require that
items within other comprehensive income, which are reclassified to earnings, be grouped together within
the statement of other comprehensive income. The amendment is effective for the Company’s interim and
T H IR D Q U ART ER R EPORT 20 11 18
annual consolidated financial statements commencing July 1, 2012. The Company is currently assessing
the impact of the changes to this standard on its consolidated financial statements.
IAS 19 “Employee Benefits” was amended in June 2011 with revisions to certain aspects of the accounting
for pension plans and other benefits, including amendments to the recognition, disaggregation,
presentation and disclosure of deferred benefit plans. The amendments are effective for the Company’s
interim and annual consolidated financial statements commencing January 1, 2013. The Company is
currently assessing the impact of the amendments on its consolidated financial statements.
In addition, there have been amendments to existing standards, including IAS 27 “Separate Financial
Statements” and IAS 28 “Investments in Associates and Joint Ventures”, as a result of the introduction of
IFRS 10 through 13 discussed above.
MANAGEMENT AND FINANCIAL REPORTING SYSTEMS
Zargon is required to comply with National Instrument 52-109 “Certification of Disclosure in Issuers’
Annual and Interim Filings”, otherwise referred to as Canadian SOX (“C-Sox”). The 2011 certificate
requires that the Company disclose in the interim MD&A any changes in the Company’s internal controls
over financial reporting that occurred during the period that have materially affected, or are reasonably
likely to materially affect, the Company’s internal control over financial reporting. The Company confirms
that no such changes were made to the internal controls over financial reporting during the third quarter of
2011.
Because of their inherent limitations, internal controls over financial reporting may not prevent or detect
misstatements, errors or fraud. Control systems, no matter how well conceived or operated, can provide
only reasonable, not absolute assurance that the objectives of the control systems are met.
OUTLOOK
With a strong balance sheet and a promising internally generated oil exploitation project inventory, Zargon
continues to be well positioned to meet its value-creating and dividend generating objectives in the
remainder of 2011 and beyond.

1 9 Z AR GO N O IL & G AS LT D .
SUMMARY OF QUARTERLY RESULTS
2011
Q1 Q2 Q3
Petroleum and natural gas sales, before royalties ($ millions) 46.94 48.47 44.99
Net earnings/(losses) ($ millions) (9.11) 12.67 30.69
Net earnings/(losses) per diluted share ($) (0.33) 0.43 1.05
Funds flow from operating activities ($ millions) 15.22 13.76 14.59
Funds flow from operating activities per diluted share ($) 0.56 0.47 0.50
Cash flows from operating activities ($ millions) 23.47 13.06 13.75
Cash flows from operating activities per diluted share ($) 0.86 0.45 0.47
Cash dividends ($ millions) (1) 9.65 10.47 10.75
Cash dividends declared per common share ($) 0.42 0.42 0.42
Net capital expenditures ($ millions) 20.36 8.02 (4.61)
Total assets ($ millions) 483.98 472.58 489.77
Bank debt ($ millions) 121.89 95.79 76.69
Average daily production (boe) 9,546 8,686 9,014
Average realized commodity field price before the impact of
financial risk management contracts ($/boe) 54.64 61.32 54.25
Funds flow netback ($/boe) 17.71 17.41 17.59
(1) Cash dividends represent the cash portion only and do not include common shares issued through Zargon’s Dividend Reinvestment Plan which commenced in April 2010.
2010
Q1 Q2 Q3 Q4
Petroleum and natural gas sales, before royalties ($ millions) 48.46 43.89 44.50 42.64
Net earnings/(losses) ($ millions) 4.35 17.86 1.20 (36.29)
Net earnings/(losses) per diluted unit ($) 0.17 0.68 0.05 (1.35)
Funds flow from operating activities ($ millions) 21.98 18.24 18.31 14.40
Funds flow from operating activities per diluted unit ($) 0.84 0.70 0.69 0.54
Cash flows from operating activities ($ millions) 20.74 12.74 19.87 8.34
Cash flows from operating activities per diluted unit ($) 0.79 0.49 0.75 0.31
Cash distributions ($ millions) (1) 12.55 11.88 11.92 10.99
Cash distributions declared per trust unit ($) 0.54 0.54 0.54 0.54
Net capital expenditures ($ millions) (2) 18.24 34.37 (1.45) 19.14
Total assets ($ millions) 466.94 495.98 481.90 472.25
Bank debt ($ millions) 84.23 114.12 97.61 115.29
Average daily production (boe) 10,062 10,050 10,094 9,317
Average realized commodity field price before the impact of
financial risk management contracts ($/boe) 53.51 47.99 47.91 49.74
Funds flow netback ($/boe) 24.27 19.96 19.70 16.81
(1) Cash distributions represent the cash portion only and do not include trust units issued through Zargon’s Distribution Reinvestment Plan which commenced in April 2010.
(2) Third quarter 2010 expenditures include corporate acquisition amounts as follows; net debt assumed of $3.41 million and the equity issuance of common shares valued at $5.95 million.
T H IR D Q U ART ER R EPORT 20 11 20
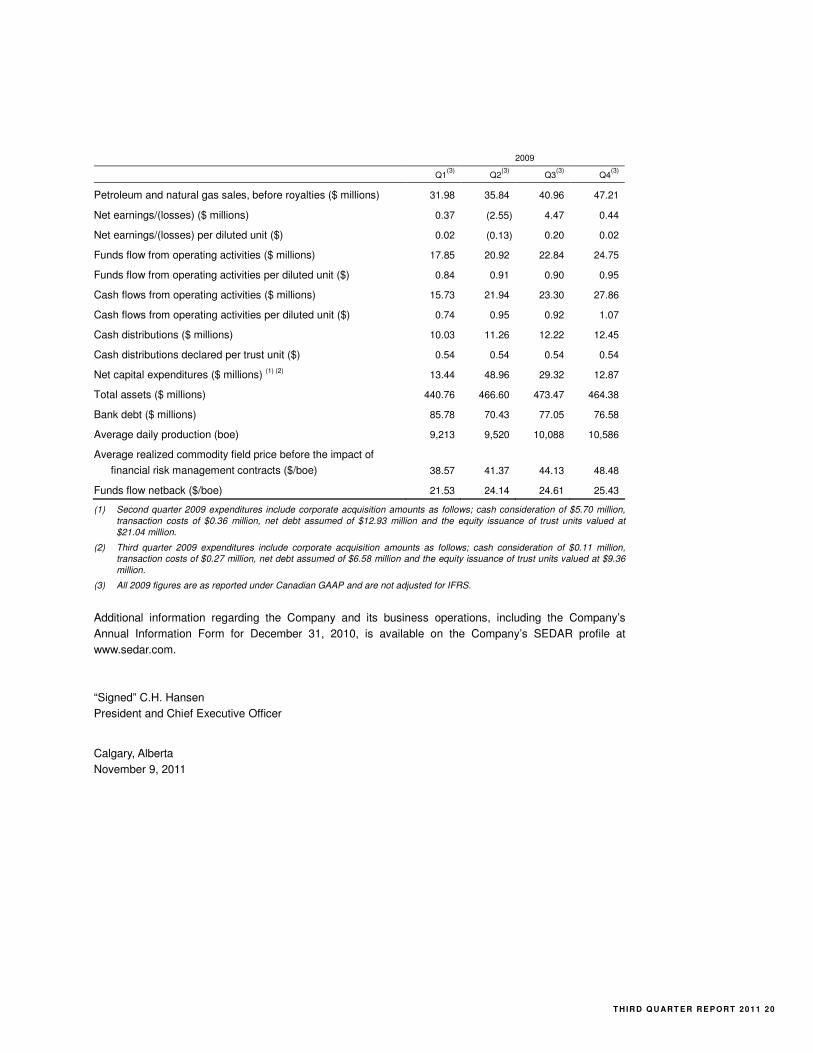
2009
Q1(3)
Q2(3)
Q3(3)
Q4(3)
Petroleum and natural gas sales, before royalties ($ millions) 31.98 35.84 40.96 47.21
Net earnings/(losses) ($ millions) 0.37 (2.55) 4.47 0.44
Net earnings/(losses) per diluted unit ($) 0.02 (0.13) 0.20 0.02
Funds flow from operating activities ($ millions) 17.85 20.92 22.84 24.75
Funds flow from operating activities per diluted unit ($) 0.84 0.91 0.90 0.95
Cash flows from operating activities ($ millions) 15.73 21.94 23.30 27.86
Cash flows from operating activities per diluted unit ($) 0.74 0.95 0.92 1.07
Cash distributions ($ millions) 10.03 11.26 12.22 12.45
Cash distributions declared per trust unit ($) 0.54 0.54 0.54 0.54
Net capital expenditures ($ millions) (1) (2) 13.44 48.96 29.32 12.87
Total assets ($ millions) 440.76 466.60 473.47 464.38
Bank debt ($ millions) 85.78 70.43 77.05 76.58
Average daily production (boe) 9,213 9,520 10,088 10,586
Average realized commodity field price before the impact of
financial risk management contracts ($/boe) 38.57 41.37 44.13 48.48
Funds flow netback ($/boe) 21.53 24.14 24.61 25.43
(1) Second quarter 2009 expenditures include corporate acquisition amounts as follows; cash consideration of $5.70 million, transaction costs of $0.36 million, net debt assumed of $12.93 million and the equity issuance of trust units valued at $21.04 million.
(2) Third quarter 2009 expenditures include corporate acquisition amounts as follows; cash consideration of $0.11 million, transaction costs of $0.27 million, net debt assumed of $6.58 million and the equity issuance of trust units valued at $9.36 million.
(3) All 2009 figures are as reported under Canadian GAAP and are not adjusted for IFRS.
Additional information regarding the Company and its business operations, including the Company’s
Annual Information Form for December 31, 2010, is available on the Company’s SEDAR profile at
www.sedar.com.
“Signed” C.H. Hansen
President and Chief Executive Officer
Calgary, Alberta
November 9, 2011
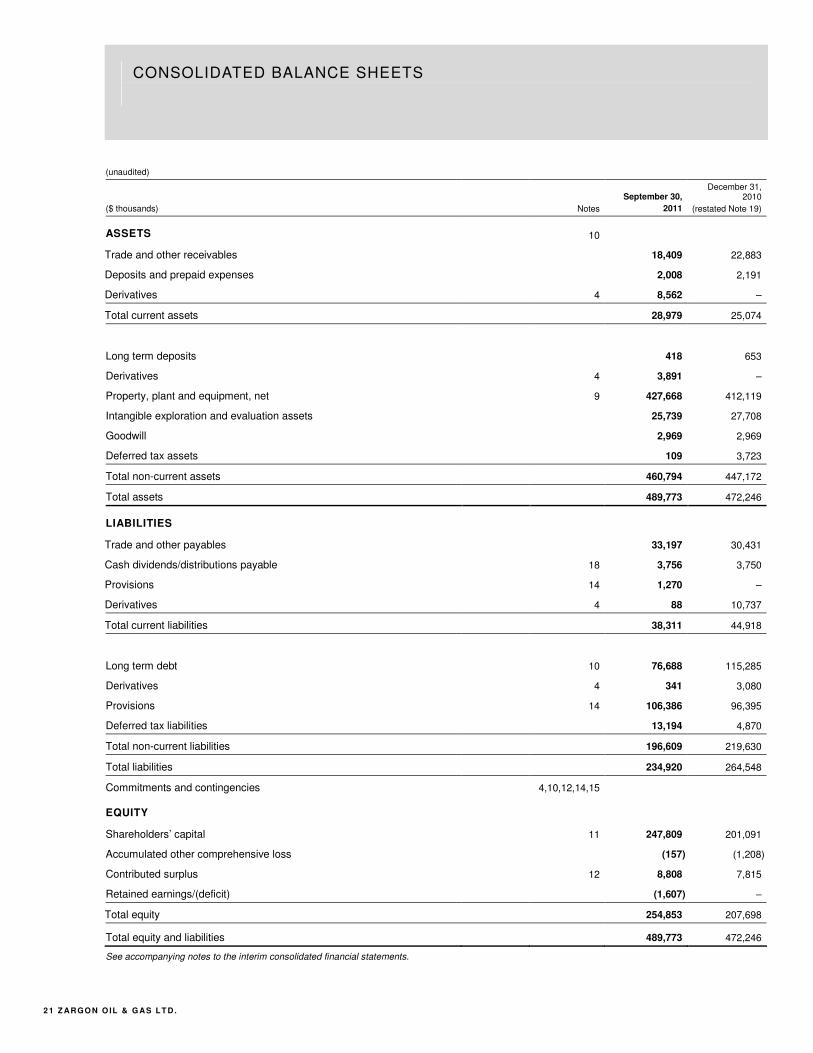
CONSOLIDATED BALANCE SHEETS
2 1 Z AR GO N O IL & G AS LT D .
(unaudited)
($ thousands) Notes
September 30,
2011
December 31, 2010
(restated Note 19)
ASSETS 10
Trade and other receivables 18,409 22,883
Deposits and prepaid expenses 2,008 2,191
Derivatives 4 8,562 –
Total current assets 28,979 25,074
Long term deposits 418 653
Derivatives 4 3,891 –
Property, plant and equipment, net 9 427,668 412,119
Intangible exploration and evaluation assets 25,739 27,708
Goodwill 2,969 2,969
Deferred tax assets 109 3,723
Total non-current assets 460,794 447,172
Total assets 489,773 472,246
LIABILITIES
Trade and other payables 33,197 30,431
Cash dividends/distributions payable 18 3,756 3,750
Provisions 14 1,270 –
Derivatives 4 88 10,737
Total current liabilities 38,311 44,918
Long term debt 10 76,688 115,285
Derivatives 4 341 3,080
Provisions 14 106,386 96,395
Deferred tax liabilities 13,194 4,870
Total non-current liabilities 196,609 219,630
Total liabilities 234,920 264,548
Commitments and contingencies 4,10,12,14,15
EQUITY
Shareholders’ capital 11 247,809 201,091
Accumulated other comprehensive loss (157) (1,208)
Contributed surplus 12 8,808 7,815
Retained earnings/(deficit) (1,607) –
Total equity 254,853 207,698
Total equity and liabilities 489,773 472,246
See accompanying notes to the interim consolidated financial statements.
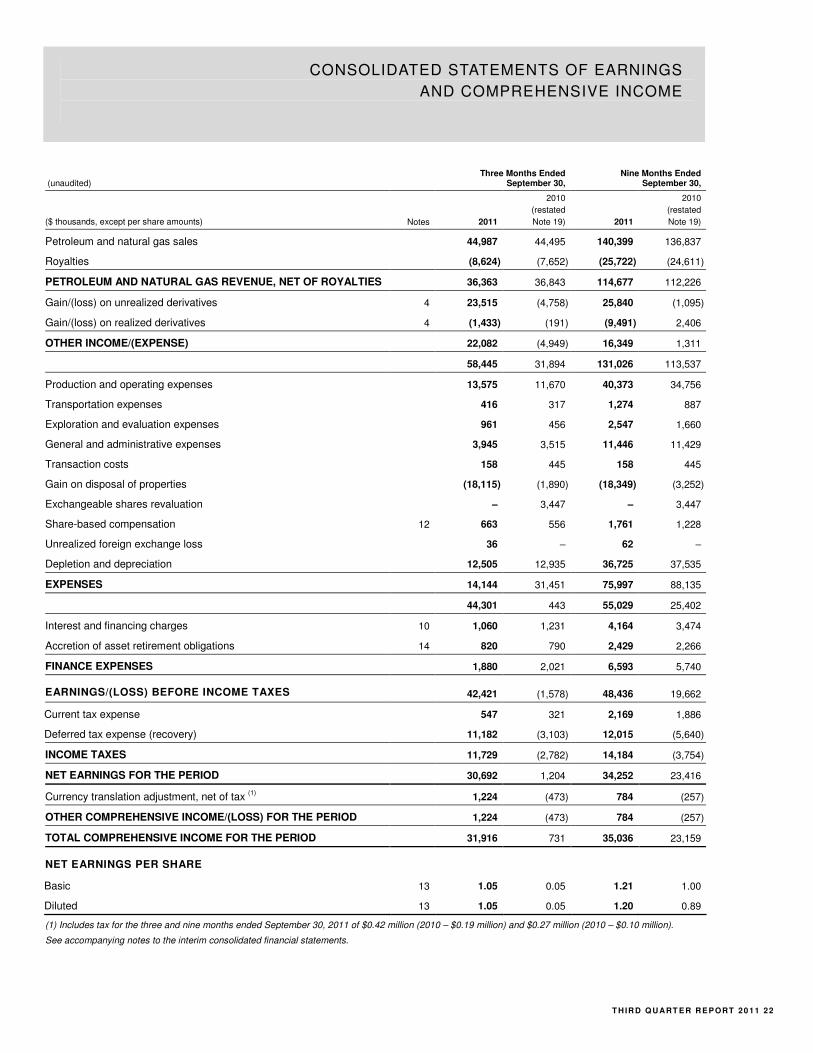
CONSOLIDATED STATEMENTS OF EARNINGS
AND COMPREHENSIVE INCOME
T H IR D Q U ART ER R EPORT 20 11 22
(unaudited) Three Months Ended
September 30, Nine Months Ended
September 30,
($ thousands, except per share amounts) Notes 2011
2010
(restated
Note 19) 2011
2010
(restated
Note 19)
Petroleum and natural gas sales 44,987 44,495 140,399 136,837
Royalties (8,624) (7,652) (25,722) (24,611)
PETROLEUM AND NATURAL GAS REVENUE, NET OF ROYALTIES 36,363 36,843 114,677 112,226
Gain/(loss) on unrealized derivatives 4 23,515 (4,758) 25,840 (1,095)
Gain/(loss) on realized derivatives 4 (1,433) (191) (9,491) 2,406
OTHER INCOME/(EXPENSE) 22,082 (4,949) 16,349 1,311
58,445 31,894 131,026 113,537
Production and operating expenses 13,575 11,670 40,373 34,756
Transportation expenses 416 317 1,274 887
Exploration and evaluation expenses 961 456 2,547 1,660
General and administrative expenses 3,945 3,515 11,446 11,429
Transaction costs 158 445 158 445
Gain on disposal of properties (18,115) (1,890) (18,349) (3,252)
Exchangeable shares revaluation – 3,447 – 3,447
Share-based compensation 12 663 556 1,761 1,228
Unrealized foreign exchange loss 36 – 62 –
Depletion and depreciation 12,505 12,935 36,725 37,535
EXPENSES 14,144 31,451 75,997 88,135
44,301 443 55,029 25,402
Interest and financing charges 10 1,060 1,231 4,164 3,474
Accretion of asset retirement obligations 14 820 790 2,429 2,266
FINANCE EXPENSES 1,880 2,021 6,593 5,740
EARNINGS/(LOSS) BEFORE INCOME TAXES 42,421 (1,578) 48,436 19,662
Current tax expense 547 321 2,169 1,886
Deferred tax expense (recovery) 11,182 (3,103) 12,015 (5,640)
INCOME TAXES 11,729 (2,782) 14,184 (3,754)
NET EARNINGS FOR THE PERIOD 30,692 1,204 34,252 23,416
Currency translation adjustment, net of tax (1) 1,224 (473) 784 (257)
OTHER COMPREHENSIVE INCOME/(LOSS) FOR THE PERIOD 1,224 (473) 784 (257)
TOTAL COMPREHENSIVE INCOME FOR THE PERIOD 31,916 731 35,036 23,159
NET EARNINGS PER SHARE
Basic 13 1.05 0.05 1.21 1.00
Diluted 13 1.05 0.05 1.20 0.89
(1) Includes tax for the three and nine months ended September 30, 2011 of $0.42 million (2010 – $0.19 million) and $0.27 million (2010 – $0.10 million).
See accompanying notes to the interim consolidated financial statements.
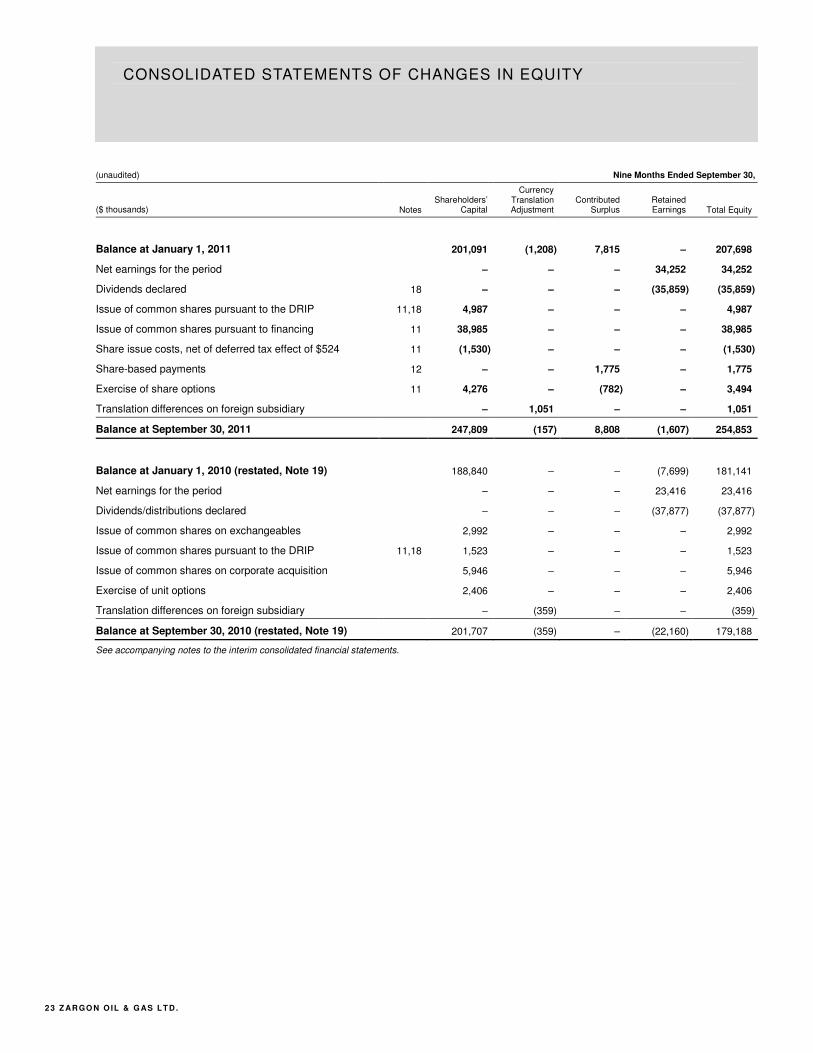
CONSOLIDATED STATEMENTS OF CHANGES IN EQUITY
2 3 Z AR GO N O IL & G AS LT D .
(unaudited) Nine Months Ended September 30,
($ thousands) Notes Shareholders’
Capital
Currency Translation Adjustment
Contributed Surplus
Retained Earnings Total Equity
Balance at January 1, 2011 201,091 (1,208) 7,815 – 207,698
Net earnings for the period – – – 34,252 34,252
Dividends declared 18 – – – (35,859) (35,859)
Issue of common shares pursuant to the DRIP 11,18 4,987 – – – 4,987
Issue of common shares pursuant to financing 11 38,985 – – – 38,985
Share issue costs, net of deferred tax effect of $524 11 (1,530) – – – (1,530)
Share-based payments 12 – – 1,775 – 1,775
Exercise of share options 11 4,276 – (782) – 3,494
Translation differences on foreign subsidiary – 1,051 – – 1,051
Balance at September 30, 2011 247,809 (157) 8,808 (1,607) 254,853
Balance at January 1, 2010 (restated, Note 19) 188,840 – – (7,699) 181,141
Net earnings for the period – – – 23,416 23,416
Dividends/distributions declared – – – (37,877) (37,877)
Issue of common shares on exchangeables 2,992 – – – 2,992
Issue of common shares pursuant to the DRIP 11,18 1,523 – – – 1,523
Issue of common shares on corporate acquisition 5,946 – – – 5,946
Exercise of unit options 2,406 – – – 2,406
Translation differences on foreign subsidiary – (359) – – (359)
Balance at September 30, 2010 (restated, Note 19) 201,707 (359) – (22,160) 179,188
See accompanying notes to the interim consolidated financial statements.
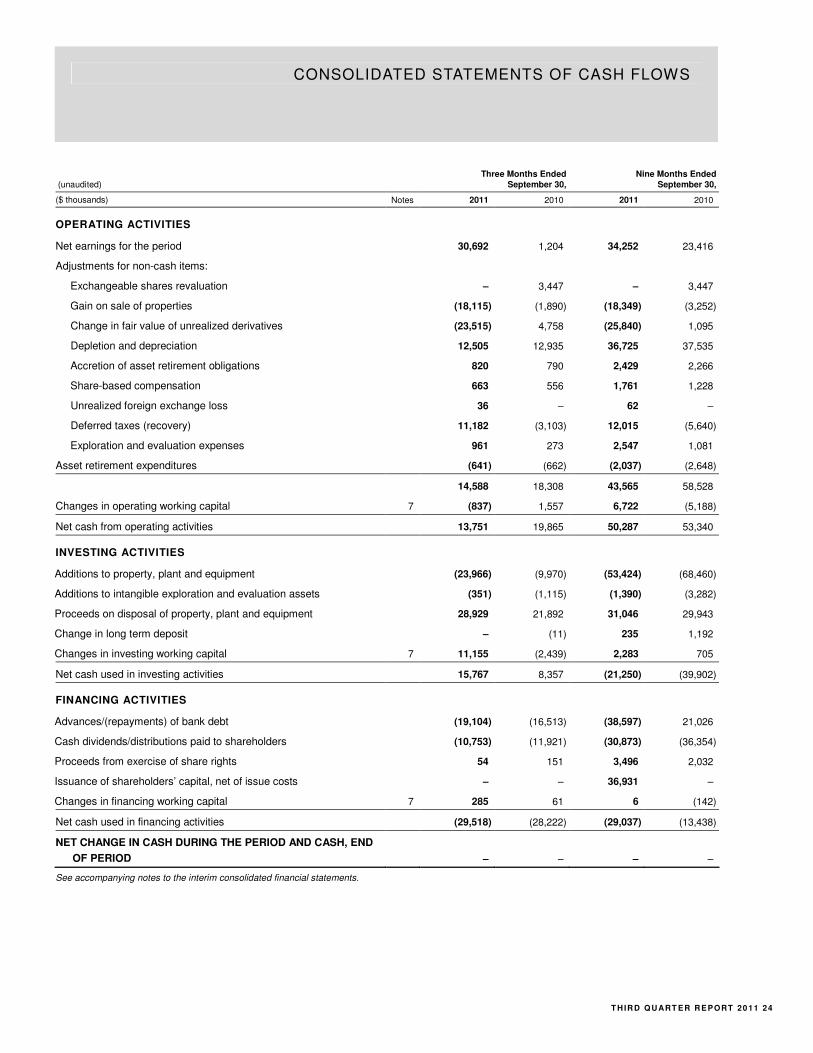
CONSOLIDATED STATEMENTS OF CASH FLOWS
T H IR D Q U ART ER R EPORT 20 11 24
(unaudited) Three Months Ended
September 30, Nine Months Ended
September 30,
($ thousands) Notes 2011 2010 2011 2010
OPERATING ACTIVITIES
Net earnings for the period 30,692 1,204 34,252 23,416
Adjustments for non-cash items:
Exchangeable shares revaluation – 3,447 – 3,447
Gain on sale of properties (18,115) (1,890) (18,349) (3,252)
Change in fair value of unrealized derivatives (23,515) 4,758 (25,840) 1,095
Depletion and depreciation 12,505 12,935 36,725 37,535
Accretion of asset retirement obligations 820 790 2,429 2,266
Share-based compensation 663 556 1,761 1,228
Unrealized foreign exchange loss 36 – 62 –
Deferred taxes (recovery) 11,182 (3,103) 12,015 (5,640)
Exploration and evaluation expenses 961 273 2,547 1,081
Asset retirement expenditures (641) (662) (2,037) (2,648)
14,588 18,308 43,565 58,528
Changes in operating working capital 7 (837) 1,557 6,722 (5,188)
Net cash from operating activities 13,751 19,865 50,287 53,340
INVESTING ACTIVITIES
Additions to property, plant and equipment (23,966) (9,970) (53,424) (68,460)
Additions to intangible exploration and evaluation assets (351) (1,115) (1,390) (3,282)
Proceeds on disposal of property, plant and equipment 28,929 21,892 31,046 29,943
Change in long term deposit – (11) 235 1,192
Changes in investing working capital 7 11,155 (2,439) 2,283 705
Net cash used in investing activities 15,767 8,357 (21,250) (39,902)
FINANCING ACTIVITIES
Advances/(repayments) of bank debt (19,104) (16,513) (38,597) 21,026
Cash dividends/distributions paid to shareholders (10,753) (11,921) (30,873) (36,354)
Proceeds from exercise of share rights 54 151 3,496 2,032
Issuance of shareholders’ capital, net of issue costs – – 36,931 –
Changes in financing working capital 7 285 61 6 (142)
Net cash used in financing activities (29,518) (28,222) (29,037) (13,438)
NET CHANGE IN CASH DURING THE PERIOD AND CASH, END
OF PERIOD – – – –
See accompanying notes to the interim consolidated financial statements.
NOTES TO THE CONSOLIDATED FINANCIAL STATEMENTS
2 5 Z AR GO N O IL & G AS LT D .
For the three and nine months ended September 30, 2011, with comparative figures for 2010 (unaudited).
1. REPORTING ENTITY
Zargon Oil & Gas Ltd. (“the Company” or “Zargon”) is a publicly traded corporation incorporated in Canada with its head office located
at Suite 700, 333-5th Avenue SW, Calgary, Alberta. The interim consolidated financial statements of the Company as at and for the
periods ended September 30, 2011 and its 2010 restated comparative periods comprise the Company and its wholly owned
subsidiaries. The Company is engaged in the exploration for and development and production of oil and natural gas in Canada and the
United States (“US”) and conducts many of its activities jointly with others; these financial statements reflect only the Company’s
proportionate interest in such activities.
On December 31, 2010, Zargon Energy Trust (the “Trust”) completed the conversion from an income trust into Zargon, a dividend
paying corporation, pursuant to a Plan of Arrangement (the “Arrangement”) under the Business Corporations Act (Alberta). Under the
Arrangement, unitholders received, for each trust unit held, one common share of the Company. Exchangeable shareholders received
1.84716 common shares of the Company for each exchangeable share held as determined in accordance with the terms of the
Arrangement. As a result, at December 31, 2010, Zargon had 27.05 million common shares issued and outstanding and no remaining
exchangeable shares. There were no changes to the underlying business of the Company and the Board of Directors and senior
management remained unchanged. Additional information regarding the Arrangement can be found in the Information Circular dated
November 10, 2010.
The conversion of the Trust into a corporation has been accounted for using the continuity of interest method. Accordingly, the
consolidated financial statements for the year ended December 31, 2010 reflect the financial position, results of operations and cash
flows as if the Company had always carried on the business of the Trust. For the convenience of the reader, when discussing prior
periods, the consolidated financial statements, where appropriate, refer to common shares, shareholders, share rights and dividends
although for the pre-conversion period such items were trust units, unitholders, trust unit rights and distributions, respectively.
Pursuant to the Arrangement, the shareholders’ capital was reduced by the amount of the deficit on December 31, 2010 of $71.34
million.
2. BASIS OF PRESENTATION AND ADOPTION OF IFRS
(a) Statement of compliance:
In 2010, the “CICA Handbook” was revised to incorporate International Financial Reporting Standards (“IFRS”), and requires
publicly accountable enterprises to apply such standards effective for years beginning on or after January 1, 2011. In these
financial statements, the term “Canadian GAAP” refers to Canadian generally accepted accounting principles before the adoption
of IFRS.
The interim consolidated financial statements for the three and nine month periods ended September 30, 2011 have been
prepared in accordance with IAS 34 “Interim Financial Reporting”. The same accounting policies and methods of computation
were followed in the preparation of these interim consolidated financial statements as were followed in the preparation of the
interim consolidated financial statements for the three month period ended March 31, 2011. In addition, the interim consolidated
financial statements for the three month period ended March 31, 2011 contains certain incremental annual IFRS disclosure not
included in the annual financial statements for the year ended December 31, 2010 prepared in accordance with pre-changeover
Canadian GAAP. Accordingly, these interim consolidated financial statements for the three and nine month periods ended
September 30, 2011 should be read together with the annual consolidated financial statements for the year ended December 31,
2010 prepared in accordance with pre-changeover Canadian GAAP as well as the interim consolidated financial statements for
the three month period ended March 31, 2011.
The policies applied in these interim consolidated financial statements are based on IFRS issued and outstanding as of November
9, 2011, the date the Board of Directors approved the statements. Any subsequent changes to IFRS that are given effect in the
Company’s annual consolidated financial statements for the year ending December 31, 2011 could result in restatement of these
interim consolidated financial statements, including the transition adjustments recognized on change-over to IFRS.
(b) Basis of measurement:
The interim consolidated financial statements have been prepared on the historical cost basis except for derivative financial
instruments measured at fair value.
T H IR D Q U ART ER R EPORT 20 11 26
(c) Functional and presentation currency:
Items included in the financial statements of each consolidated entity are measured using the currency of the primary economic
environment in which the entity operates (the “functional currency”). The interim consolidated financial statements are presented
in Canadian dollars, which is Zargon’s functional currency.
The financial statements of subsidiaries that have a functional currency different from that of Zargon (“foreign operations”) are
translated into Canadian dollars as follows: assets and liabilities - at the closing rate at the date of the balance sheet, and income
and expenses - at the average rate of the period (as this is considered a reasonable approximation to actual rates). All resulting
changes are recognized in other comprehensive income as currency translation adjustments.
If Zargon disposes of its entire interest in a foreign operation, or loses control, joint control, or significant influence over a foreign
operation, the foreign currency gains or losses accumulated in other comprehensive income related to the foreign operation are
recognized in earnings. If Zargon disposes of part of an interest in a foreign operation which remains a subsidiary, a proportionate
amount of foreign currency gains or losses accumulated in other comprehensive income related to the subsidiary are reallocated
between controlling and non-controlling interests.
(d) Use of estimates and judgements:
The preparation of financial statements in conformity with IFRS requires management to make judgements, estimates and
assumptions that affect the application of accounting policies and the reported amounts of assets, liabilities, income and
expenses. Actual results may differ from these estimates.
Estimates and underlying assumptions are reviewed on an ongoing basis. Revisions to accounting estimates are recognized in
the period in which the estimates are revised and in any future periods affected.
3. CHANGES IN ACCOUNTING POLICIES
(a) New and amended standards adopted by the Company:
Refer to Note 19.
(b) Standards, amendments and interpretations to existing standards that are not yet effective and have not been early adopted by the
Company:
IFRS 9 “Financial Instruments”, which was issued in October 2010, is the first phase in the replacement of IAS 39 “Financial
Instruments: Recognition and Measurement”. IFRS 9 revises the current multiple classification and measurement models for
financial assets and liabilities and limits the models to two: amortized cost or fair value. The new standard is effective for the
Company’s interim and annual consolidated financial statements commencing January 1, 2013. The Company is currently
assessing the impact of this standard on its consolidated financial statements.
IFRS 10 “Consolidated Financial Statements”, which was issued in May 2011, identifies the concept of control as the determining
factor in whether an investee should be included within the consolidated financial statements of the parent. The guidance requires
an entity to consolidate an investee when it has exposure or rights to variable returns from its involvement with the investee and
has the ability to affect those returns. The standard applies to all investees, including special purpose entities and replaces SIC-12
“Consolidation – Special Purpose Entities” and parts of IAS 27 “Consolidated and Separate Financial Statements”. The new
standard is effective for the Company’s interim and annual consolidated financial statements commencing January 1, 2013. The
Company is currently assessing the impact of this standard on its consolidated financial statements.
IFRS 11 “Joint Arrangements” was issued in May 2011 and addresses two forms of joint arrangements where there is joint control:
joint operations and joint ventures. In a joint operation, each venturer will recognize its share of the operation’s assets, liabilities,
revenues and expenses. Joint ventures will be required to use the equity method of accounting. IFRS 11 replaces IAS 31
“Interests in Joint Ventures” and SIC-13 “Jointly-controlled Entities – Non-Monetary Contributions from Venturers”. The new
standard is effective for the Company’s interim and annual consolidated financial statements commencing January 1, 2013. The
Company is currently assessing the impact of this standard on its consolidated financial statements.
IFRS 12 “Disclosure of Interests in Other Entities” was issued in May 2011. It is a comprehensive standard addressing disclosure
requirements for all forms of interests in other entities, including joint arrangements, associates, subsidiaries, special purpose
entities and unconsolidated structured entities. The standard aims to provide information to enable users to evaluate the nature of
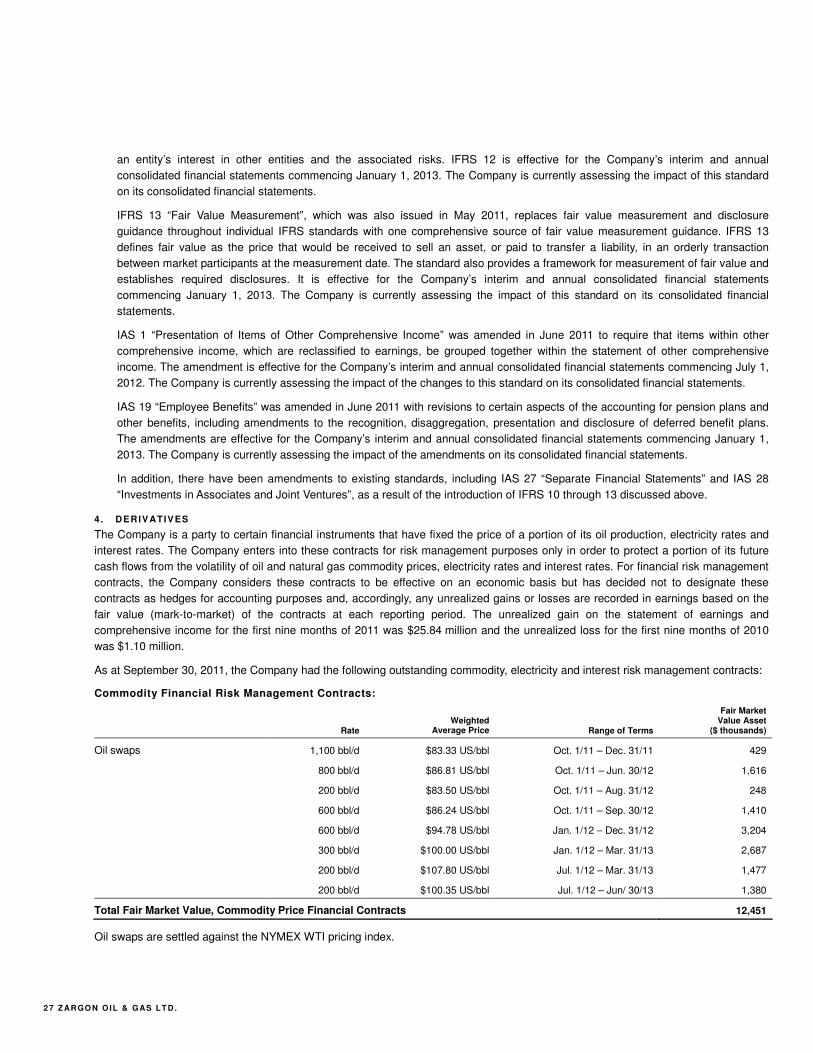
2 7 Z AR GO N O IL & G AS LT D .
an entity’s interest in other entities and the associated risks. IFRS 12 is effective for the Company’s interim and annual
consolidated financial statements commencing January 1, 2013. The Company is currently assessing the impact of this standard
on its consolidated financial statements.
IFRS 13 “Fair Value Measurement”, which was also issued in May 2011, replaces fair value measurement and disclosure
guidance throughout individual IFRS standards with one comprehensive source of fair value measurement guidance. IFRS 13
defines fair value as the price that would be received to sell an asset, or paid to transfer a liability, in an orderly transaction
between market participants at the measurement date. The standard also provides a framework for measurement of fair value and
establishes required disclosures. It is effective for the Company’s interim and annual consolidated financial statements
commencing January 1, 2013. The Company is currently assessing the impact of this standard on its consolidated financial
statements.
IAS 1 “Presentation of Items of Other Comprehensive Income” was amended in June 2011 to require that items within other
comprehensive income, which are reclassified to earnings, be grouped together within the statement of other comprehensive
income. The amendment is effective for the Company’s interim and annual consolidated financial statements commencing July 1,
2012. The Company is currently assessing the impact of the changes to this standard on its consolidated financial statements.
IAS 19 “Employee Benefits” was amended in June 2011 with revisions to certain aspects of the accounting for pension plans and
other benefits, including amendments to the recognition, disaggregation, presentation and disclosure of deferred benefit plans.
The amendments are effective for the Company’s interim and annual consolidated financial statements commencing January 1,
2013. The Company is currently assessing the impact of the amendments on its consolidated financial statements.
In addition, there have been amendments to existing standards, including IAS 27 “Separate Financial Statements” and IAS 28
“Investments in Associates and Joint Ventures”, as a result of the introduction of IFRS 10 through 13 discussed above.
4. DERIVATIVES
The Company is a party to certain financial instruments that have fixed the price of a portion of its oil production, electricity rates and
interest rates. The Company enters into these contracts for risk management purposes only in order to protect a portion of its future
cash flows from the volatility of oil and natural gas commodity prices, electricity rates and interest rates. For financial risk management
contracts, the Company considers these contracts to be effective on an economic basis but has decided not to designate these
contracts as hedges for accounting purposes and, accordingly, any unrealized gains or losses are recorded in earnings based on the
fair value (mark-to-market) of the contracts at each reporting period. The unrealized gain on the statement of earnings and
comprehensive income for the first nine months of 2011 was $25.84 million and the unrealized loss for the first nine months of 2010
was $1.10 million.
As at September 30, 2011, the Company had the following outstanding commodity, electricity and interest risk management contracts:
Commodity Financial Risk Management Contracts:
Rate
Weighted Average Price Range of Terms
Fair Market Value Asset
($ thousands)
Oil swaps 1,100 bbl/d $83.33 US/bbl Oct. 1/11 – Dec. 31/11 429
800 bbl/d $86.81 US/bbl Oct. 1/11 – Jun. 30/12 1,616
200 bbl/d $83.50 US/bbl Oct. 1/11 – Aug. 31/12 248
600 bbl/d $86.24 US/bbl Oct. 1/11 – Sep. 30/12 1,410
600 bbl/d $94.78 US/bbl Jan. 1/12 – Dec. 31/12 3,204
300 bbl/d $100.00 US/bbl Jan. 1/12 – Mar. 31/13 2,687
200 bbl/d $107.80 US/bbl Jul. 1/12 – Mar. 31/13 1,477
200 bbl/d $100.35 US/bbl Jul. 1/12 – Jun/ 30/13 1,380
Total Fair Market Value, Commodity Price Financial Contracts 12,451
Oil swaps are settled against the NYMEX WTI pricing index.
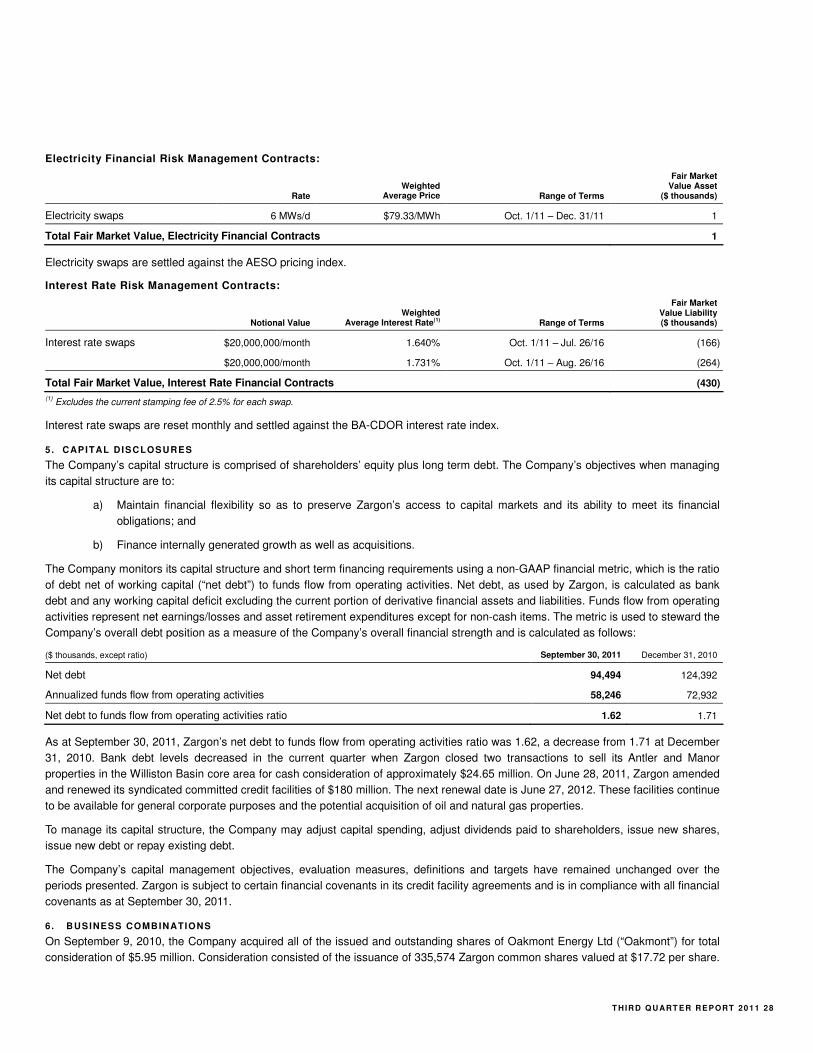
T H IR D Q U ART ER R EPORT 20 11 28
Electricity Financial Risk Management Contracts:
Rate
Weighted Average Price Range of Terms
Fair Market Value Asset
($ thousands)
Electricity swaps 6 MWs/d $79.33/MWh Oct. 1/11 – Dec. 31/11 1
Total Fair Market Value, Electricity Financial Contracts 1
Electricity swaps are settled against the AESO pricing index.
Interest Rate Risk Management Contracts:
Notional Value
Weighted Average Interest Rate(1) Range of Terms
Fair Market Value Liability ($ thousands)
Interest rate swaps $20,000,000/month 1.640% Oct. 1/11 – Jul. 26/16 (166)
$20,000,000/month 1.731% Oct. 1/11 – Aug. 26/16 (264)
Total Fair Market Value, Interest Rate Financial Contracts (430)
(1) Excludes the current stamping fee of 2.5% for each swap.
Interest rate swaps are reset monthly and settled against the BA-CDOR interest rate index.
5. CAPITAL DISCLOSURES
The Company’s capital structure is comprised of shareholders’ equity plus long term debt. The Company’s objectives when managing
its capital structure are to:
a) Maintain financial flexibility so as to preserve Zargon’s access to capital markets and its ability to meet its financial
obligations; and
b) Finance internally generated growth as well as acquisitions.
The Company monitors its capital structure and short term financing requirements using a non-GAAP financial metric, which is the ratio
of debt net of working capital (“net debt”) to funds flow from operating activities. Net debt, as used by Zargon, is calculated as bank
debt and any working capital deficit excluding the current portion of derivative financial assets and liabilities. Funds flow from operating
activities represent net earnings/losses and asset retirement expenditures except for non-cash items. The metric is used to steward the
Company’s overall debt position as a measure of the Company’s overall financial strength and is calculated as follows:
($ thousands, except ratio) September 30, 2011 December 31, 2010
Net debt 94,494 124,392
Annualized funds flow from operating activities 58,246 72,932
Net debt to funds flow from operating activities ratio 1.62 1.71
As at September 30, 2011, Zargon’s net debt to funds flow from operating activities ratio was 1.62, a decrease from 1.71 at December
31, 2010. Bank debt levels decreased in the current quarter when Zargon closed two transactions to sell its Antler and Manor
properties in the Williston Basin core area for cash consideration of approximately $24.65 million. On June 28, 2011, Zargon amended
and renewed its syndicated committed credit facilities of $180 million. The next renewal date is June 27, 2012. These facilities continue
to be available for general corporate purposes and the potential acquisition of oil and natural gas properties.
To manage its capital structure, the Company may adjust capital spending, adjust dividends paid to shareholders, issue new shares,
issue new debt or repay existing debt.
The Company’s capital management objectives, evaluation measures, definitions and targets have remained unchanged over the
periods presented. Zargon is subject to certain financial covenants in its credit facility agreements and is in compliance with all financial
covenants as at September 30, 2011.
6. BUSINESS COMBINATIONS
On September 9, 2010, the Company acquired all of the issued and outstanding shares of Oakmont Energy Ltd (“Oakmont”) for total
consideration of $5.95 million. Consideration consisted of the issuance of 335,574 Zargon common shares valued at $17.72 per share.

2 9 Z AR GO N O IL & G AS LT D .
The Company acquired Oakmont for its oil exploitation opportunities along with its complementary properties in the Alberta Plains
South core area.
These consolidated financial statements incorporate the results of operations of the acquired Oakmont properties from September 9,
2010. For the period September 9, 2010 to December 31, 2010, Zargon recorded revenue from oil, natural gas and natural gas liquids
of $0.91 million in respect of the acquired assets. Had the acquisition occurred on January 1, 2010, for the 12 months ended
December 31, 2010, Zargon estimates that its pro forma revenue would have been approximately $3.84 million. On January 1, 2011,
Oakmont was amalgamated into Zargon.
The acquisition has been accounted for using the acquisition method. The purchase price allocation is as follows:
($ thousands)
Identifiable assets acquired and liabilities assumed:
Property, plant and equipment 11,953
Intangible exploration and evaluation assets 450
Trade and other receivables 584
Long term debt (3,423)
Asset retirement obligations (2,991)
Deferred tax liabilities (56)
Trade and other payable (571)
Total 5,946
($ thousands)
Consideration paid:
Common shares issued 5,946
Acquisition costs for the transaction were $0.13 million.
7. CHANGE IN NON-CASH FLOW INFORMATION
The net change in working capital is comprised of:
Three Months Ended September 30, Nine Months Ended September 30,
($ thousands) 2011 2010 2011 2010
Source/(use) of cash:
Trade and other receivables 3,307 3,234 4,474 5,858
Deposit and prepaid expenses 28 454 183 (541)
Accounts payable and accrued liabilities 6,585 (1,010) 2,766 (6,313)
Cash dividends/distributions payable 285 61 6 (142)
Working capital acquired from corporate acquisitions – (3,410) – (3,410)
Provisions – – 1,270 –
Foreign exchange and other 398 (150) 312 (77)
10,603 (821) 9,011 (4,625)
Related to operating activities (837) 1,557 6,722 (5,188)
Related to investing activities 11,155 (2,439) 2,283 705
Related to financing activities 285 61 6 (142)
10,603 (821) 9,011 (4,625)
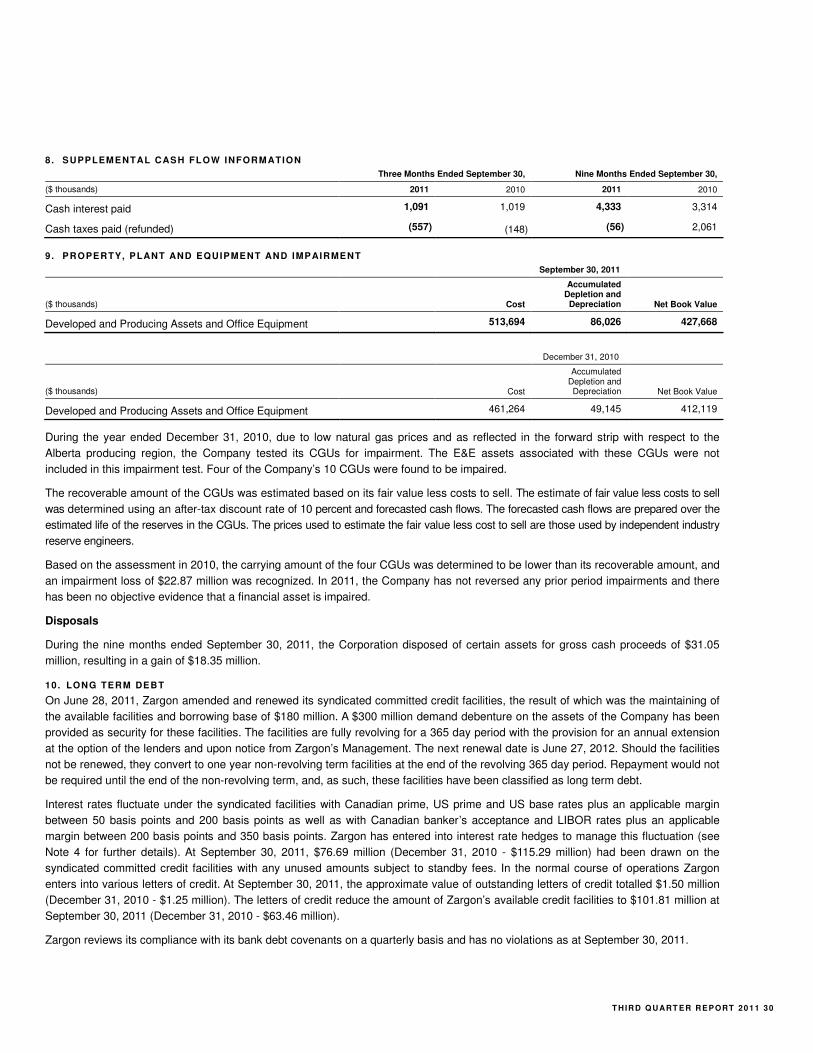
T H IR D Q U ART ER R EPORT 20 11 30
8. SUPPLEMENTAL CASH FLOW INFORMATION
Three Months Ended September 30, Nine Months Ended September 30,
($ thousands) 2011 2010 2011 2010
Cash interest paid 1,091 1,019 4,333 3,314
Cash taxes paid (refunded) (557) (148) (56) 2,061
9. PROPERTY, PLANT AND EQUIPMENT AND IMPAIRMENT
September 30, 2011
($ thousands) Cost
Accumulated Depletion and
Depreciation Net Book Value
Developed and Producing Assets and Office Equipment 513,694 86,026 427,668
December 31, 2010
($ thousands) Cost
Accumulated Depletion and Depreciation Net Book Value
Developed and Producing Assets and Office Equipment 461,264 49,145 412,119
During the year ended December 31, 2010, due to low natural gas prices and as reflected in the forward strip with respect to the
Alberta producing region, the Company tested its CGUs for impairment. The E&E assets associated with these CGUs were not
included in this impairment test. Four of the Company’s 10 CGUs were found to be impaired.
The recoverable amount of the CGUs was estimated based on its fair value less costs to sell. The estimate of fair value less costs to sell
was determined using an after-tax discount rate of 10 percent and forecasted cash flows. The forecasted cash flows are prepared over the
estimated life of the reserves in the CGUs. The prices used to estimate the fair value less cost to sell are those used by independent industry
reserve engineers.
Based on the assessment in 2010, the carrying amount of the four CGUs was determined to be lower than its recoverable amount, and
an impairment loss of $22.87 million was recognized. In 2011, the Company has not reversed any prior period impairments and there
has been no objective evidence that a financial asset is impaired.
Disposals
During the nine months ended September 30, 2011, the Corporation disposed of certain assets for gross cash proceeds of $31.05
million, resulting in a gain of $18.35 million.
10. LONG TERM DEBT
On June 28, 2011, Zargon amended and renewed its syndicated committed credit facilities, the result of which was the maintaining of
the available facilities and borrowing base of $180 million. A $300 million demand debenture on the assets of the Company has been
provided as security for these facilities. The facilities are fully revolving for a 365 day period with the provision for an annual extension
at the option of the lenders and upon notice from Zargon’s Management. The next renewal date is June 27, 2012. Should the facilities
not be renewed, they convert to one year non-revolving term facilities at the end of the revolving 365 day period. Repayment would not
be required until the end of the non-revolving term, and, as such, these facilities have been classified as long term debt.
Interest rates fluctuate under the syndicated facilities with Canadian prime, US prime and US base rates plus an applicable margin
between 50 basis points and 200 basis points as well as with Canadian banker’s acceptance and LIBOR rates plus an applicable
margin between 200 basis points and 350 basis points. Zargon has entered into interest rate hedges to manage this fluctuation (see
Note 4 for further details). At September 30, 2011, $76.69 million (December 31, 2010 - $115.29 million) had been drawn on the
syndicated committed credit facilities with any unused amounts subject to standby fees. In the normal course of operations Zargon
enters into various letters of credit. At September 30, 2011, the approximate value of outstanding letters of credit totalled $1.50 million
(December 31, 2010 - $1.25 million). The letters of credit reduce the amount of Zargon’s available credit facilities to $101.81 million at
September 30, 2011 (December 31, 2010 - $63.46 million).
Zargon reviews its compliance with its bank debt covenants on a quarterly basis and has no violations as at September 30, 2011.
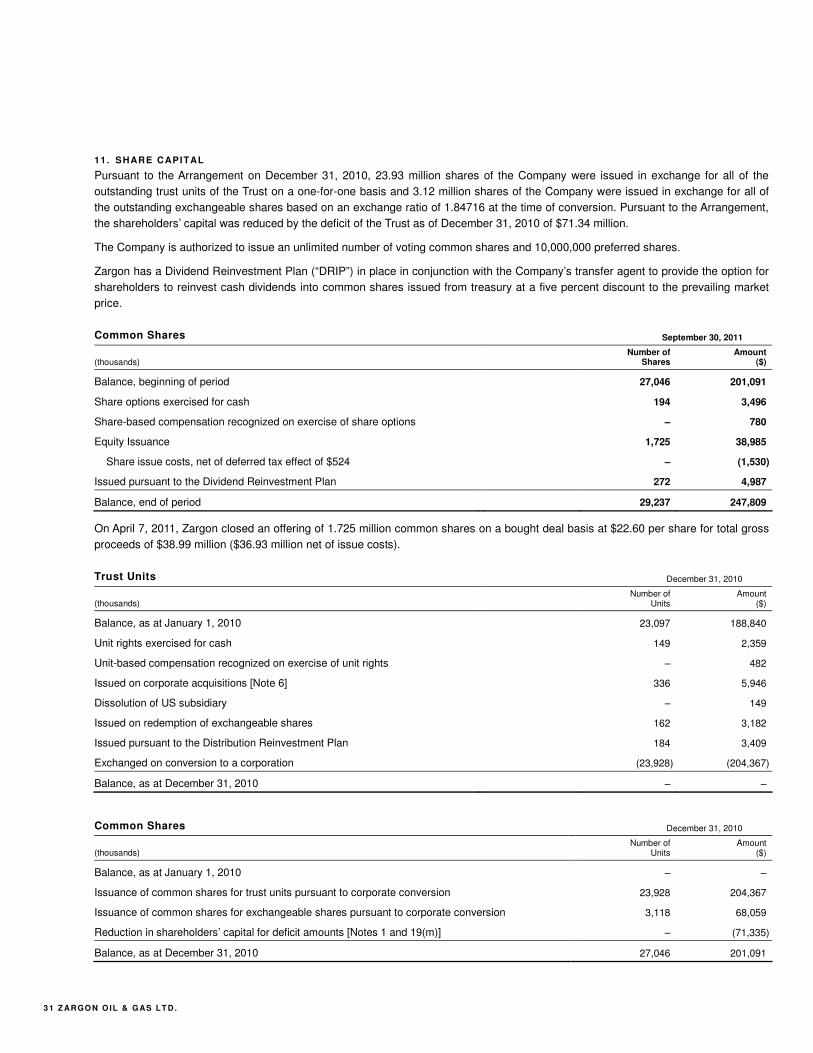
3 1 Z AR GO N O IL & G AS LT D .
11. SHARE CAPITAL
Pursuant to the Arrangement on December 31, 2010, 23.93 million shares of the Company were issued in exchange for all of the
outstanding trust units of the Trust on a one-for-one basis and 3.12 million shares of the Company were issued in exchange for all of
the outstanding exchangeable shares based on an exchange ratio of 1.84716 at the time of conversion. Pursuant to the Arrangement,
the shareholders’ capital was reduced by the deficit of the Trust as of December 31, 2010 of $71.34 million.
The Company is authorized to issue an unlimited number of voting common shares and 10,000,000 preferred shares.
Zargon has a Dividend Reinvestment Plan (“DRIP”) in place in conjunction with the Company’s transfer agent to provide the option for
shareholders to reinvest cash dividends into common shares issued from treasury at a five percent discount to the prevailing market
price.
Common Shares
September 30, 2011
(thousands) Number of
Shares Amount
($)
Balance, beginning of period 27,046 201,091
Share options exercised for cash 194 3,496
Share-based compensation recognized on exercise of share options – 780
Equity Issuance 1,725 38,985
Share issue costs, net of deferred tax effect of $524 – (1,530)
Issued pursuant to the Dividend Reinvestment Plan 272 4,987
Balance, end of period 29,237 247,809
On April 7, 2011, Zargon closed an offering of 1.725 million common shares on a bought deal basis at $22.60 per share for total gross
proceeds of $38.99 million ($36.93 million net of issue costs).
Trust Units December 31, 2010
(thousands) Number of
Units Amount
($)
Balance, as at January 1, 2010 23,097 188,840
Unit rights exercised for cash 149 2,359
Unit-based compensation recognized on exercise of unit rights – 482
Issued on corporate acquisitions [Note 6] 336 5,946
Dissolution of US subsidiary – 149
Issued on redemption of exchangeable shares 162 3,182
Issued pursuant to the Distribution Reinvestment Plan 184 3,409
Exchanged on conversion to a corporation (23,928) (204,367)
Balance, as at December 31, 2010 – –
Common Shares December 31, 2010
(thousands) Number of
Units Amount
($)
Balance, as at January 1, 2010 – –
Issuance of common shares for trust units pursuant to corporate conversion 23,928 204,367
Issuance of common shares for exchangeable shares pursuant to corporate conversion 3,118 68,059
Reduction in shareholders’ capital for deficit amounts [Notes 1 and 19(m)] – (71,335)
Balance, as at December 31, 2010 27,046 201,091

T H IR D Q U ART ER R EPORT 20 11 32
12. SHARE-BASED PAYMENTS
Share Award Plan
On December 15, 2010, a share-based compensation plan (the “Share Award Plan”) was approved and was effective January 1, 2011.
Under the Share Award Plan, directors, officers, employees and other service providers (the “grantees”) are granted the right to receive
a defined number of shares in the future, which increases commensurately with each dividend declared by the Company after the
grant date. The grantees will receive equity compensation in relation to the value of a specified number of underlying share awards.
The awards vest equally over four years and expire five years after grant date. Holders may choose to exercise upon vesting or at any
time thereafter, with forfeiture of any shares not exercised by the expiry date. Upon vesting, the grantees are eligible to receive a share
award based on the fair value of the underlying share awards plus all notional dividends accrued since the grant date.
The following table summarizes information about the Company’s share awards under the Share Award Plan:
Nine Months Ended September 30, 2011
Number of Share Awards
(thousands)
Outstanding at beginning of period –
Share awards granted 180
Share awards forfeited (17)
Outstanding at end of period 163
Common Share Rights Incentive Plans
In conjunction with the corporation conversion, Zargon’s two original Trust Unit Rights Incentive Plans were amended and restated as
Common Shares Rights Incentive Plans. Under these plans, directors, officers, employees and other service providers of the Company
possess rights to acquire common shares at their option of either the original exercise price or a “modified price” as calculated per the
provisions of the relevant plan. The Common Share Rights Incentive Plan (2007) (the “Old Plan”) provides for a modified price based
on the increment of the amount by which monthly dividends exceed a monthly return of 0.833 percent of the Company’s recorded net
book value of oil and natural gas properties (as defined in the Old Plan). Under the Common Share Rights Incentive Plan (2009) (the
“New Plan”), if the monthly dividend exceeds the monthly return of 0.833 percent of the Company’s recorded net book value of oil and
natural gas properties (as defined under the New Plan), the entire amount (not the increment) of the dividend is deducted from the
original grant price. Options granted under either Plan generally vest equally over a three-year period and expire approximately five
years from the grant date. Zargon uses a fair value methodology to value the option grants.
The following table summarizes information about the Company’s share options under the Old Plan:
Nine Months Ended September 30, 2011
Number of Share Options
(thousands)
Weighted Average Exercise Price
Initial and Modified ($/share)
Outstanding at beginning of period 738 25.61 / 23.10
Share options exercised (114) 20.89
Share options expired (145) 31.49
Share options forfeited (44) 25.54
Outstanding at end of period 435 24.24 / 22.02

3 3 Z AR GO N O IL & G AS LT D .
The following table summarizes information about the Company’s share options under the New Plan:
Nine Months Ended September 30, 2011
Number of Share Options
(thousands)
Weighted Average Exercise Price
Initial and Modified ($/share)
Outstanding at beginning of period 708 18.03 / 15.64
Share options exercised (81) 13.79
Share options forfeited (61) 18.45
Outstanding at end of period 566 18.14 / 14.53
Share-based Compensation
The weighted average assumptions used for share awards granted in the nine months ended September 30, 2011 include a volatility
factor of expected market price of 30.96 percent, a risk-free interest rate of 2.27 percent and an expected life of the common shares of
four years. The fair value of the share awards granted under the Share Award Plan in the year was calculated at $19.59 per share
award. These share awards, together with the continued vesting of options granted in prior years, resulted in share-based
compensation expense for the three and nine months ended September 30, 2011 of $0.66 million (2010 – $0.56 million) and $1.76
million (2010 – $1.23 million).
Compensation expense associated with awards/options granted under each Plan is recognized in earnings over the vesting period of
the Plan with a corresponding increase in contributed surplus. The exercise of awards/options is recorded as an increase in common
shares with a corresponding reduction in contributed surplus.
13. WEIGHTED AVERAGE NUMBER OF TOTAL SHARES
Three Months Ended September 30, Nine Months Ended September 30,
(thousands of shares) 2011 2010 2011 2010
Weighted average number of common shares – basic 29,169 23,498 28,410 23,417
Weighted average number of common shares – diluted 29,240 26,427 28,582 26,237
Basic per share amounts are calculated using the weighted average number of shares outstanding during the period. Diluted per share
amounts are calculated using the treasury stock method to determine the dilutive effect of share-based compensation. Due to the fact
that at the time of exercise, the rights holder has the option of exercising at the original grant price or a modified price as calculated
under the Plan, the prices used in the treasury stock calculation are the lower prices calculated under the Plan.
14. PROVISIONS
($ thousands) Asset retirement
obligations Other Total
Balance at January 1, 2011 96,395 – 96,395
Provisions related to dispositions (1,095) – (1,095)
Provisions made during the period 2,654 1,270 3,924
Foreign exchange and other 88 – 88
Provisions used during the year (2,037) – (2,037)
Revisions to estimated provisions 7,952 – 7,952
Accretion 2,429 – 2,429
Balance at September 30, 2011 106,386 1,270 107,656

T H IR D Q U ART ER R EPORT 20 11 34
($ thousands) Asset retirement
obligations Other Total
Balance at January 1, 2010 80,620 – 80,620
Provisions made during the year 16,379 – 16,379
Foreign exchange and other (115) – (115)
Provisions used during the year (3,556) – (3,556)
Accretion 3,067 – 3,067
Balance at December 31, 2010 96,395 – 96,395
The asset retirement obligations were calculated using a discount factor of 3.5 percent being the risk free rate related to the liability
and based on the Government of Canada long term bond rate. During the third quarter, the Government of Canada long term bond
rate had decreased and effective September 30, 2011 Zargon adjusted the discount factor to 3.0 percent. Accordingly, Zargon
recorded an adjustment to property, plant and equipment and the asset retirement obligation.
Zargon is subject to normal course income tax audits by Canadian and US taxation authorities. During the fourth quarter of 2010, the
Canada Revenue Agency commenced a flow-through share audit of a predecessor company from a prior corporate acquisition. During
the first quarter of 2011, Zargon recorded a $1.27 million provision which was comprised of a $0.92 million charge to current income
tax expense and $0.35 million charge to interest expense for the related Part XII.6 tax, with respect to this ongoing income tax audit. At
this time, Zargon is uncertain of the timing and final outcome of this matter.
15. CONTINGENCIES AND COMMITMENTS
There have been no significant changes to Zargon’s contingencies and commitments since March 31, 2011.
16. S IGNIFICANT SUBSIDIARIES
The Company has the following significant wholly owned subsidiaries which are incorporated and one partnership in Canada:
Zargon Energy Ltd.
Zargon Oil & Gas Partnership
Ashton Oil & Gas Ltd.
Additionally, the Company has the following significant wholly owned subsidiaries incorporated in the United States:
Zargon Acquisition Inc.
Zargon Oil (ND) Inc.
17. SEGMENTED INFORMATION
Zargon’s entire operating activities are related to exploration, development and production of oil and natural gas in the geographic
regions of Canada and the US.
Three Months Ended September 30, 2011
($ thousands) Canada United States Combined
Petroleum and natural gas revenue, net of royalties 33,252 3,111 36,363
Earnings before income taxes 40,695 1,726 42,421
Net capital expenditures (5,098) 486 (4,612)
Nine Months Ended September 30, 2011
($ thousands) Canada United States Combined
Petroleum and natural gas revenue, net of royalties 105,622 9,055 114,677
Earnings before income taxes 43,233 5,203 48,436
Net capital expenditures 22,323 1,445 23,768
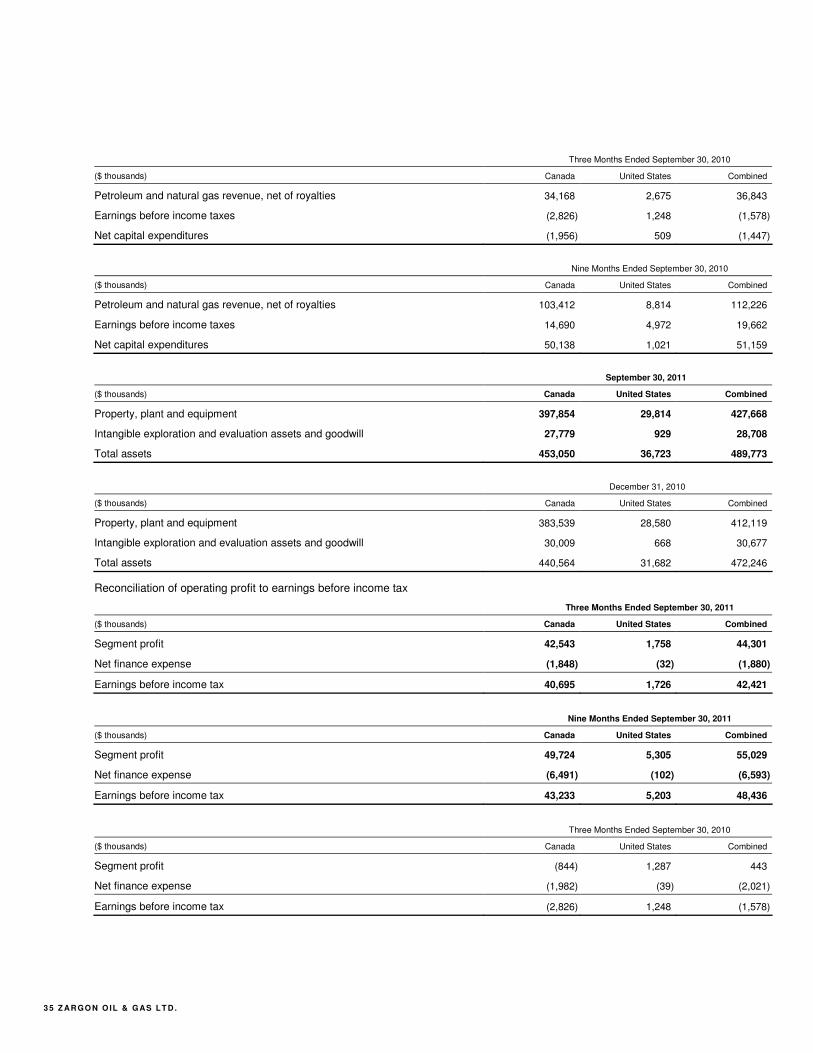
3 5 Z AR GO N O IL & G AS LT D .
Three Months Ended September 30, 2010
($ thousands) Canada United States Combined
Petroleum and natural gas revenue, net of royalties 34,168 2,675 36,843
Earnings before income taxes (2,826) 1,248 (1,578)
Net capital expenditures (1,956) 509 (1,447)
Nine Months Ended September 30, 2010
($ thousands) Canada United States Combined
Petroleum and natural gas revenue, net of royalties 103,412 8,814 112,226
Earnings before income taxes 14,690 4,972 19,662
Net capital expenditures 50,138 1,021 51,159
September 30, 2011
($ thousands) Canada United States Combined
Property, plant and equipment 397,854 29,814 427,668
Intangible exploration and evaluation assets and goodwill 27,779 929 28,708
Total assets 453,050 36,723 489,773
December 31, 2010
($ thousands) Canada United States Combined
Property, plant and equipment 383,539 28,580 412,119
Intangible exploration and evaluation assets and goodwill 30,009 668 30,677
Total assets 440,564 31,682 472,246
Reconciliation of operating profit to earnings before income tax
Three Months Ended September 30, 2011
($ thousands) Canada United States Combined
Segment profit 42,543 1,758 44,301
Net finance expense (1,848) (32) (1,880)
Earnings before income tax 40,695 1,726 42,421
Nine Months Ended September 30, 2011
($ thousands) Canada United States Combined
Segment profit 49,724 5,305 55,029
Net finance expense (6,491) (102) (6,593)
Earnings before income tax 43,233 5,203 48,436
Three Months Ended September 30, 2010
($ thousands) Canada United States Combined
Segment profit (844) 1,287 443
Net finance expense (1,982) (39) (2,021)
Earnings before income tax (2,826) 1,248 (1,578)
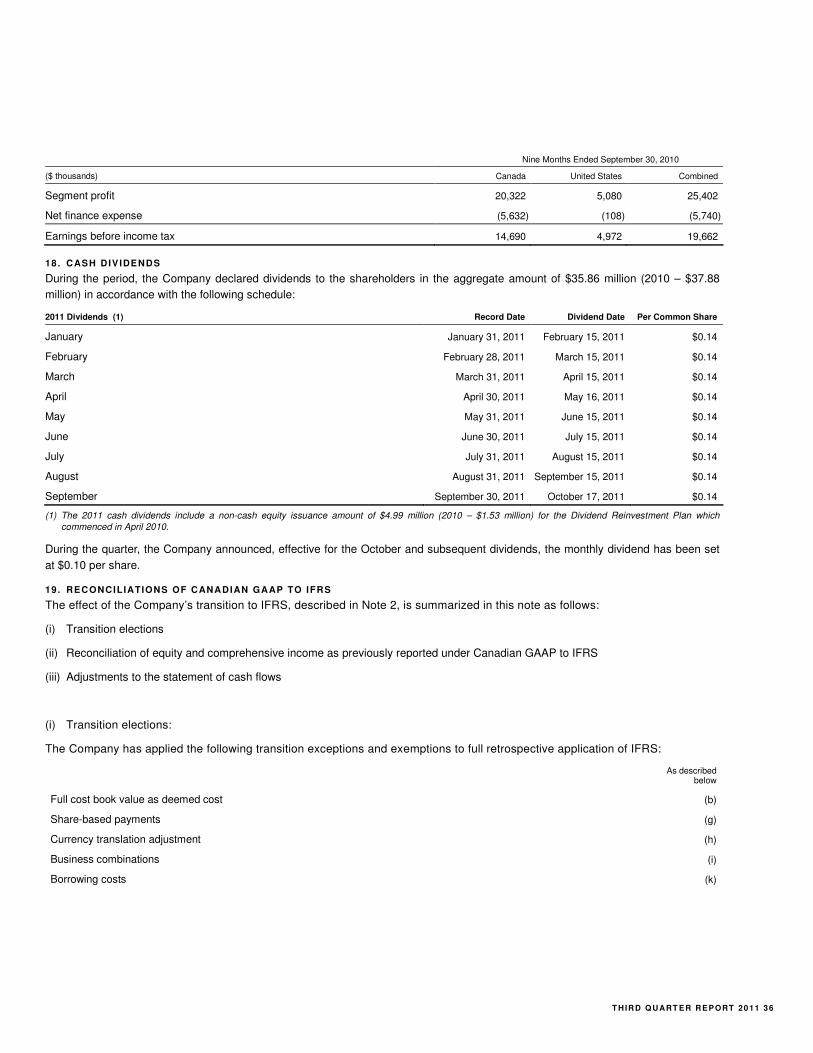
T H IR D Q U ART ER R EPORT 20 11 36
Nine Months Ended September 30, 2010
($ thousands) Canada United States Combined
Segment profit 20,322 5,080 25,402
Net finance expense (5,632) (108) (5,740)
Earnings before income tax 14,690 4,972 19,662
18. CASH DIV IDENDS
During the period, the Company declared dividends to the shareholders in the aggregate amount of $35.86 million (2010 – $37.88
million) in accordance with the following schedule:
2011 Dividends (1) Record Date Dividend Date Per Common Share
January January 31, 2011 February 15, 2011 $0.14
February February 28, 2011 March 15, 2011 $0.14
March March 31, 2011 April 15, 2011 $0.14
April April 30, 2011 May 16, 2011 $0.14
May May 31, 2011 June 15, 2011 $0.14
June June 30, 2011 July 15, 2011 $0.14
July July 31, 2011 August 15, 2011 $0.14
August August 31, 2011 September 15, 2011 $0.14
September September 30, 2011 October 17, 2011 $0.14
(1) The 2011 cash dividends include a non-cash equity issuance amount of $4.99 million (2010 – $1.53 million) for the Dividend Reinvestment Plan which commenced in April 2010.
During the quarter, the Company announced, effective for the October and subsequent dividends, the monthly dividend has been set
at $0.10 per share.
19. RECONCILIATIONS OF CANADIAN GAAP TO IFRS
The effect of the Company’s transition to IFRS, described in Note 2, is summarized in this note as follows:
(i) Transition elections
(ii) Reconciliation of equity and comprehensive income as previously reported under Canadian GAAP to IFRS
(iii) Adjustments to the statement of cash flows
(i) Transition elections:
The Company has applied the following transition exceptions and exemptions to full retrospective application of IFRS:
As described below
Full cost book value as deemed cost (b)
Share-based payments (g)
Currency translation adjustment (h)
Business combinations (i)
Borrowing costs (k)
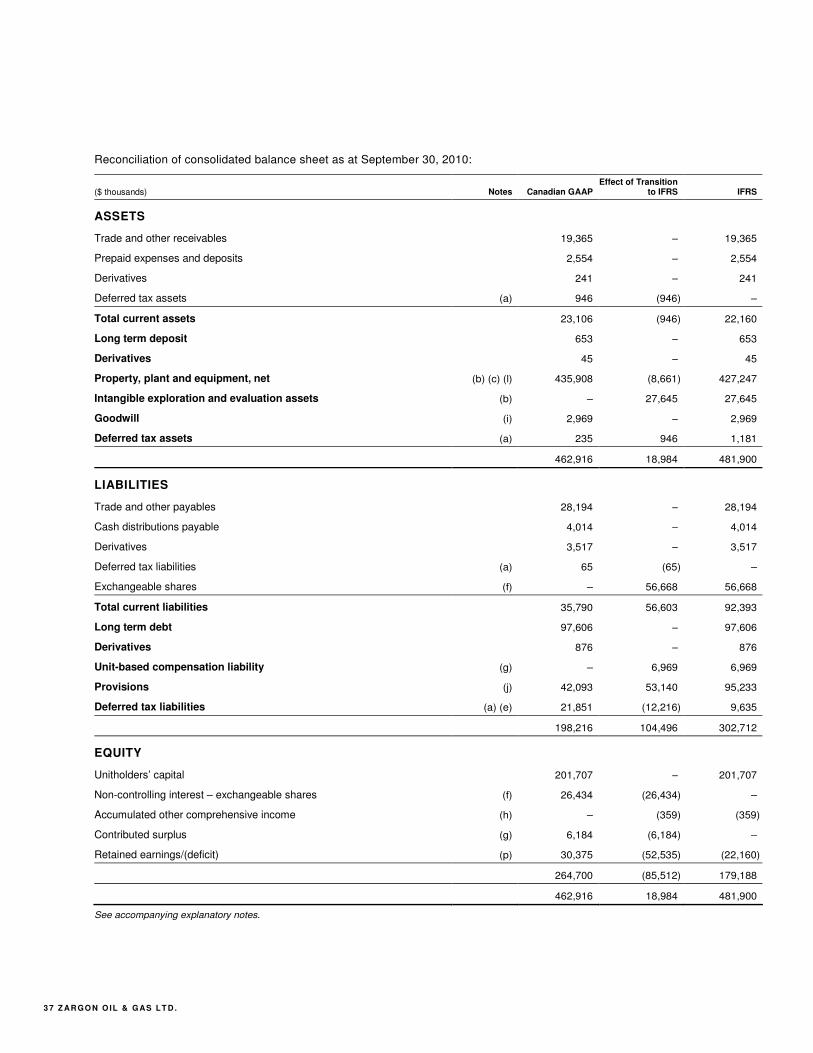
3 7 Z AR GO N O IL & G AS LT D .
Reconciliation of consolidated balance sheet as at September 30, 2010:
($ thousands) Notes Canadian GAAP Effect of Transition
to IFRS IFRS
ASSETS
Trade and other receivables 19,365 – 19,365
Prepaid expenses and deposits 2,554 – 2,554
Derivatives 241 – 241
Deferred tax assets (a) 946 (946) –
Total current assets 23,106 (946) 22,160
Long term deposit 653 – 653
Derivatives 45 – 45
Property, plant and equipment, net (b) (c) (l) 435,908 (8,661) 427,247
Intangible exploration and evaluation assets (b) – 27,645 27,645
Goodwill (i) 2,969 – 2,969
Deferred tax assets (a) 235 946 1,181
462,916 18,984 481,900
LIABILITIES
Trade and other payables 28,194 – 28,194
Cash distributions payable 4,014 – 4,014
Derivatives 3,517 – 3,517
Deferred tax liabilities (a) 65 (65) –
Exchangeable shares (f) – 56,668 56,668
Total current liabilities 35,790 56,603 92,393
Long term debt 97,606 – 97,606
Derivatives 876 – 876
Unit-based compensation liability (g) – 6,969 6,969
Provisions (j) 42,093 53,140 95,233
Deferred tax liabilities (a) (e) 21,851 (12,216) 9,635
198,216 104,496 302,712
EQUITY
Unitholders’ capital 201,707 – 201,707
Non-controlling interest – exchangeable shares (f) 26,434 (26,434) –
Accumulated other comprehensive income (h) – (359) (359)
Contributed surplus (g) 6,184 (6,184) –
Retained earnings/(deficit) (p) 30,375 (52,535) (22,160)
264,700 (85,512) 179,188
462,916 18,984 481,900
See accompanying explanatory notes.
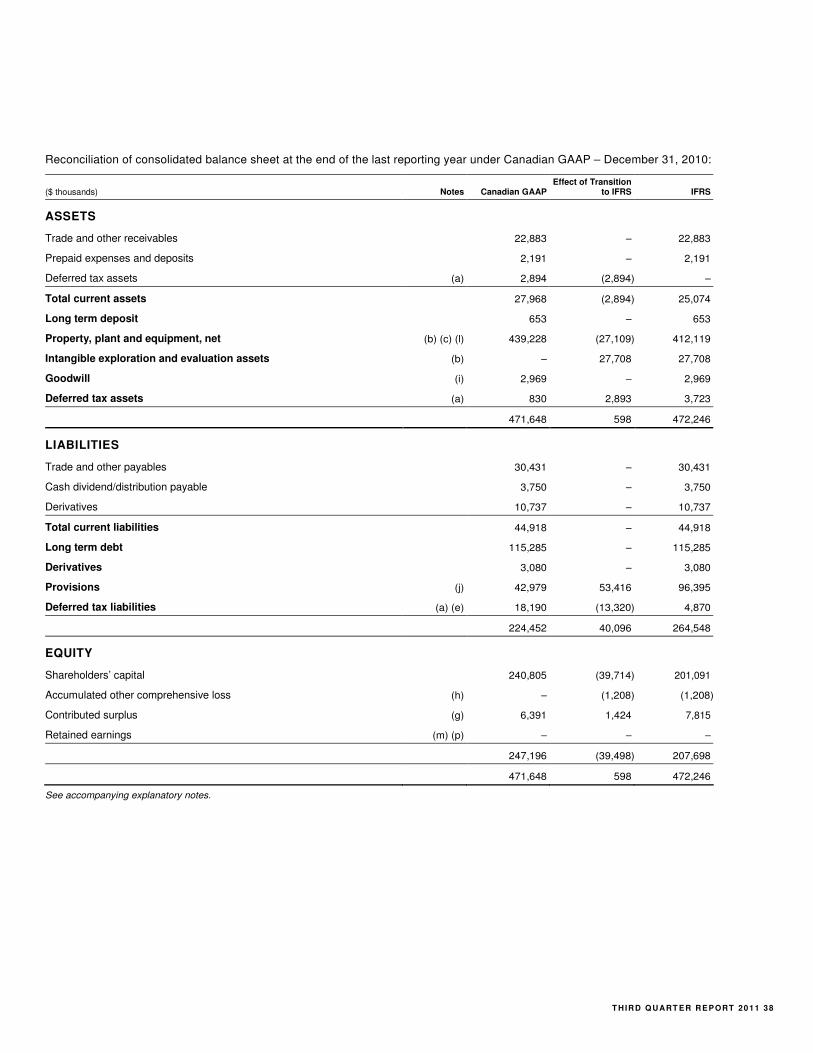
T H IR D Q U ART ER R EPORT 20 11 38
Reconciliation of consolidated balance sheet at the end of the last reporting year under Canadian GAAP – December 31, 2010:
($ thousands) Notes Canadian GAAP Effect of Transition
to IFRS IFRS
ASSETS
Trade and other receivables 22,883 – 22,883
Prepaid expenses and deposits 2,191 – 2,191
Deferred tax assets (a) 2,894 (2,894) –
Total current assets 27,968 (2,894) 25,074
Long term deposit 653 – 653
Property, plant and equipment, net (b) (c) (l) 439,228 (27,109) 412,119
Intangible exploration and evaluation assets (b) – 27,708 27,708
Goodwill (i) 2,969 – 2,969
Deferred tax assets (a) 830 2,893 3,723
471,648 598 472,246
LIABILITIES
Trade and other payables 30,431 – 30,431
Cash dividend/distribution payable 3,750 – 3,750
Derivatives 10,737 – 10,737
Total current liabilities 44,918 – 44,918
Long term debt 115,285 – 115,285
Derivatives 3,080 – 3,080
Provisions (j) 42,979 53,416 96,395
Deferred tax liabilities (a) (e) 18,190 (13,320) 4,870
224,452 40,096 264,548
EQUITY
Shareholders’ capital 240,805 (39,714) 201,091
Accumulated other comprehensive loss (h) – (1,208) (1,208)
Contributed surplus (g) 6,391 1,424 7,815
Retained earnings (m) (p) – – –
247,196 (39,498) 207,698
471,648 598 472,246
See accompanying explanatory notes.
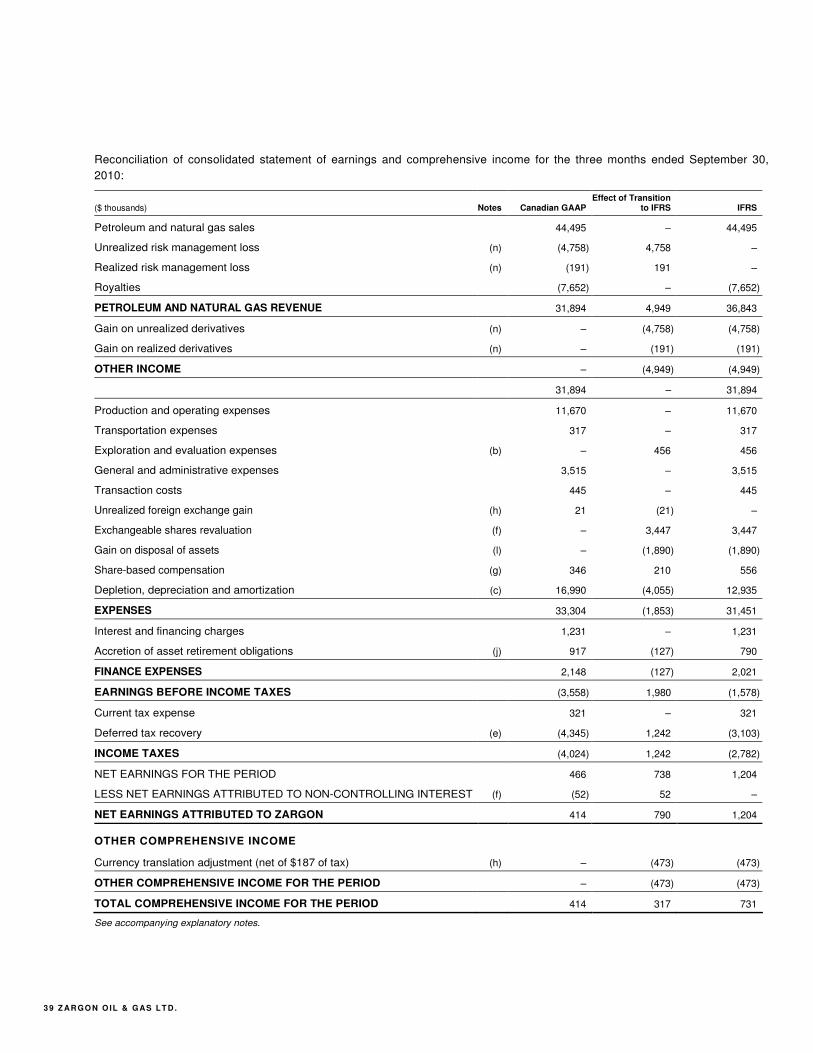
3 9 Z AR GO N O IL & G AS LT D .
Reconciliation of consolidated statement of earnings and comprehensive income for the three months ended September 30,
2010:
($ thousands) Notes Canadian GAAP Effect of Transition
to IFRS IFRS
Petroleum and natural gas sales 44,495 – 44,495
Unrealized risk management loss (n) (4,758) 4,758 –
Realized risk management loss (n) (191) 191 –
Royalties (7,652) – (7,652)
PETROLEUM AND NATURAL GAS REVENUE 31,894 4,949 36,843
Gain on unrealized derivatives (n) – (4,758) (4,758)
Gain on realized derivatives (n) – (191) (191)
OTHER INCOME – (4,949) (4,949)
31,894 – 31,894
Production and operating expenses 11,670 – 11,670
Transportation expenses 317 – 317
Exploration and evaluation expenses (b) – 456 456
General and administrative expenses 3,515 – 3,515
Transaction costs 445 – 445
Unrealized foreign exchange gain (h) 21 (21) –
Exchangeable shares revaluation (f) – 3,447 3,447
Gain on disposal of assets (l) – (1,890) (1,890)
Share-based compensation (g) 346 210 556
Depletion, depreciation and amortization (c) 16,990 (4,055) 12,935
EXPENSES 33,304 (1,853) 31,451
Interest and financing charges 1,231 – 1,231
Accretion of asset retirement obligations (j) 917 (127) 790
FINANCE EXPENSES 2,148 (127) 2,021
EARNINGS BEFORE INCOME TAXES (3,558) 1,980 (1,578)
Current tax expense 321 – 321
Deferred tax recovery (e) (4,345) 1,242 (3,103)
INCOME TAXES (4,024) 1,242 (2,782)
NET EARNINGS FOR THE PERIOD 466 738 1,204
LESS NET EARNINGS ATTRIBUTED TO NON-CONTROLLING INTEREST (f) (52) 52 –
NET EARNINGS ATTRIBUTED TO ZARGON 414 790 1,204
OTHER COMPREHENSIVE INCOME
Currency translation adjustment (net of $187 of tax) (h) – (473) (473)
OTHER COMPREHENSIVE INCOME FOR THE PERIOD – (473) (473)
TOTAL COMPREHENSIVE INCOME FOR THE PERIOD 414 317 731
See accompanying explanatory notes.

T H IR D Q U ART ER R EPORT 20 11 40
Reconciliation of consolidated statement of earnings and comprehensive income for the nine months ended September 30,
2010:
($ thousands) Notes Canadian GAAP Effect of Transition
to IFRS IFRS
Petroleum and natural gas sales 136,837 – 136,837
Unrealized risk management gain (n) (1,095) 1,095 –
Realized risk management gain (n) 2,406 (2,406) –
Royalties (24,611) – (24,611)
PETROLEUM AND NATURAL GAS REVENUE 113,537 (1,311) 112,226
Gain on unrealized derivatives (n) – (1,095) (1,095)
Gain on realized derivatives (n) – 2,406 2,406
OTHER INCOME – 1,311 1,311
113,537 – 113,537
Production and operating expenses 34,756 – 34,756
Transportation expenses 887 – 887
Exploration and evaluation expenses (b) – 1,660 1,660
General and administrative expenses 11,429 – 11,429
Transaction costs 445 – 445
Unrealized foreign exchange gain (h) 9 (9) –
Exchangeable shares revaluation (f) – 3,447 3,447
Gain on disposal of assets (l) – (3,252) (3,252)
Share-based compensation (g) 1,082 146 1,228
Depletion, depreciation and amortization (c) 50,152 (12,617) 37,535
EXPENSES 98,760 (10,625) 88,135
Interest and financing charges 3,474 – 3,474
Accretion of asset retirement obligations (j) 2,572 (306) 2,266
FINANCE EXPENSES 6,046 (306) 5,740
EARNINGS BEFORE INCOME TAXES 8,731 10,931 19,662
Current tax expense 1,886 – 1,886
Deferred tax recovery (e) (9,156) 3,516 (5,640)
INCOME TAXES (7,270) 3,516 (3,754)
NET EARNINGS FOR THE PERIOD 16,001 7,415 23,416
LESS NET EARNINGS ATTRIBUTED TO NON-CONTROLLING INTEREST (f) (1,779) 1,779 –
NET EARNINGS ATTRIBUTED TO ZARGON 14,222 9,194 23,416
OTHER COMPREHENSIVE INCOME
Currency translation adjustment (net of $102 of tax) (h) – (257) (257)
OTHER COMPREHENSIVE INCOME FOR THE PERIOD – (257) (257)
TOTAL COMPREHENSIVE INCOME FOR THE PERIOD 14,222 8,937 23,159
See accompanying explanatory notes.
4 1 Z AR GO N O IL & G AS LT D .
Explanatory notes
(a) Under IFRS, all deferred taxes must be classified as non-current. Under Canadian GAAP, deferred taxes relating to current assets
or current liabilities must be classified as current. Accordingly, current deferred tax assets reported under Canadian GAAP of
$0.95 million and current deferred tax liabilities of $0.07 million at September 30, 2010 ($2.89 million and nil, respectively, at
December 31, 2010) have been re-classified as non-current under IFRS.
(b) The Company elected under IFRS 1 to deem the Canadian GAAP carrying value of its oil and gas assets accounted for under the
full cost method as at January 1, 2010 as their deemed cost under IFRS as at that date. As such, the Canadian GAAP full cost
pool was reallocated upon transition to IFRS and the 2010 comparatives were restated to reflect the new IFRS accounting policies
as follows:
i. In accordance with IAS 16, IAS 38 and IFRS 6 on January 1, 2010 the Company reallocated costs of $24.37 million relating
to unproved properties from property, plant and equipment to exploration and evaluation assets.
ii. Under Canadian GAAP, all costs incurred prior to having obtained licence rights and lease expiries were included within
property, plant and equipment. Under IFRS, such expenditures are expensed as incurred. There was no impact on adoption
of IFRS due to the full cost as deemed cost exemption. However, the comparative 2010 balances were restated at
September 30, 2010 and December 31, 2010 resulting in a reduction in property, plant and equipment and retained earnings
of $1.66 million and $2.81 million, respectively, and an increase in exploration and evaluation expenses for the nine months
and for the year of the same amounts. The increase to exploration and evaluation expense for the three months ended
September 30, 2010 was $0.46 million.
iii. The remaining full cost pool was allocated to the developed and producing assets pro rata using reserve values.
iv. Under IFRS, impairment tests must be performed at a more granular level than what was required under Canadian GAAP.
The Canadian GAAP “ceiling test” incorporated a 2-step approach for testing impairment, while IFRS uses a 1-step approach.
Under Canadian GAAP, a discounted cash flow analysis was not required if the undiscounted cash flows from proved
reserves exceeded the carrying amount (step 1). If the carrying amount exceeded the undiscounted future cash flows, then a
prescribed discounted cash flow test was performed (step 2). Under IFRS, impairment testing is based on discounted cash
flows and is calculated at the CGU level. Impairment tests are required to be performed at the transition date, and as at
January 1, 2010 no impairment was identified. An assessment of indicators of impairment was made at September 30, 2010
and it was determined that no indicators were present. At December 31, 2010 an impairment test was performed and four of
the Company’s 10 CGUs were found to have impairment. For further details please refer to Note 9.
(c) Upon transition to IFRS, the Company adopted a policy of depleting oil and natural gas interests on a “units of production” basis
over proved plus probable reserves on a field by field basis. The depletion policy under Canadian GAAP was units of production
over proved reserves on a country by country basis. For the nine months ended September 30, 2010, this resulted in increases to
property, plant and equipment and retained earnings and a decrease to depletion expense of $12.62 million. The December 31,
2010 effect was increases in property, plant and equipment and retained earnings and a decrease to depletion expense of $17.21
million. The decrease in depletion expense for the three months ended September 30, 2010 was $4.06 million.
(d) Under IFRS, impairment losses previously recorded are reversed if there has been an improvement in the estimates used to
determine recoverable amount, except for goodwill. The reversal of impairment losses was not permitted under Canadian GAAP.
This had no impact on adoption to IFRS at January 1, 2010 due to the full cost as deemed cost exemption. There have been no
impairment loss reversals subsequent to transition date.
(e) Under IFRS, the Company’s asset retirement obligation increased by $43.87 million at January 1, 2010 (please refer to
explanatory Note (j) for further details) which resulted in a reduction in the deferred tax liability under IFRS.
As Zargon Energy Trust was a flow-through entity whose taxable income passed through to unitholders, under IFRS the
temporary tax differences prior to the corporate conversion on December 31, 2010 must be tax affected at the top marginal
personal tax rate in Canada. Under Canadian GAAP, the Trust’s temporary differences were tax affected at the statutory corporate
tax rate. This difference resulted in a reduction in the deferred tax liability under IFRS, as the Trust was in a net tax asset position.
T H IR D Q U ART ER R EPORT 20 11 42
As a result of all measurement differences, including the two discussed above, the Company recorded a decrease in the deferred
tax liability of $12.22 million for the nine months ended September 30, 2010 and $13.32 million for the year ended December 31,
2010.
(f) Under Canadian GAAP, exchangeable shares were accounted for as non-controlling interest (“NCI”), however under IFRS the
exchangeable shares are accounted for as financial liabilities at amortized cost (which is equivalent to fair value). As a result,
Zargon’s exchangeable shares will be measured at fair value at each reporting period and classified as a liability rather than as a
NCI in equity under Canadian GAAP. Since the exchangeable shares were redeemed at the time of our corporate conversion on
December 31, 2010, the 2010 exchangeable shares are classified as a current liability. The re-measurement to fair value resulted
in an increase to exchangeable shares of $29.73 million as at January 1, 2010. For the three and nine months ended September
30, 2011, the Company recorded a loss of $3.45 million in earnings due to the exchangeable share revaluation.
(g) Prior to conversion to a corporation on December 31, 2010, Zargon’s share-based payments were accounted for as liability
instruments. IFRS 2 “Share Based Payments” applies only to common share equity instruments whereas Zargon’s trust units were
classified as equity under the puttables amendment under IAS 32 “Financial Instruments: Presentation”. The trust units are
classified as equity as a result of the puttable amendment; however the unit-based payments were classified as cash-settled
instruments and therefore were accounted for as liabilities (“unit-based compensation liability”) and measured at fair value. On
December 31, 2010, the conversion from an income trust into a corporation was completed and these payments were reclassified
from liabilities to contributed surplus at their current fair value. The Company has elected to apply IFRS 2 “Share-based
Payments” only for unvested options and unsettled liability awards outstanding for the post-conversion periods. Under IFRS, the
Company accrues the cost of employee stock options over the vesting period using the graded method of amortization rather than
the straight-line method, which was the Company’s policy under Canadian GAAP. This increased the unit-based compensation
liability and reduced retained earnings at the date of transition by $0.64 million and increased share-based compensation expense
by $0.21 million and $0.15 million for the three and nine months ended September 30, 2010, respectively.
(h) The Company has elected to reset the currency translation adjustment account, which includes gains and losses arising from the
translation of foreign operations, to zero at the date of transition to IFRS, which reduced retained earnings by $1.48 million at
January 1, 2010. Currency translation adjustments of $0.47 million and $0.26 million were recognized for the three and nine
months ended September 30, 2010, respectively, and $1.21 million for the year ended December 31, 2010. Under IFRS, amounts
are initially recognized in a subsidiary’s functional currency (the currency of the primary economic environment in which it
operates) and are translated into the functional currency used for presentation of the consolidated financial statements (refer to
Note 2(c) for more information). The assessment of the functional currency has resulted in transactions and balances for Zargon’s
US subsidiaries to be initially recognized in USD. Under Canadian GAAP, these subsidiaries were considered to be integrated
and were translated with only monetary assets and liabilities retranslated using year end rates.
(i) The Company elected to apply IFRS 3 (revised) “Business Combinations” to business combinations prospectively from January 1,
2010. As such, Canadian GAAP balances relating to business combinations entered into before that date, including goodwill, have
been carried forward without adjustment.
(j) As stated in Note (b), the Company has elected to utilize the full cost as deemed cost exemption, thereby requiring that the
Company measure its asset retirement obligation as at the date of transition in accordance with IAS 37 and recognize the
difference between Canadian GAAP and IFRS in retained earnings. As such, the Company has re-measured the provision as at
January 1, 2010 under IAS 37 and estimated the amount to be recognized in retained earnings by discounting the liability to the
date at which the liability first arose. This further resulted in a decrease in retained earnings and increase in the asset retirement
obligation of $45.15 million at January 1, 2010. This resulted in an increase in the asset retirement obligation and property, plant
and equipment of $53.14 million for the nine months ended September 30, 2010 and $53.42 million for the year ended December
31, 2010 primarily due to a change in the discount rate applied from a credit adjusted rate required by Canadian GAAP, to a pre-
tax rate that reflects current market assessments of the time value of money and the risks specific to the obligation as well as
restatement of the entire obligation using the current period discount rate rather than only applying the current period discount rate
to upward revisions in the future costs estimates as was required under Canadian GAAP.
(k) The Company will apply the transitional exemption relating to borrowing costs, whereby only borrowing costs incurred after
transition date will be capitalized to qualifying assets, if any. There have been no qualifying assets subsequent to transition date.
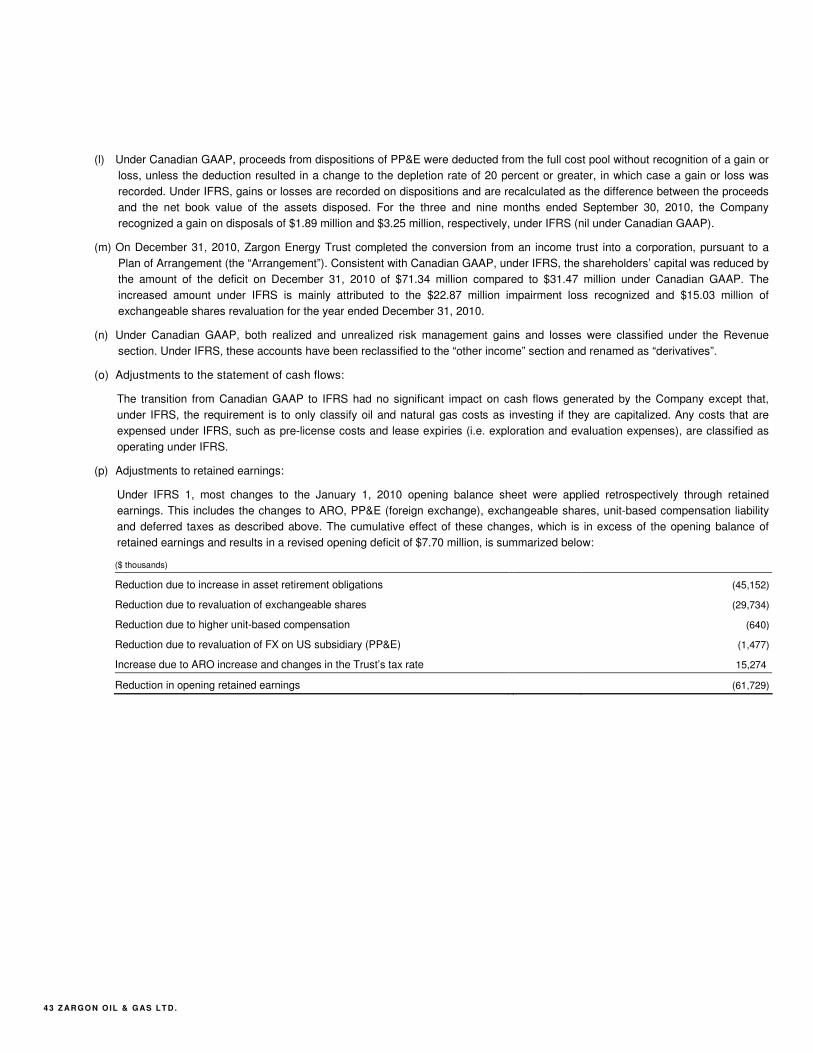
4 3 Z AR GO N O IL & G AS LT D .
(l) Under Canadian GAAP, proceeds from dispositions of PP&E were deducted from the full cost pool without recognition of a gain or
loss, unless the deduction resulted in a change to the depletion rate of 20 percent or greater, in which case a gain or loss was
recorded. Under IFRS, gains or losses are recorded on dispositions and are recalculated as the difference between the proceeds
and the net book value of the assets disposed. For the three and nine months ended September 30, 2010, the Company
recognized a gain on disposals of $1.89 million and $3.25 million, respectively, under IFRS (nil under Canadian GAAP).
(m) On December 31, 2010, Zargon Energy Trust completed the conversion from an income trust into a corporation, pursuant to a
Plan of Arrangement (the “Arrangement”). Consistent with Canadian GAAP, under IFRS, the shareholders’ capital was reduced by
the amount of the deficit on December 31, 2010 of $71.34 million compared to $31.47 million under Canadian GAAP. The
increased amount under IFRS is mainly attributed to the $22.87 million impairment loss recognized and $15.03 million of
exchangeable shares revaluation for the year ended December 31, 2010.
(n) Under Canadian GAAP, both realized and unrealized risk management gains and losses were classified under the Revenue
section. Under IFRS, these accounts have been reclassified to the “other income” section and renamed as “derivatives”.
(o) Adjustments to the statement of cash flows:
The transition from Canadian GAAP to IFRS had no significant impact on cash flows generated by the Company except that,
under IFRS, the requirement is to only classify oil and natural gas costs as investing if they are capitalized. Any costs that are
expensed under IFRS, such as pre-license costs and lease expiries (i.e. exploration and evaluation expenses), are classified as
operating under IFRS.
(p) Adjustments to retained earnings:
Under IFRS 1, most changes to the January 1, 2010 opening balance sheet were applied retrospectively through retained
earnings. This includes the changes to ARO, PP&E (foreign exchange), exchangeable shares, unit-based compensation liability
and deferred taxes as described above. The cumulative effect of these changes, which is in excess of the opening balance of
retained earnings and results in a revised opening deficit of $7.70 million, is summarized below:
($ thousands)
Reduction due to increase in asset retirement obligations (45,152)
Reduction due to revaluation of exchangeable shares (29,734)
Reduction due to higher unit-based compensation (640)
Reduction due to revaluation of FX on US subsidiary (PP&E) (1,477)
Increase due to ARO increase and changes in the Trust’s tax rate 15,274
Reduction in opening retained earnings (61,729)
T H IR D Q U ART ER R EPORT 20 11 44
CORPORATE INFORMATION
BOARD OF DIRECTORS
Craig H. Hansen
Calgary, Alberta
K. James Harrison (3) (4)
Chairman of the Board
Oakville, Ontario
Kyle D. Kitagawa (1) (2)
Calgary, Alberta
Margaret A. McKenzie (1) (3)
Calgary, Alberta
Geoffrey C. Merritt (2)
Calgary, Alberta
Jim Peplinski (2) (4)
Calgary, Alberta
J. Graham Weir (1) (2)
Calgary, Alberta
Grant A. Zawalsky (3) (4)
Calgary, Alberta
OFFICERS
Craig H. Hansen
President and Chief Executive Officer
Charles L. Buckley
Vice President, Geosciences
Randolph J. Doetzel Vice President, Operations
Jason B. Dranchuk
Vice President, Finance and
Chief Financial Officer
Tracy L. Howard
Corporate Secretary
Brian G. Kergan
Vice President, Corporate Development
Kevin C.Y. Lee
Vice President, Alberta Plains North
Robert T. Moriyama
Vice President, Enhanced Recovery
(1) Audit Committee
(2) Reserves Committee
(3) Governance and Nominating Committee
(4) Compensation Committee
STOCK EXCHANGE LISTING
Toronto Stock Exchange
Zargon Oil & Gas Ltd.
Common Shares
Trading Symbol: ZAR
TRANSFER AGENT Valiant Trust Company
310, 606 – 4th Street S.W.
Calgary, Alberta T2P 1T1
BANKERS
The Toronto Dominion Bank
910, 333 – 7th Avenue S.W.
Calgary, Alberta T2P 2Z1
Canadian Imperial Bank of Commerce
9th Floor, Bankers Hall East
855 – 2nd Street S.W.
Calgary, Alberta T2P 2P2
The Bank of Nova Scotia
2000, 700 – 2nd Street S.W.
Calgary, Alberta T2P 2N7
LEGAL COUNSEL
Burnet, Duckworth & Palmer LLP
2400, 525 – 8th Avenue S.W.
Calgary, Alberta T2P 1G1
CONSULTING ENGINEERS
McDaniel & Associates Consultants Ltd.
2200, 255 – 5th Avenue S.W.
Calgary, Alberta T2P 3G6
AUDITORS
Ernst & Young LLP
1000, 440 – 2nd Avenue S.W.
Calgary, Alberta T2P 5E9
HEAD OFFICE
700, 333 – 5th Avenue S.W.
Calgary, Alberta T2P 3B6
Telephone: 403-264-9992
Fax: 403-265-3026
Email: [email protected]
WEBSITE
www.zargon.ca