Embed Size (px)
Citation preview
Zargon Oil & Gas Ltd.
2010 F INANCIAL REPORT
Focused on exploitation
403-264-9992 www.zargon.ca
ABBREVIATIONSbbl Barrelbbl/d Barrels per daybcf Billion cubic feetboe Barrels of oil equivalent
(6 mcf is equivalent to 1 bbl)boe/d Barrels of oil equivalent per daybtu British thermal unitsgj Gigajoule
gj/d Gigajoules per daym Thousandmcf Thousand cubic feetmcf/d Thousand cubic feet per daymm Millionmmbtu Million British thermal unitsMWh Megawatt hourMWs/d Megawatts per day
AECO Alberta gas trading priceAESO Alberta Electric Systems
OperatorAPI American Petroleum InstituteEIC Emerging Issues CommitteeLIBOR London Interbank Offered RateNYMEX New York Mercantile ExchangeWTI West Texas Intermediate
1Management’s
Discussion and Analysis
34Consolidated
Financial Statements
37Notes to the Consolidated
Financial Statements
IBCCorporate
Information
Table of Contents
BOARD OF DIRECTORS
Craig H. HansenCalgary, Alberta
K. James Harrison (3) (4)
Chairman of the Board Oakville, Ontario
Kyle D. Kitagawa (1) (2)
Calgary, Alberta
Geoffrey C. Merritt (2)
Calgary, Alberta
Margaret A. McKenzie (1) (3)
Calgary, Alberta
Jim Peplinski (2) (4)
Calgary, Alberta
J. Graham Weir (1) (2)
Calgary, Alberta
Grant A. Zawalsky (3) (4) Calgary, Alberta
OFFICERS
Craig H. HansenPresident and Chief Executive Officer
Henry J. BairdVice President, Reservoir Engineering
Charles L. BuckleyVice President, Geosciences
Jason B. DranchukVice President, Finance and Chief Financial Officer
Tracy L. HowardCorporate Secretary
Brian G. KerganVice President, Corporate Development
Kevin C.Y. LeeVice President, Alberta Plains North
Robert T. MoriyamaVice President, Enhanced Recovery
Lorne D. SchwetzVice President, Land
Al D. ThorsenVice President, Operations
STOCK EXCHANGE LISTING
Toronto Stock Exchange
Zargon Oil & Gas Ltd.Common SharesTrading Symbol: ZAR
TRANSFER AGENT
Valiant Trust Company310, 606 – 4th Street S.W.Calgary, Alberta T2P 1T1
BANKERS
The Toronto Dominion Bank910, 333 – 7th Avenue S.W. Calgary, Alberta T2P 2Z1
Canadian Imperial Bank of Commerce9th Floor, Bankers Hall East855 – 2nd Street S.W.Calgary, Alberta T2P 2P2
The Bank of Nova Scotia2000, 700 – 2nd Street S.W.Calgary, Alberta T2P 2N7
HEAD OFFICE
700, 333 – 5th Avenue S.W.Calgary, Alberta T2P 3B6Telephone: 403-264-9992Fax: 403-265-3026Email: [email protected]
WEBSITE
www.zargon.ca
LEGAL COUNSEL
Burnet, Duckworth & Palmer LLP1400, 350 – 7th Avenue S.W.Calgary, Alberta T2P 3N9
CONSULTING ENGINEERS
McDaniel & Associates Consultants Ltd.2200, 255 – 5th Avenue S.W.Calgary, Alberta T2P 3G6
AUDITORS
Ernst & Young LLP1000, 440 – 2nd Avenue S.W.Calgary, Alberta T2P 5E9
(1) Audit Committee (2) Reserves Committee (3) Governance and Nominating Committee (4) Compensation Committee
Corporate Information
ANNUAL GENERAL MEETINGThe Annual General Meeting of the shareholders of Zargon Oil & Gas Ltd. will be held on Wednesday, April 27, 2011, at 3:00 pm (Calgary time) in the Strand/Tivoli Room of the Metropolitan Conference Centre, 333 – 4th Avenue S.W., Calgary, Alberta.
MANAGEMENT’S DISCUSSION AND ANALYSIS
MANA GEMENT’S D ISC USS ION A ND ANAL YSI S 1
Management’s discussion and analysis (“MD&A”) is a review of Zargon Oil & Gas Ltd.’s 2010 financial results and should be read in conjunction with the audited consolidated financial statements and related notes for the years ended December 31, 2010 and 2009. The consolidated financial statements have been prepared in accordance with Canadian generally accepted accounting principles (“GAAP”). All amounts are in Canadian dollars unless otherwise noted. All references to “Zargon” or the “Company” refer to Zargon Oil & Gas Ltd.
In the MD&A, reserves and production are commonly stated in barrels of oil equivalent (“boe”) on the basis that six thousand cubic feet of natural gas is equivalent to one barrel of oil. Boes may be misleading, particularly if used in isolation. A boe conversion ratio of six thousand cubic feet of natural gas to one barrel of oil is based on an energy equivalent conversion method primarily applicable to the burner tip and does not represent a value equivalent at the wellhead.
The following are descriptions of non-GAAP measures used in this MD&A:
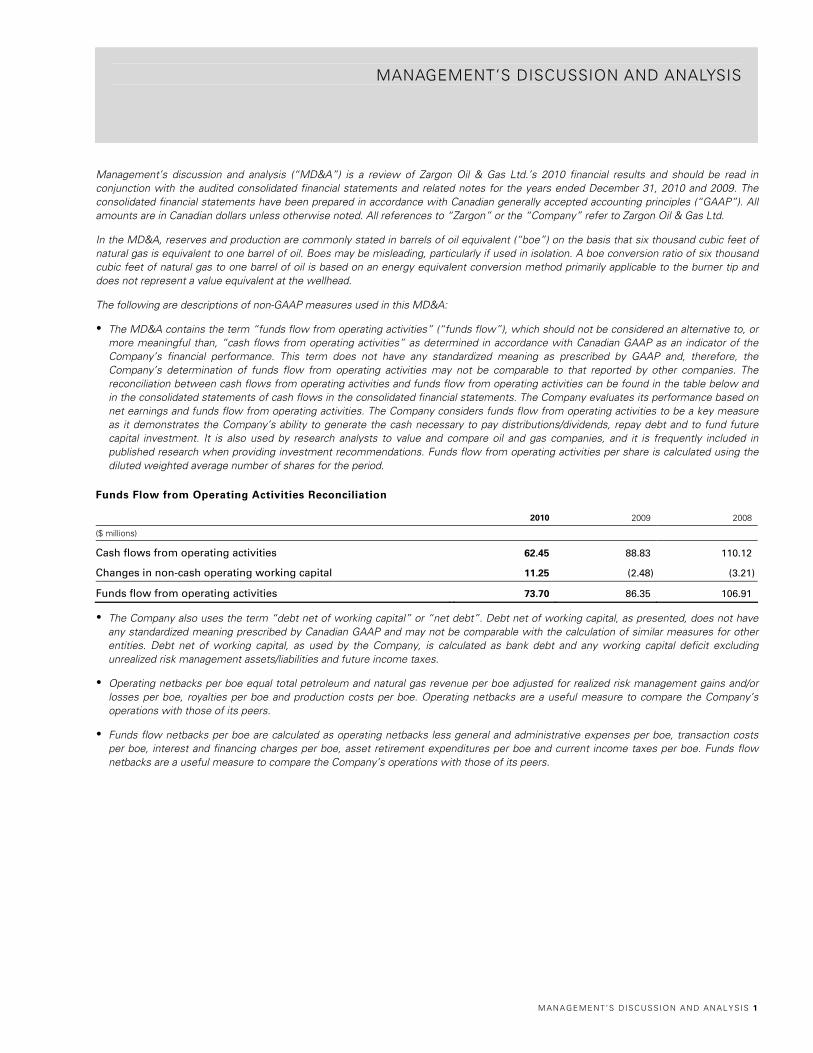
The MD&A contains the term “funds flow from operating activities” (“funds flow”), which should not be considered an alternative to, or more meaningful than, “cash flows from operating activities” as determined in accordance with Canadian GAAP as an indicator of the Company’s financial performance. This term does not have any standardized meaning as prescribed by GAAP and, therefore, the Company’s determination of funds flow from operating activities may not be comparable to that reported by other companies. The reconciliation between cash flows from operating activities and funds flow from operating activities can be found in the table below and in the consolidated statements of cash flows in the consolidated financial statements. The Company evaluates its performance based on net earnings and funds flow from operating activities. The Company considers funds flow from operating activities to be a key measure as it demonstrates the Company’s ability to generate the cash necessary to pay distributions/dividends, repay debt and to fund future capital investment. It is also used by research analysts to value and compare oil and gas companies, and it is frequently included in published research when providing investment recommendations. Funds flow from operating activities per share is calculated using the diluted weighted average number of shares for the period.
Funds Flow from Operating Activities Reconciliation
2010 2009 2008
($ millions)
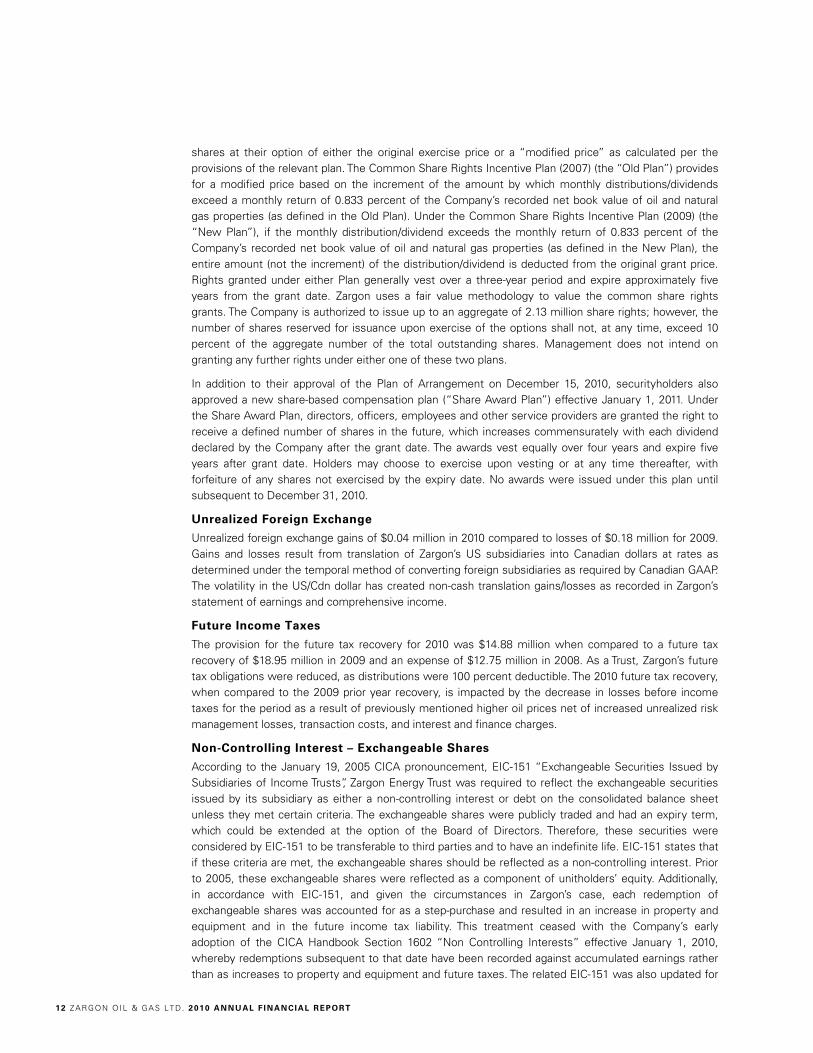
Cash flows from operating activities 62.45 88.83 110.12
Changes in non-cash operating working capital 11.25 (2.48) (3.21)
Funds flow from operating activities 73.70 86.35 106.91
The Company also uses the term “debt net of working capital” or “net debt”. Debt net of working capital, as presented, does not have any standardized meaning prescribed by Canadian GAAP and may not be comparable with the calculation of similar measures for other entities. Debt net of working capital, as used by the Company, is calculated as bank debt and any working capital deficit excluding unrealized risk management assets/liabilities and future income taxes.
Operating netbacks per boe equal total petroleum and natural gas revenue per boe adjusted for realized risk management gains and/or losses per boe, royalties per boe and production costs per boe. Operating netbacks are a useful measure to compare the Company’s operations with those of its peers.
Funds flow netbacks per boe are calculated as operating netbacks less general and administrative expenses per boe, transaction costs per boe, interest and financing charges per boe, asset retirement expenditures per boe and current income taxes per boe. Funds flow netbacks are a useful measure to compare the Company’s operations with those of its peers.
2 ZARGON O IL & GAS LT D. 2010 ANNUAL F IN ANCI AL REPORT
References to “production volumes” or “production” in this document refer to sales volumes.
Forward-Looking Statements – This document offers our assessment of Zargon’s future plans and operations as at March 9, 2011, and contains forward-looking statements including:
our distribution/dividend policy referred to under the headings “2010 Highlights” and “Liquidity and Capital Resources”;
our expectations for production costs referred to under the heading “Production Expenses”;
our expectations as to the impact of legislated modifications to Alberta Crown royalties referred to under the headings “Royalties” and “Alberta Royalty and Tax Regime”;
our expectations for taxes referred to under the heading “Current Income Taxes”;
our expectations for our new Share Award Plan referred to under the heading “Share-Based Compensation”;
our expected sources of funds for distributions/dividends and capital expenditures referred to under the heading “Liquidity and Capital Resources”;
our expectations for key business parameters referred to under the heading “Funds Flow from Operating Activities”;
our expectations for interest expenses referred to under the heading “Bank Debt”;
our expectations implementing International Financial Reporting Standards referred to under the heading “International Financial Reporting Standards”; and
our expectations for the future impact of changes to environmental regulations referred to under the heading “Environmental Regulation and Risk”.
Such statements are generally identified by the use of words such as “anticipate”, “continue”, “estimate”, “expect”, “forecast”, “may”, “will”, “project”, “should”, “plan”, “intend”, “believe” and similar expressions (including the negatives thereof). By their nature, forward-looking statements are subject to numerous risks and uncertainties, some of which are beyond our control, including such as those relating to results of operations and financial condition, general economic conditions, industry conditions, changes in regulatory and taxation regimes, volatility of commodity prices, escalation of operating and capital costs, currency fluctuations, the availability of services, imprecision of reserve estimates, geological, technical, drilling and processing problems, environmental risks, weather, the lack of availability of qualified personnel or management, stock market volatility, the ability to access sufficient capital from internal and external sources and competition from other industry participants for, among other things, capital, services, acquisitions of reserves, undeveloped lands and skilled personnel. Risks are described in more detail in our Annual Information Form, which is available on our website and at www.sedar.com. Forward-looking statements are provided to allow investors to have a greater understanding of our business.
You are cautioned that the assumptions, including among other things, future oil and natural gas prices; future capital expenditure levels; future production levels; future exchange rates; the cost of developing and expanding our assets; our ability to obtain equipment in a timely manner to carry out development activities; our ability to market our oil and natural gas successfully to current and new customers; the impact of increasing competition, our ability to obtain financing on acceptable terms; and our ability to add production and reserves through our development and acquisition activities used in the preparation of such information, although considered reasonable at the time of preparation, may prove to be imprecise and, as such, undue reliance should not be placed on forward-looking statements. Our actual results, performance, or achievement could differ materially from those expressed in, or implied by, these forward-looking statements. We can give no assurance that any of the events anticipated will transpire or occur, or if any of them do, what benefits we will derive from them. The forward-looking information contained in this document is expressly qualified by this cautionary statement. Our policy for updating forward-looking statements is that Zargon disclaims, except as required by law, any intention or obligation to update or revise any forward-looking statements, whether as a result of new information, future events or otherwise.
This MD&A has been prepared as of March 9, 2011.
MANA GEMENT’S D ISC USS ION A ND ANAL YSI S 3
CORPORATE CONVERSION
On December 31, 2010, Zargon Energy Trust (the "Trust") completed the conversion from an income trust into a dividend paying corporation, Zargon Oil & Gas Ltd. (the “Company” or “Zargon”) pursuant to a Plan of Arrangement (the "Arrangement") under the Business Corporations Act (Alberta). Under the Arrangement, unitholders received, for each trust unit held, one common share of the Company. Exchangeable shareholders received 1.84716 common shares of the Company for each exchangeable share held as determined in accordance with the terms of the Arrangement. As a result, at December 31, 2010, Zargon had 27.05 million common shares issued and outstanding and no remaining exchangeable shares. There were no changes to the underlying business of the Company and the Board of Directors and senior management remained unchanged. Additional information regarding the Arrangement can be found in the Information Circular dated November 10, 2010.
The conversion of the Trust into a corporation has been accounted for using the continuity of interest method. Accordingly, the consolidated financial statements for the year ended December 31, 2010 reflect the financial position, results of operations and cash flows as if the Company had always carried on the business of the Trust. All comparative figures referred to in the consolidated financial statements and this MD&A are the previous consolidated results of the Trust. For the convenience of the reader, when discussing prior periods, this MD&A, where appropriate, refers to common shares, shareholders, share rights and dividends although for the pre-conversion period, such items were trust units, unitholders, trust unit rights and distributions, respectively.
2010 HIGHLIGHTS
Despite essentially unchanged 2010 production volumes from 2009 levels and lower 2010 natural gas prices, revenue improved in 2010 due to the year’s higher proportion of production from oil and liquids and the continued strengthening of oil prices. Zargon’s revenue increased by 15 percent to $179.47 million in 2010, which was primarily due to a 16 percent increase in its realized average field oil price, that was partially offset by a 10 percent decrease in the average field natural gas price. Notwithstanding the higher revenue, funds flow from operating activities showed a 15 percent decrease to $73.70 million due primarily to substantial realized risk management gains recorded in 2009 that were not repeated in 2010. Net earnings for the year were $8.92 million, a 228 percent increase from 2009. The majority of the increase in net earnings resulted from lower non-cash unrealized risk management losses, net of increases in depletion, depreciation and amortization and asset retirement obligation accretion.
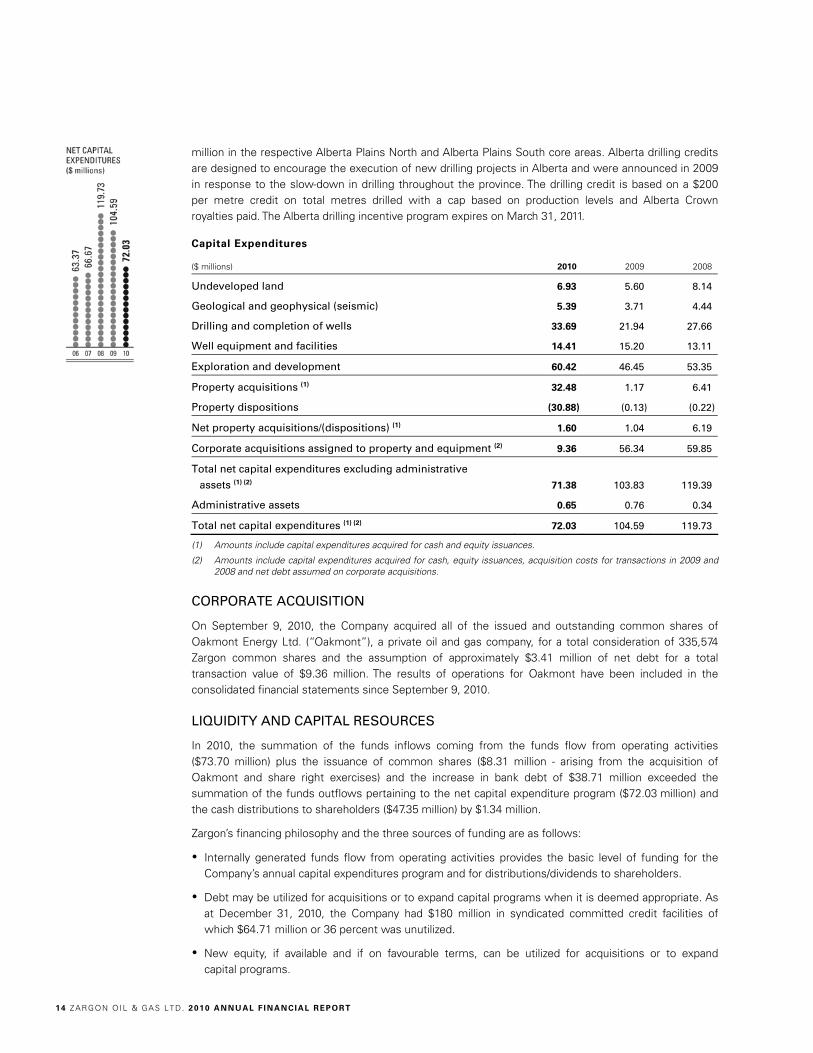
Net capital expenditures for 2010 totalled $72.03 million with $60.42 million incurred on field-related activities, $1.60 million on net property acquisitions, $9.36 million on a corporate acquisition and $0.65 million on administrative assets. Compared to the prior year, the 2010 capital program showed a 30 percent increase in field-related expenditures, but a 31 percent decrease in overall net expenditures due to decreased expenditures on corporate acquisitions. Only one corporate transaction was undertaken in 2010, which was the acquisition of Oakmont Energy Ltd. (“Oakmont”) on September 9, 2010 for $9.36 million, that was satisfied by the issuance of 0.336 million Zargon shares and by the assumption of approximately $3.41 million of net debt. As part of a continuous program to upgrade its property portfolio, the Company completed a non-core property disposition program totalling $30.88 million, which largely funded the acquisition of Alberta oil exploitation properties totalling $32.48 million, resulting in net property acquisitions for the year of $1.60 million. Under its field capital expenditure program for the year ended December 31, 2010, Zargon drilled, equipped and tied-in wells for $48.10 million, spent $6.93 million on undeveloped land and shot or acquired seismic at a cost of $5.39 million. Cash distributions to unitholders (excluding the Distribution/Dividend Reinvestment Plan (“DRIP”)) totalled $47.35 million during 2010 (2009 – $45.96 million).
4 ZARGON O IL & GAS LT D. 2010 ANNUAL F IN ANCI AL REPORT
Financial Highlights
($ millions, except for per share amounts) 2010 2009 2008
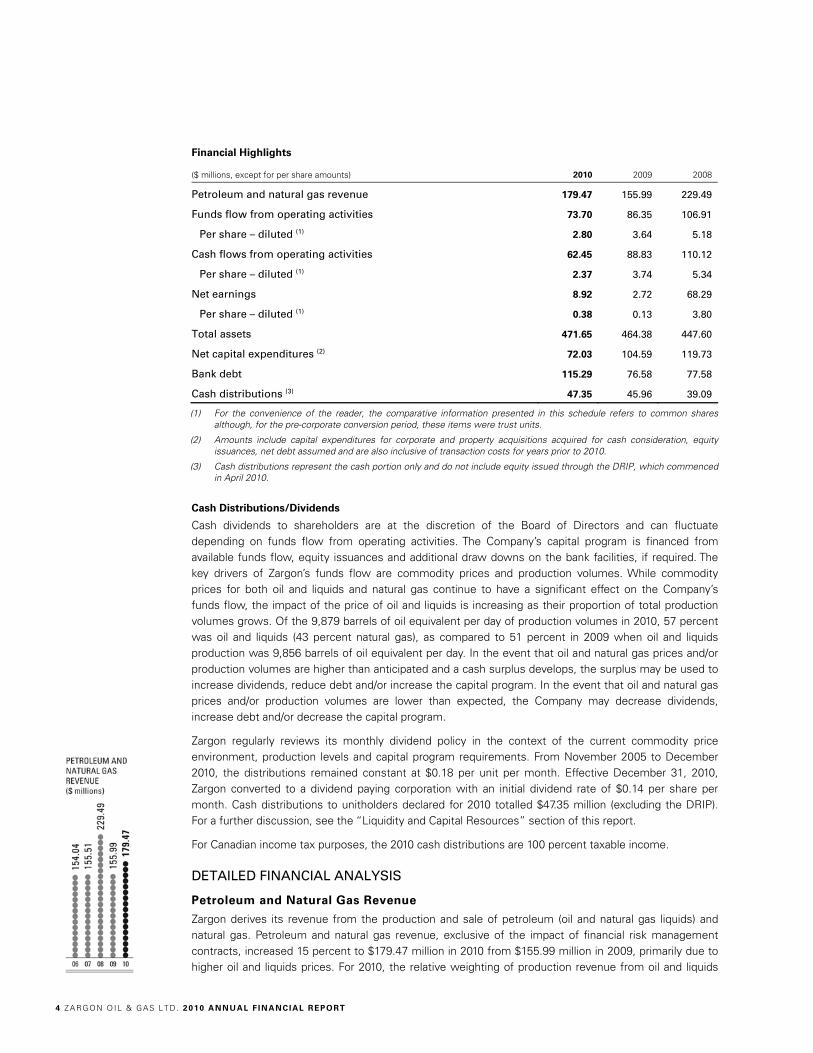
Petroleum and natural gas revenue 179.47 155.99 229.49
Funds flow from operating activities 73.70 86.35 106.91
Per share – diluted (1) 2.80 3.64 5.18
Cash flows from operating activities 62.45 88.83 110.12
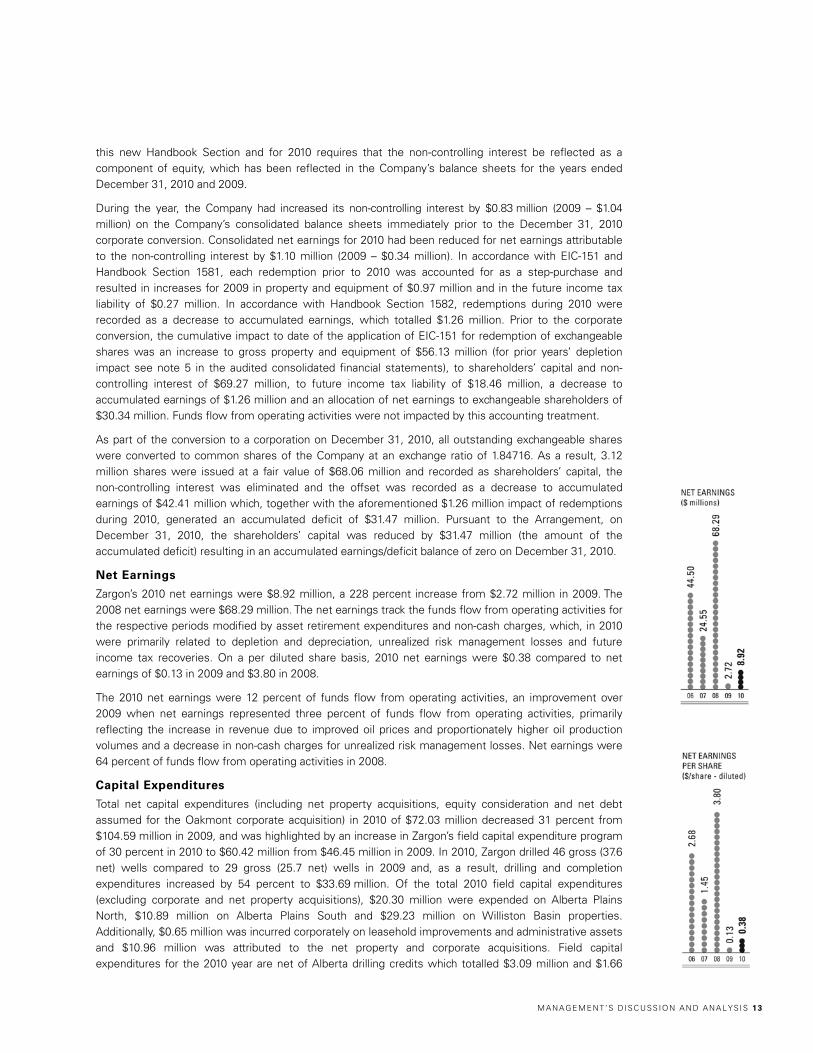
Per share – diluted (1) 2.37 3.74 5.34
Net earnings 8.92 2.72 68.29
Per share – diluted (1) 0.38 0.13 3.80
Total assets 471.65 464.38 447.60
Net capital expenditures (2) 72.03 104.59 119.73
Bank debt 115.29 76.58 77.58
Cash distributions (3) 47.35 45.96 39.09
(1) For the convenience of the reader, the comparative information presented in this schedule refers to common shares although, for the pre-corporate conversion period, these items were trust units.
(2) Amounts include capital expenditures for corporate and property acquisitions acquired for cash consideration, equity issuances, net debt assumed and are also inclusive of transaction costs for years prior to 2010.
(3) Cash distributions represent the cash portion only and do not include equity issued through the DRIP, which commenced in April 2010.
Cash Distributions/Dividends
Cash dividends to shareholders are at the discretion of the Board of Directors and can fluctuate depending on funds flow from operating activities. The Company’s capital program is financed from available funds flow, equity issuances and additional draw downs on the bank facilities, if required. The key drivers of Zargon’s funds flow are commodity prices and production volumes. While commodity prices for both oil and liquids and natural gas continue to have a significant effect on the Company’s funds flow, the impact of the price of oil and liquids is increasing as their proportion of total production volumes grows. Of the 9,879 barrels of oil equivalent per day of production volumes in 2010, 57 percent was oil and liquids (43 percent natural gas), as compared to 51 percent in 2009 when oil and liquids production was 9,856 barrels of oil equivalent per day. In the event that oil and natural gas prices and/or production volumes are higher than anticipated and a cash surplus develops, the surplus may be used to increase dividends, reduce debt and/or increase the capital program. In the event that oil and natural gas prices and/or production volumes are lower than expected, the Company may decrease dividends, increase debt and/or decrease the capital program.
Zargon regularly reviews its monthly dividend policy in the context of the current commodity price environment, production levels and capital program requirements. From November 2005 to December 2010, the distributions remained constant at $0.18 per unit per month. Effective December 31, 2010, Zargon converted to a dividend paying corporation with an initial dividend rate of $0.14 per share per month. Cash distributions to unitholders declared for 2010 totalled $47.35 million (excluding the DRIP). For a further discussion, see the “Liquidity and Capital Resources” section of this report.
For Canadian income tax purposes, the 2010 cash distributions are 100 percent taxable income.
DETAILED FINANCIAL ANALYSIS
Petroleum and Natural Gas Revenue
Zargon derives its revenue from the production and sale of petroleum (oil and natural gas liquids) and natural gas. Petroleum and natural gas revenue, exclusive of the impact of financial risk management contracts, increased 15 percent to $179.47 million in 2010 from $155.99 million in 2009, primarily due to higher oil and liquids prices. For 2010, the relative weighting of production revenue from oil and liquids
MANA GEMENT’S D ISC USS ION A ND ANAL YSI S 5
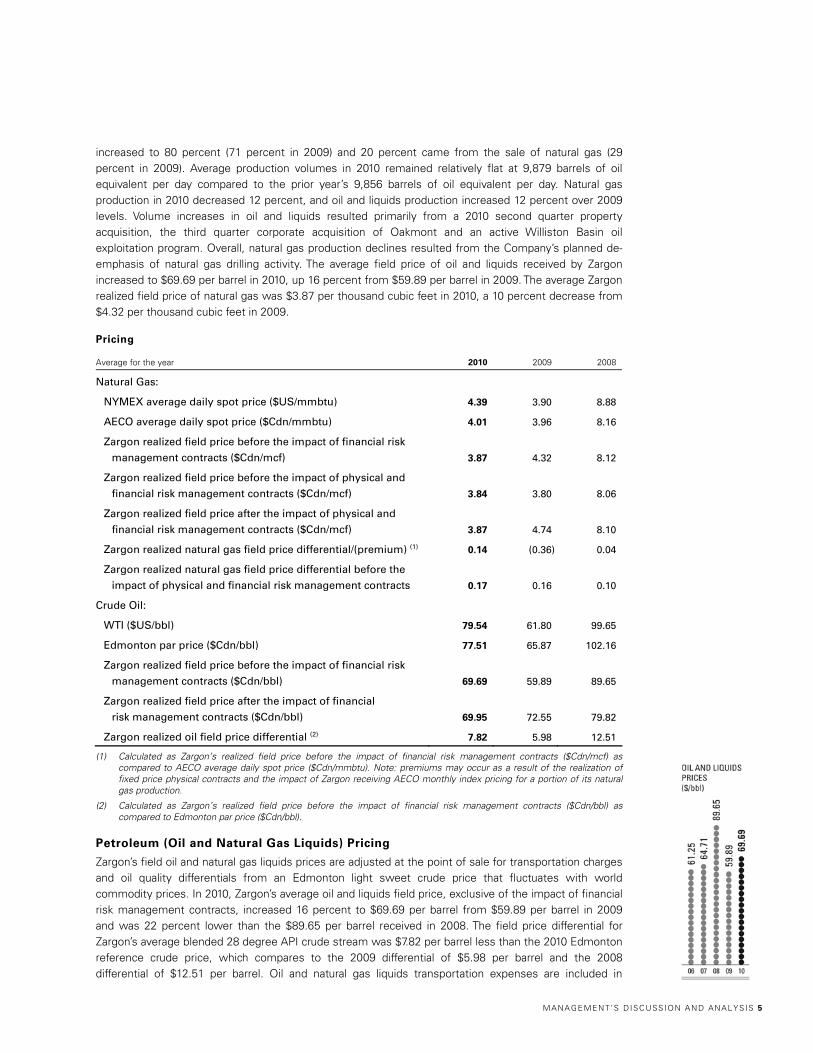
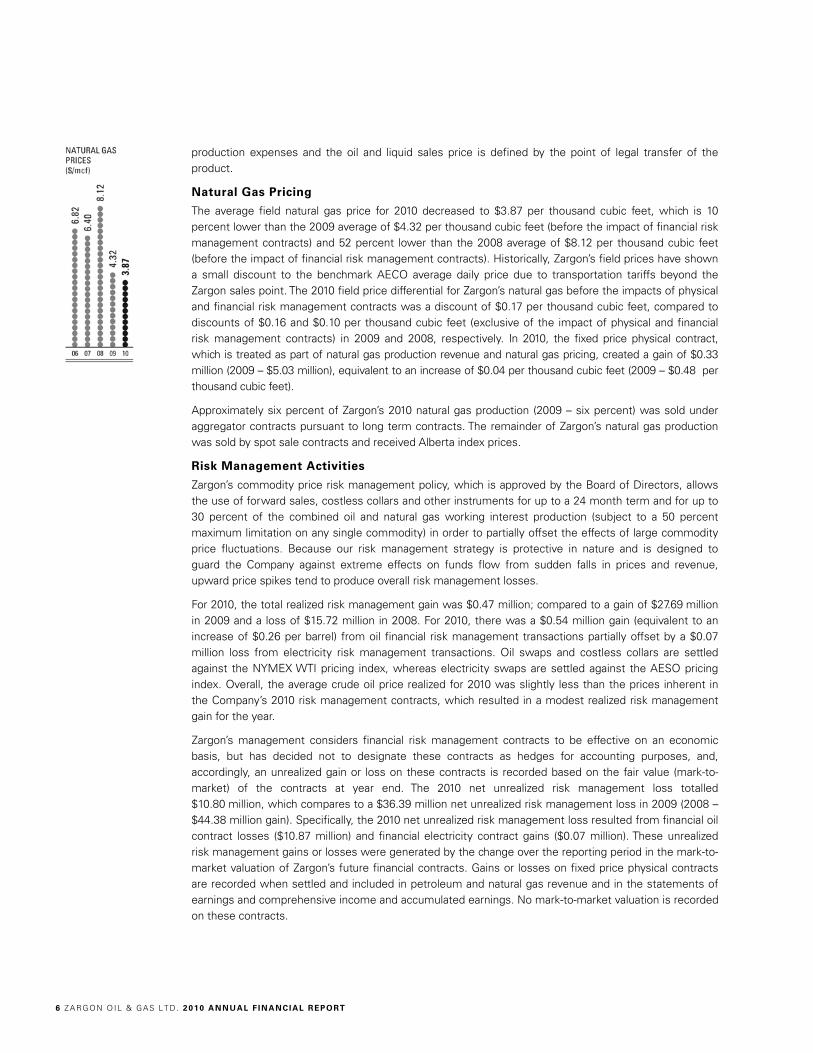
increased to 80 percent (71 percent in 2009) and 20 percent came from the sale of natural gas (29 percent in 2009). Average production volumes in 2010 remained relatively flat at 9,879 barrels of oil equivalent per day compared to the prior year’s 9,856 barrels of oil equivalent per day. Natural gas production in 2010 decreased 12 percent, and oil and liquids production increased 12 percent over 2009 levels. Volume increases in oil and liquids resulted primarily from a 2010 second quarter property acquisition, the third quarter corporate acquisition of Oakmont and an active Williston Basin oil exploitation program. Overall, natural gas production declines resulted from the Company’s planned de-emphasis of natural gas drilling activity. The average field price of oil and liquids received by Zargon increased to $69.69 per barrel in 2010, up 16 percent from $59.89 per barrel in 2009. The average Zargon realized field price of natural gas was $3.87 per thousand cubic feet in 2010, a 10 percent decrease from $4.32 per thousand cubic feet in 2009.
Pricing
Average for the year 2010 2009 2008
Natural Gas:
NYMEX average daily spot price ($US/mmbtu) 4.39 3.90 8.88
AECO average daily spot price ($Cdn/mmbtu) 4.01 3.96 8.16
Zargon realized field price before the impact of financial risk
management contracts ($Cdn/mcf) 3.87 4.32 8.12
Zargon realized field price before the impact of physical and
financial risk management contracts ($Cdn/mcf) 3.84 3.80 8.06
Zargon realized field price after the impact of physical and
financial risk management contracts ($Cdn/mcf) 3.87 4.74 8.10
Zargon realized natural gas field price differential/(premium) (1) 0.14 (0.36) 0.04
Zargon realized natural gas field price differential before the
impact of physical and financial risk management contracts 0.17 0.16 0.10
Crude Oil:
WTI ($US/bbl) 79.54 61.80 99.65
Edmonton par price ($Cdn/bbl) 77.51 65.87 102.16
Zargon realized field price before the impact of financial risk
management contracts ($Cdn/bbl) 69.69 59.89 89.65
Zargon realized field price after the impact of financial
risk management contracts ($Cdn/bbl) 69.95 72.55 79.82
Zargon realized oil field price differential (2) 7.82 5.98 12.51
(1) Calculated as Zargon’s realized field price before the impact of financial risk management contracts ($Cdn/mcf) as compared to AECO average daily spot price ($Cdn/mmbtu). Note: premiums may occur as a result of the realization of fixed price physical contracts and the impact of Zargon receiving AECO monthly index pricing for a portion of its natural gas production.
(2) Calculated as Zargon’s realized field price before the impact of financial risk management contracts ($Cdn/bbl) as compared to Edmonton par price ($Cdn/bbl).
Petroleum (Oil and Natural Gas Liquids) Pricing
Zargon’s field oil and natural gas liquids prices are adjusted at the point of sale for transportation charges and oil quality differentials from an Edmonton light sweet crude price that fluctuates with world commodity prices. In 2010, Zargon’s average oil and liquids field price, exclusive of the impact of financial risk management contracts, increased 16 percent to $69.69 per barrel from $59.89 per barrel in 2009 and was 22 percent lower than the $89.65 per barrel received in 2008. The field price differential for Zargon’s average blended 28 degree API crude stream was $7.82 per barrel less than the 2010 Edmonton reference crude price, which compares to the 2009 differential of $5.98 per barrel and the 2008 differential of $12.51 per barrel. Oil and natural gas liquids transportation expenses are included in
6 ZARGON O IL & GAS LT D. 2010 ANNUAL F IN ANCI AL REPORT
production expenses and the oil and liquid sales price is defined by the point of legal transfer of the product.
Natural Gas Pricing
The average field natural gas price for 2010 decreased to $3.87 per thousand cubic feet, which is 10 percent lower than the 2009 average of $4.32 per thousand cubic feet (before the impact of financial risk management contracts) and 52 percent lower than the 2008 average of $8.12 per thousand cubic feet (before the impact of financial risk management contracts). Historically, Zargon’s field prices have shown a small discount to the benchmark AECO average daily price due to transportation tariffs beyond the Zargon sales point. The 2010 field price differential for Zargon’s natural gas before the impacts of physical and financial risk management contracts was a discount of $0.17 per thousand cubic feet, compared to discounts of $0.16 and $0.10 per thousand cubic feet (exclusive of the impact of physical and financial risk management contracts) in 2009 and 2008, respectively. In 2010, the fixed price physical contract, which is treated as part of natural gas production revenue and natural gas pricing, created a gain of $0.33 million (2009 – $5.03 million), equivalent to an increase of $0.04 per thousand cubic feet (2009 – $0.48 per thousand cubic feet).
Approximately six percent of Zargon’s 2010 natural gas production (2009 – six percent) was sold under aggregator contracts pursuant to long term contracts. The remainder of Zargon’s natural gas production was sold by spot sale contracts and received Alberta index prices.
Risk Management Activities
Zargon’s commodity price risk management policy, which is approved by the Board of Directors, allows the use of forward sales, costless collars and other instruments for up to a 24 month term and for up to 30 percent of the combined oil and natural gas working interest production (subject to a 50 percent maximum limitation on any single commodity) in order to partially offset the effects of large commodity price fluctuations. Because our risk management strategy is protective in nature and is designed to guard the Company against extreme effects on funds flow from sudden falls in prices and revenue, upward price spikes tend to produce overall risk management losses.
For 2010, the total realized risk management gain was $0.47 million; compared to a gain of $27.69 million in 2009 and a loss of $15.72 million in 2008. For 2010, there was a $0.54 million gain (equivalent to an increase of $0.26 per barrel) from oil financial risk management transactions partially offset by a $0.07 million loss from electricity risk management transactions. Oil swaps and costless collars are settled against the NYMEX WTI pricing index, whereas electricity swaps are settled against the AESO pricing index. Overall, the average crude oil price realized for 2010 was slightly less than the prices inherent in the Company’s 2010 risk management contracts, which resulted in a modest realized risk management gain for the year.
Zargon’s management considers financial risk management contracts to be effective on an economic basis, but has decided not to designate these contracts as hedges for accounting purposes, and, accordingly, an unrealized gain or loss on these contracts is recorded based on the fair value (mark-to-market) of the contracts at year end. The 2010 net unrealized risk management loss totalled $10.80 million, which compares to a $36.39 million net unrealized risk management loss in 2009 (2008 – $44.38 million gain). Specifically, the 2010 net unrealized risk management loss resulted from financial oil contract losses ($10.87 million) and financial electricity contract gains ($0.07 million). These unrealized risk management gains or losses were generated by the change over the reporting period in the mark-to-market valuation of Zargon’s future financial contracts. Gains or losses on fixed price physical contracts are recorded when settled and included in petroleum and natural gas revenue and in the statements of earnings and comprehensive income and accumulated earnings. No mark-to-market valuation is recorded on these contracts.
MANA GEMENT’S D ISC USS ION A ND ANAL YSI S 7
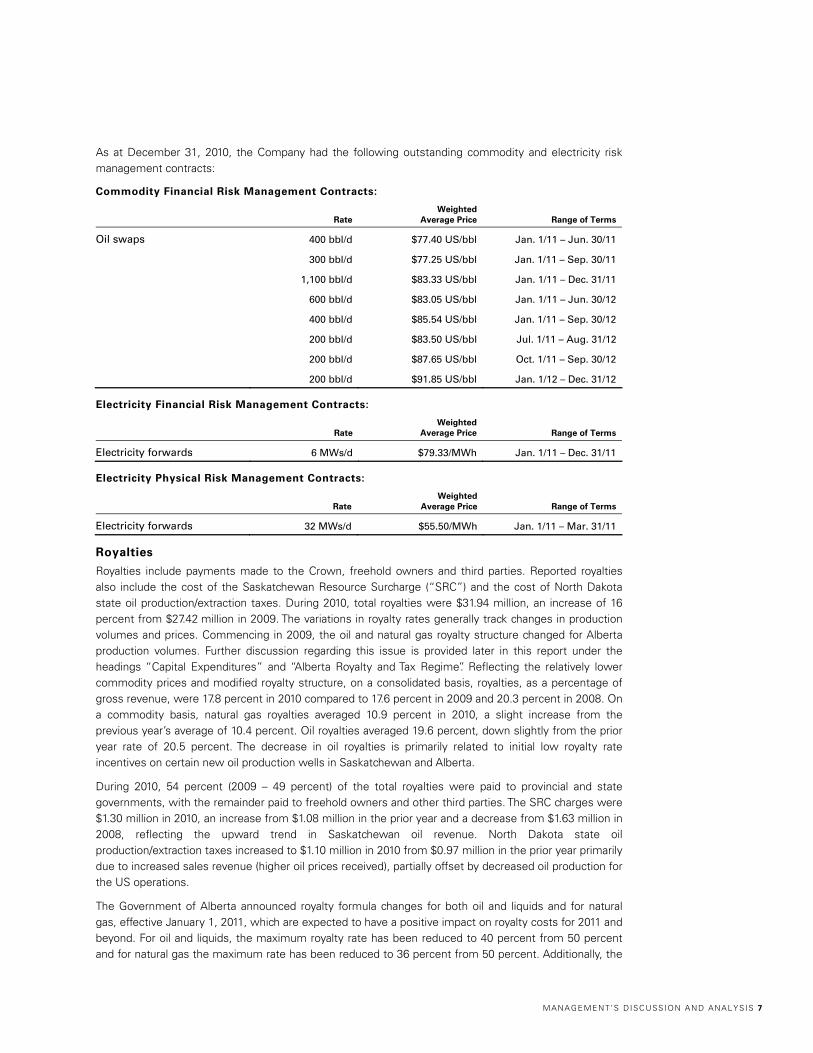
As at December 31, 2010, the Company had the following outstanding commodity and electricity risk management contracts:
Commodity Financial Risk Management Contracts:
Rate Weighted
Average Price Range of Terms
Oil swaps 400 bbl/d $77.40 US/bbl Jan. 1/11 – Jun. 30/11
300 bbl/d $77.25 US/bbl Jan. 1/11 – Sep. 30/11
1,100 bbl/d $83.33 US/bbl Jan. 1/11 – Dec. 31/11
600 bbl/d $83.05 US/bbl Jan. 1/11 – Jun. 30/12
400 bbl/d $85.54 US/bbl Jan. 1/11 – Sep. 30/12
200 bbl/d $83.50 US/bbl Jul. 1/11 – Aug. 31/12
200 bbl/d $87.65 US/bbl Oct. 1/11 – Sep. 30/12
200 bbl/d $91.85 US/bbl Jan. 1/12 – Dec. 31/12
Electricity Financial Risk Management Contracts:
Rate Weighted
Average Price Range of Terms
Electricity forwards 6 MWs/d $79.33/MWh Jan. 1/11 – Dec. 31/11
Electricity Physical Risk Management Contracts:
Rate Weighted
Average Price Range of Terms
Electricity forwards 32 MWs/d $55.50/MWh Jan. 1/11 – Mar. 31/11
Royalties
Royalties include payments made to the Crown, freehold owners and third parties. Reported royalties also include the cost of the Saskatchewan Resource Surcharge (“SRC”) and the cost of North Dakota state oil production/extraction taxes. During 2010, total royalties were $31.94 million, an increase of 16 percent from $27.42 million in 2009. The variations in royalty rates generally track changes in production volumes and prices. Commencing in 2009, the oil and natural gas royalty structure changed for Alberta production volumes. Further discussion regarding this issue is provided later in this report under the headings “Capital Expenditures” and “Alberta Royalty and Tax Regime”. Reflecting the relatively lower commodity prices and modified royalty structure, on a consolidated basis, royalties, as a percentage of gross revenue, were 17.8 percent in 2010 compared to 17.6 percent in 2009 and 20.3 percent in 2008. On a commodity basis, natural gas royalties averaged 10.9 percent in 2010, a slight increase from the previous year’s average of 10.4 percent. Oil royalties averaged 19.6 percent, down slightly from the prior year rate of 20.5 percent. The decrease in oil royalties is primarily related to initial low royalty rate incentives on certain new oil production wells in Saskatchewan and Alberta.
During 2010, 54 percent (2009 – 49 percent) of the total royalties were paid to provincial and state governments, with the remainder paid to freehold owners and other third parties. The SRC charges were $1.30 million in 2010, an increase from $1.08 million in the prior year and a decrease from $1.63 million in 2008, reflecting the upward trend in Saskatchewan oil revenue. North Dakota state oil production/extraction taxes increased to $1.10 million in 2010 from $0.97 million in the prior year primarily due to increased sales revenue (higher oil prices received), partially offset by decreased oil production for the US operations.
The Government of Alberta announced royalty formula changes for both oil and liquids and for natural gas, effective January 1, 2011, which are expected to have a positive impact on royalty costs for 2011 and beyond. For oil and liquids, the maximum royalty rate has been reduced to 40 percent from 50 percent and for natural gas the maximum rate has been reduced to 36 percent from 50 percent. Additionally, the
8 ZARGON O IL & GAS LT D. 2010 ANNUAL F IN ANCI AL REPORT
price component of each formula has been changed to moderate the increase in rates at the highest price level.
Production Expenses
Zargon’s production expenses decreased one percent to $47.19 million in 2010 from $47.56 million in 2009, reflecting, in part, Zargon’s effort to improve our efficiencies and to dispose of many of the higher cost properties acquired in recent corporate acquisitions. On a per unit of production basis, production expenses decreased one percent to $13.09 per barrel of oil equivalent from $13.22 in 2009 ($11.79 in 2008).
Natural gas production expenses in 2010 rose two percent to $2.18 per thousand cubic feet from $2.14 per thousand cubic feet in 2009, due mainly to decreased natural gas production volumes.
Oil production expenses decreased in 2010 to $13.11 per barrel, a decline of three percent from $13.56 per barrel in 2009. The primary reason for the decrease is due to higher production volumes, which more than offset charges due to increased workovers, and increased repairs and annual maintenance programs.
For 2011, higher production expenses on a per unit of production basis are expected due to Zargon’s increased weighting to the higher cost oil commodity, increased service and field costs due to higher industry activity levels and due to the potential impact of new accounting standards on our business.
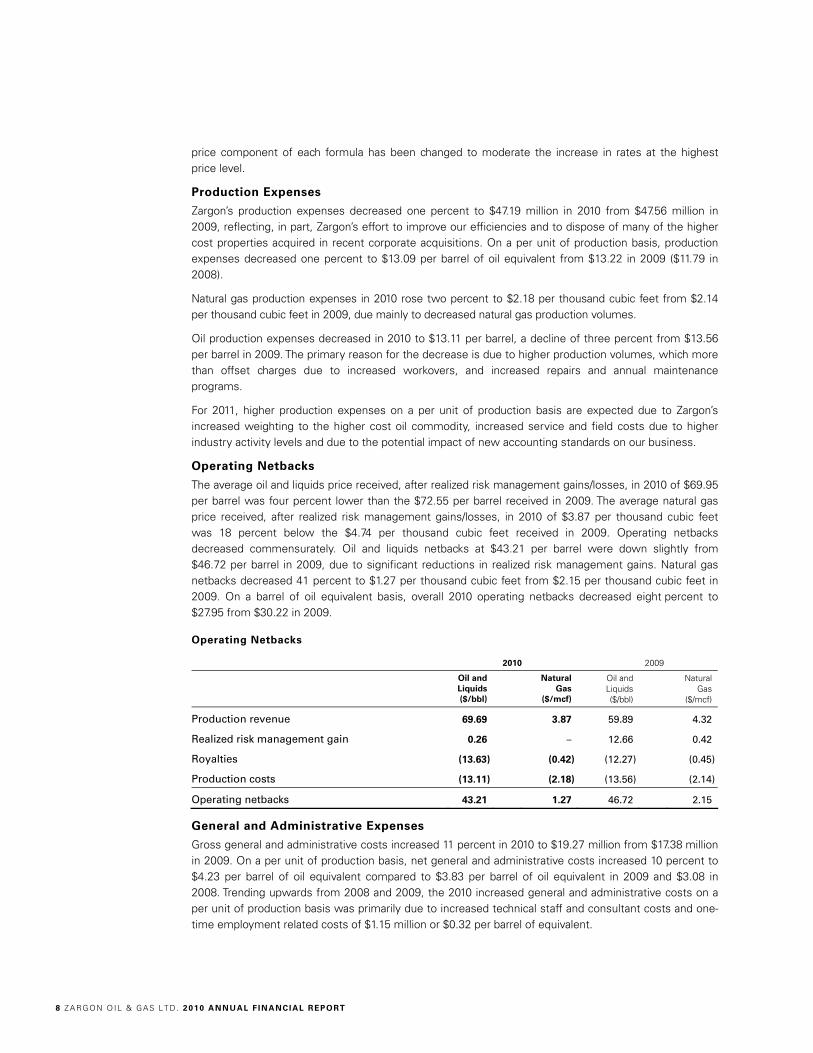
Operating Netbacks
The average oil and liquids price received, after realized risk management gains/losses, in 2010 of $69.95 per barrel was four percent lower than the $72.55 per barrel received in 2009. The average natural gas price received, after realized risk management gains/losses, in 2010 of $3.87 per thousand cubic feet was 18 percent below the $4.74 per thousand cubic feet received in 2009. Operating netbacks decreased commensurately. Oil and liquids netbacks at $43.21 per barrel were down slightly from $46.72 per barrel in 2009, due to significant reductions in realized risk management gains. Natural gas netbacks decreased 41 percent to $1.27 per thousand cubic feet from $2.15 per thousand cubic feet in 2009. On a barrel of oil equivalent basis, overall 2010 operating netbacks decreased eight percent to $27.95 from $30.22 in 2009.
Operating Netbacks
2010 2009
Oil and Liquids ($/bbl)
Natural Gas
($/mcf)
Oil and Liquids ($/bbl)
Natural Gas
($/mcf)
Production revenue 69.69 3.87 59.89 4.32
Realized risk management gain 0.26 – 12.66 0.42
Royalties (13.63) (0.42) (12.27) (0.45)
Production costs (13.11) (2.18) (13.56) (2.14)
Operating netbacks 43.21 1.27 46.72 2.15
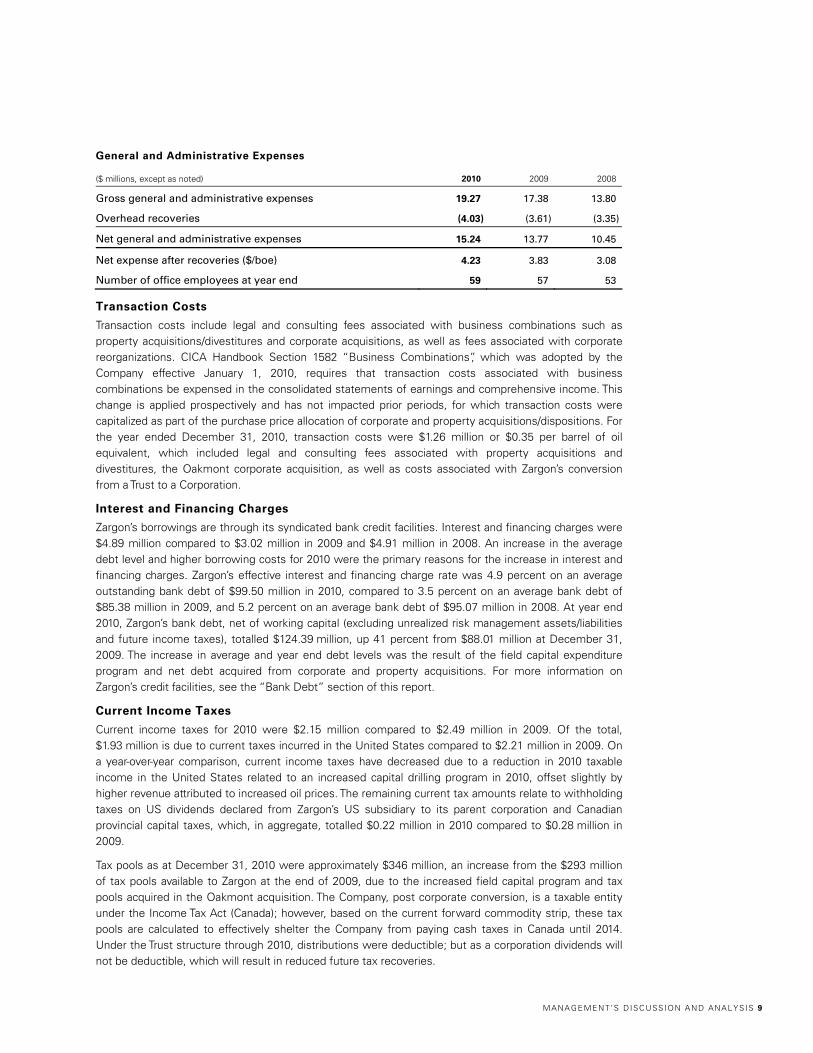
General and Administrative Expenses
Gross general and administrative costs increased 11 percent in 2010 to $19.27 million from $17.38 million in 2009. On a per unit of production basis, net general and administrative costs increased 10 percent to $4.23 per barrel of oil equivalent compared to $3.83 per barrel of oil equivalent in 2009 and $3.08 in 2008. Trending upwards from 2008 and 2009, the 2010 increased general and administrative costs on a per unit of production basis was primarily due to increased technical staff and consultant costs and one-time employment related costs of $1.15 million or $0.32 per barrel of equivalent.
MANA GEMENT’S D ISC USS ION A ND ANAL YSI S 9
General and Administrative Expenses
($ millions, except as noted) 2010 2009 2008
Gross general and administrative expenses 19.27 17.38 13.80
Overhead recoveries (4.03) (3.61) (3.35)
Net general and administrative expenses 15.24 13.77 10.45
Net expense after recoveries ($/boe) 4.23 3.83 3.08
Number of office employees at year end 59 57 53
Transaction Costs
Transaction costs include legal and consulting fees associated with business combinations such as property acquisitions/divestitures and corporate acquisitions, as well as fees associated with corporate reorganizations. CICA Handbook Section 1582 “Business Combinations”, which was adopted by the Company effective January 1, 2010, requires that transaction costs associated with business combinations be expensed in the consolidated statements of earnings and comprehensive income. This change is applied prospectively and has not impacted prior periods, for which transaction costs were capitalized as part of the purchase price allocation of corporate and property acquisitions/dispositions. For the year ended December 31, 2010, transaction costs were $1.26 million or $0.35 per barrel of oil equivalent, which included legal and consulting fees associated with property acquisitions and divestitures, the Oakmont corporate acquisition, as well as costs associated with Zargon’s conversion from a Trust to a Corporation.
Interest and Financing Charges
Zargon’s borrowings are through its syndicated bank credit facilities. Interest and financing charges were $4.89 million compared to $3.02 million in 2009 and $4.91 million in 2008. An increase in the average debt level and higher borrowing costs for 2010 were the primary reasons for the increase in interest and financing charges. Zargon’s effective interest and financing charge rate was 4.9 percent on an average outstanding bank debt of $99.50 million in 2010, compared to 3.5 percent on an average bank debt of $85.38 million in 2009, and 5.2 percent on an average bank debt of $95.07 million in 2008. At year end 2010, Zargon’s bank debt, net of working capital (excluding unrealized risk management assets/liabilities and future income taxes), totalled $124.39 million, up 41 percent from $88.01 million at December 31, 2009. The increase in average and year end debt levels was the result of the field capital expenditure program and net debt acquired from corporate and property acquisitions. For more information on Zargon’s credit facilities, see the “Bank Debt” section of this report.
Current Income Taxes
Current income taxes for 2010 were $2.15 million compared to $2.49 million in 2009. Of the total, $1.93 million is due to current taxes incurred in the United States compared to $2.21 million in 2009. On a year-over-year comparison, current income taxes have decreased due to a reduction in 2010 taxable income in the United States related to an increased capital drilling program in 2010, offset slightly by higher revenue attributed to increased oil prices. The remaining current tax amounts relate to withholding taxes on US dividends declared from Zargon’s US subsidiary to its parent corporation and Canadian provincial capital taxes, which, in aggregate, totalled $0.22 million in 2010 compared to $0.28 million in 2009.
Tax pools as at December 31, 2010 were approximately $346 million, an increase from the $293 million of tax pools available to Zargon at the end of 2009, due to the increased field capital program and tax pools acquired in the Oakmont acquisition. The Company, post corporate conversion, is a taxable entity under the Income Tax Act (Canada); however, based on the current forward commodity strip, these tax pools are calculated to effectively shelter the Company from paying cash taxes in Canada until 2014. Under the Trust structure through 2010, distributions were deductible; but as a corporation dividends will not be deductible, which will result in reduced future tax recoveries.
10 ZARGON O IL & GA S LTD. 2010 ANNU AL F INAN CIAL REPORT
For Canadian income tax purposes, 2010 cash distributions are 100 percent taxable income.
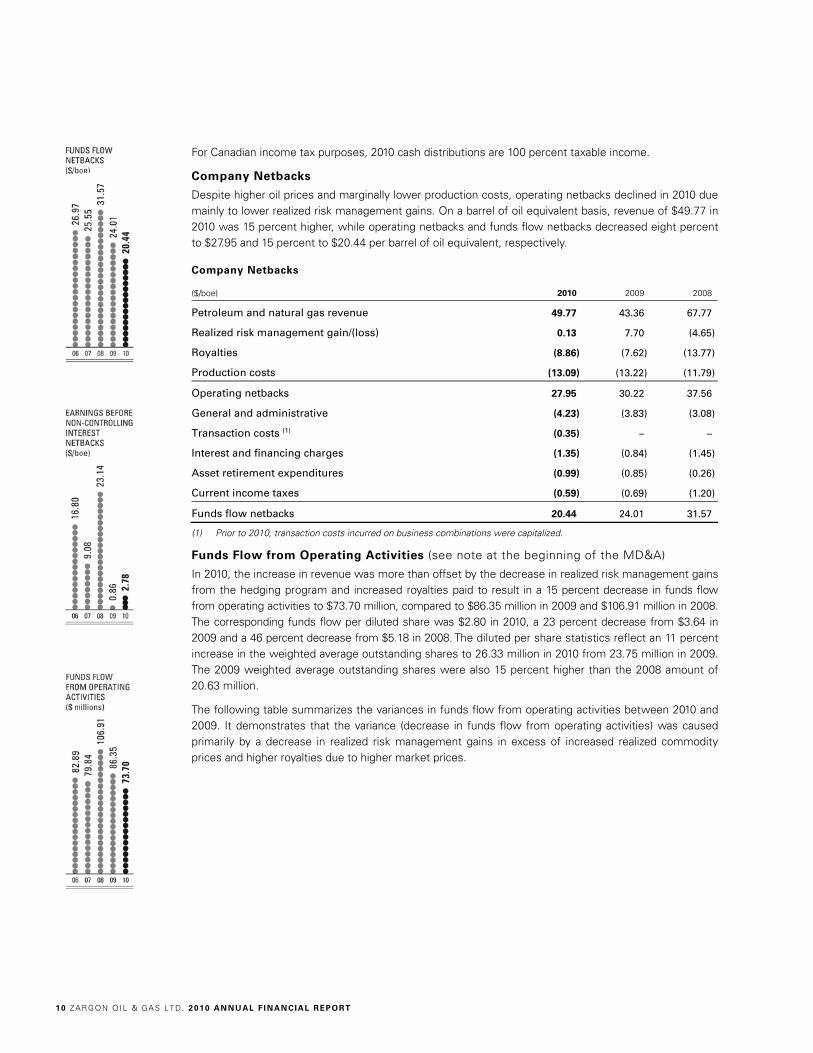
Company Netbacks
Despite higher oil prices and marginally lower production costs, operating netbacks declined in 2010 due mainly to lower realized risk management gains. On a barrel of oil equivalent basis, revenue of $49.77 in 2010 was 15 percent higher, while operating netbacks and funds flow netbacks decreased eight percent to $27.95 and 15 percent to $20.44 per barrel of oil equivalent, respectively.
Company Netbacks
($/boe) 2010 2009 2008
Petroleum and natural gas revenue 49.77 43.36 67.77
Realized risk management gain/(loss) 0.13 7.70 (4.65)
Royalties (8.86) (7.62) (13.77)
Production costs (13.09) (13.22) (11.79)
Operating netbacks 27.95 30.22 37.56
General and administrative (4.23) (3.83) (3.08)
Transaction costs (1) (0.35) – –
Interest and financing charges (1.35) (0.84) (1.45)
Asset retirement expenditures (0.99) (0.85) (0.26)
Current income taxes (0.59) (0.69) (1.20)
Funds flow netbacks 20.44 24.01 31.57
(1) Prior to 2010, transaction costs incurred on business combinations were capitalized.
Funds Flow from Operating Activities (see note at the beginning of the MD&A)
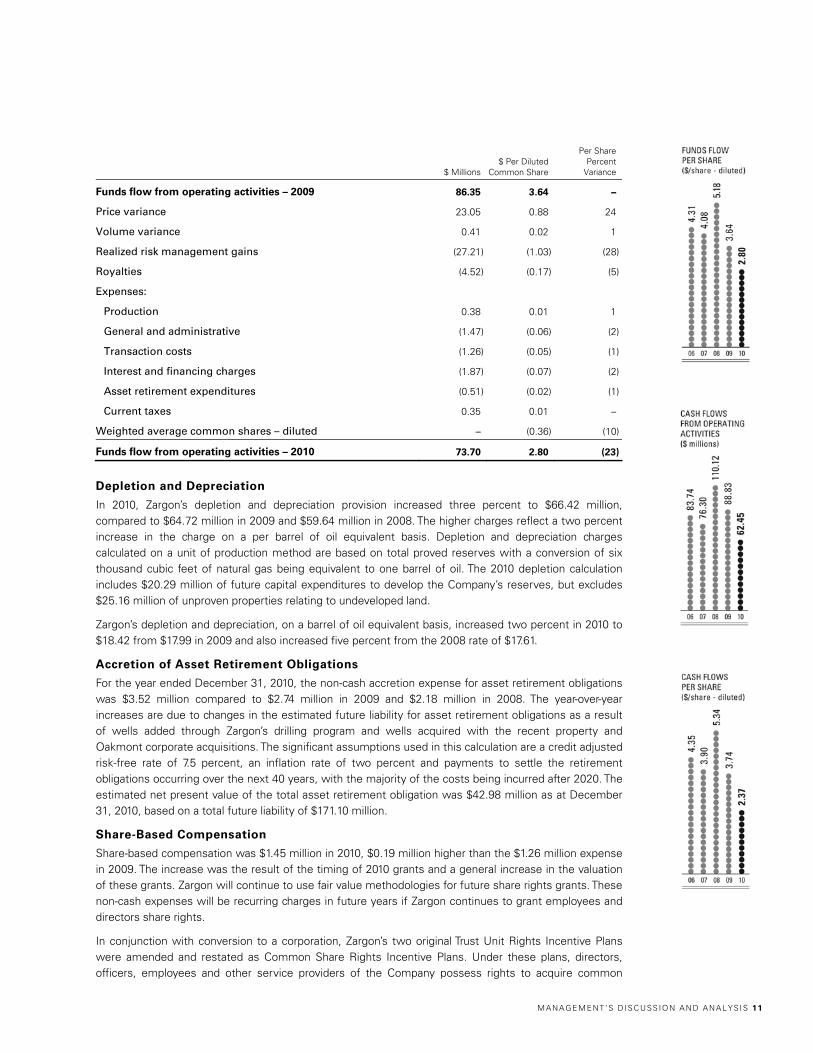
In 2010, the increase in revenue was more than offset by the decrease in realized risk management gains from the hedging program and increased royalties paid to result in a 15 percent decrease in funds flow from operating activities to $73.70 million, compared to $86.35 million in 2009 and $106.91 million in 2008. The corresponding funds flow per diluted share was $2.80 in 2010, a 23 percent decrease from $3.64 in 2009 and a 46 percent decrease from $5.18 in 2008. The diluted per share statistics reflect an 11 percent increase in the weighted average outstanding shares to 26.33 million in 2010 from 23.75 million in 2009. The 2009 weighted average outstanding shares were also 15 percent higher than the 2008 amount of 20.63 million.
The following table summarizes the variances in funds flow from operating activities between 2010 and 2009. It demonstrates that the variance (decrease in funds flow from operating activities) was caused primarily by a decrease in realized risk management gains in excess of increased realized commodity prices and higher royalties due to higher market prices.
MANA GEMENT’S D ISC USS ION A ND ANAL YSI S 11
$ Millions $ Per Diluted
Common Share
Per Share Percent
Variance
Funds flow from operating activities – 2009 86.35 3.64 –
Price variance 23.05 0.88 24
Volume variance 0.41 0.02 1
Realized risk management gains (27.21) (1.03) (28)
Royalties (4.52) (0.17) (5)
Expenses:
Production 0.38 0.01 1
General and administrative (1.47) (0.06) (2)
Transaction costs (1.26) (0.05) (1)
Interest and financing charges (1.87) (0.07) (2)
Asset retirement expenditures (0.51) (0.02) (1)
Current taxes 0.35 0.01 –
Weighted average common shares – diluted – (0.36) (10)
Funds flow from operating activities – 2010 73.70 2.80 (23)
Depletion and Depreciation
In 2010, Zargon’s depletion and depreciation provision increased three percent to $66.42 million, compared to $64.72 million in 2009 and $59.64 million in 2008. The higher charges reflect a two percent increase in the charge on a per barrel of oil equivalent basis. Depletion and depreciation charges calculated on a unit of production method are based on total proved reserves with a conversion of six thousand cubic feet of natural gas being equivalent to one barrel of oil. The 2010 depletion calculation includes $20.29 million of future capital expenditures to develop the Company’s reserves, but excludes $25.16 million of unproven properties relating to undeveloped land.
Zargon’s depletion and depreciation, on a barrel of oil equivalent basis, increased two percent in 2010 to $18.42 from $17.99 in 2009 and also increased five percent from the 2008 rate of $17.61.
Accretion of Asset Retirement Obligations
For the year ended December 31, 2010, the non-cash accretion expense for asset retirement obligations was $3.52 million compared to $2.74 million in 2009 and $2.18 million in 2008. The year-over-year increases are due to changes in the estimated future liability for asset retirement obligations as a result of wells added through Zargon’s drilling program and wells acquired with the recent property and Oakmont corporate acquisitions. The significant assumptions used in this calculation are a credit adjusted risk-free rate of 7.5 percent, an inflation rate of two percent and payments to settle the retirement obligations occurring over the next 40 years, with the majority of the costs being incurred after 2020. The estimated net present value of the total asset retirement obligation was $42.98 million as at December 31, 2010, based on a total future liability of $171.10 million.
Share-Based Compensation
Share-based compensation was $1.45 million in 2010, $0.19 million higher than the $1.26 million expense in 2009. The increase was the result of the timing of 2010 grants and a general increase in the valuation of these grants. Zargon will continue to use fair value methodologies for future share rights grants. These non-cash expenses will be recurring charges in future years if Zargon continues to grant employees and directors share rights.
In conjunction with conversion to a corporation, Zargon’s two original Trust Unit Rights Incentive Plans were amended and restated as Common Share Rights Incentive Plans. Under these plans, directors, officers, employees and other service providers of the Company possess rights to acquire common
12 ZARGON O IL & GA S LTD. 2010 ANNU AL F INAN CIAL REPORT
shares at their option of either the original exercise price or a “modified price” as calculated per the provisions of the relevant plan. The Common Share Rights Incentive Plan (2007) (the “Old Plan”) provides for a modified price based on the increment of the amount by which monthly distributions/dividends exceed a monthly return of 0.833 percent of the Company’s recorded net book value of oil and natural gas properties (as defined in the Old Plan). Under the Common Share Rights Incentive Plan (2009) (the “New Plan”), if the monthly distribution/dividend exceeds the monthly return of 0.833 percent of the Company’s recorded net book value of oil and natural gas properties (as defined in the New Plan), the entire amount (not the increment) of the distribution/dividend is deducted from the original grant price. Rights granted under either Plan generally vest over a three-year period and expire approximately five years from the grant date. Zargon uses a fair value methodology to value the common share rights grants. The Company is authorized to issue up to an aggregate of 2.13 million share rights; however, the number of shares reserved for issuance upon exercise of the options shall not, at any time, exceed 10 percent of the aggregate number of the total outstanding shares. Management does not intend on granting any further rights under either one of these two plans.
In addition to their approval of the Plan of Arrangement on December 15, 2010, securityholders also approved a new share-based compensation plan (“Share Award Plan”) effective January 1, 2011. Under the Share Award Plan, directors, officers, employees and other service providers are granted the right to receive a defined number of shares in the future, which increases commensurately with each dividend declared by the Company after the grant date. The awards vest equally over four years and expire five years after grant date. Holders may choose to exercise upon vesting or at any time thereafter, with forfeiture of any shares not exercised by the expiry date. No awards were issued under this plan until subsequent to December 31, 2010.
Unrealized Foreign Exchange
Unrealized foreign exchange gains of $0.04 million in 2010 compared to losses of $0.18 million for 2009. Gains and losses result from translation of Zargon’s US subsidiaries into Canadian dollars at rates as determined under the temporal method of converting foreign subsidiaries as required by Canadian GAAP. The volatility in the US/Cdn dollar has created non-cash translation gains/losses as recorded in Zargon’s statement of earnings and comprehensive income.
Future Income Taxes
The provision for the future tax recovery for 2010 was $14.88 million when compared to a future tax recovery of $18.95 million in 2009 and an expense of $12.75 million in 2008. As a Trust, Zargon’s future tax obligations were reduced, as distributions were 100 percent deductible. The 2010 future tax recovery, when compared to the 2009 prior year recovery, is impacted by the decrease in losses before income taxes for the period as a result of previously mentioned higher oil prices net of increased unrealized risk management losses, transaction costs, and interest and finance charges.
Non-Controlling Interest – Exchangeable Shares
According to the January 19, 2005 CICA pronouncement, EIC-151 “Exchangeable Securities Issued by Subsidiaries of Income Trusts”, Zargon Energy Trust was required to reflect the exchangeable securities issued by its subsidiary as either a non-controlling interest or debt on the consolidated balance sheet unless they met certain criteria. The exchangeable shares were publicly traded and had an expiry term, which could be extended at the option of the Board of Directors. Therefore, these securities were considered by EIC-151 to be transferable to third parties and to have an indefinite life. EIC-151 states that if these criteria are met, the exchangeable shares should be reflected as a non-controlling interest. Prior to 2005, these exchangeable shares were reflected as a component of unitholders’ equity. Additionally, in accordance with EIC-151, and given the circumstances in Zargon’s case, each redemption of exchangeable shares was accounted for as a step-purchase and resulted in an increase in property and equipment and in the future income tax liability. This treatment ceased with the Company’s early adoption of the CICA Handbook Section 1602 “Non Controlling Interests” effective January 1, 2010, whereby redemptions subsequent to that date have been recorded against accumulated earnings rather than as increases to property and equipment and future taxes. The related EIC-151 was also updated for
MANA GEMENT’S D ISC USS ION A ND ANAL YSI S 13
this new Handbook Section and for 2010 requires that the non-controlling interest be reflected as a component of equity, which has been reflected in the Company’s balance sheets for the years ended December 31, 2010 and 2009.
During the year, the Company had increased its non-controlling interest by $0.83 million (2009 – $1.04 million) on the Company’s consolidated balance sheets immediately prior to the December 31, 2010 corporate conversion. Consolidated net earnings for 2010 had been reduced for net earnings attributable to the non-controlling interest by $1.10 million (2009 – $0.34 million). In accordance with EIC-151 and Handbook Section 1581, each redemption prior to 2010 was accounted for as a step-purchase and resulted in increases for 2009 in property and equipment of $0.97 million and in the future income tax liability of $0.27 million. In accordance with Handbook Section 1582, redemptions during 2010 were recorded as a decrease to accumulated earnings, which totalled $1.26 million. Prior to the corporate conversion, the cumulative impact to date of the application of EIC-151 for redemption of exchangeable shares was an increase to gross property and equipment of $56.13 million (for prior years’ depletion impact see note 5 in the audited consolidated financial statements), to shareholders’ capital and non-controlling interest of $69.27 million, to future income tax liability of $18.46 million, a decrease to accumulated earnings of $1.26 million and an allocation of net earnings to exchangeable shareholders of $30.34 million. Funds flow from operating activities were not impacted by this accounting treatment.
As part of the conversion to a corporation on December 31, 2010, all outstanding exchangeable shares were converted to common shares of the Company at an exchange ratio of 1.84716. As a result, 3.12 million shares were issued at a fair value of $68.06 million and recorded as shareholders’ capital, the non-controlling interest was eliminated and the offset was recorded as a decrease to accumulated earnings of $42.41 million which, together with the aforementioned $1.26 million impact of redemptions during 2010, generated an accumulated deficit of $31.47 million. Pursuant to the Arrangement, on December 31, 2010, the shareholders’ capital was reduced by $31.47 million (the amount of the accumulated deficit) resulting in an accumulated earnings/deficit balance of zero on December 31, 2010.
Net Earnings
Zargon’s 2010 net earnings were $8.92 million, a 228 percent increase from $2.72 million in 2009. The 2008 net earnings were $68.29 million. The net earnings track the funds flow from operating activities for the respective periods modified by asset retirement expenditures and non-cash charges, which, in 2010 were primarily related to depletion and depreciation, unrealized risk management losses and future income tax recoveries. On a per diluted share basis, 2010 net earnings were $0.38 compared to net earnings of $0.13 in 2009 and $3.80 in 2008.
The 2010 net earnings were 12 percent of funds flow from operating activities, an improvement over 2009 when net earnings represented three percent of funds flow from operating activities, primarily reflecting the increase in revenue due to improved oil prices and proportionately higher oil production volumes and a decrease in non-cash charges for unrealized risk management losses. Net earnings were 64 percent of funds flow from operating activities in 2008.
Capital Expenditures
Total net capital expenditures (including net property acquisitions, equity consideration and net debt assumed for the Oakmont corporate acquisition) in 2010 of $72.03 million decreased 31 percent from $104.59 million in 2009, and was highlighted by an increase in Zargon’s field capital expenditure program of 30 percent in 2010 to $60.42 million from $46.45 million in 2009. In 2010, Zargon drilled 46 gross (37.6 net) wells compared to 29 gross (25.7 net) wells in 2009 and, as a result, drilling and completion expenditures increased by 54 percent to $33.69 million. Of the total 2010 field capital expenditures (excluding corporate and net property acquisitions), $20.30 million were expended on Alberta Plains North, $10.89 million on Alberta Plains South and $29.23 million on Williston Basin properties. Additionally, $0.65 million was incurred corporately on leasehold improvements and administrative assets and $10.96 million was attributed to the net property and corporate acquisitions. Field capital expenditures for the 2010 year are net of Alberta drilling credits which totalled $3.09 million and $1.66
14 ZARGON O IL & GA S LTD. 2010 ANNU AL F INAN CIAL REPORT
million in the respective Alberta Plains North and Alberta Plains South core areas. Alberta drilling credits are designed to encourage the execution of new drilling projects in Alberta and were announced in 2009 in response to the slow-down in drilling throughout the province. The drilling credit is based on a $200 per metre credit on total metres drilled with a cap based on production levels and Alberta Crown royalties paid. The Alberta drilling incentive program expires on March 31, 2011.
Capital Expenditures
($ millions) 2010 2009 2008
Undeveloped land 6.93 5.60 8.14
Geological and geophysical (seismic) 5.39 3.71 4.44
Drilling and completion of wells 33.69 21.94 27.66
Well equipment and facilities 14.41 15.20 13.11
Exploration and development 60.42 46.45 53.35
Property acquisitions (1) 32.48 1.17 6.41
Property dispositions (30.88) (0.13) (0.22)
Net property acquisitions/(dispositions) (1) 1.60 1.04 6.19
Corporate acquisitions assigned to property and equipment (2) 9.36 56.34 59.85
Total net capital expenditures excluding administrative
assets (1) (2) 71.38 103.83 119.39
Administrative assets 0.65 0.76 0.34
Total net capital expenditures (1) (2) 72.03 104.59 119.73
(1) Amounts include capital expenditures acquired for cash and equity issuances.
(2) Amounts include capital expenditures acquired for cash, equity issuances, acquisition costs for transactions in 2009 and 2008 and net debt assumed on corporate acquisitions.
CORPORATE ACQUISITION
On September 9, 2010, the Company acquired all of the issued and outstanding common shares of Oakmont Energy Ltd. (“Oakmont”), a private oil and gas company, for a total consideration of 335,574 Zargon common shares and the assumption of approximately $3.41 million of net debt for a total transaction value of $9.36 million. The results of operations for Oakmont have been included in the consolidated financial statements since September 9, 2010.
LIQUIDITY AND CAPITAL RESOURCES
In 2010, the summation of the funds inflows coming from the funds flow from operating activities ($73.70 million) plus the issuance of common shares ($8.31 million - arising from the acquisition of Oakmont and share right exercises) and the increase in bank debt of $38.71 million exceeded the summation of the funds outflows pertaining to the net capital expenditure program ($72.03 million) and the cash distributions to shareholders ($47.35 million) by $1.34 million.
Zargon’s financing philosophy and the three sources of funding are as follows:
Internally generated funds flow from operating activities provides the basic level of funding for the Company’s annual capital expenditures program and for distributions/dividends to shareholders.
Debt may be utilized for acquisitions or to expand capital programs when it is deemed appropriate. As at December 31, 2010, the Company had $180 million in syndicated committed credit facilities of which $64.71 million or 36 percent was unutilized.
New equity, if available and if on favourable terms, can be utilized for acquisitions or to expand capital programs.
MANA GEMENT’S D ISC USS ION A ND ANAL YSI S 1 5
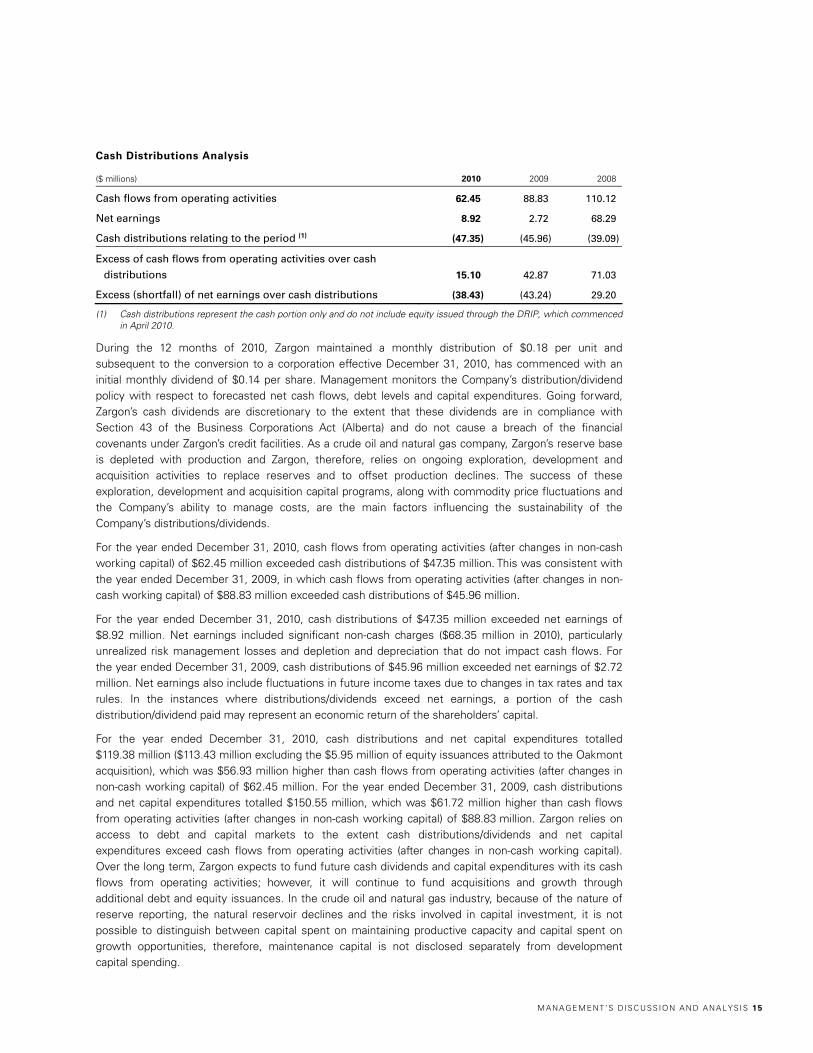
Cash Distributions Analysis
($ millions) 2010 2009 2008
Cash flows from operating activities 62.45 88.83 110.12
Net earnings 8.92 2.72 68.29
Cash distributions relating to the period (1) (47.35) (45.96) (39.09)
Excess of cash flows from operating activities over cash
distributions 15.10 42.87 71.03
Excess (shortfall) of net earnings over cash distributions (38.43) (43.24) 29.20
(1) Cash distributions represent the cash portion only and do not include equity issued through the DRIP, which commenced in April 2010.
During the 12 months of 2010, Zargon maintained a monthly distribution of $0.18 per unit and subsequent to the conversion to a corporation effective December 31, 2010, has commenced with an initial monthly dividend of $0.14 per share. Management monitors the Company’s distribution/dividend policy with respect to forecasted net cash flows, debt levels and capital expenditures. Going forward, Zargon’s cash dividends are discretionary to the extent that these dividends are in compliance with Section 43 of the Business Corporations Act (Alberta) and do not cause a breach of the financial covenants under Zargon’s credit facilities. As a crude oil and natural gas company, Zargon’s reserve base is depleted with production and Zargon, therefore, relies on ongoing exploration, development and acquisition activities to replace reserves and to offset production declines. The success of these exploration, development and acquisition capital programs, along with commodity price fluctuations and the Company’s ability to manage costs, are the main factors influencing the sustainability of the Company’s distributions/dividends.
For the year ended December 31, 2010, cash flows from operating activities (after changes in non-cash working capital) of $62.45 million exceeded cash distributions of $47.35 million. This was consistent with the year ended December 31, 2009, in which cash flows from operating activities (after changes in non-cash working capital) of $88.83 million exceeded cash distributions of $45.96 million.
For the year ended December 31, 2010, cash distributions of $47.35 million exceeded net earnings of $8.92 million. Net earnings included significant non-cash charges ($68.35 million in 2010), particularly unrealized risk management losses and depletion and depreciation that do not impact cash flows. For the year ended December 31, 2009, cash distributions of $45.96 million exceeded net earnings of $2.72 million. Net earnings also include fluctuations in future income taxes due to changes in tax rates and tax rules. In the instances where distributions/dividends exceed net earnings, a portion of the cash distribution/dividend paid may represent an economic return of the shareholders’ capital.
For the year ended December 31, 2010, cash distributions and net capital expenditures totalled $119.38 million ($113.43 million excluding the $5.95 million of equity issuances attributed to the Oakmont acquisition), which was $56.93 million higher than cash flows from operating activities (after changes in non-cash working capital) of $62.45 million. For the year ended December 31, 2009, cash distributions and net capital expenditures totalled $150.55 million, which was $61.72 million higher than cash flows from operating activities (after changes in non-cash working capital) of $88.83 million. Zargon relies on access to debt and capital markets to the extent cash distributions/dividends and net capital expenditures exceed cash flows from operating activities (after changes in non-cash working capital). Over the long term, Zargon expects to fund future cash dividends and capital expenditures with its cash flows from operating activities; however, it will continue to fund acquisitions and growth through additional debt and equity issuances. In the crude oil and natural gas industry, because of the nature of reserve reporting, the natural reservoir declines and the risks involved in capital investment, it is not possible to distinguish between capital spent on maintaining productive capacity and capital spent on growth opportunities, therefore, maintenance capital is not disclosed separately from development capital spending.
16 ZARGON O IL & GA S LTD. 2010 ANNU AL F INAN CIAL REPORT
On April 9, 2010, the Company implemented a Distribution Reinvestment Plan. Under the Arrangement, the Distribution Reinvestment Plan has been amended and restated as a Dividend Reinvestment Plan (“DRIP”) and all existing participants in the Distribution Reinvestment Plan are deemed to be participants in the DRIP. Canadian shareholders are entitled to reinvest monthly cash distributions/dividends in additional shares of the Company. At the discretion of the Company, these additional shares will be issued from Treasury at 95 percent of the “weighted average closing price”. For the purposes of the shares issued, the “weighted average closing price” is calculated as the weighted average trading price of shares for the five days prior to the distribution/dividend payment date.
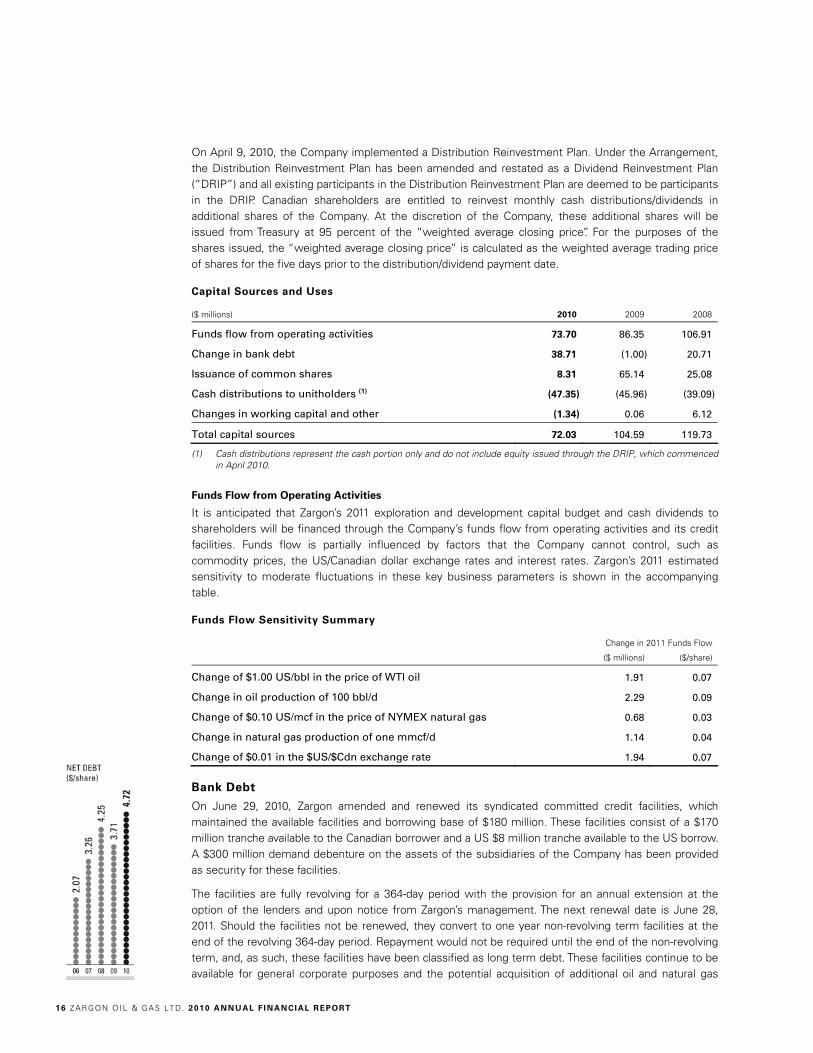
Capital Sources and Uses
($ millions) 2010 2009 2008
Funds flow from operating activities 73.70 86.35 106.91
Change in bank debt 38.71 (1.00) 20.71
Issuance of common shares 8.31 65.14 25.08
Cash distributions to unitholders (1) (47.35) (45.96) (39.09)
Changes in working capital and other (1.34) 0.06 6.12
Total capital sources 72.03 104.59 119.73
(1) Cash distributions represent the cash portion only and do not include equity issued through the DRIP, which commenced in April 2010.
Funds Flow from Operating Activities
It is anticipated that Zargon’s 2011 exploration and development capital budget and cash dividends to shareholders will be financed through the Company’s funds flow from operating activities and its credit facilities. Funds flow is partially influenced by factors that the Company cannot control, such as commodity prices, the US/Canadian dollar exchange rates and interest rates. Zargon’s 2011 estimated sensitivity to moderate fluctuations in these key business parameters is shown in the accompanying table.
Funds Flow Sensitivity Summary
Change in 2011 Funds Flow
($ millions) ($/share)
Change of $1.00 US/bbl in the price of WTI oil 1.91 0.07
Change in oil production of 100 bbl/d 2.29 0.09
Change of $0.10 US/mcf in the price of NYMEX natural gas 0.68 0.03
Change in natural gas production of one mmcf/d 1.14 0.04
Change of $0.01 in the $US/$Cdn exchange rate 1.94 0.07
Bank Debt
On June 29, 2010, Zargon amended and renewed its syndicated committed credit facilities, which maintained the available facilities and borrowing base of $180 million. These facilities consist of a $170 million tranche available to the Canadian borrower and a US $8 million tranche available to the US borrow. A $300 million demand debenture on the assets of the subsidiaries of the Company has been provided as security for these facilities.
The facilities are fully revolving for a 364-day period with the provision for an annual extension at the option of the lenders and upon notice from Zargon’s management. The next renewal date is June 28, 2011. Should the facilities not be renewed, they convert to one year non-revolving term facilities at the end of the revolving 364-day period. Repayment would not be required until the end of the non-revolving term, and, as such, these facilities have been classified as long term debt. These facilities continue to be available for general corporate purposes and the potential acquisition of additional oil and natural gas
MANA GEMENT’S D ISC USS ION A ND ANAL YSI S 17
properties, such as those most recently acquired through property acquisitions and the corporate acquisition of Oakmont, which were funded by bank debt and equity issuances. Zargon reviews its compliance with its bank debt covenants on a quarterly basis and had no violations as at December 31, 2010. The Company converted to a corporation from its previous trust structure on December 31, 2010. In order for this conversion to have occurred, Zargon had to ensure that all legal and regulatory requirements were satisfied. Zargon’s current syndicated credit facility was amended and restated effective January 1, 2011 to reflect the corporate conversion.
Through to the 2011 renewal, it is anticipated that Zargon’s borrowing costs will be higher as general debt pricing, standby fees and extension fees have increased slightly due to current debt levels. Interest rates fluctuate under the syndicated facilities with Canadian prime, US prime and US base rates plus an applicable margin between 100 basis points and 250 basis points (2009 – 125 and 275 basis points, respectively), as well as with Canadian banker’s acceptance and LIBOR rates plus an applicable margin between 250 basis points and 400 basis points (2009 – 275 and 425 basis points, respectively).
At December 31, 2010, $115.29 million (December 31, 2009 - $76.58 million) had been drawn on the syndicated committed credit facilities with any unused amounts subject to standby fees.
In the normal course of operations, Zargon enters into various letters of credit. At December 31, 2010, the approximate value of outstanding letters of credit totalled $1.25 million (December 31, 2009 - $0.61 million).
Zargon’s debt net of working capital (excluding unrealized risk management assets/liabilities and future income taxes) of $124.39 million at December 31, 2010 was equivalent to 169 percent of the 2010 funds flow from operating activities of $73.70 million. At December 31, 2009, the debt net of working capital (excluding unrealized risk management assets/liabilities and future income taxes) was $88.01 million, equivalent to 102 percent of the 2009 funds flow from operating activities of $86.35 million.
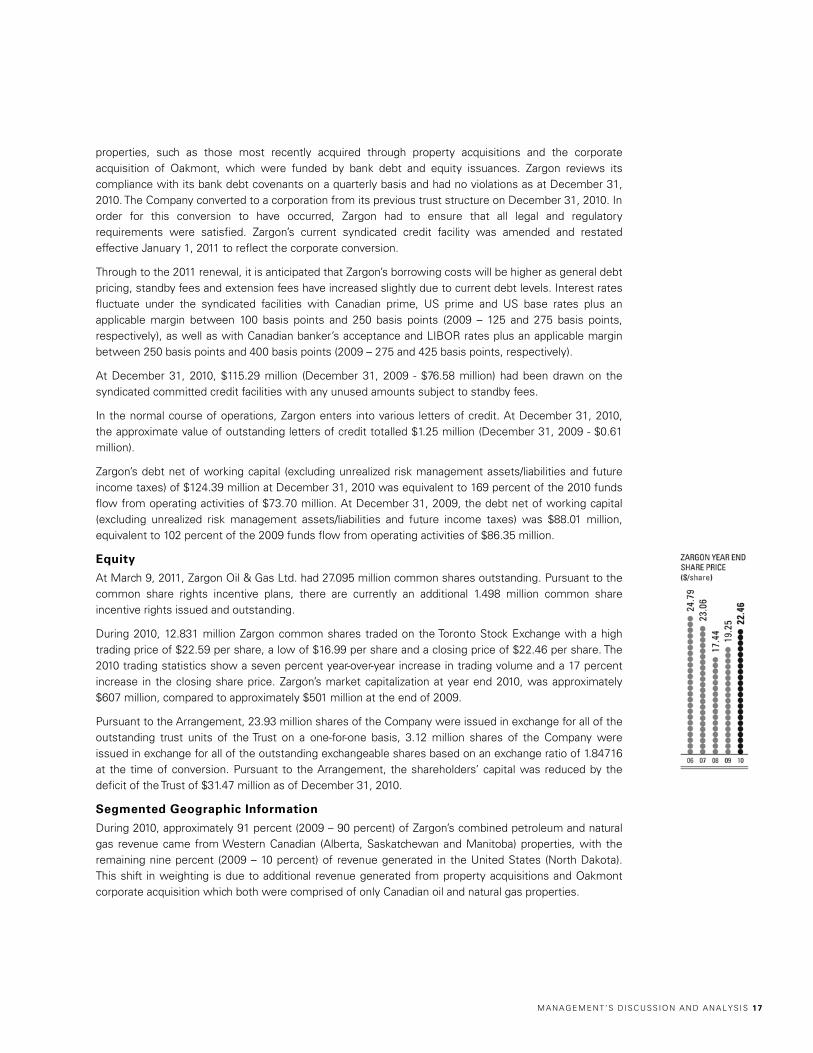
Equity
At March 9, 2011, Zargon Oil & Gas Ltd. had 27.095 million common shares outstanding. Pursuant to the common share rights incentive plans, there are currently an additional 1.498 million common share incentive rights issued and outstanding.
During 2010, 12.831 million Zargon common shares traded on the Toronto Stock Exchange with a high trading price of $22.59 per share, a low of $16.99 per share and a closing price of $22.46 per share. The 2010 trading statistics show a seven percent year-over-year increase in trading volume and a 17 percent increase in the closing share price. Zargon’s market capitalization at year end 2010, was approximately $607 million, compared to approximately $501 million at the end of 2009.
Pursuant to the Arrangement, 23.93 million shares of the Company were issued in exchange for all of the outstanding trust units of the Trust on a one-for-one basis, 3.12 million shares of the Company were issued in exchange for all of the outstanding exchangeable shares based on an exchange ratio of 1.84716 at the time of conversion. Pursuant to the Arrangement, the shareholders’ capital was reduced by the deficit of the Trust of $31.47 million as of December 31, 2010.
Segmented Geographic Information
During 2010, approximately 91 percent (2009 – 90 percent) of Zargon’s combined petroleum and natural gas revenue came from Western Canadian (Alberta, Saskatchewan and Manitoba) properties, with the remaining nine percent (2009 – 10 percent) of revenue generated in the United States (North Dakota). This shift in weighting is due to additional revenue generated from property acquisitions and Oakmont corporate acquisition which both were comprised of only Canadian oil and natural gas properties.
18 ZARGON O IL & GA S LTD. 2010 ANNU AL F INAN CIAL REPORT
OFF BALANCE SHEET ARRANGEMENTS
The Company has no guarantees or off balance sheet arrangements, except for letters of credit which have been issued in the normal course of business of approximately $1.25 million as at December 31, 2010.
RELATED PARTY TRANSACTIONS
During the year, the Company paid $0.01 million (2009 – $0.05 million) for vehicle leases to a company owned by a Board member and $0.66 million (2009 – $0.41 million) for legal services to a law firm in which a Board member is a partner. All amounts were based on normal commercial terms and conditions.
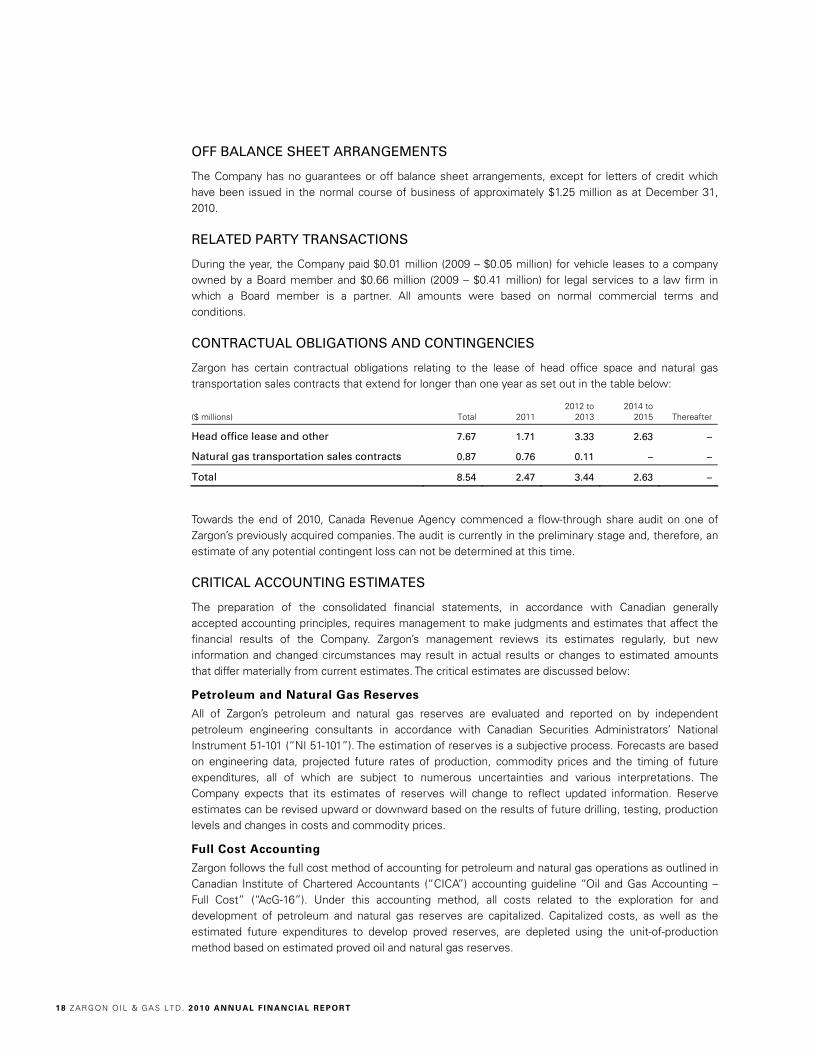
CONTRACTUAL OBLIGATIONS AND CONTINGENCIES
Zargon has certain contractual obligations relating to the lease of head office space and natural gas transportation sales contracts that extend for longer than one year as set out in the table below:
($ millions) Total 2011 2012 to
2013 2014 to
2015 Thereafter
Head office lease and other 7.67 1.71 3.33 2.63 –
Natural gas transportation sales contracts 0.87 0.76 0.11 – –
Total 8.54 2.47 3.44 2.63 –
Towards the end of 2010, Canada Revenue Agency commenced a flow-through share audit on one of Zargon’s previously acquired companies. The audit is currently in the preliminary stage and, therefore, an estimate of any potential contingent loss can not be determined at this time.
CRITICAL ACCOUNTING ESTIMATES
The preparation of the consolidated financial statements, in accordance with Canadian generally accepted accounting principles, requires management to make judgments and estimates that affect the financial results of the Company. Zargon’s management reviews its estimates regularly, but new information and changed circumstances may result in actual results or changes to estimated amounts that differ materially from current estimates. The critical estimates are discussed below:
Petroleum and Natural Gas Reserves
All of Zargon’s petroleum and natural gas reserves are evaluated and reported on by independent petroleum engineering consultants in accordance with Canadian Securities Administrators’ National Instrument 51-101 (“NI 51-101”). The estimation of reserves is a subjective process. Forecasts are based on engineering data, projected future rates of production, commodity prices and the timing of future expenditures, all of which are subject to numerous uncertainties and various interpretations. The Company expects that its estimates of reserves will change to reflect updated information. Reserve estimates can be revised upward or downward based on the results of future drilling, testing, production levels and changes in costs and commodity prices.
Full Cost Accounting
Zargon follows the full cost method of accounting for petroleum and natural gas operations as outlined in Canadian Institute of Chartered Accountants (“CICA”) accounting guideline “Oil and Gas Accounting – Full Cost” (“AcG-16”). Under this accounting method, all costs related to the exploration for and development of petroleum and natural gas reserves are capitalized. Capitalized costs, as well as the estimated future expenditures to develop proved reserves, are depleted using the unit-of-production method based on estimated proved oil and natural gas reserves.
MANA GEMENT’S D ISC USS ION A ND ANAL YSI S 19
In applying the full cost method, Zargon calculates a ceiling test on a quarterly basis to ensure that the net carrying value of petroleum and natural gas assets does not exceed the estimated undiscounted future net cash flow from production of proved reserves. Accordingly, the Company must base this calculation of future net cash flow on estimated forecasted sales prices, costs and regulations in effect at the period end. AcG-16 limits the carrying value of petroleum and natural gas properties to their fair value. The fair value is equal to estimated future cash flow from proved and probable reserves using future price forecasts and costs discounted at a risk-free rate.
Asset Retirement Obligations
Zargon follows CICA Section 3110, “Asset Retirement Obligations”, which requires liability recognition for retirement obligations associated with the Company’s property, plant and equipment. Under this policy, the Company is required to provide for future removal and site restoration costs. The Company must estimate these costs in accordance with existing laws, contracts or other policies and must also estimate a credit adjusted risk-free rate and inflation rate in this calculation. These estimated costs are charged to earnings and the appropriate liability account over the expected life of the asset. When the future removal and site restoration costs cannot be reasonably determined, a contingent liability may exist. Contingent liabilities are charged to earnings when management is able to determine the amount and the likelihood of the future obligation.
Income Tax Accounting
The determination of the Company’s income and other tax liabilities requires interpretation of complex laws and regulations. All tax filings are subject to audit and potential reassessment after the lapse of considerable time. Accordingly, the actual income tax liability may differ significantly from that estimated and recorded by management.
RECENT AND FUTURE CANADIAN ACCOUNTING PRONOUNCEMENTS
On January 1, 2010, Zargon adopted the following three CICA Handbook sections:
CICA Handbook Section 1582 “Business Combinations”, which replaces Section 1581 of the same name. Under this new guidance, the purchase price used in a business combination is based on the fair value of shares exchanged at the date of exchange and contingent liabilities are to be recognized at fair value at the acquisition date and re-measured at fair value with changes recorded through earnings each period until settled. In addition, this new guidance generally requires all transaction costs to be expensed and negative goodwill is required to be recognized immediately in earnings. The provisions of this new Section were applied to the acquisition of Oakmont (see note 4 to the consolidated financial statements).
CICA issued Section 1601 “Consolidated Financial Statements”, which replaces Section 1600 of the same name. This guidance requires uniform accounting policies to be consistent throughout all consolidated entities and the difference between reporting dates of a parent and a subsidiary to be no longer than three months. The adoption of this Section did not have an impact on the Company’s consolidated financial statements.
CICA issued Section 1602 “Non-Controlling Interests”, which replaces Section 1600 “Consolidated Financial Statements”. Commencing in 2010, non-controlling interest (“NCI”) is presented within equity. Under this new guidance, when there is a loss or gain of control, the Company’s previously held interest is re-valued at fair value. In addition, NCI may be reported at fair value or at the proportionate share of the fair value of the acquired net assets and allocation of the net income to the NCI will be on this basis. The adoption of this Section has reclassified the NCI from liabilities to equity on the Company’s consolidated balance sheet. Additionally, in accordance with EIC-151 “Exchangeable Securities Issued by Subsidiaries of Income Trusts”, each redemption of exchangeable shares was accounted for as a step-purchase and resulted in an increase in property and equipment and in the future income tax liability. This treatment ceased with the adoption of Handbook Section 1602 whereby redemption subsequent to January 1,
20 ZARGON O IL & GA S LTD. 2010 ANNU AL F INAN CIAL REPORT
2010 have been recorded against accumulated earnings rather than as increases to property and equipment and the future tax liability.
The above CICA Handbook Sections are converged with International Financial Reporting Standards.
On January 1, 2009, the Company adopted the CICA Handbook Section 3064 “Goodwill and Intangible Assets”, replacing Section 3062 “Goodwill and Other Intangible Assets”. Under this new guidance, fewer items meet the criteria for capitalization. Section 3064 establishes standards for the recognition, measurement, presentation and disclosure of goodwill and intangible assets subsequent to its initial recognition. Requirements concerning goodwill are unchanged from the requirements included in the previous Section 3062, as the new Section was only amended for intangible assets. The adoption of this Section did not significantly impact the Company’s consolidated financial statements.
Effective January 1, 2009, the Company retrospectively adopted the recommendations of Emerging Issues Committee abstract 173 “Credit Risk and the Fair Value of Financial Assets and Financial Liabilities”, which was issued in January 2009, without restatement of prior periods. The abstract requires that an entity’s own credit risk and the credit risk of the counterparty are taken into account in determining the fair value of financial assets and liabilities, including derivative instruments, for presentation and disclosure purposes. The adoption of the abstract did not significantly impact the Company’s consolidated financial statements.
Effective December 31, 2009, the Company prospectively adopted the CICA amendments to Handbook Section 3855, “Financial Instruments – Recognition and Measurement.” Amendments to this Section have prohibited the reclassification of a financial asset out of the held-for-trading category when the fair value of the embedded derivative in a combined contract cannot be reasonably measured.
Section 3855 was also amended with regards to the impairment of financial assets. The definition of “loans and receivables” has been revised and, provided that certain conditions have been met, the amendments permit reclassification of financial assets from the held-for-trading and available-for-sale categories into the loans and receivables category. The amendments also provide one method of assessing impairment for all financial assets regardless of classification. The adoption of the amendments to this standard did not have an impact on the Company’s consolidated financial statements.
Effective December 31, 2009, the Company adopted CICA issued amendments to Handbook Section 3862, “Financial Instruments – Disclosures.” The amendments include enhanced disclosures relating to the fair value of financial instruments. Section 3862 now requires that all financial instruments measured at fair value be categorized into one of three hierarchy levels. Refer to note 12 for enhanced fair value disclosures. The amendments are consistent with recent amendments to financial instrument disclosure standards in International Financial Reporting Standards.
INTERNATIONAL FINANCIAL REPORTING STANDARDS
In January 2006, the CICA Accounting Standards Board (“AcSB”) adopted a strategic plan for the direction of accounting standards in Canada. As part of that plan, the AcSB confirmed in February 2008 that International Financial Reporting Standards (“IFRS”) will replace Canadian GAAP in 2011 for profit-oriented Canadian publicly accountable enterprises. The adoption date of January 1, 2011 will require the restatement, for comparative purposes, of amounts reported by Zargon for the year ended December 31, 2010, including the opening balance sheet as at January 1, 2010.
In 2008, Zargon commenced the process to transition its financial statements from current Canadian GAAP to IFRS and has been progressing towards completion throughout 2009 and 2010. Zargon’s project consists of three key phases: the scoping and diagnostic phase, the impact analysis and evaluation phase, and the implementation phase. A wholesome description of Zargon’s IFRS project phases and Zargon’s progress to the end of 2009 is contained within Zargon’s MD&A for the year ended December 31, 2009.
MANA GEMENT’S D ISC USS ION A ND ANAL YSI S 21
Throughout 2009 and 2010, Zargon trained key accounting and finance personnel, as well as the senior management team on the application of IFRS accounting policies and the potential impact on the consolidated financial statements. Individuals within the corporate accounting department have participated in various seminars and industry discussion groups regarding the application of current IFRS and potential changes to the standards.
The corporate accounting department continues to lead the conversion project along with sponsorship from the management team. The project has progressed according to the project plan and Zargon is positioned to meet its 2011 IFRS financial reporting requirements.
With respect to key areas identified in previous reports, the following is a summary of additional progress:
During the third quarter of 2010, Zargon prepared a draft opening balance sheet as at January 1, 2010 and in the fourth quarter, Zargon drafted its financial results under IFRS for the first quarter of 2010 and commenced drafting the results for the second and third quarters. The IFRS opening balance sheet and the financial results for the first quarter have been reviewed by the external auditors; however, all amounts are considered unaudited, as Zargon has not yet prepared a full set of annual financial statements under IFRS.
IFRS 1 “First-Time Adoption of International Financial Reporting Standards” (“IFRS 1”) provides entities adopting IFRS with a number of optional exemptions and mandatory exceptions in certain areas to the general requirement for full retrospective application of IFRS. Zargon’s January 1, 2010 draft opening balance sheet utilized the following IFRS 1 exemptions:
- Property, Plant and Equipment (“PP&E”) – IFRS 1 provides the option to value the PP&E assets at their deemed cost being the Canadian GAAP net book value assigned at the date of transition, January 1, 2010. This amendment is permissible for entities that currently follow the full cost accounting guideline under Canadian GAAP. Under this current policy, Zargon accumulates all oil and natural gas assets into separate cost centres for Canada and the United States. Under IFRS, Zargon’s PP&E assets must be divided into smaller cost centres or “cash generating units” (“CGUs”). The net book value of the assets on the date of transition will be allocated to the CGUs on the basis of Zargon’s reserve values as at January 1, 2010.
- Business Combinations – IFRS 1 allows Zargon to use the IFRS rules for business combinations on a prospective basis rather than re-stating all business combinations. The IFRS business combination rules converge with the new CICA Handbook Section 1582, which Zargon early adopted on January 1, 2010 as discussed earlier in this report.
The following is a listing of key areas where accounting policies differ and where accounting policy decisions are necessary that will impact our reported financial position and results of operations:
- Re-classification of Exploration and Evaluation (“E&E”) expenditures from PP&E – Upon transition to IFRS, Zargon will re-classify all E&E expenditures that are currently included in the Canadian GAAP PP&E balance and will include them in “Intangible exploration assets, other intangibles and goodwill” on the consolidated balance sheets. Zargon has determined that it has approximately $24.4 million of oil and natural gas assets that meet the definition of E&E. The E&E assets will not be depleted and Zargon will be evaluating the projects on a quarterly basis for proper classification. E&E assets must be assessed for impairment when indicators of impairment exist.
- Calculation of depletion expense for PP&E assets – Upon transition to IFRS, Zargon has the option to calculate depletion using a reserve base of proved reserves, which is comparable to the Canadian GAAP method of calculating depletion, or using a reserve base of proved and probable reserves. Also, depletion must be calculated at a more granular level than what is currently required under Canadian GAAP. Zargon plans to calculate its depletion expense using proved and probable reserves as its depletion base. Accordingly, due to the larger depletion base associated with proved and probable
22 ZARGON O IL & GA S LTD. 2010 ANNU AL F INAN CIAL REPORT
reserves, Zargon expects its depletion expense to be reduced by approximately $4.50 to $5.50 per barrel of oil equivalent per year under IFRS as compared to its current calculation under Canadian GAAP.
- Impairment of PP&E assets – Under IFRS, impairment of PP&E must be calculated at a more granular level than what is currently required under Canadian GAAP. Impairment calculations will be performed at the CGU level using either total proved or proved and probable reserves. The most significant difference is that the Canadian GAAP “ceiling test” incorporates a 2-step approach for testing impairment, while IFRS uses a 1-step approach. Under Canadian GAAP, a discounted cash flow analysis is not required if the undiscounted cash flows from proved reserves exceed its carrying amount (step 1). If the carrying amount exceeds the undiscounted future cash flows, then a prescribed discounted cash flow test is performed (step 2). Under IFRS, impairment testing based on discounted cash flows or fair value determinations is required and is performed at the CGU level. Impairment tests are required to be performed on initial transition to IFRS. At January 1, 2010, no impairment was identified. Impairment of PP&E must be assessed whenever there is an indication of impairment such as changes in commodity prices or operational performance.
- Provisions for asset retirement obligations – Under IFRS, Zargon is required to revalue its entire liability for asset retirement obligations at each balance sheet date using a current liability-specific discount rate. Under Canadian GAAP, once recorded, asset retirement obligations are not adjusted for future changes in discount rates. Although the International Financial Reporting Interpretations Committee (“IFRIC”) is evaluating the matter, under current IFRS standards, there is no specific guidance as to whether discounting should be based on a credit adjusted rate, as it currently is under Canadian GAAP, or based on a risk free rate. In the absence of specific guidance by IFRIC, the Company has made a preliminary decision to discount the estimated fair value of future asset retirement obligations using a risk free rate. The risk free rate is currently estimated to be 3.5 percent and is expected to result in an approximately $45.2 million or 127 percent increase in the provision for asset retirement obligations as presented in the January 1, 2010 balance sheet, with an offsetting charge to accumulated earnings.
- Income tax – In November 2009 the IASB withdrew an exposure draft on Income Taxes. Current IFRS income tax requirements are fundamentally consistent with Canadian GAAP. Any changes to income tax reporting are expected to be predominantly caused by changes in the book value of assets and changes in tax rates applied, not due to the change in income tax accounting methodology. Upon transition, Zargon expects its future tax liability to decrease by approximately $15.3 million or 48 percent under IFRS as compared to its current calculation for January 1, 2010 under Canadian GAAP, primarily due to expected changes to Zargon’s provision for asset retirement obligations.
- Share-based payments – Under IFRS, share-based payments for equity awards are expensed based on a graded vesting schedule compared to the straight-line method which was permitted under Canadian GAAP. A forfeiture rate is also required to be applied to the calculation under IFRS at the initial determination of the fair value of the share-based expense, whereas under Canadian GAAP forfeitures could be recorded as they were incurred. Under IFRS our trust units are classified as equity, however, under IFRS the 2010 unit-based payments are required to be classified as a liability. For the 2010 comparative period, Zargon’s unit-based compensation plan is deemed to be cash settled in accordance with IFRS, even though the trust units are not settled in cash. Following transition, share-based payment expenses will be accelerated under IFRS as compared to its current calculation under Canadian GAAP.
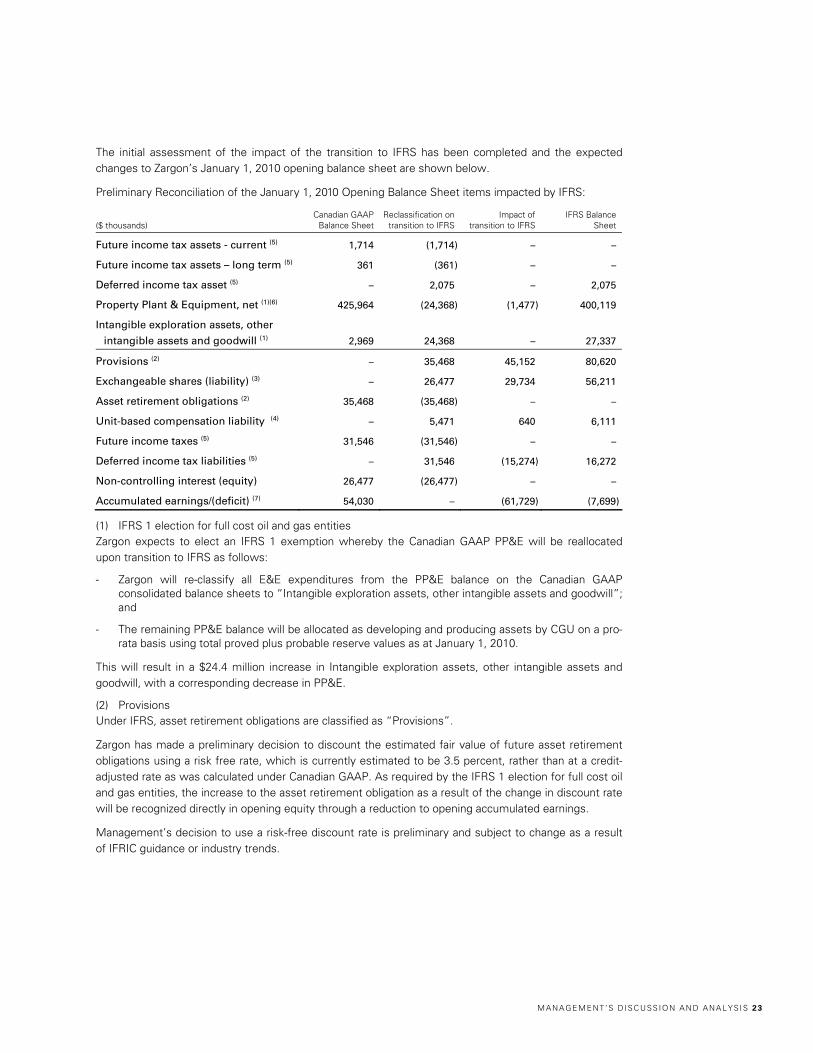
MANA GEMENT’S D ISC USS ION A ND ANAL YSI S 23
The initial assessment of the impact of the transition to IFRS has been completed and the expected changes to Zargon’s January 1, 2010 opening balance sheet are shown below.
Preliminary Reconciliation of the January 1, 2010 Opening Balance Sheet items impacted by IFRS:
($ thousands) Canadian GAAP
Balance Sheet Reclassification on
transition to IFRS Impact of
transition to IFRS IFRS Balance
Sheet
Future income tax assets - current (5) 1,714 (1,714) – –
Future income tax assets – long term (5) 361 (361) – –
Deferred income tax asset (5) – 2,075 – 2,075
Property Plant & Equipment, net (1)(6) 425,964 (24,368) (1,477) 400,119
Intangible exploration assets, other
intangible assets and goodwill (1) 2,969 24,368 – 27,337
Provisions (2) – 35,468 45,152 80,620
Exchangeable shares (liability) (3) – 26,477 29,734 56,211
Asset retirement obligations (2) 35,468 (35,468) – –
Unit-based compensation liability (4) – 5,471 640 6,111
Future income taxes (5) 31,546 (31,546) – –
Deferred income tax liabilities (5) – 31,546 (15,274) 16,272
Non-controlling interest (equity) 26,477 (26,477) – –
Accumulated earnings/(deficit) (7) 54,030 – (61,729) (7,699)
(1) IFRS 1 election for full cost oil and gas entities Zargon expects to elect an IFRS 1 exemption whereby the Canadian GAAP PP&E will be reallocated upon transition to IFRS as follows:
- Zargon will re-classify all E&E expenditures from the PP&E balance on the Canadian GAAP consolidated balance sheets to “Intangible exploration assets, other intangible assets and goodwill”; and
- The remaining PP&E balance will be allocated as developing and producing assets by CGU on a pro-rata basis using total proved plus probable reserve values as at January 1, 2010.
This will result in a $24.4 million increase in Intangible exploration assets, other intangible assets and goodwill, with a corresponding decrease in PP&E.
(2) Provisions Under IFRS, asset retirement obligations are classified as “Provisions”.
Zargon has made a preliminary decision to discount the estimated fair value of future asset retirement obligations using a risk free rate, which is currently estimated to be 3.5 percent, rather than at a credit-adjusted rate as was calculated under Canadian GAAP. As required by the IFRS 1 election for full cost oil and gas entities, the increase to the asset retirement obligation as a result of the change in discount rate will be recognized directly in opening equity through a reduction to opening accumulated earnings.
Management’s decision to use a risk-free discount rate is preliminary and subject to change as a result of IFRIC guidance or industry trends.
24 ZARGON O IL & GA S LTD. 2010 ANNU AL F INAN CIAL REPORT
The estimated effect on Provisions of the implementation of IFRS, assuming the use of a 3.5 percent risk free discount rate, is expected to be:
($ thousands)
Increase in provisions 45,152
Tax effect (11,712)
Reduction in opening accumulated earnings 33,440
(3) Exchangeable shares Under IFRS, the Company is required to review all instruments which could be converted into trust units and classify those instruments as financial assets or financial liabilities. As a result, Zargon’s exchangeable shares will be measured at fair value and classified as a liability rather than as a non-controlling interest in equity, as is currently the case under Canadian GAAP. The remeasurement to fair value will result in an increase to exchangeable share liability of $29.7 million, with an offsetting reduction in opening accumulated earnings. Given the fact they will be redeemed at the time of our conversion to a corporation on December 31, 2010, the January 1, 2010 exchangeable shares will be classified as a current liability.
(4) Unit-based compensation liability Under Canadian GAAP, Zargon values its employee unit/share options as equity settled; however under IFRS the options are deemed to be cash settled. As a result, although the trust units will still be equity on the balance sheet, the valuation of the unit-based payments will be accounted for as liabilities measured at fair value every reporting date. Additionally, IFRS requires the unit-based compensation to be measured using accelerated expensing and an expected forfeiture rate, compared to Canadian GAAP which permitted straight-line expensing and forfeitures as incurred. As a result of recalculating the unit-based compensation under these new requirements, the liability will be increased by $0.6 million at January 1, 2010, with a corresponding reduction in opening accumulated earnings.
(5) Deferred income taxes The change in the net present value of the provision for asset retirement obligations is expected to result in an $11.7 million decrease in the deferred tax liability and a corresponding increase to accumulated earnings. As Zargon Energy Trust was a flow-through entity whose taxable income passed through to the unitholders, the temporary tax differences of Zargon under IFRS for the January 1, 2010 opening balance sheet must be tax affected at the top marginal personal tax rate in Canada, resulting in a $3.6 million reduction of the deferred tax liability and an equivalent increase to accumulated earnings.
The estimated effect of the implementation of IFRS on Deferred income tax liabilities can be quantified as follows:
($ thousands)
Canadian GAAP future income tax assets 2,075
Canadian GAAP future income tax liabilities (31,546)
Reduction in deferred tax liabilities due to change in rates for trusts 3,562
Reduction in deferred tax liabilities due to increase in provisions 11,712
IFRS deferred income tax liabilities (14,197)
Under IFRS, deferred income taxes are reported as non-current.
(6) Foreign currency translation IFRS requirements refer to “functional” and “presentation” currencies and accordingly, Zargon has determined that the functional currency for its US companies is US dollars, while the presentation currency for the consolidated entity is Canadian dollars. As a result, the PP&E of the US companies, which had been translated using historical rates under Canadian GAAP, will be translated using closing rates under IFRS. The foreign exchange (“FX”) translation differences resulting from revaluing the US
MANA GEMENT’S D ISC USS ION A ND ANAL YSI S 2 5
PP&E items at the closing December 31, 2009 US to Canadian dollar exchange rate will result in a reduction in consolidated PP&E of $1.5 million and a corresponding reduction in accumulated earnings upon transition to IFRS.
(7) Opening Deficit Under IFRS 1 most changes to the January 1, 2010 opening balance sheet are applied retrospectively through opening accumulated earnings. This includes the changes to Provisions, PP&E, Exchangeable shares, Contributed surplus liability and Deferred taxes as described above. The cumulative estimated effect of these changes, which is in excess of the opening balance of accumulated earnings and results in a revised opening deficit of $7.7 million, is summarized below:
($ thousands)
Reduction due to increase in provisions (33,440)
Reduction due to revaluation of exchangeable shares (29,734)
Reduction due to higher unit compensation (640)
Reduction due to revaluation of FX on US subsidiary (1,477)
Increase due to impact changes in effective tax rate on tax liability 3,562
Reduction in opening accumulated earnings (61,729)
Readers are cautioned that the expected opening balance sheet may change as the Company’s management have not yet finalized all accounting policies under IFRS. In particular, the effects of IFRS adoption on Provisions may be subject to change due to remaining uncertainties at this time.
In addition to accounting policy differences, Zargon’s transition to IFRS will impact the internal controls over financial reporting (“ICFR”), information technology systems and certain business activities as follows:
- ICFR – The review of Zargon’s accounting policies is completed, and the assessment of changes required for ICFR has been determined. As an example, additional controls were implemented for the IFRS 1 changes such as the allocation of Zargon’s PP&E as well as the process for reclassifying Zargon’s E&E expenditures from PP&E. The Company’s accounting and finance personnel continue to work with management and operational staff to ensure all costs are recorded in a manner consistent with IFRS. This will be an ongoing effort throughout the process of restating 2010 results to ensure that all changes in accounting policies include the appropriate additional controls and procedures for future IFRS reporting requirements. As at the date of this MD&A, Zargon has drafted the IFRS January 1, 2010 opening balance sheet and the first quarter of 2010 and is currently determining adjustments to the comparative information for the remaining 2010 quarters. Once this comparative information is drafted, additional and/or modified ICFR will be implemented and will be operational for reporting in 2011.
- Information technology systems – Zargon commenced upgrading systems during the first quarter of 2010 in preparation for IFRS reporting. The modifications, which are deemed critical in order to allow for reporting of both Canadian GAAP and IFRS financial statements in 2010, have been completed. Additional system modifications may be required.
- Business activities – Management has been cognizant of the upcoming transition to IFRS and, as such, has worked with its counterparties and lenders to ensure that any agreements that contain references to Canadian GAAP financial statements are modified to allow IFRS statements. Zargon’s management has amended its banking agreements to provide for changes, which may contemplate for accounting changes which may arise in the calculation of Zargon’s pricing and debt covenants.
The preliminary decisions about IFRS 1 exemptions and accounting policy choices have not been finalized. Users are cautioned that the final IFRS impacts will not be available until the Company’s first quarterly report is issued for 2011 and that the preliminary decisions and estimated impacts of adopting IFRS may change. In addition, other differences may exist between amounts reported by Zargon under Canadian GAAP and IFRS.
26 ZARGON O IL & GA S LTD. 2010 ANNU AL F INAN CIAL REPORT
Design and Evaluation of Internal Control over Financial Reporting and Disclosure Controls and Procedures
Zargon is required to comply with National Instrument 52-109 “Certification of Disclosure in Issuers’ Annual and Interim Filings” and is required to make specific disclosures with respect to NI 52-109. These disclosures can be summarized as follows:
The President and Chief Executive Officer and the Vice President, Finance and Chief Financial Officer have directed an evaluation of Disclosure Control and Procedures (“DC&P”) and have concluded that DC&P are designed appropriately and are operating effectively as at December 31, 2010.
The President and Chief Executive Officer and the Vice President, Finance and Chief Financial Officer have directed an evaluation of Internal Controls over Financial Reporting (“ICFR”) and have concluded that ICFR are designed appropriately and are operating effectively as at December 31, 2010.
Zargon reports that no changes were made to ICFR during 2010 that have materially affected, or are reasonably likely to materially affect the Company’s ICFR.
Zargon has no interests in proportionately consolidated entities or variable interest entities other than oil and gas joint ventures. Accordingly, the scope of the design of DC&P and ICFR have not been limited to exclude controls, policies and procedures with respect to proportionately consolidated entities or variable interest entities.
Zargon has not limited the scope of the design of DC&P and ICFR with respect to any businesses acquired in 2010.
Because of their inherent limitations, DC&P and ICFR may not prevent or detect misstatements, errors or fraud. Control systems, no matter how well designed or operated, can provide only reasonable, not absolute assurance that the objectives of the control systems are met.
BUSINESS RISKS AND OUTLOOKS
Business Risks
Zargon’s external business risks arise from the uncertainty of oil and natural gas pricing, the uncertainty of interest and exchange rates, environmental and safety issues and financial and liquidity considerations. Additional risks arise from the production performance of existing properties (including natural declines), changes in tax, royalty and other regulatory standards and uncertain results from capital expenditure programs.
Oil and natural gas prices may fluctuate widely in response to many factors, such as global and North American supply and demand, economic conditions, weather conditions, political stability, the supply and price of imported oil and liquefied natural gas, production and storage levels of North American natural gas and government regulations. Zargon attempts to minimize pricing and currency exchange uncertainty with a risk management program that encompasses a variety of financial instruments. These could include forward sales of oil and natural gas production (either through financial derivative transactions such as swaps or by physical contracts), put options on both oil and natural gas, costless collars (in which some potential high price gain is given up in return for potential low price support) and US dollar currency risk management transactions in different forms for up to 30 percent of its combined oil and natural gas working interest production (subject to a 50 percent maximum limitation on any single commodity) in order to partially offset the effects of large commodity price fluctuations. In general, the Company seeks to use strategies that allow minimum price expectations to be met in order that dividends and capital programs can be funded. This strategy is designed mainly to protect the Company against periods of unusually low commodity prices and, by its nature, is likely to produce significant risk management losses when prices are unusually high.
Environmental and safety risks are mitigated through compliance with provincial and federal environmental and safety regulations, by maintaining adequate insurance, and by adopting appropriate emergency response and employee safety procedures.
MANA GEMENT’S D ISC USS ION A ND ANAL YSI S 27
The Company is subject to a broad range of laws and regulatory requirements. Changes in government regulations, including reporting requirements, income tax laws, operating practices, environmental protection requirements and royalty rates can have a significant impact on Zargon. Although Zargon has no control over these regulatory risks, the Company actively monitors changes, participates in industry organizations and, when required, engages the assistance of third party experts to assess the impact of such changes on the Company’s financial and operating results.
Zargon relies on access to debt and capital markets to the extent cash distributions/dividends and net capital expenditures exceed cash flows from operating activities. Zargon attempts to reduce these financial and liquidity risks by limiting debt financing to self-imposed debt to funds flow guidelines. Access to capital markets, if required for additional financing by either debt or equity issuances, is dependent upon maintaining strong performance and relationships with investors and funders. A substantial portion of the Company’s accounts receivable is with companies in the oil and gas industry and subject to normal industry credit risks. Management regularly monitors the aging of receivable balances to mitigate this risk. With respect to financial instruments utilized for risk management purposes, the Company partially mitigates associated credit risk by limiting transactions to counterparties with investment grade credit ratings.
Zargon actively manages the risks of its capital programs and reserves by concentrating drilling and subsequent development activities in areas where it has demonstrated proven technical capabilities and understanding. Zargon’s capital budget is managed to limit exposure so that significant capital is not risked on any one project or concept.
The marketability and price of oil and natural gas produced by Zargon is affected by numerous factors beyond its control. The Company’s ability to market its oil and natural gas is dependent in part upon the availability, proximity and capacity of oil and gas gathering systems, pipelines and processing facilities and may be impacted by potential operational problems with such pipelines and facilities, as well as by government regulation relating to price, taxes, royalties, land tenure, and production. If market factors change and inhibit the marketing of our production, overall production volumes or realized prices may decline.
Environmental Regulation and Risk
All phases of the oil and natural gas business present environmental risks and hazards and are subject to environmental regulation pursuant to a variety of federal, provincial and local laws and regulations. In 2002, the Government of Canada ratified the Kyoto Protocol (the “Protocol”), which calls for Canada to reduce its greenhouse gas emissions to specified levels. There has been much public debate with respect to Canada’s ability to meet these targets and the government’s strategy or alternative strategies with respect to climate change and the control of greenhouse gases.
In 2008 the federal government released its Action Plan to Reduce Greenhouse Gases and Air Pollution (the “Action Plan”), also known as “ecoACTION”, which includes the Regulatory Framework for Air Emissions, and the Alberta government has also introduced legislation regarding greenhouse gas emissions.
On March 8, 2007, the Alberta government introduced legislation to reduce greenhouse gas emission intensity. Bill 3 states that facilities emitting more than 100,000 tonnes of greenhouse gases per year must reduce their emissions intensity by 12 percent over the average emissions levels of 2003, 2004 and 2005; if they are not able to do so, these facilities will be required to pay $15 per tonne for every tonne above the 12 percent target, beginning on July 1, 2007. At this time, the Company has determined that there is currently no impact of this legislation on Zargon’s existing facilities ownership.
Although Zargon is not a large emitter of greenhouse gases, the Company continues to monitor developments in this area. Although environmental legislation is evolving in a manner which could result in stricter standards and enforcement, larger fines and liability, and potentially increased capital
28 ZARGON O IL & GA S LTD. 2010 ANNU AL F INAN CIAL REPORT
expenditures and operating costs, at this time it is not possible to predict the impact of these requirements on the Company and its operations and financial condition.
Alberta Royalty and Tax Regime
On February 16, 2007, the Alberta government announced that a review of the province’s royalty and tax regime (including income tax and freehold mineral rights tax) pertaining to oil and gas resources, including oil sands, conventional oil and gas and coalbed methane, would be conducted by a panel of experts with the assistance of individual Albertans and key stakeholders. On September 18, 2007, the Royalty Review Panel delivered its final report and recommendations to the Government of Alberta. The report titled “Our Fair Share”, recommended significant increases to royalties levied on natural gas, conventional oil and oil sands produced in Alberta. On October 25, 2007, the Alberta government released details of its planned implementation of the final Royalty Review Panel report, “The New Royalty Framework” (“NRF”), which took effect on January 1, 2009.
On March 3, 2009, the Government of Alberta announced an incentive program to stimulate new and continued economic activity in Alberta, which included a drilling royalty credit for new conventional oil and natural gas wells and a new well royalty incentive program. The new well incentive program applied to wells commencing production of conventional oil and natural gas between April 1, 2009 and March 31, 2010 and provided for a maximum five percent royalty rate for the first 12 months of production, up to a maximum of 50,000 barrels of oil or 500 million cubic feet of natural gas. On June 25, 2009, the Government of Alberta extended this incentive program by one year to March 31, 2011. The Company adjusted portions of its capital program to take advantage of this program. Credits totalling $4.75 million were recorded as a reduction to field capital expenditures during 2010.
Also included in the Alberta government’s incentive program were royalty formula changes for both oil and liquids and for natural gas, effective January 1, 2011, which are expected to have a positive impact on royalty costs for 2011 and beyond. For oil and liquids, the maximum royalty rate has been reduced from 50 percent to 40 percent and for natural gas the maximum rate has been reduced from 50 percent to 36 percent. Additionally, the price component of each formula has been changed to moderate the increase in rates at the highest price level.
Outlook
With a promising internally generated oil exploitation project inventory and its ability to execute accretive asset and/or corporate acquisitions, Zargon continues to be well positioned to meet its value-creating objectives in 2011 and beyond.
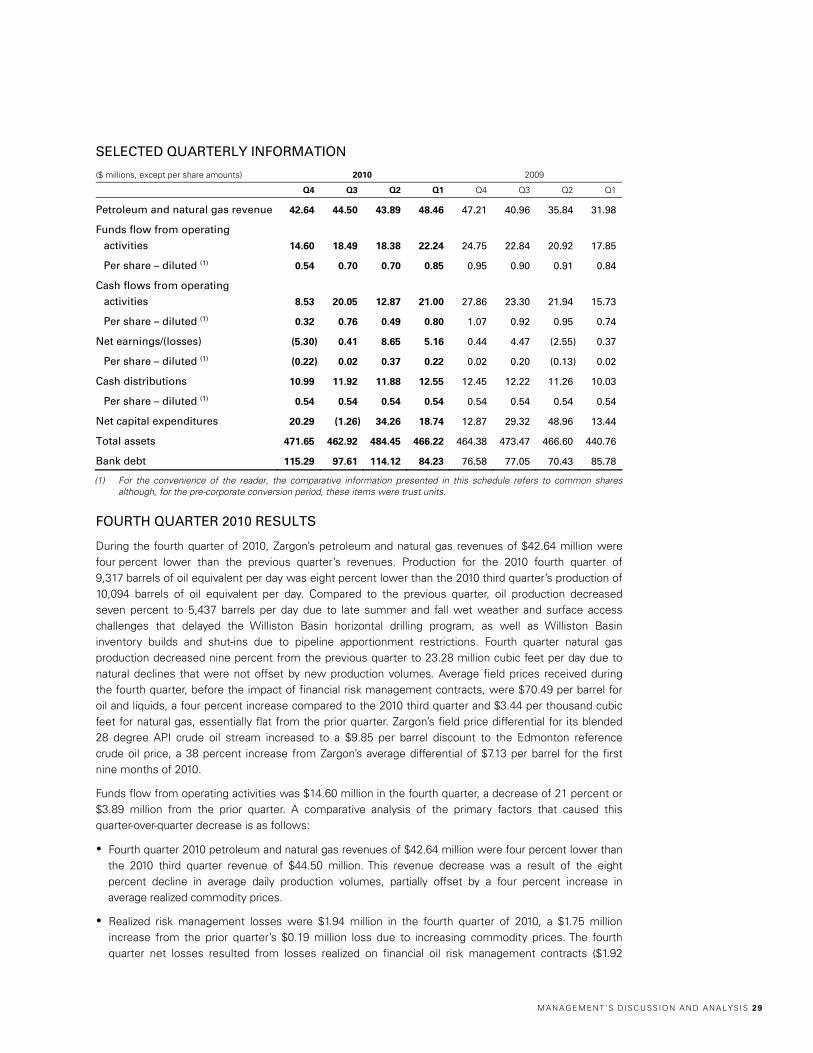
MANA GEMENT’S D ISC USS ION A ND ANAL YSI S 29
SELECTED QUARTERLY INFORMATION
($ millions, except per share amounts) 2010 2009
Q4 Q3 Q2 Q1 Q4 Q3 Q2 Q1
Petroleum and natural gas revenue 42.64 44.50 43.89 48.46 47.21 40.96 35.84 31.98
Funds flow from operating
activities 14.60 18.49 18.38 22.24 24.75 22.84 20.92 17.85
Per share – diluted (1) 0.54 0.70 0.70 0.85 0.95 0.90 0.91 0.84
Cash flows from operating
activities 8.53 20.05 12.87 21.00 27.86 23.30 21.94 15.73
Per share – diluted (1) 0.32 0.76 0.49 0.80 1.07 0.92 0.95 0.74
Net earnings/(losses) (5.30) 0.41 8.65 5.16 0.44 4.47 (2.55) 0.37
Per share – diluted (1) (0.22) 0.02 0.37 0.22 0.02 0.20 (0.13) 0.02
Cash distributions 10.99 11.92 11.88 12.55 12.45 12.22 11.26 10.03
Per share – diluted (1) 0.54 0.54 0.54 0.54 0.54 0.54 0.54 0.54
Net capital expenditures 20.29 (1.26) 34.26 18.74 12.87 29.32 48.96 13.44
Total assets 471.65 462.92 484.45 466.22 464.38 473.47 466.60 440.76
Bank debt 115.29 97.61 114.12 84.23 76.58 77.05 70.43 85.78
(1) For the convenience of the reader, the comparative information presented in this schedule refers to common shares although, for the pre-corporate conversion period, these items were trust units.
FOURTH QUARTER 2010 RESULTS
During the fourth quarter of 2010, Zargon’s petroleum and natural gas revenues of $42.64 million were four percent lower than the previous quarter’s revenues. Production for the 2010 fourth quarter of 9,317 barrels of oil equivalent per day was eight percent lower than the 2010 third quarter’s production of 10,094 barrels of oil equivalent per day. Compared to the previous quarter, oil production decreased seven percent to 5,437 barrels per day due to late summer and fall wet weather and surface access challenges that delayed the Williston Basin horizontal drilling program, as well as Williston Basin inventory builds and shut-ins due to pipeline apportionment restrictions. Fourth quarter natural gas production decreased nine percent from the previous quarter to 23.28 million cubic feet per day due to natural declines that were not offset by new production volumes. Average field prices received during the fourth quarter, before the impact of financial risk management contracts, were $70.49 per barrel for oil and liquids, a four percent increase compared to the 2010 third quarter and $3.44 per thousand cubic feet for natural gas, essentially flat from the prior quarter. Zargon’s field price differential for its blended 28 degree API crude oil stream increased to a $9.85 per barrel discount to the Edmonton reference crude oil price, a 38 percent increase from Zargon’s average differential of $7.13 per barrel for the first nine months of 2010.
Funds flow from operating activities was $14.60 million in the fourth quarter, a decrease of 21 percent or $3.89 million from the prior quarter. A comparative analysis of the primary factors that caused this quarter-over-quarter decrease is as follows:
Fourth quarter 2010 petroleum and natural gas revenues of $42.64 million were four percent lower than the 2010 third quarter revenue of $44.50 million. This revenue decrease was a result of the eight percent decline in average daily production volumes, partially offset by a four percent increase in average realized commodity prices.
Realized risk management losses were $1.94 million in the fourth quarter of 2010, a $1.75 million increase from the prior quarter’s $0.19 million loss due to increasing commodity prices. The fourth quarter net losses resulted from losses realized on financial oil risk management contracts ($1.92
30 ZARGON O IL & GA S LTD. 2010 ANNU AL F INAN CIAL REPORT
million) and on financial electricity management contracts ($0.02 million). Oil and liquids prices strengthened during the 2010 fourth quarter.
Royalties for the fourth quarter were $7.33 million, a decrease of $0.33 million from the prior quarter due mainly to lower production, and as the average royalty rate for the quarter of 17.2 percent was consistent with the 2010 third quarter rate.
Production expenses were $11.54 million for the quarter, four percent lower than the third quarter of 2010. On a per barrel of oil equivalent basis, production expenses increased four percent to $13.47 in the fourth quarter of 2010 compared to $12.91 in the prior quarter. This quarterly increase was due, in part, to decreased production due to wet weather delays pushing back on-production dates from new wells, in addition to pipeline apportionment issues.
General and administrative expenses increased in the fourth quarter by $0.34 million or 10 percent as compared to the third quarter of 2010.
Transaction costs of $0.77 million incurred in the fourth quarter were 72 percent higher than the $0.45 million incurred in the prior quarter, due mainly to legal and consulting fees incurred as a result of the December 31, 2010 corporate conversion.
Interest and financing charges were $1.42 million, an increase of 15 percent or $0.19 million from the prior quarter. The average debt level increased six percent to $108.92 million compared to $102.80 million in the third quarter of 2010, resulting in higher debt servicing charges. Zargon’s interest borrowing rates also increased during the quarter in-line with the borrowing pricing grid established under the terms of Zargon’s credit facilities.
Current income taxes of $0.26 million were $0.06 million lower than in the 2010 third quarter. The decrease was primarily due to the fourth quarter 2010 drilling program in the US, which decreased US corporate taxes and was partially offset by withholding tax paid on dividends declared from Zargon’s US subsidiary to its parent corporation.
Asset retirement expenditures reflect the actual amounts incurred to abandon and reclaim unutilized non-producing wells. These asset retirement expenditures totalled $0.92 million in the 2010 fourth quarter and increased from the prior quarter amount of $0.66 million. The difference between accretion expenses (as reflected on the consolidated statements of earnings and comprehensive income and accumulated earnings) and asset retirement expenditures are a result of the timing differences between the estimating of future expenses and the incurrence of actual expenses during the period.
Net losses for the quarter were $5.30 million, a decrease of $5.71 million compared to the third quarter of 2010 net earnings of $0.41 million, mainly as a result of realized and unrealized risk management losses. Net earnings track the funds flow from operating activities for the respective periods modified by asset retirement expenditures and non-cash charges, which included the following for the fourth quarter of 2010:
Share-based compensation expense increased by $0.01 million during the fourth quarter of 2010 to $0.36 million, a three percent increase from the third quarter.
Depletion and depreciation expense decreased by $0.73 million to $16.26 million in the 2010 fourth quarter. The decreased expense was due to lower production in the fourth quarter, despite the use of an updated depletion and depreciation rate of $18.97 per barrel of oil equivalent, compared to the prior quarter’s $18.30 per barrel of oil equivalent charge.
Unrealized risk management losses in the 2010 fourth quarter of $9.71 million were 104 percent higher than the third quarter losses of $4.76 million. These unrealized losses result from “marking-to-market” financial risk management contracts at each period end. During the fourth quarter, unrealized risk management losses resulted from higher commodity pricing at the December 31, 2010 mark-to-market date when compared to the third quarter September 30, 2010 mark-to-market date. In
MANA GEMENT’S D ISC USS ION A ND ANAL YSI S 31
particular, higher year end futures resulted in unrealized risk management contract oil losses of $9.74 million and electricity contract gains of $0.03 million. The realization and the expiry of certain financial oil contracts also affect the mark-to-market amounts.
The provision for accretion of asset retirement obligations for the 2010 fourth quarter was $0.95 million, up four percent from the prior quarter expense. The small quarter-over-quarter increase is due to changes in the estimated future liability for asset retirement obligations as a result of wells added through Zargon’s drilling program, inclusive of wells acquired/disposed of in the quarter and changes resulting from revisions to the timing and the amounts of the original estimates of undiscounted cash flows.
Unrealized foreign exchange gains of $0.05 million in the 2010 fourth quarter compare to losses of $0.02 million for the prior quarter. Gains and losses result from translations of Zargon’s US subsidiaries into Canadian dollars at rates as determined under the temporal method of converting foreign subsidiaries as required by Canadian GAAP. Relative to the closing foreign exchange rates at September 30, 2010, the increase in the value of the Canadian dollar relative to the US dollar has created nominal non-cash translation gains as recorded in Zargon’s income statement for the fourth quarter.
The future income tax recovery was $5.72 million during the quarter compared to a future income tax recovery of $4.35 million from the third quarter of 2010. The increase was due to a significant increase of losses before taxes of $11.44 million compared to the third quarter losses before taxes of $3.56 million. In summary, the fourth quarter losses before taxes were primarily a result of higher non-cash unrealized risk management contract losses in the quarter.
Reduction in losses due to non-controlling interests pertaining to exchangeable shares was $0.68 million in the 2010 fourth quarter compared to a reduction in earnings of $0.05 million in the third quarter. This was due to a net loss before non-controlling interest in the fourth quarter.
Net capital expenditures were $20.29 million during the fourth quarter of 2010, compared to a prior quarter divestiture amount of $1.26 million (which included $9.36 million for the Oakmont acquisition and divestitures of $21.89 million for the disposition package). During the fourth quarter, Zargon completed a field capital program highlighted by Sunburst horizontal oil exploitation wells in the Alberta Plains South core area, and Mississippian and Bakken (Torquay) horizontal oil exploitation wells in the Williston Basin core area. During the fourth quarter of 2010, 13.8 net wells (Williston Basin – 8.1 net wells, Alberta Plains South – 2.0 net wells, Alberta Plain North – 3.7 net wells) were drilled compared to 4.8 net wells in the third quarter of 2010.
Cash distributions to unitholders declared for the 2010 fourth quarter totalled $10.99 million (excluding the DRIP) ($0.18 per unit per month).
ADDITIONAL INFORMATION
Additional information regarding the Company and its business operations, including the Company’s Annual Information Form for December 31, 2010, is available on the Company’s SEDAR profile at www.sedar.com.
MANAGEMENT’S REPORT
32 ZARGON OIL & GA S LTD. 2010 ANNU AL F INAN CIAL REPORT
The consolidated financial statements of Zargon Oil & Gas Ltd. were prepared by management in accordance with Canadian generally accepted accounting principles. The financial and operating information presented in this annual report is consistent with that shown in the consolidated financial statements.
Management has designed and maintains a system of internal accounting controls that provide reasonable assurance that all transactions are accurately recorded, that the financial statements reliably report the Company’s operations and that the Company’s assets are safeguarded. Timely release of financial information sometimes necessitates the use of estimates when transactions affecting the current accounting period cannot be finalized until future periods. Such estimates are based on careful judgments made by management.
Ernst & Young LLP, an independent chartered accountant firm, was appointed by a resolution of the unitholders to audit the consolidated financial statements of the Company and provide an independent opinion. They have conducted an independent examination of the Company’s accounting records in order to express their opinion on the consolidated financial statements.
The Board of Directors is responsible for ensuring that management fulfills its responsibilities for financial reporting and internal control. The Board of Directors exercises this responsibility through its Audit Committee. The Audit Committee, which consists of non-management directors, has met with Ernst & Young LLP and management in order to determine that management has fulfilled its responsibilities in the preparation of the consolidated financial statements. The Audit Committee has reported its findings to the Board of Directors, who have approved the consolidated financial statements.
C.H. Hansen J.B. Dranchuk President and Chief Executive Officer Vice President, Finance and Chief Financial Officer Calgary, Canada March 9, 2011
AUDITORS’ REPORT
AUDITOR S’ REPO RT 33
To the Shareholders of Zargon Oil & Gas Ltd.
We have audited the accompanying consolidated financial statements of Zargon Oil & Gas Ltd., which comprise the consolidated balance sheets as at December 31, 2010 and 2009, and the consolidated statements of earnings and comprehensive income and accumulated earnings and cash flows for the years then ended, and a summary of significant accounting policies and other explanatory information.
Management's responsibility for the consolidated financial statements
Management is responsible for the preparation and fair presentation of these consolidated financial statements in accordance with Canadian generally accepted accounting principles, and for such internal control as management determines is necessary to enable the preparation of consolidated financial statements that are free from material misstatement, whether due to fraud or error.
Auditors’ responsibility
Our responsibility is to express an opinion on these consolidated financial statements based on our audits. We conducted our audits in accordance with Canadian generally accepted auditing standards. Those standards require that we comply with ethical requirements and plan and perform the audit to obtain reasonable assurance about whether the consolidated financial statements are free from material misstatement.
An audit involves performing procedures to obtain audit evidence about the amounts and disclosures in the consolidated financial statements. The procedures selected depend on the auditors’ judgment, including the assessment of the risks of material misstatement of the consolidated financial statements, whether due to fraud or error. In making those risk assessments, the auditors consider internal control relevant to the entity's preparation and fair presentation of the consolidated financial statements in order to design audit procedures that are appropriate in the circumstances, but not for the purpose of expressing an opinion on the effectiveness of the entity's internal control. An audit also includes evaluating the appropriateness of accounting policies used and the reasonableness of accounting estimates made by management, as well as evaluating the overall presentation of the consolidated financial statements.
We believe that the audit evidence we have obtained in our audits is sufficient and appropriate to provide a basis for our audit opinion.
Opinion
In our opinion, the consolidated financial statements present fairly, in all material respects, the financial position of the Company as at December 31, 2010 and 2009 and the results of its operations and its cash flows for the years then ended in accordance with Canadian generally accepted accounting principles.
Calgary, Canada March 9, 2011 Chartered Accountants
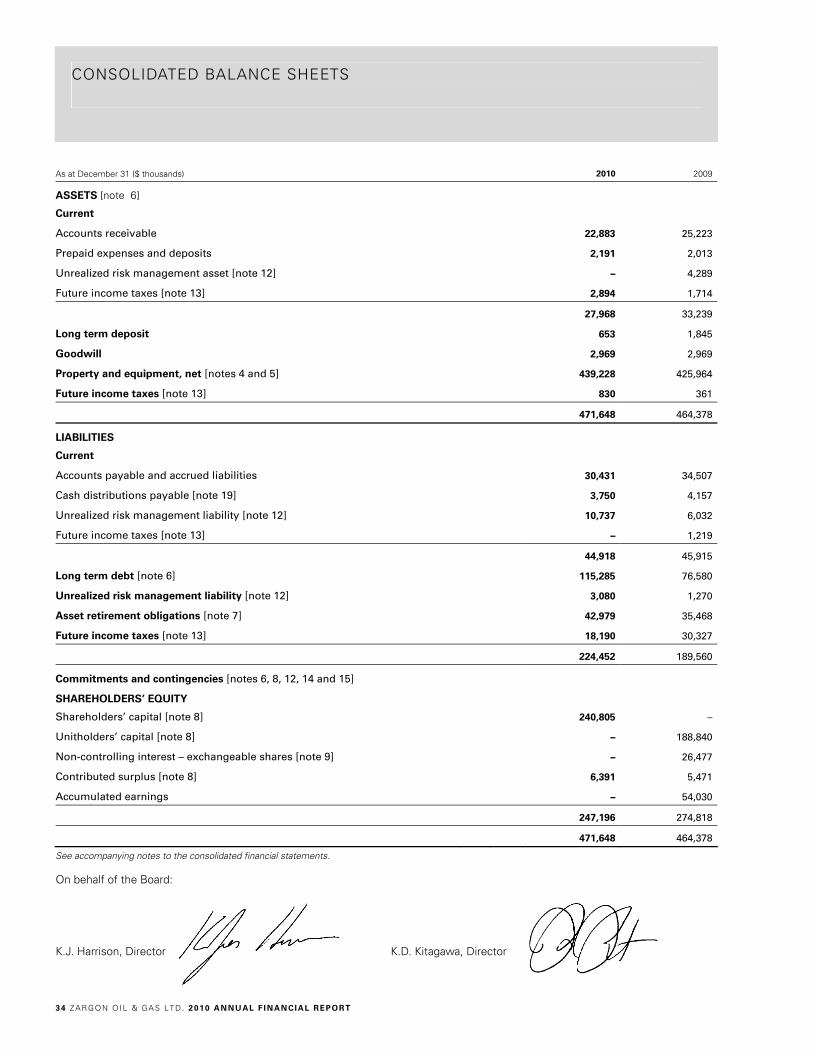
CONSOLIDATED BALANCE SHEETS
34 ZARGON O IL & GA S LTD. 2010 ANNU AL F INAN CIAL REPORT
As at December 31 ($ thousands) 2010 2009
ASSETS [note 6]
Current
Accounts receivable 22,883 25,223
Prepaid expenses and deposits 2,191 2,013
Unrealized risk management asset [note 12] – 4,289
Future income taxes [note 13] 2,894 1,714
27,968 33,239
Long term deposit 653 1,845
Goodwill 2,969 2,969
Property and equipment, net [notes 4 and 5] 439,228 425,964
Future income taxes [note 13] 830 361
471,648 464,378
LIABILITIES
Current
Accounts payable and accrued liabilities 30,431 34,507
Cash distributions payable [note 19] 3,750 4,157
Unrealized risk management liability [note 12] 10,737 6,032
Future income taxes [note 13] – 1,219
44,918 45,915
Long term debt [note 6] 115,285 76,580
Unrealized risk management liability [note 12] 3,080 1,270
Asset retirement obligations [note 7] 42,979 35,468
Future income taxes [note 13] 18,190 30,327
224,452 189,560
Commitments and contingencies [notes 6, 8, 12, 14 and 15]
SHAREHOLDERS’ EQUITY
Shareholders’ capital [note 8] 240,805 –
Unitholders’ capital [note 8] – 188,840
Non-controlling interest – exchangeable shares [note 9] – 26,477
Contributed surplus [note 8] 6,391 5,471
Accumulated earnings – 54,030
247,196 274,818
471,648 464,378
See accompanying notes to the consolidated financial statements.
On behalf of the Board:
K.J. Harrison, Director K.D. Kitagawa, Director
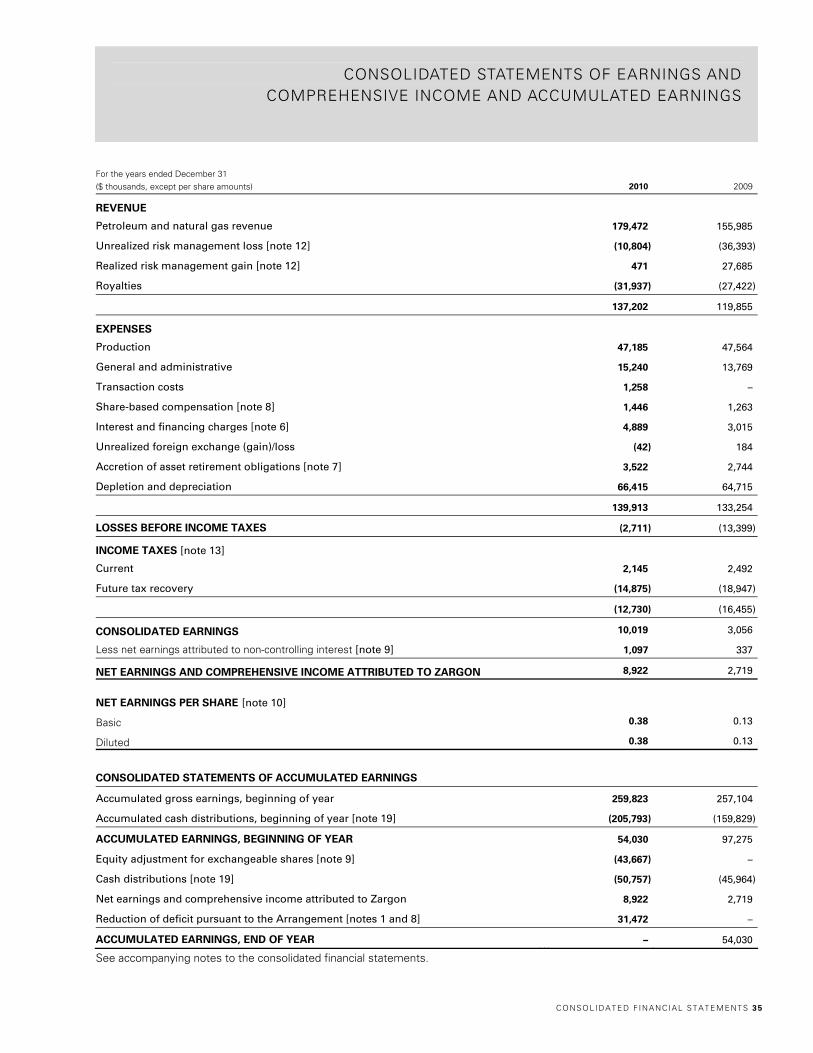
CONSOLIDATED STATEMENTS OF EARNINGS AND COMPREHENSIVE INCOME AND ACCUMULATED EARNINGS
CONSOLI DATED F INANCIAL STAT EMENTS 35
For the years ended December 31 ($ thousands, except per share amounts) 2010 2009
REVENUE
Petroleum and natural gas revenue 179,472 155,985
Unrealized risk management loss [note 12] (10,804) (36,393)
Realized risk management gain [note 12] 471 27,685
Royalties (31,937) (27,422)
137,202 119,855
EXPENSES
Production 47,185 47,564
General and administrative 15,240 13,769
Transaction costs 1,258 –
Share-based compensation [note 8] 1,446 1,263
Interest and financing charges [note 6] 4,889 3,015
Unrealized foreign exchange (gain)/loss (42) 184
Accretion of asset retirement obligations [note 7] 3,522 2,744
Depletion and depreciation 66,415 64,715
139,913 133,254
LOSSES BEFORE INCOME TAXES (2,711) (13,399)
INCOME TAXES [note 13]
Current 2,145 2,492
Future tax recovery (14,875) (18,947)
(12,730) (16,455)
CONSOLIDATED EARNINGS 10,019 3,056
Less net earnings attributed to non-controlling interest [note 9] 1,097 337
NET EARNINGS AND COMPREHENSIVE INCOME ATTRIBUTED TO ZARGON 8,922 2,719
NET EARNINGS PER SHARE [note 10]
Basic 0.38 0.13
Diluted 0.38 0.13
CONSOLIDATED STATEMENTS OF ACCUMULATED EARNINGS
Accumulated gross earnings, beginning of year 259,823 257,104
Accumulated cash distributions, beginning of year [note 19] (205,793) (159,829)
ACCUMULATED EARNINGS, BEGINNING OF YEAR 54,030 97,275
Equity adjustment for exchangeable shares [note 9] (43,667) –
Cash distributions [note 19] (50,757) (45,964)
Net earnings and comprehensive income attributed to Zargon 8,922 2,719
Reduction of deficit pursuant to the Arrangement [notes 1 and 8] 31,472 –
ACCUMULATED EARNINGS, END OF YEAR – 54,030
See accompanying notes to the consolidated financial statements.
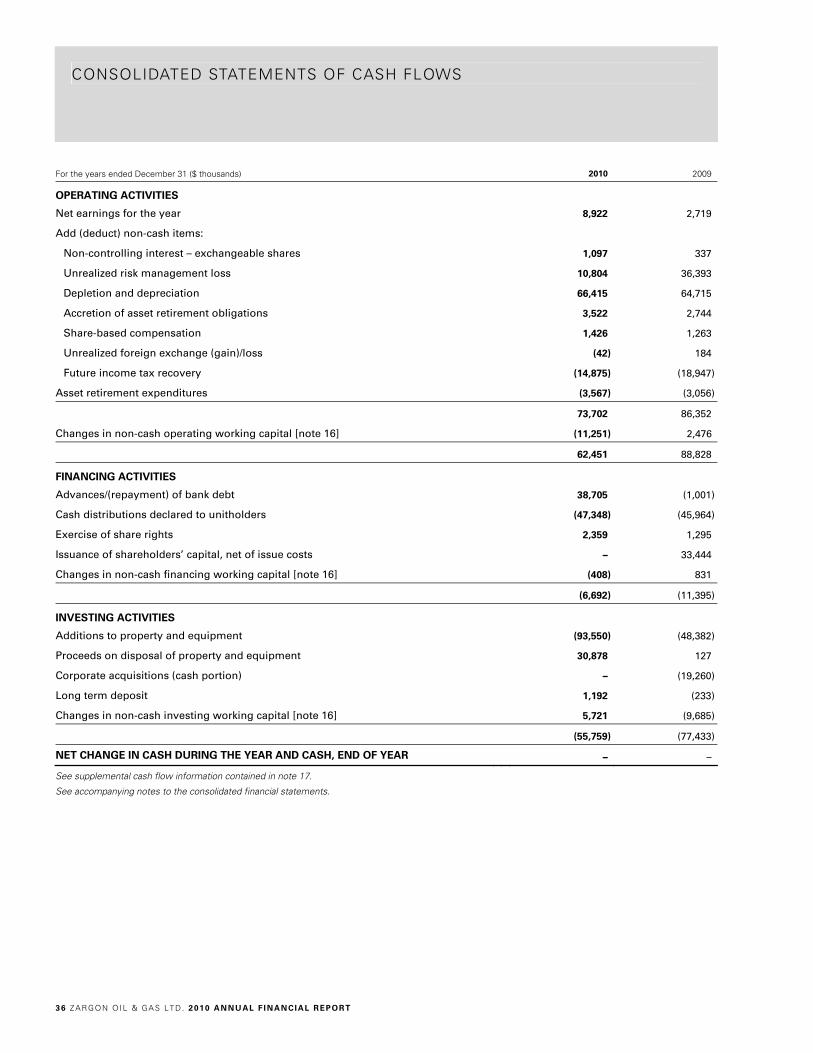
CONSOLIDATED STATEMENTS OF CASH FLOWS
36 ZARGON O IL & GA S LTD. 2010 ANNU AL F INAN CIAL REPORT
For the years ended December 31 ($ thousands) 2010 2009
OPERATING ACTIVITIES
Net earnings for the year 8,922 2,719
Add (deduct) non-cash items:
Non-controlling interest – exchangeable shares 1,097 337
Unrealized risk management loss 10,804 36,393
Depletion and depreciation 66,415 64,715
Accretion of asset retirement obligations 3,522 2,744
Share-based compensation 1,426 1,263
Unrealized foreign exchange (gain)/loss (42) 184
Future income tax recovery (14,875) (18,947)
Asset retirement expenditures (3,567) (3,056)
73,702 86,352
Changes in non-cash operating working capital [note 16] (11,251) 2,476
62,451 88,828
FINANCING ACTIVITIES
Advances/(repayment) of bank debt 38,705 (1,001)
Cash distributions declared to unitholders (47,348) (45,964)
Exercise of share rights 2,359 1,295
Issuance of shareholders’ capital, net of issue costs – 33,444
Changes in non-cash financing working capital [note 16] (408) 831
(6,692) (11,395)
INVESTING ACTIVITIES
Additions to property and equipment (93,550) (48,382)
Proceeds on disposal of property and equipment 30,878 127
Corporate acquisitions (cash portion) – (19,260)
Long term deposit 1,192 (233)
Changes in non-cash investing working capital [note 16] 5,721 (9,685)
(55,759) (77,433)
NET CHANGE IN CASH DURING THE YEAR AND CASH, END OF YEAR – –
See supplemental cash flow information contained in note 17.
See accompanying notes to the consolidated financial statements.
NOTES TO THE CONSOLIDATED FINANCIAL STATEMENTS
NOTES TO THE C ONSOLI DATED F I NANCIAL STATEMENTS 37
December 31, 2010 and 2009
All amounts are stated in Canadian dollars unless otherwise noted.
1. STRUCTURE OF THE COMPANY
On December 31, 2010, Zargon Energy Trust (the “Trust”) completed the conversion from an income trust into a dividend paying corporation, Zargon Oil & Gas Ltd. (“the Company” or “Zargon”), pursuant to a Plan of Arrangement (the “Arrangement”) under the Business Corporations Act (Alberta). Under the Arrangement, unitholders received, for each trust unit held, one common share of the Company. Exchangeable shareholders received 1.84716 common shares of the Company for each exchangeable share held as determined in accordance with the terms of the Arrangement. As a result, at December 31, 2010, Zargon had 27.05 million common shares issued and outstanding and no remaining exchangeable shares. There were no changes to the underlying business of the Company and the Board of Directors and senior management remained unchanged. Additional information regarding the Arrangement can be found in the Information Circular dated November 10, 2010.
The conversion of the Trust into a corporation has been accounted for using the continuity of interest method. Accordingly, the consolidated financial statements for the year ended December 31, 2010 reflect the financial position, results of operations and cash flows as if the Company had always carried on the business of the Trust. All comparative figures referred to in the consolidated financial statements are the previous consolidated results of the Trust. For the convenience of the reader, when discussing prior periods, the consolidated financial statements, where appropriate, refer to common shares, shareholders, share rights and dividends although for the pre-conversion period such items were trust units, unitholders, trust unit rights and distributions, respectively.
Zargon is a publicly traded corporation incorporated in Canada with its head office located in Calgary, Alberta. The consolidated financial statements of the Company for the years ended December 31, 2010 and December 31, 2009 comprise the Company and its wholly owned subsidiaries. The Company is engaged in the exploration for and development and production of oil and natural gas and conducts many of its activities jointly with others; these financial statements reflect only the Company’s proportionate interest in such activities.
Pursuant to the Arrangement, the shareholders’ capital was reduced by the amount of the deficit on December 31, 2010 of $31.47 million.
The Company’s principal business activity is the exploration for and development and production of petroleum and natural gas in Canada and the United States (“US”).
2. SUMMARY OF SIGNIFICANT ACCOUNTING POLICIES
Basis of Presentation and Consolidation
These consolidated financial statements have been prepared by management in accordance with Canadian generally accepted accounting principles (“GAAP”). Effective January 1, 2011, Zargon will be required to prepare consolidated financial statements in accordance with International Financial Reporting Standards (“IFRS”). Because a precise determination of many assets and liabilities is dependent upon future events, the preparation of periodic financial statements necessarily involves the use of estimates and approximations. Accordingly, actual results could differ materially from those estimates. The consolidated financial statements have, in management’s opinion, been properly prepared within reasonable limits of materiality and within the framework of the Company’s accounting policies summarized below.
The consolidated financial statements include the accounts of Zargon Oil & Gas Ltd., all of its subsidiaries and a partnership. All subsidiaries and the partnership are directly or indirectly owned and their operations are fully reflected in the consolidated financial statements.
Revenue Recognition
Revenue associated with the sale of crude oil, natural gas, and natural gas liquids is recognized when title and risks pass to the purchaser, normally at the plant gate which is the pipeline delivery point for natural gas and at the contracted delivery point for crude oil.
Joint Operations
A portion of the petroleum and natural gas operations of the Company are conducted jointly with others, and accordingly, these consolidated financial statements reflect only the proportionate interests of the Company in such activities.
Property and Equipment
The Company follows the full cost method of accounting for its oil and natural gas operations whereby all costs relating to the acquisition, exploration and development of oil and natural gas reserves are capitalized and accumulated in separate cost centres for Canada and the
38 ZARGON O IL & GA S LTD. 2010 ANNU AL F INAN CIAL REPORT
United States. Such costs include land acquisition costs, annual carrying charges of non-producing properties, geological and geophysical costs and costs of drilling and equipping wells.
Depletion and depreciation of petroleum, natural gas properties and equipment is computed using the unit of production method based on the estimated proved reserves of petroleum and natural gas before royalties determined by independent consultants. For purposes of this calculation, reserves are converted to common units on the basis that six thousand cubic feet of natural gas is equivalent to one barrel of oil. A portion of the cost of petroleum and natural gas rights relating to undeveloped properties is excluded from the depletion calculation. Twenty percent of the year end balance of these costs is added to the depletion base each year. Proceeds on the disposal of petroleum and natural gas properties are applied against capitalized costs, with gains or losses not ordinarily recognized, unless such a disposal would result in a change in the depletion rate of 20 percent or more.
Depreciation of office equipment is provided using the declining balance method at an annual rate of 20 percent. Leasehold improvements are depreciated over the term of the lease.
Impairment Test
The Company applies an impairment test to petroleum, natural gas properties and equipment costs on a quarterly basis or more frequently as events or circumstances dictate. This impairment test is performed on both the Canadian and US cost centres. An impairment loss exists when the carrying amount of the Company’s petroleum, natural gas properties and equipment exceeds the estimated undiscounted future net cash flows associated with the Company’s proved reserves (before royalties). If an impairment loss is determined to exist, the costs carried on the consolidated balance sheets in excess of the fair value of the Company’s proved and probable reserves plus the cost of unproved properties are charged to earnings. Reserves are determined pursuant to evaluation by independent engineers as dictated by National Instrument 51-101.
Goodwill
The Company must record goodwill relating to a corporate acquisition when the total purchase price exceeds the fair value for accounting purposes of the net identifiable assets and liabilities of the acquired company. The goodwill balance is assessed for impairment annually at year end or as events occur that could result in an indication of impairment. Impairment is recognized based on the fair value of the reporting entity (consolidated Company) compared to the book value of the reporting entity. If the fair value of the consolidated Company is less than the book value, impairment is measured by allocating the fair value of the consolidated Company to the identifiable assets and liabilities as if the Company had been acquired in a business combination for a purchase price equal to its fair value. The excess of the fair value of the consolidated Company over the amounts assigned to the identifiable assets and liabilities is the fair value of the goodwill. Any excess of the book value of goodwill over this implied fair value of goodwill is the impairment amount. Impairment is charged to earnings in the period in which it occurs.
Goodwill is stated at cost less impairment and is not amortized.
At December 31, 2010 an impairment test was performed and it was determined that there was no impairment to the goodwill balance (December 31, 2009 – nil).
Asset Retirement Obligations
Zargon recognizes the fair value of an Asset Retirement Obligation (“ARO”) in the period in which it is incurred when a reasonable estimate of the fair value can be made. The fair value of the estimated ARO is recorded as a liability, with a corresponding increase in the carrying amount of the related asset. The capitalized amount is depleted on the unit of production method based on proved reserves (before royalties). The liability amount is increased each reporting period due to the passage of time and the amount of accretion is expensed in the period. Actual costs incurred upon the settlement of the ARO are charged against the liability.
Financial Instruments
All financial instruments are required to be measured at fair value on initial recognition of the instrument, except for certain related party transactions. Measurement in subsequent periods depends on whether the financial instrument has been classified as “held-for-trading”, “available-for-sale”, “held-to-maturity”, “loans and receivables”, or “other financial liabilities” as defined by the Canadian Institute of Chartered Accountants (“CICA”) Handbook Section 3855.
Financial assets and financial liabilities classified as “held-for-trading” are measured at fair value with changes in fair value recognized in earnings. Financial assets classified as “available-for-sale” are measured at fair value, with changes in fair value recognized in other comprehensive income (“OCI”) until the asset is removed from the consolidated balance sheets. Financial assets classified as “held-to-
NOTES TO THE C ONSOLI DATED F I NANCIAL STATEMENTS 39
maturity”, “loans and receivables” and “other financial liabilities” are measured at amortized cost using the effective interest method of amortization.
Derivative financial instruments are utilized to reduce commodity price risk associated with the Company’s production of oil and natural gas. The base prices for the commodities are sometimes denominated in US dollars and the Company may also use such financial instruments to reduce the related foreign currency risk. Financial instruments may also be used from time to time to reduce interest rate risk on outstanding debt. The Company does not enter into financial instruments for trading or speculative purposes.
The Company follows a policy of using risk management instruments such as fixed price swaps, forward sales, puts and costless collars. The objective is to partially offset or mitigate the wide price swings commonly encountered in oil and natural gas commodities and in so doing protect a minimum level of cash flow in periods of low commodity prices.
Electricity price contracts are utilized to hedge anticipated purchases of electricity to manage the Company’s exposure to price fluctuations, which impact production expenses.
The Company considers these financial risk management contracts to be effective on an economic basis, but has decided not to designate these contracts as hedges for accounting purposes and, accordingly, for outstanding contracts not designated as hedges, an unrealized gain or loss is recorded based on the change in fair value (“mark-to-market”) of the contracts at each reporting period end. These instruments have been recorded as unrealized risk management assets/liabilities in the consolidated balance sheets.
In the case of forward sales, the instrument can sometimes be satisfied by physical delivery. In the case of physical delivery, the payment/receipt is recorded as part of the normal revenue stream.
Foreign currency collar and swap agreements are utilized to manage the risk inherent in producing commodities whose price is based directly or indirectly on US dollars, using notional principal amounts equal to the projected monthly revenue from their sale. Payments or charges are calculated and paid according to the terms of the agreement, usually with monthly settlement.
The Company had no interest rate financial instruments at December 31, 2010 and 2009.
Income Taxes
The Company follows the liability method of tax allocation in accounting for income taxes. Under this method, the Company records future income taxes for the effect of any differences between the accounting and income tax basis of an asset or liability using income tax rates expected to apply in the periods in which these temporary differences are expected to be recovered or settled. The effect on future income tax assets and liabilities of a change in tax rates is recognized in earnings in the period in which the change is substantively enacted.
Foreign Currency Translation
The Company uses the temporal method of foreign currency translation whereby the monetary assets and liabilities recorded in a foreign currency are translated into Canadian dollars at year end exchange rates, and non-monetary assets and liabilities at the exchange rates prevailing when the assets were acquired or liability incurred. Revenues and expenses are translated at the average rate of exchange prevailing during the year. Gains and losses on translation are included in the consolidated statements of earnings and comprehensive income and accumulated earnings.
Common Share Rights and Share-Based Compensation
Under the Company’s share options incentive plans (the “Plans”), options to purchase common shares were granted to directors, officers, employees and other service providers at market prices. The Plans allow for the exercise price of options to be reduced in future periods by an amount that distributions/dividends exceed a stated return on assets. Under the fair value method of accounting for share-based compensation, the cost of the option is charged to earnings with an offsetting amount recorded in contributed surplus, based on an estimate from the fair value model. Forfeiture of options is recorded as a reduction in expense in the period in which it occurs if the options have not yet vested.
Per Share Amounts
Per share amounts are calculated using the weighted average number of common shares outstanding during the year. Diluted per share amounts are calculated using the treasury stock method to determine the dilutive effect of share-based compensation. The Company follows the treasury stock method, which assumes that the proceeds received from “in-the-money” common share options and unrecognized future share-based compensation expense are used to repurchase shares at the average market rate during the year. Diluted
40 ZARGON O IL & GA S LTD. 2010 ANNU AL F INAN CIAL REPORT
per share amounts also include exchangeable shares using the “if-converted” method, whereby it is assumed the conversion of the exchangeable shares occurs at the beginning of the reporting period (or at the time of issuance if later) where applicable.
Measurement Uncertainty
The amounts recorded for depletion and depreciation of property and equipment and the assessment of these assets for impairment are based on estimates of proved reserves, production rates, petroleum and natural gas prices, future costs and other relevant assumptions. By their nature, these estimates are subject to measurement uncertainty and the impact on the consolidated financial statements of changes in such estimates in future periods could be material.
Inherent in the fair value calculation of asset retirement obligations are numerous assumptions and judgments including the ultimate settlement amounts, inflation factors, credit adjusted discount rates, timing of settlement and changes in the legal and regulatory environments. To the extent future revisions to these assumptions impact the fair value of the existing asset retirement obligation liability, a corresponding adjustment is made to the property and equipment balance.
Cash Distributions/Dividends
In 2010, the Trust declared monthly distributions of cash to unitholders of record on the last day of each calendar month. Pursuant to the Trust policy, it paid distributions to its unitholders subject to satisfying its financing covenants. Such distributions are recorded as distributions of equity upon declaration of the distribution. Commencing in 2011, the Company will declare monthly dividends of cash to shareholders of record on the last day of each calendar month. Pursuant to the Company’s policy, it will pay dividends to its shareholders subject to satisfying its financing covenants and the requirements of the Business Corporations Act (Alberta). Such dividends are recorded as distributions of equity upon declaration of the dividend.
3. CHANGES IN ACCOUNTING POLICIES
Business Combinations
On January 1, 2010, the Company adopted the CICA Handbook Section 1582 “Business Combinations”, replacing Section 1581 of the same name. Under this new guidance, the purchase price used in a business combination is based on the fair value of shares exchanged at the date of exchange and contingent liabilities are to be recognized at fair value at the acquisition date and re-measured at fair value with changes recorded through earnings each period until settled. In addition, this new guidance generally requires all transaction costs to be expensed and negative goodwill to be recognized immediately in earnings. The provisions of this new Section were applied to the acquisition of Oakmont Energy Ltd. (see note 4 to the consolidated financial statements).
Consolidated Financial Statements
On January 1, 2010, the Company adopted the CICA Handbook Section 1601 “Consolidated Financial Statements”, replacing Section 1600 of the same name. This guidance requires uniform accounting policies to be consistent throughout all consolidated entities and the difference between reporting dates of a parent and a subsidiary to be no longer than three months. The adoption of this Section did not have an impact on the Company’s consolidated financial statements.
Non-Controlling Interest
On January 1, 2010, the Company adopted the CICA Handbook Section 1602 “Non-Controlling Interests”, which replaces Section 1600 “Consolidated Financial Statements”. Commencing in 2010, non-controlling interest (“NCI”) is presented within equity. Under this new guidance, when there is a loss or gain of control, the Company’s previously held interest is re-valued at fair value. In addition, NCI may be reported at fair value or at the proportionate share of the fair value of the acquired net assets and allocation of the net income to the NCI will be on this basis. The adoption of this Section has reclassified the NCI from liabilities to equity on the Company’s consolidated balance sheet. Additionally, in accordance with EIC-151 “Exchangeable Securities Issued by Subsidiaries of Income Trusts”, each redemption of exchangeable shares was accounted for as a step-purchase and resulted in an increase in property and equipment and in the future income tax liability. This treatment ceased with the adoption of Handbook Section 1602 whereby redemptions subsequent to January 1, 2010 have been recorded against accumulated earnings rather than as increases to property and equipment and the future tax liability.
The above CICA Handbook Sections are converged with International Financial Reporting Standards.
NOTES TO THE C ONSOLI DATED F I NANCIAL STATEMENTS 41
4. ACQUISITIONS
Oakmont Energy Ltd.
On September 9, 2010, the Company acquired all of the outstanding shares of Oakmont Energy Ltd. (“Oakmont”), a private oil and gas company, for consideration of $5.95 million. Consideration consisted of the issuance of 335,574 Zargon common shares valued at $17.72 per share.
These consolidated financial statements incorporate the results of operations of the acquired Oakmont properties from September 9, 2010. For the period September 9, 2010 to December 31, 2010, Zargon recorded revenue from oil, natural gas and natural gas liquids of $0.91 million in respect of the acquired assets. Had the acquisition occurred on January 1, 2010, for the 12 months ended December 31, 2010, Zargon estimates that its pro forma revenue would have been approximately $3.84 million.
The acquisition was accounted for by the purchase method and the preliminary purchase price allocation is as follows:
Net Assets Acquired
($ thousands)
Property and equipment 12,403
Working capital deficiency (3,410)
Future income tax liability (56)
Asset retirement obligations (2,991)
Total net assets acquired 5,946
Consideration
($ thousands)
Common shares issued (1) 5,946
Total purchase price 5,946
(1) For the convenience of the reader, the information presented in this schedule refers to common shares although, for the pre-corporate conversion period, these items were trust units.
Acquisition costs for the transaction of $0.13 million have been included in Transaction Costs on the consolidated statements of earnings and comprehensive income and accumulated earnings as a result of the adoption of Section 1582 “Business Combinations” effective January 1, 2010.
Churchill Energy Inc.
On September 23, 2009, the Company acquired all of the outstanding shares of Churchill Energy Inc. (“Churchill”), a public oil and gas company, for consideration of $9.74 million. Consideration consisted of $0.11 million cash, the issuance of 554,669 Zargon common shares valued at $16.87 per share and acquisition costs of $0.27 million.
The results of operations for Churchill have been included in the consolidated financial statements since September 23, 2009.
The acquisition was accounted for by the purchase method and the purchase price allocation is as follows:
Net Assets Acquired
($ thousands)
Property and equipment 9,794
Working capital deficiency (6,576)
Future income tax asset 8,920
Asset retirement obligations (2,403)
Total net assets acquired 9,735
42 ZARGON O IL & GA S LTD. 2010 ANNU AL F INAN CIAL REPORT
Consideration
($ thousands)
Cash 108
Common shares issued (1) 9,357
Acquisition costs 270
Total purchase price 9,735
(1) For the convenience of the reader, the information presented in this schedule refers to common shares although, for the pre-corporate conversion period, these items were trust units.
Masters Energy Inc.
On April 29, 2009, the Company acquired all of the outstanding shares of Masters Energy Inc. (“Masters”), a public oil and gas company, for consideration of $27.10 million. Consideration consisted of $5.70 million cash, the issuance of 1,475,468 Zargon common shares valued at $14.26 per share and acquisition costs of $0.36 million. Zargon assumed Masters’ long term debt, which was repaid on the closing date of the acquisition.
The results of operations for Masters have been included in the consolidated financial statements since April 29, 2009.
The acquisition was accounted for by the purchase method and the purchase price allocation is as follows:
Net Assets Acquired
($ thousands)
Property and equipment 44,030
Working capital deficiency (105)
Long term debt (12,825)
Future income tax asset 69
Asset retirement obligations (4,072)
Total net assets acquired 27,097
Consideration
($ thousands)
Cash 5,700
Common shares issued (1) 21,040
Acquisition costs 357
Total purchase price 27,097
(1) For the convenience of the reader, the information presented in this schedule refers to common shares although, for the pre-corporate conversion period, these items were trust units.
5. PROPERTY AND EQUIPMENT
December 31, 2010
($ thousands) Cost Accumulated Depletion
and Depreciation Net Book
Value
Petroleum, natural gas properties and other equipment (1) 850,138 413,144 436,994
Leasehold improvements and office equipment 4,798 2,564 2,234
854,936 415,708 439,228
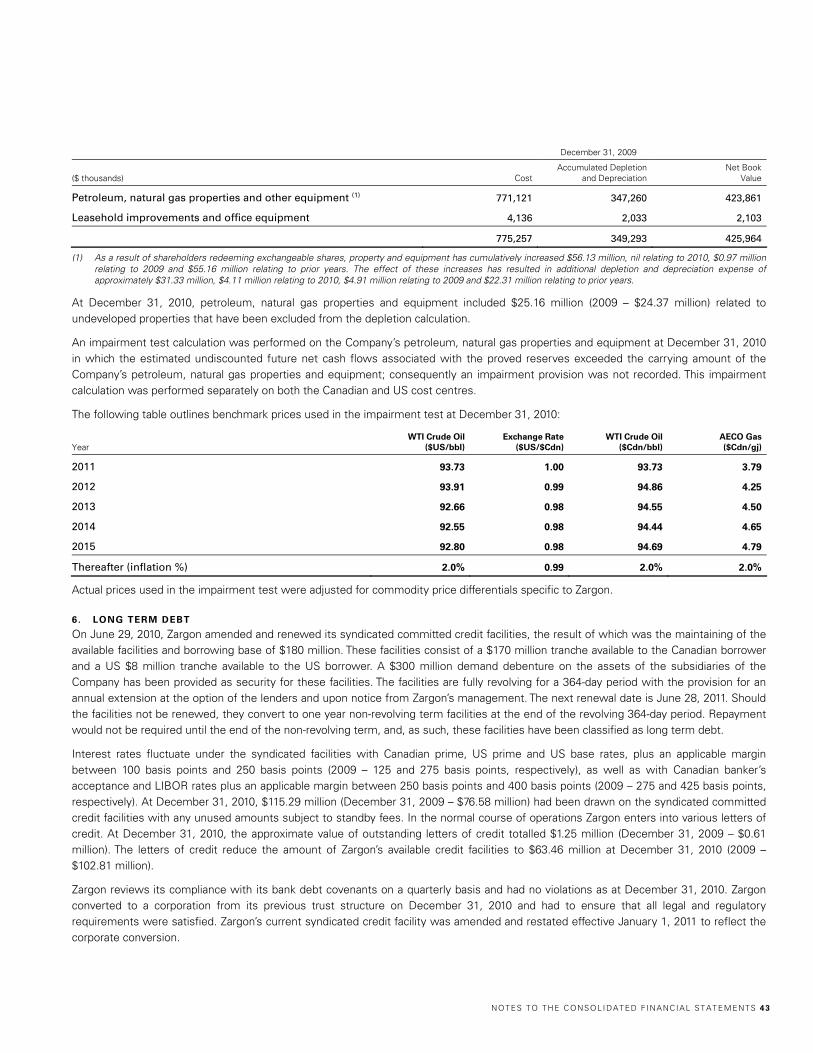
NOTES TO THE C ONSOLI DATED F I NANCIAL STATEMENTS 43
December 31, 2009
($ thousands) Cost Accumulated Depletion
and Depreciation Net Book
Value
Petroleum, natural gas properties and other equipment (1) 771,121 347,260 423,861
Leasehold improvements and office equipment 4,136 2,033 2,103
775,257 349,293 425,964
(1) As a result of shareholders redeeming exchangeable shares, property and equipment has cumulatively increased $56.13 million, nil relating to 2010, $0.97 million relating to 2009 and $55.16 million relating to prior years. The effect of these increases has resulted in additional depletion and depreciation expense of approximately $31.33 million, $4.11 million relating to 2010, $4.91 million relating to 2009 and $22.31 million relating to prior years.
At December 31, 2010, petroleum, natural gas properties and equipment included $25.16 million (2009 – $24.37 million) related to undeveloped properties that have been excluded from the depletion calculation.
An impairment test calculation was performed on the Company’s petroleum, natural gas properties and equipment at December 31, 2010 in which the estimated undiscounted future net cash flows associated with the proved reserves exceeded the carrying amount of the Company’s petroleum, natural gas properties and equipment; consequently an impairment provision was not recorded. This impairment calculation was performed separately on both the Canadian and US cost centres.
The following table outlines benchmark prices used in the impairment test at December 31, 2010:
Year WTI Crude Oil
($US/bbl) Exchange Rate
($US/$Cdn) WTI Crude Oil
($Cdn/bbl) AECO Gas ($Cdn/gj)
2011 93.73 1.00 93.73 3.79
2012 93.91 0.99 94.86 4.25
2013 92.66 0.98 94.55 4.50
2014 92.55 0.98 94.44 4.65
2015 92.80 0.98 94.69 4.79
Thereafter (inflation %) 2.0% 0.99 2.0% 2.0%
Actual prices used in the impairment test were adjusted for commodity price differentials specific to Zargon.
6. LONG TERM DEBT
On June 29, 2010, Zargon amended and renewed its syndicated committed credit facilities, the result of which was the maintaining of the available facilities and borrowing base of $180 million. These facilities consist of a $170 million tranche available to the Canadian borrower and a US $8 million tranche available to the US borrower. A $300 million demand debenture on the assets of the subsidiaries of the Company has been provided as security for these facilities. The facilities are fully revolving for a 364-day period with the provision for an annual extension at the option of the lenders and upon notice from Zargon’s management. The next renewal date is June 28, 2011. Should the facilities not be renewed, they convert to one year non-revolving term facilities at the end of the revolving 364-day period. Repayment would not be required until the end of the non-revolving term, and, as such, these facilities have been classified as long term debt.
Interest rates fluctuate under the syndicated facilities with Canadian prime, US prime and US base rates, plus an applicable margin between 100 basis points and 250 basis points (2009 – 125 and 275 basis points, respectively), as well as with Canadian banker’s acceptance and LIBOR rates plus an applicable margin between 250 basis points and 400 basis points (2009 – 275 and 425 basis points, respectively). At December 31, 2010, $115.29 million (December 31, 2009 – $76.58 million) had been drawn on the syndicated committed credit facilities with any unused amounts subject to standby fees. In the normal course of operations Zargon enters into various letters of credit. At December 31, 2010, the approximate value of outstanding letters of credit totalled $1.25 million (December 31, 2009 – $0.61 million). The letters of credit reduce the amount of Zargon’s available credit facilities to $63.46 million at December 31, 2010 (2009 – $102.81 million).
Zargon reviews its compliance with its bank debt covenants on a quarterly basis and had no violations as at December 31, 2010. Zargon converted to a corporation from its previous trust structure on December 31, 2010 and had to ensure that all legal and regulatory requirements were satisfied. Zargon’s current syndicated credit facility was amended and restated effective January 1, 2011 to reflect the corporate conversion.
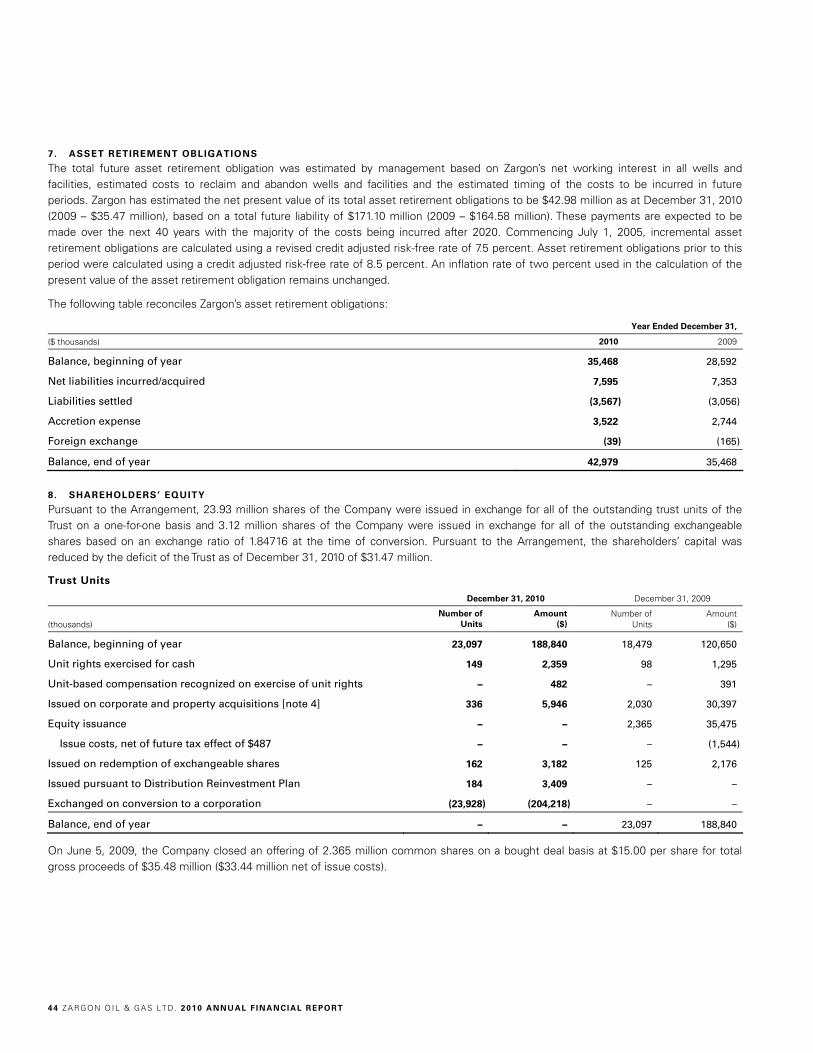
44 ZARGON O IL & GA S LTD. 2010 ANNU AL F INAN CIAL REPORT
7. ASSET RETIREMENT OBLIGATIONS
The total future asset retirement obligation was estimated by management based on Zargon’s net working interest in all wells and facilities, estimated costs to reclaim and abandon wells and facilities and the estimated timing of the costs to be incurred in future periods. Zargon has estimated the net present value of its total asset retirement obligations to be $42.98 million as at December 31, 2010 (2009 – $35.47 million), based on a total future liability of $171.10 million (2009 – $164.58 million). These payments are expected to be made over the next 40 years with the majority of the costs being incurred after 2020. Commencing July 1, 2005, incremental asset retirement obligations are calculated using a revised credit adjusted risk-free rate of 7.5 percent. Asset retirement obligations prior to this period were calculated using a credit adjusted risk-free rate of 8.5 percent. An inflation rate of two percent used in the calculation of the present value of the asset retirement obligation remains unchanged.
The following table reconciles Zargon’s asset retirement obligations:
Year Ended December 31,
($ thousands) 2010 2009
Balance, beginning of year 35,468 28,592
Net liabilities incurred/acquired 7,595 7,353
Liabilities settled (3,567) (3,056)
Accretion expense 3,522 2,744
Foreign exchange (39) (165)
Balance, end of year 42,979 35,468
8. SHAREHOLDERS’ EQUITY
Pursuant to the Arrangement, 23.93 million shares of the Company were issued in exchange for all of the outstanding trust units of the Trust on a one-for-one basis and 3.12 million shares of the Company were issued in exchange for all of the outstanding exchangeable shares based on an exchange ratio of 1.84716 at the time of conversion. Pursuant to the Arrangement, the shareholders’ capital was reduced by the deficit of the Trust as of December 31, 2010 of $31.47 million.
Trust Units
December 31, 2010 December 31, 2009
(thousands) Number of
Units Amount
($) Number of
Units Amount
($)
Balance, beginning of year 23,097 188,840 18,479 120,650
Unit rights exercised for cash 149 2,359 98 1,295
Unit-based compensation recognized on exercise of unit rights – 482 – 391
Issued on corporate and property acquisitions [note 4] 336 5,946 2,030 30,397
Equity issuance – – 2,365 35,475
Issue costs, net of future tax effect of $487 – – – (1,544)
Issued on redemption of exchangeable shares 162 3,182 125 2,176
Issued pursuant to Distribution Reinvestment Plan 184 3,409 – –
Exchanged on conversion to a corporation (23,928) (204,218) – –
Balance, end of year – – 23,097 188,840
On June 5, 2009, the Company closed an offering of 2.365 million common shares on a bought deal basis at $15.00 per share for total gross proceeds of $35.48 million ($33.44 million net of issue costs).
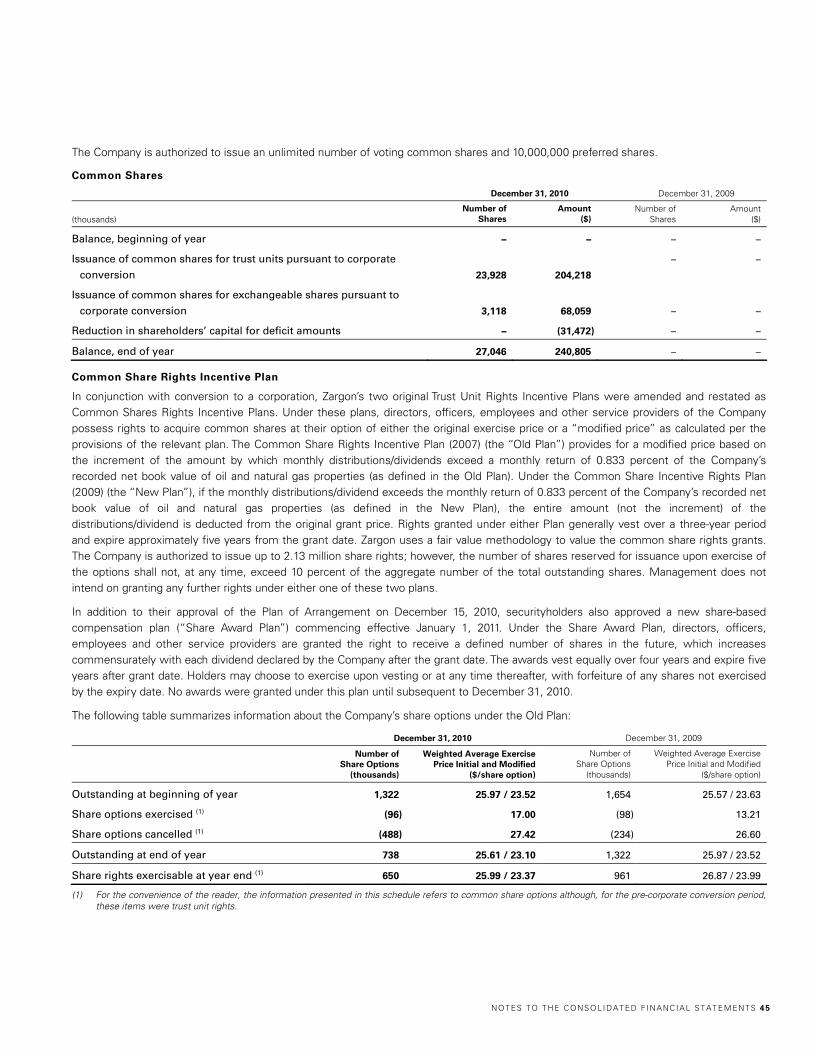
NOTES TO THE C ONSOLI DATED F I NANCIAL STATEMENTS 4 5
The Company is authorized to issue an unlimited number of voting common shares and 10,000,000 preferred shares.
Common Shares
December 31, 2010 December 31, 2009
(thousands) Number of
Shares Amount
($) Number of
Shares Amount
($)
Balance, beginning of year – – – –
Issuance of common shares for trust units pursuant to corporate
conversion 23,928 204,218
– –
Issuance of common shares for exchangeable shares pursuant to
corporate conversion 3,118 68,059 – –
Reduction in shareholders’ capital for deficit amounts – (31,472) – –
Balance, end of year 27,046 240,805 – –
Common Share Rights Incentive Plan
In conjunction with conversion to a corporation, Zargon’s two original Trust Unit Rights Incentive Plans were amended and restated as Common Shares Rights Incentive Plans. Under these plans, directors, officers, employees and other service providers of the Company possess rights to acquire common shares at their option of either the original exercise price or a “modified price” as calculated per the provisions of the relevant plan. The Common Share Rights Incentive Plan (2007) (the “Old Plan”) provides for a modified price based on the increment of the amount by which monthly distributions/dividends exceed a monthly return of 0.833 percent of the Company’s recorded net book value of oil and natural gas properties (as defined in the Old Plan). Under the Common Share Incentive Rights Plan (2009) (the “New Plan”), if the monthly distributions/dividend exceeds the monthly return of 0.833 percent of the Company’s recorded net book value of oil and natural gas properties (as defined in the New Plan), the entire amount (not the increment) of the distributions/dividend is deducted from the original grant price. Rights granted under either Plan generally vest over a three-year period and expire approximately five years from the grant date. Zargon uses a fair value methodology to value the common share rights grants. The Company is authorized to issue up to 2.13 million share rights; however, the number of shares reserved for issuance upon exercise of the options shall not, at any time, exceed 10 percent of the aggregate number of the total outstanding shares. Management does not intend on granting any further rights under either one of these two plans.
In addition to their approval of the Plan of Arrangement on December 15, 2010, securityholders also approved a new share-based compensation plan (“Share Award Plan”) commencing effective January 1, 2011. Under the Share Award Plan, directors, officers, employees and other service providers are granted the right to receive a defined number of shares in the future, which increases commensurately with each dividend declared by the Company after the grant date. The awards vest equally over four years and expire five years after grant date. Holders may choose to exercise upon vesting or at any time thereafter, with forfeiture of any shares not exercised by the expiry date. No awards were granted under this plan until subsequent to December 31, 2010.
The following table summarizes information about the Company’s share options under the Old Plan:
December 31, 2010 December 31, 2009
Number of Share Options
(thousands)
Weighted Average Exercise Price Initial and Modified
($/share option)
Number of Share Options
(thousands)
Weighted Average Exercise Price Initial and Modified
($/share option)
Outstanding at beginning of year 1,322 25.97 / 23.52 1,654 25.57 / 23.63
Share options exercised (1) (96) 17.00 (98) 13.21
Share options cancelled (1) (488) 27.42 (234) 26.60
Outstanding at end of year 738 25.61 / 23.10 1,322 25.97 / 23.52
Share rights exercisable at year end (1) 650 25.99 / 23.37 961 26.87 / 23.99
(1) For the convenience of the reader, the information presented in this schedule refers to common share options although, for the pre-corporate conversion period, these items were trust unit rights.
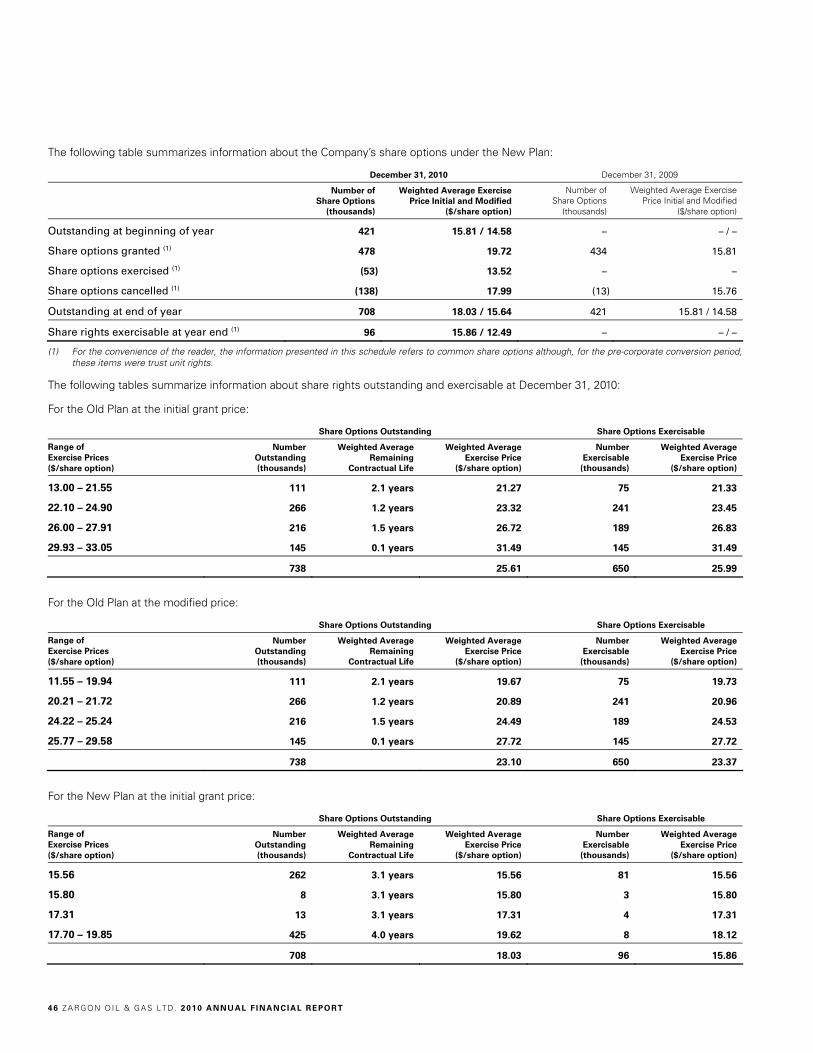
46 ZARGON O IL & GA S LTD. 2010 ANNU AL F INAN CIAL REPORT
The following table summarizes information about the Company’s share options under the New Plan:
December 31, 2010 December 31, 2009
Number of Share Options
(thousands)
Weighted Average Exercise Price Initial and Modified
($/share option)
Number of Share Options
(thousands)
Weighted Average Exercise Price Initial and Modified
($/share option)
Outstanding at beginning of year 421 15.81 / 14.58 – – / –
Share options granted (1) 478 19.72 434 15.81
Share options exercised (1) (53) 13.52 – –
Share options cancelled (1) (138) 17.99 (13) 15.76
Outstanding at end of year 708 18.03 / 15.64 421 15.81 / 14.58
Share rights exercisable at year end (1) 96 15.86 / 12.49 – – / –
(1) For the convenience of the reader, the information presented in this schedule refers to common share options although, for the pre-corporate conversion period, these items were trust unit rights.
The following tables summarize information about share rights outstanding and exercisable at December 31, 2010:
For the Old Plan at the initial grant price:
Share Options Outstanding Share Options Exercisable
Range of Exercise Prices ($/share option)
Number Outstanding (thousands)
Weighted Average Remaining
Contractual Life
Weighted Average Exercise Price
($/share option)
Number Exercisable (thousands)
Weighted Average Exercise Price
($/share option)
13.00 – 21.55 111 2.1 years 21.27 75 21.33
22.10 – 24.90 266 1.2 years 23.32 241 23.45
26.00 – 27.91 216 1.5 years 26.72 189 26.83
29.93 – 33.05 145 0.1 years 31.49 145 31.49
738 25.61 650 25.99
For the Old Plan at the modified price:
Share Options Outstanding Share Options Exercisable
Range of Exercise Prices ($/share option)
Number Outstanding (thousands)
Weighted Average Remaining
Contractual Life
Weighted Average Exercise Price
($/share option)
Number Exercisable (thousands)
Weighted Average Exercise Price
($/share option)
11.55 – 19.94 111 2.1 years 19.67 75 19.73
20.21 – 21.72 266 1.2 years 20.89 241 20.96
24.22 – 25.24 216 1.5 years 24.49 189 24.53
25.77 – 29.58 145 0.1 years 27.72 145 27.72
738 23.10 650 23.37
For the New Plan at the initial grant price:
Share Options Outstanding Share Options Exercisable
Range of Exercise Prices ($/share option)
Number Outstanding (thousands)
Weighted Average Remaining
Contractual Life
Weighted Average Exercise Price
($/share option)
Number Exercisable (thousands)
Weighted Average Exercise Price
($/share option)
15.56 262 3.1 years 15.56 81 15.56
15.80 8 3.1 years 15.80 3 15.80
17.31 13 3.1 years 17.31 4 17.31
17.70 – 19.85 425 4.0 years 19.62 8 18.12
708 18.03 96 15.86
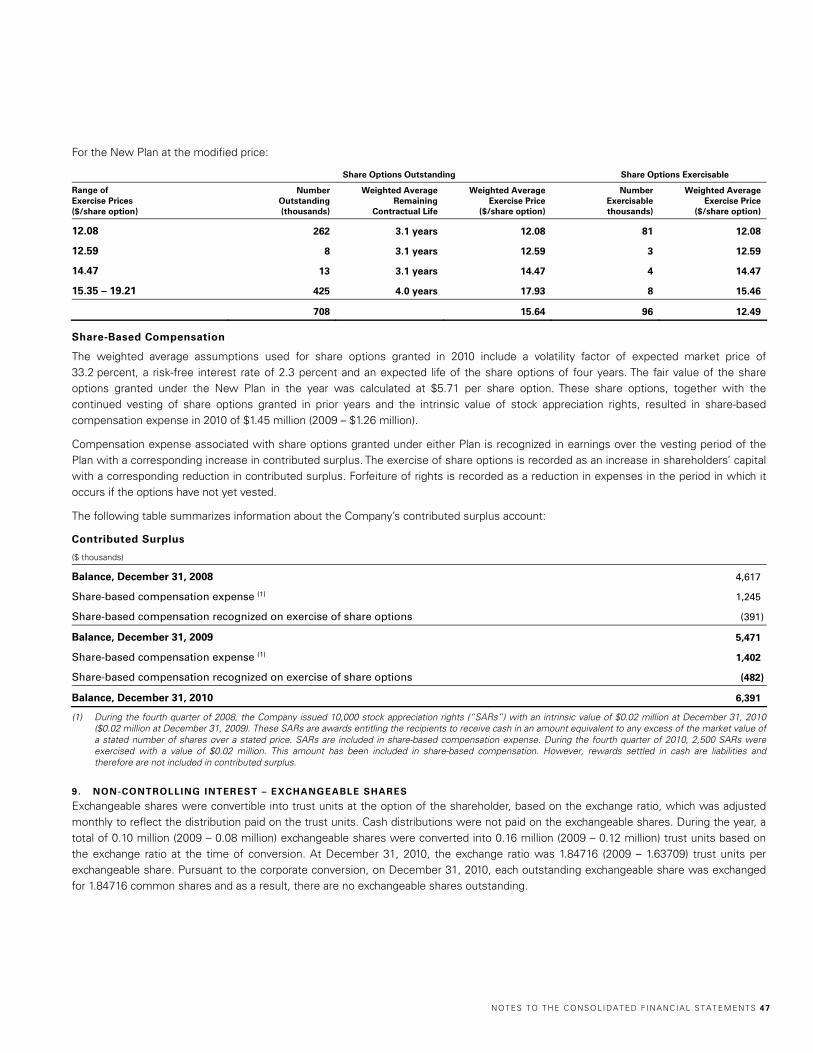
NOTES TO THE C ONSOLI DATED F I NANCIAL STATEMENTS 47
For the New Plan at the modified price:
Share Options Outstanding Share Options Exercisable
Range of Exercise Prices ($/share option)
Number Outstanding (thousands)
Weighted Average Remaining
Contractual Life
Weighted Average Exercise Price
($/share option)
Number Exercisable thousands)
Weighted Average Exercise Price
($/share option)
12.08 262 3.1 years 12.08 81 12.08
12.59 8 3.1 years 12.59 3 12.59
14.47 13 3.1 years 14.47 4 14.47
15.35 – 19.21 425 4.0 years 17.93 8 15.46
708 15.64 96 12.49
Share-Based Compensation
The weighted average assumptions used for share options granted in 2010 include a volatility factor of expected market price of 33.2 percent, a risk-free interest rate of 2.3 percent and an expected life of the share options of four years. The fair value of the share options granted under the New Plan in the year was calculated at $5.71 per share option. These share options, together with the continued vesting of share options granted in prior years and the intrinsic value of stock appreciation rights, resulted in share-based compensation expense in 2010 of $1.45 million (2009 – $1.26 million).
Compensation expense associated with share options granted under either Plan is recognized in earnings over the vesting period of the Plan with a corresponding increase in contributed surplus. The exercise of share options is recorded as an increase in shareholders’ capital with a corresponding reduction in contributed surplus. Forfeiture of rights is recorded as a reduction in expenses in the period in which it occurs if the options have not yet vested.
The following table summarizes information about the Company’s contributed surplus account:
Contributed Surplus
($ thousands)
Balance, December 31, 2008 4,617
Share-based compensation expense (1) 1,245
Share-based compensation recognized on exercise of share options (391)
Balance, December 31, 2009 5,471
Share-based compensation expense (1) 1,402
Share-based compensation recognized on exercise of share options (482)
Balance, December 31, 2010 6,391
(1) During the fourth quarter of 2008, the Company issued 10,000 stock appreciation rights (“SARs”) with an intrinsic value of $0.02 million at December 31, 2010 ($0.02 million at December 31, 2009). These SARs are awards entitling the recipients to receive cash in an amount equivalent to any excess of the market value of a stated number of shares over a stated price. SARs are included in share-based compensation expense. During the fourth quarter of 2010, 2,500 SARs were exercised with a value of $0.02 million. This amount has been included in share-based compensation. However, rewards settled in cash are liabilities and therefore are not included in contributed surplus.
9. NON-CONTROLLING INTEREST – EXCHANGEABLE SHARES
Exchangeable shares were convertible into trust units at the option of the shareholder, based on the exchange ratio, which was adjusted monthly to reflect the distribution paid on the trust units. Cash distributions were not paid on the exchangeable shares. During the year, a total of 0.10 million (2009 – 0.08 million) exchangeable shares were converted into 0.16 million (2009 – 0.12 million) trust units based on the exchange ratio at the time of conversion. At December 31, 2010, the exchange ratio was 1.84716 (2009 – 1.63709) trust units per exchangeable share. Pursuant to the corporate conversion, on December 31, 2010, each outstanding exchangeable share was exchanged for 1.84716 common shares and as a result, there are no exchangeable shares outstanding.
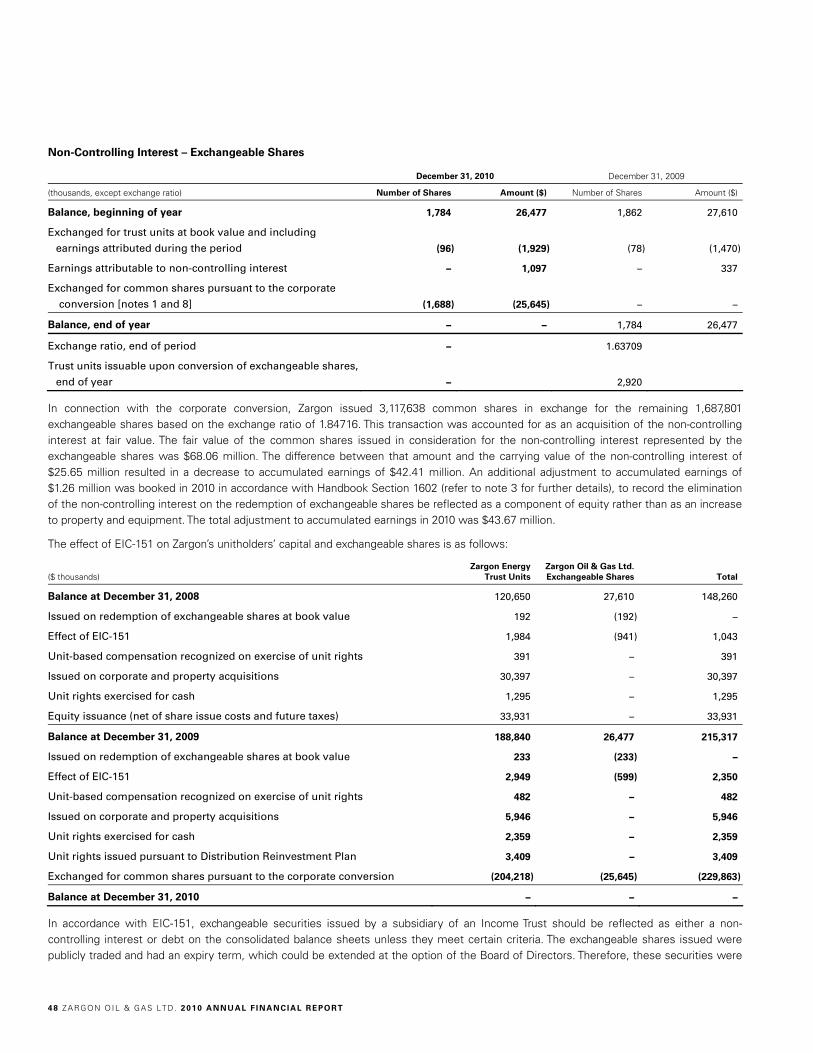
48 ZARGON O IL & GA S LTD. 2010 ANNU AL F INAN CIAL REPORT
Non-Controlling Interest – Exchangeable Shares
December 31, 2010 December 31, 2009
(thousands, except exchange ratio) Number of Shares Amount ($) Number of Shares Amount ($)
Balance, beginning of year 1,784 26,477 1,862 27,610
Exchanged for trust units at book value and including
earnings attributed during the period (96) (1,929) (78) (1,470)
Earnings attributable to non-controlling interest – 1,097 – 337
Exchanged for common shares pursuant to the corporate
conversion [notes 1 and 8] (1,688) (25,645) – –
Balance, end of year – – 1,784 26,477
Exchange ratio, end of period – 1.63709
Trust units issuable upon conversion of exchangeable shares,
end of year – 2,920
In connection with the corporate conversion, Zargon issued 3,117,638 common shares in exchange for the remaining 1,687,801 exchangeable shares based on the exchange ratio of 1.84716. This transaction was accounted for as an acquisition of the non-controlling interest at fair value. The fair value of the common shares issued in consideration for the non-controlling interest represented by the exchangeable shares was $68.06 million. The difference between that amount and the carrying value of the non-controlling interest of $25.65 million resulted in a decrease to accumulated earnings of $42.41 million. An additional adjustment to accumulated earnings of $1.26 million was booked in 2010 in accordance with Handbook Section 1602 (refer to note 3 for further details), to record the elimination of the non-controlling interest on the redemption of exchangeable shares be reflected as a component of equity rather than as an increase to property and equipment. The total adjustment to accumulated earnings in 2010 was $43.67 million.
The effect of EIC-151 on Zargon’s unitholders’ capital and exchangeable shares is as follows:
($ thousands) Zargon Energy
Trust Units Zargon Oil & Gas Ltd. Exchangeable Shares Total
Balance at December 31, 2008 120,650 27,610 148,260
Issued on redemption of exchangeable shares at book value 192 (192) –
Effect of EIC-151 1,984 (941) 1,043
Unit-based compensation recognized on exercise of unit rights 391 – 391
Issued on corporate and property acquisitions 30,397 – 30,397
Unit rights exercised for cash 1,295 – 1,295
Equity issuance (net of share issue costs and future taxes) 33,931 – 33,931
Balance at December 31, 2009 188,840 26,477 215,317
Issued on redemption of exchangeable shares at book value 233 (233) –
Effect of EIC-151 2,949 (599) 2,350
Unit-based compensation recognized on exercise of unit rights 482 – 482
Issued on corporate and property acquisitions 5,946 – 5,946
Unit rights exercised for cash 2,359 – 2,359
Unit rights issued pursuant to Distribution Reinvestment Plan 3,409 – 3,409
Exchanged for common shares pursuant to the corporate conversion (204,218) (25,645) (229,863)
Balance at December 31, 2010 – – –
In accordance with EIC-151, exchangeable securities issued by a subsidiary of an Income Trust should be reflected as either a non-controlling interest or debt on the consolidated balance sheets unless they meet certain criteria. The exchangeable shares issued were publicly traded and had an expiry term, which could be extended at the option of the Board of Directors. Therefore, these securities were
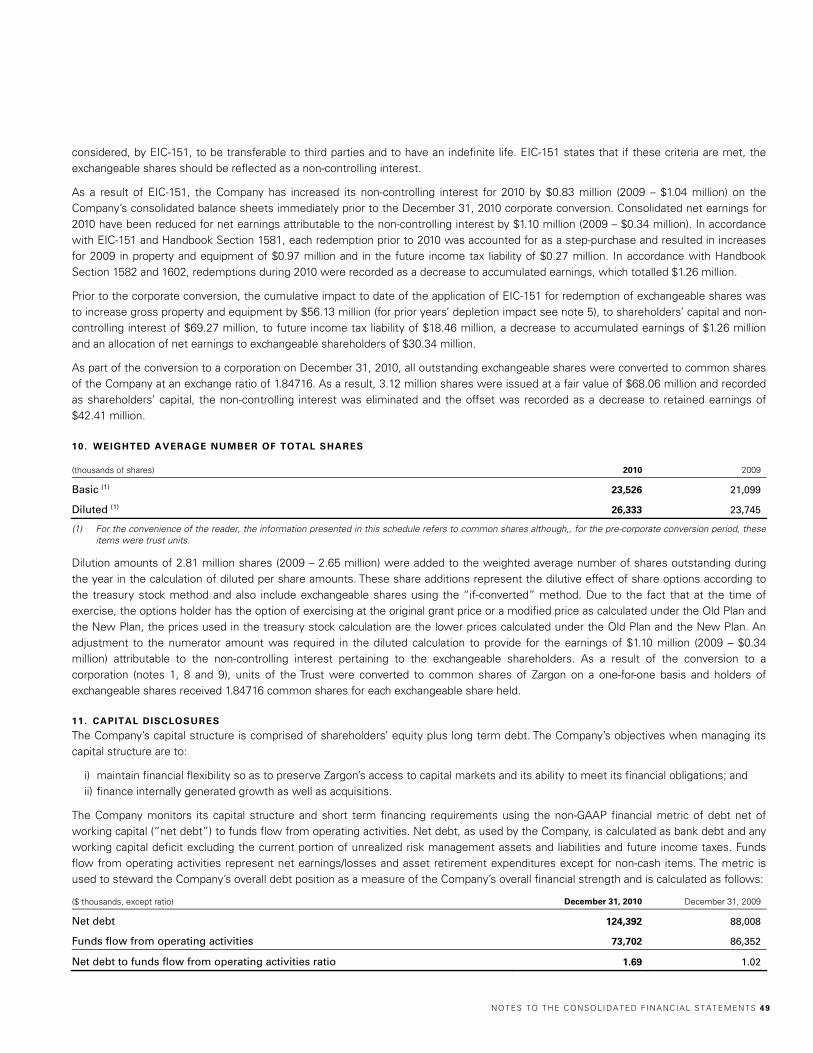
NOTES TO THE C ONSOLI DATED F I NANCIAL STATEMENTS 49
considered, by EIC-151, to be transferable to third parties and to have an indefinite life. EIC-151 states that if these criteria are met, the exchangeable shares should be reflected as a non-controlling interest.
As a result of EIC-151, the Company has increased its non-controlling interest for 2010 by $0.83 million (2009 – $1.04 million) on the Company’s consolidated balance sheets immediately prior to the December 31, 2010 corporate conversion. Consolidated net earnings for 2010 have been reduced for net earnings attributable to the non-controlling interest by $1.10 million (2009 – $0.34 million). In accordance with EIC-151 and Handbook Section 1581, each redemption prior to 2010 was accounted for as a step-purchase and resulted in increases for 2009 in property and equipment of $0.97 million and in the future income tax liability of $0.27 million. In accordance with Handbook Section 1582 and 1602, redemptions during 2010 were recorded as a decrease to accumulated earnings, which totalled $1.26 million.
Prior to the corporate conversion, the cumulative impact to date of the application of EIC-151 for redemption of exchangeable shares was to increase gross property and equipment by $56.13 million (for prior years’ depletion impact see note 5), to shareholders’ capital and non-controlling interest of $69.27 million, to future income tax liability of $18.46 million, a decrease to accumulated earnings of $1.26 million and an allocation of net earnings to exchangeable shareholders of $30.34 million.
As part of the conversion to a corporation on December 31, 2010, all outstanding exchangeable shares were converted to common shares of the Company at an exchange ratio of 1.84716. As a result, 3.12 million shares were issued at a fair value of $68.06 million and recorded as shareholders’ capital, the non-controlling interest was eliminated and the offset was recorded as a decrease to retained earnings of $42.41 million.
10. WEIGHTED AVERAGE NUMBER OF TOTAL SHARES (thousands of shares) 2010 2009
Basic (1) 23,526 21,099
Diluted (1) 26,333 23,745
(1) For the convenience of the reader, the information presented in this schedule refers to common shares although,, for the pre-corporate conversion period, these items were trust units.
Dilution amounts of 2.81 million shares (2009 – 2.65 million) were added to the weighted average number of shares outstanding during the year in the calculation of diluted per share amounts. These share additions represent the dilutive effect of share options according to the treasury stock method and also include exchangeable shares using the “if-converted” method. Due to the fact that at the time of exercise, the options holder has the option of exercising at the original grant price or a modified price as calculated under the Old Plan and the New Plan, the prices used in the treasury stock calculation are the lower prices calculated under the Old Plan and the New Plan. An adjustment to the numerator amount was required in the diluted calculation to provide for the earnings of $1.10 million (2009 – $0.34 million) attributable to the non-controlling interest pertaining to the exchangeable shareholders. As a result of the conversion to a corporation (notes 1, 8 and 9), units of the Trust were converted to common shares of Zargon on a one-for-one basis and holders of exchangeable shares received 1.84716 common shares for each exchangeable share held.
11. CAPITAL DISCLOSURES
The Company’s capital structure is comprised of shareholders’ equity plus long term debt. The Company’s objectives when managing its capital structure are to:
i) maintain financial flexibility so as to preserve Zargon’s access to capital markets and its ability to meet its financial obligations; and ii) finance internally generated growth as well as acquisitions.
The Company monitors its capital structure and short term financing requirements using the non-GAAP financial metric of debt net of working capital (“net debt”) to funds flow from operating activities. Net debt, as used by the Company, is calculated as bank debt and any working capital deficit excluding the current portion of unrealized risk management assets and liabilities and future income taxes. Funds flow from operating activities represent net earnings/losses and asset retirement expenditures except for non-cash items. The metric is used to steward the Company’s overall debt position as a measure of the Company’s overall financial strength and is calculated as follows:
($ thousands, except ratio) December 31, 2010 December 31, 2009
Net debt 124,392 88,008
Funds flow from operating activities 73,702 86,352
Net debt to funds flow from operating activities ratio 1.69 1.02
50 ZAR GON O IL & GA S LTD. 2010 ANNU AL F INAN CIAL REPORT
As at December 31, 2010, Zargon’s net debt to funds flow from operating activities ratio was 1.69, an increase from 1.02 at December 31, 2009. This increase was primarily a result of increased long term debt due to Zargon’s field capital expenditures and net property and corporate acquisitions. On June 29, 2010, Zargon amended and renewed its syndicated committed credit facilities of $180 million. The next renewal date is June 28, 2011. These facilities continue to be available for general corporate purposes and the potential acquisition of oil and natural gas properties. The Company converted to a corporation from its previous trust structure on December 31, 2010. Zargon’s current syndicated credit facility was amended and restated effective January 1, 2011 to reflect the corporate conversion.
To manage its capital structure, the Company may adjust capital spending, adjust dividends paid to shareholders, issue new shares, issue new debt or repay existing debt.
The Company’s capital management objectives, evaluation measures, definitions and targets have remained unchanged over the periods presented. Zargon is subject to certain financial covenants in its credit facility agreements and is in compliance with all financial covenants.
Zargon reviews its compliance with its bank debt covenants on a quarterly basis and had no violations as at December 31, 2010.
12. F INANCIAL INSTRUMENTS AND RISK MANAGEMENT CONTRACTS
Fair Value of Financial Assets and Liabilities
Zargon’s financial assets and liabilities are comprised of accounts receivable, deposits, accounts payable, cash distributions payable, unrealized risk management assets and liabilities and long term debt. Fair values of financial assets and liabilities, summarized information related to risk management positions and discussion of risks associated with financial assets and liabilities are presented as follows:
A) Fair Value of Financial Assets and Liabilities
Accounts receivable are designated as “loans and receivables”. Accounts payable and accrued liabilities, cash distributions payable and long term debt are designated as “other liabilities”. The fair values of these accounts approximate their carrying amounts.
Risk management assets and liabilities are derivative financial instruments classified as “held-for-trading”. These accounts are recorded at their estimated fair value using quoted market prices.
Financial instruments of the Company carried on the consolidated balance sheets are carried at amortized cost with the exception of risk management contracts, which are carried at fair value.
All of the Company’s risk management contracts are transacted in active markets. The Company classifies the fair value of these transactions according to the following hierarchy based on the amount of observable inputs used to value the instrument.
- Level I
Quoted prices are available in active markets for identical assets or liabilities as of the reporting date. Active markets are those in which transactions occur in sufficient frequency and volume to provide pricing information on an ongoing basis.
- Level II
Pricing inputs are other than quoted prices in active markets included in Level I. Prices in Level II are either directly or indirectly observable as of the reporting date. Level II valuations are based on inputs, including quoted forward prices for commodities, time value and volatility factors, which are can be substantially observed or corroborated in the marketplace.
- Level III
Valuations in this level are those with inputs for the asset or liability that are not based on observable market data.
The Company’s risk management contracts have been assessed on the fair value hierarchy described above. The Company’s risk management contracts are classified as Level II. Assessment of the significance of a particular input into the fair value measurement requires judgment and may affect the placement within the fair value hierarchy level.
B) Risk Management Assets and Liabilities
The Company is a party to certain financial instruments that have fixed the price of a portion of its oil production and electricity rates. The Company enters into these contracts for risk management purposes only, in order to protect a portion of its future cash flow from the volatility of oil and natural gas commodity prices and electricity rates. For financial risk management contracts, the Company considers these contracts to be effective on an economic basis, but has decided not to designate these contracts as hedges for accounting
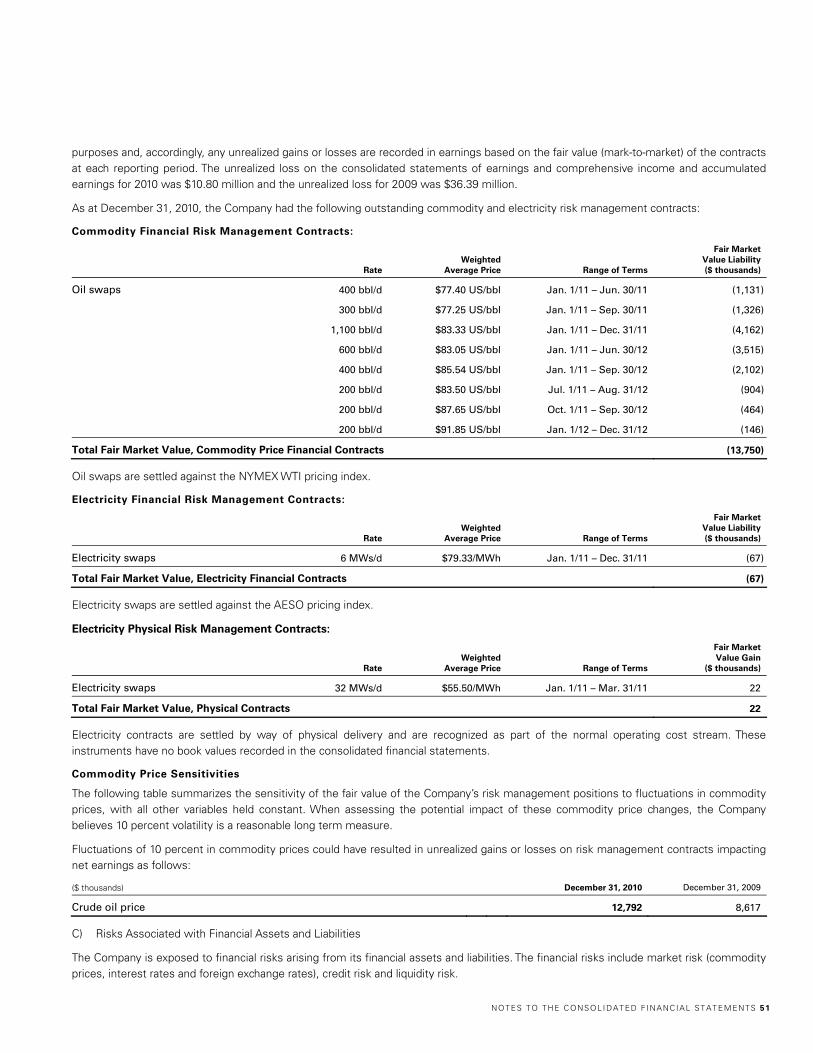
NOTES TO THE C ONSOLI DATED F I NANCIAL STATEMENTS 51
purposes and, accordingly, any unrealized gains or losses are recorded in earnings based on the fair value (mark-to-market) of the contracts at each reporting period. The unrealized loss on the consolidated statements of earnings and comprehensive income and accumulated earnings for 2010 was $10.80 million and the unrealized loss for 2009 was $36.39 million.
As at December 31, 2010, the Company had the following outstanding commodity and electricity risk management contracts:
Commodity Financial Risk Management Contracts:
Rate
Weighted Average Price Range of Terms
Fair Market Value Liability ($ thousands)
Oil swaps 400 bbl/d $77.40 US/bbl Jan. 1/11 – Jun. 30/11 (1,131)
300 bbl/d $77.25 US/bbl Jan. 1/11 – Sep. 30/11 (1,326)
1,100 bbl/d $83.33 US/bbl Jan. 1/11 – Dec. 31/11 (4,162)
600 bbl/d $83.05 US/bbl Jan. 1/11 – Jun. 30/12 (3,515)
400 bbl/d $85.54 US/bbl Jan. 1/11 – Sep. 30/12 (2,102)
200 bbl/d $83.50 US/bbl Jul. 1/11 – Aug. 31/12 (904)
200 bbl/d $87.65 US/bbl Oct. 1/11 – Sep. 30/12 (464)
200 bbl/d $91.85 US/bbl Jan. 1/12 – Dec. 31/12 (146)
Total Fair Market Value, Commodity Price Financial Contracts (13,750)
Oil swaps are settled against the NYMEX WTI pricing index.
Electricity Financial Risk Management Contracts:
Rate
Weighted Average Price Range of Terms
Fair Market Value Liability ($ thousands)
Electricity swaps 6 MWs/d $79.33/MWh Jan. 1/11 – Dec. 31/11 (67)
Total Fair Market Value, Electricity Financial Contracts (67)
Electricity swaps are settled against the AESO pricing index.
Electricity Physical Risk Management Contracts:
Rate
Weighted Average Price Range of Terms
Fair Market Value Gain
($ thousands)
Electricity swaps 32 MWs/d $55.50/MWh Jan. 1/11 – Mar. 31/11 22
Total Fair Market Value, Physical Contracts 22
Electricity contracts are settled by way of physical delivery and are recognized as part of the normal operating cost stream. These instruments have no book values recorded in the consolidated financial statements.
Commodity Price Sensitivities
The following table summarizes the sensitivity of the fair value of the Company’s risk management positions to fluctuations in commodity prices, with all other variables held constant. When assessing the potential impact of these commodity price changes, the Company believes 10 percent volatility is a reasonable long term measure.
Fluctuations of 10 percent in commodity prices could have resulted in unrealized gains or losses on risk management contracts impacting net earnings as follows:
($ thousands) December 31, 2010 December 31, 2009
Crude oil price 12,792 8,617
C) Risks Associated with Financial Assets and Liabilities
The Company is exposed to financial risks arising from its financial assets and liabilities. The financial risks include market risk (commodity prices, interest rates and foreign exchange rates), credit risk and liquidity risk.
52 ZAR GON O IL & GA S LTD. 2010 ANNU AL F INAN CIAL REPORT
Market Risk
Market risk is the risk that the fair value or future cash flows of financial assets or liabilities will fluctuate due to movements in market prices and is comprised of the following:
- Commodity Price Risk
As a means of mitigating exposure to commodity price risk volatility, the Company has entered into various derivative agreements. The use of derivative instruments is governed under formal policies and is subject to limits established by the Board of Directors. The Company’s policy is to not use derivative financial instruments for speculative purposes.
Natural Gas – To partially mitigate the natural gas commodity price risk, the Company may enter into swaps, to fix the Canadian dollar AECO prices.
Crude Oil – The Company has partially mitigated its exposure to the WTI NYMEX price with fixed price swaps.
- Interest Rate Risk
Borrowings under bank credit facilities are market rate based (variable interest rates); thus, carrying values approximate fair values.
At the December 31, 2010 debt pricing levels, the increase or decrease in net earnings for each one percent change in interest rates would amount to $0.97 million (2009 - $0.82 million).
- Foreign Exchange Risk
As Zargon operates in North America, fluctuations in the exchange rate between the US/Canadian dollar can have a significant effect on the Company’s reported results. A $0.01 change in the US to Canadian dollar exchange rate would have resulted in a $0.80 million (2009 - $0.61 million) increase or decrease in net earnings for the year ended December 31, 2010.
Credit Risk
Credit risk is the risk that the counterparty to a financial asset will default, resulting in the Company incurring a financial loss. This credit exposure is mitigated with credit practices that limit transactions according to counterparties’ credit quality. A substantial portion of the Company’s accounts receivable are with customers in the oil and gas industry and are subject to normal industry credit risks.
The maximum credit risk exposure associated with accounts receivable, accrued revenues and risk management assets is the total carrying value. The Company monitors these balances monthly to limit the risk associated with collection. Of Zargon’s accounts receivable at December 31, 2010, approximately 54 percent (December 31, 2009 – 40 percent) was owing from two companies and Zargon anticipates full collection.
The Company’s allowance for doubtful accounts was $0.10 million as at December 31, 2010 and $0.10 million as at December 31, 2009. During 2010, the Company did not record any additional provisions for non-collectible accounts receivable.
When determining whether amounts that are past due are collectible, management assesses the credit worthiness and past payment history of the counterparty, as well as the nature of the past due amount. Zargon considers all material amounts greater than 90 days to be past due. As at December 31, 2010, $1.01 million of accounts receivable are past due, excluding amounts described above, all of which are considered to be collectible.
Liquidity Risk
Liquidity risk is the risk the Company will encounter difficulties in meeting its financial liability obligations. The Company manages its liquidity risk through cash and debt management. See note 11 for a more detailed discussion.
As at December 31, 2010, Zargon had available unused committed bank credit facilities of approximately $63.46 million compared to $102.81 million at December 31, 2009. The Company believes it has sufficient funding through the use of these facilities to meet foreseeable borrowing requirements.
NOTES TO THE C ONSOLI DATED F I NANCIAL STATEMENTS 53
The timing of cash outflows relating to financial liabilities are outlined in the table below:
($ thousands) 1 year 2–3 years Total
Accounts payable and accrued liabilities 30,431 – 30,431
Cash distributions payable 3,750 – 3,750
Risk management liabilities (1) 10,737 3,080 13,817
Long term debt (2) – 115,285 115,285
(1) See the section titled “Commodity Price Sensitivities” in this note for a better understanding of the volatility around these amounts.
(2) See note 6 for the details on the credit facilities.
13. INCOME TAXES
The provision for income taxes in the consolidated statements of earnings and comprehensive income and accumulated earnings reflect an effective rate which differs from the expected statutory tax rate. Differences were accounted for as follows:
($ thousands) 2010 2009
Statutory income tax rates 28.45% 29.42%
Expected income taxes expense (recovery) (772) (3,942)
Add (deduct) income tax effect of:
Rate adjustments 1,538 458
Trust distributions (14,440) (13,523)
Capital taxes and withholding taxes 212 285
Other 732 267
(12,730) (16,455)
The future income tax liabilities reflect the net tax effects of temporary differences between the carrying amounts of assets and liabilities for financial reporting purposes and the amounts used for income tax purposes. The components of Zargon’s net future income tax liability are as follows:
($ thousands) 2010 2009
Net book value of property and equipment in excess of tax pools 44,832 46,983
Deferred partnership earnings 8,568 7,560
Asset retirement obligations (11,067) (9,199)
Current unrealized risk management (asset)/liability (2,894) (495)
Long-term unrealized risk management (asset)/liability (830) (361)
Non-capital losses (23,555) (14,296)
Share issue costs (355) (491)
Other (233) (230)
14,466 29,471
54 ZAR GON O IL & GA S LTD. 2010 ANNU AL F INAN CIAL REPORT
Zargon’s estimated federal tax pools are as follows:
($ thousands) December 31, 2010 December 31, 2009
Canadian oil and gas property expenses 75,983 74,239
Canadian development expenses 52,208 47,713
Canadian exploration expenses 55,846 49,411
Capital cost allowance 57,879 61,290
Non-capital losses 100,521 60,600
US tax pools 2,260 2,425
Partnership deferral (1,023) (6,290)
Other 2,699 3,750
346,373 293,138
For tax purposes, the Company has $0.55 million allowable capital losses derived from the dissolution of one of its US subsidiaries in 2010; however, the future benefits have not been recorded in the consolidated financial statements as the Company does not anticipate any capital gains. The allowable capital loss can be carried forward indefinitely but only used to offset future taxable capital gains.
14. COMMITMENTS
The Company is committed to future minimum payments for natural gas transportation sales commitments in addition to operating leases for office space, office equipment and vehicles. Payments required under these commitments for each of the next five years are: 2011 – $2.47 million; 2012 – $1.78 million; 2013 – $1.66 million; 2014 – $1.66; 2015 – $0.97 million; thereafter – nil.
15. CONTINGENCIES AND GUARANTEES
In the normal course of operations, Zargon executes agreements that provide for indemnification and guarantees to counterparties in transactions such as the sale of assets and operating leases.
These indemnifications and guarantees may require compensation to counterparties for costs and losses incurred as a result of various events, including breaches of representations and warranties, loss of or damages to property, environmental liabilities or as a result of litigation that may be suffered by counterparties.
Certain indemnifications can extend for an unlimited period and generally do not provide for any limit on the maximum potential amount. The nature of substantially all of the indemnifications prevents the Company from making a reasonable estimate of the maximum potential amount that might be required to pay counterparties as the agreements do not specify a maximum amount, and the amounts depend on the outcome of future contingent events, the nature and likelihood of which cannot be determined at this time.
The Company indemnifies its directors and officers against any and all claims or losses reasonably incurred in the performance of their services to the Company to the extent permitted by law. The Company has acquired and maintains liability insurance for its directors and officers. The Company is party to various legal claims associated with the ordinary conduct of business. The Company does not anticipate that these claims will have a material impact on its financial position.
Towards the end of 2010, Canada Revenue Agency commenced a flow-through share audit on one of Zargon’s previously acquired companies. The audit is currently in the preliminary stage and, therefore, an estimate of any potential contingent loss is not determinable at this time.
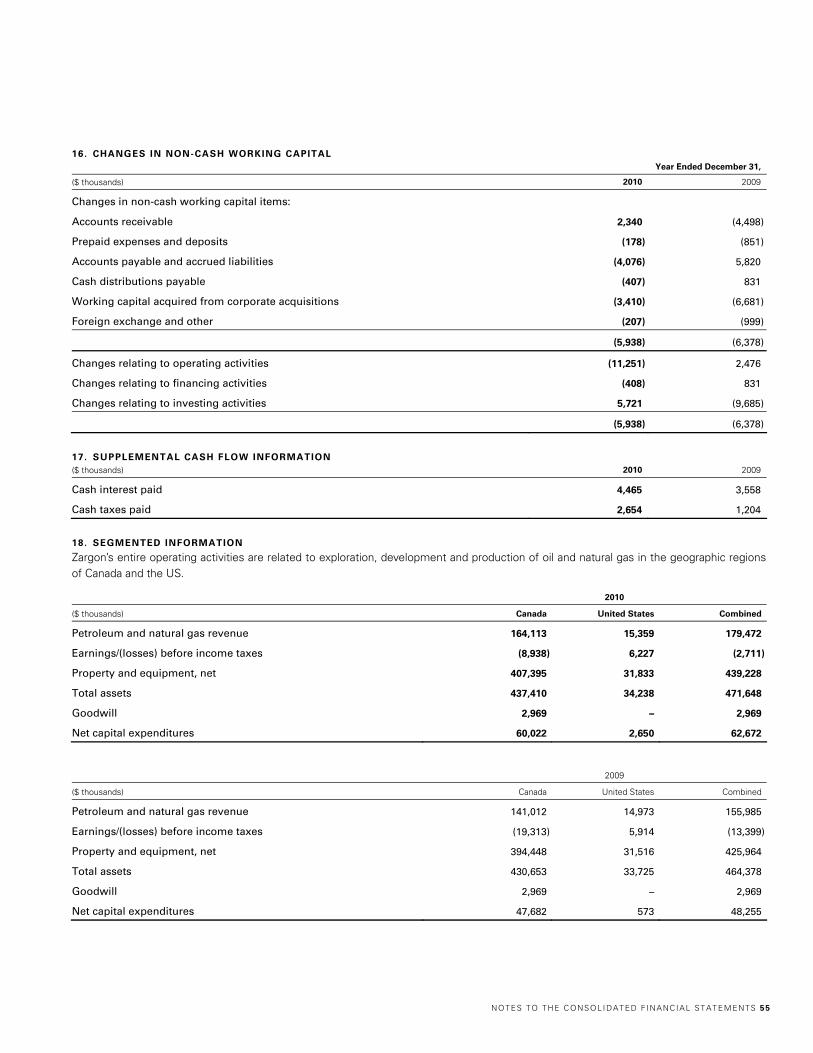
NOTES TO THE C ONSOLI DATED F I NANCIAL STATEMENTS 55
16. CHANGES IN NON-CASH WORKING CAPITAL Year Ended December 31,
($ thousands) 2010 2009
Changes in non-cash working capital items:
Accounts receivable 2,340 (4,498)
Prepaid expenses and deposits (178) (851)
Accounts payable and accrued liabilities (4,076) 5,820
Cash distributions payable (407) 831
Working capital acquired from corporate acquisitions (3,410) (6,681)
Foreign exchange and other (207) (999)
(5,938) (6,378)
Changes relating to operating activities (11,251) 2,476
Changes relating to financing activities (408) 831
Changes relating to investing activities 5,721 (9,685)
(5,938) (6,378)
17. SUPPLEMENTAL CASH FLOW INFORMATION ($ thousands) 2010 2009
Cash interest paid 4,465 3,558
Cash taxes paid 2,654 1,204
18. SEGMENTED INFORMATION
Zargon’s entire operating activities are related to exploration, development and production of oil and natural gas in the geographic regions of Canada and the US.
2010
($ thousands) Canada United States Combined
Petroleum and natural gas revenue 164,113 15,359 179,472
Earnings/(losses) before income taxes (8,938) 6,227 (2,711)
Property and equipment, net 407,395 31,833 439,228
Total assets 437,410 34,238 471,648
Goodwill 2,969 – 2,969
Net capital expenditures 60,022 2,650 62,672
2009
($ thousands) Canada United States Combined
Petroleum and natural gas revenue 141,012 14,973 155,985
Earnings/(losses) before income taxes (19,313) 5,914 (13,399)
Property and equipment, net 394,448 31,516 425,964
Total assets 430,653 33,725 464,378
Goodwill 2,969 – 2,969
Net capital expenditures 47,682 573 48,255
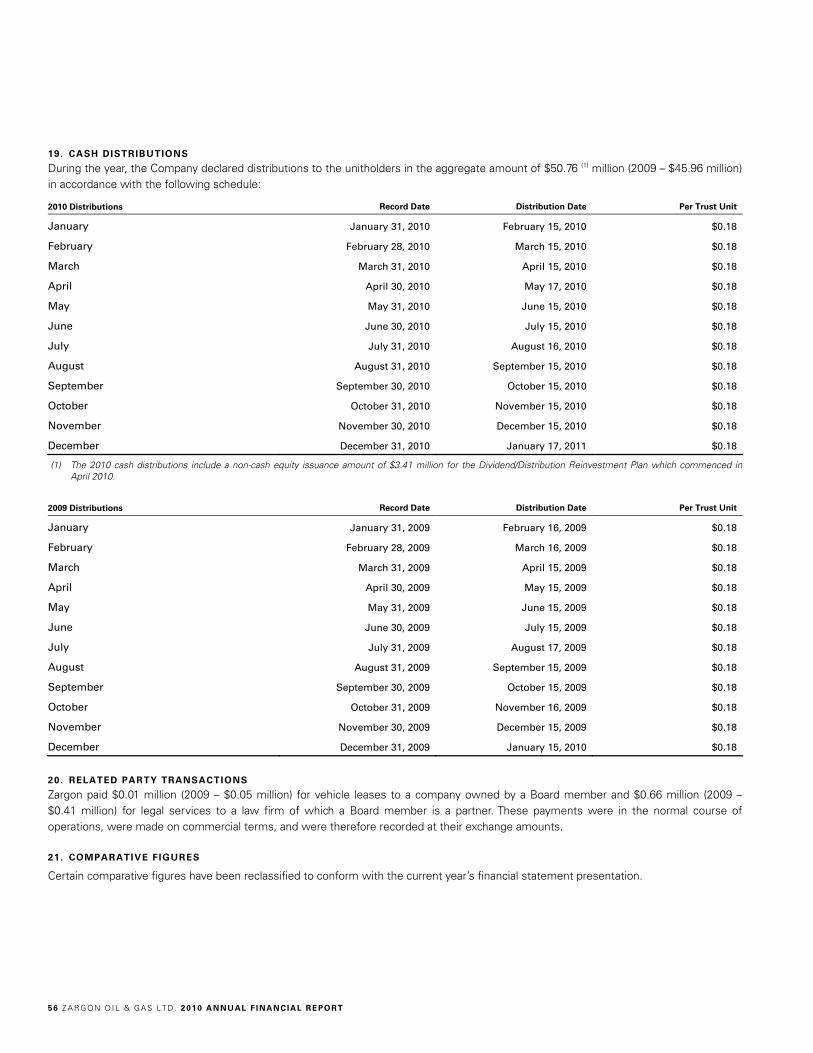
56 ZAR GON O IL & GA S LTD. 2010 ANNU AL F INAN CIAL REPORT
19. CASH DISTRIBUTIONS
During the year, the Company declared distributions to the unitholders in the aggregate amount of $50.76 (1) million (2009 – $45.96 million) in accordance with the following schedule:
2010 Distributions Record Date Distribution Date Per Trust Unit
January January 31, 2010 February 15, 2010 $0.18
February February 28, 2010 March 15, 2010 $0.18
March March 31, 2010 April 15, 2010 $0.18
April April 30, 2010 May 17, 2010 $0.18
May May 31, 2010 June 15, 2010 $0.18
June June 30, 2010 July 15, 2010 $0.18
July July 31, 2010 August 16, 2010 $0.18
August August 31, 2010 September 15, 2010 $0.18
September September 30, 2010 October 15, 2010 $0.18
October October 31, 2010 November 15, 2010 $0.18
November November 30, 2010 December 15, 2010 $0.18
December December 31, 2010 January 17, 2011 $0.18
(1) The 2010 cash distributions include a non-cash equity issuance amount of $3.41 million for the Dividend/Distribution Reinvestment Plan which commenced in April 2010.
2009 Distributions Record Date Distribution Date Per Trust Unit
January January 31, 2009 February 16, 2009 $0.18
February February 28, 2009 March 16, 2009 $0.18
March March 31, 2009 April 15, 2009 $0.18
April April 30, 2009 May 15, 2009 $0.18
May May 31, 2009 June 15, 2009 $0.18
June June 30, 2009 July 15, 2009 $0.18
July July 31, 2009 August 17, 2009 $0.18
August August 31, 2009 September 15, 2009 $0.18
September September 30, 2009 October 15, 2009 $0.18
October October 31, 2009 November 16, 2009 $0.18
November November 30, 2009 December 15, 2009 $0.18
December December 31, 2009 January 15, 2010 $0.18
20. RELATED PARTY TRANSACTIONS
Zargon paid $0.01 million (2009 – $0.05 million) for vehicle leases to a company owned by a Board member and $0.66 million (2009 – $0.41 million) for legal services to a law firm of which a Board member is a partner. These payments were in the normal course of operations, were made on commercial terms, and were therefore recorded at their exchange amounts.
21. COMPARATIVE FIGURES
Certain comparative figures have been reclassified to conform with the current year’s financial statement presentation.
ABBREVIATIONSbbl Barrelbbl/d Barrels per daybcf Billion cubic feetboe Barrels of oil equivalent
(6 mcf is equivalent to 1 bbl)boe/d Barrels of oil equivalent per daybtu British thermal unitsgj Gigajoule
gj/d Gigajoules per daym Thousandmcf Thousand cubic feetmcf/d Thousand cubic feet per daymm Millionmmbtu Million British thermal unitsMWh Megawatt hourMWs/d Megawatts per day
AECO Alberta gas trading priceAESO Alberta Electric Systems
OperatorAPI American Petroleum InstituteEIC Emerging Issues CommitteeLIBOR London Interbank Offered RateNYMEX New York Mercantile ExchangeWTI West Texas Intermediate
1Management’s
Discussion and Analysis
34Consolidated
Financial Statements
37Notes to the Consolidated
Financial Statements
IBCCorporate
Information
Table of Contents
BOARD OF DIRECTORS
Craig H. HansenCalgary, Alberta
K. James Harrison (3) (4)
Chairman of the Board Oakville, Ontario
Kyle D. Kitagawa (1) (2)
Calgary, Alberta
Geoffrey C. Merritt (2)
Calgary, Alberta
Margaret A. McKenzie (1) (3)
Calgary, Alberta
Jim Peplinski (2) (4)
Calgary, Alberta
J. Graham Weir (1) (2)
Calgary, Alberta
Grant A. Zawalsky (3) (4) Calgary, Alberta
OFFICERS
Craig H. HansenPresident and Chief Executive Officer
Henry J. BairdVice President, Reservoir Engineering
Charles L. BuckleyVice President, Geosciences
Jason B. DranchukVice President, Finance and Chief Financial Officer
Tracy L. HowardCorporate Secretary
Brian G. KerganVice President, Corporate Development
Kevin C.Y. LeeVice President, Alberta Plains North
Robert T. MoriyamaVice President, Enhanced Recovery
Lorne D. SchwetzVice President, Land
Al D. ThorsenVice President, Operations
STOCK EXCHANGE LISTING
Toronto Stock Exchange
Zargon Oil & Gas Ltd.Common SharesTrading Symbol: ZAR
TRANSFER AGENT
Valiant Trust Company310, 606 – 4th Street S.W.Calgary, Alberta T2P 1T1
BANKERS
The Toronto Dominion Bank910, 333 – 7th Avenue S.W. Calgary, Alberta T2P 2Z1
Canadian Imperial Bank of Commerce9th Floor, Bankers Hall East855 – 2nd Street S.W.Calgary, Alberta T2P 2P2
The Bank of Nova Scotia2000, 700 – 2nd Street S.W.Calgary, Alberta T2P 2N7
HEAD OFFICE
700, 333 – 5th Avenue S.W.Calgary, Alberta T2P 3B6Telephone: 403-264-9992Fax: 403-265-3026Email: [email protected]
WEBSITE
www.zargon.ca
LEGAL COUNSEL
Burnet, Duckworth & Palmer LLP1400, 350 – 7th Avenue S.W.Calgary, Alberta T2P 3N9
CONSULTING ENGINEERS
McDaniel & Associates Consultants Ltd.2200, 255 – 5th Avenue S.W.Calgary, Alberta T2P 3G6
AUDITORS
Ernst & Young LLP1000, 440 – 2nd Avenue S.W.Calgary, Alberta T2P 5E9
(1) Audit Committee (2) Reserves Committee (3) Governance and Nominating Committee (4) Compensation Committee
Corporate Information
ANNUAL GENERAL MEETINGThe Annual General Meeting of the shareholders of Zargon Oil & Gas Ltd. will be held on Wednesday, April 27, 2011, at 3:00 pm (Calgary time) in the Strand/Tivoli Room of the Metropolitan Conference Centre, 333 – 4th Avenue S.W., Calgary, Alberta.

Zargon Oil & Gas Ltd.
2010 F INANCIAL REPORT
Focused on exploitation
403-264-9992 www.zargon.ca