Embed Size (px)
Citation preview
Zelig: Everyone’s Statistical SoftwareToward A Common Framework for Statistical Analysis & Development
Kosuke Imai1 Gary King2 Olivia Lau3
1Department of PoliticsPrinceton University
2Department of GovernmentHarvard University
3Center for Drug Evaluation and ResearchFood and Drug Administration
February 26, 2010
Imai, King, & Lau (Princeton, Harvard, FDA) Zelig: Everyone’s Statistical Software February 26, 2010 1 / 34

Introduction
Kosuke Imai, Gary King, andOlivia Lau. "Toward A CommonFramework for Statistical Anal-ysis and Development" Journalof Computational and GraphicalStatistics, Vol. 17, No. 4 (De-cember), pp. 892-913
Imai, King, & Lau (Princeton, Harvard, FDA) Zelig: Everyone’s Statistical Software February 26, 2010 2 / 34

Introduction Motivation
Motivation for the Zelig Project
The Problem:Quantitative methodology is thriving like never beforeIt is wonderful, but results in different jargon, notation, syntaxes, etc.
The Consequence:Hard to learn useful methods developed in various disciplinesDespite their common underlying statistical foundation
Possible Solutions:Top-down approaches: possible (though inefficient) in commercialpackages but contradict with the nature of scientific inquiryOpen source approaches such as R (and Zelig)
Imai, King, & Lau (Princeton, Harvard, FDA) Zelig: Everyone’s Statistical Software February 26, 2010 3 / 34
Introduction Motivation
What’s R? Why Should I Use R and Zelig?
What’s R?Canned statistical packagesAn open-source project (free and reliable)An object-oriented programming language
Why should I use R?Most methodologists and statisticians use RMore statistical procedures than other software
Why should I use Zelig?With Zelig, R is easy to learn and useNo need to wait until a commercial statistical package decides toinclude a procedureR and Zelig create a community of users and developers ofstatistics with a common language
Imai, King, & Lau (Princeton, Harvard, FDA) Zelig: Everyone’s Statistical Software February 26, 2010 4 / 34
Introduction Intellectual Contributions
What Does Zelig Do?: A Unified User Interface
Interpreting and presenting statistical results:1 Focus on the scientific quantities of interest2 Point and uncertainty estimates
Providing additional infrastructure:1 multiple imputation2 matching methods3 counterfactual evaluations4 replication, etc.
Encompassing a large fraction of statistical models:1 Bayesian and frequentist models2 single and multiple equations models3 cross-section and time-series models4 time-series-cross-section models5 single and multi-level models, etc.
Imai, King, & Lau (Princeton, Harvard, FDA) Zelig: Everyone’s Statistical Software February 26, 2010 5 / 34

Introduction Intellectual Contributions
What Does Zelig Do?: A Developer’s Interface
1 Tools for writing new models so that developers can easilytransform user inputs into mathematically convenient forms
2 Methods to wrap existing packages so that developers do nothave to modify their packages in order to include them into Zelig
3 A dynamically-generated GUI so that those who do not know Rcan easily use developer’s packages
Imai, King, & Lau (Princeton, Harvard, FDA) Zelig: Everyone’s Statistical Software February 26, 2010 6 / 34
A Unified User Interface Primary Zelig Commands
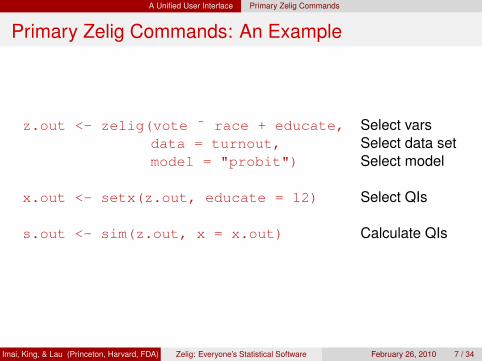
Primary Zelig Commands: An Example
z.out <- zelig(vote ˜ race + educate, Select varsdata = turnout, Select data setmodel = "probit") Select model
x.out <- setx(z.out, educate = 12) Select QIs
s.out <- sim(z.out, x = x.out) Calculate QIs
Imai, King, & Lau (Princeton, Harvard, FDA) Zelig: Everyone’s Statistical Software February 26, 2010 7 / 34
A Unified User Interface Zelig Functionalities
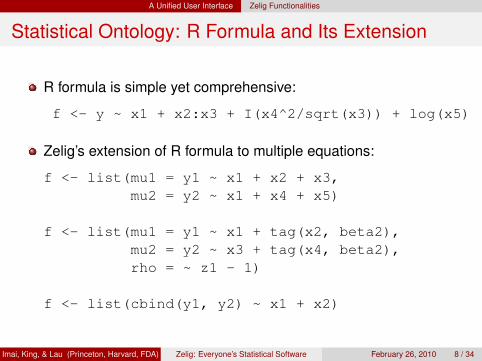
Statistical Ontology: R Formula and Its Extension
R formula is simple yet comprehensive:
f <- y ~ x1 + x2:x3 + I(x4^2/sqrt(x3)) + log(x5)
Zelig’s extension of R formula to multiple equations:
f <- list(mu1 = y1 ~ x1 + x2 + x3,mu2 = y2 ~ x1 + x4 + x5)
f <- list(mu1 = y1 ~ x1 + tag(x2, beta2),mu2 = y2 ~ x3 + tag(x4, beta2),rho = ~ z1 - 1)
f <- list(cbind(y1, y2) ~ x1 + x2)
Imai, King, & Lau (Princeton, Harvard, FDA) Zelig: Everyone’s Statistical Software February 26, 2010 8 / 34
A Unified User Interface Zelig Functionalities
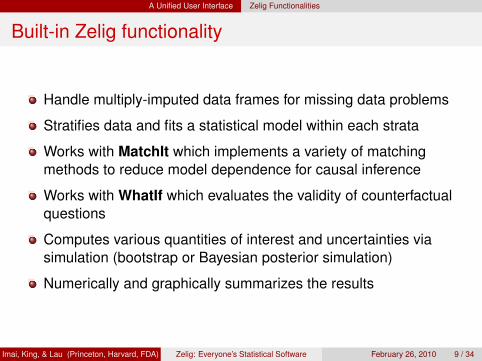
Built-in Zelig functionality
Handle multiply-imputed data frames for missing data problems
Stratifies data and fits a statistical model within each strata
Works with MatchIt which implements a variety of matchingmethods to reduce model dependence for causal inference
Works with WhatIf which evaluates the validity of counterfactualquestions
Computes various quantities of interest and uncertainties viasimulation (bootstrap or Bayesian posterior simulation)
Numerically and graphically summarizes the results
Imai, King, & Lau (Princeton, Harvard, FDA) Zelig: Everyone’s Statistical Software February 26, 2010 9 / 34
A Unified User Interface Zelig Functionalities
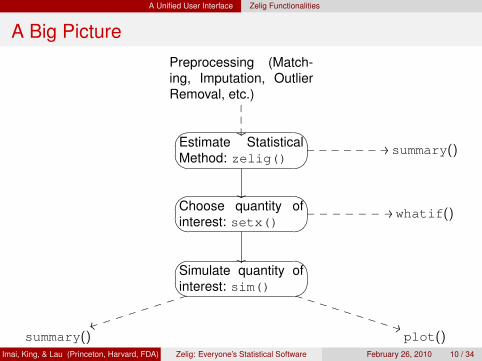
A Big PicturePreprocessing (Match-ing, Imputation, OutlierRemoval, etc.)
�����
GF ED@A BCEstimate StatisticalMethod: zelig()
��
//_______ summary()
GF ED@A BCChoose quantity ofinterest: setx()
//_______
��
whatif()
GF ED@A BCSimulate quantity ofinterest: sim()
**UUUUUUUUU
tti i i i i i i i
summary() plot()Imai, King, & Lau (Princeton, Harvard, FDA) Zelig: Everyone’s Statistical Software February 26, 2010 10 / 34
R Tutorial R Basics
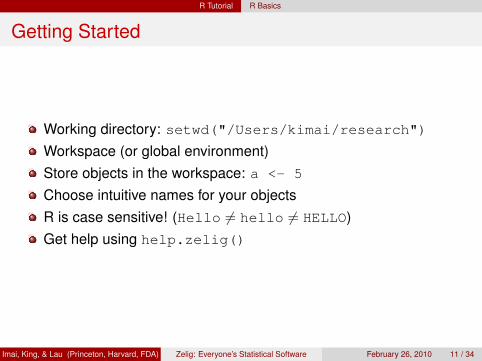
Getting Started
Working directory: setwd("/Users/kimai/research")Workspace (or global environment)Store objects in the workspace: a <- 5
Choose intuitive names for your objectsR is case sensitive! (Hello 6= hello 6= HELLO)Get help using help.zelig()
Imai, King, & Lau (Princeton, Harvard, FDA) Zelig: Everyone’s Statistical Software February 26, 2010 11 / 34
R Tutorial R Objects
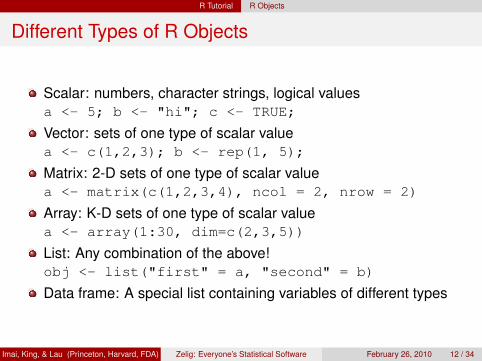
Different Types of R Objects
Scalar: numbers, character strings, logical valuesa <- 5; b <- "hi"; c <- TRUE;
Vector: sets of one type of scalar valuea <- c(1,2,3); b <- rep(1, 5);
Matrix: 2-D sets of one type of scalar valuea <- matrix(c(1,2,3,4), ncol = 2, nrow = 2)
Array: K-D sets of one type of scalar valuea <- array(1:30, dim=c(2,3,5))
List: Any combination of the above!obj <- list("first" = a, "second" = b)
Data frame: A special list containing variables of different types
Imai, King, & Lau (Princeton, Harvard, FDA) Zelig: Everyone’s Statistical Software February 26, 2010 12 / 34
R Tutorial R Functions
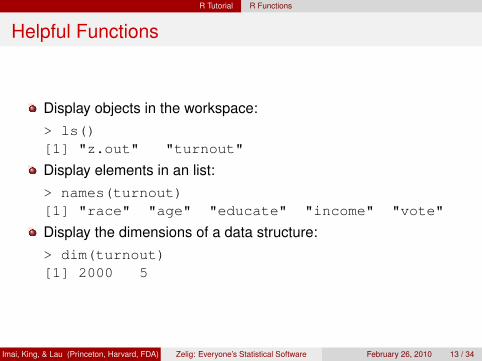
Helpful Functions
Display objects in the workspace:> ls()[1] "z.out" "turnout"
Display elements in an list:> names(turnout)[1] "race" "age" "educate" "income" "vote"
Display the dimensions of a data structure:> dim(turnout)[1] 2000 5
Imai, King, & Lau (Princeton, Harvard, FDA) Zelig: Everyone’s Statistical Software February 26, 2010 13 / 34
R Tutorial R Functions
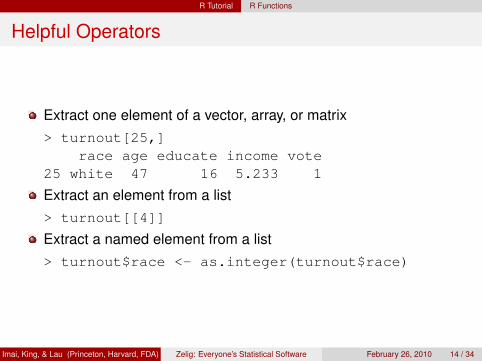
Helpful Operators
Extract one element of a vector, array, or matrix> turnout[25,]
race age educate income vote25 white 47 16 5.233 1
Extract an element from a list> turnout[[4]]
Extract a named element from a list> turnout$race <- as.integer(turnout$race)
Imai, King, & Lau (Princeton, Harvard, FDA) Zelig: Everyone’s Statistical Software February 26, 2010 14 / 34
R Tutorial Data Manipulation
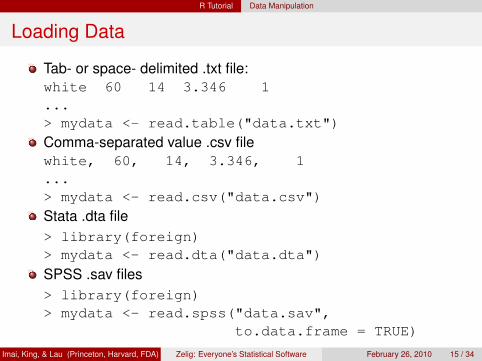
Loading Data
Tab- or space- delimited .txt file:white 60 14 3.346 1...> mydata <- read.table("data.txt")
Comma-separated value .csv filewhite, 60, 14, 3.346, 1...> mydata <- read.csv("data.csv")
Stata .dta file> library(foreign)> mydata <- read.dta("data.dta")
SPSS .sav files> library(foreign)> mydata <- read.spss("data.sav",
to.data.frame = TRUE)
Imai, King, & Lau (Princeton, Harvard, FDA) Zelig: Everyone’s Statistical Software February 26, 2010 15 / 34
R Tutorial Data Manipulation
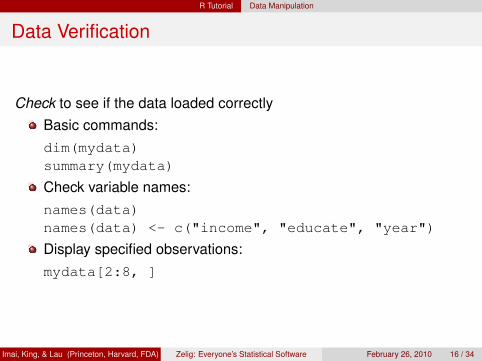
Data Verification
Check to see if the data loaded correctlyBasic commands:dim(mydata)summary(mydata)
Check variable names:names(data)names(data) <- c("income", "educate", "year")
Display specified observations:mydata[2:8, ]
Imai, King, & Lau (Princeton, Harvard, FDA) Zelig: Everyone’s Statistical Software February 26, 2010 16 / 34
R Tutorial Data Manipulation
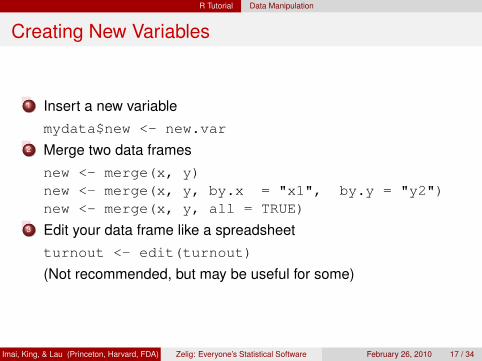
Creating New Variables
1 Insert a new variablemydata$new <- new.var
2 Merge two data framesnew <- merge(x, y)new <- merge(x, y, by.x = "x1", by.y = "y2")new <- merge(x, y, all = TRUE)
3 Edit your data frame like a spreadsheetturnout <- edit(turnout)
(Not recommended, but may be useful for some)
Imai, King, & Lau (Princeton, Harvard, FDA) Zelig: Everyone’s Statistical Software February 26, 2010 17 / 34
R Tutorial Data Manipulation
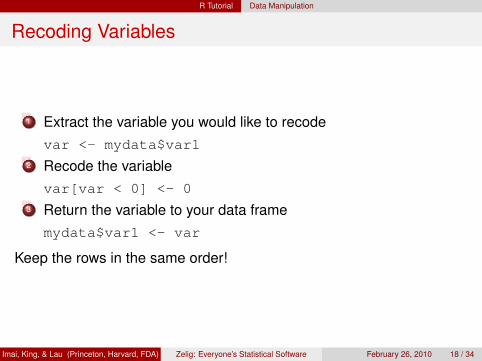
Recoding Variables
1 Extract the variable you would like to recodevar <- mydata$var1
2 Recode the variablevar[var < 0] <- 0
3 Return the variable to your data framemydata$var1 <- var
Keep the rows in the same order!
Imai, King, & Lau (Princeton, Harvard, FDA) Zelig: Everyone’s Statistical Software February 26, 2010 18 / 34
R Tutorial Saving the Data
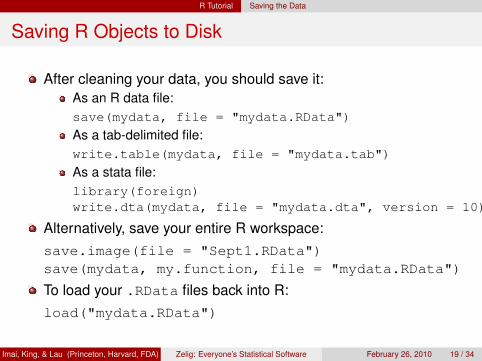
Saving R Objects to Disk
After cleaning your data, you should save it:As an R data file:save(mydata, file = "mydata.RData")
As a tab-delimited file:write.table(mydata, file = "mydata.tab")
As a stata file:library(foreign)write.dta(mydata, file = "mydata.dta", version = 10)
Alternatively, save your entire R workspace:save.image(file = "Sept1.RData")save(mydata, my.function, file = "mydata.RData")
To load your .RData files back into R:load("mydata.RData")
Imai, King, & Lau (Princeton, Harvard, FDA) Zelig: Everyone’s Statistical Software February 26, 2010 19 / 34
Zelig Tutorial Example 1: Logistic Regression
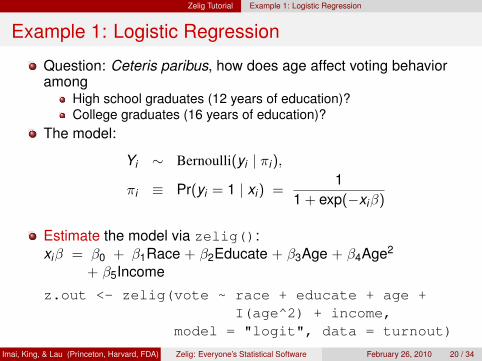
Example 1: Logistic Regression
Question: Ceteris paribus, how does age affect voting behavioramong
High school graduates (12 years of education)?College graduates (16 years of education)?
The model:
Yi ∼ Bernoulli(yi | πi),
πi ≡ Pr(yi = 1 | xi) =1
1 + exp(−xiβ)
Estimate the model via zelig():xiβ = β0 + β1Race + β2Educate + β3Age + β4Age2
+ β5Income
z.out <- zelig(vote ~ race + educate + age +I(age^2) + income,
model = "logit", data = turnout)
Imai, King, & Lau (Princeton, Harvard, FDA) Zelig: Everyone’s Statistical Software February 26, 2010 20 / 34
Zelig Tutorial Example 1: Logistic Regression
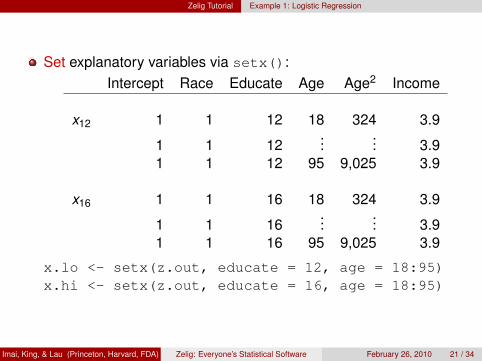
Set explanatory variables via setx():Intercept Race Educate Age Age2 Income
x12 1 1 12 18 324 3.9
1 1 12...
... 3.91 1 12 95 9,025 3.9
x16 1 1 16 18 324 3.9
1 1 16...
... 3.91 1 16 95 9,025 3.9
x.lo <- setx(z.out, educate = 12, age = 18:95)x.hi <- setx(z.out, educate = 16, age = 18:95)
Imai, King, & Lau (Princeton, Harvard, FDA) Zelig: Everyone’s Statistical Software February 26, 2010 21 / 34
Zelig Tutorial Example 1: Logistic Regression
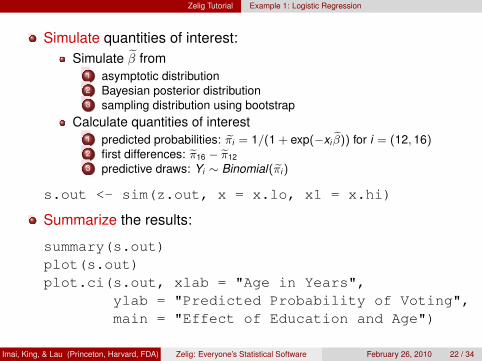
Simulate quantities of interest:Simulate β̃ from
1 asymptotic distribution2 Bayesian posterior distribution3 sampling distribution using bootstrap
Calculate quantities of interest1 predicted probabilities: π̃i = 1/(1 + exp(−xi β̃)) for i = (12, 16)2 first differences: π̃16 − π̃123 predictive draws: Yi ∼ Binomial(π̃i)
s.out <- sim(z.out, x = x.lo, x1 = x.hi)
Summarize the results:
summary(s.out)plot(s.out)plot.ci(s.out, xlab = "Age in Years",
ylab = "Predicted Probability of Voting",main = "Effect of Education and Age")
Imai, King, & Lau (Princeton, Harvard, FDA) Zelig: Everyone’s Statistical Software February 26, 2010 22 / 34
Zelig Tutorial Example 1: Logistic Regression
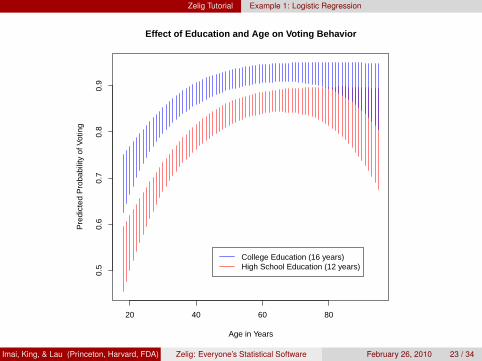
20 40 60 80
0.5
0.6
0.7
0.8
0.9
Effect of Education and Age on Voting Behavior
Age in Years
Pre
dict
ed P
roba
bilit
y of
Vot
ing
College Education (16 years)High School Education (12 years)
Imai, King, & Lau (Princeton, Harvard, FDA) Zelig: Everyone’s Statistical Software February 26, 2010 23 / 34
Zelig Tutorial Example 2: Fixed Effects Regression
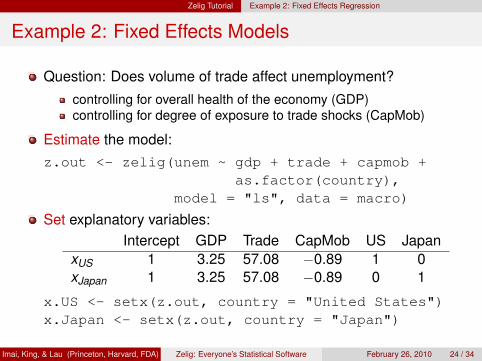
Example 2: Fixed Effects Models
Question: Does volume of trade affect unemployment?
controlling for overall health of the economy (GDP)controlling for degree of exposure to trade shocks (CapMob)
Estimate the model:z.out <- zelig(unem ~ gdp + trade + capmob +
as.factor(country),model = "ls", data = macro)
Set explanatory variables:Intercept GDP Trade CapMob US Japan
xUS 1 3.25 57.08 −0.89 1 0xJapan 1 3.25 57.08 −0.89 0 1
x.US <- setx(z.out, country = "United States")x.Japan <- setx(z.out, country = "Japan")
Imai, King, & Lau (Princeton, Harvard, FDA) Zelig: Everyone’s Statistical Software February 26, 2010 24 / 34
Zelig Tutorial Example 2: Fixed Effects Regression
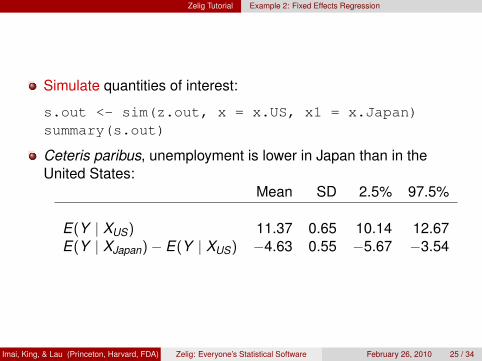
Simulate quantities of interest:
s.out <- sim(z.out, x = x.US, x1 = x.Japan)summary(s.out)
Ceteris paribus, unemployment is lower in Japan than in theUnited States:
Mean SD 2.5% 97.5%
E(Y | XUS) 11.37 0.65 10.14 12.67E(Y | XJapan)− E(Y | XUS) −4.63 0.55 −5.67 −3.54
Imai, King, & Lau (Princeton, Harvard, FDA) Zelig: Everyone’s Statistical Software February 26, 2010 25 / 34
Zelig Tutorial Example 3: Model Fitting in Strata
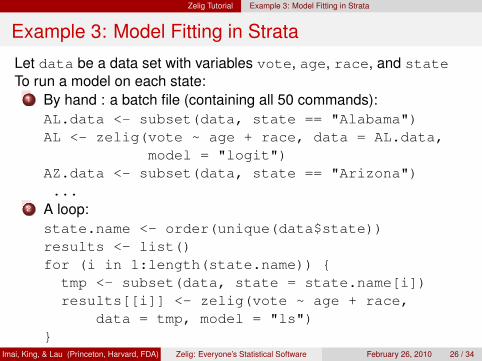
Example 3: Model Fitting in Strata
Let data be a data set with variables vote, age, race, and stateTo run a model on each state:
1 By hand : a batch file (containing all 50 commands):AL.data <- subset(data, state == "Alabama")AL <- zelig(vote ~ age + race, data = AL.data,
model = "logit")AZ.data <- subset(data, state == "Arizona")...
2 A loop:state.name <- order(unique(data$state))results <- list()for (i in 1:length(state.name)) {tmp <- subset(data, state = state.name[i])results[[i]] <- zelig(vote ~ age + race,
data = tmp, model = "ls")}
Imai, King, & Lau (Princeton, Harvard, FDA) Zelig: Everyone’s Statistical Software February 26, 2010 26 / 34
Zelig Tutorial Example 3: Model Fitting in Strata
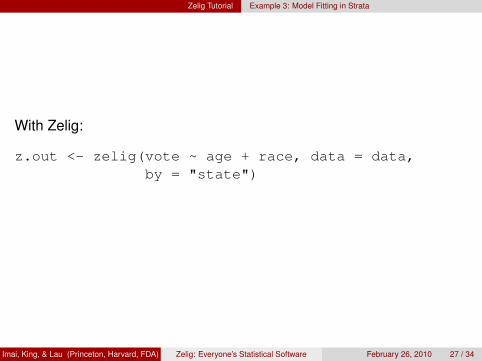
With Zelig:
z.out <- zelig(vote ~ age + race, data = data,by = "state")
Imai, King, & Lau (Princeton, Harvard, FDA) Zelig: Everyone’s Statistical Software February 26, 2010 27 / 34
Zelig Tutorial Example 4: Multiply Imputed Data Sets
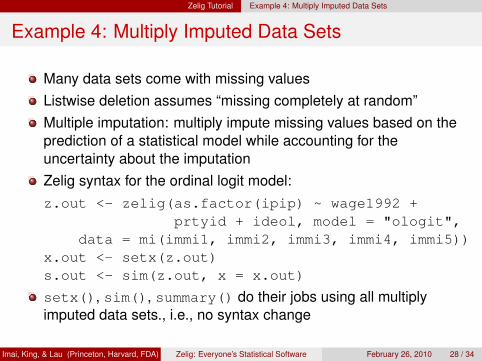
Example 4: Multiply Imputed Data Sets
Many data sets come with missing valuesListwise deletion assumes “missing completely at random”Multiple imputation: multiply impute missing values based on theprediction of a statistical model while accounting for theuncertainty about the imputationZelig syntax for the ordinal logit model:z.out <- zelig(as.factor(ipip) ~ wage1992 +
prtyid + ideol, model = "ologit",data = mi(immi1, immi2, immi3, immi4, immi5))
x.out <- setx(z.out)s.out <- sim(z.out, x = x.out)
setx(), sim(), summary() do their jobs using all multiplyimputed data sets., i.e., no syntax change
Imai, King, & Lau (Princeton, Harvard, FDA) Zelig: Everyone’s Statistical Software February 26, 2010 28 / 34
Zelig Tutorial Example 5: Matching for Causal Inference
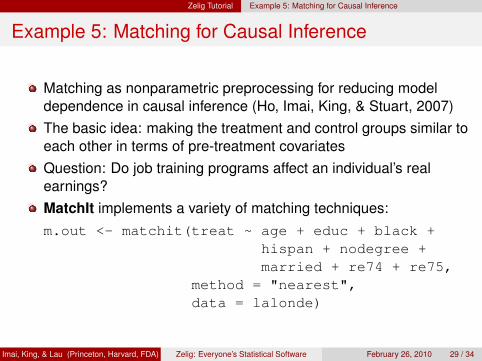
Example 5: Matching for Causal Inference
Matching as nonparametric preprocessing for reducing modeldependence in causal inference (Ho, Imai, King, & Stuart, 2007)The basic idea: making the treatment and control groups similar toeach other in terms of pre-treatment covariatesQuestion: Do job training programs affect an individual’s realearnings?MatchIt implements a variety of matching techniques:m.out <- matchit(treat ~ age + educ + black +
hispan + nodegree +married + re74 + re75,
method = "nearest",data = lalonde)
Imai, King, & Lau (Princeton, Harvard, FDA) Zelig: Everyone’s Statistical Software February 26, 2010 29 / 34
Zelig Tutorial Example 5: Matching for Causal Inference
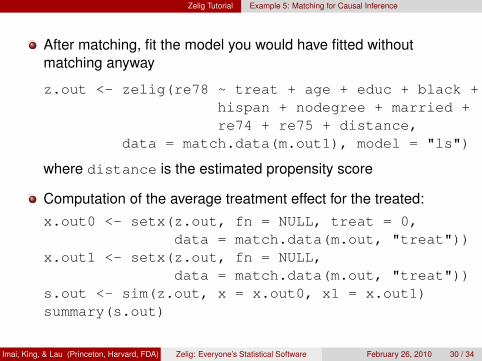
After matching, fit the model you would have fitted withoutmatching anyway
z.out <- zelig(re78 ~ treat + age + educ + black +hispan + nodegree + married +re74 + re75 + distance,
data = match.data(m.out1), model = "ls")
where distance is the estimated propensity score
Computation of the average treatment effect for the treated:x.out0 <- setx(z.out, fn = NULL, treat = 0,
data = match.data(m.out, "treat"))x.out1 <- setx(z.out, fn = NULL,
data = match.data(m.out, "treat"))s.out <- sim(z.out, x = x.out0, x1 = x.out1)summary(s.out)
Imai, King, & Lau (Princeton, Harvard, FDA) Zelig: Everyone’s Statistical Software February 26, 2010 30 / 34
Zelig Tutorial Example 6: Multiple Equations Models
Example 3: Multiple Equations Models
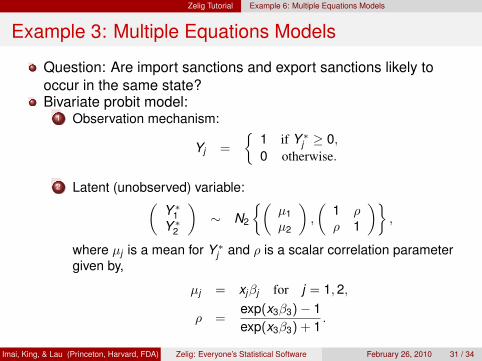
Question: Are import sanctions and export sanctions likely tooccur in the same state?Bivariate probit model:
1 Observation mechanism:
Yj =
{1 if Y ∗
j ≥ 0,0 otherwise.
2 Latent (unobserved) variable:(Y ∗
1Y ∗
2
)∼ N2
{(µ1µ2
),
(1 ρρ 1
)},
where µj is a mean for Y ∗j and ρ is a scalar correlation parameter
given by,
µj = xjβj for j = 1,2,
ρ =exp(x3β3)− 1exp(x3β3) + 1
.
Imai, King, & Lau (Princeton, Harvard, FDA) Zelig: Everyone’s Statistical Software February 26, 2010 31 / 34
Zelig Tutorial Example 6: Multiple Equations Models
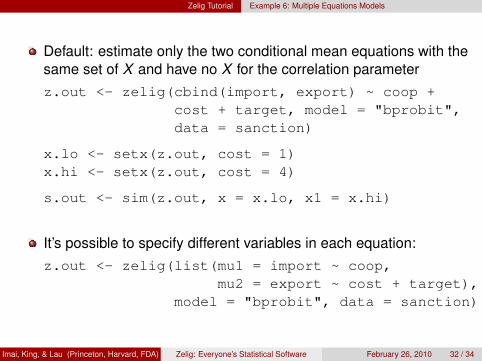
Default: estimate only the two conditional mean equations with thesame set of X and have no X for the correlation parameterz.out <- zelig(cbind(import, export) ~ coop +
cost + target, model = "bprobit",data = sanction)
x.lo <- setx(z.out, cost = 1)x.hi <- setx(z.out, cost = 4)
s.out <- sim(z.out, x = x.lo, x1 = x.hi)
It’s possible to specify different variables in each equation:z.out <- zelig(list(mu1 = import ~ coop,
mu2 = export ~ cost + target),model = "bprobit", data = sanction)
Imai, King, & Lau (Princeton, Harvard, FDA) Zelig: Everyone’s Statistical Software February 26, 2010 32 / 34
Zelig Tutorial Example 6: Multiple Equations Models
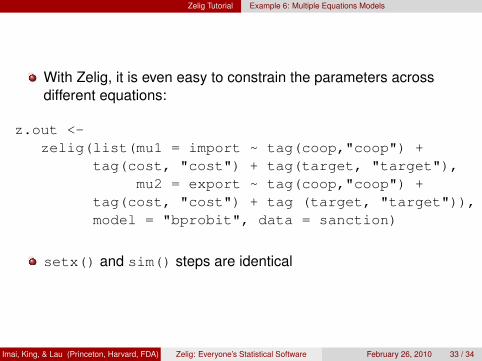
With Zelig, it is even easy to constrain the parameters acrossdifferent equations:
z.out <-zelig(list(mu1 = import ~ tag(coop,"coop") +
tag(cost, "cost") + tag(target, "target"),mu2 = export ~ tag(coop,"coop") +
tag(cost, "cost") + tag (target, "target")),model = "bprobit", data = sanction)
setx() and sim() steps are identical
Imai, King, & Lau (Princeton, Harvard, FDA) Zelig: Everyone’s Statistical Software February 26, 2010 33 / 34

Zelig Tutorial Example 6: Multiple Equations Models
Concluding Remarks
Zelig provides a unified interface for both users and developers
Makes R and its numerous functionalities accessible to appliedresearchers
Many more improvements planned for Zelig1 Adding more models2 Collaboration with the Dataverse Network3 API to encourage more contributions
Visit Zelig on the web at
http://gking.harvard.edu/zelig/
Imai, King, & Lau (Princeton, Harvard, FDA) Zelig: Everyone’s Statistical Software February 26, 2010 34 / 34