Embed Size (px)
Citation preview


Zenoss Extended MonitoringCopyright © 2010 Zenoss, Inc., 275 West St. Suite 204, Annapolis, MD 21401, U.S.A. All rights reserved.
This work is licensed under a Creative Commons Attribution Share Alike 3.0 License. To view a copy of this license, visit http://creativecommons.org/licenses/by-sa/3.0/; or send a letter to Creative Commons, 171 2nd Street, Suite 300, San Francisco, California, 94105,USA.
The Zenoss logo is a registered trademark of Zenoss, Inc. Zenoss and Open Enterprise Management are trademarks of Zenoss, Inc. in theU.S. and other countries.
Amazon Web Services, AWS, Amazon Elastic Compute Cloud, and Amazon EC2 are trademarks of Amazon.com, Inc. or its affiliates in theUnited States and/or other countries.
Flash is a registered trademark of Adobe Systems Incorporated.
Oracle, the Oracle logo, and Java are registered trademarks of the Oracle Corporation and/or its affiliates. Other names may be trademarksof their respective owners.
Linux is a registered trademark of Linus Torvalds.
SNMP Informant is a trademark of Garth K. Williams (Informant Systems, Inc.).
Sybase is a registered trademark of Sybase, Inc.
Tomcat is a trademark of the Apache Software Foundation.
VMware is registered trademark or trademark of VMware, Inc. in the United States and/or other jurisdictions.
Windows is a registered trademark of Microsoft Corporation in the United States and other countries.
All other companies and products mentioned are trademarks and property of their respective owners.
Part Number: 07-102010-3.0-v04

iii
1. ZenPacks ................................................................................................................................................ 11.1. About ZenPacks ........................................................................................................................... 1
1.1.1. Provided ZenPacks ............................................................................................................ 11.2. Installing ZenPacks ....................................................................................................................... 1
1.2.1. Installing from the Command Line ....................................................................................... 11.2.2. Installing from the User Interface ........................................................................................ 21.2.3. Installing All Core ZenPacks from RPM ............................................................................... 21.2.4. Viewing Loaded ZenPacks .................................................................................................. 3
1.3. Creating ZenPacks ........................................................................................................................ 31.3.1. Why Create a ZenPack? .................................................................................................... 41.3.2. Create a ZenPack .............................................................................................................. 41.3.3. Add a Database Object to a ZenPack ................................................................................. 41.3.4. View Database Objects in a ZenPack ................................................................................. 51.3.5. Remove a Database Object from a ZenPack ....................................................................... 51.3.6. Adding Other Items to ZenPacks ........................................................................................ 5
1.4. Packaging and Distributing ZenPacks ............................................................................................ 51.5. Removing ZenPacks ..................................................................................................................... 61.6. Where to Find More Information .................................................................................................... 6
I. Core ZenPacks ........................................................................................................................................ 72. Amazon Web Services ..................................................................................................................... 8
2.1. About ................................................................................................................................... 82.2. Prerequisites ......................................................................................................................... 82.3. Setup ................................................................................................................................... 82.4. Working with the EC2Manager Account ................................................................................. 9
2.4.1. CloudWatch Data ....................................................................................................... 92.4.2. Templates and Collection .......................................................................................... 10
2.4.2.1. Example: Initiating Load-Based Elasticity for an EC2 Setup .............................. 103. Apache Web Server ....................................................................................................................... 11
3.1. About ................................................................................................................................. 113.2. Prerequisites ....................................................................................................................... 113.3. Enable Monitoring ............................................................................................................... 11
3.3.1. Display the Status Page in Apache Version 1.3 or Higher ........................................... 113.3.2. Display the Status Page in Apache Version 2.x .......................................................... 123.3.3. Verifying Your Apache Configuration ......................................................................... 143.3.4. Configure Zenoss to Monitor the Web Server ............................................................. 14
3.4. Daemons ............................................................................................................................ 154. Dell Hardware ................................................................................................................................ 16
4.1. About ................................................................................................................................. 164.2. Prerequisites ....................................................................................................................... 164.3. Enable Enhanced Modeling ................................................................................................. 164.4. Daemons ............................................................................................................................ 17
5. Domain Name System (DNS) ......................................................................................................... 185.1. About ................................................................................................................................. 185.2. Prerequisites ....................................................................................................................... 185.3. Enable Monitoring ............................................................................................................... 185.4. Daemons ............................................................................................................................ 18
6. File Transfer Protocol (FTP) ........................................................................................................... 196.1. About ................................................................................................................................. 196.2. Prerequisites ....................................................................................................................... 196.3. Enable Monitoring ............................................................................................................... 196.4. Enable Secure Site Monitoring ............................................................................................. 196.5. Tuning for Site Responsiveness ........................................................................................... 206.6. Daemons ............................................................................................................................ 20
7. HP PC Hardware ........................................................................................................................... 21

Zenoss Extended Monitoring
iv
7.1. About ................................................................................................................................. 217.2. Prerequisites ....................................................................................................................... 217.3. Enable Enhanced Modeling ................................................................................................. 217.4. Daemons ............................................................................................................................ 22
8. Internet Relay Chat (IRC) ............................................................................................................... 238.1. About ................................................................................................................................. 238.2. Prerequisites ....................................................................................................................... 238.3. Enable Monitoring ............................................................................................................... 238.4. Daemons ............................................................................................................................ 23
9. Jabber Instant Messaging .............................................................................................................. 249.1. About ................................................................................................................................. 249.2. Prerequisites ....................................................................................................................... 249.3. Enable Monitoring ............................................................................................................... 249.4. Daemons ............................................................................................................................ 24
10. Java 2 Platform Standard Edition (J2E) ......................................................................................... 2510.1. About ................................................................................................................................ 25
10.1.1. JMX Background .................................................................................................... 2510.1.2. ZenJMX Capabilities ............................................................................................... 2510.1.3. Allowable Parameter Types ..................................................................................... 2610.1.4. Single Value Attribute Calls ..................................................................................... 2610.1.5. Complex-Value Attribute Calls ................................................................................. 2710.1.6. Example Method Calls ............................................................................................ 27
10.1.6.1. No parameters, single return value ............................................................... 2710.1.6.2. No parameters, multiple values returned in List format .................................... 2810.1.6.3. No parameters, multiple values returned in Map format .................................. 2810.1.6.4. Single parameter in polymorphic operation .................................................... 2810.1.6.5. Multiple parameters in polymorphic operations ............................................... 29
10.2. Prerequisites ..................................................................................................................... 3010.2.1. Sun Java Runtime Environment (JRE) ..................................................................... 30
10.3. Example to Monitor a JMX Value ....................................................................................... 3010.3.1. Enabling Remote JMX Access ................................................................................ 3010.3.2. Configure Zenoss with a Custom Data Source ......................................................... 31
10.4. Monitor Values in TabularData and CompositeData Objects ................................................. 3210.5. Using JConsole to Query a JMX Agent ............................................................................. 3210.6. Daemons .......................................................................................................................... 36
11. Lightweight Directory Access Protocol (LDAP) Response Time ....................................................... 3711.1. About ................................................................................................................................ 3711.2. Prerequisites ..................................................................................................................... 3711.3. Enable Monitoring ............................................................................................................. 37
11.3.1. For a Device .......................................................................................................... 3711.4. Daemons .......................................................................................................................... 38
12. MySQL Database ......................................................................................................................... 3912.1. About ................................................................................................................................ 3912.2. Prerequisites ..................................................................................................................... 3912.3. Enable Monitoring ............................................................................................................. 39
12.3.1. Authorize MySQL Performance Data Access ............................................................ 3912.3.2. Set up Zenoss ........................................................................................................ 39
12.4. Daemons .......................................................................................................................... 4013. Network News Transport Protocol (NNTP) ..................................................................................... 41
13.1. About ................................................................................................................................ 4113.2. Prerequisites ..................................................................................................................... 4113.3. Enable Monitoring ............................................................................................................. 4113.4. Daemons .......................................................................................................................... 41
14. Network Time Protocol (NTP) ....................................................................................................... 42

Zenoss Extended Monitoring
v
14.1. About ................................................................................................................................ 4214.2. Prerequisites ..................................................................................................................... 4214.3. Enable Monitoring ............................................................................................................. 4214.4. Daemons .......................................................................................................................... 42
15. ONC-style Remote Procedure Call (RPC) ..................................................................................... 4315.1. About ................................................................................................................................ 4315.2. Prerequisites ..................................................................................................................... 4315.3. Enable Monitoring ............................................................................................................. 4315.4. Daemons .......................................................................................................................... 43
16. SSH Monitoring Example ............................................................................................................. 4416.1. About ................................................................................................................................ 4416.2. Prerequisites ..................................................................................................................... 4416.3. Set Linux Server Monitoring Credentials ............................................................................. 4416.4. Add a Linux Server ........................................................................................................... 4416.5. Daemons .......................................................................................................................... 45
17. VMware Infrastructure ESX Server ................................................................................................ 4617.1. About ................................................................................................................................ 4617.2. Prerequisites ..................................................................................................................... 46
17.2.1. Installing Prerequisite Libraries ................................................................................ 4617.3. Enabling the ZenPack ....................................................................................................... 4717.4. Daemons .......................................................................................................................... 47
18. Web Page Response Time (HTTP) ............................................................................................... 4818.1. About ................................................................................................................................ 4818.2. Prerequisites ..................................................................................................................... 4818.3. Enable Monitoring ............................................................................................................. 4818.4. Check for a Specific URL or Specify Security Settings ......................................................... 4818.5. Check for Specific Content on the Web Page ..................................................................... 4918.6. Tuning for Site Responsiveness ......................................................................................... 4918.7. Daemons .......................................................................................................................... 50
19. Xen Virtual Hosts ......................................................................................................................... 5119.1. About ................................................................................................................................ 5119.2. Prerequisites ..................................................................................................................... 5119.3. Model Hosts and Guest ..................................................................................................... 5119.4. Daemons .......................................................................................................................... 51
II. Enterprise ZenPacks .............................................................................................................................. 5220. Advanced Search ......................................................................................................................... 53
20.1. About ................................................................................................................................ 5320.1.1. Working with Saved Searches ................................................................................. 54
20.2. Prerequisites ..................................................................................................................... 5421. AIX .............................................................................................................................................. 55
21.1. About ................................................................................................................................ 5521.2. Prerequisites ..................................................................................................................... 5521.3. Add an AIX Server ............................................................................................................ 5521.4. Set AIX Server Monitoring Credentials ................................................................................ 5621.5. Resolving CHANNEL_OPEN_FAILURE Issues ............................................................................. 5621.6. Resolving Command timed out Issues ................................................................................. 5721.7. Daemons .......................................................................................................................... 57
22. Apache Tomcat Application Server ............................................................................................... 5822.1. About ................................................................................................................................ 5822.2. Prerequisites ..................................................................................................................... 5822.3. Enable Monitoring ............................................................................................................. 59
22.3.1. Configuring Tomcat to Allow JMX Queries ............................................................... 5922.3.2. Configuring Zenoss ................................................................................................. 59
22.4. Change the Amount of Data Collected and Graphed ........................................................... 60

Zenoss Extended Monitoring
vi
22.5. Viewing Raw Data ............................................................................................................. 6122.6. Daemons .......................................................................................................................... 61
23. BEA WebLogic Application Server ................................................................................................ 6223.1. About ................................................................................................................................ 62
23.1.1. Overall Application Server Vitals .............................................................................. 6223.1.2. Entity EJB, Message Driven Bean (MDB), and Session EJB Subsystem Metrics .......... 6223.1.3. Data Pool (JDBC) metrics ....................................................................................... 6223.1.4. Queue (JMS) Metrics .............................................................................................. 63
23.2. Prerequisites ..................................................................................................................... 6323.3. Enable Monitoring ............................................................................................................. 63
23.3.1. Configuring WebLogic to Allow JMX Queries ............................................................ 6323.3.2. Configuring Zenoss ................................................................................................. 63
23.4. Change the Amount of Data Collected and Graphed ........................................................... 6423.5. Viewing Raw Data ............................................................................................................. 6523.6. Monitor SSL-Proxied WebLogic Servers ............................................................................. 6523.7. Daemons .......................................................................................................................... 65
24. BIG-IP Network Devices ............................................................................................................... 6624.1. About ................................................................................................................................ 6624.2. Prerequisites ..................................................................................................................... 6624.3. Enable Monitoring ............................................................................................................. 6624.4. Viewing Virtual Servers ...................................................................................................... 6724.5. Daemons .......................................................................................................................... 67
25. Brocade SAN Switches ................................................................................................................ 6825.1. About ................................................................................................................................ 6825.2. Prerequisites ..................................................................................................................... 6825.3. Enable Monitoring ............................................................................................................. 68
25.3.1. Configuring Brocade Devices to Allow SNMP Queries ............................................... 6825.3.2. Configuring Zenoss ................................................................................................. 68
25.4. Viewing Fibre Channel Port Information .............................................................................. 6925.5. Daemons .......................................................................................................................... 69
26. CheckPoint Firewalls .................................................................................................................... 7026.1. About ................................................................................................................................ 7026.2. Prerequisites ..................................................................................................................... 7026.3. Enable Monitoring ............................................................................................................. 70
26.3.1. Configuring CheckPoint Firewalls to Allow SNMP Queries ......................................... 7026.3.2. Configuring Zenoss ................................................................................................. 70
26.4. Daemons .......................................................................................................................... 7127. Cisco Devices .............................................................................................................................. 72
27.1. About ................................................................................................................................ 7227.2. Prerequisites ..................................................................................................................... 7227.3. Enable Monitoring ............................................................................................................. 72
27.3.1. Configuring Cisco Devices to Allow SNMP Queries ................................................... 7227.3.2. Configuring Zenoss ................................................................................................. 72
27.4. Forwarding Syslog Messages to Zenoss ............................................................................. 7327.5. Extended Capabilities for Cisco Devices ............................................................................. 73
27.5.1. IOS ........................................................................................................................ 7327.5.2. CatOS .................................................................................................................... 7427.5.3. ASA, FWSM and PIX ............................................................................................. 7427.5.4. Wireless LAN Controllers ........................................................................................ 7427.5.5. ACE Load Balancers .............................................................................................. 7427.5.6. Telepresence Codecs ............................................................................................. 74
27.6. Daemons .......................................................................................................................... 7528. Cisco UCS .................................................................................................................................. 76
28.1. About ................................................................................................................................ 76

Zenoss Extended Monitoring
vii
28.2. Prerequisites ..................................................................................................................... 7628.3. Adding a Cisco UCS Device for Monitoring ......................................................................... 7628.4. UCS Monitoring Credentials ............................................................................................... 7728.5. Daemons .......................................................................................................................... 77
29. Datacenter View .......................................................................................................................... 7829.1. About ................................................................................................................................ 7829.2. Prerequisites ..................................................................................................................... 7929.3. Working with the List View ................................................................................................. 7929.4. Working with the Custom View .......................................................................................... 79
29.4.1. Adding a Background Image to the Custom View ..................................................... 7929.4.1.1. Removing the Custom View Background Image ............................................. 80
29.4.2. Working with Devices in the Custom View ............................................................... 8029.4.3. Removing the Custom View .................................................................................... 80
29.5. Activating the Auto-Generated Rack View ........................................................................... 8130. Device Access Control Lists ......................................................................................................... 82
30.1. About ................................................................................................................................ 8230.2. Prerequisites ..................................................................................................................... 8230.3. Key Concepts ................................................................................................................... 82
30.3.1. Permissions and Roles ........................................................................................... 8230.3.2. Administered Objects .............................................................................................. 8230.3.3. Users and Groups .................................................................................................. 8230.3.4. Assigning Administered Object Accessa ................................................................... 8330.3.5. Restricted Screen Functionality ............................................................................... 83
30.3.5.1. Dashboard ................................................................................................... 8330.3.5.2. Device List .................................................................................................. 8330.3.5.3. Device Organizers ....................................................................................... 8330.3.5.4. Reporting ..................................................................................................... 8330.3.5.5. Viewing Events ............................................................................................ 83
30.4. Create a User Restricted to Specific Devices ...................................................................... 8330.5. Create a Manager Restricted to Specific Devices ................................................................ 8430.6. Adding Device Organizers ................................................................................................. 8430.7. Restricted User Organizer Management ............................................................................. 84
31. Distributed Collector ..................................................................................................................... 8531.1. About ................................................................................................................................ 85
31.1.1. Navigating Existing Collectors and Hubs .................................................................. 8531.1.2. Restrictions and Requirements ................................................................................ 8531.1.3. Installation Notes .................................................................................................... 8631.1.4. Firewall Notes ........................................................................................................ 8631.1.5. Platform Notes ....................................................................................................... 8631.1.6. Debugging .............................................................................................................. 87
31.2. Prerequisites ..................................................................................................................... 8731.3. Typical Usage Scenarios for Distributed Monitoring ............................................................. 87
31.3.1. ZeoDB - Local Hub - Local Collector ....................................................................... 8731.3.2. ZeoDB - Local Hub - Remote Collector .................................................................... 8731.3.3. ZeoDB - Local Hub - Multiple Remote Collectors ...................................................... 8731.3.4. ZeoDB - Multiple Remote Hubs - Multiple Remote Collectors ..................................... 88
31.4. Deploying Collectors .......................................................................................................... 8831.4.1. Prerequisite Tasks .................................................................................................. 8831.4.2. Adding Collectors ................................................................................................... 88
31.4.2.1. Install Remotely (Root Password) ................................................................. 8831.4.2.2. Install Remotely (Root SSH Keys) ................................................................ 9031.4.2.3. Install Remotely (Zenoss SSH Keys) ............................................................. 9131.4.2.4. Install Locally ............................................................................................... 92
31.4.3. Deleting Collectors .................................................................................................. 93

Zenoss Extended Monitoring
viii
31.4.4. Updating a Hub or Collector .................................................................................... 9331.4.5. Backing Up Remote Collectors ................................................................................ 93
31.5. Adding Devices to Collectors ............................................................................................. 9331.5.1. Moving Devices Between Collectors ........................................................................ 93
31.6. Managing the Collector Daemons ...................................................................................... 9431.7. Deploying Hubs ................................................................................................................. 94
31.7.1. Configuring MySQL for Remote Hubs ...................................................................... 9431.7.2. Add a Hub ............................................................................................................. 95
31.7.2.1. Install Remotely (Root Password) ................................................................. 9531.7.2.2. Install Remotely (Root SSH Keys) ................................................................ 9631.7.2.3. Install Remotely (Zenoss SSH Keys) ............................................................. 97
31.7.3. Setting Up SSH Keys for Distributed Collector .......................................................... 9832. Dynamic Service View ................................................................................................................ 100
32.1. About .............................................................................................................................. 10032.1.1. Dynamic View of Organizers ................................................................................. 10132.1.2. Dynamic View of Devices ...................................................................................... 102
32.1.2.1. Dynamic View of Cisco UCS Devices .......................................................... 10232.1.2.2. Dynamic View of VMware Hosts ................................................................. 10232.1.2.3. Dynamic View of Storage Devices .............................................................. 102
32.2. Prerequisites ................................................................................................................... 10232.3. Enabling .......................................................................................................................... 10232.4. Daemons ........................................................................................................................ 103
33. Enterprise Collector .................................................................................................................... 10433.1. About .............................................................................................................................. 10433.2. Prerequisites ................................................................................................................... 10433.3. Enabling Enterprise Collector ........................................................................................... 104
34. Enterprise Linux ......................................................................................................................... 10534.1. About .............................................................................................................................. 10534.2. Prerequisites ................................................................................................................... 10534.3. Add a Linux Server ......................................................................................................... 10534.4. Set Linux Server Monitoring Credentials ........................................................................... 10534.5. Resolving CHANNEL_OPEN_FAILURE Issues ................................................................. 10634.6. Resolving Command timed out Issues .............................................................................. 10734.7. DMIDECODE Modeler Plugin ........................................................................................... 10734.8. Daemons ........................................................................................................................ 108
35. Enterprise Reports ..................................................................................................................... 10935.1. About .............................................................................................................................. 109
35.1.1. 95th Percentile ..................................................................................................... 10935.1.2. Alert Rule Email Addresses ................................................................................... 10935.1.3. Defined Thresholds ............................................................................................... 10935.1.4. Event Time to Resolution ...................................................................................... 11035.1.5. Interface Volume .................................................................................................. 11035.1.6. Maintenance Windows .......................................................................................... 11035.1.7. Organizer Availability ............................................................................................ 11035.1.8. User Event Activity ............................................................................................... 11035.1.9. Users Group Membership ..................................................................................... 110
35.2. Viewing Enterprise Reports .............................................................................................. 11035.3. Prerequisites ................................................................................................................... 111
36. Enterprise Security ..................................................................................................................... 11236.1. About .............................................................................................................................. 11236.2. Prerequisites ................................................................................................................... 11236.3. Enabling Password Encryption ......................................................................................... 112
37. Foundry Device .......................................................................................................................... 11337.1. About .............................................................................................................................. 113

Zenoss Extended Monitoring
ix
37.2. Prerequisites ................................................................................................................... 11337.3. Configuring Zenoss ......................................................................................................... 11337.4. Daemons ........................................................................................................................ 114
38. Hewlett Packard UNIX ................................................................................................................ 11538.1. About .............................................................................................................................. 11538.2. Prerequisites ................................................................................................................... 11538.3. Limitations ....................................................................................................................... 11538.4. Add an HP-UX Device for Monitoring ............................................................................... 11538.5. Set HP-UX Server Monitoring Credentials ......................................................................... 116
38.5.1. Set Credentials for the Device ............................................................................... 11638.5.2. Set Credentials for the Device Class ...................................................................... 116
38.6. Resolving CHANNEL_OPEN_FAILURE Issues ................................................................. 11638.7. Resolving Command time out Issues ................................................................................ 11738.8. Daemons ........................................................................................................................ 118
39. JBoss Application Server ............................................................................................................ 11939.1. About .............................................................................................................................. 11939.2. Prerequisites ................................................................................................................... 12039.3. Enable Monitoring ............................................................................................................ 120
39.3.1. Configuring JBoss to Allow JMX Queries ............................................................... 12039.3.2. Configuring Zenoss ............................................................................................... 120
39.4. Change the Amount of Data Collected and Graphed ......................................................... 12139.5. Viewing Raw Data ........................................................................................................... 12239.6. Daemons ........................................................................................................................ 122
40. Juniper Devices ......................................................................................................................... 12340.1. About .............................................................................................................................. 12340.2. Prerequisites ................................................................................................................... 12340.3. Enable Monitoring ............................................................................................................ 123
40.3.1. Configuring Juniper Devices to Allow SNMP Queries .............................................. 12340.3.2. Configuring Zenoss ............................................................................................... 123
40.4. Daemons ........................................................................................................................ 12441. LDAP Authentication .................................................................................................................. 125
41.1. About .............................................................................................................................. 12541.2. Prerequisites ................................................................................................................... 125
41.2.1. LDAP Configuration Information ............................................................................. 12541.3. Limitations ....................................................................................................................... 12641.4. Authenticating with Microsoft Active Directory .................................................................... 126
41.4.1. Adding the Authentication Plugin ........................................................................... 12641.4.2. Configuring Plugin Settings ................................................................................... 12641.4.3. Enabling Group to Role Mapping ........................................................................... 12741.4.4. Verifying Connectivity and Credentials Outside of Zenoss ........................................ 128
41.5. Authenticating with other LDAP Servers ............................................................................ 12841.6. Optimizing Authentication with a Cache ............................................................................ 12941.7. Configuring Local Authentication as a Fallback .................................................................. 130
42. Mail Transactions ....................................................................................................................... 13142.1. About .............................................................................................................................. 131
42.1.1. Events .................................................................................................................. 13142.2. Prerequisites ................................................................................................................... 13142.3. Enable Monitoring ............................................................................................................ 13142.4. Daemons ........................................................................................................................ 132
43. MS Active Directory .................................................................................................................... 13343.1. About .............................................................................................................................. 13343.2. Prerequisites ................................................................................................................... 13343.3. Enable Monitoring ............................................................................................................ 13343.4. Daemons ........................................................................................................................ 134

Zenoss Extended Monitoring
x
44. MS Exchange ............................................................................................................................ 13544.1. About .............................................................................................................................. 13544.2. Prerequisites ................................................................................................................... 13544.3. Enable Monitoring ............................................................................................................ 13544.4. Daemons ........................................................................................................................ 136
45. Microsoft Message Queuing (MSMQ) Monitoring ......................................................................... 13745.1. About .............................................................................................................................. 13745.2. Prerequisites ................................................................................................................... 13745.3. Configuration ................................................................................................................... 137
45.3.1. Automatically Monitor Queues on All Servers ......................................................... 13745.3.2. Monitor Queues on Specific Servers ...................................................................... 13845.3.3. Fine-Tuning Queue Monitoring .............................................................................. 138
45.4. Daemons ........................................................................................................................ 13846. Microsoft Internet Information Services (IIS) ................................................................................. 139
46.1. About .............................................................................................................................. 13946.2. Prerequisites ................................................................................................................... 13946.3. Enable Monitoring ............................................................................................................ 13946.4. Daemons ........................................................................................................................ 140
47. Microsoft SQL Server ................................................................................................................. 14147.1. About .............................................................................................................................. 14147.2. Prerequisites ................................................................................................................... 14147.3. Enable Monitoring ............................................................................................................ 14147.4. Collecting Information from Non-Default Microsoft SQL Server Instances ............................ 14247.5. Daemons ........................................................................................................................ 142
48. Multi-Realm IP Networks ............................................................................................................ 14348.1. About .............................................................................................................................. 14348.2. Prerequisites ................................................................................................................... 14348.3. Example System ............................................................................................................. 14348.4. System Setup .................................................................................................................. 144
48.4.1. Adding Realms ..................................................................................................... 14448.4.2. Adding Collectors to Realms ................................................................................. 14448.4.3. Adding Devices to Realms .................................................................................... 145
48.5. Notes .............................................................................................................................. 14549. NetApp Filers ............................................................................................................................. 146
49.1. About .............................................................................................................................. 14649.1.1. Performance Graphs ............................................................................................. 146
49.2. Prerequisites ................................................................................................................... 14749.3. Enable Monitoring ............................................................................................................ 147
49.3.1. Configuring NetApp Devices to Allow SNMP Queries .............................................. 14749.3.2. Configuring Zenoss ............................................................................................... 147
49.4. Using SSH to Model NFS Clients ..................................................................................... 14849.5. Forwarding syslog Events from NetApp ............................................................................ 14849.6. Daemons ........................................................................................................................ 148
50. NetScreen Devices ..................................................................................................................... 14950.1. About .............................................................................................................................. 14950.2. Prerequisites ................................................................................................................... 14950.3. Enable Monitoring ............................................................................................................ 149
50.3.1. Configuring NetScreen Devices to Allow SNMP Queries .......................................... 14950.3.2. Configuring Zenoss ............................................................................................... 149
50.4. Daemons ........................................................................................................................ 15051. Nortel Devices ........................................................................................................................... 151
51.1. About .............................................................................................................................. 15151.2. Prerequisites ................................................................................................................... 15151.3. Enable Monitoring ............................................................................................................ 151

Zenoss Extended Monitoring
xi
51.3.1. Configuring Nortel Devices to Allow SNMP Queries ................................................ 15151.3.2. Configuring Zenoss ............................................................................................... 151
51.4. Daemons ........................................................................................................................ 15252. Oracle ....................................................................................................................................... 153
52.1. About .............................................................................................................................. 15352.2. Prerequisites ................................................................................................................... 15352.3. Enable Monitoring ............................................................................................................ 153
52.3.1. Authorize Oracle Performance Data Access ........................................................... 15352.3.2. Configure Zenoss ................................................................................................. 153
52.4. Monitor Additional SIDs ................................................................................................... 15452.5. Monitoring Other Tables or Views .................................................................................... 15452.6. Daemons ........................................................................................................................ 155
53. Predictive Thresholding .............................................................................................................. 15653.1. About .............................................................................................................................. 15653.2. Prerequisites ................................................................................................................... 15653.3. Add a Predictive Threshold .............................................................................................. 156
54. RANCID Integration .................................................................................................................... 15854.1. About .............................................................................................................................. 15854.2. Prerequisites ................................................................................................................... 15854.3. Enable Integration ........................................................................................................... 158
54.3.1. Configure Cisco Devices to Send Traps ................................................................. 15854.3.2. Configure RANCID Update Information in Zenoss ................................................... 158
55. Remedy Ticket Creation ............................................................................................................. 16055.1. About .............................................................................................................................. 16055.2. Prerequisites ................................................................................................................... 16055.3. Enable Ticket Creation .................................................................................................... 16055.4. Send Test Tickets ........................................................................................................... 16055.5. Daemons ........................................................................................................................ 160
56. SNMP Trap Forwarding .............................................................................................................. 16156.1. About .............................................................................................................................. 16156.2. Prerequisites ................................................................................................................... 16156.3. Enable Event Forwarding ................................................................................................. 161
56.3.1. Import Zenoss MIB onto the Remote Receiver ........................................................ 16156.3.2. Configure Zenoss to Send Events as Traps ........................................................... 161
56.4. Send Test Events ............................................................................................................ 16256.5. Daemons ........................................................................................................................ 162
57. Solaris ....................................................................................................................................... 16357.1. About .............................................................................................................................. 16357.2. Prerequisites ................................................................................................................... 16357.3. Limitations ....................................................................................................................... 16357.4. Set Solaris Server Monitoring Credentials ......................................................................... 16357.5. Enable Monitoring ............................................................................................................ 16457.6. Resolving CHANNEL_OPEN_FAILURE Issues ................................................................. 16457.7. Resolving Command time out Issues ................................................................................ 16557.8. Daemons ........................................................................................................................ 165
58. Splunk Monitoring ...................................................................................................................... 16758.1. About .............................................................................................................................. 16758.2. Prerequisites ................................................................................................................... 16758.3. Splunk Data Source Type ................................................................................................ 16758.4. Monitoring Splunk Searches ............................................................................................. 168
58.4.1. Monitoring Results of a Simple Search ................................................................... 16858.4.2. Monitoring Results of a Top Search ....................................................................... 170
58.5. Daemons ........................................................................................................................ 17259. SQL Transactions ...................................................................................................................... 173

Zenoss Extended Monitoring
xii
59.1. About .............................................................................................................................. 17359.2. Prerequisites ................................................................................................................... 17359.3. Enable SQL Server Monitoring ......................................................................................... 17359.4. Enable Sybase Server Monitoring .................................................................................... 17459.5. Enable MySQL Server Monitoring .................................................................................... 17559.6. Storing Query Results ...................................................................................................... 17659.7. Troubleshooting ............................................................................................................... 17759.8. Daemons ........................................................................................................................ 177
60. Storage Base ............................................................................................................................. 17860.1. About .............................................................................................................................. 17860.2. Prerequisites ................................................................................................................... 178
61. Sugar CRM ................................................................................................................................ 17961.1. About .............................................................................................................................. 17961.2. Prerequisites ................................................................................................................... 17961.3. Enable Monitoring ............................................................................................................ 179
61.3.1. Configuring Zenoss ............................................................................................... 17961.4. Daemons ........................................................................................................................ 180
62. VMware ESX ............................................................................................................................. 18162.1. About .............................................................................................................................. 18162.2. Prerequisites ................................................................................................................... 18162.3. Monitoring VMware ESX Servers ..................................................................................... 18162.4. Enabling SNMP Subagents .............................................................................................. 18162.5. Daemons ........................................................................................................................ 182
63. VMware Virtual Hosts ................................................................................................................. 18363.1. About .............................................................................................................................. 183
63.1.1. VMware Events .................................................................................................... 18363.1.1.1. Migration Events ........................................................................................ 184
63.2. Prerequisites ................................................................................................................... 18463.2.1. Installing Prerequisite Libraries ................................................................................ 46
63.3. Enable Monitoring ............................................................................................................ 18563.4. Viewing VMware Devices ................................................................................................. 18663.5. Viewing Guest Virtual Machines ....................................................................................... 18763.6. Enabling Data Collection Using resxtop ............................................................................ 188
63.6.1. Gathering VMware Host Statistics .......................................................................... 18863.6.2. Gathering VMware Guest Statistics ........................................................................ 188
63.7. Adding a Custom Metric .................................................................................................. 18963.8. Moving VMware Devices Between Collectors .................................................................... 19063.9. Daemons ........................................................................................................................ 190
63.9.1. Tuning Options ..................................................................................................... 19164. WebSphere Application Server ................................................................................................... 192
64.1. About .............................................................................................................................. 19264.2. Prerequisites ................................................................................................................... 19264.3. Enable Monitoring ............................................................................................................ 192
64.3.1. Configure WAS for Monitoring ............................................................................... 19264.3.2. Configure Zenoss ................................................................................................. 192
64.4. Examples ........................................................................................................................ 19364.5. Daemons ........................................................................................................................ 194
65. Web-Based Synthetic Transactions ............................................................................................. 19565.1. About .............................................................................................................................. 195
65.1.1. Data Points .......................................................................................................... 19565.1.2. Event Generation .................................................................................................. 195
65.2. Prerequisites ................................................................................................................... 19665.3. Enable Monitoring ............................................................................................................ 19665.4. Creating twill Commands ................................................................................................. 197

Zenoss Extended Monitoring
xiii
65.4.1. Creating twill Commands from TestGen4Web ......................................................... 19865.4.2. Creating twill Commands Manually ........................................................................ 198
65.5. Monitoring through Proxy Servers .................................................................................... 19865.5.1. Example Proxy Setup ........................................................................................... 19965.5.2. Testing the Proxy Setup ........................................................................................ 199
65.6. Daemons ........................................................................................................................ 19966. Windows Performance ................................................................................................................ 200
66.1. About .............................................................................................................................. 20066.2. Prerequisites ................................................................................................................... 20066.3. Enable Monitoring ............................................................................................................ 200
66.3.1. Defining Windows Credentials ............................................................................... 20066.3.2. Add Devices in Zenoss ......................................................................................... 201
66.4. Monitor Other Performance Counters ............................................................................... 20166.5. Testing Connections from Windows .................................................................................. 20166.6. Testing Connections from Zenoss .................................................................................... 20266.7. Modify Registry Settings for Firewalls in Secure Environments ........................................... 20266.8. Configuring a Standalone Windows Device for a Non-Administrative Account ...................... 20266.9. Tuning Collector Daemon Performance ............................................................................. 20766.10. Enabling the NTLMv2 Authentication Protocol ................................................................. 207
67. Zenoss Global Dashboard .......................................................................................................... 20867.1. About .............................................................................................................................. 20867.2. Prerequisites ................................................................................................................... 20867.3. Configuration ................................................................................................................... 208
67.3.1. Install the ZenGlobe Web Server ........................................................................... 20867.3.2. Configure Remote Zenoss for Monitoring ............................................................... 20967.3.3. Configure ZenGlobe to Monitor Remote Zenoss Instances ...................................... 209
67.4. Viewing a Remote Zenoss Instance .................................................................................. 21067.5. Ending a Session ............................................................................................................ 210
68. ZenOperator Role ...................................................................................................................... 21168.1. About .............................................................................................................................. 21168.2. Prerequisites ................................................................................................................... 211
A. twill Commands Reference ................................................................................................................... 212A.1. About ....................................................................................................................................... 212A.2. Browsing .................................................................................................................................. 212A.3. Assertions ................................................................................................................................ 212A.4. Display ..................................................................................................................................... 212A.5. Forms ....................................................................................................................................... 213A.6. Cookies .................................................................................................................................... 213A.7. Debugging ................................................................................................................................ 213A.8. Other Commands ..................................................................................................................... 214A.9. Details on Form Handling .......................................................................................................... 214A.10. ZenWebTx Extensions to twill .................................................................................................. 215
A.10.1. twilltiming ..................................................................................................................... 215A.10.2. twillextract .................................................................................................................... 216A.10.3. twillxpathextract ............................................................................................................ 216A.10.4. ignorescripts ................................................................................................................. 217

1
Chapter 1. ZenPacks1.1. About ZenPacks
ZenPacks extend and modify the system to add new functionality. This can be as simple as adding new deviceclasses or monitoring templates, or as complex as extending the data model and providing new collection daemons.
You can use ZenPacks to add:
• Monitoring templates
• Data sources
• Graphs
• Event classes
• Event and user commands
• Reports
• Model extensions
• Product definitions
Simple ZenPacks can be created completely within the user interface. More complex ZenPacks require developmentof scripts or daemons, using Python or another programming language.
ZenPacks can be distributed for installation on other Zenoss systems.
1.1.1. Provided ZenPacks
A range of provided ZenPacks add and extend system functionality. These ZenPacks are grouped as Core ZenPacks(available to all users) and Enterprise ZenPacks, which are available only to Zenoss Enterprise implementations.
The guide titled Zenoss Extended Monitoring provides detailed descriptions, installation information, and configu-ration details for Core and Enterprise ZenPacks.
The following sections provide information and procedures to help you:
• Install ZenPacks
• Create ZenPacks
• Package and distribute ZenPacks
• Remove ZenPacks
1.2. Installing ZenPacks
ZenPacks are distributed as .egg files. You can install ZenPacks from the command line on the Zenoss server, orfrom the user interface.
1.2.1. Installing from the Command Line
Use these commands to install a ZenPack file and then restart the system:
zenpack --install <filename>

ZenPacks
2
zenoss restart
If you have the source code for the ZenPack you can install directly from that rather than from an .egg file. Thecommand is the same; however, you must specify the directory containing the source code. This copies the sourcecode to $ZENHOME/ZenPacks:
zenpack --install <directoryname>zenoss restart
If you are developing a ZenPack, you should maintain your source code outside of $ZENHOME/ZenPacks for tworeasons:
• if you issue a zenpack --remove command it will delete your code from that location and you will lose your filesunless you have them backed up elsewhere.
• if you are maintaining your source code in a version control system it is frequently more convenient to have thefiles reside elsewhere on the file system.
Using the --link option, you can install the ZenPack but have the system use your code from its current location.Instead of installing your code in $ZENHOME/ZenPacks, the system will create a link in that location that points to yoursource code directory.
zenpack --link --install <directoryname>zenoss restart
1.2.2. Installing from the User Interface
To upload and install a ZenPack .egg file from the user interface:
1. From the navigation bar, select Advanced > Settings.
2. In the left panel, select ZenPacks.
3.From (Action menu), select Install ZenPack.
The Install ZenPack dialog appears.
4. Browse to and select the .egg file you want to install, and then click OK.
The file is uploaded to the Zenoss server and installed.
Note
After installing the ZenPack, you should restart the system.
1.2.3. Installing All Core ZenPacks from RPM
The core ZenPacks, along with third party ZenPacks, are available for download individually from:
http://community.zenoss.org/community/zenpacks
At that location is a link to download an RPM that includes the most popular core ZenPacks. To install via the coreZenPacks RPM follow these steps:
1. Download the appropriate file from the ZenPacks download area specific to your version.
2. Make sure ZEO is running (as the zenoss user):
zeoctl start
3. Install the rpm (as root user):

ZenPacks
3
rpm -ihv <rpm file>
4. Restart Zope and ZenHub:
zopectl restartzenhub restart
1.2.4. Viewing Loaded ZenPacks
To see which ZenPacks are loaded on your system:
1. From the navigation bar, select Advanced.
The Settings page appears.
2. Select ZenPacks in the left panel.
The list of loaded ZenPacks appears.
Figure 1.1. Loaded ZenPacks
From the action menu on this page, you can create, install, and delete ZenPacks.
Note
Alternatively, you can view loaded ZenPacks from the command line:
zenpack --list
1.3. Creating ZenPacks
Read the following information and procedures to learn more about why you might want to create a ZenPack, andhow to:
• Create a ZenPack
• Add a database object to a ZenPack
• View database objects in a ZenPack
• Remove a database object from a ZenPack
• Add other items to a ZenPack

ZenPacks
4
1.3.1. Why Create a ZenPack?
Suppose you have developed a monitoring template for a new piece of hardware. You have created data sourcesfor the OID's you think are worth monitoring, thresholds to make sure some of these values stay within reasonablelimits, and several graph definitions to show this data graphically. Perhaps you also have created a new deviceclass for this hardware. You can create a ZenPack to easily distribute your template and device class to otheradministrators. This ZenPack can be entirely created from within the user interface.
As another example, suppose you want to monitor a new piece of software running on one of your servers. Youwould like to monitor several performance metrics of this software, but they are available only via a programmaticAPI provided with the software. You could develop a new collector daemon to gather data via this API and provideit back to the system. You might also create a new type of data source to provide configuration data for the newcollector. Obviously this effort would require development skills and intimate knowledge of the system not necessaryfor the previous example, but this functionality can be distributed as a ZenPack.
1.3.2. Create a ZenPack
Use the following instructions and guidelines to create a ZenPack.
Note
You must be logged in as an administrator to create a ZenPack.
1. From the navigation bar, select Advanced > Settings.
2. In the left panel, select ZenPacks.
3.From (Action menu), select Create a ZenPack.
The Create a ZenPack dialog appears.
4. Enter the name of the ZenPack, which must be in the format:
ZenPacks.Organization.Identifier
where Organization is a name that identifies you or your organization and Identifier is a string that representsthe intent of your ZenPack.
5. Click OK.
The system creates the ZenPack object in the database and a new directory in the file system $ZENHOME/Zen-Packs/YourZenPackID.
1.3.3. Add a Database Object to a ZenPack
To add a database object (such as a device, service, or event class, event mapping, user or event command, deviceorganizer, or monitoring template) to a ZenPack:
1. Navigate to the object in the interface.
2. From the Action menu, select Add to ZenPack.

ZenPacks
5
Figure 1.2. Add to ZenPack
The Add to ZenPack dialog appears.
3. Select a ZenPack from the list of installed ZenPacks, and then click Submit.
1.3.4. View Database Objects in a ZenPack
To view the objects that are part of a ZenPack:
1. From the navigation bar, select Advanced > Settings.
2. In the left panel, select ZenPacks.
3. Click the name of a ZenPack in the list.
The ZenPack Provides area of the page lists objects that are part of the ZenPack.
1.3.5. Remove a Database Object from a ZenPack
To remove a database object from a ZenPack:
1. From the navigation bar, select Advanced > Settings.
2. In the left panel, select ZenPacks.
3. Click the name of a ZenPack in the list.
4. Select an object in the ZenPack Provides area of the page.
5. From the Action menu, select Delete from ZenPack.
1.3.6. Adding Other Items to ZenPacks
ZenPacks can contain items that are not ZEO database items, such as:
• Daemons
• Data source types
• Skins
You can add these to a ZenPack by placing them in the appropriate subdirectory in the ZenPack's directory. Seethe Core ZenPacks at http://community.zenoss.org/community/zenpacks for examples of how to incorporate suchitems into your ZenPack.
1.4. Packaging and Distributing ZenPacks
Follow these steps to create an installable ZenPack .egg file:
1. From the navigation bar, select Advanced > Settings.
2. In the left panel, select ZenPacks.

ZenPacks
6
3. Click the name of a ZenPack in the list.
4.From (Action menu) located at the bottom left of the page, select Export ZenPack.
The Export ZenPack dialog appears.
Figure 1.3. Export ZenPack
5. Select one of the export options:
• Export to $ZENHOME/exports - Exports the ZenPack to a file named ZenPackID.egg in the $ZENHOME/ex-ports directory on the Zenoss server.
• Export to $ZENHOME/exports - Additionally downloads the exported file to your browser. Other adminis-trators can then install this exported .egg file.
6. Click OK.
1.5. Removing ZenPacks
Warning
Removing a ZenPack can have unexpected consequences. For example, removing a ZenPack that installs adevice class removes the device class and all devices in that class.
Before removing a ZenPack, you should:
• Delete any data source of a type provided by the ZenPack
• Perform a backup of your system data. (See the section titled "Backup and Restore" in Zenoss Administrationfor information on backing up your system data.)
1.6. Where to Find More InformationFurther information about ZenPack development is available in the Zenoss Developer's Guide.
Discussions about ZenPack development and implementation take place on the zenoss-dev and zenoss-zenpacksforums:
• http://community.zenoss.org/community/forums
• http://community.zenoss.org/community/developers/zenpack_development
• http://zenpacks.zenoss.org

Part I. Core ZenPacks

8
Chapter 2. Amazon Web Services2.1. About
The Amazon Web Services™ (AWS™) ZenPack allows you to monitor Amazon Elastic Compute Cloud™ (AmazonEC2™) server instances. It collects information for these objects monitored through Amazon's CloudWatch APIs:
• Account
• Instance
• Instance Type
When you install the ZenPack, the /AWS/EC2 device class is added to your Zenoss instance. A single device in theEC2 class, EC2Manager, represents your EC2 account. All instances and instance types are contained in the EC2account manager.
2.2. Prerequisites
You must have a valid Amazon Web Services account with the Elastic Compute Cloud service enabled.
Modeling and performance requests to Amazon are sent via XML over http or https. You must open port 80, port443, or both on your Zenoss server so that requests can be sent to Amazon's infrastructure through the Internet.
The Zenoss server time must be correct; otherwise, no performance data will be returned.
Prerequisite Restriction
Zenoss Version Zenoss Version 2.5 or higher
Required ZenPacks AWS
Table 2.1. Prerequisites
2.3. Setup
To set up the EC2 account manager in Zenoss, follow these steps:
1. Retrieve your Amazon EC2 access credentials.
a. Browse to http://aws.amazon.com.
b. Select Security Credentials from the Your Account list of options.
The Access Key ID and Secret Access Key values appear on the Access Keys tab.

Amazon Web Services
9
Figure 2.1. Access Credentials
2. In the Zenoss interface, select Infrastructure, and then select the EC2Manager device in the device list.
3. Select Configure EC2 in the left panel.
4. Enter access credentials.
Note
Entering a class for the Device Mapping field allows the system to monitor an EC2 instance as a normaldevice. If no class is specified, then the instances are monitoring within EC2Manager only.
5. Model the EC2Manager account to retrieve the Instance and InstanceType objects.
2.4. Working with the EC2Manager AccountSelect Infrastructure, and then select the EC2Manager account in the device list. Select Instances in the left panelto see each instance that is active in your Amazon EC2 account. Click an instance to view detailed information
The Instance Type field is a link to a type object that references all instances of a particular type.
2.4.1. CloudWatch Data
Amazon provides monitoring information through its CloudWatch APIs. These APIs provide monitoring informationfor each of their primary objects (Account, Instance, and Instance Type).
Metrics provided by the API are:
• CPU utilization
• Network in/out
• Disk bytes read/write
• Disk operations read/write
The metrics for an instance apply directly for the instances; for example, if an instance shows 100% CPU utilization,then its CPU is at maximum. However, for an instance type, 100% CPU utilization means that all instances withinthat type are at 100% CPU utilization. The same is true for the account; metrics are summed for all instances.
Zenoss collects monitoring information for the Account, Instance, and Instance Type objects. Account informationappears on the Perf tab. Instance and Instance Type information appears on their main screens.

Amazon Web Services
10
2.4.2. Templates and Collection
Zenoss uses the standard monitoring template system to configure EC2 Manager accounts. Each template relieson a custom ZenCommand, zencw2, that polls the CloudWatch API and returns all available parameters. Theseparameters are used by their associated graphs. You can set thresholds against the parameters.
Templates for each primary object type are defined in the /AWS/EC2 class.
Object Type Template
Account EC2Manager
Instance EC2Instance
Instance Type EC2InstanceType
Table 2.2. Primary Object Type Templates
2.4.2.1. Example: Initiating Load-Based Elasticity for an EC2 Setup
Suppose you want to use Zenoss to initiate load-based elasticity for your EC2 setup. For example, each time theaccount CPU exceeds 80%, you want Zenoss to create a new instance. To set up this scenario, you would first setup and model your account. Then, you would follow these steps:
1. Select the EC2Manager device in the Devices section of the Infrastructure page, and then expand the Monitoringtemplates node at the left of screen and click the EC2Manager template.
2. Add a threshold against the zencw2_CPUUtilization CPU Utilization data point, and then set its event class to/Perf/CPU.
Each time the CPU exceeds the threshold, Zenoss creates an event with the device name EC2Manager in the/Perf/CPU class.
3. Create an event command that matches this event, and launch the EC2 command to create the new instances.
When the event is initiated, the new instances will be created.
Note
The clear command can be used to shut down unneeded instances.

11
Chapter 3. Apache Web Server3.1. AboutThe ApacheMonitor ZenPack provides a method for pulling performance metrics from the Apache Web serverdirectly into Zenoss, without requiring the use of an agent. This is accomplished by using Apache's mod_statusmodule that comes with Apache Version 1 and 2.
The following metrics are collected and graphed for the Apache HTTP server.
• Requests per Second
• Throughput (Bytes/sec and Bytes/request)
• CPU Utilization of the HTTP server and all worker processes or threads
• Slot Usage (Open, Waiting, Reading Request, Sending Reply, Keep-Alive DNS Lookup, and Logging)
3.2. Prerequisites
Prerequisite Restriction
Zenoss Version Zenoss Version 2.2 or higher
Required ZenPacks ZenPacks.zenoss.ApacheMonitor
Table 3.1. Apache Prerequisites
3.3. Enable MonitoringFollow the steps in these sections to:
• Display the status page in Apache Version 1.3 or higher
• Display the status page in Apache Version 2.x
• Configure your configuration
• Configure the system to monitor the Web server
3.3.1. Display the Status Page in Apache Version 1.3 or Higher1. On the Apache server, locate the httpd.conf file. Generally, this file is located at /etc/httpd/httpd.conf or /
etc/httpd/conf/httpd.conf; however, other locations are possible depending on your operating system andsetup.
If you cannot locate the configuration file, use your system's search facilities to locate it. For Windows, use theSearch button of the Windows Explorer tool. For Unix, try the following command:
find / -name httpd.conf
2. Check to see that the following line is not commented out and is available in httpd.conf or /etc/apache/modules.conf:
LoadModule status_module /usr/lib/apache/1.3/mod_status.so
Note
You may have to search in alternate locations to find the mod_status.so file. Also, the syntax may differdepending on your configuration.

Apache Web Server
12
3. Turn the ExtendedStatus option on in the httpd.conf file. This option is typically commented out. You canenable it by uncommenting it or ensuring that it is defined.
#ExtendedStatus on
becomes:
ExtendedStatus on
4. Enable the /server-status location in the httpd.conf file. Typically, this option exists but is commented out.
#<Location /server-status># SetHandler server-status# Order deny,allow# Deny from all# Allow from .example.com#</Location>
becomes:
<Location /server-status>SetHandler server-statusOrder deny,allowDeny from allAllow from zenoss.example.com</Location>
Note
Your Zenoss server or servers must be able to connect to your Apache server. Ensure that it is listed here oris part of the network specified in this chunk of configuration.
To specify multiple servers, separate the entries with spaces. If you specify an IP address range rather thana destination, be sure to add a network mask to the end of the IP address range.
The following example allows a server called externalzenoss.example.com, as well as all servers that startwith 192.168.10, in their addresses:
<Location /server-status>SetHandler server-statusOrder deny,allowDeny from allAllow from externalzenoss.example.com 192.168.10.0/24</Location>
5. Save the httpd.conf file with these changes and verify that the configuration file is correct. This can be accom-plished with following command.
apachectl -t
Correct any issues before restarting Apache.
6. Restart the Web server (httpd). This can be accomplished with following command.
apachectl restart
3.3.2. Display the Status Page in Apache Version 2.x1. On the Apache server, find the httpd.conf file. This is usually /etc/apache2/apache2.conf or /etc/apache2/
conf/httpd.conf; however, other locations are possible depending on your operating system and setup.

Apache Web Server
13
If you are unsure about where your configuration file is located, use your system;s search facilities to locatethis file. Under Windows, use the Search button of the Windows Explorer tool. Under Unix, try the followingcommand:
find / -name httpd.conf
2. Verify that the mod_status module is loaded.
apache% apachec2ctl -M 2<&1 | grep statusstatus_module (shared)
The previous output indicates that the module is loaded and no further configuration is necessary. If there is nooutput, then copy the mods-available/status.load to the mods-enabled directory, and then run:
apache% /etc/init.d/apache2 force-reload
3. Turn the ExtendedStatus option on in the httpd.conf file. This option is typically commented out. You canenable it by uncommenting it or ensuring that it is defined.
#ExtendedStatus on
becomes:
ExtendedStatus on
4. Enable the /server-status location in the httpd.conf file. This is another option that typically already existsbut is commented out.
#<Location /server-status># SetHandler server-status# Order deny,allow# Deny from all# Allow from .example.com#</Location>
becomes:
<Location /server-status>SetHandler server-statusOrder deny,allowDeny from allAllow from zenoss.example.com</Location>
Note
Your Zenoss server or servers must be able to connect to your Apache server so you must ensure that it iseither listed here or is a part of the network specified in this chunk of configuration.
To specify multiple servers, separate the entries with spaces. If you would like to specify an IP address rangerather than a destination, be sure to add a network mask to the end of the IP address range. The followingexample allows a server called externalzenoss.example.com as well as all servers that start with '192.168.10'in their addresses:
<Location /server-status>SetHandler server-statusOrder deny,allowDeny from allAllow from externalzenoss.example.com 192.168.10.0/24</Location>
5. Save the httpd.conf file with these changes and verify that the configuration file is correct. This can be accom-plished with following command.

Apache Web Server
14
apache2ctl -t
Correct any issues before restarting Apache.
6. Restart the webserver (httpd). This can be accomplished with following command.
apache2ctl restart
3.3.3. Verifying Your Apache Configuration
Once Apache has been configured, you should verify that it is working correctly. To verify your Apache server, pointyour Web browser to your Apache server at the appropriately modified URL:
http://your-apache-server/server-status?auto
This is an example of what you might see:
Total Accesses: 1Total kBytes: 2Uptime: 43ReqPerSec: .0232558BytesPerSec: 47.6279BytesPerReq: 2048BusyWorkers: 1IdleWorkers: 5Scoreboard: _W____................................
If there is a configuration issue, you should see an error message telling you that the page is forbidden.
Note
Your Zenoss server or servers must be able to connect to your Apache server by using HTTP to receive informa-tion. This means that the Zenoss server must be permitted not only by the Apache configuration settings, but alsoby any firewalls or proxies between the Zenoss server and the Apache server, including any firewall on the Apacheserver. If there are any proxies, they must be configured to allow the Zenoss HTTP traffic through to Zenoss.Consult your network administrator and security officer to verify the firewall configuration and your site's policies.
Further note that the name or IP address that your server has behind a firewall may be different than the IPaddress (some form of Network Address Translation (NAT)) or name resolution (the way that the external serverresolves names may be through an Internet-visible DNS system rather than an intranet-only DNS system).
3.3.4. Configure Zenoss to Monitor the Web Server
Once the Apache server is configured to allow Zenoss to access the extended status, you can add Apache moni-toring to the device within Zenoss by binding the Apache template to the device.
1. Select Infrastructure from the navigation bar.
2. Click the device name in the device list.
The device overview page appears.
3. In the left panel, expand Monitoring Templates, and then select Device.
4. Select Bind Templates from the Action menu.
The Bind Templates dialog appears.
5. Add the Apache template to the list of templates, and then click Save.
The Apache template is added. The system can now begin collecting the Apache server metrics from this device.

Apache Web Server
15
3.4. Daemons
Type Name
Performance Collector zencommand
Table 3.2. Daemons

16
Chapter 4. Dell Hardware4.1. About
The DellMonitor ZenPack provides custom modeling of devices running the Dell OpenManage agents. It also con-tains hardware identification for Dell proprietary hardware. The information is collected through the SNMP interface.
The following information is modeled:
• Hardware Model
• Hardware Serial Number
• Operating System
• CPU Information (socket, speed, cache, voltage)
• PCI Card Information (manufacturer, model)
4.2. Prerequisites
Prerequisite Restriction
Zenoss Version Zenoss Version 2.2 or higher
Required ZenPacks ZenPacks.zenoss.DellMonitor
On each remote device The Dell OpenManage SNMP Agent is used to gather informa-tion about the device.
Table 4.1. Dell Hardware Prerequisites
4.3. Enable Enhanced Modeling
To enable modeling:
1. Select Infrastructure from the navigation bar.
2. Click the device name in the device list.
The device overview page appears.
3. Select Modeler Plugins from the left panel.
4. Click Add Fields to reveal the list of available plugins.
5. Select the following plugins from the Available fields list, and then drag them to the Plugins list:
• DellCPUMap
• DellDeviceMap
• DellPCIMap
6. Remove the following plugins by clicking on the 'X' button located to the right of the plugin.
• zenoss.snmp.CpuMap
• zenoss.snmp.DeviceMap
7. Click Save to save the updates.
8. Remodel the device using these new plugins by selecting Model Device from the Action menu.

Dell Hardware
17
4.4. Daemons
Type Name
Modeler zenmodeler
Performance Collector zenperfsnmp
Table 4.2. Daemons

18
Chapter 5. Domain Name System (DNS)5.1. AboutDigMonitor monitors the response time of DNS lookups for devices running a DNS server.
5.2. Prerequisites
Prerequisite Restriction
Zenoss Version Zenoss Version 2.2 or higher
Required ZenPacks ZenPacks.zenoss.DigMonitor
Table 5.1. DNS (DigMonitor) Prerequisites
5.3. Enable MonitoringTo enable monitoring by the system:
1. Select Infrastructure from the navigation bar.
2. Click the device name in the device list.
The device overview page appears.
3. Expand Monitoring Templates in the left panel, and then select Device.
4. Select Bind Templates from the Action menu.
The Bind Templates dialog appears.
5. Add the DigMonitor template to the list of selected templates, and then click OK.
The DigMonitor template appears under Monitoring Templates.
6. Select the DigMonitor template in the left panel, and change options as needed.
Option Description
DNS Server Name server against which the dig command should be run.
Port Port on which the name server is listening. This is normally port53.
Record Name Name of the record you want to look up.
Record Type DNS record type (for example, A, MX, CNAME).
Table 5.2. DigMonitor Data Source Options
5.4. Daemons
Type Name
Performance Collector zencommand
Table 5.3. Daemons

19
Chapter 6. File Transfer Protocol (FTP)6.1. AboutThe FTPMonitor ZenPack monitors connection response time to an FTP server.
6.2. Prerequisites
Prerequisite Restriction
Zenoss Version Zenoss Version 2.2 or higher
Required ZenPacks ZenPacks.zenoss.FTPMonitor
Table 6.1. FTP Prerequisites
6.3. Enable MonitoringTo enable monitoring of the device:
1. Select Infrastructure from the navigation bar.
2. Click the device name in the device list.
The device overview page appears.
3. Expand Monitoring Templates in the left panel, and then select Device.
4. Select Bind Templates from the Action menu.
The Bind Templates dialog appears.
5. Select the FTPMonitor template and move it to the list of selected templates.
6. Click Save.
The FTPMonitor template appears under Monitoring Templates.
7. Select the FTPMonitor template and change options as needed.
Option Description
Port The port to connect to FTP server (default 21)
Send String Command string to send to the server
Expect String A string to expect in server response
Mismatch If the expected string does not match the string returned fromthe remote server, create an event with one of these states: ok,warn, crit (default: warn)
Quit String Command to send to the remote server to end the session
Table 6.2. FTPMonitor Basic Data Source Options
6.4. Enable Secure Site MonitoringTo enable secure site monitoring:
1. Select Infrastructure from the navigation bar.

File Transfer Protocol (FTP)
20
2. Click the device name in the devices list.
The device overview page appears.
3. Expand Monitoring Templates in the left panel.
4. Select the FTPMonitor template and change options as needed.
Option Description
Port The port to connect to FTP server (default 21).
Certificate Minimum days for which a certificate is valid
Use SSL Use SSL for the connection
Table 6.3. FTPMonitor Secure Data Source Options
6.5. Tuning for Site Responsiveness1. Select Infrastructure from the navigation bar.
2. Click the device name in the devices list.
The device overview page appears.
3. Expand Monitoring Templates in the left panel.
4. Select the FTPMonitor template and change options as needed.
Option Description
Timeout Seconds before connection times out (default: 60)
Refuse If a TCP/IP connection to the remote service is refused (ie noprogram is listening at that port) send an event with one ofthese severity states: ok, warn, crit (default: crit)
Max Bytes Close the connection once more than this number of bytes arereceived.
Delay Seconds to wait between sending string and polling for re-sponse
Warning response time (seconds) Response time to result in a warning status.
Critical response time (seconds) Response time to result in critical status
Table 6.4. FTPMonitor Tunables Data Source Options
6.6. Daemons
Type Name
Performance Collector zencommand
Table 6.5. Daemons

21
Chapter 7. HP PC Hardware7.1. About
HPMonitor provides custom modeling of devices running the HP Insight Management Agents. It also contains hard-ware identification for HP proprietary hardware. The information is collected through the SNMP interface.
The following information is modeled:
• Hardware Model
• Hardware Serial Number
• Operating System
• CPU Information (socket, speed, cache)
7.2. Prerequisites
Prerequisite Restriction
Zenoss Version Zenoss Version 2.2 or higher
Required ZenPacks ZenPacks.zenoss.HPMonitor
On each remote device The HP Insight SNMP Management Agent gathers informationabout the device.
Table 7.1. HP PC Hardware Prerequisites
7.3. Enable Enhanced Modeling
To enable enhanced modeling:
1. Select Infrastructure from the navigation bar.
2. Click the device name in the device list.
The device overview page appears.
3. Select Modeler Plugins from the left panel.
4. Click Add Fields to reveal the list of available plugins.
5. Select the following available plugins and drag them to the plugins list:
• HPCpuMap
• HPDeviceMap
6. Remove the following plugins by clicking the 'X' button to the right of the plugin:
• zenoss.snmp.CPUMap
• zenoss.snmp.DeviceMap
7. Click Save.
8. Remodel the device using the new plugins. To do this, select Model Device from the Action menu.

HP PC Hardware
22
7.4. Daemons
Type Name
Modeler zenmodeler
Performance Collector zenperfsnmp
Table 7.2. Daemons

23
Chapter 8. Internet Relay Chat (IRC)8.1. AboutZenPacks.zenoss.IrcdMonitor monitors the number of users connected to an IRC server.
8.2. Prerequisites
Prerequisite Restriction
Zenoss Version Zenoss Version 2.2 or higher
Required ZenPacks ZenPacks.zenoss.IrcdMonitor
Table 8.1. IRC Prerequisites
8.3. Enable MonitoringTo enable monitoring:
1. Select Infrastructure from the navigation bar.
2. Click the device name in the device list.
The device overview page appears.
3. Expand Monitoring Templates in the left panel, and then select Device.
4. Select Bind Templates from the Action menu.
The Bind Templates dialog appears.
5. Move the IrcdeMonitor template from the Available list and move it to the Selected list.
6. Click Save.
The IrcdMonitor template is added.
7. Click the new template in the left panel and change options as needed.
Option Description
Port Specifies the port to connect to the IRC server (default 6667).
warning_num Creates a warning event when this number of users are seen.
critical_num Creates a critical event when this number of users are seen.
Table 8.2. IRC Basic Data Source Options
8.4. Daemons
Type Name
Performance Collector zencommand
Table 8.3. Daemons

24
Chapter 9. Jabber Instant Messaging9.1. AboutZenPacks.zenoss.JabberMonitor monitors the response time of devices running a Jabber server.
9.2. PrerequisitesPrerequisite Restriction
Zenoss Version Zenoss Version 2.2 or higher
Required ZenPacks ZenPacks.zenoss.JabberMonitor
Table 9.1. Jabber Prerequisites
9.3. Enable MonitoringTo enable monitoring:
1. Select Infrastructure from the navigation bar.
2. Click the device in the device list.
The device overview page appears.
3. Expand Monitoring Templates in the left panel, and then select Device.
4. Select Bind Templates from the Action menu.
The Bind Templates dialog appears.
5. Move the Jabber template from the Available list to the Selected list, and then click Save.
The Jabber template is added. The system can begin collecting Jabber server metrics from the device.
6. Select the newly added template and change options as needed.
Option Description
Timeout (seconds) Seconds before connection times out (default: 60)
Port The port on which the Jabber server is listening. Typically this isport 5223.
Send String string to send to the server : default
<stream:stream to='${dev/id}'xmlns:stream='http://etherx.jabber.org/streams'>
Expect String String to expect in server response.
<stream>
Table 9.2. Jabber Data Source Options
9.4. DaemonsType Name
Performance Collector zencommand
Table 9.3. Daemons

25
Chapter 10. Java 2 Platform Standard Edition(J2E)10.1. About
ZenJMX is a ZenPack that allows Zenoss to communicate with remote Java Management Extensions (JMX) agents.The ZenJMX ZenPack defines a data source named JMX that allows you to query any single or complex-valueattribute, or invoke an MBean operation. It also comes with a built-in template named Java that contains MBeaninformation for a few beans built into the JVM.
Note
ZenJMX also includes a built-in template named ZenJMX. This template should only be used on the device runningthe zenjmx daemon. To monitor other Java servers use the included Java template.
When the zenjmx daemon is started it communicates with ZenHub and retrieves a list of devices that possess JMXdata sources. It also spawns a Java process. ZenJMX asynchronously issues queries for each of those devicesto the Java process via XML-RPC. The Java process then collects the data from the Java application and returnsthe results to ZenJMX. Any collection or configuration errors are sent as events to Zenoss and will appear in theevent console.
Lastly, ZenJMX heartbeats after each collect to ZenHub to let Zenoss know that ZenJMX is still alive and well.
10.1.1. JMX Background
The JMX technology is used throughout the Java Virtual Machine to provide performance and management infor-mation to clients. Using a combination of JConsole (Sun Microsystems' JMX client that is shipped with the JDK)and JMX, a system operator can examine the number of threads that are active in the JVM or change the log level.There are numerous other performance metrics that can be gleaned from the JVM, as well as several managementinterfaces that can be invoked that change the behavior of the JVM.
In Java 5, Sun introduced the Remote API for Java Management Extensions. This enhancement defines an RMIwrapper around a JMX agent and allows for independent client development. ZenJMX accesses remote JMX agentsvia the "Remote API for Java Management Extensions." It currently does not support local connections (providedvia the temporary directory) to JMX Agents.
10.1.2. ZenJMX Capabilities
ZenJMX is a full-featured JMX client that works "out of the box" with JMX agents that have their remote APIs enabled.It supports authenticated and unauthenticated connections, and it can retrieve single-value attributes, complex-valueattributes, and the results of invoking an operation. Operations with parameters are also supported so long as theparameters are primitive types (Strings, booleans, numbers), as well as the object version of primitives (such asjava.lang.Integer and java.lang.Float). Multi-value responses from operations (Maps and Lists) are supported,as are primitive responses from operations.
The JMX data source installed by ZenJMX allows you to define the connection, authentication, and retrieval infor-mation you want to use to retrieve performance information. The IP address is extracted from the parent device,but the port number of the JMX Agent is configurable in each data source. This allows you to operate multiple JMXAgents on a single device and retrieve performance information for each agent separately. This is commonly usedon production servers that run multiple applications.

Java 2 Platform Standard Edition (J2E)
26
Authentication information is also associated with each JMX data source. This offers the most flexibility for siteadministrators because they can run some JMX agents in an open, unauthenticated fashion and others in a hardenedand authenticated fashion. SSL-wrapped connections are supported by the underlying JMX Remote subsystembuilt into the JDK, but were not tested in the Zenoss labs. As a result, your success with SSL encrypted accessto JMX Agents may vary.
The data source allows you to define the type of performance information you want to achieve: single-value attribute,complex-value attribute, or operation invocation. To specify the type of retrieval, you must specify an attribute name(and one or more data points) or provide operation information.
Any numerical value returned by a JMX agent can be retrieved by Zenoss and graphed and checked against thresh-olds. Non-numerical values (Strings and complex types) cannot be retrieved and stored by Zenoss.
When setting up data points, make sure you understand the semantics of the attribute name and choose the cor-rect Zenoss data point type. Many JMX Agent implementations use inconsistent nomenclature when describingattributes. In some cases the term "Count" refers to an ever-increasing number (a "Counter" data point type). Inother cases the term "Count" refers to a snapshot number (a "Gauge" data point type).
10.1.3. Allowable Parameter Types
The following primitive data types are allowed in JMX calls:
• java.lang.Integer
• java.lang.Long
• java.lang.Double
• java.lang.Float
• java.lang.String
• java.lang.Boolean
• int
• long
• double
• float
• boolean
10.1.4. Single Value Attribute Calls
This is the most basic usage scenario. If you are interested in retrieving a single value from an MBean in a JMXAgent, and the attribute returns simple numeric data, you fall into the "single value attribute" category. To define asingle-value attribute call simply provide the fully qualified name of your MBean and then provide the name of theattribute in the Attribute Name field of the data source. Lastly, you must define a data point.
Some examples of this include the commonly referenced JDK Threading information:
• MBean Name: java.lang:type=Threading
• Attribute Name: ThreadCount
• Data Points:
• ThreadCount (type: gauge)
Java uses lots of file descriptors during normal operation. The number of open file descriptors the JVM is workingwith can be measured using the following information:

Java 2 Platform Standard Edition (J2E)
27
• MBean Name: java.lang:type=OperatingSystem
• Attribute Name: OpenFileDescriptorCount
• Data Points:
• OpenFileDescriptorCount (type: gauge)
There are several other single-value attributes that can be retrieved from the JDK. We recommend using JConsoleto interactively navigate through the MBean hierarchy to determine which MBeans contain useful information toyou. See Section 10.5, “Using JConsole to Query a JMX Agent” for additional information on how to inspect theMBeans deployed in an JMX Agent.
10.1.5. Complex-Value Attribute Calls
If your MBean attribute defines multiple sub-attributes (via CompositeData or Tabular) that you are interested incapturing, then you fall into the category of a "complex-value attribute" call. The JDK contains a few complex-valueattributes you might be interested in capturing, including garbage collection statistics that were captured during thecopy and mark-sweep compact collection cycles.
To extract data from a complex-value attribute, you must define one or more data points in the data source. Thenames of the data points are used as keys into the complex-value data structure returned from the MBean attribute.For JMX CompositeData attributes, the data point names are used as a key to map the results. For JMX TabularData,the data point names are used as indexes into the structure to map the result.
The JDK also provides heap memory information via a complex-value attribute. The amount of committed, used,and maximum heap memory can be viewed by setting up a complex-value attribute in Zenoss with the followinginformation:
• MBean Name: java.lang:type=Memory
• Attribute Name: HeapMemoryUsage
• Data Points:
• committed (type: gauge)
• used (type: gauge)
• max (type: gauge)
10.1.6. Example Method Calls
Some management values need to be computed. These situations frequently arise when custom MBeans are de-ployed alongside an enterprise application. An MBean named "Accounting" might be deployed within an enterpriseapplication that defines operations intended for operators or support staff. These operations might include methodssuch as "getBankBalance()" or "countTotalDeposits()".
ZenJMX has the ability to invoke operations, but there are some subtleties in how ZenJMX sends parameters tothe JMX Agent and interprets the response.
10.1.6.1. No parameters, single return value
In the most basic usage scenario no arguments are passed to the operation and a single value is returned. Thisusage scenario is very similar to a single-value attribute call, except we're invoking an operation to retrieve the valuerather than accessing an attribute. The configuration for this hypothetical usage scenario follows:
• MBean Name: Application:Name=Accounting,Type=Accounting
• Operation Name: getBankBalance()
• Data Points:

Java 2 Platform Standard Edition (J2E)
28
• balance (type: gauge)
10.1.6.2. No parameters, multiple values returned in List format
In this scenario no parameters are passed to an operation, but multiple response values are provided in a List. Thevalues returned are expressed in a List<Object>, but they are coerced (but not casted) to doubles prior to beingstored in Zenoss. This means that returning a numeric value as "1234" will work, but "1,234" will not work. The litmustest is to evaluate if Double.valueOf(object.toString()) will successfully evaluate.
ZenJMX can be configured to read multiple values from an operation's results by defining multiple data points. Youmust define a data point for each value returned from the operation, and if there is a mismatch between the numberof data points you define and the size of the List<Object> returned an exception will be generated. The configurationfor ZenJMX follows:
• MBean Name: Application:Name=Accounting,Type=Accounting
• Operation Name: getBalanceSummary()
• Data Points:
• dailyBalance (type: gauge)
• annualBalance (type: gauge)
10.1.6.3. No parameters, multiple values returned in Map format
In this scenario no parameters are passed to an operation, but multiple response values are provided in aMap<String, Object>. The keyset of the Map contains the names of data points that can be defined, and the valuesare the values of said data points. When a Map<String, Object> is returned you need not capture all of the returnedvalues as data points, and you can instead pick the exact values you are interested in. To choose the values tocapture you simply define data points with the same names as Strings in the keyset.
The following configuration demonstrates how to extract specific data points from an operation that returnsa Map<String, Object>. The key item to note in this configuration is that "dailyBalance" and "annualBalance"must be present as keys in the returned Map<String, Object> and their values must be coercible via theDouble.valueOf(object.toString()) idiom.
• MBean Name: Application:Name=Accounting,Type=Accounting
• Operation Name: getBalances()
• Data Points:
• dailyBalance (type: gauge)
• annualBalance (type: gauge)
10.1.6.4. Single parameter in polymorphic operation
MBeans are implemented as Java classes and Java permits parameterized polymorphic behavior. This means thatmultiple methods can be defined with the same name so long as their parameter signatures differ. You can safelydefine "getBalance(String)" and "getBalance()" and the two exist as separate methods.
In order to properly resolve methods with the same name the caller must provide a Class[] that lists the types ofparameters that exist in the method's signature. This resolves the candidate methods to an individual method whichcan then be invoked by passing an Object[].
ZenJMX allows you to resolve methods of the same name and asks you to provide the fully qualified class namesof each parameter in comma delimited format when you set up the data source. Note that primitive types (String,Boolean, Integer, Float) are supported but complex types are not supported, and that you must include the class'package name when providing the information (java.lang.String).

Java 2 Platform Standard Edition (J2E)
29
The Object[] of parameter values must line up with Class[] of parameter types, and if there is a mismatch in thenumber of types and values that are provided an exception will be generated.
The marshaling of values from String to Boolean, Integer, and Float types is provided via the .valueOf() static methodon each of those types. That is, if you define an attribute of type java.lang.Integer you must provide a String thatcan be successfully passed to java.lang.Integer.fromValue(). If you fail to do so an exception is generated.
This example illustrates how to pass a single parameter to a polymorphic operation:
• MBean Name: Application:Name=Accounting,Type=Accounting
• Operation Name: getBalances()
• Paramater Types: java.lang.Integer
• Parameter Values: 1234
• Data Points:
• balance (type: gauge)
Here is another example where we've changed the type of the parameter passed to the method to be a String.Semantically it represents a different type of Account in our example:
• MBean Name: Application:Name=Accounting,Type=Accounting
• Operation Name: getBalances()
• Paramater Types: java.lang.String
• Parameter Values: sbb552349999
• Data Points:
• balance (type: gauge)
10.1.6.5. Multiple parameters in polymorphic operations
The above example describes how polymorphic behavior in Java functions and how method resolution can beprovided by identifying the Class[] that represents the parameters passed to a method. The situation where multipleparameters are passed to a polymorphic operation is no different then the situation where a single parameter ispassed to a polymorphic operation, except that the length of the Class[] and Object[] is greater than one.
When multiple parameters are required to invoke an operation you must provide the fully qualified class namesof each parameter's type in comma delimited format, as well as the object values for each type (also in commadelimited format).
The following example demonstrates a configuration that passes two parameters to an MBean operation. The sec-ond parameter passed is a default value to return if no account can be located matching the first parameter.
• MBean Name: Application:Name=Accounting,Type=Accounting
• Operation Name: getBalances()
• Parameter Types: java.lang.String, java.lang.Integer
• Parameter Values: sbb552349999, 0
• Data Points:
• balance (type: gauge)
There are additional combinations that are possible with polymorphic methods and the values they return, andthose combinations are left as an exercise for the reader to explore. The logic for extracting results from multi-valueoperation invocations follows the same rules as the logic for extracting results from a multi-value attribute read. Foradditional information on the rules of that logic see the section above on multi-value attributes.

Java 2 Platform Standard Edition (J2E)
30
10.2. PrerequisitesPrerequisite Restriction
Zenoss Version Zenoss Version 2.2 or higher
Zenoss Product Zenoss Core and Zenoss Enterprise
Required ZenPacks ZenPacks.zenoss.ZenJMX
Other Sun JRE Version 5.0 or higher
Table 10.1. J2EE Prerequisites
10.2.1. Sun Java Runtime Environment (JRE)
ZenJMX requires Sun JRE Version 5.0 or higher. Make sure that after you install Sun's JRE you update your PATHsuch that the java executable works. You can test this using the command:
$ which java/usr/java/default/bin/java
If the above returns a fully qualified path, then you have successfully installed Java.
If Java is not installed, the which will return a message similar to the following:
$ which java/usr/bin/which: no java in (/usr/local/bin:/bin:/usr/bin:/opt/zenoss/bin)
To determine which version of Java is installed, run the following command:
$ java -versionjava version "1.5.0_16"Java(TM) 2 Runtime Environment, Standard Edition (build 1.5.0_16-b06-284)Java HotSpot(TM) Client VM (build 1.5.0_16-133, mixed mode, sharing)
Warning
Sun's Java version 5 (aka 1.5) must be installed. The GNU Java does not work.
Note
ZenJMX and Sun's JRE is installed using a conary command. As root, run the following command:
conary update --resolve group-zenjmx
10.3. Example to Monitor a JMX Value
10.3.1. Enabling Remote JMX Access
Each application server has a slightly different process for enabling remote JMX Access. It's best to consult withyour application server for specific instructions. We've included instructions for a few commonly used configurationsbelow.
JMX agents can be configured in two ways: remote access and local-only. When configured for remote access aJMX client communicates with the JMX agent via a socket and uses the Remote Method Invocation (RMI) protocolto access the MBeans. When configured for local-only access the JMX agent periodically dumps serialized MBeansto a temporary directory on the machine. JConsole can be used to access JMX agents in local-only mode as well asin remote mode (via RMI). ZenJMX can only be used with remote servers via RMI and cannot work with local-onlyserialized MBeans. This is not a significant limitation because ZenJMX can establish RMI connections to localhostjust as easily as it can establish RMI connections to remote hosts.

Java 2 Platform Standard Edition (J2E)
31
The JAVA_OPTS environment variable can be used to enable remote access to JVM MBeans. Set it as follows:
JAVA_OPTS="-Dcom.sun.management.jmxremote.port=12345JAVA_OPTS="${JAVA_OPTS} -Dcom.sun.management.jmxremote.authenticate=false"JAVA_OPTS="${JAVA_OPTS} -Dcom.sun.management.jmxremote.ssl=false"
export JAVA_OPTS
When starting an application pass the JAVA_OPTS variable as an argument to the JVM as follows:
java ${JAVA_OPTS} -classpath /path/to/application.jar com.yourcompany.Main
You can then use JConsole to connect to localhost:12345. Authentication can be configured by modifying thejava.security file as well as java.policy. There are lots of examples available on the Internet that can provide guidancein how to achieve authenticated remote access to JVM MBeans.
10.3.2. Configure Zenoss with a Custom Data Source
Custom JMX data sources allow system administrators to monitor any attribute or operation result accessible viaa JMX call. ZenJMX creates a JMX data source and allows you to provide object information, as well as authentica-tion settings, and attribute/operation information. Determining which object and attribute names, as well as whichoperations to invoke, is the key to customizing ZenJMX.
To configure the system with a custom data source:
1. Select Infrastructure from the navigation bar.
2. Click the device in the device list.
The device overview page appears.
3. Expand Monitoring Templates in the left panel, and then select Device.
4. Select Add Local Template from the Action menu.
The Add Local Template dialog appears.
5. Enter a name for the template (such as JVM Values), and then click Submit.
The template is added.
6. Select the newly created template.
7.Click (Add) in the Data Sources area.
The Add Data Source dialog appears.
8. Enter a name for the data source (Heap Memory), select JMX as the type, and then click Submit.
The data source is added.
9. Double-click the data source to edit it. Change options as needed, and then click Save.
Option Description
JMX Management Port This is not necessarily the same as the listen port for your serv-er.
Object Name The Object Name is also referred to as the MBean name. Enterjava.lang:type=Memory
Attribute Name Enter HeapMemoryUsage
Table 10.2. Memory Head Example ZenJMX Data Source Options

Java 2 Platform Standard Edition (J2E)
32
10. Add data points named committed, max, and used:
a. Select Add Data Point from the Action menu.
The Add Data Point dialog appears.
b. Enter the name of the data point (committed, max, or used) and then click Submit.
11. After adding all data points, add graphs that reference them. (For more information, see Zenoss Administration.)
Review Section 10.5, “Using JConsole to Query a JMX Agent” to learn how to determine the object name, attributename, and data points that might be interesting in your application.
10.4. Monitor Values in TabularData and CompositeData Objects
The Attribute Path input value on the ZenJMX data source allows you to monitor values nested in the TabularDataand CompositeData complex open data objects. Using this value you can specify a path to traverse and index intothese complex data structures.
If the result of traversing and extracting a value out of the nested open data is a single numeric value then it isautomatically mapped to the datapoint in the data source. However, if the value from the open data is another opendata object then the data point names from the datasource are used as indexes or keys to map values out of theopen data.
The input value is a dot-separated string that represents a path through the object. Non-bracketed values are keysinto CompositeData. Bracketed values are indexes into TabularData.
For TabularData indexes with more than one value, use a comma-separated list with no spaces (for example,[key1,key2]).
To specify a column name (needed only when the table has more than two columns) use curly brackets after thetable index.
Example
To get the used Tenured Generation memory after the last garbage collection from the Garbage Collector MBean,set the Attribute Name on the datasource to lastGcInfo. Set the Attribute Path to:
memoryUsageAfterGc.[Tenured Gen].{value}.used
The key memoryUsageAfterGc is evaluated against the CompositeData returned from the lastGcInfo attribute. Theevaluation results in a TabularData object. Then, the [Tenured Gen] index is evaluated against the TableData, whichreturns a row in the table.
Since a row in the table can contain multiple columns, the key value (in curly brackets) is used to pick a column inthe row. Lastly, the key used is evaluated against the CompositeData in the column to return the memory value.
In this example, since the index being used for the tabular data is not a multi-value index and so the column nameis optional. The Attribute Path can be written as:
memoryUsageAfterGc.[Tenured Gen].used
10.5. Using JConsole to Query a JMX Agent
JConsole is a tool built into the JDK that allows system administrators to query a JMX Agent and examine theMBeans deployed within the server. JConsole also allows administrators to view JVM summary information, includ-

Java 2 Platform Standard Edition (J2E)
33
ing the amount of time the JVM has been running, how many threads are active, how much memory is currentlyused by the heap, how many classes are currently loaded, and how much physical memory exists on the machine.
JConsole also provides a graph that shows memory, thread, and class usage over time. The scale of the graphcan be adjusted so that a system administrator can examine a specific period of time, or can zoom out to view alonger range picture of usage. Unfortunately, JConsole can only produce graphs that show usage while JConsolewas running. Administrators cannot look back in time to a point where the JVM was running but JConsole wasnot monitoring the JVM.
Figure 10.1. JMX Heap Graph
The MBeans tab along the top of JConsole provides an interactive method for examining MBean values. Afterclicking on the MBeans tab a panel will be displayed with a tree on the left hand side. The tree contains a hierarchicallist of all MBeans deployed in the JVM.
The standard JVM MBeans are all in the java.lang and java.util.logging packages. Application server specificMBeans do not follow any standard naming pattern. Some vendors choose to use package names for their MBeannames while other vendors choose package-like names (but not fully qualified packages).
To get started expand the java.lang node in the Tree. This will expose several MBeans as well as additional folders.Click on the Memory MBean and observe how the right hand side of the panel is populated with information aboutthe Memory MBean.

Java 2 Platform Standard Edition (J2E)
34
Figure 10.2. Memory MBean
MBeans can contain attributes and operations. MBeans can also fire notifications to observers, but that's be-yond the scope of this document. The attributes tab lists all of the attributes in the first column and theirvalues (or a clickable attribute type) in the second column. In the case of Memory the HeapMemoryUsageis a Composite attribute, otherwise referred to as a "complex-value attribute" in Zenoss. Double click the"javax.management.openmbean.CompositeDataSupport" type and you will see multiple attributes appear. Theshow the amount of committed, maximum, and used memory sizes for the heap.

Java 2 Platform Standard Edition (J2E)
35
Figure 10.3. Memory MBean Expanded
The unique name of the MBean can be viewed by clicking on the Info tab. The first value is MBean Name. Its valuein the case of Memory is: "java.lang:type=Memory."
Note
There is no standardized way to name MBeans; application server vendors name them differently.
You can also examine operation information by clicking on the Operations tab. These are methods that JConsolecan remotely invoke on an MBean that will result in some value being computed or some state changing in theapplication. The Threading MBean has several operations that can be invoked that return information. Click onthe java.lang package and then click on the Threading operation. Lastly, click on the Operations tab. Methods like"getThreadUserTime" are invocable.

Java 2 Platform Standard Edition (J2E)
36
Figure 10.4. Operations Tab
Test the "getThreadUserTime" method by changing the p0 parameter to 1 and clicking the "getThreadUserTime"button. A dialog window will be raised that displays the amount of CPU user time thread #1 has used. Try adjustingthe parameter to different values to observe the different CPU times for the threads.
10.6. Daemons
Type Name
Performance Collector zenjmx
Table 10.3. Daemons

37
Chapter 11. Lightweight Directory AccessProtocol (LDAP) Response Time11.1. About
ZenPacks.zenoss.LDAPMonitor monitors the response time of an LDAP server (in milliseconds).
11.2. Prerequisites
Prerequisite Restriction
Zenoss Version Zenoss Version 2.2 or higher
Required ZenPacks ZenPacks.zenoss.LDAPMonitor
Table 11.1. LDAP Monitoring Prerequisites
11.3. Enable Monitoring
The LDAPServer template must be bound to the device class or device you want to monitor.
11.3.1. For a Device
To enable monitoring for a device:
1. Select Infrastructure from the navigation bar.
2. Click the device name in the device list.
The device overview page appears.
3. Select Configuration Properties from the left panel.
4. Modify configuration property values as needed for your environment. Check with your LDAP administrationfor more information.
Property Description
zLDAPBaseDN The Base Distinguished Name for your LDAP server. Typ-ically this is the organization's domain name (for example,dc=foobar,dc=com)
zLDAPBindDN The Distinguished Name to use for binding to the LDAP server,if authentication is required
zLDAPBindPassword The password to use for binding to the LDAP server, if authenti-cation is required
Table 11.2. LDAPServer Configuration Properties
5. Click Save.
6. Expand Monitoring Templates, and then select Device from the left panel.
7. Select Bind Templates from the Action menu.
The Bind Templates dialog appears.

Lightweight Directory Access Pro-tocol (LDAP) Response Time
38
8. Add the LDAPServer template to the list of selected templates, and then click Submit.
The LDAPServer template is added to the list of monitoring templates.
9. Select the LDAPServer template and change options as needed.
Option Description
Port The port to connect to LDAP server (default 389)
Base Distinguished Name Defaults to ${here/zLDAPBaseDN}
Bind Password Defaults to ${here/zLDAPBindPassword}
Use SSL Use SSL for the connection
Table 11.3. LDAPServer Basic Data Source Options
Note
If your LDAP servers require SSL or a custom port, select the ldap data source, and then change the UseSSL and Port fields as needed.
10. Validate your configuration by running zencommand and observing that the check_ldap or check_ldaps com-mand correctly connects to your LDAP server:
zencommand run -v10 -d yourdevicenamehere
11.4. Daemons
Type Name
Performance Collector zencommand
Table 11.4. Daemons

39
Chapter 12. MySQL Database12.1. About
MySqlMonitor provides a method for pulling performance metrics from the MySQL database server directly intoZenoss without requiring the use of an agent. This is accomplished by using the MySQL client library to connectto the database remotely.
The following metrics are collected and graphed for MySQL server:
• Command Statistics (SELECT, INSERT, UPDATE, DELETE)
• Select Statistics (Scan, Range Check, Range Join, Full Join)
• Handler Statistics (Keyed and Unkeyed Reads, Writes, Updates, Deletes)
• Network Traffic (Received and Sent)
12.2. Prerequisites
Prerequisite Restriction
Zenoss Version Zenoss Version 2.2 or higher
Required ZenPacks ZenPacks.zenoss.MySqlMonitor
Table 12.1. MySQL Prerequisites
12.3. Enable Monitoring
Use the following procedures to enable monitoring.
12.3.1. Authorize MySQL Performance Data Access
Follow these steps to set up your MySQL server to allow Zenoss to read performance data from the system tables.
1. Connect to the MySQL database by using the MySQL client:
mysql -u root
Alternatively, if there is a MySQL root password:
mysql -u root -p
2. Create a user for Zenoss to use. The username "zenoss" is recommended.
mysql> CREATE USER zenoss IDENTIFIED BY 'zenossPassword';
Query OK, 0 rows affected (0.00 sec)
12.3.2. Set up Zenoss1. Select Infrastructure from the navigation bar.
2. Click the device name in the device list.
The device overview page appears.
3. Select Configuration Properties from the left panel.

MySQL Database
40
4. Edit the zMySqlRootPassword configuration property for the device or devices in Zenoss on which you wantto monitor MySQL.
5. Click Save.
6. Expand Monitoring Templates, and then select Device from the left panel.
7. Select Bind Templates from the Action menu.
The Bind Templates dialog appears.
8. Add the MySQL template to the list of selected templates, and then click Submit.
The MySQL template is added to the list of monitoring templates.
Note
Pay particular attention to the MySQL Version 5+ setting in the data source. If you are monitoring pre-v5 instal-lations of MySQL, then you must set this value to False. If you are monitoring pre-v5 and v5+ installations, thencreate two templates: one for MySQL installations earlier than v5 and another for those after.
12.4. Daemons
Type Name
Performance Collector zencommand
Table 12.2. Daemons

41
Chapter 13. Network News Transport Protocol(NNTP)13.1. AboutZenPacks.zenoss.NNTPMonitor ZenPack monitors the response time of an NNTP server in milliseconds.
13.2. Prerequisites
Prerequisite Restriction
Zenoss Version Zenoss Version 2.2 or higher
Required ZenPacks ZenPacks.zenoss.NNTPMonitor
Table 13.1. NNTP Prerequisites
13.3. Enable MonitoringTo enable monitoring for a device:
1. Select Infrastructure from the navigation bar.
2. Click the device name in the device list.
The device overview page appears.
3. Expand Monitoring Templates, and then select Device from the left panel.
4. Select Bind Templates from the Action menu.
The Bind Templates dialog appears.
5. Add the NNTPMonitor template to the list of selected templates, and then click Submit.
The NNTPMonitor template is added to the list of monitoring templates.
6. Select the template and change options as needed.
7. Validate your configuration by running zencommand and observing that the check_nntp or check_nntpscommand correctly connects to your NNTP server:
zencommand run -v10 -d yourdevicenamehere
13.4. Daemons
Type Name
Performance Collector zencommand
Table 13.2. Daemons

42
Chapter 14. Network Time Protocol (NTP)14.1. AboutZenPacks.zenoss.NtpMonitor monitors the offset between system time and a target NTP (Network Time Server)server's time.
14.2. Prerequisites
Prerequisite Restriction
Zenoss Version Zenoss Version 2.2 or higher
Required ZenPacks ZenPacks.zenoss.NtpMonitor
Table 14.1. NTP Prerequisites
14.3. Enable MonitoringThe NTPMonitor template must be bound to the device class or device you want to monitor.
1. Select Infrastructure from the navigation bar.
2. Click the device name in the device list.
The device overview page appears.
3. Expand Monitoring Templates, and then select Device from the left panel.
4. Select Bind Templates from the Action menu.
The Bind Templates dialog appears.
5. Add the NTPMonitor template to the list of selected templates, and then click Submit.
The NTPMonitor template is added to the list of monitoring templates. You can now start collecting the NTPserver metrics from this device.
14.4. Daemons
Type Name
Performance Collector zencommand
Table 14.2. Daemons

43
Chapter 15. ONC-style Remote Procedure Call(RPC)15.1. AboutZenPacks.zenoss.RPCMonitor monitors the availability of an ONC RPC server.
15.2. Prerequisites
Prerequisite Restriction
Zenoss Version Zenoss Version 2.2 or higher
Required ZenPacks ZenPacks.zenoss.RPCMonitor
Table 15.1. ONC RPC Prerequisites
15.3. Enable MonitoringThe RPCMonitor template must be bound to the device class or device you want to monitor. Follow these stepsto enable monitoring:
1. Select Infrastructure from the navigation bar.
2. Click the device name in the device list.
The device overview page appears.
3. Select Configuration Properties from the left panel.
4. Set the appropriate RPC command to test in the zRPCCommand configuration property (for example, nfs orypserv).
5. Click Save.
6. Expand Monitoring Templates, and then select Device from the left panel.
7. Select Bind Templates from the Action menu.
The Bind Templates dialog appears.
8. Add the RPCServer template to the list of selected templates, and then click Submit.
The RPCServer template is added to the lists of monitoring templates. You can now collect the RPCServerserver metrics from the device.
15.4. Daemons
Type Name
Performance Collector zencommand
Table 15.2. Daemons

44
Chapter 16. SSH Monitoring Example16.1. About
The LinuxMonitor ZenPack demonstrates the new Secure Shell (SSH) features. This example ZenPack includesfunctionality to model and monitor several types of device components for devices placed in the /Server/SSH/Linuxdevice class by running commands and parsing the output. Parsing of command output is performed on the Zenossserver or on a distributed collector. The account used to monitor the device does not require root access or specialprivileges.
This ZenPack is provided for developers as it provides some examples of how to create SSH performance collectingplugins. See the Zenoss Developer's Guide for more information about the new SSH features.
16.2. Prerequisites
Prerequisite Restriction
Zenoss Version Zenoss Version 2.4 or higher
Required ZenPacks ZenPacks.zenoss.LinuxMonitor
Table 16.1. Linux SSH Monitoring Example Prerequisites
16.3. Set Linux Server Monitoring Credentials
All Linux servers must have a device entry in an organizer below the /Devices/Server/SSH/Linux device class.
Tip
The SSH monitoring feature will attempt to use key-based authentication before using a configuration propertiespassword value.
1. Select Infrastructure from the navigation bar.
2. Click the device name in the device list.
The device overview page appears.
3. Select Configuration Properties from the left panel.
4. Verify the credentials for the service account.
Name Description
zCommandUsername Linux user with privileges to gather performance information.
zCommandPassword Password for the Linux user.
Table 16.2. Linux Configuration Properties
16.4. Add a Linux Server
The following procedure assumes that credentials have been set.
1. Select Infrastructure from the navigation bar.
2. Select Add a Single Device from the Add Device list of options.

SSH Monitoring Example
45
The Add a Single Device dialog appears.
3. Enter the following information in the dialog:
Name Description
Name or IP Linux host to model.
Device Class /Server/SSH/Linux
Model Device Select this option unless adding a device with a user name andpassword different than found in the device class. If you do notselect this option, then you must add the credentials (see Sec-tion 16.3, “Set Linux Server Monitoring Credentials”) and thenmanually model the device.
Table 16.3. Adding Linux Device Details
4. Click Add.
16.5. Daemons
Type Name
Modeler zenmodeler
Performance Collector zencommand
Table 16.4. Daemons

46
Chapter 17. VMware Infrastructure ESXServer17.1. AboutThe EsxTop ZenPack uses the resxtop command to gather performance information about VMware Infrastructure™ESX™ servers. A basic modeler creates virtual machines under the /Devices/Server/Virtual Hosts/EsxTop deviceclass for any host device that is added and modeled.
17.2. PrerequisitesTo implement this ZenPack, you must:
• Install the OpenSSL development package, Version 0.9.7 or higher
• Install the VMware vSphere CLI (as described in the section titled Installing Prerequisite Libraries).
• Update the ZenossVirtualHostMonitor ZenPack to Version 2.3.5.
Prerequisite Restriction
Zenoss Version Zenoss Version 3.0 or higher
Required ZenPacks ZenPacks.zenoss.ZenossVirtualHostMonitor
ZenPacks.zenoss.EsxTop
VMware vSphere™ Command-Line Interface(CLI)
VMware vSphere CLI Version 4.1 or highermust be installed on the Zenoss collectors.
Table 17.1. Prerequisites
17.2.1. Installing Prerequisite Libraries
The VMware vSphere CLI is required for access to the resxtop command, which enables Zenoss to model andgather performance information about individual ESX servers.
Follow these steps to install the CLI and required software:
1. If you have not yet installed it, install the OpenSSL development package. For example, for an RPM-basedsystem, enter:
yum install openssl-devel
2. From your VMware account, download the VMware vSphere CLI.
Note
For downloads and documentation, go to:
http://downloads.vmware.com/d/details/vcli41/ZHcqYmRoaCpiZHRAag==
3. Copy the package to each Zenoss collector.
4. For each collector:
a. Expand the package file.
b. Run the following command to install the package:

VMware Infrastructure ESX Server
47
./vmware-install.pl
c. As the zenoss user, run the following command to verify successful installation:
resxtop --server myESXServer --user userOnRemoteEsxServerAllowedToUseEsxTop -b -n 1 -a
The resxtop command prompts for a password.
d. Enter the password for a user with permissions on the remote ESX server.
If the command is working correctly, then a screen displays with several pages of command output.
e. Create a symbolic link from the location that the resxtop command was installed into the $ZENHOME/libex-ec directory. This allows the check_esxtop command to automatically determine which binary to run. Forexample:
cd $ZENHOME/libexecln -s PathToResxtop
f. Test the check_esxtop command by showing the VMs on the remote server:
$ZENHOME/ZenPacks/Ze*EsxTop*/Z*/z*/E*/libexec/check_esxtop --server=myEsxserver \ --user=userOnRemoteEsxServerAllowedToUseEsxTop --password=password --showvms
17.3. Enabling the ZenPackFollow these steps to set up the EsxTop ZenPack. From the Zenoss interface, add a host:
1. From Infrastructure > Devices, navigate to the /Devices/Server/Virtual Hosts/EsxTop device class.
2.From , select Add a Single Device.
The Add a Single Device dialog appears.
3. Enter a host name or IP address.
4. De-select the Model Device option.
5. Click Add.
6. Select the newly added device in the list.
The device overview appears.
7. Click Details, and then select Configuration Properties in the left panel.
8. Enter login credentials for the zCommandUsername and zCommandPassword configuration properties, andthen click Save.
9. If the device has an SNMP agent installed, update the ESX device configuration with the appropriate SNMPconfiguration information, and then add any desired modeler plugins.
10.From (Action menu), select Model device.
17.4. Daemons
Type Name
Modeler zenmodeler
Performance Collector zencommand
Table 17.2. Daemons

48
Chapter 18. Web Page Response Time (HTTP)18.1. About
ZenPacks.zenoss.HttpMonitor monitors connection response time to an HTTP server and determines whether spe-cific content exists on a Web page.
18.2. Prerequisites
Prerequisite Restriction
Zenoss Version Zenoss Version 2.2 or higher
Required ZenPacks ZenPacks.zenoss.HttpMonitor
Table 18.1. HTTP Prerequisites
18.3. Enable Monitoring
Follow these steps to enable monitoring:
1. Select Infrastructure from the navigation bar.
2. Click the device name in the device list.
The device overview page appears.
3. Expand Monitoring Templates, and then select Device from the left panel.
4. Select Bind Templates from the Action menu.
The Bind Templates dialog appears.
5. Add the HttpMonitor template to the list of selected templates, and then click Submit.
Note
Prior to Zenoss 2.4, this template was not available. If your Zenoss release is prior to Zenoss 2.4 you mustcreate the template, data source and graphs manually. See Zenoss Administration for more details on thesesteps.
6. The HttpMonitor template is added to the list of monitoring templates. You can now begin collecting Web servermetrics from the device.
18.4. Check for a Specific URL or Specify Security Settings1. Select Infrastructure from the navigation bar.
2. Click the device name in the device list.
The device overview page appears.
3. Expand Monitoring Templates, and then select Device from the left panel.
4. Create a local copy of the template.
5. Select the newly created local template copy.
6. Select the HttpMonitor data source, and then select View and Edit Details from the Action menu.

Web Page Response Time (HTTP)
49
The Edit Data Source dialog appears.
7. Change data source options as needed, and then click Save.
Option Description
Port The port to connect to HTTP server (default 80).
Use SSL Use SSL for the connection
Url Address of the web page.
Basic Auth User If the website requires credentials, specify the username here.
Basic Auth Password Password for the user.
Redirect Behavior If the web site returns an HTTP redirect, should the probe followthe redirect or create an event? Possible event severities areOK, Warning, and Critical.
Table 18.2. HTTPMonitor Content Checking Data Source Options
18.5. Check for Specific Content on the Web PageThis procedure allows Zenoss to create an event if content at the web page does not match the expected output.
1. Select Infrastructure from the navigation bar.
2. Click the device name in the device list.
The device overview page appears.
3. Expand Monitoring Templates, and then select Device from the left panel.
4. Create a local copy of the template.
5. Select the newly created local template copy.
6. Select the HttpMonitor data source, and then select View and Edit Details from the Action menu.
The Edit Data Source dialog appears.
7. Change data source options as needed, and then click Save.
Option Description
Regular Expression A Python regular expression to match text in the web page.
Case Sensitive Is the regular expression case-sensitive or not?
Invert Expression If you would like to test to see if the web page does not containcontent matched by a regular expression, check this box.
Table 18.3. HTTPMonitor Content Checking Data Source Options
18.6. Tuning for Site Responsiveness1. Select Infrastructure from the navigation bar.
2. Click the device name in the device list.
The device overview page appears.
3. Expand Monitoring Templates, and then select Device from the left panel.
4. Create a local copy of the template.

Web Page Response Time (HTTP)
50
5. Select the newly created local template copy.
6. Select the HttpMonitor data source, and then select View and Edit Details from the Action menu.
The Edit Data Source dialog appears.
7. Change data source options as needed, and then click Save.
Option Description
Timeout (seconds) Seconds before connection times out (default: 60)
Cycle Time (seconds) Number of seconds between collection cycles (default: 300 orfive minutes)
Table 18.4. HTTPMonitor Tunables Data Source Options
18.7. Daemons
Type Name
Performance Collector zencommand
Table 18.5. Daemons

51
Chapter 19. Xen Virtual Hosts19.1. AboutThe XenMonitor ZenPack allows you to monitor Xen para-virtualized domains with Zenoss.
This ZenPack:
• Extends ZenModeler to discover guests running on the Xen host.
• Provides screens and templates for collecting and displaying resources allocated to guests.
The XenMonitor ZenPack requires the ZenossVirtualHostMonitor ZenPack to be installed as a prerequisite.
19.2. Prerequisites
Prerequisite Restriction
Zenoss Version Zenoss Version 2.2 or higher
Required ZenPacks ZenPacks.zenoss.XenMonitorZenPacks.zenoss.ZenossVirtualHostMonitor
Table 19.1. Xen Virtual Hosts Prerequisites
19.3. Model Hosts and GuestFor each Xen server, follow this procedure:
1. Optionally, place an SSH key to your Xen server to allow the zenoss user from the Zenoss server to log in asroot without requiring further credentials.
2. Create the Xen server in the /Servers/Virtual Hosts/Xen device class.
Warning
If you have this server modeled already, remove the server and recreate it under the Xen device class. Donot move it.
3. Select the Guest menu and ensure that the guest hosts were found during the modeling process.
19.4. Daemons
Type Name
Modeler zenmodeler
Performance Collector zencommand
Table 19.2. Daemons

Part II. Enterprise ZenPacks

53
Chapter 20. Advanced Search20.1. AboutThe AdvancedSearch ZenPack enables the advanced search facility in the user interface. This tool allows you tolocate devices and other system objects, as well as events and services.
When enabled, advanced search appears adjacent to the user information area.
Figure 20.1. Advanced Search (User Information Area)
To search, enter part or all of a name in the search box. The system displays matches, categorized by type.
Figure 20.2. Search Results
To view all search results, click the indicator at the top of the list. The full list of results appears.
Figure 20.3. All Search Results

Advanced Search
54
From here, you can display search results by category. Click in the left panel to filter search results by a selection.
20.1.1. Working with Saved Searches
To save a search:
1. Click Save As.
the Save Search As dialog appears.
2. Enter a name for the saved search, and then click Submit.
To retrieve a saved search, select it from the search box menu.
You also can manage saved searches. Access all saved searches from two locations:
• Search box menu
• Action menu located at the bottom of the Search Results page
The Manage Saved Searches dialog lets you view the queries associated with saved searches and delete savedsearches.
20.2. Prerequisites
Prerequisite Restriction
Zenoss Version Zenoss Version 3.0 or higher
Required ZenPacks ZenPacks.zenoss.AdvancedSearch
Table 20.1. Prerequisites

55
Chapter 21. AIX21.1. AboutThe AixMonitor ZenPack enables Zenoss to use Secure Shell (SSH) to monitor AIX hosts. Zenoss models andmonitors devices placed in the /Server/SSH/AIX device class by running commands and parsing the output. Parsingof command output is performed on the Zenoss server or on a distributed collector. The account used to monitorthe device does not require root access or special privileges.
Specifically, the AixMonitor ZenPack provides:
• File system and process monitoring
• Network interfaces and route modeling
• CPU utilization information
• Hardware information (memory, number of CPUs, machine serial numbers, model numbers)
• OS information (OS level command style information)
• LPP and RPM information (such as installed software)
21.2. Prerequisites
Prerequisite Restriction
Zenoss Version Zenoss Version 2.4 or higher
Required ZenPacks ZenPacks.zenoss.AixMonitor
AIX Releases Supported 5.3 and 6.1
Table 21.1. AIX Prerequisites
Note
If using a distributed collector setup, SSH requires firewall access (default of port 22) from the collector to themonitored server.
21.3. Add an AIX ServerThe following procedure assumes that the credentials have been set.
1. From Infrastructure > Devices, select Add a Single Device.
2. Enter the following information in the dialog:
Name Description
Name or IP AIX host to model
Device Class /Server/SSH/AIX
Model Device Select this option unless adding a device with username/pass-word different than found in the device class. If you do not se-lect this option, then you must add the credentials (see Sec-tion 21.4, “Set AIX Server Monitoring Credentials”) and thenmanually model the device.
Table 21.2. Adding AIX Device Information

AIX
56
3. Click Add Device to add the device.
21.4. Set AIX Server Monitoring Credentials
All AIX servers must have a device entry in an organizer below the /Devices/Server/SSH/AIX device class.
Note
The SSH monitoring feature will attempt to use key-based authentication before using a configuration propertiespassword value.
1. Navigate to the device class or device.
• If applying changes to a device class:
a. Select the class in the devices hierarchy.
b. Click Details.
c. Select Configuration Properties.
• If applying changes to a device:
a. Click the device in the device list.
b. Select Configuration Properties.
2. Verify the credentials for the service account to access the service.
Name Description
zCommandUsername AIX user with privileges to gather performance infor-mation
zCommandPassword Password for the AIX user
Table 21.3. AIX Configuration Properties
3. Click Save to save your changes.
21.5. Resolving CHANNEL_OPEN_FAILURE Issues
The zencommand daemon's log file ($ZENHOME/collector/zencommand.log) may show messages stating:
ERROR zen.SshClient CHANNEL_OPEN_FAILURE: Authentication failureWARNING:zen.SshClient:Open of command failed (error code 1): open failed
If the sshd daemon's log file on the remote device is examined, it may report that the MAX_SESSIONS number ofconnections has been exceeded and that it is denying the connection request. At least in the OpenSSH daemons,this MAX_SESSIONS number is a compile-time option and cannot be reset in a configuration file.
To work around this limitation of the sshd daemon, use the configuration property zSshConcurrentSessions to controlthe number of connections created by zencommand to the remote device.
1. Navigate to the device or device class in the Zenoss interface.
• If applying changes to a device class:
a. Select the class in the devices hierarchy.
b. Click Details.
c. Select Configuration Properties.
• If applying changes to a device:

AIX
57
a. Click the device in the device list.
b. Select Configuration Properties.
2. Apply an appropriate value for the maximum number of sessions.
Name Description
zSshConcurrentSessions Maximum number of sessions supported by the remote device'sMAX_SESSIONS parameter. Common values for AIX is 2 or 10.
Table 21.4. Concurrent SSH Configuration Properties
3. Click Save to save your changes.
21.6. Resolving Command timed out IssuesThe zencommand daemon's log file ($ZENHOME/collector/zencommand.log) may show messages stating:
WARNING:zen.zencommand:Command timed out on device device_name: command
If this occurs, it usually indicates that the remote device has taken too long in order to return results from thecommands. In order to increase the amount of time to allow devices to return results, change the configurationproperty zCommandCommandTimeout to a larger value.
1. Navigate to the device or device class in the Zenoss interface.
• If applying changes to a device class:
a. Select the class in the devices hierarchy.
b. Click Details.
c. Select Configuration Properties.
• If applying changes to a device:
a. Click the device in the device list.
b. Select Configuration Properties.
2. Apply an appropriate value for the command timeout.
Name Description
zCommandCommandTimeout Time in seconds to wait for commands to complete on the re-mote device.
Table 21.5. SSH Timeout Configuration Properties
3. Click Save to save your changes.
21.7. Daemons
Type Name
Modeler zenmodeler
Performance Collector zencommand
Table 21.6. Daemons

58
Chapter 22. Apache Tomcat ApplicationServer22.1. About
TomcatMonitor is a ZenPack that allows System Administrators to monitor the Tomcat Application Server. Tomcatis a web application container that conforms to many parts of the J2EE Specification.
This ZenPack focuses on the metrics that Tomcat updates in its internal MBean container that is accessible via theremote JMX API. These metrics focus on attributes that relate to the servicing of web pages and primarily includethread pool size, CPU use, available file descriptors, JSP and servlet counts, and request counts.
TomcatMonitor places much emphasis on monitoring thread status because every web request is serviced in aseparate thread. Each thread requires file descriptors to be maintained, and thus those are monitored as well. Theamount of CPU time spent servicing each thread is also captured and reported.
TomcatMonitor also reports on the number of times JSPs and Servlets are reloaded. This metric can be useful inhighly dynamic sites where JSPs or Servlets change on the fly and need to be reloaded periodically. Monitoring ofthis metric can lead to the identification of small "Reloading Storms" before they cause production outages.
The amount of time Tomcat spends servicing a request is also recorded. This extremely high level metric can provideinsight into downstream systems that are not monitored. If all the Tomcat resources are within normal tolerancesbut processing time suddenly spikes it can be an indication that a back-end service (such as a database or anotherweb service) is misbehaving.
The following metrics can be collected and graphed:
• Tomcat cache (accesses vs hits)
• Daemon and User thread count
• Overall CPU time
• Global Request Traffic: bytes sent/received
• Global Request Traffic: request count and error count
• Global Request processing time
• JSP/Servlet reload time
• Servlet class loading and processing time
• Servlet request and error count
Tip
The more extensive JBoss Application Server uses Tomcat as a Web Application engine to manage web appli-cations deployed inside enterprise applications within JBoss. As a result, the TomcatMonitor ZenPack can beused to monitor Tomcat MBeans that are active within JBoss.
22.2. Prerequisites
Prerequisite Restriction
Zenoss Version Zenoss Version 2.2 or higher

Apache Tomcat Application Server
59
Prerequisite Restriction
Required ZenPacks ZenPacks.zenoss.ZenJMX,ZenPacks.zenoss.TomcatMonitor
Table 22.1. Tomcat Prerequisites
22.3. Enable Monitoring
22.3.1. Configuring Tomcat to Allow JMX Queries
Before running the Tomcat bin/start.sh script, run the following to allow unsecured queries against the Tomcatserver:
JAVA_OPTS="-Dcom.sun.management.jmxremote.port=12346"JAVA_OPTS="${JAVA_OPTS} -Dcom.sun.management.jmxremote.authenticate=false"JAVA_OPTS="${JAVA_OPTS} -Dcom.sun.management.jmxremote.ssl=false"export JAVA_OPTS
The same JAVA_OPTS approach can be used to enable remote access to Tomcat MBeans. Set the JAVA_OPTS variableas illustrated above and then execute the ./catalina.sh start command in the ${TOMCAT_HOME}/bin directory.
Note
Tomcat 6.0.14's catalina.sh does not process the stop command properly when the JAVA_OPTS variable is set.We recommend using two separate shell scripts when troubleshooting JMX problems in Tomcat: one for startingTomcat (with the JAVA_OPTS variable set) and a different one for stopping Tomcat (where the JAVA_OPTS variableis not set).
If you add the above lines to the to bin/setenv.sh (as seems to be the logical thing to do in catalina.sh to getthe environment variables set up), the bin/shutdown.sh script will get those same environment variables. Thiswill cause the shutdown.sh script to attempt to bind to the ports, fail, and then not stop Apache Tomcat.
22.3.2. Configuring Zenoss
All Apache Tomcat services must have a device entry under the /Devices/Server/Tomcat device class.
Note
The zenjmx daemon must be configured and running. See Section 10.2.1, “Sun Java Runtime Environment(JRE)” for more information about configuring the zenjmx daemon with the Sun JRE tools.
1. Navigate to the device or device class under the /Devices/Server/Tomcat device class in the Zenoss interface.
• If applying changes to a device class:
a. Select the class in the devices hierarchy.
b. Click Details.
c. Select Configuration Properties.
• If applying changes to a device:
a. Click the device in the device list.
b. Select Configuration Properties.
2. Edit the appropriate configuration properties for the device or devices.

Apache Tomcat Application Server
60
Name Description
zTomcatJ2EEApplicationName Used to construct MBean names for a specific application de-ployed on Tomcat, typically used for JSP and Servlet statistics.
zTomcatJ2EEServerName Used to construct MBean names for a specific application de-ployed on Tomcat, typically used for JSP and Servlet statistics.
zTomcatJmxManagementAuthenticate This configuration property is deprecated.
zTomcatJmxManagementPassword JMX password.
zTomcatJmxManagementPort The port number used to gather JMX information.
zTomcatJmxManagementUsername JMX username for authentication.
zTomcatListenHost The hostname on which Tomcat is listening for web requests.This is used to construct MBean names.
zTomcatListenPort The Tomcat connector, which is a port and protocol (http, jk...)that Tomcat is listening on. This is used to construct MBeannames that monitor bytes, error and requests on that connector.
zTomcatServletName Specific Servlet name to monitor.
zTomcatServletUri URI of Servlet to monitor.
zTomcatWebAppUri URI path for a Tomcat web application. Used to constructMBean names.
Table 22.2. Tomcat Configuration Properties
3. Click Save to save your changes.
You will now be able to start collecting the Tomcat server metrics from this device.
4. Navigate to Graphs and you should see some placeholders for performance graphs. After approximately fifteenminutes you should see the graphs start to become populated with information.
Tip
The out-of-the-box TomcatMonitor data source configuration has been defined at the macro level, but can beconfigured to operate on a more granular basis. For example, the Servlet Reload Count applies to all servlets inall web applications but it could be narrowed to be Servlet /submitOrder in web application "production server".
22.4. Change the Amount of Data Collected and Graphed1. Navigate to the device or device class under the /Devices/Server/Tomcat device class in the Zenoss interface.
2. From the left panel, select Monitoring Templates.
3. From the Action menu, select Bind Templates.
4. Move one or more templates to Selected, and then click Save.
Name Description
Tomcat Cache Cache information about a specific Web application deployed.
Tomcat Core Core information about any Tomcat server: memory usage,threads, uptime, etc.
Tomcat Global Request Processor Connection information over a Tomcat connector: bytes, errors,requests.
Tomcat JSPS Metrics about a specific JSP page.

Apache Tomcat Application Server
61
Name Description
Tomcat Servlet Metrics about a specific Servlet.
Tomcat Thread Pool Threadpool metrics measured per Tomcat connector.
Tomcat Web Module Processing time metrics for a Web module.
Table 22.3. Tomcat Templates
5. Click the OK button to save your changes.
22.5. Viewing Raw DataSee Section 10.5, “Using JConsole to Query a JMX Agent” for more information about how to investigate raw datareturned from the application.
22.6. Daemons
Type Name
Performance Collector zenjmx
Table 22.4. Daemons

62
Chapter 23. BEA WebLogic ApplicationServer23.1. About
WebLogicMonitor allows you to monitor a WebLogic Server. WebLogicMonitor uses the JMX Remote API and andaccesses MBeans deployed within WebLogic that contain performance information about the components that arebeing managed. This performance information includes pool sizes for data sources (JDBC), threads, connections(JCA), queues (JMS), servlets, JSPs, Enterprise Java Beans (EJB), timer queues.
Throughput is also monitored when it is available. This metric is computed by WebLogic and is based on the numberof messages moving through a queue at any given time. The throughput metric gives a good picture of the health ofthe messaging subsystem, which is commonly used throughout many enterprise applications. Stateless, Stateful,and Entity EJB performance metrics are monitored, as are message driven bean performance.
Security realms are also monitored for potential denial of service attacks. This includes recording of authenticationfailures, broken out by valid accounts, invalid accounts, and accounts that are currently locked out. Applicationspecific realms can be monitored by customizing the built in WebLogic default realm.
23.1.1. Overall Application Server Vitals• Number of total and active JMS connections and servers
• Overall number of JTA transactions that are rolled back or abandoned
• JTA transactions rolled back due to system, application, or resource issues
• Number of JTA rollbacks that timeout
• Active and committed JTA transaction count
• Timer exceptions, executions, and scheduled triggers
• User accounts that are locked and unlocked
• Authentication failures against locked accounts and non-existent accounts
• Total sockets opened, and the current number of open sockets
• JVM Mark/Sweep and Copy garbage collector execution counts
• Number of JVM daemon threads
• JVM Heap/Non-Heap used and committed memory
23.1.2. Entity EJB, Message Driven Bean (MDB), and Session EJB SubsystemMetrics• Rollback and commit count on a per-EJB basis
• Bean pool accesses, cache hits, and cache misses
• Number of Beans in use, idle, and destroyed
• Number of activations and passivations
23.1.3. Data Pool (JDBC) metrics• Leaked, Total, and Active connections

BEA WebLogic Application Server
63
• Number of requests waiting for a connection
• Number of reconnect failures
23.1.4. Queue (JMS) Metrics• Bytes received, currently active, and pending in the queue
• Number of queue consumers
• Number of current, pending, and receives messages
23.2. Prerequisites
Prerequisite Restriction
Zenoss Version Zenoss Version 2.2 or higher
Required ZenPacks ZenPacks.zenoss.ZenJMX,ZenPacks.zenoss.WebLogicMonitor
BEA WebLogic Versions WebLogic 9.0 or higher
Table 23.1. BEA WebLogic Prerequisites
23.3. Enable Monitoring
23.3.1. Configuring WebLogic to Allow JMX Queries
If you have not set up a domain and server then run the startWLS.sh script located in the ${BEA_HOME}/wlserv-er_10.0/server/bin directory. If you don't have the Terminal I/O package installed you can set the JAVA_OPTIONSvariable to the following value:
JAVA_OPTIONS="-Dweblogic.management.allowPasswordEcho=true"export JAVA_OPTIONS
Provide a user name and password to start WebLogic. Note that WebLogic requires a password that is at leasteight characters long. Wait for WebLogic to generate a configuration and start up. Shut down WebLogic and restartit with remote JMX access enabled.
To enable remote JMX access set the following variable:
JAVA_OPTIONS="-Dcom.sun.management.jmxremote.port=12347"JAVA_OPTIONS="${JAVA_OPTIONS} -Dcom.sun.management.jmxremote.authenticate=false"JAVA_OPTIONS="${JAVA_OPTIONS} -Dcom.sun.management.jmxremote.ssl=false"export JAVA_OPTIONS
Then re-run the ./startWLS.sh script. JConsole can then communicate with the server on port 12347.
23.3.2. Configuring Zenoss
All WebLogic services must have a device entry under the /Devices/Server/WebLogic device class.
Note
The zenjmx daemon must be configured and running. See Section 10.2.1, “Sun Java Runtime Environment(JRE)” for more information about configuring the zenjmx daemon with the Sun JRE tools.

BEA WebLogic Application Server
64
1. Navigate to the device class or device.
• If applying changes to a device class:
a. Select the class in the devices hierarchy.
b. Click Details.
c. Select Configuration Properties.
• If applying changes to a device:
a. Click the device in the device list.
b. Select Configuration Properties.
2. Edit the appropriate configuration properties for the device or devices.
Name Description
zWebLogicJmxManagementAuthenticate This configuration property is deprecated
zWebLogicJmxManagementPassword JMX password
zWebLogicJmxManagementPort The port number used to gather JMX information
zWebLogicJmxManagementUsername JMX username for authentication
Table 23.2. WebLogic Configuration Properties
3. Click Save to save your changes.
You will now be able to start collecting the WebLogic server metrics from this device.
4. Navigate to Graphs and you should see some placeholders for performance graphs. After approximately 15minutes you should see the graphs start to become populated with information.
Tip
The out-of-the-box WebLogic data source configuration has been defined at the macro level, but can be configuredto operate on a more granular basis. For example, the Servlet Reload Count applies to all servlets in all webapplications but it could be narrowed to be Servlet /submitOrder in web application "production server".
23.4. Change the Amount of Data Collected and Graphed1. Navigate to the device or device class.
2. Select Monitoring Templates in the left panel.
3. From the Action menu, select Bind Templates to display the Bind Templates dialog.
4. Move templates from the Available area to the Selected area, and then click Save.
Name Description
WebLogic Core Core information about any WebLogic server, including memoryusage, threads, and uptime.
WebLogic JCA
WebLogic JMS
WebLogic JMS Destination
WebLogic JTA
WebLogic JTA Rollbacks
WebLogic JVM

BEA WebLogic Application Server
65
Name Description
WebLogic Thread Pool Threadpool metrics measured per Tomcat connector
WebLogic Timer Service
WebLogic User Lockouts
Table 23.3. WebLogic Templates
5. Click the OK button to save your changes.
23.5. Viewing Raw DataSee the Section 10.5, “Using JConsole to Query a JMX Agent” section for more information about how to investigateraw data returned back from the application.
23.6. Monitor SSL-Proxied WebLogic ServersIf you are monitoring a Web application running on a BEA WebLogic server you may find that the transaction alwaysfails with a code 550 regardless of how you configure the script. This could be a result of the WebLogic server beingbehind an SSL proxy. When used in this configuration, WebLogic requires that a WL-Proxy-SSL header be added tothe request so that it knows to redirect to HTTPS instead of HTTP.
To support this extra header in your Zenoss Web transaction, you must make the following changes on the scripttab of your WebTx data source.
• Remove any content from the Initial URL field.
• Add the following to the beginning of the Script box.
add_extra_header WL-Proxy-SSL truego
23.7. Daemons
Type Name
Performance Collector zenjmx
Table 23.4. Daemons

66
Chapter 24. BIG-IP Network Devices24.1. AboutThe Zenoss BIG-IP network device monitoring feature monitors load balancer CPU and memory utilization. It alsotracks per-instance metrics for each load-balanced virtual server that is configured.
24.2. Prerequisites
Prerequisite Restriction
Zenoss Version Zenoss Version 2.2 or higher
Required ZenPacks ZenPacks.zenoss.BigIPMonitor
Table 24.1. BIG-IP Prerequisites
24.3. Enable MonitoringTo add a device and enable BIG-IP monitoring on it:
1.From Infrastructure, select Add a Single Device from (Add Device).
The Add a Single Device page appears.
2. Enter a name for the device, and then select these values:
• Model Device - De-select this option.
• Device Class - Select /Network/BIG-IP.
3. Click Add.
4. Navigate to the newly created device.
5. Select Configuration Properties in the left panel.
6. Change the values of these configuration properties:
• zSnmpCommunity - Enter the SNMP community string here.
• zSnmpVer - Select v2c.
Figure 24.1. BIG-IP Configuration Properties Selections
7. Click Save.
8. Model the device. To to this, select Manage > Model Device from the page menu.

BIG-IP Network Devices
67
Zenoss models the device. When modeling completes, you can view the device. After approximately fifteenminutes, you can verify that the performance graphs are updating.
24.4. Viewing Virtual ServersTo view the virtual servers, select BIG-IP details. Click a link in the table to view additional information for eachload-balanced server.
24.5. Daemons
Type Name
Modeler zenmodeler
Performance Collector zenperfsnmp
Table 24.2. Daemons

68
Chapter 25. Brocade SAN Switches25.1. AboutBrocadeMonitor allows you to monitor Brocade Storage Area Network (SAN) switches.
25.2. Prerequisites
Prerequisite Restriction
Zenoss Version Zenoss Version 2.2 or higher
Required ZenPacks ZenPacks.zenoss.BrocadeMonitor,ZenPacks.zenoss.StorageBase
Table 25.1. Brocade Prerequisites
25.3. Enable Monitoring
25.3.1. Configuring Brocade Devices to Allow SNMP Queries
Configure the Brocade devices to allow SNMP queries from the Zenoss server, and send SNMP v1 or SNMP v2traps to the Zenoss server.
25.3.2. Configuring Zenoss
All Brocade devices must exist under the /Devices/Storage/Brocade device class.
1. Navigate to the device or device class in the Zenoss interface.
• If applying changes to a device class:
a. Select the class in the devices hierarchy.
b. Click Details.
c. Select Configuration Properties.
• If applying changes to a device:
a. Click the device in the device list.
b. Select Configuration Properties.
2. Edit the appropriate configuration properties for the device or devices.
Name Description
zSnmpCommunity Consult with your storage administrators to determine the SN-MP community permitted
zSnmpMonitorIgnore This should be set to False
zSnmpPort The default port is 161
zSnmpVer This should be set to v2c
Table 25.2. Brocade Configuration Properties
3. Click Save to save your changes. You will now be able to start collecting the Brocade switch metrics from thisdevice.

Brocade SAN Switches
69
25.4. Viewing Fibre Channel Port InformationTo view the virtual servers, select Brocade Details.
25.5. Daemons
Type Name
Modeler zenmodeler
Performance Collector zenperfsnmp
Table 25.3. Daemons

70
Chapter 26. CheckPoint Firewalls26.1. About
The CheckPointMonitor ZenPack allows you to monitor CheckPoint firewalls.
26.2. Prerequisites
Prerequisite Restriction
Zenoss Version Zenoss Version 2.2 or higher
Required ZenPacks ZenPacks.zenoss.CheckPointMonitor
Table 26.1. CheckPoint Prerequisites
26.3. Enable Monitoring
26.3.1. Configuring CheckPoint Firewalls to Allow SNMP Queries
Configure the CheckPoint firewall to allow SNMP queries from the Zenoss server, and to send SNMP v1 or SNMPv2 traps to the Zenoss server.
26.3.2. Configuring Zenoss
All CheckPoint devices must exist under the /Devices/Network/Check Point device class.
1. Navigate to the device or device class in the Zenoss interface.
• If applying changes to a device class:
a. Select the class in the devices hierarchy.
b. Click Details.
c. Select Configuration Properties.
• If applying changes to a device:
a. Click the device in the device list.
b. Select Configuration Properties.
2. Edit the appropriate configuration properties for the device or devices.
Name Description
zSnmpCommunity Consult with your network administrators to determine the SN-MP community permitted.
zSnmpMonitorIgnore This should be set to False
zSnmpPort The default port is 161
zSnmpVer This should be set to v2c
Table 26.2. CheckPoint Configuration Properties
3. Click Save to save your changes.
You will now be able to start collecting the CheckPoint firewall metrics from this device.

CheckPoint Firewalls
71
4. Navigate to Graphs and you should see some placeholders for performance graphs. After approximately fifteenminutes you should see the graphs start to become populated with information.
26.4. Daemons
Type Name
Modeler zenmodeler
Performance Collector zenperfsnmp
Table 26.3. Daemons

72
Chapter 27. Cisco Devices27.1. About
The CiscoMonitor ZenPack allows you to monitor a variety of devices from Cisco Systems. Most Cisco devices arewell-supported by the standard capabilities of Zenoss. This ZenPack extends those basic capabilities to supportmodeling and monitoring of characteristics specific to Cisco devices.
27.2. Prerequisites
Prerequisite Restriction
Zenoss Version Zenoss Version 2.4 or higher
Required ZenPacks ZenPacks.zenoss.CiscoMonitor
Table 27.1. Cisco Prerequisites
27.3. Enable Monitoring
Follow the steps in this section to configure your Cisco device and Zenoss for monitoring.
27.3.1. Configuring Cisco Devices to Allow SNMP Queries
Configure the Cisco device to allow SNMP queries from the Zenoss server, and send SNMP v1 or SNMP v2 trapsto the Zenoss server.
27.3.2. Configuring Zenoss
All Cisco devices must be located in the /Devices/Network/Cisco device class.
1. Navigate to the device or device class in the Zenoss interface.
• If applying changes to a device class:
a. Select the class in the devices hierarchy.
b. Click Details.
c. Select Configuration Properties.
• If applying changes to a device:
a. Click the device in the device list.
b. Select Configuration Properties.
2. Edit the appropriate configuration properties for the device or devices.
Name Description
zSnmpCommunity Consult with your network administrators to determine the SN-MP community permitted.
zSnmpMonitorIgnore Set to a value of False.
zSnmpPort The default port is 161.

Cisco Devices
73
Name Description
zSnmpVer Set to a value of v2c.
Table 27.2. Cisco Configuration Properties
3. Click Save to save your changes. Zenoss now will collect Cisco device metrics from the configured device ordevices.
4. Navigate to Graphs and you should see some placeholders for performance graphs. After approximately 15minutes you should see the graphs start to become populated with information.
27.4. Forwarding Syslog Messages to Zenoss
For information about forwarding syslog messages from Cisco IOS routers and CatOS switches into Zenoss, seeAppendix C, "Syslog Device Preparation" in Zenoss Administration.
27.5. Extended Capabilities for Cisco Devices
27.5.1. IOS
You should place Cisco devices running IOS in the /Devices/Network/Cisco device class. This lets them benefitfrom these extended monitoring capabilities:
• Modeling of hardware serial number. This information can be found in the details information for Cisco IOSdevices.
• Monitoring of CPU and memory utilization. This information can be found on the Graph page for Cisco IOSdevices.
• Modeling and monitoring of IP-SLA (RTTMON). This information can be found by navigating to the device, andthen selecting Cisco Details from the left panel. menu.
• Modeling of stacked switch modules. This information can be found by navigating to the device, and then se-lecting Cisco Details from the left panel.

Cisco Devices
74
27.5.2. CatOS
You should place Cisco Catalyst devices running CatOS in the /Network/Cisco/CatOS device class. The only differ-ence in this class is that the CPU and memory performance monitoring is done by using a different configuration.Otherwise, the devices are treated the same as IOS devices.
27.5.3. ASA, FWSM and PIX
You should place Cisco ASA, FWSM, and PIX devices in the /Network/Cisco/ASA device class. The only difference inthis class is that the CPU and memory performance monitoring is done by using a different configuration. Otherwise,the devices are treated the same as IOS devices.
Zenoss can encounter problems when querying Cisco PIX, ASA, and FWSM devices using SNMP. This is because,by default, Zenoss tries to fit forty requests into a single SNMP packet when using SNMP v2c. This improvesperformance and reduces network and processing overhead on Zenoss and the monitored device.
Common symptoms of this problem include:
• DEBUG level /Perf/Snmp events with a summary field of Error reading value for "???"
• Missing performance graphs.
• Errors similar to this that appear in the Cisco device log:
incoming SNMP request (? bytes) from IP address ?.?.?.? Port ? Interface "inside" exceeds data buffer size, discarding this SNMP request.
27.5.4. Wireless LAN Controllers
You should place Cisco Wireless LAN Controllers in the /Network/Cisco/WLC device class. This lets them benefitfrom the following extended monitoring capabilities:
• Modeling of hardware model, serial number and operating system. This information can be found on the deviceOverview page.
• Modeling of individual access points controller by the wireless LAN controller. This information can be found bynavigating to the wireless LAN controller device, and then selecting Wireless in the left panel.
27.5.5. ACE Load Balancers
You should place Cisco ACE (Application Control Engine) devices in the /Network/Cisco/ACE device class. This letsthem benefit from the following extended monitoring capabilities:
• Modeling and monitoring of individual load balanced virtual servers. This information can be found by navigatingto the device, and then selecting Cisco Details in the left panel.
27.5.6. Telepresence Codecs
You should place Cisco Telepresence Codec devices in the /Network/Cisco/Codec device class. This lets thembenefit from the following extended monitoring capabilities:
• Modeling of hardware model, serial number and operating system. This information can be found on the overviewpage for Telepresence Codec devices.

Cisco Devices
75
• Modeling of all peripherals controlled by the codec. This information can be found by navigating to the Telep-resence Code device, and then selecting Telepresence from the left panel.
27.6. Daemons
Type Name
Modeler zenmodeler
Performance Collector zenperfsnmp
Table 27.3. Daemons

76
Chapter 28. Cisco UCS28.1. About
The CiscoUCS ZenPack enables Zenoss to use HTTP to monitor Cisco Unified Computing System (UCS) devices.Using Cisco's UCSTM™ Manager XML API, the system models and monitors devices placed in the /CiscoUCSdevice class.
The Cisco UCS ZenPack provides:
• Fabric interconnect monitoring
• Monitoring of equipment chassis and their compute blades
• Monitoring of service profiles, their compute blade assignments, and links to any other Zenoss device from theUCS service profile on which it is running
• Full monitoring of events generated by the UCS
28.2. Prerequisites
Prerequisite Restriction
Zenoss Version Zenoss Version 2.5.2 or higher
Required ZenPacks ZenPacks.zenoss.CiscoUCS,ZenPacks.zenoss.DynamicView
Table 28.1. Cisco UCS Prerequisites
28.3. Adding a Cisco UCS Device for Monitoring
Follow these steps to begin monitoring a Cisco UCS device through Zenoss:
1. In the Zenoss interface, navigate to the /CiscoUCS device class.
2.From , select Add Cisco UCS.
The Add Cisco UCS dialog appears.

Cisco UCS
77
Figure 28.1. Add Cisco UCS Unit
3. Enter information in the dialog:
• Hostname or IP Address - Enter the host name or IP address of the UCS manager.
• Username - Enter the user name of an authorized user.
• Password - Enter the password to the user account.
• Port # - By default, Zenoss assumes a standard HTTP port of 80. Change this value as needed.
4. Click Add Unit to begin discovery.
28.4. UCS Monitoring CredentialsThese configuration properties are populated automatically if you use the Add Cisco UCS dialog. (See the previoussection, Adding a Cisco UCS Device for Monitoring.)
Name Description
zCiscoUCSManagerUser Username that will be used to access the Cisco UCS throughthe UCS Manager.
zCiscoUCSManagerPassword Password to validate the username.
zCiscoUCSManagerPort Port number used to monitor the Cisco UCS. The default valueis 80.
Table 28.2. Cisco UCS Configuration Properties
28.5. Daemons
Type Name
Modeler zenmodeler
Performance Collector zencommand
Event Monitoring zenucsevents
Table 28.3. Daemons

78
Chapter 29. Datacenter View29.1. About
Datacenter View is a visual representation of devices (such as a server or blade and device containers (such as arack or chassis) in the system. Using this feature, you can create a custom view that represents a physical space(such as a data center) by customizing the view background. You can then overlay this view with active represen-tations of your devices and device containers.
Figure 29.1. Custom View
For each device or device container, the system can generate a rack view, which diagrams the physical location ofdevices in a chassis or rack. Each represented device provides at-a-glance information about its status.
Figure 29.2. Rack View

Datacenter View
79
29.2. Prerequisites
Prerequisite Restriction
Zenoss Version Zenoss Version 2.5.1 or later
Required ZenPacks ZenPacks.zenoss.Diagram
Table 29.1. Datacenter View Prerequisites
Before a device or sub-location can appear in Datacenter View:
• At least one organizer must be configured
• At least one device or sub-organizer must be included in a location
To see the auto-generated rack view, you must set a rack slot value for the device. (For more information about thisview, see the section titled Activating the Auto-Generated Rack View.)
29.3. Working with the List ViewThe List View provides a view of your devices (or, if configured, the Rack View).
Follow these steps to access the List View:
1. From the interface, select Infrastructure.
2. In the devices hierarchy, select a location, group, or system.
3. Click Details.
4. Select Diagram.
The List View appears.
Note
After you create a Custom View, that view appears by default.
29.4. Working with the Custom ViewThe Custom View lets you create a visual representation of your physical space (such as a data center).
To access the Custom View, from the Diagram selection, click Custom View.
You can edit the Custom View to:
• Add or change a background image
• Move or resize device images
• Remove the view
29.4.1. Adding a Background Image to the Custom View
Follow these steps to create a custom view and add a background image to the view:
1. From the Datacenter View page (accessed from the Diagram selection), click Custom View.
2. Click Edit to enable edit mode.
The Edit button highlights to indicate that it is active, and Options selections become available.

Datacenter View
80
3. Select Options > Change Background.
The Change Background dialog appears.
4. Select Background Image from URL from the list of options.
5. Enter an image location in the Image URL field, and then click Save. Any image format and size supported byyour browser can be used.
Figure 29.3. Change Background
29.4.1.1. Removing the Custom View Background Image
To remove the current background image from the Custom View:
1. From the Custom View area, click Edit.
2. Select Options > Change Background.
3. In the Change Background dialog, select No background image from the list of options.
4. Click Save.
The image no longer appears in the view.
29.4.2. Working with Devices in the Custom View
Devices in the custom view can be moved and resized. To work with devices in this view, click Edit. You can thendrag devices to a specific location in the view, and resize them to accurately represent your physical space.
You also can view device details from this view. Click the device to go to its Status page.
Note
To access device status, you cannot be in edit mode.
29.4.3. Removing the Custom View
Removing the custom view removes the view and custom background image, if any. To remove a custom view:
1. From the Datacenter View page (accessed from the Diagram selection), click Custom View.
2. Click Edit to enable edit mode.
3. Select Options > Remove Custom View.
The custom view no longer appears by default. If you select Custom View, devices still appear in the view;however, they are reset to default positions and sizes.

Datacenter View
81
29.5. Activating the Auto-Generated Rack ViewFirst, ensure that the device is included in a location. Then follow these steps to make devices visible in DatacenterView.
1. Edit the device you want to make visible. From the list of Devices, select a device (in the illustration,beta.zenoss.loc), click Details, and then select Edit.
2. Enter values for Rack Slot, in the format:
ru=n,rh=n,st=n
where:
• ru=n sets the value for rack unit (the lowest unit used by the device)
• rh=n sets the value for rack height (the number of units the device uses in the rack)
• st=n sets the value for rack slot
• sc=n sets the value for slot capacity (set only for chassis devices)
For example, values of:
ru=2,rh=1
establishes a device visually in the rack as shown in this illustration:
Figure 29.4. Setting Rack Slot Value
Note
In the example, a rack slot value is not needed, as there is only one device.
3. Click Save.
The device appears in Datacenter View. In the List View, it appears as part of a rack illustration. (The rack illustrationis now the default image in the List View.)
In the Custom View, it appears as a single device image.
Note
You can customize this device image by modifying the zIcon configuration property in the device class.

82
Chapter 30. Device Access Control Lists30.1. About
The Device Access Control List (ACL) Enterprise ZenPack (ZenDeviceACL) adds fine-grained security controls toZenoss. You can use this control to limit access to data, such as limiting access to certain departments within alarge organization, or limiting a customer of a service provider to see only his own data.
A user with limited access to objects also has a more limited view of features within the system. Most global views,such as the network map, event console, and all types of class management, are not available. The Device Listis available, as are the device organizers Systems, Groups, and Locations. A limited set of reports can also beaccessed.
30.2. Prerequisites
Prerequisite Restriction
Zenoss Version Zenoss Version 2.2 or higher
Required ZenPacks ZenPacks.zenoss.ZenDeviceACL
Table 30.1. Device ACL Prerequisites
30.3. Key Concepts
30.3.1. Permissions and Roles
Actions in Zenoss are assigned permissions. For example, to access the device edit screen you must have the“Change Device” permission. Permissions are not assigned directly to a user, but granted to roles, which are thenassigned to a user. A common example is the ZenUser role. Its primary permission is “View,” which grants read-only access to all objects.
ZenManagers have additional permissions, such as “Change Device,” which grants users with this role access tothe device edit screen. When you assign a role to a user (using the Roles field on the Edit tab), it is assigned globally.When creating a restricted user you may not want to give that user a global role.
For more information about Zenoss roles, refer to Zenoss Administration.
30.3.2. Administered Objects
Device ACLs provide limited control to various objects in the system. Administered objects are the same as deviceorganizers (groups, systems, locations, and devices). If access is granted to any device organizer, it extends to alldevices in that organizer.
To assign access to objects for a restricted user, you must be assigned the Manager or ZenManager role. Zenossgrants access to objects by using the “Administered Objects” selection for a user or user group. To limit access,you must not assign a “global” role to the user or group.
30.3.3. Users and Groups
Users and user groups work exactly as they would normally. See the chapter titled "Managing Users" in ZenossAdministration for more information about managing users and groups.

Device Access Control Lists
83
30.3.4. Assigning Administered Object Accessa
For each user or group there is selection called "Administered Objects." The Action menu has an "Add" item for eachtype of administered object. Adding an object will bring up a dialog box with live search on the given type of object.
After adding an object, you can assign it to a role. Roles can be different for each object. For example, a user orgroup might have the ZenUser role assigned to a particular device but the ZenManager role assigned to a locationorganizer. If multiple roles are granted to a device though direct assignment and organizer assignment, the resultingpermissions will be additive. For the previously cited example, if the device is within the organizer the user will inheritthe ZenManager role on the device.
30.3.5. Restricted Screen Functionality
30.3.5.1. Dashboard
By default, the dashboard is configured with three portlets:
• Object Watch List
• Device Issues
• Production State
These have content that are restricted to objects for a given user.
30.3.5.2. Device List
The device list is automatically filtered to devices of a restricted user, scoped to accessible devices. There are nomenu items available.
30.3.5.3. Device Organizers
Device organizers control groups of devices for a restricted user. Each device added to the group will be accessibleto the user. Permissions are inherited through multiple tiers of a device organizer.
30.3.5.4. Reporting
Reports are limited to device reports and performance reports.
30.3.5.5. Viewing Events
A user in restricted mode does not have access to the global event console. The available events for the user canbe seen under his organizers.
30.4. Create a User Restricted to Specific Devices1. As admin or any user account with Manager or ZenManager role, create a user named acltest. Set a password
for the user.
2. From the user’s Edit page, make sure that no role is assigned.
3. Select the user’s Administered Objects page.
4. From the Action menu, select the “Add Device…” item and add an existing device to that user.
The device’s role defaults to ZenUser.
5. Log out of your browser, or open a second browser and then log in as acltest.
6. Go to Infrastructure > Devices.

Device Access Control Lists
84
You should see only the device you assigned to acltest.
7. Navigate to the device and notice that the Edit selection is not available. This is because you are in read-onlymode for this device.
30.5. Create a Manager Restricted to Specific DevicesFollowing the previous example:
1. From the user's edit page, change the acltest user’s role to “ZenManager." (You must do this as a user withZenManager global rights.)
2. Go back to the acltest user's Administered Objects and set the role on the device to ZenManager.
3. As acltest, navigate to the device. You now have access to the Edit page.
30.6. Adding Device Organizers1. Go to the Groups root and create a group called “RestrictGroup."
2. Go to the acltest user’s Administered Objects and add the group to the user.
3. Logged in as acltest, notice that the Navigation menu has the Groups item. Group can be added to a user.
4. Place a device within this group and as acltest you should not only see the device within the group but alsoin the device list.
30.7. Restricted User Organizer Management1. Assign the acltest user the ZenManager role on your restricted group.
2. As acltest, you can now add sub-organizers under the restricted group.

85
Chapter 31. Distributed Collector31.1. About
Distributed Collector allows you to deploy additional performance collection and event monitoring daemons to theZenoss server or other servers. This allows you to:
• Distribute processor, disk, and network load across multiple servers.
• Collect performance and events from networks that cannot be reached by the Zenoss server.
• Configure more than one set of monitoring settings, such as different cycle times for the zenperfsnmp daemon.
When you first install Distributed Collector, Zenoss is configured with one hub and one collector. A collector is a set ofcollection daemons, on the Zenoss server or another server, that shares a common configuration. That configurationcontains values, such as number of seconds between SNMP collection cycles, default discovery networks, andmaximum number of zenprocess parallel jobs.
Each collector has its own copy of each of the Zenoss collection daemons. For example, Zenoss initiallycontains collection daemons with names like zenperfsnmp, zenprocess, and zenping. If you create a new col-lector named My2ndCollector, then the system creates new daemons named My2ndCollector_zenperfsnmp,My2ndCollector_zenprocess, and My2ndCollector_zenping.
You cannot delete the initial hub and collector set up by Distributed Collector (both named localhost).
31.1.1. Navigating Existing Collectors and Hubs
When you log in as the Zenoss admin user, go to Advanced > Collectors. The Collectors page lists existing hubsand collectors in hierarchical form. Hubs are listed at the top level; collectors are nested below the hub to whichthey belong.
From this page, you can:
• Add a hub
• Delete a hub (which also deletes its associated collectors)
• View and edit hub settings
• Configure associated monitoring templates
Select a hub to display details and configuration options. The Daemons selection lists the copy of the ZenHub daemonthat belongs to the collector. Links adjacent to the daemon name allow you to view its log, and view and edit itsconfiguration. Use the buttons to the right of the daemon name to stop, start, and restart the daemon.
31.1.2. Restrictions and Requirements• Servers hosting remote hubs or collectors must be the same operating system and hardware architecture as
the Zenoss server. For example, if the Zenoss server is running RedHat Enterprise Linux v5 on Intel 32-bithardware, then hubs and collectors can be deployed only to other RHEL 5 32-bit servers.
• By default, port 8789 must be open so that a distributed collector can communicate with ZenHub. (This candiffer if you have configured ZenHub to run on a different port.) For a remote ZenHub, port 3306 most be openfor MySQL communications, and port 8100 must be open for ZEO communications.
• You must update all hubs and collectors after performing any of these functions on your master Zenoss server:
• Upgrade

Distributed Collector
86
• Install patches
• Install, upgrade, or remove ZenPacks
To update a hub, select Overview, and then select Update Hub from the Action menu. To update a collector,select it, and then select Update Collector from the Action menu.
• Zenoss is not compatible with Security-Enhanced Linux (SELinux) in enforcing mode. You must disable enforc-ing mode for all platforms running the Zenoss daemons (Zenoss master, remote hubs, and remote collectors).
To disable enforcing mode:
1. Edit the /etc/linux/config file.
2. Set the following line:
SELINUX=disabled
Note
You also can disable enforcing mode temporarily (avoiding the need to reboot) with the command:
echo 0 > /selinux/enforce
For more information about SELinux, browse to http://en.wikipedia.org/wiki/SELinux, or to the SELinux homepage at http://www.nsa.gov/research/selinux/index.shtml.
For additional platform-specific information, refer to Section 31.1.5, “Platform Notes”.
31.1.3. Installation Notes• Make sure the Zenoss server's hostname is a fully qualified domain name.
• Remember that collectors and hubs can be pushed only to servers with identical operating system versions andhardware architecture.
• When installing a remote hub, make sure that Event Manager > hostname has a fully qualified domain name(preferred) or at least a numeric address that can be reached by any server with hubs deployed to it.
• If you have any other firewalls on the Zenoss server, or on servers that host remote collectors or hubs, thenyou should disable them.
31.1.4. Firewall Notes
Remote hubs need to communicate with the ZEO database on the Zenoss server on port 8100. Hubs also need tocommunicate with the MySQL server, usually on the Zenoss server (see Event Manager > Hostname), and on theport specified in Event Manager > Port (usually 3306.) Collectors communicate with their hub on the port specifiedwhen the hub was created. See the ZenHub Port field on the hub's overview page.
31.1.5. Platform Notes
Software Appliance and Hardware Appliance
• Hubs and collectors can be deployed only to other Zenoss software or hardware appliances.
• You must stop Zenoss on an appliance before deploying a hub or collector to it.
• You must set a password for the root user on an appliance before deploying a hub or collector to it.
• When using appliances for the Zenoss server and remote server the user must shutdown Zenoss on the remoteserver before creating hub or collectors on it. Otherwise, ZEO, Zope, and the standard Zenoss daemons willrun indefinitely on that server and will no longer be controllable via the zenoss script.

Distributed Collector
87
• Do not use conary to update appliances being used as remote collectors or hubs.
31.1.6. Debugging
Hostname Configuration
The Zenoss server should have a properly configured hostname (preferably a fully qualified domain name). Youcan check the hostname from the shell:
root# hostname
You also can check by using the Python function used by Zenoss:
root# python -c 'import socket; print socket.gethostname()'
31.2. Prerequisites
Prerequisite Restriction
Zenoss Version Zenoss Version 2.4 or higher
Required ZenPacks ZenPacks.zenoss.DistributedCollector
Table 31.1. Distributed Collector Prerequisites
31.3. Typical Usage Scenarios for Distributed Monitoring
Typical setup scenarios for using multiple hubs and collectors are:
• ZeoDB - local hub - local collector
• ZeoDB - local hub - remote collector
• ZeoDB - local hub - multiple remote collectors
• ZeoDB - multiple remote hubs - multiple remote collectors
The correct distributed strategy for your environment depends on network security restrictions, as well as scale.Contact Zenoss Support if you are unsure which option best suits your enterprise.
31.3.1. ZeoDB - Local Hub - Local Collector
This setup requires only a single server, and is the most common Zenoss deployment type. You would most likelyuse this configuration if you need to monitor fewer than 1000 devices, and your master Zenoss server has directnetwork access to all of the monitored devices.
31.3.2. ZeoDB - Local Hub - Remote Collector
This setup requires two servers, and is the most basic distributed setup. The primary benefit of this configurationover the local hub/local collector configuration is that the master server does no collection. This frees resources,optimizing the server's ability to perform its central role of database server and Web interface.
31.3.3. ZeoDB - Local Hub - Multiple Remote Collectors
This is the most common distributed Zenoss configuration. Two reasons you might use this configuration are:

Distributed Collector
88
• Scaling Zenoss to monitoring more than 1000 devices. Depending on the hardware of the collectors, it is possibleto monitor up to 1000 devices for each collector using this configuration.
• Handling differing network security policies. Often, your master Zenoss server will not have access to all of thedevices you need to monitor. In this case you can set up a remote collector with the required network access.
31.3.4. ZeoDB - Multiple Remote Hubs - Multiple Remote Collectors
This configuration is for large installations only. For cases in which you have more than five collectors, you shouldconsider deploying one or more hub servers to handle them.
31.4. Deploying Collectors
Use the information and steps in the following sections to deploy and manage collectors.
Note
Before deploying a remote collector you must set up a remote server. For more information setup tasks, refer tothe chapter titled "Installing Distributed Collectors" in Zenoss Installation for Enterprise.
31.4.1. Prerequisite Tasks
All prerequisite tasks and conditions required to install Zenoss are also required by the machine that will be theremote collector. Refer to Zenoss Installation for Enterprise for specific procedures to satisfy these conditions.
By default, only local access to the ZEO database is configured. Before adding a remote hub, you must edit the$ZENHOME/etc/zeo.conf file to allow remote access.
In the file, change the line:
address localhost:8100
to
address 8100
31.4.2. Adding Collectors
To add a collector to a hub:
1. Navigate to the Hub Overview page.
2. Select Add Collector from the Zenoss Collectors Action menu.
The Add Collector page appears.
31.4.2.1. Install Remotely (Root Password)
To install a remote collector, using a root password for access to the remote host:
1. Select the Install remotely option.
2. Select the root password option.

Distributed Collector
89
Figure 31.1. Install Remote Collector (Root Password)
3. Enter or change setup details:
Field Name Description
Collector ID Enter the name for the collector as it will be identi-fied in Zenoss. This name will be used to prefix theZenoss control scripts on the collector. If the ID iscoll1, then scripts will be named coll1_zenperfsnmp.
Host Enter the name of the host for the collector. This mustbe a fully qualified domain name, IP address, or re-solvable hostname.
Root Password Enter the password for the root user on the Host. Theroot password is not stored; it is used to configure apre-shared key between the main Zenoss server andthe remote collector.
Table 31.2. Add New Collector Fields
Note
If you are creating another collector on the Zenoss server, enter the localhost rather than the IP addressof the Zenoss server.
4. Click Add Collector. The system displays log output from the creation of the new collector. When fully configured(this may require several minutes), click the link at the bottom of the page to go to the overview page for thenew collector.

Distributed Collector
90
31.4.2.2. Install Remotely (Root SSH Keys)
To install a remote collector, using existing root SSH keys for access to the remote host:
1. Select the Install remotely option.
2. Select the root SSH keys option.
Figure 31.2. Install Remote Collector (Root SSH Keys)
3. Enter or change setup details:
Field Name Description
Collector ID Enter the name for the collector as it will be identi-fied in Zenoss. This name will be used to prefix theZenoss control scripts on the collector. If the ID iscoll1, then scripts will be named coll1_zenperfsnmp.
Host Enter the name of the host for the collector. This mustbe a fully qualified domain name, IP address, or re-solvable hostname.
Table 31.3. Add New Collector Fields
Note
If you are creating another collector on the Zenoss server, enter the localhost rather than the IP addressof the Zenoss server.
4. Click Add Collector. The system displays log output from the creation of the new collector. When fully configured(this may require several minutes), click the link at the bottom of the page to go to the overview page for thenew collector.

Distributed Collector
91
31.4.2.3. Install Remotely (Zenoss SSH Keys)
If you choose to set up a collector using Zenoss SSH keys, Zenoss will attempt to install by using the zenoss user.To successfully install a collector using these keys (without root access), these prerequisite conditions must be met:
• zenoss user SSH keys must be set up between the Zenoss server and the target.
• You must be running the RPM distribution of Zenoss.
• Zenoss core RPM must be installed on the target (remote) machine.
Tip: When installing the Zenoss RPM on the remote machine, do not start Zenoss.
Follow these steps to install a remote collector, using Zenoss SSH keys for access to the remote host.
Note
For detailed steps for creating SSH keys, see the section titled "Setting Up SSH Keys for Distributed Collector."
1. Select the Install remotely option.
2. Select the zenoss SSH Keys option.
Figure 31.3. Install Remote Collector (Zenoss SSH Keys)
3. Enter or change setup details:
Field Name Description
Collector ID Enter the name for the collector as it will be identi-fied in Zenoss. This name will be used to prefix theZenoss control scripts on the collector. If the ID iscoll1, then scripts will be named coll1_zenperfsnmp.

Distributed Collector
92
Field Name Description
Host Enter the name of the host for the collector. This mustbe a fully qualified domain name, IP address, or re-solvable hostname.
Table 31.4. Add New Collector Fields
Note
If you are creating another collector on the Zenoss server, enter the localhost rather than the IP addressof the Zenoss server.
4. Click Add Collector. The system displays log output from the creation of the new collector. When fully configured(this may require several minutes), click the link at the bottom of the page to go to the overview page for thenew collector.
31.4.2.4. Install Locally
Follow these steps to install a local collector:
1. Select the Install locally option.
Figure 31.4. Install Remote Collector (Zenoss SSH Keys)
2. Enter or change setup details:
Field Name Description
Collector ID Enter the name for the collector as it will be identi-fied in Zenoss. This name will be used to prefix theZenoss control scripts on the collector. If the ID iscoll1, then scripts will be named coll1_zenperfsnmp.
Table 31.5. Add New Collector Fields

Distributed Collector
93
3. Click Add Collector. The system displays log output from the creation of the new collector. When fully configured(this may require several minutes), click the link at the bottom of the page to go to the overview page for thenew collector.
31.4.3. Deleting Collectors
When you delete a collector, its devices are left without an assigned collector. Zenoss recommends that you reassignassigned devices prior to deleting a collector.
To delete a collector, click the name of the hub where the collector exists from the main collectors page. The Huboverview page appears. From the list of Zenoss Collectors, select the collector you want to delete. From the Actionmenu, select Delete Collector.
When you delete collectors using this Zenoss instance, they are not removed or "uninstalled" in any way from thecollector device. They continue to exist on the device until manually removed through the file system.
31.4.4. Updating a Hub or Collector
Warning
Any time you update your version of Zenoss or install additional ZenPacks, you must update any hubs or collectors.
To update a hub or collector, navigate to the Overview page for the hub or collector, and then choose Update Hubor Update Collector from the Action menu. This copies the most recent Zenoss code and ZenPacks to the serverand restarts the daemons running there.
31.4.5. Backing Up Remote Collectors
Zenoss does not automatically back up remote collector performance data (RRD files). To back up this data, set upa cron job on the remote collector. The cron job should invoke zenbackup with these options:
zenbackup --no-eventsdb --no-zodb
Old backup data is not automatically deleted; therefore, the backup solution you use to save the data should removethe backup file when it is no longer needed.
Note
Zenoss recommends that you avoid performing backups directly to NFS file systems. Because zenbackup mustrestart Zenoss after a backup, a bad connection to an NFS server can prevent the remote collector from starting.
31.5. Adding Devices to CollectorsAdding devices to collectors occurs when you add the device to Zenoss.
1.Select Add a Single Device from (Add Device).
The Add a Single Device page appears.
2. From the Collector list of options, select the collector you want to use to collect data for the device.
After you select the collector, the device appears in the Devices list, located at the bottom of the collectoroverview page.
31.5.1. Moving Devices Between Collectors
You can move devices from one collector to another.

Distributed Collector
94
1. Select one or more device rows in the device list.
2. Select Set Collector from the Actions list of options.
3. Select a collector, and then click OK.
Zenoss moves the devices to the selected collector.
Note
When a device is moved between collectors, the performance data is not moved. As a result, historical datafor the device may not appear in reports and graphs.
31.6. Managing the Collector DaemonsCollector daemons appear on the Zenoss Daemons page for each collector, and can be started, stopped andrestarted from there.
31.7. Deploying HubsIn addition to collectors, Distributed Collector allows you to set up new hubs. A hub represents an instance of thezenhub daemon, which is the daemon through which all collector daemons communicate with the object databaseand event database. All collectors must belong to exactly one hub; however, a hub may have many collectorsassociated with it. All hubs (and indirectly all collectors) refer to the same object and event databases. Typically,only very large systems with more than five collectors or more than 1,500 devices will benefit from multiple hubs.
Hubs are used to manage configuration data and pass it to the collectors. Hubs also take data from the collectorsand pass it to the ZeoDB. More hubs can be a more efficient way to manage larger deployments, as they helpdistribute the computing resources when configuration changes are made. They further remove the potential forconfiguration changes to be a bottleneck to gathering and processing data.
31.7.1. Configuring MySQL for Remote Hubs
Hubs on remote servers need access to the MySQL events database. This setting is the Hostname field in theConnection Information section of the Event Manager page. By default this is set to localhost, but will not work forremote hubs. Distributed collector attempts to set this field to the fully qualified domain name of the Zenoss serverwhen it is installed. If remote hubs appear to be having trouble connecting to MySQL or sending events, then checkthe value in this field to make sure it can be reached from the server the hub is on.
Another aspect of remote hubs connecting to MySQL is privileges. For a hub to connect to the events database, theuser specified in the User Name field in Event Settings must be granted privileges to connect to MySQL from theremote server. Distributed Collector attempts to grant these privileges any time a remote hub is created or updated.If a remote hub is logging error messages that indicate it is not allowed to connect to MySQL from the given host,then these privileges are likely not set up correctly. Granting of these privileges requires a fully qualified domainname for the remote server.
Before adding a hub, ensure MySQL grants and permissions are set correctly.
The zenoss user needs the following privileges set to see if a remote connection is possible:
GRANT SELECT on mysql.user to zenoss@localhost IDENTIFIED BY "zenoss";FLUSH PRIVILEGES;
In addition, a zenoss MySQL user is needed that can access the database by using the fully qualified domain nameof the zenoss installation:
GRANT ALL PRIVILEGES ON events.* to zenoss@'<FQDN>' IDENTIFIED BY "zenoss";GRANT SELECT on mysql.user to zenoss@'<FQDN>' IDENTIFIED BY "zenoss";FLUSH PRIVILEGES;

Distributed Collector
95
When you add the remote hub, you will see an error that indicates how to add a remote MySQL user for the hubto be installed. To resolve this issue, do one of the following:
• Open remote privileges to the MySQL database with:
GRANT ALL PRIVILEGES ON events.* to zenoss@'%' IDENTIFIED BY "zenoss";FLUSH PRIVILEGES;
OR
• Add a zenoss MySQL user for each remote hub:
GRANT ALL PRIVILEGES ON events.* to zenoss@'<ZENHUB FQDN>' IDENTIFIED BY "zenoss";FLUSH PRIVILEGES;
31.7.2. Add a Hub
When installing a remote hub, you can select one of several options, using:
• Root password to the remote host
• Pre-existing root SSH keys
• Zenoss SSH keys (use only for RPM installations)
To add a hub, from the main Collectors page, select Add Hub from the Action menu.
The Add Hub page appears.
31.7.2.1. Install Remotely (Root Password)
To install a remote hub, using a root password for access to the remote host:
1. Select the root password option.
Figure 31.5. Install Remote Hub (Root Password)

Distributed Collector
96
2. Enter or change setup details:
• Hub ID - Enter a name for the new hub. The name can be any unique combination of letters, digits, anddashes.
• Host - Enter the fully qualified domain name, IP address, or resolvable hostname of the server on whichthe new hub will run.
• Root Password - Enter the root user password for the server you specified in the Host field.
• Port - Enter the port number on which the hub should listen for collectors. The default port is 8790.
• Hub Password - Enter the hub password that the collectors will use to log in to this hub. The defaultpassword is "zenoss."
• XML RPC Port - Specify the port on which the hub should listen for xml-rpc requests from the collectorsor other API clients.
• ZEO Host - Specify the server hosting the ZEO database (the object database). In most cases, this is theIP address or hostname of the main Zenoss server.
3. Click Add Hub.
The system displays log output from the creation of the new hub. When fully configured (this may require severalminutes), click the link at the bottom of the page to go to the overview page for the new hub.
31.7.2.2. Install Remotely (Root SSH Keys)
To install a remote hub, using existing root SSH keys for access to the remote host:
1. Select the root SSH keys option.
Figure 31.6. Install Remote Hub (Root SSH Keys)
2. Enter or change setup details:
• Hub ID - Enter a name for the new hub. The name can be any unique combination of letters, digits, anddashes.

Distributed Collector
97
• Host - Enter the fully qualified domain name, IP address, or resolvable hostname of the server on whichthe new hub will run.
• Port - Enter the port number on which the hub should listen for collectors. The default port is 8790.
• Hub Password - Enter the hub password that the collectors will use to log in to this hub. The defaultpassword is "zenoss."
• XML RPC Port - Specify the port on which the hub should listen for xml-rpc requests from the collectorsor other API clients.
• ZEO Host - Specify the server hosting the ZEO database (the object database). In most cases, this is theIP address or hostname of the main Zenoss server.
3. Click Add Hub.
The system displays log output from the creation of the new hub. When fully configured (this may require severalminutes), click the link at the bottom of the page to go to the overview page for the new hub.
31.7.2.3. Install Remotely (Zenoss SSH Keys)
If you choose to set up a hub using Zenoss SSH keys, Zenoss will attempt to install by using the zenoss user. Tosuccessfully install a hub using these keys (without root access), these prerequisite conditions must be met:
• zenoss user SSH keys must be set up between the Zenoss server and the target. The target must have azenoss user.
• ZENHOME directory must be present on the remote machine.
• zensocket must be present on the remote machine, and the setuid bits must be set.
Tip: The best way to meet the prerequisite conditions is to install the Zenoss RPM on the remote machine. Afterinstallation, do not start Zenoss.
Follow these steps to install a remote hub, using Zenoss SSH keys for access to the remote host.
Note
For detailed steps for creating SSH keys, see the section titled "Setting Up SSH Keys for Distributed Collector."
1. Select the zenoss SSH keys option.

Distributed Collector
98
Figure 31.7. Install Remote Hub (Zenoss SSH Keys)
2. Enter or change setup details:
• Hub ID - Enter a name for the new hub. The name can be any unique combination of letters, digits, anddashes.
• Host - Enter the fully qualified domain name, IP address, or resolvable hostname of the server on whichthe new hub will run.
• Port - Enter the port number on which the hub should listen for collectors. The default port is 8790.
• Hub Password - Enter the hub password that the collectors will use to log in to this hub. The defaultpassword is "zenoss."
• XML RPC Port - Specify the port on which the hub should listen for xml-rpc requests from the collectorsor other API clients.
• ZEO Host - Specify the server hosting the ZEO database (the object database). In most cases, this is theIP address or hostname of the main Zenoss server.
3. Click Add Hub.
The system displays log output from the creation of the new hub. When fully configured (this may require severalminutes), click the link at the bottom of the page to go to the overview page for the new hub.
31.7.3. Setting Up SSH Keys for Distributed Collector
Follow these instructions to create SSH keys for use when setting up hubs and collectors.
These instructions assume you are using openssh. For more information, refer to the ssh-keygen man pages.
1. Use the following commands to generate an openssh RSA key pair for the zenoss user:
mkdir $HOME/.ssh

Distributed Collector
99
ssh-keygen -t rsa -f $HOME/.ssh/id_rsa -P "
2. Lock down the key pair:
chmod 700 $HOME/.sshchmod go-rwx $HOME/.ssh/*
3. Copy the generated public key $HOME/.ssh/id_rsa.pub file to the remote machine. On the remote machine, addthe public key to the authorized_keys file in the account the user wants to log in to by using the SSH key.
a. If $HOME/.ssh does not exist on the target machine, then create it with these commands:
mkdir ~/.sshchmod 700 ~/.ssh
b. Add the key:
cat id_rsa.pub >> $HOME/.ssh/authorized_keyschmod 600 $HOME/.ssh/authorized_keys
Note
You cannot use keys with a pass phrase with Zenoss.

100
Chapter 32. Dynamic Service View32.1. About
Dynamic Service View ("dynamic view") is a visualization of system objects and their relationships to other objects.You can access the dynamic view from groups, systems, and locations. Depending on the object type, differentrelationships are illustrated.
Each dynamic view shows related objects in a graph. Each object in that graph displays its associated event infor-mation.
Figure 32.1. Dynamic Service View: Locations Graph
When you click an object in the graph, the "inspector" panel appears. This panel provides detailed information aboutthe object and links directly to it. Information that appears in the inspector depends on the object type selected.

Dynamic Service View
101
Figure 32.2. Dynamic Service View: Inspector Panel
View controls appear to the right of the graph. These allow you to adjust your view:
• Overview - Toggles display on and off of the graph overview illustration.
• Magnifier - Toggles on and off the magnifier, which allows you to magnify selected portions of the graph.
• Zoom In - Zooms in on the graph.
• Zoom Out - Zooms out on the graph.
• Fit View - Fits the graph to the browser page.
• Refresh - Refreshes the graph.
Figure 32.3. Dynamic View: View Controls
32.1.1. Dynamic View of Organizers
The dynamic view of organizers shows objects that can impact the status of the organizer, such as other organizersand devices. This view also shows relationships between devices and a virtual infrastructure, such as VMware orCisco UCS objects monitored by the system, as well as storage information.
To access the dynamic view for an organizer (such as a group, system, or location):

Dynamic Service View
102
1. From Infrastructure > Devices, select the organizer in the devices hierarchy.
2. Click Details.
3. Select Dynamic Service View.
32.1.2. Dynamic View of Devices
The dynamic view of devices shows the relationship between a device and monitored components.
To access the dynamic view for a device:
1. From Infrastructure > Devices, click a device in the device list.
The device overview page appears.
2. Select Dynamic Service View in the left panel.
32.1.2.1. Dynamic View of Cisco UCS Devices
On Cisco UCS devices, the dynamic view shows the components and relationships that make up a Cisco UCScluster.
32.1.2.2. Dynamic View of VMware Hosts
On VMware Hosts (ESX servers), the dynamic view shows the relative VMware elements that are connected tothe host, such as:
• VMs that currently are running on the Host
• Data stores that are mounted by the Host
• Clusters to which the Host belongs
32.1.2.3. Dynamic View of Storage Devices
On storage devices, such as NetApp Filers, there are two dynamic views:
• Physical Storage View - Shows the device's storage enclosures and associated hard disks.
• Logical Storage View - Shows the logical storage arrangement that the storage device presents, such as filesystems and raid groups.
32.2. Prerequisites
Prerequisite Restriction
Zenoss Version Zenoss Version 3.0 or higher
Required ZenPacks ZenPacks.zenoss.DynamicView
Other Oracle/Sun JRE 1.5 or later, Flash-enabledWeb browser
Table 32.1. Prerequisites
32.3. Enabling
After installing the DynamicView ZenPack, you must restart the system. The zenjserver daemon must be runningfor dynamic views to be visible.

Dynamic Service View
103
32.4. Daemons
Type Name
Display zenjserver
Table 32.2. Daemons

104
Chapter 33. Enterprise Collector33.1. AboutThe Zenoss Enterprise Collector ZenPack allows collector daemons to start and monitor devices, even if a connec-tion to ZenHub is not available when the daemon starts.
Enterprise Collector enables configuration caching for these collector daemons:
• zenwin
• zeneventlog
• zenwinperf
• zenprocess
Data and events are cached locally and are sent to ZenHub as needed after a connection is re-established. Cachedconfiguration data is stored in $ZENHOME/perf/Daemons/MonitorName/DaemonName-Suffix, where Suffix is one of:
• configs.db
• properties.pickle
• threshold-classes.pickle
• thresholds.pickle
For example:
[zenoss@zenosst zenpacks]$ ls $ZENHOME/perf/Daemons/localhost/zeneventlog*/opt/zenoss/perf/Daemons/localhost/zeneventlog-configs.db/opt/zenoss/perf/Daemons/localhost/zeneventlog-properties.pickle/opt/zenoss/perf/Daemons/localhost/zeneventlog-threshold-classes.pickle/opt/zenoss/perf/Daemons/localhost/zeneventlog-thresholds.pickle
Each time a collector daemon successfully retrieves configuration information from ZenHub, it updates the cachedfiles. This happens at startup, and then every 20 minutes to 6 hours (depending on the daemon and its configuration).A daemon must successfully connect once before it can use the cached files if ZenHub is not available.
The cached files are considered transient, and can be deleted without harm to the system.
33.2. Prerequisites
Prerequisite Restriction
Zenoss Version Zenoss Version 2.5 or higher
Table 33.1. Enterprise Collector Prerequisites
33.3. Enabling Enterprise CollectorAfter installing the Enterprise Collector ZenPack, restart Zenoss and all Zenoss daemons (including zenhub).

105
Chapter 34. Enterprise Linux34.1. About
The EnterpriseLinux ZenPack extends the capabilities of the LinuxMonitor ZenPack and enables Zenoss to useSecure Shell (SSH) to monitor Linux hosts. Zenoss models and monitors devices placed in the /Server/SSH/Linuxdevice class by running commands and parsing the output. Parsing of command output is performed on the Zenossserver or on a distributed collector. The account used to monitor the device does not require root access or specialprivileges for the default modeler plugins.
34.2. Prerequisites
Prerequisite Restriction
Zenoss Version Zenoss Version 2.4 or higher
Required ZenPacks ZenPacks.zenoss.LinuxMonitor,ZenPacks.zenoss.EnterpriseLinux
Table 34.1. Enterprise Linux Prerequisites
Note
If using a distributed collector setup, SSH requires firewall access (default of port 22) from the collector to themonitored server.
34.3. Add a Linux Server
The following procedure assumes that the credentials have been set.
1.From Infrastructure > Devices, Select Add a Single Device from (Add Device).
2. Enter the following information:
Name Description
Device Name Linux host to model
Device Class Path /Server/SSH/Linux
Discovery Protocol Set this to auto unless adding a device with username/pass-word different than found in the device class. If you set thisto none, then you will need to add the credentials (see Sec-tion 34.4, “Set Linux Server Monitoring Credentials”) and thenmanually model the device.
Table 34.2. Adding Linux Device Information
3. Click Add.
34.4. Set Linux Server Monitoring Credentials
All Linux servers must have a device entry in an organizer below the /Devices/Server/SSH/Linux device class.

Enterprise Linux
106
Tip
The SSH monitoring feature will attempt to use key-based authentication before using a configuration propertiespassword value.
1. Navigate to the device or device class in the Zenoss interface.
• If applying changes to a device class:
a. Select the class in the devices hierarchy.
b. Click Details.
c. Select Configuration Properties.
• If applying changes to a device:
a. Click the device in the device list.
b. Select Configuration Properties.
2. Verify the credentials for the service account to access the service.
Name Description
zCommandUsername Linux user with privileges to gather performance information.
zCommandPassword Password for the above user.
Table 34.3. Linux Configuration Properties
3. Click Save to save your changes.
34.5. Resolving CHANNEL_OPEN_FAILURE Issues
The zencommand daemon's log file ($ZENHOME/collector/zencommand.log) may show messages stating:
ERROR zen.SshClient CHANNEL_OPEN_FAILURE: Authentication failureWARNING:zen.SshClient:Open of command failed (error code 1): open failed
If the sshd daemon's log file on the remote device is examined, it may report that the MAX_SESSIONS number ofconnections has been exceeded and that it is denying the connection request. At least in the OpenSSH daemons,this MAX_SESSIONS number is a compile-time option and cannot be reset in a configuration file.
In order to work around this limitation of the sshd daemon, use the configuration property zSshConcurrentSessionsto control the number of connections created by zencommand to the remote device.
1. Navigate to the device or device class in the Zenoss interface.
• If applying changes to a device class:
a. Select the class in the devices hierarchy.
b. Click Details.
c. Select Configuration Properties.
• If applying changes to a device:
a. Click the device in the device list.
b. Select Configuration Properties.
2. Apply an appropriate value for the maximum number of sessions.

Enterprise Linux
107
Name Description
zSshConcurrentSessions Maximum number of sessions supported by the remote device'sMAX_SESSIONS parameter. A common value for Linux is 10.
Table 34.4. Concurrent SSH Configuration Properties
3. Click Save to save your changes.
34.6. Resolving Command timed out Issues
The zencommand daemon's log file ($ZENHOME/collector/zencommand.log) may show messages stating:
WARNING:zen.zencommand:Command timed out on device device_name: command
If this occurs, it usually indicates that the remote device has taken too long in order to return results from thecommands. In order to increase the amount of time to allow devices to return results, change the configurationproperty zCommandCommandTimeout to a larger value.
1. Navigate to the device or device class in the Zenoss interface.
• If applying changes to a device class:
a. Select the class in the devices hierarchy.
b. Click Details.
c. Select Configuration Properties.
• If applying changes to a device:
a. Click the device in the device list.
b. Select Configuration Properties.
2. Apply an appropriate value for the command timeout.
Name Description
zCommandCommandTimeout Time in seconds to wait for commands to complete on the re-mote device.
Table 34.5. SSH Timeout Configuration Properties
3. Click Save to save your changes.
34.7. DMIDECODE Modeler Plugin
This plugin allows you to collect and model detailed hardware and kernel information on your Linux devices.
Since the dmidecode command requires root privileges, it needs to be run with something like sudo. Sample entriesrequired on the sudoers file on each remote device are:
Cmnd_Alias DMIDECODE = /usr/sbin/dmidecode ## Allows members of the zenoss group to gather modeling information Defaults:zenoss !requiretty %zenoss ALL = (ALL) NOPASSWD: DMIDECODE
To use this plugin, add it to the list of collector plugins for the device or device class, and then remodel. For moreinformation on working with Zenoss plugins, refer to Zenoss Administration.

Enterprise Linux
108
34.8. Daemons
Type Name
Modeler zenmodeler
Performance Collector zencommand
Table 34.6. Daemons

109
Chapter 35. Enterprise Reports35.1. About
The EnterpriseReports ZenPack adds new reports to the standard Zenoss reports. Available reports include:
• 95th Percentile
• Alert Rule Email Addresses
• Defined Thresholds
• Event Time to Resolution
• Interface Volume
• Maintenance Windows
• Organizer Availability
• User Event Activity
• Users Group Membership
To access Enterprise reports, select Reports from the Navigation bar. Enterprise reports appear in the left panel.
35.1.1. 95th Percentile
The 95th Percentile report provides details about all network interfaces in the system, sorted by highest utilization.
95th percentile is a widely used mathematical calculation that evaluates the regular and sustained utilization of anetwork connection. The 95th percentile method more closely reflects the needed capacity of the link in questionthan other methods (such as mean or maximum rate).
This report is useful for network capacity planning and billing for either average or 95th percentile bandwidth uti-lization.
You can filter this report by device name. Enter a complete or partial name (using * (asterisk) for matching), andthen click Update to filter the report.
To change the reporting time period, enter Start and End dates (or click Select to select dates from a calendar).Click Update to refresh the report.
35.1.2. Alert Rule Email Addresses
The Alert Rule Email Addresses report displays all alert rules and the email addresses to which alerts are sent.
This report is useful when reviewing which users receive certain types of system alerts.
35.1.3. Defined Thresholds
The Defined Thresholds report provides details about all thresholds defined in the system. The report links to thetarget of each threshold. The target can be a device class, individual device, or individual component.
This report is useful for administering the system. You can use it to quickly identify which threshold events can occurwithin the system, and the severity of those events.

Enterprise Reports
110
35.1.4. Event Time to Resolution
The Event Time to Resolution report shows, for each user, the total time taken to acknowledge or clear events.Results are organized by event severity.
This report is helpful for tracking response time SLAs in a NOC-type environment.
35.1.5. Interface Volume
The Interface Volume report shows network interface volume. It reports on all network interfaces in the system,sorted by highest utilization. Volume is defined as the total number of bytes transferred during a specific reportingperiod.
This report is useful for determining billing on total bandwidth consumption.
To change the reporting time period, enter Start and End dates (or click Select to select dates from a calendar).Click Update to refresh the report.
35.1.6. Maintenance Windows
The Maintenance Windows report shows all defined windows that are active during a selected time period.
To change the reporting time period, enter Start and End dates (or click Select to select dates from a calendar).Click Update to refresh the report.
35.1.7. Organizer Availability
Provides the availability percentage of all network organizers in the system. This report can be filtered by organizer,event class, component, and date.
You can report on the availability of device classes, locations, systems, or groups within a defined time frame. Thisreport offers two reporting modes:
• Averaged - Defines the organizer as available for the average availability time for all devices contained in it.
• Coalesced - Defines the organizer as available only if all devices are available during a certain time period.
Two modes of operation: Averaged - defines the organizer as available for the average availability time for all thedevices contained within it. Coalesced - defines availability of the organizer as the available only if all devices areavailable during a certain time period.
35.1.8. User Event Activity
Reports the total number of events acknowledged and cleared, on a per-user basis, during the reporting period.
This report is helpful for tracking operator activity in a NOC-type environment.
35.1.9. Users Group Membership
Shows all users and the groups to which they belong.
35.2. Viewing Enterprise Reports
After installing the EnterpriseReports ZenPack, you can access Enterprise reports. From the Zenoss interface, selectReports from the navigation bar.

Enterprise Reports
111
35.3. Prerequisites
Prerequisite Restriction
Zenoss version Zenoss version 2.2 or higher
Zenoss Product Zenoss Enterprise
Required ZenPacks ZenPacks.zenoss.EnterpriseReports
Table 35.1. Enterprise Reports Prerequisites

112
Chapter 36. Enterprise Security36.1. AboutThe EnterpriseSecurity ZenPack enhances Zenoss security by enabling password encryption. Zenoss stores thepasswords it uses to remotely access hosts in a Zope Object Database (ZODB). After enabling this feature, thesepasswords are encrypted according to the Advanced Encryption Standard (AES), with 256-bit key sizes.
By using the password encryption feature, you can help prevent an attacker from accessing your managed systemsif he gains access to a backup copy of your ZODB.
36.2. Prerequisites
Prerequisite Restriction
Zenoss Version Zenoss Version 2.5 or higher
Required ZenPacks EnterpriseSecurity
Table 36.1. Enterprise Security Prerequisites
36.3. Enabling Password EncryptionTo enable password encryption, install the ZenPack. No other action is required to enable this feature. After ZenPackinstallation, password encryption is always enabled.
To test that password encryption is functioning correctly, use grep to search the Data.fs file for the value of one ofthe password configuration properties. For example, if you set zCommandPassword to a value of wobet51, you cancheck that passwords are encrypted by using this command on the Zenoss server:
strings $ZENHOME/var/Data.fs | grep wobet51
If the Enterprise Security ZenPack is installed, this command will not return results.

113
Chapter 37. Foundry Device37.1. About
The FoundryMonitor ZenPack models specific details on Foundry devices, including:
• DRAM
• Serial Number
• Processor
• Product type
This ZenPack monitors memory utilization, as well as CPU utilization averages for 1 minute, 1 second, and 5 sec-onds.
It also includes all Foundry traps to ensure proper decoding of those traps through zentrap.
37.2. Prerequisites
Prerequisite Restriction
Zenoss Version Zenoss Version 2.4 or higher
Required ZenPacks ZenPacks.zenoss.FoundryMonitor
Table 37.1. Foundry Prerequisites
37.3. Configuring Zenoss
All Foundry devices must exist in the /Devices/Network/Foundry device class.
Follow these steps to configure Zenoss:
1. Navigate to the device or device class in the Zenoss interface.
• If applying changes to a device class:
a. Select the class in the devices hierarchy.
b. Click Details.
c. Select Configuration Properties.
• If applying changes to a device:
a. Click the device in the device list.
b. Select Configuration Properties.
2. Edit the appropriate configuration properties for the device or devices.
Name Description
zSnmpCommunity Consult with your network administrators to determine the SN-MP community permitted.
zSnmpMonitorIgnore Set to a value of False.
zSnmpPort The default port is 161.

Foundry Device
114
Name Description
zSnmpVer Set to a value of v2c.
Table 37.2. Foundry Configuration Properties
3. Click Save to save your changes. Zenoss now will begin collecting Foundry device metrics from this device.
4. Navigate to Graphs and you should see some placeholders for performance graphs. After approximately fifteenminutes you should see the graphs start to become populated with information.
37.4. Daemons
Type Name
Modeler zenmodeler
Performance Collector zenperfsnmp
Traps zentrap
Table 37.3. Daemons

115
Chapter 38. Hewlett Packard UNIX38.1. About
The HpuxMonitor ZenPack enables Zenoss to use Secure Shell (SSH) to monitor Hewlett Packard UNIX (HP-UX) hosts. The system models and monitors devices placed in the /Server/SSH/HP-UX device class by runningcommands and parsing the output. Parsing of command output is performed on the system server (if using a localcollector) or on a distributed collector. The account used to monitor the device requires root access or specialprivileges to access /usr/bin/adb.
The HpuxMonitor ZenPack provides:
• File system and process monitoring
• Network interfaces and route modeling
• CPU utilization information
• Hardware information (memory, number of CPUs, and model numbers)
• OS information (OS-level, command-style information)
• Software package information (such as installed software)
38.2. Prerequisites
Prerequisite Restriction
Zenoss Version Version 2.5 or higher
Required ZenPacks ZenPacks.zenoss.HpuxMonitor
Supported HP-UX Releases HP-UX 11.00
Table 38.1. HP-UX Prerequisites
Note
If using a distributed collector setup, SSH requires firewall access (by default, port 22) from the collector to themonitored server.
38.3. Limitations
This ZenPack has not been tested on Itanium systems.
38.4. Add an HP-UX Device for Monitoring
These steps assume that credentials have been set.
1.From Infrastructure > Devices, select Add a Single Device from (Add Device).
2. Enter the following information:
Name Description
Name or IP HP-UX host to model

Hewlett Packard UNIX
116
Name Description
Device Class /Server/SSH/HP-UX
Model Device Select this option unless adding a device with a user name andpassword different than found in the device class. If you de-se-lect this option, then you must add the credentials (see Sec-tion 38.5, “Set HP-UX Server Monitoring Credentials”), and thenmanually model the device.
Table 38.2. Adding HP-UX Device Information
3. Click Add Device to add the device.
38.5. Set HP-UX Server Monitoring CredentialsAll HP-UX servers must have a device entry in an organizer below the /Devices/Server/SSH/HP-UX device class.
Note
The SSH monitoring feature will attempt to use key-based authentication before using a configuration propertiespassword value.
38.5.1. Set Credentials for the Device1. In the Web interface, navigate to the device.
2. In the left panel, select Configuration Properties.
3. Verify the credentials for the service account to access the service:
Name Description
zCommandUsername HP-UX user with privileges to gather performance information
zCommandPassword Password for the HP-UX user
Table 38.3. HP-UX Configuration Properties
4. Click Save to save your changes.
38.5.2. Set Credentials for the Device Class1. In the Web interface, navigate to the Devices/Server/SSH/HP-UX device class.
2. In the left panel, select Configuration Properties.
3. Verify the credentials for the service account to access the service. (Refer to the previous table titled "HP-UXConfiguration Properties.")
4. Click Save to save your changes.
38.6. Resolving CHANNEL_OPEN_FAILURE IssuesThe zencommand daemon's log file ($ZENHOME/collector/zencommand.log) may show messages stating:
ERROR zen.SshClient CHANNEL_OPEN_FAILURE: Authentication failureWARNING:zen.SshClient:Open of command failed (error code 1): open failed
If you view the sshd daemon's log file on the remote device, you may see that the MAX_SESSIONS number of connec-tions has been exceeded and that it is denying the connection request. In the OpenSSH daemons, this MAX_SESSIONSnumber is a compile-time option and cannot be reset in a configuration file.

Hewlett Packard UNIX
117
To work around this sshd daemon limitation, use the configuration property zSshConcurrentSessions to control thenumber of connections created by zencommand to the remote device:
1. Navigate to the device or device class in the Zenoss interface.
• If applying changes to a device class:
a. Select the class in the devices hierarchy.
b. Click Details.
c. Select Configuration Properties.
• If applying changes to a device:
a. Click the device in the device list.
b. Select Configuration Properties.
2. Apply an appropriate value for the maximum number of sessions.
Name Description
zSshConcurrentSessions Maximum number of sessions supported by the remote device'sMAX_SESSIONS parameter. Common values for HP-UX are 2 and10.
Table 38.4. Concurrent SSH Configuration Properties
3. Click Save to save your changes.
38.7. Resolving Command time out Issues
The zencommand daemon's log file ($ZENHOME/collector/zencommand.log) may show messages stating:
WARNING: zen.zencommand:Command timed out on device device_name: command
If this occurs, it generally indicates that the remote device has taken too long to return results from the commands.To increase the amount of time to allow devices to return results, change the configuration property zCommandCom-mandTimeout to a larger value:
1. Navigate to the device or device class in the Zenoss interface.
• If applying changes to a device class:
a. Select the class in the devices hierarchy.
b. Click Details.
c. Select Configuration Properties.
• If applying changes to a device:
a. Click the device in the device list.
b. Select Configuration Properties.
2. Apply an appropriate value for the command timeout.
Name Description
zCommandCommandTimeout Time in seconds to wait for commands to complete on the re-mote device.
Table 38.5. SSH Timeout Configuration Properties
3. Click Save to save your changes.

Hewlett Packard UNIX
118
38.8. Daemons
Type Name
Modeler zenmodeler
Performance Collector zencommand
Table 38.6. Daemons

119
Chapter 39. JBoss Application Server39.1. Aboutthe JBossMonitor ZenPack that system administrators to monitor JBoss Application Servers. JBossMonitor usesthe JMX Remote API and accesses MBeans deployed within JBoss that contain performance information about thecomponents that are being managed.
The collected performance information includes: pool sizes for data sources (JDBC), Enterprise Java Beans (EJBs),message queues (JMS), threads, servlets, JSPs, and classloaders. Cache information is also accessible, providingsystem administrators insight into the number of hits (or misses) their cache policy has produced.
The ZenPack also aggregates individual performance metrics into higher level concepts that provide a picture ofthe performance of the application. Cache hits and misses are combined on the same graph to provide an overallpicture of cache performance. Likewise, queue metrics are combined to show the number of messages currently onthe queue, being processed, and being placed on the queue. Queue subscribers and publishers are also graphed.
Each of the individual performance metrics can be trended and predicted, and thresholds can be explicitly defined.Both the predicted thresholds and explicit thresholds inform system administrators of potential future problemsbefore they occur. Since so much of J2EE involves "managed resources", the ability to monitor pool sizes and alertadministrators prior to resources being exhausted is extremely valuable and can reduce the likelihood of a fataloutage caused by resource depletion.
Most of the metrics that are collected in JBossMonitor represent combinations of individual component metrics.For example, the Thread Pool metric represents all threads in all pools. It is possible to configure JBossMonitorto perform at higher granularity and have it monitor a Thread Pool with a particular name. However, since thesenames are application specific we have chosen to configure JBossMonitor to collect at a rather coarse-grained levelby default. The installer is highly encouraged to customize and configure!
One particular monitoring template that requires end-user configuration involves Servlets. If a site to be monitoredis revenue generating, and credit card submissions from the website are handled via a back-end servlet, it may becritically important to monitor the resources made available by the JBoss container to the servlet container. If thenumber of free spaces in the servlet pool dwindles to zero it could prevent your application from making a sale.
The following are the collected metrics for JBoss servers:
• Active Threads
• JMS Message cache memory usage
• JMS Message hits/misses
• JMS Topic/Destination queue size
• Java heap memory usage
• JCA commit, rollback, and transaction count
• JCA Connection pool in-use connections and available connections
• JCA connections created/destroyed
• JCA total connections
• JGroups cluster messages sent/received
• JGroups cluster bytes sent/received
• MBean creation/removal count
• MBean messages processed count

JBoss Application Server
120
39.2. Prerequisites
Prerequisite Restriction
Zenoss Version Zenoss Version 2.2 or higher
Required ZenPacks ZenPacks.zenoss.ZenJMX,ZenPacks.zenoss.JBossMonitor
Table 39.1. JBoss Prerequisites
39.3. Enable Monitoring
39.3.1. Configuring JBoss to Allow JMX Queries
JBoss uses the JAVA_OPTS approach for enabling remote access to MBeans. However, it requires some additionalproperties. To set up your JAVA_OPTS for use in JBoss see the following code segment:
JAVA_OPTS="-Dcom.sun.management.jmxremote.port=12345"JAVA_OPTS="${JAVA_OPTS} -Dcom.sun.management.jmxremote.authenticate=false"JAVA_OPTS="${JAVA_OPTS} -Dcom.sun.management.jmxremote.ssl=false"JAVA_OPTS="${JAVA_OPTS} -Djboss.platform.mbeanserver"JAVA_OPTS="${JAVA_OPTS} -Djavax.management.builder.initial=org.jboss.system\.server.jmx.MBeanServerBuilderImpl"export JAVA_OPTS
When you start JBoss via the run.sh you must also pass the "-b 0.0.0.0" argument:
cd ${JBOSS_HOME}/bin./run.sh -b 0.0.0.0
JMX actually uses two separate ports for MBean access: one is used for initial connection handling and authenti-cation, and the other is used for RMI access. During the handshake between a JMX Client and the JMX Agent theagent tells the client the IP address and port number for the RMI registry. By default JBoss sets the IP addressto 127.0.0.1. This works when the JMX client and the JMX agent reside on the same device, but it won't work ina distributed environment.
By passing the "-b 0.0.0.0" argument you instruct JBoss to bind to all available network ports, and this results inthe JMX Agent's handshaking logic using a network reachable address when informing clients of the RMI registryhostname and port.
The jmx-console Web page in JBoss allows you to view the different MBeans that are available; however, thisdoes not mean that these MBeans are available remotely. If JConsole can view MBeans, then so can the zenjmxdaemon that gathers this information.
39.3.2. Configuring Zenoss
All JBoss services must have a device entry under the /Devices/Server/JBoss device class.
Note
The zenjmx daemon must be configured and running. See Section 10.2.1, “Sun Java Runtime Environment(JRE)” for more information about configuring the zenjmx daemon with the Sun JRE tools.
1. Navigate to the device or device class in the Zenoss interface.
• If applying changes to a device class:
a. Select the class in the devices hierarchy.

JBoss Application Server
121
b. Click Details.
c. Select Configuration Properties.
• If applying changes to a device:
a. Click the device in the device list.
b. Select Configuration Properties.
2. Edit the appropriate configuration properties for the device or devices.
Name Description
zJBossJmxManagementAuthenticate This configuration property is deprecated.
zJBossJmxManagementPassword JMX password
zJBossJmxManagementPort The port number used to gather JMX information
zJBossJmxManagementUsername JMX username for authentication
Table 39.2. JBoss Configuration Properties
3. Click Save to save your changes.
You will now be able to start collecting the JBoss server metrics from this device.
4. Navigate to Graphs and you should see some placeholders for graphs. After approximately fifteen minutes youshould see the graphs start to become populated with information.
Tip
The out-of-the-box JBoss data source configuration has been defined at the macro level, but can be configuredto operate on a more granular basis. For example, the Servlet Reload Count applies to all servlets in all Webapplications but it could be narrowed to be Servlet /submitOrder in Web application "production server."
39.4. Change the Amount of Data Collected and Graphed1. Navigate to the device or device class under the /Devices/Server/JBoss device class in the interface.
2. In the left panel, select Monitoring Templates
3. Select Bind Templates from the Action menu.
4. To add other templates and retain existing monitoring templates, hold down the control key while clicking onthe original entries.
Name Description
JBoss Core Core information about any JBoss server, including memory us-age, threads, and uptime.
JBoss JCA Connection Pool
JBoss JGroups Channel
JBoss JMS Cache
JBoss JMS Destination
JBoss JMS Topic
JBoss Message Driven EJB
Table 39.3. JBoss Templates
5. Click the OK button to save your changes.

JBoss Application Server
122
39.5. Viewing Raw DataSee the Section 10.5, “Using JConsole to Query a JMX Agent” section for more information about how to investigateraw data returned from the application.
39.6. Daemons
Type Name
Performance Collector zenjmx
Table 39.4. Daemons

123
Chapter 40. Juniper Devices40.1. About
The JuniperMonitor ZenPack allows system administrators to monitor their Juniper devices.
40.2. Prerequisites
Prerequisite Restriction
Zenoss Version Zenoss Version 2.2 or higher
Required ZenPacks ZenPacks.zenoss.JuniperMonitor
Table 40.1. Juniper Prerequisites
40.3. Enable Monitoring
40.3.1. Configuring Juniper Devices to Allow SNMP Queries
Configure the Juniper device to allow SNMP queries from the Zenoss server, and send SNMP v1 or SNMP v2 trapsto the Zenoss server.
40.3.2. Configuring Zenoss
All Juniper devices must exist under the /Devices/Network/Juniper device class.
1. Navigate to the device or device class in the Zenoss interface.
• If applying changes to a device class:
a. Select the class in the devices hierarchy.
b. Click Details.
c. Select Configuration Properties.
• If applying changes to a device:
a. Click the device in the device list.
b. Select Configuration Properties.
2. Edit the appropriate configuration properties for the device or devices.
Name Description
zSnmpCommunity Consult with your network administrators to determine the SN-MP community permitted.
zSnmpMonitorIgnore This should be set to False
zSnmpPort The default port is 161.
zSnmpVer This should be set to v2c
Table 40.2. Juniper Configuration Properties
3. Click Save to save your changes. You will now be able to start collecting the Juniper device metrics from thisdevice.

Juniper Devices
124
4. Navigate to Graphs and you should see some placeholders for graphs. After approximately fifteen minutes youshould see the graphs start to become populated with information.
40.4. Daemons
Type Name
Modeler zenmodeler
Performance Collector zenperfsnmp
Table 40.3. Daemons

125
Chapter 41. LDAP Authentication41.1. AboutThe LDAPAuthenticator Enterprise ZenPack allows Zenoss to use your existing LDAP authentication infrastructure(such as Active Directory or OpenLDAP) to enable single sign-on to the Zenoss Web interface. For example, you canreuse the user management tools with which you are familiar to enable your Windows users to use their Windowscredentials to authenticate to the Zenoss interface. This saves you from having to manually create user accountsand separately maintain passwords.
The benefits of using a service like LDAP to maintain user accounts and privileges include:
• Does not require users to remember yet another password. This decreases support and maintenance require-ments.
• Allows centralized management of each user's privileges. This enables easier security auditing and SOX re-porting.
Authentication logging is stored in the $ZENHOME/log/event.log file.
41.2. PrerequisitesPrerequisite Restriction
Zenoss Version Zenoss Version 2.2 or higher
Required ZenPacks ZenPacks.zenoss.LDAPAuthenticator
Table 41.1. LDAP Authentication Prerequisites
41.2.1. LDAP Configuration Information
Before configuring LDAP authentication, you must gather the following information from your LDAP or Active Direc-tory administrator. Here is a list of the required information:
• Hostname or IP address of an Active Directory global catalog server. (Active Directory authentication only)
• Hostname or IP address of an LDAP server. (other LDAP server authentication only)
• User's base Distinguished Name (DN). For example, if your domain was ad.zenoss.com, then your user's baseDN might be:
cn=users,dc=ad,dc=zenoss,dc=com
• Manager DN. This is the DN (distinguished name) of a user in the domain administrators group. An examplethat follows the user's base DN is:
cn=Administrator,cn=users,dc=ad,dc=zenoss,dc=com
• Optional: Active Directory groups to map to Zenoss roles. You can choose to control user roles within the ZenossWeb interface using Active Directory groups instead of controlling the roles directly from within Zenoss. If youdo choose to do this you should create the following groups within Active Directory.
• Zenoss Managers
• Zenoss Users
Note
Zenoss recommends that you make sure that your LDAP server requires at least four successive failures to lockan account. Due to authentication design, each login to Zenoss goes through three different Web pages. Each

LDAP Authentication
126
one of these pages requests a user authentication, which ends up making a single call to the LDAP backend.Thus, if the user makes one mistake and the LDAP server locks the account on three successive failures, theuser's account will be locked even though he specified the password once.
41.3. LimitationsYou cannot use LDAP SSL on CentOS4 or the Zenoss Appliance.
41.4. Authenticating with Microsoft Active Directory
41.4.1. Adding the Authentication Plugin
To add the plugin, you must access the ZMI (Zope Management Interface). This allows raw access to the Zopeapplication server and its configured objects. These steps show how to add the ActiveDirectory Multi Plugin withits default settings.
1. Browse to this URL:
http://YourZenossInstallation:8080/zport/acl_users/manage
2. Choose the ActiveDirectory Multi Plugin plugin, and then click Add.
3. Complete the form with your credentials and paths:
Name Description
ID Enter adPlugin.
Title Enter a title, or leave blank.
LDAP Server[:port] Specify the address of the global catalog server from the pre-requisites section. It should either be the resolvable hostnameor IP address of the global catalog server followed by :3268 Ex-ample: ad1.zenoss.com:3268
If using SSL, the name must be specified.
Read-only Select this option.
Users Base DN Use the value obtained from your AD administrator.
Group storage Groups not stored on LDAP server.
Groups Base DN Use the value obtained from your AD administrator.
Manager DN Use the value obtained from your AD administrator.
Password Use the value obtained from your AD administrator.
Table 41.2. Active Directory Multi Plugin Configuration
4. Click Add to save your changes.
41.4.2. Configuring Plugin Settings
The default plugin settings need some customizations.
1. Browse to this URL:
http://yourzenossinstallation:8080/zport/acl_users/adPlugin/manage
2. Check the following boxes:
• Authentication

LDAP Authentication
127
• Properties
• User_Enumeration
• Roles ([Select only if a default role other than Anonymous is desired.])
• Role_Enumeration ([Select only if a default role other than Anonymous is desired.])
3. Click Update to save your changes.
4. Click Contents tab.
5. Click acl_users folder.
6. Set the following:
Name Description
User ID Attribute Windows Login Name (sAMAccountName)
RDN Attribute Windows Login Name (sAMAccountName)
Table 41.3. Active Directory acl_users Folder Customizations
7. Click Apply Changes to save your changes.
8. Click LDAP Schema tab.
9. In the Add LDAP schema item section, set the following:
Name Description
LDAP Attribute Name mail
Friendly Name Email Address
Multi-valued No
Map to Name email
Table 41.4. Active Directory Schema Item Configuration
10. Click Apply Changes to save your changes.
11. Click Add to save your changes.
41.4.3. Enabling Group to Role Mapping
You can optionally control your users' roles within Zenoss by using the Active Directory groups. If you choose not todo this, you can control their access by setting their roles within the user management section of the Zenoss Webinterface. If you choose to use Active Directory groups, you should use the following steps.
1. Browse to one of the following URLs:
• For LDAP:
http://yourzenossinstallation:8080/zport/acl_users/manage
• For Active Directory:
http://yourzenossinstallation:8080/zport/acl_users/adPlugin/manage
2. Put a check in Roles and click Update.
3. Click Properties tab.
4. Change the groupid_attr to: cn.
5. Click Save Changes to save your changes.

LDAP Authentication
128
6. Click Contents tab.
7. Click acl_users folder.
8. Set the following:
Name Description
Group storage Groups stored on LDAP server
Group mapping Manually map LDAP groups to Zope roles
Table 41.5. Active Directory Group to Role Configuration
9. Click Apply Changes to save your changes.
10. Click Groups tab.
11. Scroll to the bottom of the page and in the Add LDAP group to Zope role mapping section:
a. Choose Zenoss Managers on the left and Manager on the right.
b. Click Add.
c. Choose Zenoss Users on the left and ZenUser on the right.
d. Click Add.
e. Click Apply Changes to save your changes.
41.4.4. Verifying Connectivity and Credentials Outside of Zenoss
Verify your credential information is valid from the Zenoss server by using the ldapsearch command. To install thiscommand, use the following for RPM-based systems:
# yum -y install openldap-clients
For the appliance, use the command:
# conary update openldap-clients
as the zenoss user on the Zenoss server:
ldapsearch -LLL -x -b 'BaseDN' -D 'Bind DN' -W -H ldap://LDAP_server-name \"sAMAccountName=*" member
41.5. Authenticating with other LDAP Servers1. Browse to this URL:
http://yourzenossinstallation:8080/zport/acl_users/manage
2. Choose the LDAP Multi Plugin plugin, and then click Add.
3. Complete the form with your LDAP credentials and paths:
Name Description
ID Enter ldapAuthentication.
Title Enter a title or leave blank.
LDAP Server[:port] Specify the name or IP address of the LDAP server. The de-fault port is 389, and the default port for SSL is 636, so the portdoesn't need to be specified if using the defaults. If using SSL,the name must be specified.

LDAP Authentication
129
Name Description
Default User Roles Set to ZenUser. If this is set as blank, LDAP users will not beable to log in.
Table 41.6. LDAP Multi Plugin Configuration
4. Click Add to save your changes.
5. Click plugins in the list of objects.
6. Click the Authentication Plugins link.
7. Move your ldapAuthentication plugin to the list of active plugins, above the userManager plugin
41.6. Optimizing Authentication with a Cache
Once you have configured third-party authentication, you should enable caching. Without a cache of LDAP respons-es, your Zenoss server must repeatedly query the configured LDAP server or servers for user, group and authenti-cation information. The following steps describe the process of setting up caching of LDAP responses.
1. Log in to Zenoss as a user with the Manager role.
2. Navigate to /zport/acl_users/manage in the Web interface. Do this by replacing the end of your URL withinthe Zenoss Web interface.
3. Choose RAM Cache Manager from the list of options at top-right.
Figure 41.1. Add RAM CAche
4. Set the Id to RAMCache, and then click Add.
5. Click the new RAMCache added to the list to configure it.
a. Erase AUTHENTICATED_USER from the REQUEST variables field.
b. Click Save Changes.
6. Click acl_users in the breadcrumbs to go back to the acl_users folder.
Figure 41.2. acl_users Breadcrumbs
7. Click the Cache tab.

LDAP Authentication
130
8. Select RAMCache from the Cache this object using list, and then click Save Changes.
9. Click the Contents tab.
10. Click the adPlugin or ldapAuthentication plugin, and then click the Cache tab.
11. Select RAMCache from the list and click Save Changes.
41.7. Configuring Local Authentication as a FallbackYou can use local authentication as a fallback in the event that the LDAP server is unreachable. The local authen-tication plugin is called userManager.
1. Verify that the userManager plugin is available:
a. Go to the following URL to access the Zope Management Interface (ZMI):
http://yourzenoss:8080/zport/acl_users/manage
b. In the Name column, click Plugins.
c. Click Authentication Plugins.
d. Make sure that your LDAP plugin is first in the list of Active Plugins. (The userManager plugin must bebelow it.)
Figure 41.3. Authentication Plugins
2. Create a user with fallback capabilities. For example, to allow an LDAP user named "zenoss-user" to log inwhen the LDAP server is down:
a. Go to Advanced > Settings > Users > Add New User.
b. Create a user named "zenoss-user."
Note
You must create this account before the user logs in with the LDAP credentials. The password definedwhen creating the account in Zenoss will be valid even when the LDAP server is down.

131
Chapter 42. Mail Transactions42.1. About
The ZenMailTx ZenPack allows you to monitor round-trip email delivery.
42.1.1. Events
There are several situations for which ZenMailTx will create events. The component will be zenmailtx, the event-Group will be mail and the eventClass will be /Status. These situations are:
• The SMTP server name or the POP server name cannot be resolved.
• The SMTP server or the POP server is down or unavailable.
• The timeout (specified on the Data Source tab) is exceeded for the SMTP or POP server.
• Authentication (if specified) with the SMTP or POP server fails.
• A threshold defined for one of the data points in this data source is exceeded. Thresholds are defined in themonitoring template that contains the data source.
Once an email has successfully made a trip back and forth, a clear event is created that clears any failure events.
42.2. Prerequisites
Prerequisite Restriction
Zenoss Version Zenoss Version 2.2 or higher
Required ZenPacks ZenPacks.zenoss.ZenMailTx
Table 42.1. Mail Transactions Prerequisites
42.3. Enable Monitoring1. Click the device in the device list.
2. From the left panel, select the Device template under Monitoring Templates.
3. Select Add Local Template from the Action menu.
4. Enter an identifier for the template (such as ZenMailTx), and then click Submit to create the template.
5. Click the newly created ZenMailTx template.
6.In the Data Sources area, click to add a data source.
7. Enter a name for the data source (MailTx), select MAILTX as the type, and then click Submit.
8. Change options as needed.
Option Description
To Address The e-mail address that will appear in the From: field in the gen-erated e-mail.
From Address The e-mail address where the generated e-mail should be sent.
SMTP Host The e-mail server where the e-mail should be sent.

Mail Transactions
132
Option Description
POP Host The POP server from which the test e-mail will be received.
Table 42.2. Mail Transactions Basic Data Source Options
Tip
Any of the MAILTX fields can take TAL expressions, including the password fields.
9. Click Save to save your changes.
10. Navigate to Graphs and you should see some place holders for graphs. After approximately fifteen minutes youshould see the graphs begin populating with information.
42.4. Daemons
Type Name
Performance Collector zenmailtx
Table 42.3. Daemons

133
Chapter 43. MS Active Directory43.1. About
The ActiveDirectory ZenPack allows you to monitor Microsoft Active Directory authentication metrics.
This ZenPack creates a device class for Microsoft Active Directory with appropriate priorities. It also creates aWindows Service class and IP Service class for Active Directory-related services with monitoring enabled.
Use the Active Directory ZenPack to monitor these metrics:
• DS Client Binds/Sec
• DS Directory Reads/Sec, Searches/Sec and Writes/Sec
• DS Monitor List Size
• DS Name Cache Hit Rate
• DS Notify Queue Size
• DS Search Sub-operations/Sec
• DS Server Binds/Sec, Server Name Translations/Sec
• DS Threads In Use
• KDC AS Requests, TGS Requests
• Kerberos Authentications
• LDAP Active Threads
• LDAP Bind Time
• LDAP Client Sessions
• LDAP New / New SSL and Closed Connections/Sec
• LDAP Searches/Sec, Writes/Sec
• LDAP Successful Binds
• LDAP UDP Operations/Sec
• NTLM Authentications
43.2. Prerequisites
Prerequisite Restriction
Zenoss Version Zenoss Version 2.2 or higher
Required ZenPacks ZenPacks.zenoss.ZenWinPerf,ZenPacks.zenoss.ActiveDirectory
Table 43.1. Active Directory Monitoring Prerequisites
43.3. Enable Monitoring
All Active Directory services must have a device entry under the /Devices/Server/Windows/Active Directory deviceclass. In addition, verify that your Zenoss Windows service account has access to the Active Directory service.
1. Navigate to the device or device class in the Zenoss interface.

MS Active Directory
134
• If applying changes to a device class:
a. Select the class in the devices hierarchy.
b. Click Details.
c. Select Configuration Properties.
• If applying changes to a device:
a. Click the device in the device list.
b. Select Configuration Properties.
2. Verify the credentials for the service account to access the service.
Name Description
zWinUser Windows user with privileges to gather performance informa-tion.
zWinPassword Password for the above user.
Table 43.2. Active Directory Configuration Properties
3. Click Save to save your changes.
You will now be able to start collecting the Active Directory server metrics from this device.
4. Navigate to Graphs and you should see some placeholders for graphs. After approximately fifteen minutes youshould see the graphs start to become populated with information.
43.4. Daemons
Type Name
Performance Collector zenwinperf
Table 43.3. Daemons

135
Chapter 44. MS Exchange44.1. About
The MS Exchange ZenPack is an application monitoring ZenPack that monitors Microsoft Exchange and its relatedservices. The ZenPack enables users to view graphs based on MS Exchange Performance Counters and to monitorprocesses related to MS Exchange.
44.2. Prerequisites
Prerequisite Restriction
Zenoss Version Zenoss Version 2.2 or higher
Required ZenPacks ZenPacks.zenoss.ZenWinPerf, ZenPacks.zenoss.MSExchange
Table 44.1. MS Exchange Prerequisites
44.3. Enable Monitoring
All MS Exchange services must have a device entry under the /Devices/Server/Windows/MSExchange device class.In addition, verify that your Zenoss Windows service account has access to the MS Exchange service.
1. Navigate to the device or device class in the Zenoss interface.
• If applying changes to a device class:
a. Select the class in the devices hierarchy.
b. Click Details.
c. Select Configuration Properties.
• If applying changes to a device:
a. Click the device in the device list.
b. Select Configuration Properties.
2. Verify the credentials for the service account to access the service.
Name Description
zWinUser Windows user with privileges to gather performance informa-tion.
zWinPassword Password for the above user.
Table 44.2. MS Exchange Configuration Properties
3. Click Save to save your changes.
You will now be able to start collecting the MS Exchange server metrics from this device.
4. Navigate to Graphs and you should see some placeholders for graphs. After approximately fifteen minutes youshould see the graphs start to become populated with information.

MS Exchange
136
44.4. Daemons
Type Name
Performance Collector zenwinperf
Table 44.3. Daemons

137
Chapter 45. Microsoft Message Queuing(MSMQ) Monitoring45.1. About
The following description of Microsoft Message Queuing (MSMQ) can be found on Microsoft's MSMQ product page.
“Microsoft Message Queuing (MSMQ) technology enables applications running at different times to communicateacross heterogeneous networks and systems that may be temporarily offline. MSMQ provides guaranteed messagedelivery, efficient routing, security, and priority-based messaging. It can be used to implement solutions for bothasynchronous and synchronous messaging scenarios.”
The MSMQMonitor ZenPack described in this chapter allows Zenoss to automatically discover queues and monitorhow many messages are queued in each.
45.2. Prerequisites
Prerequisite Restriction
Zenoss Version Zenoss Version 2.5 or higher
Required ZenPacks ZenPacks.zenoss.MSMQMonitor
ZenPacks.zenoss.ZenWinPerf
Table 45.1. MSMQ Monitoring Prerequisites
45.3. Configuration
To monitor the MSMQ queues you must first follow the instructions in the Windows Performance chapter of thisguide to setup proper credentials for Zenoss to remotely monitor your Windows server. Once this is done you cantake one of the following two approaches to enabled MSMQ queue monitoring.
45.3.1. Automatically Monitor Queues on All Servers
The easiest way to configure Zenoss to monitor your queues is to enable queue discovery for the entire /Serv-er/Windows device class. Within 12 hours Zenoss will have automatically discovered all of the queues available tobe monitored and begun monitoring how many messages are in each queue and creating threshold events if theyexceed 10,000 messages.
Perform the following steps to enable queue discovery for all Windows servers.
1. Navigate to the /Server/Windows device class.
2. Click Details.
3. Select Modeler Plugins from the left panel.
4. Click Add Fields.
5. Drag zenoss.wmi.MSMQQueueMap from the available fields to the list of plugins.
6. Click Save.
7. Wait about 12 hours for all Windows servers to be remodeled.

Microsoft Message Queuing (MSMQ) Monitoring
138
45.3.2. Monitor Queues on Specific Servers
If you don't want Zenoss automatically monitoring queues on all of your Windows servers and would rather point itto specific servers you can do so by performing the following steps on each server you're interested in.
1. Navigate to the device.
2. Select Modeler Plugins from the left panel.
3. Click Add Fields.
4. Drag zenoss.wmi.MSMQQueueMap from the available fields to the list of plugins.
5. Click Save.
6. Select Model Device from the Action menu.
45.3.3. Fine-Tuning Queue Monitoring
By default Zenoss will automatically monitor all queues on a server that is running the MSMQ services. Each queuewill also have a default 10,000 maximum threshold applied to it. This means that an event will be created when thenumber of messages in a single queue exceeds 10,000.
Note
By default queues with names beginning with tcp will not be discovered. You can change this behavior with thezMSMQIgnoreQueues property. This property is a regular expression and any queues that match it will not bediscovered.
You can change the maximum messages threshold on a per-queue basis by changing the Queues MessagesThreshold property. Leaving this value blank will have the result of no threshold being applied.
45.4. Daemons
Type Name
Modeler
Performance Collector
zenmodeler
zenwinperf
Table 45.2. MSMQ Monitoring Daemons

139
Chapter 46. Microsoft Internet InformationServices (IIS)46.1. About
The IISMonitor ZenPack collects key metrics from Microsoft IIS. The metrics are collected using Windows Perfmonand does not require an agent to be installed on the IIS server.
• Connections Attempts
• Throughput (Bytes & Files)
• Requests (GET, HEAD, POST, CGI, ISAPI)
• Standard: GET, HEAD, POST, CGI, ISAPI
• WebDAV: PUT, COPY, MOVE, DELETE, OPTIONS, PROPFIND, PROPPATCH, MKCOL
• Other: SEARCH, TRACE, LOCK, UNLOCK
46.2. Prerequisites
Prerequisite Restriction
Zenoss Version Zenoss Version 2.2 or higher
Required ZenPacks ZenPacks.zenoss.ZenWinPerf, ZenPacks.zenoss.IISMonitor
Table 46.1. MS IIS Prerequisites
46.3. Enable Monitoring
All IIS servers must have a device entry in an organizer below the /Devices/Server/Windows/WMI device class. Inaddition, verify that your Zenoss Windows service account has access to the IIS service.
1. Bind the IIS template to the /Devices/Server/Windows/WMI class. To do this:
a. Select the device class in the devices hierarchy.
b. Click Details.
c. Select Device_WMI under Monitoring Templates.
d. Select Bind Templates from the Action menu.
The Bind Templates dialog appears.
e. Move IIS (/Server/Windows/WMI) from the Available area to the Selected area, and then click Save.
2. Navigate to the device or device class in the Zenoss interface.
• If applying changes to a device class:
a. Select the class in the devices hierarchy.
b. Click Details.
c. Select Configuration Properties.
• If applying changes to a device:
a. Click the device in the device list.

Microsoft Internet Information Services (IIS)
140
b. Select Configuration Properties.
3. Verify the credentials for the service account to access the service.
Name Description
zWinUser Windows user with privileges to gather performance informa-tion.
zWinPassword Password for the above user.
Table 46.2. IIS Configuration Properties
4. Click Save to save your changes.
You will now be able to start collecting the IIS server metrics from this device.
5. Navigate to Graphs and you should see some placeholders for graphs. After approximately fifteen minutes youshould see the graphs begin to be populated with information.
46.4. Daemons
Type Name
Performance Collector zenwinperf
Table 46.3. Daemons

141
Chapter 47. Microsoft SQL Server47.1. About
The MSSQLServer ZenPack monitors Microsoft SQL Server and its related services. The ZenPack enables users toview graphs based on Microsoft SQL Server Performance Counters and to monitor processes related to SQL Server.
47.2. Prerequisites
Prerequisite Restriction
Zenoss Version Zenoss Version 2.2 or higher
Required ZenPacks ZenPacks.zenoss.ZenWinPerf,ZenPacks.zenoss.MSSQLServer
Table 47.1. MS SQL Server Prerequisites
47.3. Enable Monitoring
All MS SQL Server services must have a device entry under the /Devices/Server/Windows/MSSQLServer deviceclass. In addition, verify that your Zenoss Windows service account has access to the MS SQL Server service.
1. Navigate to the device or device class in the Zenoss interface.
• If applying changes to a device class:
a. Select the class in the devices hierarchy.
b. Click Details.
c. Select Configuration Properties.
• If applying changes to a device:
a. Click the device in the device list.
b. Select Configuration Properties.
2. Verify the credentials for the service account to access the service.
Name Description
zWinUser Windows user with privileges to gather performance informa-tion.
zWinPassword Password for the above user.
Table 47.2. MS SQL Server Configuration Properties
3. Click Save to save your changes.
You will now be able to start collecting the MS SQL Server server metrics from this device.
4. Navigate to Graphs to see placeholders for graphs. After approximately fifteen minutes, the graphs start tobecome populated with information.

Microsoft SQL Server
142
47.4. Collecting Information from Non-Default Microsoft SQL Serv-er InstancesThe default Microsoft SQL Sever instance is SQLServer. The monitoring template delivered with the MSSQLServerZenPack uses this default instance to gather performance metrics. If you use a non-default SQL Server instance,then Zenoss does not automatically find and gather information about it.
To enable Zenoss to monitor a non-default instance, you must override the monitoring template:
1. From Infrastructure > Devices, click the device on which you want to override the template.
2. Under Monitoring Templates, select the MSSQLServer template.
3. From the Action menu, select Override Template Here.
The Override Templates dialog appears.
4. Select the MSSQLServer template in the list, and then click Submit.
The template redisplays in the left panel, now identified as "Locally Defined."
5. For each of the data sources in the Data Sources area, perform these steps:
a. Double-click the data source to edit it.
b. In the Perf Counter field, change the text "\SQLServer:" to "\MyInstance:" (where MyInstance is the nameof the Microsoft SQL Server database instance name.
c. Click Save.
6. Remodel the device.
47.5. Daemons
Type Name
Performance Collector zenwinperf
Table 47.3. Daemons

143
Chapter 48. Multi-Realm IP Networks48.1. About
The Multi-Realm IP ZenPack functionality extends core modeling, monitoring, and event management in Zenoss toallow for overlapping IP spaces. With this ZenPack, Zenoss can prefix a realm identifier to the IP addresses on agiven network to differentiate these addresses in Zenoss.
There are two primary use cases for using multi-realm IP management.
• A large company that manages multiple locations that have the same network spaces defined across thesemultiple locations and as a result have created multiple overlapping IP spaces and Zenoss needs a way toidentify each separate IP space in the system.
• Service Providers responsible for monitoring multiple customers where the customers have created independentnetworks and IP spaces that are unique to their location, but not unique to the Service Provider.
The essential workflow for creating and using IP Realms is that first you need to create the IP realms and then asso-ciate these realms with a collector. The associations between IP Realms and actual devices is made automatically bythe device's association with the collector. All devices on a collector are associated with the realm for that collector.
Note
The Multi-Realm IP ZenPack is available only by separate download from the Zenoss Support site.
After downloading the ZenPack, you must install it manually. In the Zenoss interface, go to Settings > Zenpacks> Install Zenpack.
48.2. Prerequisites
Prerequisite Restriction
Zenoss Version Zenoss Version 2.2 or higher
Required ZenPacks ZenPacks.zenoss.DistributedCollector,ZenPacks.zenoss.MultiRealmIP
Table 48.1. Multi-realm Prerequisites
48.3. Example System
The following diagram lays out an example setup. It has a central Zenoss server in the 10.10.10.0/24 network.The network local to the Zenoss server is considered the default network within the system. The default network istreated exactly the same as a Zenoss system without Multi-Realm IP ZenPack installed.
There are two other networks shown (r1 and r2) which are behind a firewall and have the same IP space192.168.0.0/24. Each realm has a distributed collector located within it. The collector can be accessed from theZenoss server using a IP translation from the firewall to map the address accessible from in front of the firewallto an address behind the firewall. Remote collectors in a multi-realm setup must be accessible from the centralserver using SSH.

Multi-Realm IP Networks
144
Figure 48.1. Example IP Realm
48.4. System SetupSet up Zenoss following the example system described above.
Tip
If you do not have overlapping IP space this example can be created using collectors within the same network.To create the example, add a machine multiple times once per collector, making sure to change the name of thedevice as it is added. The result is similar to a real realm setup.
Under multi-realm IP networks, device names must be unique even though the IP addresses will overlap.
On certain server configurations, if a distributed collector is configured, a "zenpack command failed" error occurswhen installing this ZenPack. If you encounter this error, then run the following grant (as MySQL root):
grant super on *.* to 'zenoss'@'{FQDN_of_Zenoss_host}' identified by 'zenoss';
where the first 'zenoss' is the user account that Zenoss uses to access MySQL, and the second 'zenoss' is thataccount's password.
48.4.1. Adding Realms1. Go to Infrastructure > Networks.
2. From the Add menu, select Add IP Realm. Add the realms r1 and r2.
48.4.2. Adding Collectors to Realms1. Add the two collectors that are installed in each realm.
Distributed collectors now have an IP Realm field on their configuration screen set each collector to the appro-priate realm configured above.

Multi-Realm IP Networks
145
2. Change each collector so that it is in the correct realm.
48.4.3. Adding Devices to Realms1. Now we are ready to add devices to the system. As mentioned above, adding the same device to the system
twice can simulate a multi-realm setup. Add a device called A.test making sure that when it is added the collectoris set to one of the remote collectors, and not localhost.
2. Now rename the device.
3. Add the device a second time using your other collector, again not localhost.
4. After the device is loaded, select Software and follow the network link on one of the interfaces. Notice that thenetwork has been created underneath the realm created earlier. This configuration is at the heart of multi-realm,as networks are discovered they are created within each realm.
Monitoring is now happening on each representation of the device from the different collectors in different over-lapping realms.
As another test try searching by IP from the top-level search. Two devices will be returned -- one within each realm.
48.5. Notes• If an event contains the unique name of a device then it is straight-forward to assign it to the proper device. If
only the IP address is sent the event will be assigned by looking up the IP within the context of the realm.
• If a device is moved between realms it must be remodeled so that its IPs are placed in the proper location.
• The Network Map only supports the display the default realm.

146
Chapter 49. NetApp Filers49.1. About
NetAppMonitor provides additional modeling and monitoring for NetApp devices. NFS, CIFS and HTTP operationsper second are collected, as well as file system and snapshot utilization information. Hardware model and operatingsystem revision asset information is modeled.
The NetApp ZenPack uses reports (IIRC) provided by the StorageBase ZenPack.
Asset information:
• Hardware Model
• Operating System Revision
Device metrics:
• Network bits/sec: Send and Received
• Operations/sec: NFS, CIFS and HTTP
File system metrics:
• File system utilization (90% threshold)
• Snapshot utilization (120% threshold)
NetApp uses SSH to model NFS clients of file systems. It uses SNMP to model:
• Disks, storage enclosures, RAID groups, Plexes, Aggregates, Volumes, LUNs and QTrees
• LUN clients
• Licenses
Note
Sizes reported by the NetAppMonitor ZenPack are approximate, as values for many objects (Aggregate, Volume,Plex, and RAID group) are not exposed by the NetApp MIB.
It uses SNMP to monitor:
• iSCSI, Fibre Channel, and per LUN throughput
• Disk inventory (active, spare, pre-failed, or failed)
• Disk maintenance activity (scrubbing, reconstructing, parity reconstructing, verifying parity)
• NFS v3 statistics
• NFS cache statistics
• CIFS statistics
49.1.1. Performance Graphs
Performance graphs provided with this ZenPack include:
• NFSv3 Operations
• Fibre Channel Traffic

NetApp Filers
147
• iSCSI Traffic
• NFS Caching Statistics
• Disk Inventory
• Disk Maintenance
49.2. Prerequisites
Prerequisite Restriction
Zenoss Version Zenoss Version 3.x or higher
Required ZenPacks ZenPacks.zenoss.NetAppMonitor
ZenPacks.zenoss.StorageBase
Table 49.1. NetApp Prerequisites
49.3. Enable Monitoring
49.3.1. Configuring NetApp Devices to Allow SNMP Queries
Configure the NetApp devices to allow SNMP queries from the Zenoss server, and send SNMP v1 or SNMP v2traps to the Zenoss server.
49.3.2. Configuring Zenoss
All NetApp devices must exist under the /Devices/Storage/NetApp device class.
1. Navigate to the device or device class in the Zenoss interface.
• If applying changes to a device class:
a. Select the class in the devices hierarchy.
b. Click Details.
c. Select Configuration Properties.
• If applying changes to a device:
a. Click the device in the device list.
b. Select Configuration Properties.
2. Edit the appropriate configuration properties for the device or devices.
Name Description
zSnmpCommunity Consult with your storage administrators to determine the SN-MP community permitted.
zSnmpPort The default port is 161.
zSnmpVer Set to v2c.
Table 49.2. NetApp Configuration Properties
3. Click Save to save your changes. You will now be able to start collecting the NetApp metrics from this device.
4. Navigate to Graphs and you should see some placeholders for graphs. After approximately fifteen minutes youshould see the graphs start to become populated with information.

NetApp Filers
148
49.4. Using SSH to Model NFS ClientsTo use SSH to model NFS clients, you must:
1. Allow SSH logins to the NetApp server.
2. Set the configuration properties zCommandPassword and zCommandUser.
3. Remodel the device.
49.5. Forwarding syslog Events from NetAppTo forward syslog events from NetApp:
1. From the NetApp interface, click the Filer menu.
2. Click the Configure Syslog menu item.
3. Click the New Action button.
4. Add the following, separating each field with a tab.
*.* @yourzenossserver
5. Click OK.
You can test the configuration by logging in to the command line on the NetApp server, and then entering thefollowing command:
logger Hello World
This should result in an event with the subject "Hello World" appearing in the Zenoss event console. To restart thedaemon, enter:
syslog reset_syslog
49.6. Daemons
Type Name
Modeler zenmodeler
Performance Collector zenperfsnmp
Performance Collector zencommand
Table 49.3. Daemons

149
Chapter 50. NetScreen Devices50.1. About
NetScreenMonitor allows you to monitor NetScreen devices.
50.2. Prerequisites
Prerequisite Restriction
Zenoss Version Zenoss Version 2.2 or higher
Required ZenPacks ZenPacks.zenoss.NetScreenMonitor
Table 50.1. NetScreen Prerequisites
50.3. Enable Monitoring
50.3.1. Configuring NetScreen Devices to Allow SNMP Queries
Configure the NetScreen device to allow SNMP queries from the Zenoss server, and send SNMP v1 or SNMP v2traps to the Zenoss server.
50.3.2. Configuring Zenoss
All NetScreen devices must exist under the /Devices/Network/NetScreen device class.
1. Navigate to the device or device class in the Zenoss interface.
• If applying changes to a device class:
a. Select the class in the devices hierarchy.
b. Click Details.
c. Select Configuration Properties.
• If applying changes to a device:
a. Click the device in the device list.
b. Select Configuration Properties.
2. Edit the appropriate configuration properties for the device or devices.
Name Description
zSnmpCommunity Consult with your network administrators to determine the SN-MP community permitted.
zSnmpMonitorIgnore This should be set to False
zSnmpPort The default port is 161.
zSnmpVer This should be set to v2c
Table 50.2. NetScreen Configuration Properties
3. Click Save to save your changes. You will now be able to start collecting the NetScreen device metrics fromthis device.

NetScreen Devices
150
4. Navigate to Graphs and you should see some placeholders for graphs. After approximately fifteen minutes youshould see the graphs start to become populated with information.
50.4. Daemons
Type Name
Modeler zenmodeler
Performance Collector zenperfsnmp
Table 50.3. Daemons

151
Chapter 51. Nortel Devices51.1. About
The NortelMonitor ZenPack allows you to monitor Nortel devices.
51.2. Prerequisites
Prerequisite Restriction
Zenoss Version Zenoss Version 2.2 or higher
Required ZenPacks ZenPacks.zenoss.NortelMonitor
Table 51.1. Nortel Prerequisites
51.3. Enable Monitoring
51.3.1. Configuring Nortel Devices to Allow SNMP Queries
Configure the Nortel device to allow SNMP queries from the Zenoss server, and send SNMP v1 or SNMP v2 trapsto the Zenoss server.
51.3.2. Configuring Zenoss
All Nortel devices must exist under the /Devices/Network/Nortel device class.
1. Navigate to the device or device class in the Zenoss interface.
• If applying changes to a device class:
a. Select the class in the devices hierarchy.
b. Click Details.
c. Select Configuration Properties.
• If applying changes to a device:
a. Click the device in the device list.
b. Select Configuration Properties.
2. Edit the appropriate configuration properties for the device or devices.
Name Description
zSnmpCommunity Consult with your network administrators to determine the SN-MP community permitted.
zSnmpMonitorIgnore This should be set to False
zSnmpPort The default port is 161.
zSnmpVer This should be set to v2c
Table 51.2. Nortel Configuration Properties
3. Click Save to save your changes. You will now be able to start collecting the Nortel device metrics from thisdevice.

Nortel Devices
152
4. Navigate to Graphs and you should see some placeholders for graphs. After approximately fifteen minutes youshould see the graphs start to become populated with information.
51.4. Daemons
Type Name
Modeler zenmodeler
Performance Collector zenperfsnmp
Table 51.3. Daemons

153
Chapter 52. Oracle52.1. AboutThe Oracle Monitoring ZenPack (DatabaseMonitor) monitors an Oracle database server. The ZenPack enablesusers to view graphs based on interface from Oracle performance tables.
52.2. PrerequisitesPrerequisite Restriction
Zenoss Version Zenoss Version 2.2 or higher
Required ZenPacks ZenPacks.zenoss.DatabaseMonitor
Table 52.1. Oracle Prerequisites
Note
The Oracle ZenPack (ZenPacks.zenoss.DatabaseMonitor) is not available at the Enterprise Download site bydefault for legal reasons. It is also not included in the Enterprise ZenPacks RPM file.
Oracle requires each user to complete a license agreement prior to receiving this ZenPack. Upon completion,Zenoss Support will enable the ZenPack. You will be notified via a new case in the Zenoss Support Portal whenthe ZenPack is available. This ZenPack will be located in the zenpacks directory at the Enterprise Download siteas both a 32-bit and a 64-bit version.
After downloading the ZenPack, you must install it manually. In the Zenoss interface, go to Advanced > Settings,select ZenPacks in the left panel, and then select Install ZenPack from the Action menu.
52.3. Enable Monitoring
52.3.1. Authorize Oracle Performance Data Access
The default Oracle monitoring template queries the v$statname and v$sysstat views for performance metrics. Youmust get a login to the Oracle instance with read privileges to these tables at the minimum. You must also provideread privileges any other custom tables or views you plan to monitor.
52.3.2. Configure Zenoss
Oracle monitoring can be applied to any device in the system by binding the Oracle template and configuring afew properties. The following steps illustrate how you would add Oracle monitoring to a Windows server calledoraprod1.example.com.
1. Select the oraprod1.example.com device in the device list.
2. In the left panel, select Configuration Properties.
3. Set the following Oracle-related properties.
• zOracleConnectString: Optionally used instead of the following separate options.
• zOracleInstance: Oracle SID
• zOraclePassword: Password for the Oracle account
• zOraclePort: Port number for the Oracle instance
• zOracleUser: Username for the Oracle account

Oracle
154
4. Click Save.
5. Select Bind Templates from the Action menu.
6. Move the Oracle template from the list of Available templates to the Selected area.
7. Click Save.
You will now be able to find the following additional graphs on the device. It may take up to fifteen minutes to startdisplaying values. You can check the device's event console for any errors related to the Oracle collection.
52.4. Monitor Additional SIDsTo monitor performance data from an additional SID on the same device you must make a copy of the default Oracletemplate and adjust its instance property.
1. Navigate to Advanced -> Monitoring Templates.
2. Highlight the /Devices under the Oracle template.
3. Choose Override Template from the action menu.
4. Choose your Oracle server from the list.
5. Click Submit.
6. Highlight the new Oracle template for your Oracle server.
7. Choose View and Edit Details from the gear menu.
8. Change the template name from Oracle to Oracle??? where ??? is the SID.
9. Click Submit.
10. Highlight the Oracle template for your Oracle server.
52.5. Monitoring Other Tables or ViewsThe Oracle data source also allows monitoring of other data contained within the database. You will need to builda query that returns a table in the following format.
Data Point Name Numeric Value
firstValue 123
secondValue 45.6
Table 52.2. Example Query Results
Once you have a result set conforming to this name, value column specification you can add a new Oracle datasource to a new or existing template using the following steps.
1. Optionally create a new monitoring template for the data source.
2. Edit the monitoring template.
3. Add a new Oracle data source to the template.
4. Fill out all of the data source fields as required to make the query.
5. Add one data point to the new data source for each row.
Note
The data point name must match the value in the first column of the result set exactly. For the example resultset shown above you would create a data point named firstValue and another named secondValue.

Oracle
155
52.6. Daemons
Type Name
Performance Collector zencommand
Table 52.3. Daemons

156
Chapter 53. Predictive Thresholding53.1. About
The ZenHoltWinters ZenPack adds the ability to create threshold events when a device exceeds cyclical predictedvalues. The Holt-Winters exponential smoothing algorithm is used for this prediction.
For more information on RRD and Holt-Winters, see the rrdcreate command for more information.
Warning
Zenoss relies on the existence of Holt-Winters RRAs within an RRD file. After adding Holt-Winters thresholds theRRD files will need to be re-created so that the new configuration can occur. You will have to remove any existingRRD files so that new files can be created.
Removing RRD files will remove all historical information associated with these RRD files.
53.2. Prerequisites
Prerequisite Restriction
Zenoss Version Zenoss Version 2.2 or higher
Required ZenPacks ZenPacks.zenoss.ZenHoltWinters
Table 53.1. Trap Forwarding Prerequisites
53.3. Add a Predictive Threshold1. Navigate to the template that you want to modify.
2.From the Thresholds area, click (Add Threshold).
3. Provide a name for the new threshold and select the HoltWintersFailure threshold type, and then click Add.
4. Choose the data source to which the threshold should be applied.
5. Specify the parameters for the prediction engine.
Name Description
Rows The number of points to use for predictive purposes.
Alpha A number from 0 to 1 that controls how quickly the modeladapts to unexpected values.
Beta A number from 0 to 1 that controls how quickly the modeladapts to changes in unexpected rates changes.
Season The number of primary data points in a season. Note that Rowsmust be at least as large as Season.
Table 53.2. Predictive Threshold Data Source Threshold Options
6. Click Save to save your changes.
7. Remove the RRD file or files that correspond to the data source selected in a previous step.
cd $ZENHOME/perf/Devices

Predictive Thresholding
157
rm device_names/DataSource_DataPoint.rrd
Note
Removing the RRD files does result in a loss of historical information.

158
Chapter 54. RANCID Integration54.1. AboutThe RANCIDIntegrator ZenPack allows integration between the popular RANCID configuration management tooland Zenoss. The integration points between the tools are:
• Zenoss will build the router.db file for RANCID. This allows for the centralization of administration activities andreduces the duplication of effort normally required to maintain the two tools.
• Implementation of this feature is as easy as adding a cron job to execute $ZENHOME/bin/zenrancid to updatethe router.db file.
• Zenoss will automatically run RANCID's rancid-runm tool on a single device in response to a ciscoConfigMan-Event SNMP trap being sent from the device to Zenoss. Cisco devices will send this trap whenever their config-uration is changed. This allows for real-time capturing of router configuration changes in your CVS repository.
Note
The RANCID integrator is dependent on a connection to the Zope server, hence it can run only on the Zenossmaster and as such works only with managed resources on the master.
54.2. Prerequisites
Prerequisite Restriction
Zenoss Version Zenoss Version 2.2 or higher
Required ZenPacks ZenPacks.zenoss.RANCIDIntegrator
Table 54.1. RANCID Prerequisites
54.3. Enable Integration
54.3.1. Configure Cisco Devices to Send Traps
To implement this feature you must configure your Cisco devices to send their SNMP traps to the Zenoss server.
Link from Cisco device status pages to the most recent configuration stored in your CVS repository via viewvc.
54.3.2. Configure RANCID Update Information in Zenoss1. From Infrastructure >Devices, click the device in the device list.
2. Select Configuration Properties in the left panel.
3. Edit the appropriate configuration properties for the device.
Name Description
zRancidRoot File system directory where RANCID is installed. It may be NFSmounted from the RANCID server. Default is /opt/rancid
zRancidUrl Base URL to viewvc
zRancidGroup RANCID group attribute. Controls what router.db file the de-vice is written to. Can be set at the device class or device level.Default is router on the /Network/Router/Cisco class

RANCID Integration
159
Name Description
zRancidType RANCID type attribute. Controls what device type is written tothe router.db file. Can be set at the device class or device lev-el. Default is cisco on the /Network/Router/Cisco
Table 54.2. RANCID Configuration Properties
4. Click Save to save your changes.

160
Chapter 55. Remedy Ticket Creation55.1. AboutThe RemedyIntegrator ZenPack provides a way for Zenoss to automatically open tickets in your Remedy systemwhen specific events occur. The cases are opened by Zenoss sending a specially-formatted email to the Remedyservice's email receiver.
55.2. PrerequisitesPrerequisite Restriction
Zenoss Version Zenoss Version 2.2 or higher
Required ZenPacks ZenPacks.zenoss.RemedyIntegrator
Table 55.1. Remedy Ticket Creation Prerequisites
55.3. Enable Ticket CreationHave your Remedy administrator create the template email that is needed to have events enter into the appropriateworkflow.
1. Select Advanced > Settings from the navigation bar.
2. Select Users from the left panel.
3. Click on the Remedy user.
4. Change the email address to the email address from which your Remedy service receives email.
5. Select Alerting Rules in the left panel.
6. Click on the Open Ticket alerting rule to edit it.
7. Set the Enabled field to True and adjust the event filter to your requirements.
8. Select Message in the left panel and modify the Zenoss e-mail message with the necessary information fromthe template e-mail. Lines that will require modification for all sites are:
• Server: remedy.yourdomain.com
• Login: remedyUsername
• Password: remedyPassword
9. Click Save to save your changes.
55.4. Send Test TicketsTo create test events that will match your rule and create tickets in Remedy, select Events from the navigation bar,
and then click (Add Event).
55.5. DaemonsType Name
Event Forwarder zenactions
Table 55.2. Daemons

161
Chapter 56. SNMP Trap Forwarding56.1. AboutZenoss can be configured to forward events matching specified criteria to other SNMP trap receivers. You may wantto do this if you have another system that would benefit from the event information that Zenoss collects.
Note
This ZenPack is available only by separate download from the Zenoss Support site. After downloading the Zen-Pack, you must install it manually:
1. In the Zenoss interface, go to Advanced > Settings.
2. In the left panel, select ZenPacks.
3. Select Install ZenPack from the Action menu.
56.2. Prerequisites
Prerequisite Restriction
Zenoss Version Zenoss Version 2.2 or higher
Required ZenPacks ZenPacks.zenoss.TrapForwarder
Table 56.1. Trap Forwarding Prerequisites
56.3. Enable Event Forwarding
56.3.1. Import Zenoss MIB onto the Remote Receiver
The MIB file ZENOSS-MIB.txt is found at the base directory within the TrapForwarder distribution. Import this MIBinto the event management system that you plan to forward to events to so that the SNMP traps that Zenoss willgenerate can be properly interpreted. Consult the documentation for the remote SNMP manager for instructions.
56.3.2. Configure Zenoss to Send Events as Traps1. From the navigation bar, select Advanced > Settings.
2. Select Daemons in the left panel.
3. Locate the trapforwarder daemon in the list, and then click edit config in that row.
4. Specify the following properties that are expected by your remote SNMP trap receiver.
Name Description
community SNMP community name sent in each trap
trapsink hostname or IP address of the remote SNMP trap receiver
Required ZenPacks ZenPacks.zenoss.TrapForwarder
Table 56.2. trapforwarder Configuration File Options
5. Click Save to save your changes.
6. Select Daemons in the left panel and locate the trapforwarder daemon. Click Restart in that row.
7. From the navigation bar, select Events > Event Manager.

SNMP Trap Forwarding
162
8. Select Commands in the left panel.
9. Choose the events you want to forward, based on the example already setup called SNMP Trap. Click to edit it.
The example is set up to forward all new events from production devices with a severity of warning or greater.You may want to limit this further.
10. Once configuration of the rule is complete, select a value of True for the Enabled field.
11. Click Save to save your changes.
56.4. Send Test EventsTo create test events that will match your rule, navigate to Events from the navigation bar and then add an event.
56.5. Daemons
Type Name
Event Forwarder trapforwarder
Table 56.3. Daemons

163
Chapter 57. Solaris57.1. AboutThe SolarisMonitor ZenPack enables Zenoss to use Secure Shell (SSH) to monitor Solaris hosts. Zenoss modelsand monitors devices placed in the /Server/SSH/Solaris device class by running commands and parsing the output.Parsing of command output is performed on the Zenoss server (if using a local collector) or on a distributed collector.The account used to monitor the device does not require root access or special privileges.
The SolarisMonitor ZenPack provides:
• File system and process monitoring
• Network interfaces and route modeling
• CPU utilization information
• Hardware information (memory, number of CPUs, and model numbers)
• OS information (OS-level, command-style information)
• Pkginfo information (such as installed software)
57.2. PrerequisitesPrerequisite Restriction
Zenoss Version Zenoss Version 2.5 or higher
Required ZenPacks ZenPacks.zenoss.SolarisMonitor
Solaris releases supported OpenSolaris 5.11, Solaris 9 and 10
Table 57.1. Solaris Prerequisites
Note
If using a distributed collector setup, SSH requires firewall access (by default, port 22) from the collector to themonitored server.
57.3. LimitationsThe SolarisMonitor ZenPack does not support monitoring in Solaris Zones or systems containing Solaris Zones.(Implemented with Solaris 10, Solaris Zones act as isolated virtual servers within a single operating system instance.)
57.4. Set Solaris Server Monitoring CredentialsAll Solaris servers must have a device entry in an organizer below the /Devices/Server/SSH/Solaris device class.
Note
The SSH monitoring feature will attempt to use key-based authentication before using a configuration propertiespassword value.
1. Navigate to the device or device class in the Zenoss interface.
• If applying changes to a device class:
a. Select the class in the devices hierarchy.
b. Click Details.

Solaris
164
c. Select Configuration Properties.
• If applying changes to a device:
a. Click the device in the device list.
b. Select Configuration Properties.
2. Verify the credentials for the service account to access the service.
Name Description
zCommandUsername Solaris user with privileges to gather performance in-formation
zCommandPassword Password for the Solaris user
Table 57.2. Solaris Configuration Properties
3. Click Save to save your changes.
57.5. Enable Monitoring
These steps assume that credentials have been set.
1.From Infrastructure > Devices, select select Add a Single Device from (Add Device menu).
2. Enter the following information:
Name Description
Device Name Solaris host to model
Device Class Path /Server/SSH/Solaris
Discovery Protocol Set this to auto unless adding a device with a username andpassword different than found in the device class. If you set thisto none, then you must add the credentials (see Section 57.4,“Set Solaris Server Monitoring Credentials”), and then manuallymodel the device.
Table 57.3. Adding Solaris Device Information
3. Click Add to add the device.
57.6. Resolving CHANNEL_OPEN_FAILURE Issues
The zencommand daemon's log file ($ZENHOME/collector/zencommand.log) may show messages stating:
ERROR zen.SshClient CHANNEL_OPEN_FAILURE: Authentication failureWARNING:zen.SshClient:Open of command failed (error code 1): open failed
If the sshd daemon's log file on the remote device is examined, it may report that the MAX_SESSIONS number ofconnections has been exceeded and that it is denying the connection request. In the OpenSSH daemons, thisMAX_SESSIONS number is a compile-time option and cannot be reset in a configuration file.
To work around this sshd daemon limitation, use the configuration property zSshConcurrentSessions to control thenumber of connections created by zencommand to the remote device:
1. Navigate to the device or device class in the Zenoss interface.
• If applying changes to a device class:

Solaris
165
a. Select the class in the devices hierarchy.
b. Click Details.
c. Select Configuration Properties.
• If applying changes to a device:
a. Click the device in the device list.
b. Select Configuration Properties.
2. Apply an appropriate value for the maximum number of sessions.
Name Description
zSshConcurrentSessions Maximum number of sessions supported by the remote device'sMAX_SESSIONS parameter. Common values for Solaris is 2 or 10.
Table 57.4. Concurrent SSH Configuration Properties
3. Click Save to save your changes.
57.7. Resolving Command time out Issues
The zencommand daemon's log file ($ZENHOME/collector/zencommand.log) may show messages stating:
WARNING:zen.zencommand:Command timed out on device device_name: command
If this occurs, it usually indicates that the remote device has taken too long to return results from the commands.To increase the amount of time to allow devices to return results, change the configuration property zCommandCom-mandTimeout to a larger value:
1. Navigate to the device or device class in the Zenoss interface.
• If applying changes to a device class:
a. Select the class in the devices hierarchy.
b. Click Details.
c. Select Configuration Properties.
• If applying changes to a device:
a. Click the device in the device list.
b. Select Configuration Properties.
2. Apply an appropriate value for the command timeout.
Name Description
zCommandCommandTimeout Time in seconds to wait for commands to complete on the re-mote device.
Table 57.5. SSH Timeout Configuration Properties
3. Click Save to save your changes.
57.8. Daemons
Type Name
Modeler zenmodeler

Solaris
166
Type Name
Performance Collector zencommand
Table 57.6. Daemons

167
Chapter 58. Splunk Monitoring58.1. AboutSplunk is a search engine for IT data. It lets you search and analyze all the data your IT infrastructure generatesfrom a single location in real time. More information on Splunk can be found online at http://www.splunk.com/.
The Splunk ZenPack allows you to monitor the results of a Splunk search. The total count returned by a searchcan be recorded, thresholded and graphed as well as additional tabular data contained within the results of moreadvanced searches that make use of Splunk's top filter. The value of monitoring Splunk searches is that it adds aneasy and flexible way to monitor log data at aggregate level instead of on a log-by-log basis.
58.2. Prerequisites
Prerequisite Restriction
Zenoss Version Zenoss Version 2.4 or higher
Required ZenPacks ZenPacks.zenoss.Splunk
Third Party Software Splunk Version 3 or 4
Table 58.1. Splunk Monitoring Prerequisites
58.3. Splunk Data Source TypeThe Splunk ZenPack adds the new Splunk data source type to your Zenoss system. This data source can be usedto monitor the results of Splunk searches.
The Splunk data source type has the following fields in common with many other Zenoss data source types:
• Name: The name given to your data source.
• Enabled: This data source will only be polled if enabled is set to true.
In the event that the Splunk search fails to execute successfully an event will be generated. The following fieldscontrol key fields in the generated event. It is important to note that these fields only apply when the Splunk searchfails to execute, and not when a threshold on the data point is breached.
• Component
• Event Class
• Event Key
• Severity
The following fields are specific to Splunk type data sources.
• Splunk Server: Hostname or IP address of your Splunk server. If left blank the SPLUNK_SERVER environmentvariable will be used.
• Splunk Port: Port that the splunkd daemon is listening on. Default is 8089. If left blank the SPLUNK_PORT environ-ment variable will be used.
• Splunk Username: Splunk username. Default is admin. If left blank the SPLUNK_USERNAME environment variablewill be used.
• Splunk Password: Splunk password. Default is changeme. If left blank the SPLUNK_PASSWORD environment vari-able will be used.

Splunk Monitoring
168
• Search: Search string exactly as it would be typed into the Splunk search engine. Be careful to use full quotesand not apostrophes where necessary.
58.4. Monitoring Splunk Searches
58.4.1. Monitoring Results of a Simple Search
The easiest way to get started monitoring your Splunk searches is with a simple search. The following steps willillustrate a simple way to build dynamic Splunk search monitoring.
This example demonstrates how to detect brute-force password cracking attempts on all Linux servers.
1. Build a search in Splunk to verify that you're getting the expected data. This example shows a query ofhost="zendev.damsel.loc" minutesago=5 "failed password".
Note
Using a time specifier such as minutesago=5 within your search can be a useful trick when it comes tomonitoring searches from Zenoss. We will have Zenoss automatically replace zendev.damsel.loc with theappropriate hostname using a ${here/id} TALES expression.
2. Create a Zenoss monitoring template for monitoring this Splunk search.
a.From Advanced > Monitoring Templates, click to add a monitoring template.
The Add Template dialog appears.

Splunk Monitoring
169
b. Enter SplunkLinux in the Name field and select Linux in /Service/Linux for Template Path, and then clickSubmit.
c. Select the newly created template.
d. Add a Splunk data source to capture the count of failed passwords.
i.In the Data Sources area, click to add a data source.
ii. In the Add Data Source dialog, set the Name to failedPassword and the Type to Splunk, and then clickOK.
iii. Double-click the data source to configure it as follows, and then click Save.
• Splunk Server: Hostname or IP of your Splunk server
• Splunk Port: 8089
• Splunk Username: Splunk username (default is admin)
• Splunk Password: Splunk password (default is changeme)
• Search: host="${here/id}" minutesago=5 "failed password"
iv. Add the count data point to the failedPassword data source.
A. Select Add Data Point from the Data Sources Action menu.
B. Set the Name to count and click OK.
v. Add a threshold of how many failed passwords constitutes an attack.
A.In the Thresholds area, click to add a threshold.
B. Set the Name to password attack and Type to MinMaxThreshold, and then click Add..\
C. Select failedPassword_count from Data Points.
D. Set the Max Value to 10.
E. Set the Event Class to /Security/Login/BadPass.
F. Click Save.
vi. Add a graph to visualize failed passwords per 5 minutes.
A.In the Graph Definitions area, click to add a graph.
B. Set the Name to Splunk - Failed Passwords, and then click Submit.
C. Double-click the newly created graph to edit it.
D. Set the Units to failed/5min.
E. Set the Min Y to 0.
F. Select Manage Graph Points from the Action menu in the Graph Definitions area.
The Manage Graph Points dialog appears.
G. Select Data Point from the Add menu.
The Add Data Point dialog appears.
H. Select failedPassword_count from Data Point, and then click Submit.
I. Click into the new count graph point.

Splunk Monitoring
170
J. Set the RPN to 300,* to adjust from failed/sec to failed/5min.
K. Set the Format to %6.1lf.
L. Set the Legend to Count.
M. Click Save.
vii. Bind the SplunkLinux template to the /Server/Linux device class.
A. From Infrastructure > Devices, navigate to the /Server/Linux device class.
B. Click Details.
C. Select Bind Templates from the Action menu.
D. Move the SplunkLinux template from the Available area to the Selected area, and then click Save.
Now you will have a Failed Passwords graph on all of your Linux servers that visualizes how many failed passwordattempts have occurred over the last 5 minutes. You will also get a warning severity event anytime more than 10failed password attempts are made within a 5 minute period.
58.4.2. Monitoring Results of a Top Search
Monitoring additional data points within a top search builds on monitoring a simple search. You can extra numericdata from the tabular results returned from a top search using the following steps.
This example demonstrates how you can monitor the logs by source type for all Linux devices.
1. Build a search in Splunk to verify that you're getting the expected data. This example shows a query ofhost="zendev.damsel.loc" minutesago=5 | top sourcetype.

Splunk Monitoring
171
Note
Take special note of the names in the sourcetype column and the names of the count and percent columns.These will be used to construct the names of the datapoints within our Splunk data source.
2. Setup a Zenoss monitoring template just as described in the simple search example.
3. Add a Splunk type data source named sourcetype to the template with the following settings.
• Splunk Server: Hostname or IP of your Splunk server
• Splunk Port: 8089
• Splunk Username: Splunk username (default is admin)
• Splunk Password: Splunk password (default is changeme)
• Search: host="${here/id}" minutesago=5 | top sourcetype
4. Add data points to the sourcetype data source with the following names. These names come from concatenatingthe data in the first column of each row with the name of the column name with the target numeric data.
• linux_audit_count
• linux_audit_percent
• linux_secure_count
• linux_secure_percent

Splunk Monitoring
172
5. Create a graph that will show these results within Zenoss in a useful way.
a. Add a graph from the Graph Definitions area of the monitoring template.
b. Set the ID to Splunk - Logs by Source Type then click Submit.
c. Set the Units to percent.
d. Set the Min Y to 0.
e. Set the Max Y to 100.
f. Click Save.
g. Select Manage Graph Points from the Action menu in the Graph Definitions area.
The Manage Graph Points dialog appears.
h. Select Data Point from the Add menu.
The Add Data Point dialog appears.
i. Use SHIFT-click or CTRL-click to select the following data points from the list then click Submit.
• sourcetype_linux_audit_percent
• sourcetype_linux_secure_percent
j. Click into each of the graph points you just added to the graph and set the following properties.
• Line Type: Area
• Stacked: True
• Format: %5.1lf%%
• Legend: Audit or Secure respectively.
6. Bind the monitoring template to the /Server/Linux device class just as in the simple search example.
You will now have a graph for all Linux devices that shows what percentage of logs are coming from the audit andsecure logs respectively. This ability to track multiple results from a single Splunk search has many other possibleuses. Experiment with the top filter in Splunk to see what other useful data you could extract.
58.5. Daemons
Type Name
Performance Collector zencommand
Table 58.2. Splunk Monitoring Daemons

173
Chapter 59. SQL Transactions59.1. About
The ZenSQLTx ZenPack allows you to test the availability and performance of MySQL, Sybase and Microsoft SQLservers. It provides a SQL data source where user-defined SQL queries can be executed against a database.
59.2. Prerequisites
Prerequisite Restriction
Zenoss Version Zenoss Version 2.2 or higher
Required ZenPacks ZenPacks.zenoss.ZenSQLTx
Table 59.1. SQL Transaction Prerequisites
59.3. Enable SQL Server Monitoring
Ensure that your Microsoft SQL Server authentication mode is set to "SQL Server and Windows Authenticationmode." For more information about this setting and how to change it, refer to:
http://msdn.microsoft.com/en-us/library/ms188670.aspx
1. Click the device in the device list.
2. Select Device under Monitoring Templates in the left panel.
3. Select Add Local Template from the Action menu.
The Add Local Template dialog appears.
4. Enter a name of the template, and then click Submit.
5. Click the newly created template in the left panel.
6.In the Data Sources area, click .
7. Enter a name for the data source, select SQL as the type, and then click Submit.
8. Double-click the newly created data source.
The Edit Data Source dialog appears.
9. Change options as needed.
Option Description
Database Type Enter MS SQL
Host Name Set the host name on which the database is located. This fieldaccepts a TALES expression, such as ${here/id} or ${here/getManageIp}
Port Set the port on which the database server is listening. If you donot specify a port number, then the default port for the databaseis used.
Database Name Specify the name of the database (required).

SQL Transactions
174
Option Description
User Specify a user name with permission to connect to thedatabase and run queries.
Password Specify the user password.
SQL Queries Specify the SQL queries that this data source should execute.A summary of MS SQL syntax is available in the documentationaccompanying the software.
Table 59.2. MS SQL Server Transactions Data Source Options
10. Click Save to save your changes.
Zenoss creates a data point that corresponds to the total query time in milliseconds.
11. Click Test to verify that the database connection can be completed, and that the data returned from the queriesare correct.
See the Administration Guide for more information about setting up thresholds and graphs. To create data pointsthat store the results of queries, see the section titled "Data Points."
59.4. Enable Sybase Server Monitoring1. Click the device in the device list.
2. Select Device under Monitoring Templates in the left panel.
3. Select Add Local Template from the Action menu.
The Add Local Template dialog appears.
4. Enter a name of the template, and then click Submit.
5. Click the newly created template in the left panel.
6.In the Data Sources area, click .
7. Enter a name for the data source, select SQL as the type, and then click Submit.
8. Double-click the newly created data source.
The Edit Data Source dialog appears.
9. Change options as needed.
Option Description
Database Type Enter Sybase
Host Name Set the host name on which the database is located. This fieldaccepts a TALES expression, such as ${here/id} or ${here/getManageIp}
Port Set the port on which the database server is listening. If you donot specify a port number, then the default port for the databaseis used.
Database Name Specify the name of the database (required).
User Specify a user name with permission to connect to thedatabase and run queries.
Password Specify the user password.

SQL Transactions
175
Option Description
SQL Queries Specify the SQL queries that this data source should execute. Asummary of Sybase syntax is available at the Sybase ManualsWeb site.
Table 59.3. MySQL Server Transactions Data Source Options
10. Click on the Save button to save your changes.
Zenoss creates a data point that corresponds to the total query time in milliseconds.
11. Click Test to verify that the database connection can be completed, and that the data returned from the queriesare correct.
See the Administration Guide for more information about setting up thresholds and graphs. To create data pointsthat store the results of queries, see the section titled "Data Points."
59.5. Enable MySQL Server Monitoring1. Click the device in the device list.
2. Select Device under Monitoring Templates in the left panel.
3. Select Add Local Template from the Action menu.
The Add Local Template dialog appears.
4. Enter a name of the template, and then click Submit.
5. Click the newly created template in the left panel.
6.In the Data Sources area, click .
7. Enter a name for the data source, select SQL as the type, and then click Submit.
8. Double-click the newly created data source.
The Edit Data Source dialog appears.
9. Change options as needed.
Option Description
Database Type Enter MySQL
Host Name Set the host name on which the database is located. This fieldaccepts a TALES expression, such as ${here/id} or ${here/getManageIp}
Port Set the port on which the database server is listening. If you donot specify a port number, then the default port for the databaseis used.
Database Name Specify the name of the database (required).
User Specify a user name with permission to connect to thedatabase and run queries.
Password Specify the user password.
SQL Queries Specify the SQL queries that this data source should execute. Asummary of MySQL syntax is available at:

SQL Transactions
176
Option Descriptionhttp://dev.mysql.com/doc/refman/5.0/en/sql-syntax.html
Table 59.4. MySQL Server Transactions Data Source Options
10. Click on the Save button to save your changes.
Zenoss creates a data point that corresponds to the total query time in milliseconds.
11. Click Test to verify that the database connection can be completed, and that the data returned from the queriesare correct.
See Zenoss Administration for more information about setting up thresholds and graphs. To create data points thatstore the results of queries, see the section titled "Data Points."
59.6. Storing Query Results
If any data is retrieved from the database that can be interpreted as a number, that number can be used as a datapoint. In select statements in which a column name is used, that column name becomes the name of the data point.In select statements in which no column name is specified (for example, aggregate functions such as count(*),sum(), or min()), the data point name returned is database-dependent:
• MySQL - The column name can be controlled with an 'AS' clause in the query. If used, then the column nameis the "cleaned up" result of the 'AS' clause; otherwise, it uses the format: 'q' + query number (beginning with0) + '_' + column number in the query (beginning with 0).
• All other databases - The column name uses the format: 'q' + query number (beginning with 0) + '_' + columnnumber in the query (beginning with 0).
Non-alphanumeric characters ([^za-zA-Z0-9_]) are removed from the column name to produce the data point name.Any query results that cannot be interpreted as a number are ignored, and the query numbers will not change.
For example, the queries:
select count(*) from Users;select UserName from Users; select count(*) * 4 from Users
return these results:
Queries completed successfully. | totalTime=2.13289260864 count=3.0 count4=12.0
Note
To use multiple queries (such as in the preceding example), they must be separated with a semicolon.
This example demonstrates multiple results from a single query:
select count(*) as count1, count(*)-1001 from history;
and returns these results:
Queries completed successfully. | totalTime=72.6099014282 count1=99894.0 count1001=98893.0
Notes:
• For SQL Server, use the format q*_* if no column name is found.
• The SQL 'as' renaming capability can be used to control the name of the data point.

SQL Transactions
177
59.7. TroubleshootingTo verify any queries, as well as any permissions or authentication issues, run the zensql.py command from thecommand line. Here's an example against the MySQL database on a Zenoss server:
cd $ZENHOME/ZenPacks/*ZenSQLTx*/Z*/z*/Z*./zensql.py -t mysql -H localhost -u zenoss -p zenoss -d events 'select \* from events.log;'Queries completed successfully. | totalTime=54.5899868011
Note
Single quotes (') are required around the SQL statement. Any wild card characters (such as *) must be escaped,as shown in the previous example.
For the zensql.py command, the database types understood are shown in the following table.
Name Database Type
mssql MS SQL Server
sybase Sybase
mysql MySQL Server
Table 59.5. zensql.py Database Types
59.8. Daemons
Type Name
Performance Collector zencommand
Table 59.6. Daemons

178
Chapter 60. Storage Base60.1. AboutThe StorageBase ZenPack contains base classes, and reports for ZenPacks that use those base classes.
The ZenPack includes these reports:
• Licenses - Shows the storage devices and installed licenses.
• Clients - Shows the devices that use the storage devices.
• Disk Firmware - After selecting a storage device, displays disk firmware information.
60.2. Prerequisites
Prerequisite Restriction
Zenoss Version Zenoss Version 3.0 or higher
Required ZenPacks ZenPacks.zenoss.StorageBase,ZenPacks.zenoss.DynamicView
Table 60.1. Prerequisites

179
Chapter 61. Sugar CRM61.1. About
SugarCRMMonitor is a ZenPack that allows System Administrators to monitor their Sugar CRM services.
61.2. Prerequisites
Prerequisite Restriction
Zenoss Version Zenoss Version 2.2 or higher
Required ZenPacks ZenPacks.zenoss.SugarCRMMonitor
Table 61.1. Sugar CRM Prerequisites
61.3. Enable Monitoring
61.3.1. Configuring Zenoss
All SugarCRM devices must exist under the /Devices/Web/SugarCRM device class.
1. Navigate to the device or device class under the /Devices/Server/Tomcat device class in the Zenoss interface.
• If applying changes to a device class:
a. Select the class in the devices hierarchy.
b. Click Details.
c. Select Configuration Properties.
• If applying changes to a device:
a. Click the device in the device list.
b. Select Configuration Properties.
2. Edit the appropriate configuration properties for the device or devices.
Name Description
zSugarCRMBase
zSugarCRMPassword Password for the zSugarCRMUsername user.
zSugarCRMTestAccount
zSugarCRMUsername Username allowed to log into the Sugar CRM server.
Table 61.2. SugarCRM Configuration Properties
3. Click Save to save your changes.
4. From the left panel, select Device under Monitoring Templates.
5. Select Bind Templates from the Action menu.
The Bind Templates dialog appears.
6. Move the SugarCRM template from the Available list to the Selected list.
7. Click Save.

Sugar CRM
180
The SugarCRM template should now be displayed under the Monitoring Templates for Device. You will now beable to start collecting the Sugar CRM metrics from this device.
8. Navigate to Graphs and you should see some placeholders for graphs. After approximately fifteen minutes youshould see the graphs start to become populated with information.
61.4. Daemons
Type Name
Performance Collector zencommand
Table 61.3. Daemons

181
Chapter 62. VMware ESX62.1. AboutThe VMwareESXMonitor ZenPack allows you to monitor VMware ESX hosts and their guests. This ZenPack:
• Extends ZenModeler to discover guests running on the ESX host.
• Provides screens and templates for collecting and displaying resources allocated to the guests.
This ZenPack requires the ZenossVirtualHostMonitor ZenPack to be installed as a prerequisite.
62.2. Prerequisites
Prerequisite Restriction
Zenoss Version Zenoss Version 2.2 or higher
Required ZenPacks ZenPacks.zenoss.VMwareESXMonitor,ZenPacks.zenoss.ZenossVirtualHostMonitor
Table 62.1. Prerequisites
62.3. Monitoring VMware ESX ServersTo monitor VMware ESX servers:
1. Make sure you have SNMP connectivity to your ESX 3 servers.
2. Create your ESX services using the /Servers/Virtual Hosts/ESX device class.
Note
If you have already modeled these servers, then remove and recreate them under the ESX device class. Donot move them.
3. Select the Guest menu and ensure that the guest hosts were found when the devices were added.
4. Using the VMware vSphere client, add Zenoss to the list of destinations for SNMP traps. (See Administration >vCenterServerSettings > SNMP.) For information about configuring traps for a stand-alone ESX 3 server, see"About SNMP and VMware Infrastructure" at:
http://www.vmware.com/pdf/vi3_35/esx_3/r35u2/vi3_35_25_u2_admin_guide.pdf
Notes:
• There is a link to the VMware Web interface on each ESX server Status page.
• If the name of the Guest under ESX is the same as the name of a device being monitored directly by Zenoss,a link is provided to take you directly to that device from the Guest list.
62.4. Enabling SNMP SubagentsESX servers (Version 4.x and higher) contain an SNMP subagent from VMware. This subagent provides all infor-mation related to VMware (such as virtual machines and their status). By default, the subagent is disabled.
The VMware SNMP subagent does not provide information about the ESX server itself (such as processes, memory,CPU, or performance data).

VMware ESX
182
Note
The VMware SNMP subagent cannot share port 161. If any other agent is using that port (usually the NET-SNMPagent), the subagent cannot start.
To fully monitor the ESX machine on your Zenoss server, you must enable both SNMP agents (NET-SNMP and theVMware subagent). Follow these steps to enable both agents using an SNMP proxy:
1. Stop the snmpd service through the service console (via SSH) on the ESX host:
service snmpd stop
2. Add a proxy line to the /etc/snmp/snmpd.conf file:
proxy -v 1 -c public udp:127.0.0.1:171 .1.3.6.1.4.1.6876
This line will use the snmpd service to access the VMware MIB on the subagent running at port 171.
3. Using the VMware vSphere CLI (command line interface), bind the VMware SNMP agent to port 171, and thenenable the subagent by using these commands:
vicfg-snmp.pl --server <hostname|IP address> --username <username> --password <password> -c public --port 171vicfg-snmp.pl --server <hostname|IP address> --username <username> --password <password> -E
4. Via SSH, go back to the ESX host. Restart the mgmt-vmware service (hostd) and the snmp service. On theESX host from the service, enter:
service mgmt-vmware restartservice snmpd restart
62.5. Daemons
Type Name
Modeler zenmodeler
Performance Collector zenperfsnmp
Table 62.2. Daemons

183
Chapter 63. VMware Virtual Hosts63.1. About
With Zenoss, you can collect information to monitor your VMware infrastructure. By entering a single set of connec-tion parameters, you allow Zenoss to:
• Obtain the names and properties of various entities in your VMware infrastructure
• Monitor metrics collected by VMware
• Retrieve VMware events
Zenoss extracts VMware information through the VMware Infrastructure (VI) SDK, VMware's SOAP interface to itsline of server virtualization products. The SDK can be accessed from an individual ESX server or vCenter Server(previously, VirtualCenter Server) instance, which can return information about many ESX servers.
For more information about VMware infrastructure, see VMware's Introduction to VMware Infrastructure
63.1.1. VMware Events
VMware records a wide range of events that are available through the VI SDK. Zenoss extracts these events andmakes them available in the event console.
Figure 63.1. VMware Events (Event Console)
The device column shows the ID of the VMware entity with which the event is associated, unless the event is specificto a guest VM. In that case, the Device column shows the ID of the host, and the Component column displays theID of the guest.
Zenoss maps the VMware event to the event class and assigns the event a severity level. The event class appearsin the Event Class column.
To see detailed event information and the original VMware event type, double-click the event row.

VMware Virtual Hosts
184
The VMware event type is the value shown for eventGroup.
Figure 63.2. Event Details
63.1.1.1. Migration Events
When a VMotion guest migrates from one host to another, VMware records events to signal its progress. Whena VmMigrated event occurs, it is duplicated to become two events, which are mapped to the /VMware/Migrationevent class in Zenoss. One event contains the originating host as the device; the other lists the destination hostas the device.
An event command (navigate to Events > Event Manager, and then select Commands in the left panel) reacts tothese events by remodeling the two hosts and generating an updated view of the guests. The time required toproduce updated guest lists (from the time migration completes) is between 30 seconds and four minutes.
63.2. Prerequisites
To implement this ZenPack, you must install:
• OpenSSL development package, Version 0.9.7 or higher
• VMware vSphere CLI (as described in the section titled Installing Prerequisite Libraries).
Prerequisite Restriction
Zenoss Version Zenoss Version 3.0 or higher
Required ZenPacks ZenPacks.zenoss.ZenVMware,ZenPacks.zenoss.StorageBase,ZenPacks.zenoss.DynamicView
VMware VI API Compatible with ESX Server 3.5, VirtualCenter Server 2.5, andESX Server 3i. It is not explicitly compatible with ESX Server3.0.x or VirtualCenter 2.0.x, or any previous versions.
Table 63.1. VMware Prerequisites

VMware Virtual Hosts
185
Warning
If the time on the monitored VC/ESX server is too far from the time on the box where the zenvmwareperf daemonis running, the daemon will not collect any data.
63.2.1. Installing Prerequisite Libraries
The VMware vSphere CLI is required for access to the resxtop command, which enables Zenoss to model andgather performance information about individual ESX servers.
VMware hosts (as seen in the /Devices/VMware/EndpointName/Hosts area) must be resolvable in DNS to obtainperformance information from the resxtop command.
Follow these steps to install the CLI and required software:
1. If you have not yet installed it, install the OpenSSL development package. For example, for an RPM-basedsystem, enter:
yum install openssl-devel
2. From your VMware account, download the VMware vSphere CLI.
Note
For downloads and documentation, go to:
http://downloads.vmware.com/d/details/vcli41/ZHcqYmRoaCpiZHRAag==
3. Copy the package to each Zenoss collector.
4. For each collector:
a. Expand the package file.
b. Run the following command to install the package:
./vmware-install.pl
c. As the zenoss user, run the following command to verify successful installation:
resxtop --server myESXServer --user userOnRemoteEsxServerAllowedToUseEsxTop -b -n 1 -a
The resxtop command prompts for a password.
d. Enter the password for a user with permissions on the remote ESX server.
If the command is working correctly, then a screen displays with several pages of command output.
e. Create a symbolic link from the location that the resxtop command was installed into the $ZENHOME/libex-ec directory. This allows the check_esxtop command to automatically determine which binary to run. Forexample:
cd $ZENHOME/libexecln -s PathToResxtop
f. Test the check_esxtop command by showing the VMs on the remote server:
$ZENHOME/ZenPacks/Ze*ZenVMware*/Z*/z*/Z*/libexec/check_esxtop --server=myEsxserver \ --user=userOnRemoteEsxServerAllowedToUseEsxTop --password=password --showvms
63.3. Enable Monitoring
Follow these steps to begin monitoring your VMware servers.

VMware Virtual Hosts
186
1.From Infrastructure > Devices, select Add VMware Infrastructure from .
The Add VMware dialog appears.
Figure 63.3. Add VMware Infrastructure Dialog
2. Enter parameters to connect to the ESX server or vCenter Server that will provide monitoring capabilities.
• Name or ID -Enter a name for the infrastructure to be monitored.
• Host - Enter the hostname of the server providing the VI SDK connections. This can be an individual ESXserver or the location of a vCenter Server instance.
• Use SSL - Select this option if the connection should be made by using SSL encryption.
• Username - Enter the user name used to authenticate.
• Password - Enter the password used to authenticate.
• Collector - Select the collector to use to retrieve information from the VI SDK endpoint.
3. Click Add.
Zenoss begins modeling the VMware infrastructure. It places the information in the device hierarchy under /Devices/VMware/ID, where ID is the value of the ID field you entered during setup.
63.4. Viewing VMware Devices
Zenoss represents these VMware entities as devices:
• Hosts (ESX servers)
• Resource Pools
• Data stores
• Clusters

VMware Virtual Hosts
187
Each of these categories is represented as a device class under the newly created organizer. For example, if the IDof an infrastructure is esxwin, then four device classes appear below /Devices/VMware/esxwin: Clusters, Datastores,Hosts, and ResourcePools.
Figure 63.4. VMware Device Classes
If the SDK endpoint is an individual ESX server, then the Clusters organizer will be empty. (A VMware cluster isa concept external to an individual host.)
63.5. Viewing Guest Virtual Machines
To view guest VMs on an ESX server:
1. Navigate to a device in the Hosts class.
2. Select VMware Guest in the host's component tree (in the left panel).
The Virtual Guest Devices list appears.
Figure 63.5. Virtual Guest Devices
In the list, the first column contains a link to the guest component, named the same name as the VM. (This is notnecessarily the same as the VM hostname.) If the VM has been modeled elsewhere in Zenoss, then a link to thatdevice appears in the Managed Device column.

VMware Virtual Hosts
188
As shown in the previous figure, none of the VMs are being monitored in their "native" device classes. For example,the guest named "ldap test box" is a Linux VM with the hostname "public-demo.zenoss.loc." If you add that deviceto /Devices/Server/Linux, a link will appear.
Figure 63.6. Virtual Guest Devices - Managed Device
Click the Name link to go to the Guest component status page, which shows the VM's relationships to other VMwareentities, and provides access to VMware-specific metrics and events.
Click the managed device link to go to the Device status page, which contains information about the device as aseparate Linux or Windows server. These two status pages link to each other.
63.6. Enabling Data Collection Using resxtopFollow these steps to enable gathering of VMware host and guest statistics.
63.6.1. Gathering VMware Host Statistics
By default, data collection using resxtop statistics is disabled. To enable it:
1. From the Zenoss interface, select Advanced, and then select Monitoring Templates.
2. Locate and select the VMwareHost_esxtop template.
3. For each of the data sources:
a. Click the data source to open it.
b. Select the Enabled option to enable data collection.
c. Click Save.
Data collection will begin shortly after update, followed by visible graph data.
For information about the collected data, see Section 7, "Batch Mode," in the document titled "Interpreting esxtopStatistics" at the following location:
http://communities.vmware.com/docs/DOC-9279
63.6.2. Gathering VMware Guest Statistics
By default, data collection using resxtop statistics is disabled. To enable it:
1. From the Zenoss interface, select Advanced, and then select Monitoring Templates.
2. Locate and select the VMwareGuest_esxtop template.
3. For each of the data sources:
a. Click the data source to open it.

VMware Virtual Hosts
189
b. Select the Enabled option to enable data collection.
c. Click Save.
Data collection will begin shortly after update, followed by visible graph data.
For information about the collected data, see Section 7, "Batch Mode," in the document titled "Interpreting esxtopStatistics" at the following location:
http://communities.vmware.com/docs/DOC-9279
63.7. Adding a Custom MetricIn Zenoss, metric-bearing VMware entities (such as Hosts, Guests, and Clusters) have associated templates. Thesetemplates define which metrics are gathered. By default, only a subset is collected; however, you can add more byadding data sources to the templates. Once created, you can then create custom graphs from these data sources.
To create a custom data source:
1. Navigate to Advanced > Monitoring Templates and select the template to which you want to add the data source.
2.From the Data Sources area, click to add a data source.
The Add Data Source dialog appears.
Figure 63.7. Add Data Source
3. Enter a name and select the VMware data source from the list of options, and then click Submit.
4. Double-click the newly created data source to edit it. Enter or select values:
• Event Key - Not used.
• Severity - Not used.
• Group, Counter, and Rollup Type - VMware-specific data points are determined by this trio of strings. Forinformation about each of these metrics, see the chapter titled "Performance Counters Reference" in theVI SDK Programming Guide.

VMware Virtual Hosts
190
• Instance - Certain metrics are further specified by an instance name. For example, the metric whose Group/Counter/Rollup Type triplet is Network/Network Data Receive Rate/average requires the name of the actualinterface for full specification. In Zenoss, this metric is represented by the data source nicRx on the templateVMwareNic. The VMwareNic template is bound to the individual host interfaces, each of whose ID is theinterface name. In this case, the instance name is ${here/instanceId}.
5. Click Save to save the new data source.
63.8. Moving VMware Devices Between Collectors
If you move a VMware device to a different collector, you must follow one of these procedures to force the changesto take effect:
• Restart the collector daemons. To do this, go to Advanced > Settings, select Daemons in the left panel, andthen click Restart in the row for each of these daemons:
• zenvmwaremodeler
• zenvmwareperf
• zenvmwareevents
Note
Alternatively, as user zenoss, enter the following commands to stop and then restart these Zenoss daemons:
zenvmwaremodeler restartzenvmwareperf restartzenvmwareevents restart
OR
• Navigate to the page for the organizer that represents the VMware endpoint (for example, Devices/VMware,myEndpoint), and then select Push Changes from the Action menu.
Figure 63.8. Push Changes
63.9. Daemons
Type Name
Modeler zenvmwaremodeler
Performance Collector zenvmwareperf

VMware Virtual Hosts
191
Type Name
Event Collector zenvmwareevents
Table 63.2. Daemons
63.9.1. Tuning Options
These collector daemons offer options for tuning performance. Use them to control data amounts and the rate atwhich data comes back to be modified.
• zenvmwareperf
Option Description
--callChunkSize=Value Specifies the number of performance requeststo submit at the same time.
--callChunkSleep=Value Specifies the time to sleep, in seconds, be-tween performance requests.
Table 63.3. Daemons
• zenvmwareevents
Option Description
--eventChunkSize=Value Specifies the number of events to gather at onetime.
--eventChunkSleep=Value Specifies the time to sleep, in seconds, be-tween event requests.
Table 63.4. Daemons

192
Chapter 64. WebSphere Application Server64.1. About
The WebSphere monitoring feature allows Zenoss to monitor IBM WebSphere Application Servers (WAS).
64.2. Prerequisites
Prerequisite Restriction
Zenoss Version Zenoss Version 2.2 or higher
Required ZenPacks ZenPacks.zenoss.ZenWebTx 2.5 or higher,ZenPacks.zenoss.WebsphereMonitor
Table 64.1. WebSphere Prerequisites
64.3. Enable Monitoring
64.3.1. Configure WAS for Monitoring
To successfully monitor WebSphere, you must have the Performance Monitoring Infrastructure (PMI) servlet in-stalled and enabled on your WebSphere instance. For more information, please see the IBM WebSphere docu-mentation.
64.3.2. Configure Zenoss1. Navigate to the device or device class under the /Devices/Server/Tomcat device class in the Zenoss interface.
• If applying changes to a device class:
a. Select the class in the devices hierarchy.
b. Click Details.
c. Select Configuration Properties.
• If applying changes to a device:
a. Click the device in the device list.
b. Select Configuration Properties.
2. Edit the appropriate configuration properties for the device or devices.
Property Description
zWebsphereURLPath Path to the PMI servlet on a WebSphere instance.
The default value is the default path on a WebSphere installa-tion:
wasPerTool/servlet/perfservlet
zWebsphereUser Used for HTTP basic authentication. This field is not required,and is empty by default.
zWebspherePassword Used for HTTP basic authentication. This field is not required,and is empty by default.

WebSphere Application Server
193
Property Description
zWebsphereAuthRealm Used for HTTP basic authentication. This field is not required,and is empty by default.
zWebsphereServer Used by the provided template to build the xpath queries for thedata to collect. You must supply a value for this field. There isno default value.
zWebsphereNode Used by the provided template to build the queries for the datato collect. You must supply a value for this field.
Table 64.2. WebSphere Configuration Properties
3. Click Save to save your changes.
4. Select Device under Monitoring Templates in the left panel.
5. From the Action menu, select Bind Templates.
The Bind Templates dialog appears.
6. Move the Websphere template from the Available list to the Selected list, and then click Save.
The Websphere template should now be displayed under the Monitoring Templates for Device. You will now beable to start collecting the WebSphere metrics from this device.
7. Navigate to Graphs and you should see some place holders for graphs. After approximately 15 minutes youshould see the graphs start to become populated with information.
64.4. Examples
Once the PMI module has been installed into WAS, you can generate the PMI XML file. You then can use this fileto complete the monitoring template.
This example shows how to obtain the configuration properties required for basic monitoring functionality. It furthershows how to add other metrics to be monitored.
You can generate the PMI XML file by browsing to this URL:
http://WASserver/wasPerfTool/servlet/perfservlet
Note
This is the default WAS server location. The URL should match the configuration property setting used in thetemplate.
where WASserver is the WAS server's host name or IP address.
The following example XML file results:
<?xml version="1.0" encoding="UTF-8"?><!DOCTYPE PerformanceMonitor SYSTEM "/wasPerfTool/dtd/performancemonitor.dtd"><PerformanceMonitor responseStatus="success" version="6.1.0.21"> <Node name="serverA"> <Server name="serverAB"> <Stat name="serverABC">... <Stat name="Dynamic Caching"> <Stat name="Object: ws/WSSecureMap"> <Stat name="Object Cache"> <Stat name="Counters">

WebSphere Application Server
194
<CountStatistic ID="21" count="0" lastSampleTime="1242827146039" name="HitsInMemoryCount" \ startTime="1242827146039" unit="N/A"/> <CountStatistic ID="28" count="5" lastSampleTime="1243610826245" name="MissCount" \ startTime="1242827146039" unit="N/A"/> </Stat> </Stat> </Stat> </Stat>... </Stat> </Server> </Node></PerformanceMonitor>
In the previous example, configuration properties settings are:
• zWebsphereNode: serverA
• zWebsphereServer: serverAB
You might want to add counters beyond the standard counters. For example, you might want to add the HitsIn-MemoryCount and MissCount counters (related to dynamic caching). To do this, you would add the following twillcommands to the Script tab of your WebSphere data source:
xpathextract HitsInMemoryCount '/PerformanceMonitor/Node[@name="${here/zWebsphereNode}"]/\Server[@name="${here/zWebsphereServer}"]/Stat[@name="server"]/Stat[@name="Dynamic Caching"]/\Stat[@name="Object: ws/WSSecureMap"]/Stat[@name="Object Cache"]/Stat[@name="Counters"]/\CountStatistic[@name="HitsInMemoryCount"]/attribute::count' xpathextract MissCount \'/PerformanceMonitor/Node[@name="${here/zWebsphereNode}"]/Server[@name="${here/zWebsphereServer}"]/\Stat[@name="server"]/Stat[@name="Dynamic Caching"]/Stat[@name="Object: ws/WSSecureMap"]/\Stat[@name="Object Cache"]/Stat[@name="Counters"]/CountStatistic[@name="MissCount"]/attribute::count'
After adding these commands, you would then add the data points for HitsInMemoryCount and MissCount, andthen add the data points to a graph.
64.5. Daemons
Type Name
Performance Collector zenwebtx
Table 64.3. Daemons

195
Chapter 65. Web-Based Synthetic Transactions65.1. AboutThe ZenWebTx ZenPack allows you to test the availability and performance of Web sites by performing some ofthe same activities performed by your user community. You create one or more tests that mimic user actions in aWeb browser. Zenoss then performs these tests periodically, creating events when a test fails or exceeds a timethreshold.
Additionally, Zenoss can record data for each test run, such as:
• Time required for the test to execute
• Time taken for any portion of the test to complete
• Values extracted from Web pages during the test
ZenWebTx uses a scripting language called Twill to describe the steps of a test. These steps include actions such as:
• Clicking a link
• Completing form fields
• Assertions, which check for the presence or absence of text on a page. In addition, you can extract data fromthe Web page and record the numeric values that are a part of these patterns
• Descriptions of data to collect during the test
You can write Twill commands manually. You also can use a Firefox add-on called TestGen4Web to record abrowser session that ZenWebTx then translates into Twill commands. The zenwebtx daemon processes the Twillcommands periodically, recording data and creating events as appropriate.
65.1.1. Data Points
Data produced by any Zenoss data source are called data points. WebTx data sources contain two default data points:
• totalTime – Number of seconds taken to complete the entire transaction.
• success – Returns 1 (success) or 0 (failure), depending on whether or not the transaction succeeded.
You can create other data points by using the extract and printTimer twill commands, which output data values whenthe twill commands are run. You must create new data points with the same name you used in those commandsto bring that data into Zenoss. For more information about the extract and printTimer twill commands, refer to theappendix titled Appendix A, twill Commands Reference.
ZenWebTx supports using XPath queries to extract data from XML documents. For more information about thisfeature, refer to the appendix in this guide titled Appendix A, twill Commands Reference.
65.1.2. Event Generation
There are several situations for which ZenWebTx will create events in Zenoss. These events use the componentand event class specified on the Data Source tab. These situations are:
• ZenWebTx is unable to retrieve a page during the transaction.
• One of the twill commands fails, such as finding text that does not exist or following a link that does not exist.
• The timeout (specified on the Data Source tab) is exceeded.
• A threshold defined for one of the data points in this data source is exceeded. Thresholds are defined in themonitoring template that contains the data source.

Web-Based Synthetic Transactions
196
65.2. Prerequisites
Prerequisite Restriction
Zenoss Version Zenoss Version 2.2 or higher
Required ZenPacks ZenPacks.zenoss.ZenWebTx
Table 65.1. Web Transactions Prerequisites
65.3. Enable Monitoring
To create a WebTx data source:
1.From the data sources area, click (Add Data Source).
2. In the Create Data Source dialog, enter the name of the new data source, and then select the data sourcetype WebTx.
3. Click Submit.
4. Select the data source to edit it. Enter information or make selections to specify how and when this data source'sWeb transactions are performed, and which data should be collected:
Option Description
Name Displays the name of the data source that you specified in theCreate Data Source dialog. This name is used in thresholdsand graph definitions to refer to the data collected by this datasource.
Source Type Set to WebTx, indicating that this is a synthetic Web transactiondata source. You cannot edit this selection.
Enabled Set to True (the default) to collect information from this datasource. You may want to set this value to False to disable da-ta sources when developing the data source, or when makingchanges to the Web application being tested.
Component Any time the Web transaction fails, Zenoss generates an event.Use this field to set the Component field of the generated event.
Event Class Select the event class of the event generated by this datasource. Normally, this is set to /Status/Web (according to thevalue set on the data source).
Timeout Specify the number of seconds that zenwebtx will attempt to ex-ecute this data source's commands before it generates an errorevent.
Cycle Time Specify the number of seconds that zenwebtx will wait betweenthe start of one test run and the start of the next.
User Agent Specify the text that zenwebtx will present to target Web sites toidentify itself.
Table 65.2. WebTx Data Source Options
5. Click Save to save the specified settings.
6. Select Script. From here, you will specify the details of the transaction. Information here also helps you debugtwill commands when setting up the data source.

Web-Based Synthetic Transactions
197
Enter information or make selections:
Option Description
Initial URL Specify the URL of the page where the transaction will start.This field frequently contains a TALES expression to refer to adevice's ID or IP address, such as http://${dev/id} or http://${dev/manageIp}.
For more information on TALES expressions, refer to the Ap-pendix in the Administratrion Guide titled TALES Expressions.
Initial User Specify the user name for authentication.
Initial Password Specify the user password for authentication.
Initial Authentication Realm Specify the basic HTTP authentication realm.
TestDevice Use this field to test and debug twill commands. Enter the ID ofa device, and then click Test Twill Commands to execute thetwill commands against the device. If you do not specify a de-vice, then Zenoss will select a device for you.
Upload Recording Upload a Web session recording generated by the FirefoxTestGen4Web add-on. Enter or browse to the recording loca-tion.
If you specify a file here, and then click Save, Zenoss translatesthe file to twill commands and replaces the contents of the TwillCommands field with the newly translated commands.
Twill Commands Specify the number of seconds that zenwebtx will wait betweenthe start of one test run and the start of the next.
Enter twill commands that Zenoss will execute to produce val-ues and events for the data source.
If you select this action, then the current contents of the TwillCommands field is completely replaced. Zenoss does not savethe replaced information.
See the Section 65.4, “Creating twill Commands” section formore information about twill commands.
Table 65.3. WebTx Script Settings
Note
If you provide values for Initial User, Initial Password, and Initial Authentication Realm, Zenoss will use thesecredentials before accessing the URL specified for Initial URL. All three (Initial User, Initial Password, andInitial Authentication Realm) must be present; otherwise, the values are ignored.
7. Click Save to save the data source.
65.4. Creating twill Commands
ZenWebTx uses a language called twill to specify the steps of a Web test. Each WebTx data source has a field thatcontains the twill commands that describe a Web transaction. You can create this list of twill commands manually,or you can record a session in a browser and use that as the basis for your data source.

Web-Based Synthetic Transactions
198
Some twill commands specify an action, such as following a specific link on a page or entering data in a formfield. Other twill commands specify a test, such as searching for specific text on a page or making sure the titledoes not contain specific text. The full range of available commands is described in the appendix Appendix A, twillCommands Reference.
65.4.1. Creating twill Commands from TestGen4Web
The TestGen4Web Firefox add-on allows you to record browser sessions. ZenWebTx can take these sessions andconvert them to twill, creating a starting point for developing ZenWebTx data sources.
Follow these general steps to record and convert a TestGen4Web session:
1. From the TestGen4Web toolbar in Firefox, use the Record and Stop buttons to record a session.
2. Use the Save button in the toolbar to save the session to a file.
3. From the Script page of a ZenWebTx data source in Zenoss, browse to and select your saved session.
4. Click Save to convert the TestGen4Web session to twill. The newly converted commands appear in the TwillCommands field on the page, replacing any previous twill commands in that area.
65.4.2. Creating twill Commands Manually
Even if you use TestGen4Web to initially create twill commands, you will frequently want to edit these commandsmanually to add data points or additional content checks. The Appendix A, twill Commands Reference describes indetail the commands that you can use. The Test Twill Commands button on the Script page is helpful when testingtwill commands as you create or edit them.
You also can execute twill commands interactively by using the twill-sh program from the command line. Thisprogram lets you enter commands one at a time and then inspect the pages that come back.
Invoke twill-sh with:
> PYTHONPATH=$ZENHOME/Products/ZenWebTx/lib$ZENHOME/Products/ZenWebTx/bin/twill-sh
Within twill-sh, use the help command to list available commands and see a command descriptions. Of particularinterest are these commands:
• showforms – Lists the forms on the page and the fields within each.
• showlinks – Lists the links on the page.
• show – Lists the source HTML from the page.
• exit – Quits the twill-sh program.
Often the most convenient way to use twill-sh is to create a text file that contains your twill commands. You can thenspecify that file on the command line when you invoke twill-sh. This lets you analyze problems that occur.
Invoke twill-sh with a text file as such:
> PYTHONPATH=$ZENHOME/Products/ZenWebTx/lib$ZENHOME/Products/ZenWebTx/bin/twill-sh -i myTwillCommands.txt
The -i option instructs twill-sh to stay in the twill shell rather than exiting when it finishes running the commands inthe myTwillCommands.txt file.
65.5. Monitoring through Proxy ServersZenWebTx can access Web servers through HTTP proxy servers and non-authenticating HTTPS proxy servers.

Web-Based Synthetic Transactions
199
To configure ZenWebTx to use a proxy, you must define the http_proxy and https_proxy environment variables.
1. Open the ~zenoss/.bashrc file.
2. Add the following lines:
export http_proxy=http://Address:Port/export https_proxy=http://Address:Port/
where Address is the address of your HTTP or HTTPS proxy server, and Port is the port on which your proxyserver listens.
65.5.1. Example Proxy Setup
HTTP and HTTPS proxies frequently listen on port 3128. If your proxy server is "my.proxyserver.loc" and it usesport 3128, then add these two lines to the ~zenoss/.bashrc file:
export http_proxy=http://my.proxyserver.loc:3128/export https_proxy=http://my.proxyserver.loc:3128/
65.5.2. Testing the Proxy Setup
You can test the proxy setup by using the twill-sh tool. twill-sh is an interpreter shell for the twill scripting language,which is used to define WebTx data sources.
After setting up the proxy information in the ~zenoss/.bashrc file, follow these steps to test your setup:
1. Make sure http_proxy and https_proxy are defined in your current shell:
$ source ~zenoss/.bashrc
2. Launch the twill shell:
PYTHONPATH=$PYTHONPATH:\$ZENHOME/ZenPacks/ZenPacks.zenoss.ZenWebTx/ZenPacks/zenoss/ZenWebTx/lib:\$ZENHOME/ZenPacks/ZenPacks.zenoss.ZenWebTx/ZenPacks/zenoss/ZenWebTx/bin/twill-sh
3. Try to retrieve a URL through HTTP or HTTPS. For example, to retrieve the Zenoss home page, enter:
go http://www.zenoss.com
You should see a message similar to this:
current page: http://www.zenoss.com
If an error message appears, then your proxy may not be correctly configured in the ~zenoss/.bashrc file.
4. Exit the twill shell:
exit
65.6. Daemons
Type Name
Performance Collector zenwebtx
Table 65.4. Daemons

200
Chapter 66. Windows Performance66.1. AboutZenWinPerf is a ZenPack that allows performance monitoring of Windows servers without an intermediary Windowsserver doing the data collection. ZenWinPerf provides the WinPerf Data Source, which uses a Windows performancecounter rather than an SNMP OID to specify the value to collect.
For more information on Windows Management Instrumentation (WMI), please see this Microsoft Technet Article.
Name Description
zenwin Watches Windows services and reports on status.
zeneventlog Watches Windows Event Log and generates events.
zenwinperf Collects Perfmon performance data.
zenmodeler This models Windows devices and has both SNMP and WMIsupport.
Table 66.1. Windows Monitoring Daemons
66.2. PrerequisitesPrerequisite Restriction
Zenoss Version Zenoss Version 2.3 or higher
Required ZenPacks ZenPacks.zenoss.WinModelerPlugins,ZenPacks.zenoss.ZenWinPerf
Supported OS Versions Windows XP, Windows 2000, Windows 2003, Windows Vista,Windows 2008
Table 66.2. Windows Performance Monitoring Prerequisites
66.3. Enable Monitoring
66.3.1. Defining Windows Credentials
A connection to a Windows device cannot be established without a valid set of credentials. The configuration prop-erties zWinUser and zWinPassword can be set per device or for an entire device class.
Tip
The user needs to be a member of the local administrators or of the domain administrators group unless the stepsin Section 66.8, “Configuring a Standalone Windows Device for a Non-Administrative Account” are followed.
To set these configuration properties:
1. Navigate to the device or device class in the Zenoss interface.
• If applying changes to a device class:
a. Select the class in the devices hierarchy.
b. Click Details.
c. Select Configuration Properties.
• If applying changes to a device:

Windows Performance
201
a. Click the device in the device list.
b. Select Configuration Properties.
2. Edit appropriate configuration properties for the device or devices.
Name Description
zWinUser Windows user with privileges to gather performance informa-tion. Like all Windows credentials, the domain should be speci-fied in the zWinUser entry. Use .\username for an account that isnot in the domain but only on the local computer.
zWinPassword Password for the above user.
Table 66.3. Windows Performance Configuration Properties
3. Click Save to save your changes.
66.3.2. Add Devices in Zenoss
The ZenWinPerf ZenPack includes a /Device/Server/Windows/WMI class that has several new device templatesbound. SNMP data collection is not used in this class.
To move a device to the /Device/Server/Windows/WMI class:
1. Select the device row in the devices list.
2. Drag the device to the class in the devices hierarchy.
66.4. Monitor Other Performance CountersTo create your own WinPerf data sources, follow these steps:
1. Navigate to either a new or an existing monitoring template and select New DataSource from the Data Sourcestable menu.
2. Enter a name for the data source, select WinPerf as the type and click OK.
3. Enter a Windows performance counter in the Perf Counter field. See Windows Perfmon counters for more details.
4. Click Save. Notice that a data point is created with the same name as the performance counter you selected.
5. If you wish you can test the counter by entering a device id in the Test Device field and clicking the Test button.
66.5. Testing Connections from WindowsThis procedure verifies that the username/password combination are correct, and that there is no firewall blockingthe connection.
1. Run the wbemtest command.
2. Click on the Connect… button.
3. In the Namespace field, enter:
\\HOST\root\cimv2
4. Enter login information in the User and Password fields.
5. Click on the Query field.
6. Enter the following to return a dialog with a list of services on the device.
select * from win32_service

Windows Performance
202
66.6. Testing Connections from ZenossThis procedure verifies that the username/password combination are correct, and that there is no firewall blockingthe connection. Since this is done from the Zenoss server, this test is a better approximation of how successfulZenoss will be in connecting to the Windows device.
As the zenoss user on the Zenoss server:
wmic -U 'user' //device 'select * from Win32_computerSystem'
The wmic command will then prompt you for the password.
Note
This procedure is only valid for Zenoss 2.3 or greater.
66.7. Modify Registry Settings for Firewalls in Secure Environments
Note
This procedure is only applicable for environments with firewalls and so most users will not need this step.
DCOM dynamically allocates one port per process. You need to decide how many ports you want to allocate toDCOM processes, which is equivalent to the number of simultaneous DCOM processes through the firewall. Youmust open all of the UDP and TCP ports corresponding to the port numbers you choose. You also need to open TCP/UDP 135, which is used for RPC End Point Mapping, among other things. In addition, you must edit the registry totell DCOM which ports you reserved. You do this with the HKEY_LOCAL_MACHINES\Software\Microsoft\Rpc\Internetregistry key, which you will probably have to create.
To allow remote registry access for the performance data to be read, see Controlling remote Performance Monitoraccess to Windows NT servers.
The following table shows the registry settings to restrict DCOMs port range to 10 ports.
Registry Key Type Setting
Ports REG_MULTI_SZ Range of port. Can be multiple linessuch as: 3001-3010 135
PortsInternetAvailable REG_SZ Y
UseInternetPorts REG_SZ Y
Table 66.4. Firewall and Registry Settings for DCOM
These registry settings must be established in addition to all firewall settings.
66.8. Configuring a Standalone Windows Device for a Non-Admin-istrative AccountMonitoring Windows devices normally requires an account with administrator-level privileges. For the Zenoss userwho wants to use a non-administrative account, several additional configuration steps must be performed on eachWindows device, or by using a Group Policy.
Zenoss uses the Windows Management Instrumentation (WMI) feature to collect Event Log and Service informa-tion in the Core edition and modeling information when using the Enterprise edition. In the Enterprise edition, theremote Windows registry API also is used to collect low-level performance monitor ("PerfMon") statistics. Both ofthese Windows sub-systems use the Microsoft Remote Procedure Call (MS-RPC) interface to connect to the Win-

Windows Performance
203
dows device and gather the appropriate information. MS-RPC handles the authentication on a per-packet or per-session basis, but ultimately the access granted is determined by the sub-systems involved with serving the remoteprocedure calls.
1. If the Windows firewall is in use, modify it to allow Remote Administration access. This will open the MS-RPCport and others as needed. Enter the following command at the command prompt:
netsh firewall set service RemoteAdmin enable
2. On Windows XP, Simple File Sharing must be disabled for machines that are not located within a Domain. Whenthis feature is enabled it causes all incoming MS-RPC connections to use the built-in Guest account, ratherthan the account credentials specified in the incoming call. This option may be found by going to Control Panel,opening the Folder Options applet and then choosing the View tab. In the Advanced Settings list, navigate tothe bottom until you see the Use simple file sharing (Recommended) option, and then disable it.
Figure 66.1. Windows XP Disable Simple File Sharing
3. Create a local account on the Windows device for monitoring. We assume in the remainder of these steps thatthis account was named zenossmon but any valid account name can be used. Place the account only in the Usersgroup and not in the Power Users or Administrators groups. Optionally, create a new user group for monitoringand use that group instead of the account in the remaining steps.
4. Give the zenossmon account DCOM access by running the dcomcnfg utility.

Windows Performance
204
Figure 66.2. Component Services COM Security Settings
a. In the Component Services dialog box, expand Component Services, expand Computers, and then right-click My Computer and click Properties .
b. In the My Computer Properties dialog box, click the COM Security tab.
c. Under Access Permissions, click Edit Limits. In the Access Permission dialog box, add the zenossmon ac-count to the list and ensure that the Remote Access checkbox is enabled, then click OK to close the dialog.
d. Under Launch and Activation Permissions, click Edit Limits. In the Access Permission dialog box, add thezenossmon account to the list and ensure that the Remote Launch and Remote Activation checkboxes areenabled, then click OK to close the dialog.
e. Click OK on the My Computer Properties dialog to save all changes.
5. Give the zenossmon account permissions to read the WMI namespace by using WMI Control.
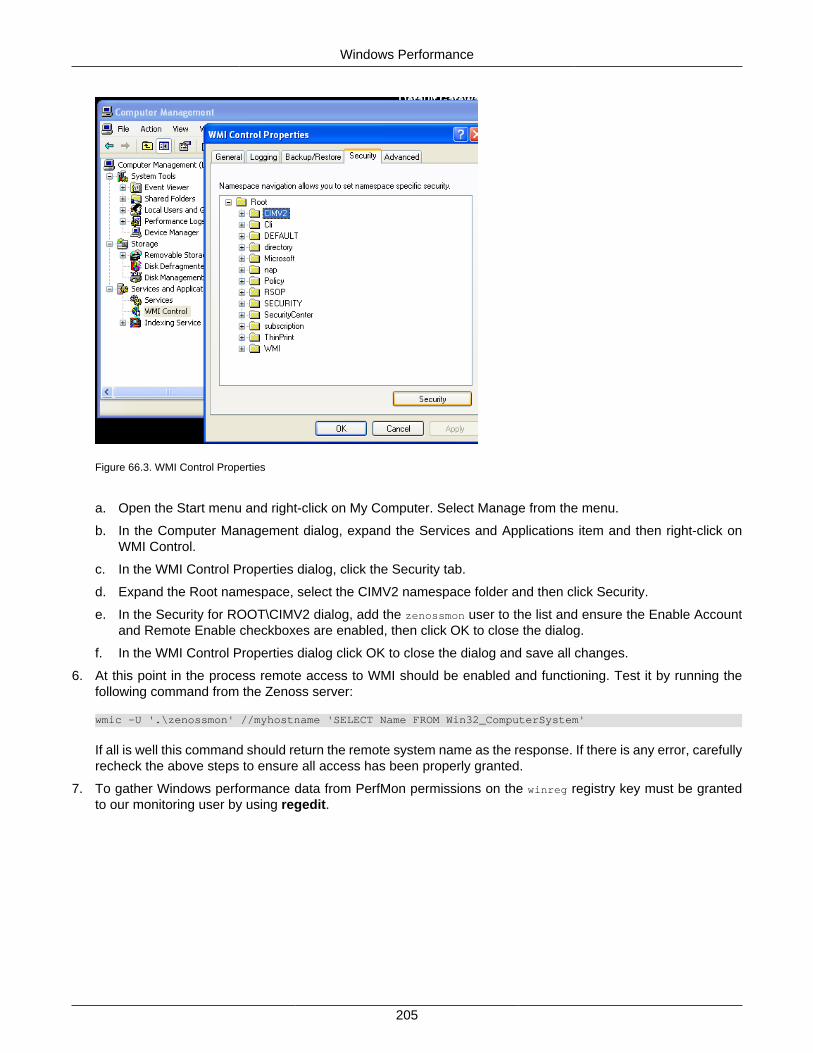
Windows Performance
205
Figure 66.3. WMI Control Properties
a. Open the Start menu and right-click on My Computer. Select Manage from the menu.
b. In the Computer Management dialog, expand the Services and Applications item and then right-click onWMI Control.
c. In the WMI Control Properties dialog, click the Security tab.
d. Expand the Root namespace, select the CIMV2 namespace folder and then click Security.
e. In the Security for ROOT\CIMV2 dialog, add the zenossmon user to the list and ensure the Enable Accountand Remote Enable checkboxes are enabled, then click OK to close the dialog.
f. In the WMI Control Properties dialog click OK to close the dialog and save all changes.
6. At this point in the process remote access to WMI should be enabled and functioning. Test it by running thefollowing command from the Zenoss server:
wmic -U '.\zenossmon' //myhostname 'SELECT Name FROM Win32_ComputerSystem'
If all is well this command should return the remote system name as the response. If there is any error, carefullyrecheck the above steps to ensure all access has been properly granted.
7. To gather Windows performance data from PerfMon permissions on the winreg registry key must be grantedto our monitoring user by using regedit.

Windows Performance
206
Figure 66.4. regedit and the winreg Key
a. Run regedit.
b. Browse to the HKEY_LOCAL_MACHINE\SYSTEM\CurrentControlSet\Control\SecurePipeServers\winreg key.
c. Right-click on the winreg key and choose Permissions.
d. Add the monitoring user to the permissions list and grant only Read permissions
8. Give the zenossmon account access to read the Windows Event Log.
Once the appropriate changes are made, test that Event Log access works with your zenossmon user. Run thefollowing from your Zenoss system:
wmic -U '.\zenossmon' //myhostname \'SELECT Message FROM Win32_NTLogEvent WHERE LogFile="Application"'
9. If you are using SP1 or newer with Windows Server 2003, then you must allow non-administrative users toaccess the service control manager to monitor services.
At a command prompt, run the following:
sc sdset SCMANAGERD:(A;;CCLCRPRC;;;AU)(A;;CCLCRPWPRC;;;SY)(A;;KA;;;BA)S:(AU;FA;KA;;;WD)(AU;OIIOFA;GA;;;WD)
Warning
The above command should be one line.
At this point you should be able to query Windows service status remotely by using the non-administrativeaccount. Test this by running the following command from your Zenoss system:

Windows Performance
207
wmic -U '.\zenossmon' //myhostname 'SELECT Name FROM Win32_Service'
66.9. Tuning Collector Daemon PerformanceZenWinPerf creates several configuration properties that control its behavior. Values for the configuration propertiesare initially set on the /Devices device class. As with any property, these values can be overridden in other deviceclasses and on individual devices themselves.
Property Setting
zWinPerfCycleSeconds This is how frequently (in seconds) zewinperf datasources are collected. By default this is set to 300 sec-onds.
Table 66.5. zenwinperf Daemon Configuration Properties
66.10. Enabling the NTLMv2 Authentication ProtocolTo enable the NTLMv2 authentication protocol for all Windows devices of a zenwin, zenwinperf, or zenevent logcollector, update collector configuration files:
Alternatively, from the command line add:
--ntlmv2auth
# Enable NTLMv2 authentication for Windows# Devices, default: False#ntlmv2auth False

208
Chapter 67. Zenoss Global Dashboard67.1. About
The Zenoss Global Dashboard is a standalone Web server that collects event and heartbeat data from the monitoredZenoss servers and aggregates them into a single view. Several portlets from the standard Zenoss dashboard areavailable:
• Device Issues - A list of all devices with serious events. The Server column displays the Zenoss server thatmonitors that device.
• Zenoss Sub-Systems - A list of monitored Zenoss instances. An event rainbow is displayed for each instance,showing a summary of active events.
• Zenoss Issues - A list of heartbeat issues from monitored Zenoss instances. Refer to the Zenoss AdministrationGuide for instructions on how to handle these events.
Note
ZenGlobe is a standalone Web server. It is not a ZenPack.
67.2. Prerequisites
Prerequisite Restriction
Other requirements The Python setuptools package is required.
Table 67.1. Zen Global Dashboard Prerequisites
67.3. Configuration
67.3.1. Install the ZenGlobe Web Server
Follow these steps to download and install the Zenoss Global Dashboard:
1. Download the latest version of the Zenoss Global Dashboard.
2. Extract the tarball and change to the created directory using the following commands:
tar xzf ZenGlobe-2.1.tar.gzcd ZenGlobe-2.1
3. Install ZenGlobe.
sudo python setup.py install
4. Prior to starting up the first time, ZenGlobe needs to know the port it should bind to and the Zenoss instanceit should use for authentication. Run:
sudo zenglobe configure
Enter the port to which you want ZenGlobe to bind. Make sure you have nothing else listening at that port.
When asked, enter the hostname of a running Zenoss instance that you want ZenGlobe to use for authentication.You can change this setting later, but in order to log in to ZenGlobe the first time, you will need to use theusername and password of a user from this Zenoss instance. Anyone with a login to this instance will be ableto view the ZenGlobe dashboard, but only the admin user will be able to edit settings.

Zenoss Global Dashboard
209
5. Start ZenGlobe using the command:
sudo zenglobe start
6. Check to make sure that ZenGlobe has started by accessing from your browser:
http://[ZenGlobe machine hostname]:[port]/
You should now see a ZenGlobe login screen.
67.3.2. Configure Remote Zenoss for Monitoring
For security reasons, ZenGlobe must be configured to log in to the remote Zenoss instances from which it gathersdata. By default, this is set to be zenglobe:zenglobe; however, it is a good idea to reconfigure ZenGlobe to use amore secure username and password combination.
1. In a browser, navigate to the Zenoss instance you wish to monitor, click Settings in the left navigation pane.
2. Select the Users tab.
3. From the table menu, select Add New User. Enter the username that you want ZenGlobe to use to log in to allZenoss instances (e.g. zenglobe). You may leave the Email field blank.
4. Click the OK button to save your changes.
67.3.3. Configure ZenGlobe to Monitor Remote Zenoss Instances1. Log in to the Zenoss Global Dashboard as the admin user.
Note
Only the admin user can modify ZenGlobe options.
2. Click the Configure... link in the top bar. The configuration box will slide down.
The options in this configuration box are as follows:
Name Description
Zenoss Servers The list of hostnames of the Zenoss instances ZenGlobe willmonitor.
Remote Login The user name and password ZenGlobe will use to ac-cess the remote Zenoss instances. By default, it is set tozenglobe:zenglobe. Follow the instructions in Section 67.3.2,“Configure Remote Zenoss for Monitoring” to set up matchingusers on each Zenoss instance to be monitored.
URL Template The template ZenGlobe will use to build the URL by which it ac-cesses monitored Zenoss instances. If you run your Zenoss in-stances on a different port, or serve them behind Apache withrewritten URLs, you will need to update this value to reflect thatchange.
Authentication Server The Zenoss instance against which ZenGlobe authenticates.You may also reset the port and authentication server using thesame command line option you used when initially configuringZenGlobe.
Table 67.2. Zen Global Dashboard Configuration Options

Zenoss Global Dashboard
210
67.4. Viewing a Remote Zenoss InstanceThe drop-down list on the extreme left of the top bar can be used to view monitored Zenoss instances from withinZenGlobe. Select the hostname of an instance from the list and then log in to the remote instance. You may returnto the ZenGlobe dashboard at any time by selecting it from the same drop-down list.
67.5. Ending a SessionClick Logout in the top bar to end your ZenGlobe session.

211
Chapter 68. ZenOperator Role68.1. AboutThe ZenOperatorRole ZenPack creates a new role (ZenOperator) suitable for use in Zenoss. For more informationabout using this role, please see the Zenoss Administration Guide section titled "Roles" in the chapter titled "Man-aging Users."
68.2. Prerequisites
Prerequisite Restriction
Zenoss Version Zenoss Version 2.2 or higher
Required ZenPacks ZenPacks.zenoss.ZenOperatorRole
Table 68.1. Zen Operator Role Prerequisites

212
Appendix A. twill Commands ReferenceA.1. About
twill is the language used by ZenWebTx to simulate user actions in a Web browser and to test pages retrieved bythe simulation. The following sections list the twill commands available for use in ZenWebTx data sources.
Note
For detailed information about ZenWebTx, see the chapter titled Chapter 65, Web-Based Synthetic Transactions.
Some twill commands produce text output (see the section titled Section A.4, “Display”). These commands do notaffect the execution of tests by ZenWebTx, and are useful in testing and debugging ZenWebTx data sources.
To see the output of commands that produce text output, click Test Twill Commands on the Script page of aZenWebTx data source.
Twill commands are divided among the following categories:
• Browsing
• Assertions
• Display
• Forms
• Cookies
• Debugging
• Other commands
A.2. Browsing• go <URL> - Visit the given URL.
• back - Return to the previous URL.
• reload - Reload the current URL.
• follow <link name> - Follow a link on the current page.
A.3. Assertions• code <code> - Assert that the last page loaded had this HTTP status. For example, ``code 200`` asserts that
the page loaded correctly.
• find <regexp> - Assert that the page contains this regular expression.
• notfind <regexp> - Assert that the page does not contain this regular expression.
• url <regexp> - Assert that the current URL matches the given regexp.
• title <regexp> - Assert that the title of this page matches this regular expression.
A.4. Display• echo <string> - Echo the string to the screen.
• redirect_output <filename> - Append all Twill output to the given file.

twill Commands Reference
213
• reset_output - Display all output to the screen.
• save_html [<filename>] - Save the current page's HTML to a file. If no filename is given, derive the filenamefrom the URL.
• show - Show the current page's HTML.
• showlinks - Show all of the links on the current page.
• showforms - Show all of the forms on the current page.
• showhistory - Show the browser history.
A.5. Forms• submit *[<n>]* - Click the nth submit button, if given; otherwise, submit via the last submission button clicked. If
nothing is clicked, then use the first submit button on the form. See the section titled Details on Form Handlingfor more information.
• formvalue <formnum> <fieldname> <value> - Set the given field in the given form to the given value. For read-only form widgets and controls, the click may be recorded for use by submit, but the value is not changed unlessthe config command has changed the default behavior. See config and the section titled "Details on FormHandling" for more information on the formvalue command.
For list widgets, you can use one of the following commands to select or de-select a particular value. To selecta value, enter the command in this format:
formvalue <formnum> <fieldname> +value
To de-select a value:
formvalue <formnum> <fieldname> -value
• fv - Abbreviation for the formvalue command.
• formaction <formnum> <action> - Change the form action URL to the given URL.
• fa - abbreviation for the fa command.
• formclear - Clear all values in the form.
• formfile <formspec> <fieldspec> <filename> [ <content_type> ]* - attach a file to a file upload button by filename.
A.6. Cookies• save_cookies <filename> - Save the current cookie jar to a file.
• load_cookies <filename> - Replace the current cookie jar with the specified file contents.
• clear_cookies - Clear all of the current cookies.
• show_cookies - show all of the current cookies. Sometimes useful for debugging.
A.7. Debugging
debug <what> <level> - Turn on or off debugging/tracing for various functions.
Enter the command in the form:
debug <what> <level>
where <what> is one of these options:
• HTTP - Show HTTP headers.

twill Commands Reference
214
• equiv-refresh - Test HTTP EQUIV-REFRESH headers.
• twill - Show twill commands.
and <level> is 0 (for off) or 1 (for on).
A.8. Other Commands• tidy_ok - Check to see if the tidy command runs on this page without any errors or warnings.
• exit *[<code>]* - Exit with the given integer code, if specified. The value of <code> defaults to 0.
• run <command> - Execute the specified Python command.
• run file <file1> [ <file2> ... ]* - Execute the specified files.
• agent - Set the browser's "User-agent" string.
• sleep [<seconds>] - sleep the given number of seconds. Defaults to 1 second.
• reset_browser - Reset the browser.
• extend_with <module> - Import commands from the specified Python module. This acts like ``from <module>import *`` does in Python.
For example, a function ``fun`` in ``ext module`` would be available as ``fun``. See *exam-ples/extend_example.py* for an example.
• add_auth <realm> <uri> <user> <password> - Add HTTP Basic Authentication information for the given realm/URL combination.
For example, “add_auth IdyllStuff http://www.idyll.org/ titus test” tells twill that a request from the authenticationrealm "IdyllStuff" under http://www.idyll.org/ should be answered with username 'titus', password 'test'. If the'with_default_realm' option is set to True, ignore 'realm'.
• config [<key> [<value>]] - Show/set configuration options.
• add_extra_headers <name> <value> - Add an extra HTTP header to each HTTP request.
• show_extra_headers - Show the headers being added to each HTTP request.
• clear_extra_headers - Clear the headers being added to each HTTP request.
A.9. Details on Form HandlingThe formvalue (or fv) and submit commands rely on a certain amount of implicit cleverness to do their work. Inodd situations, it is difficult to determine which form field formvalue will choose based on your field name, or whichform and field submit is going to "click" on.
Example 1
Following is the pseudocode for how formvalue and submit determine which form to use (function'twill.commands.browser.get_form')::
for each form on page:
if supplied regexp pattern matches the form name, select
if no form name, try converting to an integer N & using N-1 as
an index into the list or forms on the page (for example, form 1 is
the first form on the page).

twill Commands Reference
215
Example 2
Following is the pseudocode for how formvalue and submit determine which form field to use (function`twill.commands.browser.get_form_field`)::
search current form for control name with exact match to fieldname;
if single (unique) match, select.
if no match, convert fieldname into a number and use as an index, if
possible.
if no match, search current form for control name with regexp match to fieldname;
if single (unique) match, select.
if *still* no match, look for exact matches to submit-button values.
if single (unique) match, select.
Example 3
Following is the pseudocode for `submit`::
if a form was _not_ previously selected by formvalue:
if there is only one form on the page, select it.
otherwise, fail.
if a field is not explicitly named:
if a submit button was "clicked" with formvalue, use it.
otherwise, use the first submit button on the form, if any.
otherwise:
find the field using the same rules as formvalue
finally, if a button has been picked, submit using it;
otherwise, submit without using a button
A.10. ZenWebTx Extensions to twill
ZenWebTx adds several commands to the standard twill vocabulary.
A.10.1. twilltiming
twilltiming sets timers in a set of twill commands. If you then define a data point for this timer, you can graph andset thresholds on this timer value.
Use the following command to start a new timer:

twill Commands Reference
216
startTimer myTimerName
and then, to output the value:
printTimer myTimerName
Timer values should be output only once. So, to output the time from the start of the script to more than one pointin the script, you must use more than one timer. For example:
startTimer wwwZenossComstartTimer bothPagesgo http://www.zenoss.comprintTimer wwwZenossComstartTimer communityPagefollow "Community"printTimer communityPageprintTimer bothPages
To use these timers in Zenoss, create data points with the same name as the timers. In this example you couldcreate data points named wwwZenossCom, communityPage, and bothPages. You can then use these data pointsin Zenoss thresholds and graph definitions.
A.10.2. twillextract
twillextract extracts numeric values from Web pages during the transaction. To use twillextract, use the followingcommand to match the given regular expression to the current page:
extract <dataName> <regularExpression>
The value 1 or 0 is assigned to dataName depending on whether the regular expression matched or not.
Additionally, you can use Python's regular expression substring-matching syntax to extract substrings of the matchedtext. For example, http://www.zenoss.com contains a copyright notice near the bottom that looks like "Copyright(c) 2005-2009 Zenoss, Inc." The following twill commands use a regular expression to grab the second year fromthat notice:
go http://www.zenoss.comextract copyright "(?P<firstYear>[0-9]*)-(?P<secondYear>[0-9]*) Zenoss, Inc."
(?P<name>.....) is Python syntax for naming that particular part of the regular expression. The value extracted fromthat part of the matching text is given the name from the extract command, then a dash, then the name from thesub-pattern. In this example, copyright gets a value of 1 or 0 depending on whether the pattern was found on thepage or not, and copyright-firstYear and copyright-secondYear get the values extracted from the matched text. Touse these values in Zenoss you must create data points in the WebTx data source with the same name as thoseyou used in the extract command. In this case you would create data points named copyright, copyright-firstYearand copyright-secondYear. You can then create graph definitions and thresholds for these data points.
A.10.3. twillxpathextract
Zenoss uses the twillxpathextract command to extract numeric values from XML documents. To use twillxpathex-tract, add the following command to match and extract data using the given XPath expression:
xpathextract <dataName> <xpath>
where xpathextract is the command name, <dataName> is the name of the data point to which the value will map,and <xpath> is the xpath used to retrieve the data.
When applied to an XML document, the XPath expression must return a numeric value. This value is then assignedto the dataName data point.

twill Commands Reference
217
A.10.4. ignorescripts
ignorescripts strips javascript from visited pages before they are processed by twill. Although twill ignores script tags,it is possible for scripts to include strings that twill will interpret as HTML tags. Including the command extend_withignorescripts near the top of your twill commands will cause all script tags to be stripped, thereby avoiding this issue.