Embed Size (px)
Citation preview

ZIMMER HOLDINGS, INC.2011 ANNUAL REPORT
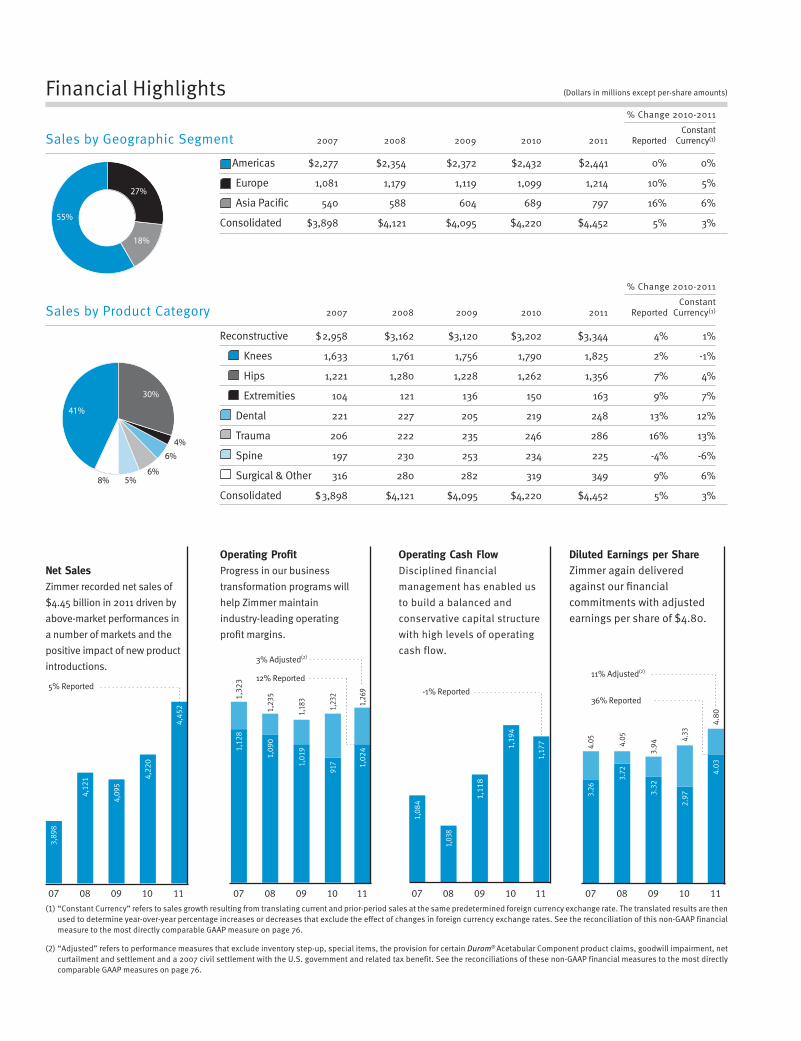
Operating Profi tProgress in our business transformation programs will help Zimmer maintain industry-leading operating profit margins.
Operating Cash FlowDisciplined financial management has enabled us to build a balanced and conservative capital structure with high levels of operating cash flow.
Diluted Earnings per ShareZimmer again delivered against our fi nancial commitments with adjusted earnings per share of $4.80.
Net SalesZimmer recorded net sales of $4.45 billion in 2011 driven by above-market performances in a number of markets and the positive impact of new product introductions.
(1) “Constant Currency” refers to sales growth resulting from translating current and prior-period sales at the same predetermined foreign currency exchange rate. The translated results are then used to determine year-over-year percentage increases or decreases that exclude the effect of changes in foreign currency exchange rates. See the reconciliation of this non-GAAP financial measure to the most directly comparable GAAP measure on page 76.
(2) “Adjusted” refers to performance measures that exclude inventory step-up, special items, the provision for certain Durom® Acetabular Component product claims, goodwill impairment, net curtailment and settlement and a 2007 civil settlement with the U.S. government and related tax benefit. See the reconciliations of these non-GAAP financial measures to the most directly comparable GAAP measures on page 76.
% Change 2010-2011
ConstantSales b y Geographic Segment 2007 2008 2009 2010 2011 Reported Currency(1)
Americas $2,277 $2,354 $2,372 $2,432 $2,441 0% 0%
Europe 1,081 1,179 1,119 1,099 1,214 10% 5%
Asia Pacific 540 588 604 689 797 16% 6%
Consolidated $3,898 $4,121 $4,095 $4,220 $4,452 5% 3%
% Change 2010-2011
ConstantSales b y Product Category 2007 2008 2009 2010 2011 Reported Currency(1)
Reconstructive $ 2,958 $3,162 $3,120 $3,202 $3,344 4% 1%
Knees 1,633 1,761 1,756 1,790 1,825 2% -1%
Hips 1,221 1,280 1,228 1,262 1,356 7% 4%
Extremities 104 121 136 150 163 9% 7%
Dental 221 227 205 219 248 13% 12%
Trauma 206 222 235 246 286 16% 13%
Spine 197 230 253 234 225 -4% -6%
Surgical & Other 316 280 282 319 349 9% 6%
Consolidated $ 3,898 $4,121 $4,095 $4,220 $4,452 5% 3%
Financial Highlights (Dollars in millions except per-share amounts)
27%
18%
55%
8% 5%6%
6%
41%
30%
4%
10090807
4.05
3.944.05
3.72
3.32
4.33
2.973.
26
10090807
1,03
8
1,1
18
1,19
4
1,08
4
10090807
1,23
5
1,18
31,32
3
1,09
0
1,01
9
1,23
291
7
1,12
8
10090807
4,12
1
4,09
5
4,22
0
3,89
8
11
1,26
91,
024
11
1,17
7
11
4.8
04.
03
11
4,45
2
5% Reported
3% Adjusted(2)
12% Reported
-1% Reported
11% Adjusted(2)
36% Reported

1
To Our Stockholders:
In 2011, Zimmer Holdings proudly celebrated our 10th anniversary as a publicly listed company on the New York Stock Exchange. On the day of our IPO in 2001, Zimmer’s market value made our spin-off the largest such transaction in healthcare at the time. In the ten years since, Zimmer has become the world’s leading company dedicated solely to musculoskeletal health – combining the industry’s most comprehensive and innovative product portfolio with robust clinical, health economics and commercial capabilities.
Our success is driven by a passion and commitment to one fundamental goal – to support healthcare professionals with products, technologies and training to help them restore mobil-ity and quality of life to millions of patients suff ering from debilitating joint pain and musculo-skeletal conditions. Through this unwavering commitment to patients, healthcare profession-als and institutions, Zimmer continues to drive sales growth, deliver leveraged earnings and increase value to our stockholders.
A Year of Global Growth
Zimmer achieved record sales in 2011 totaling $4.45 billion, with fully diluted adjusted earn-ings per share of $4.80. These results were driven by above-market performances in a number of geographies and product categories. The year was characterized by improved execution by our global sales teams and the ongoing positive impact of new product introductions across the portfolio.
In the United States, Zimmer’s performance was consistent with a challenging market in our core reconstructive franchises, and we continued to win share in certain of our emerging busi-nesses. Zimmer’s performance in established and emerging global markets reinforced our broad growth potential. We gained market share and delivered strong growth in a number of established markets in our Europe, Middle East and Africa, and Asia Pacifi c segments. Recent strategic investments to improve sales and operational performance contributed to impressive results in these regions.
Responding to the evolving needs of payors and governments in a number of major markets, Zimmer’s strong track record of clini-cal success enables us to demonstrate how our technologies improve outcomes while also reducing healthcare costs – a clear long-term value proposition for our Customers. In 2011, this value proposition resulted in Zimmer being the successful bidder in a number of large tenders in key European markets.
Emerging markets, including China, Brazil and Russia, among others, continued to generate strong growth in 2011, reinforcing their signifi cant long-term potential. Zimmer will continue to invest in emerging markets, including a focus on medical training and education programs designed to assist healthcare professionals in meeting the demands of growing patient populations. In late 2011, Zimmer announced a new Research and Development Center in China that will focus on innovation to meet the unique needs of Asian patients and clinicians.
Innovation Focus: Delivering More Personalized Solutions
Building on Zimmer’s unmatched experience in the development of implant technologies, we are accelerating the pace of our innovation program, producing clinically-relevant products that deliver long-term value to patients, hospitals and healthcare sys-tems. The foundation of Zimmer’s innovation strategy is to deliver personalized solutions across the musculoskeletal continuum of care. These solutions include customizable implant and instrumentation systems that enable surgeons to deliver a personal-ized care experience to every patient, including options for all lifestyle demands.
In line with this strategy, Zimmer continued to introduce a range of products across our portfolio in 2011, and the pipeline is populated with exciting innovations to come in 2012 and beyond. In Knees, we continue to see increased adoption of Zimmer® Patient Specific Instruments, which use MRI technology to develop personalized surgical guides for each patient. In early 2012, we expanded the application of this technology with the introduction of Patient Specific Instruments for partial knee arthroplasty.In our Hip business, the recently-introduced CLS® Brevius™ Hip stem builds on the more than 25 years of clinical history of the CLS Spotorno® stem with the addition of Kinectiv® technology, which off ers a range of neck options, enabling increased control for a more accurate restoration of the patient’s natural anatomy.
ZIMMER HOLDINGS, INC.2011 ANNUAL REPORT
On the Cover
Recently, mountaineering legend Lou Whittaker (left) and his surgeon Dr. Richard Moore (right) visited Zimmer headquarters in Warsaw, Indiana to share Lou’s comeback story following bilateral knee replacement surgery and to thank Zimmer employees for his NexGen Knees. The pair are photographed here at the Sun Valley Resort in Sun Valley, Idaho, their favorite skiing location. To learn more about Lou’s story, please turn to page 4.

2
In 2011, most of Zimmer’s emerging businesses delivered consistent above-market growth globally, supported by numerous new product introductions. In our Dental business, the introduction of the Trabecular Metal™ Dental Implant expands our application of this unique, proprietary material to a new treatment area. We also announced a strategic arrangement to provide Zfx Digital Dentistry Solutions, which positions us to enter the CAD/CAM crown and bridge market. In our Trauma division, we introduced several new components to the Zimmer Natural Nail® Family, which features anatomical designs and a wide variety of nail lengths and widths. We also completed the acquisition of the XtraFix ® External Fixation System in late 2011, which strengthens our posi-tion in the attractive external fi xation market. Moving into 2012, Zimmer’s Surgical business will benefi t from the addition of newly acquired product lines, including the Zimmer® Universal power system, and the STABLECUT® portfolio of surgical blades, which together represent an estimated $1 billion global market.
As Zimmer drives growth across our reconstructive and emerging businesses, we also continue to explore opportunities to expand our reach into early-intervention product solutions. In 2011, the DeNovo® NT Natural Tissue Graft for cartilage repair enjoyed continued success, with utilization in more than 3,500 cases to date. Also in 2011, Seikagaku Corporation received FDA approval for a single-injection hyaluronic acid injectable treatment for osteoarthritis pain of the knee. Zimmer plans to market this product in the United States through an exclusive distribution agreement with Seikagaku.
Meeting Global Economic Challenges Through Financial Discipline
Global economic conditions remained challenging in 2011, with low consumer confi dence and continued high unemployment rates refl ected in sustained rates of surgical procedure deferrals above that which would be considered normal. This trend par-ticularly aff ected the U.S. market where unemployment levels are linked to lower enrollment in private health insurance plans.
Looking ahead, Zimmer is not waiting for broader economic conditions to improve to deliver increased value to our stockholders. Our goal is to deliver consistent above market growth in each of our geographic segments and product categories. To succeed, we will maintain a rigorous focus on our strategic priorities, including product innovation, an ongoing emphasis on emerging markets, operational excellence and disciplined capital deployment.
To generate incremental resources to accelerate growth, we implemented several business transformation initiatives globally in 2011, including, among others, a management delayering initiative, a strategic sourcing consolidation and an optimization of manufacturing capabilities. Beyond operational improvements, these programs also demonstrate Zimmer’s commitment to build-ing the industry’s most performance-driven culture. Pursuing world-class benchmarks across the Company will accelerate growth and deliver increased value to stockholders.
Members of the Zimmer leadership team visited the New York Stock Exchange in August 2011 to ring the closing bell in honor of Zimmer’s 10th anniversary as an NYSE listed company. Pictured here from left to right are: Jim Crines, Stephen Ooi, Jeff McCaulley, Bruno Melzi, Derek Davis, David Dvorak, Chad Phipps, John McGoldrick (Zimmer Board Chairman), Bill Fisher, Cheryl Blanchard, Rick Stair and Norm Finch (All titles listed on the inside back cover).

3
The Next Decade: Expanding Leadership
Zimmer’s current portfolio comprises the industry’s most comprehensive, clinically-successful and customizable products, en-abling us to continue to create value for all stakeholders. The performance of Zimmer’s global sales teams in 2011 demonstrates what can be achieved when the industry’s leading musculoskeletal solutions are delivered with strong sales execution. Zimmer is dedicated to meeting our fi nancial commitments into the future, and to delivering both short- and long-term value to stockholders.
Zimmer is also committed to our role as an industry leader. In addition to providing training for nearly 25,000 healthcare profes-sionals in 2011, Zimmer sponsored more than 70 medical mission trips to support surgical teams providing care to remote and underserved areas around the world. Moreover, we expanded our industry-leading commitment to supporting multi-cultural and minority initiatives to address musculoskeletal healthcare disparities. Finally, we sponsored more than 300 Arthritis Foundation walks and related patient education events. In these and other areas, Zimmer is proud to be out front, helping to drive positive change, especially for those individuals who are in the greatest need.
The musculoskeletal care market remains one of the most exciting and dynamic intersections of medicine and technology – and one that holds enormous opportunities to grow our Company while simultaneously making a valuable contribution to society. As we embark on our 85th anniversary as a Company serving the musculoskeletal market and our second decade as an independent, public company, our entire team has great pride and confi dence in knowing that Zimmer is uniquely positioned to provide health-care professionals with the world’s best products, technologies and training to help renew their patients’ lives.
John L. Mc Goldrick Chairman
David C. Dvorak President and Chief Executive Offi cer

44
Lou Whittaker is a mountain climbing legend. He was the expedition leader for the fi rst successful American ascent of the North Wall of Mt. Everest, and he has led expeditions to many of the highest mountains in the world, including more than 250 ascents of Mt. Rainier in his home state of Washington.
In 2004, after 40 years literally on the top of the world, Lou Whittaker began the most epic journey of his life – his comeback from debilitating knee pain.
“I’d been climbing and guiding people up the world’s highest mountains for almost half a century, but knee pain brought me down to earth,” Lou said. “I was reduced to lowering myself hand-over-hand on the railing just to get down a single fl ight of stairs.”
Based on the recommendation of a fellow skier, Lou sought medical attention from his orthopaedic surgeon, Dr. Richard Moore.
“When I fi rst saw Lou, he could not stand for more than a couple of minutes at a time,” said Dr. Moore.
Over the next few months, Dr. Moore replaced both of Lou’s knees with Zimmer NexGen knees, the world’s most trusted knee replacement system.
The Lou Whittaker Comeback Story
“As an orthopaedic surgeon, it is important to take the time to understand and embrace a patients’ dreams for recovery,” Dr. Moore said. “Lou is a lifelong climber and skier, and his comeback dream was to return to those activities.”
“Working with Zimmer’s NexGen knee system, I was able to personalize a surgical approach to alleviate Lou’s pain, restore his mobility and help him return to an active lifestyle.”
“Within a few months, I could do things again that I had not done for 20 years,” Lou said. “Together with Dr. Moore, Zimmer gave me back my life.”
To celebrate his comeback, Lou and Dr. Moore led a group of friends on a 50-mile trek through the Himalayas in Southeast Asia in 2008. Included on that expedition was Lou’s long-time friend and climbing partner, Nawang Gombu, the fi rst person ever to climb Mt. Everest twice. Shortly after their trip, Gombu died from cancer in 2011.
“I waited too long to get my knees replaced, and I nearly missed the opportunity to make one last memorable climb with Gombu,” Lou said. “Now, I tell people all the time, if you need a joint replacement, get it done and get on with your life.”
On the comeback trail with Lou Whittaker: Lou cross country skiing in Sun Valley, Idaho (left); Lou and his wife Ingrid on Bald Mountain in Sun Valley, Idaho (center); and Lou taking a break during the Himalayas expedition.
d

UNITED STATES SECURITIES AND EXCHANGE COMMISSIONWashington, D.C. 20549
FORM 10-KANNUAL REPORT PURSUANT TO SECTION 13 OR 15(d)
OF THE SECURITIES EXCHANGE ACT OF 1934
For year ended December 31, 2011
Commission file number 001-16407
ZIMMER HOLDINGS, INC.(Exact name of registrant as specified in its charter)
Delaware 13-4151777(State of Incorporation) (IRS Employer Identification No.)
345 East Main Street Warsaw, Indiana 46580
(Address of principal executive offices) (Zip Code)
Registrant’s telephone number, including area code: (574) 267-6131
Securities registered pursuant to Section 12(b) of the Act:
Title of each class Name of each exchange on which registeredCommon Stock, $.01 par value New York Stock Exchange
Securities registered pursuant to Section 12(g) of the Act: None
Indicate by check mark if the registrant is a well-known seasoned issuer, as defined in Rule 405 of the Securities Act. Yes Í No ‘
Indicate by check mark if the registrant is not required to file reports pursuant to Section 13 or Section 15(d) of the Act. Yes ‘ No Í
Indicate by check mark whether the registrant (1) has filed all reports required to be filed by Section 13 or 15(d) of the SecuritiesExchange Act of 1934 during the preceding 12 months (or for such shorter period that the registrant was required to file suchreports), and (2) has been subject to such filing requirements for the past 90 days. Yes Í No ‘
Indicate by check mark whether the registrant has submitted electronically and posted on its corporate Web site, if any, every InteractiveData File required to be submitted and posted pursuant to Rule 405 of Regulation S-T (§ 232.405 of this chapter) during the preceding12 months (or for such shorter period that the registrant was required to submit and post such files). Yes Í No ‘
Indicate by check mark if disclosure of delinquent filers pursuant to Item 405 of Regulation S-K is not contained herein, and will notbe contained, to the best of the registrant’s knowledge, in definitive proxy or information statements incorporated by reference inPart III of this Form 10-K or any amendment to this Form 10-K. ‘
Indicate by checkmark whether the registrant is a large accelerated filer, an accelerated filer, a non-accelerated filer or a smallerreporting company. See the definitions of “large accelerated filer”, “accelerated filer” and “smaller reporting company” in Rule12b-2 of the Exchange Act. (Check One):
Large accelerated filer Í Accelerated filer ‘ Non-accelerated filer ‘ Smaller reporting company ‘
(Do not check if a smaller reporting company)
Indicate by checkmark whether the registrant is a shell company (as defined Exchange Act Rule 12b-2). Yes ‘ No Í
The aggregate market value of shares held by non-affiliates was $12,030,750,799 (based on the closing price of these shares on theNew York Stock Exchange on June 30, 2011 and assuming solely for the purpose of this calculation that all directors and executiveofficers of the registrant are “affiliates”). As of February 10, 2012, 178,122,539 shares of the registrant’s $.01 par value commonstock were outstanding.
Documents Incorporated by Reference
Document Form 10-K
Portions of the Proxy Statement with respect to the 2012 Annual Meeting of Stockholders Part III
ZIMMER HOLDINGS, INC. 2011 FORM 10-K ANNUAL REPORT
Cautionary Note About Forward-Looking StatementsThis Annual Report on Form 10-K includes “forward-looking” statements within the meaning of federal securities laws.
Forward-looking statements can be identified by the fact that they do not relate strictly to historical or current facts. They ofteninclude words such as “may,” “will,” “should,” “would,” “could,” “anticipate,” “expect,” “plan,” “seek,” “believe,” “predict,”“estimate,” “potential,” “project,” “target,” “forecast,” “intend,” “strategy,” “future,” “opportunity,” and similar expressions.Forward-looking statements are based on current expectations and assumptions that are subject to risks and uncertainties whichmay cause actual results to differ materially from the forward-looking statements. A detailed discussion of risks and uncertaintiesthat could cause actual results and events to differ materially from such forward-looking statements is included in the section titled“Risk Factors” (refer to Part I, Item 1A of this report). Readers of this report are cautioned not to place undue reliance on theseforward-looking statements. While we believe the assumptions on which the forward-looking statements are based are reasonable,there can be no assurance that these forward-looking statements will prove to be accurate. We expressly disclaim any obligation toupdate or revise any forward-looking statements, whether as a result of new information, future events or otherwise. You areadvised, however, to consult any further disclosures we make on related subjects in our Quarterly Reports on Form 10-Q andCurrent Reports on Form 8-K.
Table of Contents Page
PART I 3
Item 1. Business 3
Item 1A. Risk Factors 13
Item 1B. Unresolved Staff Comments 18
Item 2. Properties 19
Item 3. Legal Proceedings 19
Item 4. [Removed and Reserved] 19
PART II 20
Item 5. Market for the Registrant’s Common Equity, Related Stockholder Matters and Issuer Purchases of EquitySecurities 20
Item 6. Selected Financial Data 21
Item 7. Management’s Discussion and Analysis of Financial Condition and Results of Operations 22
Item 7A. Quantitative and Qualitative Disclosures About Market Risk 32
Item 8. Financial Statements and Supplementary Data 36
Item 9. Changes in and Disagreements With Accountants on Accounting and Financial Disclosure 69
Item 9A. Controls and Procedures 69
Item 9B. Other Information 69
PART III 70
Item 10. Directors, Executive Officers and Corporate Governance 70
Item 11. Executive Compensation 70
Item 12. Security Ownership of Certain Beneficial Owners and Management and Related Stockholder Matters 70
Item 13. Certain Relationships and Related Transactions and Director Independence 70
Item 14. Principal Accounting Fees and Services 70
PART IV 71
Item 15. Exhibits, Financial Statement Schedules 71
2

ZIMMER HOLDINGS, INC. 2011 FORM 10-K ANNUAL REPORT
PART I
ITEM 1. Business
OVERVIEW
We are a global leader in the design, development,manufacture and marketing of orthopaedic reconstructive,spinal and trauma devices, biologics, dental implants andrelated surgical products. We also provide other healthcarerelated services. In this report, “Zimmer,” “we,” “us,” “our” andsimilar words refer collectively to Zimmer Holdings, Inc. and itssubsidiaries. Zimmer Holdings refers to the parent companyonly.
Zimmer Holdings was incorporated in Delaware in 2001.Our history dates to 1927, when Zimmer ManufacturingCompany, a predecessor, was founded in Warsaw, Indiana. OnAugust 6, 2001, Zimmer Holdings was spun off from its formerparent and became an independent public company.
CUSTOMERS, SALES AND MARKETING
Our primary customers include orthopaedic surgeons,neurosurgeons, oral surgeons, dentists, hospitals, stockingdistributors, healthcare dealers and, in their capacity asagents, healthcare purchasing organizations or buying groups.These customers range from large multinational enterprises toindependent clinicians and dentists.
We have operations in more than 25 countries and marketproducts in more than 100 countries, with corporateheadquarters in Warsaw, Indiana, and more than 100manufacturing, distribution and warehousing and/or officefacilities worldwide. We manage our operations through threemajor geographic segments — the Americas, which iscomprised principally of the U.S. and includes other North,Central and South American markets; Europe, which iscomprised principally of Europe and includes the Middle Eastand Africa markets; and Asia Pacific, which is comprisedprimarily of Japan and Australia and includes other Asian andPacific markets.
We market and sell products through three principalchannels: 1) direct to healthcare institutions, such as hospitalsor direct channel accounts; 2) through stocking distributorsand healthcare dealers; and 3) directly to dental practices anddental laboratories. With direct channel accounts, inventory isgenerally consigned to sales agents or customers. With sales tostocking distributors, healthcare dealers, dental practices anddental laboratories, title to product passes upon shipment orupon implantation of the product. Direct channel accountsrepresented approximately 80 percent of our net sales in 2011.No individual direct channel account, stocking distributor,healthcare dealer, dental practice or dental laboratoryaccounted for more than 1 percent of our net sales for 2011.
We stock inventory in our warehouse facilities and retaintitle to consigned inventory in sufficient quantities so thatproducts are available when needed for surgical procedures.Safety stock levels are determined based on a number offactors, including demand, manufacturing lead times andquantities required to maintain service levels. We also carry
trade accounts receivable balances based on credit terms thatare generally consistent with local market practices.
We utilize a network of sales associates, sales managersand support personnel, most of whom are employed orcontracted by independent distributors and sales agencies. Weinvest a significant amount of time and expense in trainingsales associates in how to use specific products and how tobest inform surgeons of product features and uses. Sales forcerepresentatives must have strong technical selling skills andmedical education to provide technical support for surgeons.
In response to the different healthcare systemsthroughout the world, our sales and marketing strategies andorganizational structures differ by region. We utilize a globalapproach to sales force training, marketing and medicaleducation to provide consistent, high quality service.Additionally, we keep current with key surgical developmentsand other issues related to orthopaedic surgeons,neurosurgeons, dentists and oral surgeons and the medicalprocedures they perform.
Americas. The Americas is our largest geographicsegment, accounting for $2,440.8 million, or 55 percent, of2011 net sales, with the U.S. accounting for 93 percent of netsales in this region. The U.S. sales force primarily consists ofindependent sales agents, most of whom sell productsexclusively for Zimmer. Sales agents in the U.S. receive acommission on product sales and are responsible for manyoperating decisions and costs. Sales commissions are accruedat the time of sale.
In this region, we contract with group purchasingorganizations and managed care accounts and have promotedunit growth by offering volume discounts to customerhealthcare institutions within a specified group. Generally, weare designated as one of several preferred purchasing sourcesfor specified products, although members are not obligated topurchase our products. Contracts with group purchasingorganizations generally have a term of three years, withextensions as warranted.
In the Americas, we monitor and rank independent salesagents across a range of performance metrics, including theachievement of certain sales targets and maintenance ofefficient levels of working capital.
Europe. The European geographic segment accountedfor $1,214.5 million, or 27 percent, of 2011 net sales, withFrance, Germany, Italy, Spain, Switzerland and the UnitedKingdom collectively accounting for 72 percent of net sales inthe region. This segment also includes other key markets,including Benelux, Nordic, Central and Eastern Europe, theMiddle East and Africa. Our sales force in this segment iscomprised of direct sales associates, commissioned agents,independent distributors and sales support personnel. InEurope, we emphasize the advantages of our clinically proven,established designs and innovative solutions and new andenhanced materials and surfaces. In most European countries,healthcare is sponsored by the government and therefore
3

ZIMMER HOLDINGS, INC. 2011 FORM 10-K ANNUAL REPORT
government budgets have a role in healthcare spending, whichcan affect our sales in this segment.
Asia Pacific. The Asia Pacific geographic segmentaccounted for $796.5 million, or 18 percent, of 2011 net sales,with Japan being the largest market within this segment,accounting for approximately 52 percent of the region’s sales.This segment also includes key markets such as Australia, NewZealand, Korea, China, Taiwan, India, Thailand, Singapore,Hong Kong and Malaysia. In Japan and most countries in theAsia Pacific region, we maintain a network of dealers, who actas order agents on behalf of hospitals in the region, and salesassociates, who build and maintain relationships withorthopaedic surgeons, neurosurgeons and dental surgeons intheir markets. These sales associates cover over 7,000hospitals in the region. The knowledge and skills of these salesassociates play a critical role in providing service, productinformation and support to surgeons. In November 2011 weannounced that we will establish a new research anddevelopment center in Beijing, China, which will focus onproducts and technologies to meet the unique needs of Asianpatients and their healthcare providers.
SEASONALITY
Our business is somewhat seasonal in nature, as many ofour products are used in elective procedures, which typicallydecline during the summer months and can increase at the endof the year once annual deductibles have been attained onhealth insurance plans.
DISTRIBUTION
We operate distribution facilities domestically in Warsaw,Indiana; Dover, Ohio; Statesville, North Carolina; Memphis,Tennessee; Carlsbad, California; and Austin, Texas andinternationally in Australia, Austria, Belgium, Canada, theCzech Republic, China, Finland, France, Germany, Hong Kong,India, Italy, Japan, Korea, Malaysia, the Netherlands, NewZealand, Portugal, Russia, Singapore, South Africa, Spain,Sweden, Switzerland, Taiwan, Thailand and the UnitedKingdom.
We generally ship our orders via expedited courier. We donot consider our backlog of firm orders to be material to anunderstanding of our business.
PRODUCTS
Our products include orthopaedic reconstructive, spinaland trauma devices, biologics, dental implants and relatedsurgical products.
We utilize our exclusive Trabecular Metal™ Technologyacross the majority of our product categories. Trabecular
Metal Material is a structural biomaterial with a cellulararchitecture that resembles bone and approximates itsphysical and mechanical properties more closely than otherprosthetic materials. The highly porous trabecularconfiguration is conducive to more normal bone formation andbone in-growth. Trabecular Metal Implants are fabricatedusing elemental tantalum metal and a patented vapor
deposition technique that creates a metallic strut configurationresembling cancellous bone with nano-textured surfacefeatures.
Orthopaedic Reconstructive Implants
Knee Implants
Total knee replacement surgeries typically include afemoral component, a patella (knee cap), a tibial tray and anarticular surface (placed on the tibial tray). Knee replacementsurgeries include first-time, or primary, joint replacementprocedures and revision procedures for the replacement,repair or enhancement of an implant or component from aprevious procedure. Knee implants are designed toaccommodate different levels of ligament stabilization of thejoint. While some knee implant designs, called cruciateretaining (CR) designs, require the retention of the posteriorcruciate ligament, other designs, called posterior stabilized(PS) and ultracongruent (UC) designs, provide joint stabilitywithout the posterior cruciate ligament. There are alsoprocedures for partial reconstruction of the knee, which treatlimited knee degeneration and involve the replacement of onlyone side, or compartment, of the knee with aunicompartmental knee prosthesis.
We offer a wide range of products for specialized kneeprocedures, including the following:
NexGen® Complete Knee Solution. The numberone selling knee brand in the world, the NexGen Knee productline is a comprehensive system for knee replacement surgerywhich has significant application across the continuum of carein aspects of primary and revision knee arthroplasty, includingCR, PS and revision procedures. The NexGen Knee Systemoffers joint stability, sizing and performance options in aunified system of interchangeable components that can betailored to an individual patient. The NexGen Knee Systemprovides surgeons with complete and versatile kneeinstrument options spanning multiple surgeon and treatmentphilosophies. The breadth and versatility of the NexGen KneeSystem allows surgeons to transition from one type of implantto another during surgery, according to the respective needs ofthe patient, and to support current surgical philosophies. Innational joint replacement registries, databases that track theperformance of artificial joints implanted in many thousands ofpatients, NexGen Knee replacement products are consistentlyreported to have among the lowest rates of revision surgeriesfor the most frequently used knee systems.
The NexGen CR product line is designed to be usedin conjunction with a functioning posterior cruciate ligament.Similar to the posterior stabilized design, the NexGen CR-FlexFixed Bearing Knee is designed to provide a greater range ofmotion for patients who require deep bending in their activitiesof daily living. The NexGen CR-Flex Femoral Componentsoffer a tissue balancing (flexion balancing) solution whichallows the surgeon to adjust component sizing and balance andstabilize the implant without removing additional bone orwasting critical procedure time.
4
ZIMMER HOLDINGS, INC. 2011 FORM 10-K ANNUAL REPORT
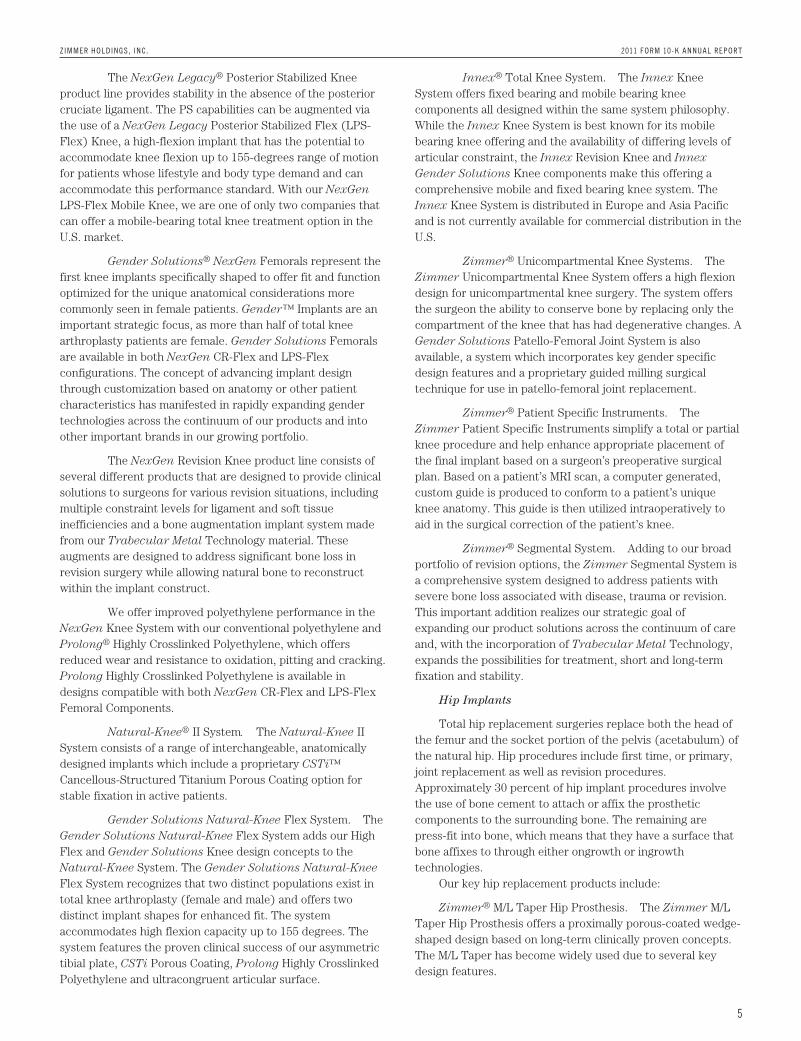
The NexGen Legacy® Posterior Stabilized Kneeproduct line provides stability in the absence of the posteriorcruciate ligament. The PS capabilities can be augmented viathe use of a NexGen Legacy Posterior Stabilized Flex (LPS-Flex) Knee, a high-flexion implant that has the potential toaccommodate knee flexion up to 155-degrees range of motionfor patients whose lifestyle and body type demand and canaccommodate this performance standard. With our NexGen
LPS-Flex Mobile Knee, we are one of only two companies thatcan offer a mobile-bearing total knee treatment option in theU.S. market.
Gender Solutions® NexGen Femorals represent thefirst knee implants specifically shaped to offer fit and functionoptimized for the unique anatomical considerations morecommonly seen in female patients. Gender™ Implants are animportant strategic focus, as more than half of total kneearthroplasty patients are female. Gender Solutions Femoralsare available in both NexGen CR-Flex and LPS-Flexconfigurations. The concept of advancing implant designthrough customization based on anatomy or other patientcharacteristics has manifested in rapidly expanding gendertechnologies across the continuum of our products and intoother important brands in our growing portfolio.
The NexGen Revision Knee product line consists ofseveral different products that are designed to provide clinicalsolutions to surgeons for various revision situations, includingmultiple constraint levels for ligament and soft tissueinefficiencies and a bone augmentation implant system madefrom our Trabecular Metal Technology material. Theseaugments are designed to address significant bone loss inrevision surgery while allowing natural bone to reconstructwithin the implant construct.
We offer improved polyethylene performance in theNexGen Knee System with our conventional polyethylene andProlong® Highly Crosslinked Polyethylene, which offersreduced wear and resistance to oxidation, pitting and cracking.Prolong Highly Crosslinked Polyethylene is available indesigns compatible with both NexGen CR-Flex and LPS-FlexFemoral Components.
Natural-Knee® II System. The Natural-Knee IISystem consists of a range of interchangeable, anatomicallydesigned implants which include a proprietary CSTi™Cancellous-Structured Titanium Porous Coating option forstable fixation in active patients.
Gender Solutions Natural-Knee Flex System. TheGender Solutions Natural-Knee Flex System adds our HighFlex and Gender Solutions Knee design concepts to theNatural-Knee System. The Gender Solutions Natural-Knee
Flex System recognizes that two distinct populations exist intotal knee arthroplasty (female and male) and offers twodistinct implant shapes for enhanced fit. The systemaccommodates high flexion capacity up to 155 degrees. Thesystem features the proven clinical success of our asymmetrictibial plate, CSTi Porous Coating, Prolong Highly CrosslinkedPolyethylene and ultracongruent articular surface.
Innex® Total Knee System. The Innex KneeSystem offers fixed bearing and mobile bearing kneecomponents all designed within the same system philosophy.While the Innex Knee System is best known for its mobilebearing knee offering and the availability of differing levels ofarticular constraint, the Innex Revision Knee and Innex
Gender Solutions Knee components make this offering acomprehensive mobile and fixed bearing knee system. TheInnex Knee System is distributed in Europe and Asia Pacificand is not currently available for commercial distribution in theU.S.
Zimmer® Unicompartmental Knee Systems. TheZimmer Unicompartmental Knee System offers a high flexiondesign for unicompartmental knee surgery. The system offersthe surgeon the ability to conserve bone by replacing only thecompartment of the knee that has had degenerative changes. AGender Solutions Patello-Femoral Joint System is alsoavailable, a system which incorporates key gender specificdesign features and a proprietary guided milling surgicaltechnique for use in patello-femoral joint replacement.
Zimmer® Patient Specific Instruments. TheZimmer Patient Specific Instruments simplify a total or partialknee procedure and help enhance appropriate placement ofthe final implant based on a surgeon’s preoperative surgicalplan. Based on a patient’s MRI scan, a computer generated,custom guide is produced to conform to a patient’s uniqueknee anatomy. This guide is then utilized intraoperatively toaid in the surgical correction of the patient’s knee.
Zimmer® Segmental System. Adding to our broadportfolio of revision options, the Zimmer Segmental System isa comprehensive system designed to address patients withsevere bone loss associated with disease, trauma or revision.This important addition realizes our strategic goal ofexpanding our product solutions across the continuum of careand, with the incorporation of Trabecular Metal Technology,expands the possibilities for treatment, short and long-termfixation and stability.
Hip Implants
Total hip replacement surgeries replace both the head ofthe femur and the socket portion of the pelvis (acetabulum) ofthe natural hip. Hip procedures include first time, or primary,joint replacement as well as revision procedures.Approximately 30 percent of hip implant procedures involvethe use of bone cement to attach or affix the prostheticcomponents to the surrounding bone. The remaining arepress-fit into bone, which means that they have a surface thatbone affixes to through either ongrowth or ingrowthtechnologies.
Our key hip replacement products include:
Zimmer® M/L Taper Hip Prosthesis. The Zimmer M/LTaper Hip Prosthesis offers a proximally porous-coated wedge-shaped design based on long-term clinically proven concepts.The M/L Taper has become widely used due to several keydesign features.
5

ZIMMER HOLDINGS, INC. 2011 FORM 10-K ANNUAL REPORT
Zimmer M/L Taper Hip Prosthesis with Kinectiv®
Technology. The Zimmer M/L Taper with Kinectiv
Technology is a system of modular stem and neck componentsdesigned to help the surgeon restore the natural hip jointcenter intraoperatively by addressing the key variables of leglength, offset and version independently.
Alloclassic® (Zweymüller®) Hip System. TheAlloclassic (Zweymüller) Hip System has become one of themost used, primary, cementless hip systems in the world. Thisis one of the few stems available today that is practicallyunchanged since its introduction in 1979. A new offset designwas added in 2004 and offers the surgeon increased capabilityto restore the patient’s anatomical joint movement.
CLS® Spotorno® Hip System. The CLS Spotorno
Stem is one of our best selling hip prostheses, especially in theEuropean markets. Additions to the product line provide thecapability for restoration of the physiological center of rotation.
CLS Brevius™ Hip Stem with Kinectiv
Technology. Introduced in 2011, this hip stem is based on theCLS Spotorno Stem, which has more than 25 years of clinicaluse. The new technology enables surgeons to better matchpatients’ individual anatomies with modular neck optionsdesigned for independent, intraoperative adjustments.
Fitmore® Hip Stem. The Fitmore Hip Stem offersthe surgeon a short, bone preserving stem. Maintaining bonestock is particularly important for patients who may undergo alater revision procedure. Its shape facilitates minimallyinvasive procedures.
Continuum® Acetabular System, Trilogy® ITAcetabular System and Allofit® IT Alloclassic AcetabularSystem. Each of these acetabular systems offer the surgeon achoice of advanced bearing options to meet the clinical andlifestyle needs of each patient. Bearing options includeLongevity® Highly Crosslinked Polyethylene, Metasul®
Metal-on-Metal Technology and a BIOLOX®1 deltaCeramic-on-Ceramic Technology (where Zimmer hasregulatory clearances). The acetabular systems also providesurgeons a choice of fixation method that accommodates theirsurgical philosophy. Continuum is now our most widely soldacetabular cup system.
Maxera® Cup. The Maxera Cup provides a large-head, ceramic-on-ceramic option for the younger and moreactive patient. The cup is an established hemispherical designthat provides increased stability with a familiar surgicaltechnique. The Maxera Cup presents orthopaedic surgeonswith a system that offers a high range of motion and alow-wear bearing to better enable the restoration of a patient’sactive lifestyle.
Trabecular Metal Modular Acetabular System. TheTrabecular Metal Modular Acetabular System incorporatesthe advanced fixation surface of Trabecular Metal Material. Inaddition, we offer a Trabecular Metal Acetabular Revision
1 Registered trademark of CeramTec GmbH
System that provides the surgeon with a variety of off-the-shelfoptions to address a wide range of bone deficienciesencountered during acetabular revisions and to achieve astable construct.
Extremity Implants
Our extremity portfolio, primarily shoulder and elbowproducts, is designed to treat arthritic conditions, soft tissueinjuries and fractures.
Our key products include:
Bigliani/Flatow® Complete Shoulder SolutionFamily. The Bigliani/Flatow Shoulder product linecombined with the Trabecular Metal Humeral Stem give us asignificant presence in the global shoulder implant market.
Trabecular Metal Glenoid. The Trabecular MetalGlenoid offers surgeons a glenoid component designed toimprove fixation. Trabecular Metal Material’s properties allowfor more normal bone formation and maintenance.
Trabecular Metal Reverse Shoulder System. TheTrabecular Metal Reverse Shoulder System incorporatesadvanced materials and design to offer improved biologicalingrowth potential through the utilization of Trabecular Metal
Technology, while addressing significant loss of rotator cufffunction. The reverse shoulder system is designed to restorefunction to patients who, because of debilitating rotator cufftears, are not candidates for traditional shoulder surgery andhave exhausted other means of repair.
Zimmer® Anatomical Shoulder™ System. TheAnatomical Shoulder System can be adjusted to eachpatient’s individual anatomy. This portfolio of productsincludes the Anatomical Shoulder Inverse/Reverse System,designed to address significant loss of rotator cuff function,and the Anatomical Shoulder Fracture System. Both theprimary and fracture shoulder implants can be converted to areverse shoulder without removal of the initial implant.
Coonrad/Morrey Total Elbow. The Coonrad/MorreyTotal Elbow product line is a family of elbow replacementimplant products to address patients with conditions of severearthritis or trauma.
Dental Implants
Our dental products division manufactures and/ordistributes: (1) dental reconstructive implants — forindividuals who are totally without teeth or are missing one ormore teeth; (2) dental restorative products — aimed atproviding a more natural restoration to resemble the originalteeth; and (3) dental regenerative products — for soft tissueand bone rehabilitation.
Dental Reconstructive Implants
Our dental reconstructive implant products and surgicaland restorative techniques include:
Tapered Screw-Vent® Implant System. Our highestselling dental product line provides the clinician a tapered
6

ZIMMER HOLDINGS, INC. 2011 FORM 10-K ANNUAL REPORT
geometry which resembles the natural shape of a tooth root.The Tapered Screw-Vent Implant System, with its two-stagedesign, was developed to minimize valuable chair time forrestorations. The Tapered Screw-Vent Implant System is atechnologically advanced dental implant featuring aproprietary internal hex connection, multiple lead threads forreduced insertion time and selective surface coatings. TheZimmer® One-Piece Implant System, designed to complementthe success of the Tapered Screw-Vent Implant System,enhances this product line by offering clinicians a fast,convenient restorative option.
AdVent® Implant System. Utilizing many features ofthe Tapered Screw-Vent Implant System, the AdVent ImplantSystem is a transgingival, one stage design that utilizes thesame surgical system as the Tapered Screw-Vent ImplantSystem, allowing the clinician to use both design conceptswithout incurring the added cost of a second surgical system.
Tapered SwissPlus® Implant System. Designed tomeet the needs of clinicians who prefer a transgingival, onestage, dental implant, the Tapered SwissPlus Implant Systemincorporates multiple lead threads for faster insertion time anda tapered body to allow it to be placed in tight interdentalspaces. The Tapered SwissPlus Implant System alsoincorporates an internal connection.
Dental Restorative Products
We commercialize products for the aesthetic marketaimed at providing a more natural restoration. We offer a fullline of prosthetic devices for each of the above dental implantsystems as well as a custom solution, as follows:
Zimmer Hex-Lock® Contour Abutment andRestorative Products. Designed to be used with our Tapered
Screw-Vent and Zimmer One-Piece Implant Systems, ourcontour lines are a solution for addressing the diversity ofpatients’ needs. Featuring prepared margins, titanium andceramic options and snap-on impression caps, our abutmentsare designed to simplify the restoration process, save time forclinicians and technicians and offer versatility.
Our Hex-Lock Short Abutment and RestorativeSystem is an all-inclusive solution that promotes posteriorrestorations. We also offer the Zimmer® Contour ZirconiaAbutment. Both are engineered for use with the TaperedScrew-Vent Implant System.
Dental Regenerative Products
We market the following product lines for use inregenerative techniques in oral surgery:
Puros® Allograft Products. The Puros biologicoffering is an allograft material, which in the case ofmineralized bone and dermal tissues, utilizes the Tutoplast®2
Tissue Processing Technique to provide exceptional bone andsoft tissue grafting material for use in oral surgery. ZimmerDental offers a number of distinct Puros Allograft products to
2 Registered trademark of RTI Biologics, Inc.
use together or separately for various bone and soft tissuegrafting needs: Puros Cancellous Particulate, Puros CorticalParticulate, Puros Block Allografts, Puros PericardiumMembranes, Puros Dermis Membranes, Puros DemineralizedBone Matrix (DBM) and Puros DBM Putty with Chips.
We distribute the Puros Allograft Products throughan exclusive, worldwide agreement with RTI Biologics, Inc.,which was amended and renewed in 2010.
Through this same agreement with RTI Biologics,Inc., we provide CopiOs® Pericardium Membrane in the U.S.Sourced from bovine pericardial tissue, the CopiOs
Pericardium Membrane provides the characteristics of naturaltissue and can be used as a direct substitute for Puros
Pericardium Membranes.
Spine Implants
Our Spine products division designs, manufactures anddistributes medical devices and surgical instruments to delivercomprehensive solutions for those with back or neck paincaused by degenerative conditions, deformities or traumaticinjury of the spine. We provide surgeons a broad range oftechnologies for posterior and anterior procedures in thecervical, thoracic and lumbar regions of the spine.
Zimmer Spine’s portfolio of spinal solutions includes:
PathFinder NXT ™ Minimally Invasive PedicleScrew System. Released in 2010, the PathFinder NXT
System builds on the legacy of the PathFinder® Device, apioneering technology in minimally invasive spinal fusionprocedures. The Pathfinder NXT System is designed to allowfor a mini-open or true percutaneous approach, depending onthe preferred surgeon technique and patient need. In addition,the PathFinder NXT System incorporates enhanced featuresthat provide improved efficiency in performing minimallyinvasive fusion procedures.
Zimmer Universal Clamp™ Spinal FixationSystem. The design of the Universal Clamp Implant allowsit to be used alongside traditional hooks, screws and wires totreat scoliotic deformities and correct complex spinalpathologies.
Sequoia® Pedicle Screw System. The Sequoia
System was developed to simplify surgical flow, reduceimplantation time and improve ergonomic tool design. Thispedicle screw system combines ergonomic instrumentationwith an effective design that reduces implant metal volume.
Ardis® Interbody System. The Ardis Implantfeatures a self-distracting nose, convex geometry and widerange of sizes. This versatile PEEK-OPTIMA®3 Deviceincorporates a large space for graft placement, plus anadvanced tooth design to effectively resist migration andexpulsion during procedures. Ardis Instrumentation was alsodesigned to streamline the surgical procedure and improvesurgeon comfort.
3 Registered trademark of Ivibio, Ltd.
7

ZIMMER HOLDINGS, INC. 2011 FORM 10-K ANNUAL REPORT
Trinica® Select Anterior Cervical PlatingSystem. The Trinica Select System is designed to simplifythe surgical procedure with the Secure-Twist® Anti-MigrationSystem, which provides visual confirmation of screw capture,as well as a wide variety of screw options to customize theconstruct depending on patient need.
Biological Products. Zimmer Spine offers a full lineof bone void filler products to accommodate most surgicalprocedures. Puros® Demineralized Bone Matrix is available inPutty and Putty with Chips formulations, and the CopiOs®
Bone Void Filler family of products includes synthetic bonegraft material in the form of sponges or pastes that are used tofill bone voids during spine surgery.
Dynesys® Dynamic Stabilization System. TheDynesys Implant family was designed to facilitate a morephysiologic approach to low back spinal stabilization. Thesystem threads flexible components, instead of traditional rigidtitanium rods, through pedicle screws in order to stabilizeaffected spinal segments in a more natural anatomic positionand to alleviate pain. The Dynesys Dynamic StabilizationSystem is currently only indicated for use as an adjunct tofusion in the U.S.
Wallis® Posterior Dynamic Stabilization System(available outside the U.S. only). The Wallis System is aspinal implant that was designed to stabilize the lumbar spinewhile preserving the anatomy and minimizing the need forbony resection. The Wallis System combines a PEEK-OPTIMA
Spacer linked to the vertebrae via a polyester band thatpermits an even distribution of stresses on bone.
Trauma
Trauma products include devices used to stabilizedamaged or broken bones and their surrounding tissues tosupport the body’s natural healing processes. Fractures aremost often stabilized using internal fixation devices such asplates, screws, nails, wires and pins, but may also be stabilizedusing external fixation devices. Biologics treatments are usedin conjunction with traditional trauma devices to encouragehealing and replace bone lost during an injury. We are focusedon providing exceptional options to treat a broad range oftraumatic injuries, addressing unmet clinical needs andimplementing next-generation technologies into our portfolioof trauma solutions.
Zimmer Trauma offers a comprehensive line of products,including:
Zimmer Natural Nail® System. The Zimmer
Natural Nail System includes a series of intramedullary nailsdesigned to address a broad range of long bone fractures. Thenails are anatomically shaped and incorporate a feature thatallows the screws to be linked to the nails, creating a constructeven in poor quality bone. Instrumentation for nail placementis designed to make it easy for surgeons to utilize the implantsas well as to address growing concerns with obesity andosteoporosis.
NCB® Polyaxial Locking Plate System. NCB PolyaxialLocking Plates provide surgeons with the ability to place screwswith polyaxial freedom and utilize both conventional and lockingtechnology in the treatment of complex fractures of the distalfemur, proximal humerus and proximal tibia. We continue toinvest in additional applications of this technology.
Zimmer® Periarticular Locking Plate System. TheZimmer Periarticular Locking Plate System combinesanatomic designs with locking screw technology to createconstructs for use in comminuted fractures or where deficientbone stock or poor bone quality is encountered. By combininglocking screw holes with compression slots, the plates can beused as both locking devices and fracture compressiondevices.
Zimmer® Universal Locking System. The Zimmer
Universal Locking System is a comprehensive system of miniand small fragment plates, screws and instruments for fracturefixation. The Universal Locking System plates resemblestandard plates, but have figure-8 shaped holes which allowthe plates to be used as compression plates, locked internalfixators or as an internal fixation system combining bothtechniques.
Zimmer® Cable-Ready® System. The Zimmer
Cable-Ready System includes a series of instruments, cablesand other implants that help a surgeon treat several differentfracture types, including those that occur around a previouslyimplanted device (periprosthetic). The cables are wrappedaround the bone and then secured, either to themselves or toplates, to provide fixation for fractured limbs.
Surgical
We develop, manufacture and market products thatsupport reconstructive, trauma, spine and dental implantprocedures, with a focus on Bone Cements, Surgical WoundSite Management and Blood Management. The Surgicalproduct portfolio includes:
PALACOS®4 Bone Cement. We have exclusive U.S.and Canada distribution rights for the PALACOS line of bonecement products manufactured by Heraeus Kulzer GmbH.Included in these brands are PALACOS R and PALACOS R+GBone Cements, as well as PALACOS LV and PALACOS LV+GBone Cements. The PALACOS R+G and PALACOS LV+Gproducts are bone cements with the antibiotic gentamicinpre-mixed in the formulation. Both are used by orthopaedicsurgeons to reduce the risk of postoperative infection insecond stage revisions. The PALACOS family’s history ofclinical success, fatigue strength, high visualization andhandling characteristics make it well-suited for orthopaedics.
Hi-Fatigue™5 Bone Cement. We have exclusiveEuropean and Asian distribution rights for the Hi-Fatigue lineof bone cement products manufactured by aap BiomaterialsGmbH & Co. KG. Included in these brands are Hi-Fatigue andHi-Fatigue G Bone Cements. The Hi-Fatigue G Bone Cement
4 Registered trademark of Heraeus Kulzer GmbH5 Registered trademark of aap Biomaterials GmbH & Co. KG
8

ZIMMER HOLDINGS, INC. 2011 FORM 10-K ANNUAL REPORT
utilizes the antibiotic gentamicin pre-mixed in the formulationand is used by orthopaedic surgeons to reduce the risk ofpostoperative infection.
A.T.S.® Automatic Tourniquet Systems. The A.T.S.
Tourniquet Systems Product Line is our family of tourniquetmachines and cuffs that are designed to safely create abloodless surgical field. The portfolio includes the A.T.S. 3000Tourniquet System, which utilizes proprietary technology todetermine the patient’s appropriate “Limb Occlusion Pressure”(LOP) based on the patient’s specific physiology. Throughreduction of a patient’s LOP, the clinician may reduce the riskof tissue and/or nerve damage. Complementing A.T.S.Tourniquet Systems machines is a wide range of cuffs thatprovide the flexibility to occlude blood flow safely withconvenience and accuracy for limbs of virtually every size andshape.
Pulsavac® Plus, Pulsavac Plus AC and Pulsavac
Plus LP Wound Debridement Systems. The Pulsavac
Systems are used for cleaning and debridement ofcontaminants and foreign matter from wounds usingsimultaneous irrigation and suction. All three Pulsavac
Systems are disposable to reduce the risk of crosscontamination. While Pulsavac Plus and Pulsavac Plus LPWound Debridement Systems are both battery-powered, thePulsavac Plus AC Wound Debridement System is a disposablesystem that is powered by a reusable AC power source to helpalleviate environmental concerns associated with batterydisposal.
Zimmer® Blood Reinfusion System (ZBRS) andHemovac® Blood Management System. These two bloodmanagement products are part of a larger family that supportsthe clinician in managing patient blood loss after a surgicalprocedure. The ZBRS product is a closed-loop postoperativesystem that effectively salvages and filters the patient’s ownblood to help reduce dependency on banked blood and/orpreoperative autologous donation.
HEALTHCARE CONSULTING
Our healthcare consulting services subsidiary, AcceleroHealth Partners, LLC (Accelero), is based in Canonsburg,Pennsylvania. Accelero consultants work to design acustomized program for each client that promotes the activeparticipation and collaboration of the physicians and thehospital-based departments with the goal of consistentlyproducing a superior outcome in the form of a growing,efficient and effective care delivery network. Currently,revenue related to Accelero services represents less than 1percent of our total net sales.
BIOLOGICS
Our research and development efforts include a Biologicsgroup based in Austin, Texas, with its own full-time staff anddedicated projects focusing on the development of a variety ofbiologic technologies for musculoskeletal applications. Thisgroup works on biological solutions to repair and regenerate
damaged or degenerated musculoskeletal tissues usingbiomaterials/cell therapies which offer the possibility oftreating damaged joints by biological repair rather thanreplacing them. A sampling of some of our key projects in theBiologics area is set forth below.
We are collaborating with ISTO Technologies, Inc. (ISTO)to develop chondral grafts for cartilage repair. ISTO createscell-based therapies for cartilage regeneration using cells fromjuvenile donor cartilage. DeNovo® NT Natural Tissue Graftrepresents our first product entry into the cartilage repairmarket. This tissue product provides particulated juvenilecartilage tissue for repair of articular cartilage defects of theknee, ankle, shoulder, hip, elbow and toe joints. More than1,600 procedures utilizing this innovative cartilage repairproduct were performed in 2011. Our biologics portfolio alsofeatures Chondrofix® Osteochondral Allograft designed toaddress osteochondral lesions in a single-stage procedure. TheChondrofix Implant is an osteochondral plug comprised ofarticular cartilage and subchondral bone.
Many musculoskeletal surgical procedures use bone graftsto help regenerate lost or damaged bone. Our Spine, Dentaland Trauma divisions have introduced a technologicallyadvanced all-human demineralized bone matrix, Puros DBMPutty and Putty with bone chips. This bone-derived allograftmaterial is used to fill bone voids or defects. It is placed intothe bone void where it is then completely replaced by naturalbone during the healing process.
RESEARCH AND DEVELOPMENT
We have extensive research and development activities todevelop new surgical techniques, materials, biologics andproduct designs. The research and development functionswork closely with our strategic brand marketing function. Therapid commercialization of innovative new materials, biologicsproducts, implant and instrument designs and surgicaltechniques remains one of our core strategies and continues tobe an important driver of sales growth.
We are broadening our product offerings in each of ourproduct categories and exploring new technologies withpossible applications in multiple areas. For the years endedDecember 31, 2011, 2010 and 2009, we spent $238.6 million,$218.5 million and $205.7 million, respectively, on researchand development. Our primary research and developmentfacility is located in Warsaw, Indiana. We have other researchand development personnel based in, among other places,Winterthur, Switzerland; Austin, Texas; Minneapolis,Minnesota; Carlsbad, California; Dover, Ohio; and Parsippany,New Jersey. As of December 31, 2011, we employed more than1,000 research and development employees worldwide.
We expect to continue to identify innovative technologies,which may include acquiring complementary products orbusinesses, establishing technology licensing arrangements orstrategic alliances.
9

ZIMMER HOLDINGS, INC. 2011 FORM 10-K ANNUAL REPORT
GOVERNMENT REGULATION AND COMPLIANCE
We are subject to government regulation in the countriesin which we conduct business. In the U.S., numerous laws andregulations govern all the processes by which medical devicesare brought to market. These include, among others, theFederal Food, Drug and Cosmetic Act and regulations issued orpromulgated thereunder. The Food and Drug Administration(FDA) has enacted regulations that control all aspects of thedevelopment, manufacture, advertising, promotion andpostmarket surveillance of medical products, including medicaldevices. In addition, the FDA controls the access of products tomarket through processes designed to ensure that onlyproducts that are safe and effective are made available to thepublic.
Most of our new products fall into an FDA classificationthat requires the submission of a Premarket Notification(510(k)) to the FDA. This process requires us to demonstratethat the device to be marketed is at least as safe and effectiveas, that is, substantially equivalent to, a legally marketeddevice. We must submit information that supports oursubstantial equivalency claims. Before we can market the newdevice, we must receive an order from the FDA findingsubstantial equivalence and clearing the new device forcommercial distribution in the U.S.
Other devices we develop and market are in a category(class) for which the FDA has implemented stringent clinicalinvestigation and Premarket Approval (PMA) requirements.The PMA process requires us to provide clinical and laboratorydata that establishes that the new medical device is safe andeffective. The FDA will approve the new device for commercialdistribution if it determines that the data and information inthe PMA constitute valid scientific evidence and that there isreasonable assurance that the device is safe and effective forits intended use(s).
All of our devices marketed in the U.S. have been clearedor approved by the FDA, with the exception of certainpre-amendment devices which were in commercial distributionprior to May 28, 1976. The FDA has grandfathered thesedevices, so new FDA submissions are not required.
The FDA has the authority to: halt the distribution ofcertain medical devices; detain or seize adulterated ormisbranded medical devices; or order the repair, replacementor refund of the costs of such devices and to seek criminalprosecution of executives for violation of FDA regulations.There are also certain requirements of state, local and foreigngovernments that we must comply with in the manufactureand marketing of our products.
In many of the foreign countries in which we market ourproducts, we are subject to local regulations affecting, amongother things, design and product standards, packagingrequirements and labeling requirements. Many of theregulations applicable to our devices and products in thesecountries are similar to those of the FDA. The membercountries of the European Union have adopted the EuropeanMedical Device Directive, which creates a single set of medicaldevice regulations for products marketed in all membercountries. Compliance with the Medical Device Directive and
certification to a quality system enable the manufacturer toplace a CE mark on its products. To obtain authorization toaffix the CE mark to a product, a recognized EuropeanNotified Body must assess a manufacturer’s quality systemsand the product’s conformity to the requirements of theMedical Device Directive. We are subject to inspection by theNotified Bodies for compliance with these requirements.
Further, we are subject to various federal and state lawsconcerning healthcare fraud and abuse, including false claimsand anti-kickback laws. These laws are administered by, amongothers, the U.S. Department of Justice, the Office of InspectorGeneral of the Department of Health and Human Services andstate attorneys general. Many of these agencies have increasedtheir enforcement activities with respect to medical devicemanufacturers in recent years. Violations of these laws arepunishable by criminal and/or civil sanctions, including, in someinstances, fines, imprisonment and, within the U.S., exclusionfrom participation in government healthcare programs,including Medicare, Medicaid and Veterans Administration(VA) health programs.
Our operations in foreign countries are subject to theextraterritorial application of the U.S. Foreign CorruptPractices Act (FCPA). Our global operations are also subjectto foreign anti-corruption laws, such as the UK Bribery Act,among others. As part of our global compliance program, weseek to address anti-corruption risks proactively.
Our facilities and operations are also subject to complexfederal, state, local and foreign environmental andoccupational safety laws and regulations, including thoserelating to discharges of substances in the air, water and land,the handling, storage and disposal of wastes and the clean-upof properties by pollutants. We do not expect that the ongoingcosts of compliance with these environmental requirementswill have a material impact on our consolidated earnings,capital expenditures or competitive position.
We continue to assess the impact that the healthcarereform legislation passed in 2010 by the U.S. federalgovernment will have on our business. The new law includes a2.3 percent excise tax on a majority of our U.S. sales that isscheduled to be implemented in 2013.
COMPETITION
The orthopaedics and broader musculoskeletal careindustry is highly competitive. In the global markets forreconstructive implants, trauma and related surgical products,our major competitors include: DePuy Orthopaedics, Inc. (asubsidiary of Johnson & Johnson), Stryker Corporation,Biomet, Inc., Smith & Nephew plc, Wright Medical Group, Inc.,Synthes, Inc. and Tornier, Inc.
In the Americas geographic segment, we and DePuyOrthopaedics, Inc., Stryker Corporation, Biomet, Inc., Smith &Nephew, Inc. (a subsidiary of Smith & Nephew plc), WrightMedical Group, Inc. and Synthes, Inc. account for a largemajority of the total reconstructive and trauma implant sales.
In the Asia Pacific market for reconstructive implant andtrauma products, we compete primarily with DePuyOrthopaedics, Inc., Stryker Corporation, Synthes, Inc.,
10

ZIMMER HOLDINGS, INC. 2011 FORM 10-K ANNUAL REPORT
Smith & Nephew plc and Biomet, Inc., as well as regionalcompanies, including Japan Medical Materials Corporation andJapan Medical Dynamic Marketing, Inc. Factors, such as thedealer system and complex regulatory environments, make itdifficult for smaller companies, particularly those that arenon-regional, to compete effectively with the market leaders inthe Asia Pacific region.
The European reconstructive implant and trauma productmarkets are more fragmented than the Americas or the AsiaPacific segments. The variety of philosophies held by Europeansurgeons regarding hip reconstruction, for example, hasfostered the existence of many regional European companies,including Aesculap AG (a subsidiary of B. Braun), WaldemarLINK GmbH & Co., KG and Mathys AG which, in addition to theglobal competitors, compete with us. Many hip implants sold inEurope are products developed specifically for the Europeanmarket. We will continue to develop and produce speciallytailored products to meet specific European needs.
In the spinal implant category, we compete globallyprimarily with the spinal and biologic business of Medtronic,Inc., DePuy Spine (a subsidiary of Johnson & Johnson),Synthes, Inc., Stryker Corporation, Biomet Spine (a subsidiaryof Biomet, Inc.) and NuVasive, Inc.
In the dental implant category, we compete primarily withNobel Biocare Holding AG, Straumann Holding AG, DentsplyInternational and Biomet 3i (a subsidiary of Biomet, Inc.).
Competition within the industry is primarily based ontechnology, innovation, quality, reputation and customerservice. A key factor in our continuing success in the futurewill be our ability to develop new products and improveexisting products and technologies.
MANUFACTURING AND RAW MATERIALS
We manufacture our products at twelve sites, includingWarsaw, Indiana; Winterthur, Switzerland; Ponce, Puerto Rico;Dover, Ohio; Statesville, North Carolina; Carlsbad, California;Parsippany, New Jersey; Shannon, Ireland; Etupes, France;Beijing and Xianning, China; and Geneva, Switzerland. We alsostrategically outsource some manufacturing to qualifiedsuppliers who are highly capable of producing components.
We believe that our manufacturing facilities are among thebest in our industry in terms of automation and productivityand have the flexibility to accommodate future growth. Themanufacturing operations at these facilities are designed toincorporate the cellular concept for production and toimplement tenets of a manufacturing philosophy focused oncontinuous improvement efforts in product quality, lead timereduction and capacity optimization. Our continuousimprovement efforts are driven by Lean and Six Sigmamethodologies. In addition, at certain of our manufacturingfacilities, many of the employees are cross-trained to perform abroad array of operations.
We generally target operating our manufacturing facilitiesat optimal levels of total capacity. We continually evaluate thepotential to in-source and out-source production as part of ourmanufacturing strategy to provide value to our stakeholders.
We have improved our manufacturing processes to protectour profitability and offset the impact of inflationary costs. Wehave, for example, employed computer-assisted robots andmulti-axis grinders to precision polish medical devices;automated certain manufacturing and inspection processes,including on-machine inspection and process controls;purchased state-of-the-art equipment; in-sourced core productsand processes; and negotiated cost reductions from third-partysuppliers.
We use a diverse and broad range of raw materials in themanufacturing of our products. We purchase all of our rawmaterials and select components used in manufacturing ourproducts from external suppliers. In addition, we purchasesome supplies from single sources for reasons of qualityassurance, sole source availability, cost effectiveness orconstraints resulting from regulatory requirements. We workclosely with our suppliers to assure continuity of supply whilemaintaining high quality and reliability. To date, we have notexperienced any significant difficulty in locating and obtainingthe materials necessary to fulfill our production schedules.
INTELLECTUAL PROPERTY
Patents and other proprietary rights are important to thecontinued success of our business. We also rely upon tradesecrets, know-how, continuing technological innovation andlicensing opportunities to develop and maintain ourcompetitive position. We protect our proprietary rightsthrough a variety of methods, including confidentialityagreements and proprietary information agreements withvendors, employees, consultants and others who may haveaccess to proprietary information. We own or control throughlicensing arrangements more than 5,000 issued patents andpatent applications throughout the world that relate to aspectsof the technology incorporated in many of our products.
EMPLOYEES
As of December 31, 2011, we employed more than 8,700employees worldwide, including more than 1,000 employeesdedicated to research and development. Approximately 4,700employees are located within the U.S. and approximately4,000 employees are located outside of the U.S., primarilythroughout Europe and in Japan. We have approximately 3,600employees dedicated to manufacturing our productsworldwide. The Warsaw, Indiana production facility employsmore than 1,400 employees. Approximately 150 U.S.employees are members of a trade union covered by acollective bargaining agreement.
We have a collective bargaining agreement with theUnited Steel, Paper and Forestry, Rubber Manufacturing,Energy, Allied Industrial and Service Workers InternationalUnion for and on behalf of Local 2737-15 covering employeesat the Dover, Ohio facility, which continues in effect untilMay 15, 2012.
11

ZIMMER HOLDINGS, INC. 2011 FORM 10-K ANNUAL REPORT
EXECUTIVE OFFICERS
The following table sets forth certain information with respect to our executive officers as of February 20, 2012.
Name Age Position
David C. Dvorak 48 President and Chief Executive Officer
Cheryl R. Blanchard, Ph.D. 47 Senior Vice President and Chief Scientific Officer
James T. Crines 52 Executive Vice President, Finance and Chief Financial Officer
Derek M. Davis 43 Vice President, Finance and Corporate Controller and Chief Accounting Officer
Jeffery A. McCaulley 46 President, Zimmer Reconstructive
Bruno A. Melzi 64 Chairman, Europe, Middle East and Africa
Stephen H.L. Ooi 58 President, Asia Pacific
Jeffrey B. Paulsen 51 Group President, Global Businesses
Chad F. Phipps 40 Senior Vice President, General Counsel and Secretary
Mr. Dvorak was appointed President, Chief Executive Officerand a member of the Board of Directors in May 2007. FromDecember 2005 to April 2007, he served as Group President,Global Businesses and Chief Legal Officer. Prior to that, hehad served as Executive Vice President, Corporate Services,Chief Counsel and Secretary, as well as Chief ComplianceOfficer, since October 2003. Mr. Dvorak joined Zimmer in2001.
Dr. Blanchard was appointed Senior Vice President and ChiefScientific Officer in December 2005. She is responsible forCorporate Research, Regulatory Affairs, Global MedicalAffairs, Biologics Research and Development and BiologicsSales and Marketing. Previously, she had served as VicePresident, Corporate Research and Clinical Affairs sinceOctober 2003. Dr. Blanchard joined Zimmer in 2000.
Mr. Crines was appointed Executive Vice President, Financeand Chief Financial Officer in May 2007. From December 2005to April 2007, he served as Senior Vice President, Finance,Operations and Corporate Controller and Chief AccountingOfficer. Prior to that, he had served as Senior Vice President,Finance/Controller and Information Technology since October2003. Mr. Crines joined Zimmer in 1995.
Mr. Davis was appointed Vice President, Finance and CorporateController and Chief Accounting Officer in May 2007. He hasresponsibility for internal and external reporting, planning andanalysis, and corporate and business unit accounting. FromMarch 2006 to May 2007, he served as Director, FinancialPlanning and Accounting. Prior to that, he had served asDirector, Finance, Operations and Logistics since December2003. Mr. Davis joined Zimmer in 2003.
Mr. McCaulley was appointed President, Zimmer Reconstructivein November 2008. He has overall responsibility for the GlobalReconstructive Division, including direct responsibility forGlobal Brand Management, Product Research andDevelopment, Quality and Regulatory Affairs, and MedicalTraining and Education, as well as Americas Marketing andSales. Prior to joining Zimmer, he served as President andChief Executive Officer of the Health Division of WoltersKluwer from 2005, Vice President and General Manager of theDiabetes Division of Medtronic, Inc. from 2002, and spent
14 years with GE Healthcare in numerous positions ofincreasing responsibility, including President and ChiefExecutive Officer of GE Clinical Services from 2000.
Mr. Melzi was appointed Chairman, Europe, Middle East andAfrica in October 2003. He is responsible for the sales,marketing and distribution of products in the European,Middle Eastern and African regions. Mr. Melzi joined Zimmerin 1990.
Mr. Ooi was appointed President, Asia Pacific in December2005. He is responsible for the sales, marketing anddistribution of products in the Asia Pacific region. Prior tothat, he had served as President, Australasia since September2003. Mr. Ooi joined Zimmer in 1986.
Mr. Paulsen was appointed Group President, Global Businessesin December 2009. He has responsibility for Zimmer Spine,Zimmer Dental, Zimmer Trauma and Zimmer Surgical. Prior tojoining Zimmer, Mr. Paulsen served as Chief Operating Officerof MPS Group, Inc., a privately held environmental servicesand facility management firm, from September 2008 toDecember 2009. Prior to that, he served as Group President ofTriMas Corporation, a specialty manufacturing company, fromJanuary 2007 to June 2008. Previously, Mr. Paulsen had held anumber of increasingly responsible executive roles at StrykerCorporation from 1996 to December 2006, including President,Orthopaedic Reconstructive Division.
Mr. Phipps was appointed Senior Vice President, GeneralCounsel and Secretary in May 2007. He has globalresponsibility for our legal affairs and he serves as Secretary tothe Board of Directors. Mr. Phipps also oversees ourGovernment Affairs, Corporate Marketing andCommunications and Public Relations activities. FromDecember 2005 to May 2007, he served as Associate GeneralCounsel and Corporate Secretary. Prior to that, he had servedas Associate Counsel and Assistant Secretary since September2003. Mr. Phipps joined Zimmer in 2003.
12
ZIMMER HOLDINGS, INC. 2011 FORM 10-K ANNUAL REPORT
AVAILABLE INFORMATION
Our Internet address is www.zimmer.com. We routinelypost important information for investors on our website in the“Investor Relations” section, which may be accessed from ourhomepage at www.zimmer.com or directly at http://investor.zimmer.com. We use this website as a means ofdisclosing material, non-public information and for complyingwith our disclosure obligations under Regulation FD.Accordingly, investors should monitor the Investor Relationssection of our website, in addition to following our pressreleases, SEC filings, public conference calls, presentationsand webcasts. Our goal is to maintain the Investor Relationswebsite as a portal through which investors can easily find ornavigate to pertinent information about us, free of charge,including:• our Annual Reports on Form 10-K, Quarterly Reports on
Form 10-Q, Current Reports on Form 8-K and amendmentsto those reports filed or furnished pursuant to Section 13(a)or 15(d) of the Securities Exchange Act of 1934, asamended (Exchange Act), as soon as reasonably practicableafter we electronically file that material with or furnish it tothe Securities and Exchange Commission (SEC);
• announcements of investor conferences and events at whichour executives talk about our products and competitivestrategies. Podcasts and archives of these events are alsoavailable;
• press releases on quarterly earnings, productannouncements, legal developments and other materialnews that we may post from time to time;
• corporate governance information including our CorporateGovernance Guidelines, Code of Business Conduct, Code ofEthics for Chief Executive Officer and Senior FinancialOfficers, information concerning our Board of Directors andits committees, including the charters of the AuditCommittee, Compensation and Management DevelopmentCommittee and Corporate Governance Committee, andother governance-related policies;
• shareholder services information, including ways to contactour transfer agent; and
• opportunities to sign up for email alerts and RSS feeds tohave information provided in real time.
The information available on our website is notincorporated by reference in, or a part of this or any otherreport we file with or furnish to the SEC.
ITEM 1A. Risk Factors
Risk factors which could cause actual results to differ
from our expectations and which could negatively impact
our financial condition and results of operations are
discussed below and elsewhere in this report. The risks
and uncertainties described below are not the only ones we
face. Additional risks and uncertainties not presently
known to us or that are currently not believed to be
significant to our business may also affect our actual
results and could harm our business, financial condition
and results of operations. If any of the risks or
uncertainties described below or any additional risks and
uncertainties actually occur, our business, results of
operations and financial condition could be materially
and adversely affected.
If we fail to comply with the terms of the Corporate
Integrity Agreement we entered into in September
2007, we may be subject to exclusion from federal
healthcare programs.
As previously reported, in September 2007 we settled aninvestigation conducted by the U.S. Attorney’s Office for theDistrict of New Jersey (U.S. Attorney) into financialrelationships between major orthopaedic manufacturers andconsulting orthopaedic surgeons. As part of that settlement,we entered into a five-year Corporate Integrity Agreement(CIA) with the Office of Inspector General of the Departmentof Health and Human Services (OIG-HHS). A copy of the CIA isfiled as an exhibit to this report. If we do not comply with theterms of the CIA, we could be subject to exclusion by OIG-HHSfrom participation in federal healthcare programs, includingMedicaid and Medicare.
The ongoing investigation by the U.S. Securities and
Exchange Commission and the U.S. Department of
Justice regarding potential violations of the Foreign
Corrupt Practices Act in the sale of medical devices in a
number of foreign countries by companies in the
medical device industry could have a material adverse
effect on our business, financial condition and cash
flows.
We are cooperating fully with the U.S. Securities andExchange Commission and the U.S. Department of Justice withregard to an ongoing investigation of potential violations of theForeign Corrupt Practices Act in the sale of medical devices ina number of foreign countries by companies in the medicaldevice industry. Although we have adopted policies andprocedures designed to prevent improper payments and wetrain our employees, distributors and others concerning theseissues, we cannot assure that violations of these requirementswill not occur. If we are found to have violated the ForeignCorrupt Practices Act, we may face sanctions including fines,criminal penalties, disgorgement of profits and suspension ordebarment of our ability to contract with governmentalagencies or receive export licenses.
In July 2011, we received Form FDA-483
Inspectional Observations from the FDA concerning
quality systems at our Warsaw, Indiana manufacturing
facility and we may not be able to timely and adequately
address the quality system issues raised by the FDA.
Following a July 2011 routine inspection of our Warsaw,Indiana manufacturing facility, the FDA issued a Form 483notice. The Form 483 notice identified certain inspectionalobservations regarding the facility’s quality systems. Thefacility manufactures reconstructive products that are soldglobally. We have responded in writing to the observations andmet with representatives of the district office of the FDA todiscuss our response and action plans. We expect the FDA toconduct a re-inspection of this facility in the future todetermine whether we have taken sufficient actions to addressthe observations described in the Form 483 notice. If the FDA
13

ZIMMER HOLDINGS, INC. 2011 FORM 10-K ANNUAL REPORT
is not satisfied with our response to the issues identified in theForm 483 notice, the FDA could take additional actions such asissuing a warning letter to us, which, among other things, couldadversely affect our ability to receive approvals of regulatoryapplications until the issues are resolved. Any of these possiblesanctions could have an adverse impact on our revenues,financial position, results of operations and cash flows, andotherwise harm our business and reputation.
Challenging global economic conditions could
adversely affect our results of operations.
During 2011, growth in the healthcare industry and ourrevenue growth were adversely affected by continuingchallenges in the global economy. Although the U.S. economyis recovering from the worst recession in decades,unemployment remains high and consumer confidenceremains low, resulting in reduced numbers of insured patientsand the deferral of elective reconstructive procedures. Globaleconomic conditions, particularly in Europe, our second-largest operating segment, remain uncertain. We believe thatEuropean austerity measures implemented to address theongoing financial crisis contributed to decreased healthcareutilization and increased pricing pressure for some of ourproducts. We cannot assure you that challenges in the globaleconomy will not continue to negatively impact procedurevolumes, average selling prices and reimbursement rates fromthird-party payors, any of which could adversely affect ourresults of operations. In addition, we have experienced delaysin the collection of receivables from hospitals in certaincountries that have national healthcare systems, includingcertain regions in Spain, Italy, Greece and Portugal, which arethe countries most directly affected by the Euro zone crisis.Repayment of these receivables is dependent upon thefinancial stability of the economies of those countries.Continuing high unemployment in the U.S., a worsening of theEuropean financial crisis or a failure to receive payment of allor a significant portion of our European receivables couldadversely affect our results of operations.
If we do not introduce new products in a timely
manner, our products may become obsolete over time,
customers may not buy our products and our revenue
and profitability may decline.
Demand for our products may change, in certain cases, inways we may not anticipate because of:• evolving customer needs;• changing demographics;• slowing industry growth rates;• declines in the reconstructive implant market;• the introduction of new products and technologies;• evolving surgical philosophies; and• evolving industry standards.
Without the timely introduction of new products andenhancements, our products may become obsolete over time.If that happens, our revenue and operating results wouldsuffer. The success of our new product offerings will dependon several factors, including our ability to:• properly identify and anticipate customer needs;• commercialize new products in a timely manner;
• manufacture and deliver instruments and products insufficient volumes on time;
• differentiate our offerings from competitors’ offerings;• achieve positive clinical outcomes for new products;• satisfy the increased demands by healthcare payors,
providers and patients for shorter hospital stays, faster post-operative recovery and lower-cost procedures;
• innovate and develop new materials, product designs andsurgical techniques; and
• provide adequate medical education relating to newproducts.
In addition, new materials, product designs and surgicaltechniques that we develop may not be accepted quickly, insome or all markets, because of, among other factors:• entrenched patterns of clinical practice;• the need for regulatory clearance; and• uncertainty with respect to third-party reimbursement.
Moreover, innovations generally require a substantialinvestment in research and development before we candetermine their commercial viability and we may not have thefinancial resources necessary to fund the production. Inaddition, even if we are able to successfully developenhancements or new generations of our products, theseenhancements or new generations of products may notproduce revenue in excess of the costs of development andthey may be quickly rendered obsolete by changing customerpreferences or the introduction by our competitors of productsembodying new technologies or features.
We conduct a significant amount of our sales
activity outside of the U.S., which subjects us to
additional business risks and may cause our
profitability to decline due to increased costs.
We sell our products in more than 100 countries andderived more than 45 percent of our net sales in 2011 fromoutside the U.S. We intend to continue to pursue growthopportunities in sales internationally, including in emergingmarkets, which could expose us to additional risks associatedwith international sales and operations. Our internationaloperations are, and will continue to be, subject to a number ofrisks and potential costs, including:• changes in foreign medical reimbursement policies and
programs;• unexpected changes in foreign regulatory requirements;• differing local product preferences and product
requirements;• fluctuations in foreign currency exchange rates;• diminished protection of intellectual property in some
countries outside of the U.S.;• trade protection measures and import or export
requirements that may prevent us from shipping products toa particular market and may increase our operating costs;
• foreign exchange controls that might prevent us fromrepatriating cash earned in countries outside the U.S.;
• complex data privacy requirements and labor relations laws;• extraterritorial effects of U.S. laws such as the Foreign
Corrupt Practices Act;• effects of foreign anti-corruption laws, such as the UK
Bribery Act;
14

ZIMMER HOLDINGS, INC. 2011 FORM 10-K ANNUAL REPORT
• difficulty in staffing and managing foreign operations;• labor force instability;• potentially negative consequences from changes in tax laws;
and• political and economic instability.
Violations of foreign laws or regulations could result infines, criminal sanctions against us, our officers or ouremployees, prohibitions on the conduct of our business anddamage to our reputation.
We are subject to risks arising from currency
exchange rate fluctuations, which can increase our
costs, cause our profitability to decline and expose us
to counterparty risks.
A substantial portion of our foreign revenues is generatedin Europe and Japan. The U.S. dollar value of our foreign-generated revenues varies with currency exchange ratefluctuations. Significant increases in the value of the U.S. dollarrelative to the Euro or the Japanese Yen, as well as othercurrencies, could have a material adverse effect on our resultsof operations. Although we address currency risk managementthrough regular operating and financing activities, and, on alimited basis, through the use of derivative financialinstruments, those actions may not prove to be fully effective.
We may fail to adequately protect our proprietary
technology and other intellectual property, which would
allow competitors or others to take advantage of our
research and development efforts.
Our long-term success largely depends on our ability tomarket technologically competitive products. If we fail toobtain or maintain adequate intellectual property protection,we may not be able to prevent third parties from using ourproprietary technologies. Also, our currently pending or futurepatent applications may not result in issued patents, andissued patents are subject to claims concerning priority, scopeand other issues.
The U.S. Patent and Trademark Office and the courts havenot consistently treated the breadth of claims allowed orinterpreted in orthopaedic reconstructive implant andbiotechnology patents. Future changes in, or unexpectedinterpretations of, the patent laws may adversely affect ourability to enforce our patent position.
In addition, intellectual property rights may be unavailableor of limited effect in some foreign countries. If we do notobtain sufficient international protection for our intellectualproperty, our competitiveness in international markets couldbe impaired, which could limit our growth and revenue.
We also attempt to protect our trade secrets, proprietaryknow-how and continuing technological innovation withsecurity measures, including the use of confidentialityagreements with our employees, consultants and collaborators.These measures may prove to be ineffective and any remediesavailable to us may be insufficient to compensate our damages.
Pending and future intellectual property litigation
and infringement claims could cause us to incur
significant expenses or prevent us from selling our
products.
A successful claim of patent or other intellectual propertyinfringement against us could adversely affect our growth and
profitability, in some cases materially. From time to time, wereceive notices from third parties of potential infringement andreceive claims of potential infringement. We may be unawareof intellectual property rights of others that may cover some ofour technology. If someone claims that our products infringedtheir intellectual property rights, any resulting litigation couldbe costly and time consuming and would divert the attention ofmanagement and key personnel from other business issues. Ifwe were to lose such litigation involving material intellectualproperty rights, such loss could result in significant damageawards and injunctions that could prevent our manufactureand sale of affected products or require us to pay significantroyalties in order to continue to manufacture or sell affectedproducts.
Pending and future product liability claims and
litigation could adversely impact our financial condition
and results of operations and impair our reputation.
Our business exposes us to potential product liability risksthat are inherent in the design, manufacture and marketing ofmedical devices. In the ordinary course of business, we are thesubject of product liability lawsuits alleging that componentfailures, manufacturing flaws, design defects or inadequatedisclosure of product-related risks or product-related informationresulted in an unsafe condition or injury to patients. Aspreviously reported, we temporarily suspended the marketingand distribution of our Durom® Acetabular Component (Durom
Cup) in the U.S. in July 2008. Subsequently, a number of productliability lawsuits and other claims have been asserted against us.We have settled some of these claims and the others are stillpending. Additional claims may be asserted in the future. We arealso currently defending a number of other product liabilitylawsuits and claims related to various other products. Anyproduct liability claim brought against us, with or without merit,can be costly to defend. Product liability lawsuits and claims,safety alerts or product recalls, regardless of their ultimateoutcome, could have a material adverse effect on our businessand reputation and on our ability to attract and retain customers.
Although we maintain third-party product liabilityinsurance coverage, we have substantial self-insured retentionamounts that we must pay in full before obtaining anyinsurance proceeds to satisfy a judgment or settlement.Furthermore, even if any product liability loss is covered byour insurance, it is possible that claims against us may exceedthe coverage limits of our insurance policies and we wouldhave to pay the amount of any settlement or judgment that isin excess of our policy limits. Product liability claims in excessof applicable insurance could have a material adverse effect onour business, financial condition and results of operations.
We are involved in legal proceedings that may
result in adverse outcomes.
In addition to intellectual property and product liabilityclaims and lawsuits, we are involved in various commercial andsecurities litigation and claims, government investigations andother legal proceedings that arise from time to time in theordinary course of our business. Although we believe we havesubstantial defenses in these matters, litigation and otherclaims are subject to inherent uncertainties and management’s
15

ZIMMER HOLDINGS, INC. 2011 FORM 10-K ANNUAL REPORT
view of these matters may change in the future. Given theuncertain nature of legal proceedings generally, we are notable in all cases to estimate the amount or range of loss thatcould result from an unfavorable outcome. We could in thefuture incur judgments or enter into settlements of claims thatcould have a material adverse effect on our results ofoperations in any particular period.
We depend on a limited number of suppliers for
some key raw materials and outsourced activities.
We use a number of suppliers for raw materials that weneed to manufacture our products and to outsource some keymanufacturing activities. These suppliers must provide thematerials and perform the activities to our standards for us tomeet our quality and regulatory requirements. Some key rawmaterials and outsourced activities can only be obtained from asingle source or a limited number of sources. A prolongeddisruption or other inability to obtain these materials oroutsource key manufacturing activities could materially andadversely affect our ability to satisfy demand for our products.
If we fail to retain the independent agents and
distributors upon whom we rely heavily to market our
products, customers may not buy our products and our
revenue and profitability may decline.
Our marketing success in the U.S. and abroad dependssignificantly upon our agents’ and distributors’ sales andservice expertise in the marketplace. Many of these agentshave developed professional relationships with existing andpotential customers because of the agents’ detailed knowledgeof products and instruments. A loss of a significant number ofthese agents could have a material adverse effect on ourbusiness and results of operations.
We may make additional acquisitions or enter into
strategic alliances that could increase our costs or
liabilities or be disruptive.
We intend to continue to look for additional strategicacquisitions of other businesses that are complementary to ourbusinesses and other companies with whom we could formstrategic alliances or enter into other arrangements to developor exploit intellectual property rights. These activities involverisks, including the following:• we may need to divert more management resources to
integration than we planned, which may adversely affect ourability to pursue other more profitable activities;
• the difficulties of integrating acquired businesses may beincreased if we need to integrate geographically separatedorganizations, personnel with disparate businessbackgrounds and companies with different corporatecultures;
• we may not recognize expected cost savings or theanticipated benefits of acquisitions or strategic alliances;
• our acquisition candidates or strategic partners may haveunexpected liabilities or prove unable to meet theirobligations to us or the joint venture; and
• the priorities of our strategic partners may proveincompatible with ours.
Future material impairments in the carrying value
of our intangible assets, including goodwill, would
negatively affect our operating results.
Our assets include intangible assets, primarily goodwill.The goodwill results from our acquisition activity andrepresents the excess of the consideration transferred over thefair value of the net assets acquired. We assess at leastannually whether events or changes in circumstances indicatethat the carrying value of our intangible assets may not berecoverable. If the operating performance at one or more ofour business units falls significantly below current levels, ifcompeting or alternative technologies emerge, or if marketconditions or future cash flow estimates for one or more of ourbusinesses decline, we could be required, under current U.S.accounting rules, to record a non-cash charge to operatingearnings for the amount of the impairment. Any write-off of amaterial portion of our unamortized intangible assets wouldnegatively affect our results of operations.
We may have additional tax liabilities.
We are subject to income taxes in the U.S. and manyforeign jurisdictions. Significant judgment is required indetermining our worldwide provision for income taxes. In theordinary course of our business, there are many transactionsand calculations where the ultimate tax determination isuncertain. We regularly are under audit by tax authorities.Although we believe our tax estimates are reasonable, the finaldetermination of tax audits and any related litigation could bematerially different from our historical income tax provisionsand accruals. The results of an audit or litigation could have amaterial effect on our financial statements in the period orperiods for which that determination is made.
We earn a significant amount of our operating incomefrom outside the U.S., and any repatriation of funds currentlyheld in foreign jurisdictions may result in higher effective taxrates. In addition, there have been proposals to change U.S. taxlaws that would significantly impact how U.S. multinationalcorporations are taxed on foreign earnings. Although wecannot predict whether or in what form this proposedlegislation will pass, if enacted it could have a material adverseimpact on our tax expense and cash flow.
In May 2011, the IRS concluded its examinations of ourU.S. federal returns for years 2005 through 2007 and issuedincome tax assessments reallocating profits between certain ofour U.S. and foreign subsidiaries. We believe that we havefollowed applicable U.S. tax laws and will vigorously defendour income tax positions. However, the ultimate resolution ofthis matter is uncertain and could have a material impact onour income tax expense, results of operations and cash flowsfor future periods.
U.S. healthcare reform legislation includes
provisions that may adversely affect our business and
results of operations.
As the 2010 U.S. healthcare law continues to be phased in,we believe the law will have an impact on various aspects ofour business operations. The 2013 imposition of the 2.3percent medical device excise tax is forcing us to identify waysto reduce spending in other areas to offset the increasedexpense that we will incur because of the tax. We do not
16

ZIMMER HOLDINGS, INC. 2011 FORM 10-K ANNUAL REPORT
expect to be able to pass along the cost of the tax to hospitals,which continue to face cuts to their Medicare reimbursementper the healthcare law. Nor do we expect to be able to offsetthe cost of the tax through higher sales volumes resulting fromthe expansion of health insurance coverage because of thedemographics of the current uninsured population. The levelof difficulty in terms of complying with the medical device taxwill depend on the regulations put forth by the U.S.Department of Treasury. In addition, the law’s Medicarepayment reforms, such as accountable care organizations andbundled payments, will provide additional incentives forhealthcare providers to reduce spending on our medical deviceproducts and reduce utilization of hospital procedures that useour products. Accordingly, while it is still too early to fullyunderstand and predict the ultimate impact of the law on ourbusiness, ongoing implementation of this legislation could havea material adverse effect on our results of operations and cashflows.
We are subject to healthcare fraud and abuse
regulations on an ongoing basis that could require us to
change our business practices and restrict our
operations in the future.
Our industry is subject to various federal and state lawspertaining to healthcare fraud and abuse, including false claimslaws, the federal Anti-Kickback Statute, similar state laws andphysician self-referral laws. Violations of these laws arepunishable by criminal and/or civil sanctions, including, insome instances, fines, imprisonment and, within the U.S.,exclusion from participation in government healthcareprograms, including Medicare, Medicaid and VeteransAdministration (VA) health programs. The interpretation andenforcement of these laws and regulations are uncertain andsubject to rapid change.
If third-party payors decline to reimburse our
customers for our products or reduce reimbursement
levels, the demand for our products may decline and our
ability to sell our products profitably may be harmed.
We sell our products and services to hospitals, doctors,dentists and other healthcare providers, all of which receivereimbursement for the healthcare services provided to theirpatients from third-party payors, such as domestic andinternational government programs, private insurance plansand managed care programs. These third-party payors maydeny reimbursement if they determine that a device used in aprocedure was not in accordance with cost-effective treatmentmethods, as determined by the third-party payor, or was usedfor an unapproved indication. Third-party payors may alsodecline to reimburse for experimental procedures and devices.If our products are not considered cost-effective by third-partypayors, our customers may not be reimbursed for our products.
In addition, third-party payors are increasingly attemptingto contain healthcare costs by limiting both coverage and thelevel of reimbursement for medical products and services. Ifthird-party payors reduce reimbursement levels to hospitalsand other healthcare providers for our products, demand forour products may decline, or we may experience increasedpressure to reduce the prices of our products, which could havea material adverse effect on our sales and results of operations.
We have also experienced downward pressure on productpricing and other effects of healthcare reform in ourinternational markets. If key participants in governmenthealthcare systems reduce the reimbursement levels for ourproducts, our sales and results of operations may be adverselyaffected.
The ongoing cost-containment efforts of healthcare
purchasing organizations may have a material adverse
effect on our results of operations.
Many customers for our products have formed grouppurchasing organizations in an effort to contain costs. Grouppurchasing organizations negotiate pricing arrangements withmedical supply manufacturers and distributors, and thesenegotiated prices are made available to a group purchasingorganization’s affiliated hospitals and other members. If we arenot one of the providers selected by a group purchasingorganization, affiliated hospitals and other members may beless likely to purchase our products, and, if the grouppurchasing organization has negotiated a strict compliancecontract for another manufacturer’s products, we may beprecluded from making sales to members of the grouppurchasing organization for the duration of the contractualarrangement. Our failure to respond to the cost-containmentefforts of group purchasing organizations may cause us to losemarket share to our competitors and could have a materialadverse effect on our sales and results of operations.
Our success depends on our ability to effectively
develop and market our products against those of our
competitors.
We operate in a highly competitive environment. Ourpresent or future products could be rendered obsolete oruneconomical by technological advances by one or more of ourpresent or future competitors or by other therapies, includingbiological therapies. To remain competitive, we must continueto develop and acquire new products and technologies.Competition is primarily on the basis of:• technology;• innovation;• quality;• reputation; and• customer service.
In markets outside of the U.S., other factors influencecompetition as well, including:• local distribution systems;• complex regulatory environments; and• differing medical philosophies and product preferences.
Our competitors may:• have greater financial, marketing and other resources than
us;• respond more quickly to new or emerging technologies;• undertake more extensive marketing campaigns;• adopt more aggressive pricing policies; or• be more successful in attracting potential customers,
employees and strategic partners.Any of these factors, alone or in combination, could cause
us to have difficulty maintaining or increasing sales of ourproducts.
17

ZIMMER HOLDINGS, INC. 2011 FORM 10-K ANNUAL REPORT
We and our customers are subject to various
governmental regulations relating to the
manufacturing, labeling and marketing of our products,
and we may incur significant expenses to comply with
these regulations and develop products compatible with
these regulations.
The medical devices we design, develop, manufacture andmarket are subject to rigorous regulation by the FDA andnumerous other federal, state and foreign governmentalauthorities. The process of obtaining regulatory approvals tomarket a medical device can be costly and time consuming andapprovals might not be granted for future products on a timelybasis, if at all. Delays in receipt of, or failure to obtain,approvals for future products could result in delayedrealization of product revenues or in substantial additionalcosts.
In addition, if we fail to comply with applicable materialregulatory requirements, including, for example, the QualitySystem Regulation, recordkeeping regulations, labeling andpromotional requirements and adverse event reportingregulations, we may be subject to a range of sanctionsincluding:• warning letters;• fines or civil penalties;• injunctions;• repairs, replacements or refunds;• recalls or seizures of products;• total or partial suspension of production;• the FDA’s refusal to grant future premarket clearances or
approvals;• withdrawals or suspensions of current product applications;
and• criminal prosecution.
Moreover, the FDA recently issued several guidancedocuments that may impact the amount of data required for510(k) clearance of new products. The guidance documentsmay also require additional submissions for minor changes toproducts currently on the market, where none were requiredin the past. Additionally, reauthorization of the Medical DeviceUser Fee Act, to be completed by September 30, 2012, maylead to additional post-market requirements for certain 510(k)products. We expect these 510(k)-related changes could delaynew products from reaching the market in the U.S. andincrease the costs of introducing new products and features,which could adversely affect our business.
Our products and operations are also often subject to therules of industrial standards bodies, such as the InternationalStandards Organization. If we fail to adequately address any ofthese regulations, our business could be harmed.
ITEM 1B. Unresolved Staff Comments
Not Applicable.
18

ZIMMER HOLDINGS, INC. 2011 FORM 10-K ANNUAL REPORT
ITEM 2. Properties
We have the following properties:Location Use Owned /Leased Square Feet
Warsaw, Indiana Research & Development, Manufacturing, Warehousing, Marketing &
Administration . . . . . . . . . . . . . . . . . . . . . . . . . . . . . . . . . . . . . . . . . . . . . . . . Owned 1,400,000
Warsaw, Indiana Corporate Headquarters and The Zimmer Institute . . . . . . . . . . . . . . . . . . Owned 117,000
Warsaw, Indiana Offices, Manufacturing & Warehousing . . . . . . . . . . . . . . . . . . . . . . . . . . . . Leased 90,000
Carlsbad, California Offices, Research & Development & Manufacturing . . . . . . . . . . . . . . . . . Leased 118,000
Minneapolis, Minnesota Offices & Research & Development . . . . . . . . . . . . . . . . . . . . . . . . . . . . . . . Owned 51,000
Statesville, North Carolina Manufacturing & Warehousing . . . . . . . . . . . . . . . . . . . . . . . . . . . . . . . . . . . Owned 156,000
Dover, Ohio Research & Development, Manufacturing & . . . . . . . . . . . . . . . . . . . . . . . . Owned 140,000
Warehousing . . . . . . . . . . . . . . . . . . . . . . . . . . . . . . . . . . . . . . . . . . . . . . . . . Leased 61,000
Parsippany, New Jersey Office, Research & Development, Manufacturing, Warehousing & The
Zimmer Institute . . . . . . . . . . . . . . . . . . . . . . . . . . . . . . . . . . . . . . . . . . . . . . Leased 115,000
Memphis, Tennessee Offices & Warehousing . . . . . . . . . . . . . . . . . . . . . . . . . . . . . . . . . . . . . . . . . Leased 30,000
Austin, Texas Offices, Administration, Research & Development . . . . . . . . . . . . . . . . . . Leased 97,000
Sydney, Australia Offices & Warehousing . . . . . . . . . . . . . . . . . . . . . . . . . . . . . . . . . . . . . . . . . Leased 36,000
Vienna, Austria Offices & Warehousing . . . . . . . . . . . . . . . . . . . . . . . . . . . . . . . . . . . . . . . . . Leased 18,000
Wemmel, Belgium Offices & Warehousing . . . . . . . . . . . . . . . . . . . . . . . . . . . . . . . . . . . . . . . . . Leased 15,000
Mississauga, Canada Offices & Warehousing . . . . . . . . . . . . . . . . . . . . . . . . . . . . . . . . . . . . . . . . . Leased 52,000
Beijing, China Offices & Manufacturing . . . . . . . . . . . . . . . . . . . . . . . . . . . . . . . . . . . . . . . . Leased 80,000
Xianning, China Offices, Research & Development & Manufacturing . . . . . . . . . . . . . . . . . Leased 53,000
Shanghai, China Offices & Warehousing . . . . . . . . . . . . . . . . . . . . . . . . . . . . . . . . . . . . . . . . . Leased 18,000
Etupes, France Offices, Manufacturing & Warehousing . . . . . . . . . . . . . . . . . . . . . . . . . . . . Owned 90,000
Eschbach, Germany Distribution Center . . . . . . . . . . . . . . . . . . . . . . . . . . . . . . . . . . . . . . . . . . . . Owned 94,000
Freiburg, Germany Offices & Warehousing . . . . . . . . . . . . . . . . . . . . . . . . . . . . . . . . . . . . . . . . . Leased 51,000
Shannon, Ireland Offices & Manufacturing . . . . . . . . . . . . . . . . . . . . . . . . . . . . . . . . . . . . . . . . Owned 125,000
Milan, Italy Offices & Warehousing . . . . . . . . . . . . . . . . . . . . . . . . . . . . . . . . . . . . . . . . . Leased 47,000
Gotemba, Japan Offices, Service Center & Warehousing . . . . . . . . . . . . . . . . . . . . . . . . . . . . Owned 87,000
Tokyo, Japan Offices & Warehousing . . . . . . . . . . . . . . . . . . . . . . . . . . . . . . . . . . . . . . . . . Leased 24,000
Seoul, Korea Offices & Warehousing . . . . . . . . . . . . . . . . . . . . . . . . . . . . . . . . . . . . . . . . . Leased 22,000
Utrecht, Netherlands Offices & Warehousing . . . . . . . . . . . . . . . . . . . . . . . . . . . . . . . . . . . . . . . . . Leased 33,000
Ponce, Puerto Rico Offices, Manufacturing & Warehousing . . . . . . . . . . . . . . . . . . . . . . . . . . . . Owned 213,000
Singapore Offices & Warehousing . . . . . . . . . . . . . . . . . . . . . . . . . . . . . . . . . . . . . . . . . Leased 19,000
Barcelona, Spain Offices & Warehousing . . . . . . . . . . . . . . . . . . . . . . . . . . . . . . . . . . . . . . . . . Leased 16,000
Winterthur, Switzerland Offices, Research & Development & Manufacturing . . . . . . . . . . . . . . . . . Leased 374,000
Münsingen, Switzerland Offices & Warehousing . . . . . . . . . . . . . . . . . . . . . . . . . . . . . . . . . . . . . . . . . Owned 76,000
Geneva, Switzerland Offices, Research & Development & Manufacturing . . . . . . . . . . . . . . . . . Leased 15,000
Swindon, United Kingdom Offices & Warehousing . . . . . . . . . . . . . . . . . . . . . . . . . . . . . . . . . . . . . . . . . Leased 70,000
We believe the current facilities, including manufacturing, warehousing, research and development and office space providesufficient capacity to meet ongoing demands.
In addition to the above, we maintain more than 100 other offices and warehouse facilities in more than 25 countries aroundthe world, including the U.S., Japan, Australia, France, Russia, India, Germany, Italy, Switzerland and China. We believe that all ofthe facilities and equipment are in good condition, well maintained and able to operate at present levels.
ITEM 3. Legal Proceedings
Information pertaining to legal proceedings in which we are involved can be found in Note 19 to our consolidated financialstatements (see Part II, Item 8 of this report).
ITEM 4. [Removed and Reserved]
Not Applicable.
19

ZIMMER HOLDINGS, INC. 2011 FORM 10-K ANNUAL REPORT
PART II
ITEM 5. Market for the Registrant’s Common Equity, Related Stockholder Matters and Issuer Purchases of
Equity Securities
Our common stock is traded on the New York Stock Exchange and the SIX Swiss Exchange under the symbol “ZMH.” The highand low sales prices for our common stock on the New York Stock Exchange for the calendar quarters of fiscal years 2011 and 2010are set forth as follows:
Quarterly High-low Share Prices High Low
Year Ended December 31, 2011:First Quarter $65.22 $52.15Second Quarter $69.93 $59.49Third Quarter $66.03 $49.92Fourth Quarter $55.43 $47.00
Year Ended December 31, 2010:First Quarter $64.77 $54.72Second Quarter $62.50 $52.26Third Quarter $58.08 $46.27Fourth Quarter $54.99 $47.09
In December 2011, our Board of Directors declared a dividend of $0.18 per share to be paid in April 2012 to stockholders ofrecord as of the close of business on March 30, 2012. Prior to this declaration, we had not paid dividends on our common stocksince becoming a public company in 2001. We expect to continue paying cash dividends on a quarterly basis; however, futuredividends are subject to approval of the Board of Directors and may be adjusted as business needs or market conditions change.
The number of holders of our common stock on February 10, 2012 was approximately 271,400. On February 10, 2012, theclosing price of the common stock, as reported on the New York Stock Exchange, was $60.84 per share.
The information required by this Item concerning equity compensation plans is incorporated by reference to Item 12 of thisreport.
The following table summarizes repurchases of common stock settled during the three months ended December 31, 2011:
Total Number ofShares Purchased
Average PricePaid per Share
Total Number of SharesPurchased as Part ofPublicly Announced
Plans or Programs (1)
Approximate Dollar Value ofShares that May Yet Be
Purchased Under Plans orPrograms (1)
October 2011 1,274,600 $55.53 76,483,850 $ 228,665,592November 2011 900,000 51.17 77,383,850 182,610,442December 2011 553,000 47.90 77,936,850 1,500,000,000
Total 2,727,600 $52.55 77,936,850 $1,500,000,000
(1)In December 2011, we announced a new program authorizing purchases of up to $1.5 billion of shares through December 31, 2014 and announced that wewere no longer authorized to repurchase shares under prior programs.
20

ZIMMER HOLDINGS, INC. 2011 FORM 10-K ANNUAL REPORT
ITEM 6. Selected Financial Data
The financial information for each of the past five years ended December 31 is set forth below (in millions, except per shareamounts):
Summary of Operations 2011 2010 2009 2008 2007
Net sales $4,451.8 $4,220.2 $4,095.4 $4,121.1 $3,897.5Net earnings of Zimmer Holdings, Inc. 760.8 596.9 717.4 848.6 773.2Earnings per common share
Basic $ 4.05 $ 2.98 $ 3.34 $ 3.73 $ 3.28Diluted 4.03 2.97 3.32 3.72 3.26
Dividends declared per share of common stock $ 0.18 $ – $ – $ – $ –Average common shares outstanding
Basic 187.6 200.0 215.0 227.3 235.5Diluted 188.7 201.1 215.8 228.3 237.5
Balance Sheet DataTotal assets $8,515.3 $7,999.9 $7,785.5 $7,239.0 $6,633.7Long-term debt 1,576.0 1,142.1 1,127.6 460.1 104.3Other long-term obligations 557.4 384.0 328.5 353.9 328.4Stockholders’ equity 5,514.8 5,771.3 5,638.7 5,653.9 5,452.4
21

ZIMMER HOLDINGS, INC. 2011 FORM 10-K ANNUAL REPORT
ITEM 7. Management’s Discussion and Analysis of Financial Condition and Results of Operations
The following discussion and analysis should be read inconjunction with the consolidated financial statements and thecorresponding notes included elsewhere in this Form 10-K.Certain percentages presented in this discussion and analysisare calculated from the underlying whole-dollar amounts andtherefore may not recalculate from the rounded numbers usedfor disclosure purposes. Certain amounts in the 2010 and 2009consolidated financial statements have been reclassified toconform to the 2011 presentation.
OVERVIEW
We believe the following developments or trends areimportant in understanding our financial condition, results ofoperations and cash flows for the year ended December 31,2011.
Demand (Volume and Mix) Trends
Increased volume and changes in the mix of product salescontributed 4 percentage points of 2011 sales growth, which is1 percentage point above the rate of growth from 2010compared to 2009.
Volume and mix trends continued to be challenged by theglobal economy. We believe reconstructive procedure volumesin 2011 continued to be lower than historical utilization ratesand lower than demographic trends would indicate. This effectwas particularly pronounced in our Americas operatingsegment, where the impact of ongoing high unemploymentand low consumer confidence contributed to softness.
Long-term indicators still point toward sustained growthdriven by an aging global population, obesity, more activelifestyles, growth in emerging markets, new materialtechnologies, advances in surgical techniques and provenclinical benefits of joint replacement procedures. In addition,the ongoing shift in demand to premium products, such asProlong Highly Crosslinked Polyethylene, Trabecular Metal
Technology products, hip stems with Kinectiv Technology,high-flex knees, porous hip stems and the introduction ofpatient specific devices, is expected to continue to positivelyaffect sales growth.
Pricing Trends
Global average selling prices declined by 1 percent in2011 compared to 2010. Selling prices in the Americas, Europeand Asia Pacific declined by 2 percent, were flat, and declinedby 1 percent, respectively, during 2011. We continue to seepricing pressure from governmental healthcare costcontainment efforts and from local hospitals and healthsystems. Due to these pressures and a biannual priceadjustment in Japan in April 2012, we expect selling prices willhave approximately a negative 2 percent effect on sales on aglobal basis in 2012.
Foreign Currency Exchange Rates
For 2011, foreign currency exchange rates resulted in a 2percent increase in sales. If foreign currency exchange ratesremain consistent with 2011 year end rates, we estimate that astronger dollar versus foreign currency exchange rates willhave a negative effect in 2012 of approximately 1 percent onsales. We address currency risk through regular operating andfinancing activities and through the use of forward contractsand options solely to manage foreign currency volatility andrisk. Changes to foreign currency exchange rates affect salesgrowth, but due to gains/losses on hedge contracts andoptions, which are recorded in cost of products sold, the effecton net earnings in the near term is expected to be minimal.
Global Economic Conditions
We believe adverse conditions in the global economycontinue to negatively affect elective hospital procedures.However, we continue to believe that procedure deferrals willdiminish slowly over time, and that growth rates will trendhigher as they track more in line with historical usage ratesamong the aging population. We believe these demographictrends will ultimately foster long-term sustained growth evenif in the short-term the timing of these elective procedurescontinues to be adversely affected.
2012 Outlook
We estimate our sales will grow between 1 and 3 percentin 2012. Such sales growth assumes knee and hip procedureswill grow in low single digits with modest global economicgrowth and relatively stable employment. As discussedpreviously, we expect pricing to have a negative effect on salesgrowth of 2 percent, and foreign currency exchange rates tohave a negative effect on sales growth of approximately 1percent based upon December 31, 2011 rates.
Assuming currency rates remain at December 31, 2011levels, we expect our gross margin to be between 74 and 75percent of sales in 2012. This takes into account the costpressures we have experienced from lower than plannedmanufacturing volumes, as well as anticipated losses fromforeign currency hedges. However, if currency rates remain atDecember 31, 2011 levels the hedge losses we recognize in2012 will be less than the hedge losses recognized in 2011. Weexpect to continue making investments in research anddevelopment (R&D) in the range of 5 to 6 percent of sales.Selling, general and administrative expenses (SG&A) as apercent of sales is expected to be between 39.5 and 40.5percent as we realize operational efficiencies from globalrestructuring and transformation initiatives and furtherleverage revenue growth.
We expect to incur approximately $100 million ofexpenses in 2012 related to certain restructuring andtransformation initiatives. The programs are targeted atstreamlining the organization and business processes. They
22

ZIMMER HOLDINGS, INC. 2011 FORM 10-K ANNUAL REPORT
are expected to be mostly completed in 2012. We also expectto incur approximately $10 million for certain acquisition andintegration costs connected with recent acquisitions. Weexpect to recognize the majority of these $110 million ofexpenses in “Special items” on our statement of net earnings.The gross margin and SG&A percentages discussed above donot include these expenses.
Assuming variable rates remain at December 31, 2011levels, we expect interest income and expense, net, to beapproximately $65 million in 2012, which is higher than 2011primarily due to a $550 million offering of senior notescompleted in November 2011.
RESULTS OF OPERATIONS
Net Sales by Reportable Segment
The following tables present net sales by reportable segment and the components of the percentage changes (dollars inmillions):
Year Ended December 31,Volume/
Mix
Foreign
Exchange2011 2010 % Inc/(Dec) Price
Americas $2,440.8 $2,431.6 –% 2% (2)% –%
Europe 1,214.5 1,099.5 10 5 – 5
Asia Pacific 796.5 689.1 16 7 (1) 10
Total $4,451.8 $4,220.2 5 4 (1) 2
Year Ended December 31,Volume/
Mix
Foreign
Exchange2010 2009 % Inc/(Dec) Price
Americas $2,431.6 $2,372.4 2% 3% (1)% –%
Europe 1,099.5 1,119.2 (2) 1 – (3)
Asia Pacific 689.1 603.8 14 8 (2) 8
Total $4,220.2 $4,095.4 3 3 (1) 1
“Foreign Exchange” as used in the tables in this report represents the effect of changes in foreign currency exchange rates onsales growth.
Net Sales by Product Category
The following tables present net sales by product category and the components of the percentage changes (dollars in millions):
Year Ended December 31,Volume/
Mix
Foreign
Exchange2011 2010 % Inc (Dec) Price
ReconstructiveKnees $1,825.1 $1,789.9 2% 1% (2)% 3%Hips 1,355.6 1,262.3 7 6 (2) 3Extremities 163.4 150.1 9 8 (1) 2
Total 3,344.1 3,202.3 4 3 (2) 3
Dental 248.1 219.0 13 5 7 1Trauma 285.8 245.5 16 13 – 3Spine 225.0 234.4 (4) (4) (2) 2Surgical and other 348.8 319.0 9 6 – 3
Total $4,451.8 $4,220.2 5 4 (1) 2
23

ZIMMER HOLDINGS, INC. 2011 FORM 10-K ANNUAL REPORT
Year Ended December 31,Volume/
Mix
Foreign
Exchange2010 2009 % Inc (Dec) Price
ReconstructiveKnees $1,789.9 $1,756.3 2% 3% (2)% 1%Hips 1,262.3 1,228.5 3 4 (2) 1Extremities 150.1 135.6 11 10 – 1
Total 3,202.3 3,120.4 3 4 (2) 1
Dental 219.0 204.7 7 4 4 (1)Trauma 245.5 234.8 5 1 2 2Spine 234.4 253.6 (8) (6) (1) (1)Surgical and other 319.0 281.9 13 11 – 2
Total $4,220.2 $4,095.4 3 3 (1) 1
The following table presents net sales by product category by region (dollars in millions):
Year Ended December 31,
2011 2010 2009
2011 vs. 2010
% Inc (Dec)
2010 vs. 2009
% Inc (Dec)
ReconstructiveKnees
Americas $1,067.5 $1,110.5 $1,098.7 (4)% 1%Europe 462.6 418.7 428.1 10 (2)Asia Pacific 295.0 260.7 229.5 13 14
HipsAmericas 600.7 589.7 565.9 2 4Europe 470.5 433.2 448.6 9 (3)Asia Pacific 284.4 239.4 214.0 19 12
ExtremitiesAmericas 125.0 115.9 103.7 8 12Europe 27.5 24.4 23.9 13 2Asia Pacific 10.9 9.8 8.0 12 22
Total 3,344.1 3,202.3 3,120.4 4 3
DentalAmericas 134.7 113.9 102.8 18 11Europe 85.3 80.0 78.2 7 2Asia Pacific 28.1 25.1 23.7 12 6
TraumaAmericas 145.5 130.1 125.9 12 3Europe 63.5 50.2 52.7 26 (5)Asia Pacific 76.8 65.2 56.2 18 16
SpineAmericas 150.9 166.5 192.6 (9) (14)Europe 53.5 51.5 46.9 4 10Asia Pacific 20.6 16.4 14.1 25 17
Surgical and otherAmericas 216.5 205.0 182.8 6 12Europe 51.6 41.5 40.8 24 2Asia Pacific 80.7 72.5 58.3 11 24
Total $4,451.8 $4,220.2 $4,095.4 5 3
24

ZIMMER HOLDINGS, INC. 2011 FORM 10-K ANNUAL REPORT
Knees
Knee sales experienced 2 percent growth in each of thepast two years, including double digit growth in Europe andAsia Pacific in 2011 offset by a decline in sales in the Americas.We estimate that industry procedure volumes were flat toslightly positive on a global basis in 2011, while pricing wasnegative. We believe procedure volumes will continue to bepressured from a cyclical downturn related to uncertain globaleconomic conditions.
The NexGen Complete Knee Solution product line,including Gender Solutions Knee Femoral Implants, theNexGen LPS-Flex Knee and the NexGen CR-Flex Knee,together with the Gender Solutions Natural-Knee FlexSystem, led knee sales. In addition, sales of the Gender
Solutions Patello Femoral Joint and Zimmer Patient SpecificInstruments exhibited growth.
In Europe, changes in foreign currency exchange ratesaffected knee sales in the years ended December 31, 2011 and2010 by positive 4 percent and negative 2 percent,respectively. In Asia Pacific, changes in foreign currencyexchange rates positively affected knee sales in the yearsended December 31, 2011 and 2010 by 9 percent and 10percent, respectively.
Hips
Hip sales grew by 7 percent in 2011 driven by newproduct introductions, such as our Continuum AcetabularSystem and our Zimmer M/L Taper Stem with Kinectiv
Technology. Additionally, negative publicity in the marketplaceover the use of hip systems that use metal-on-metal technologymay have contributed to an increase in sales of hip systemswith alternative bearing surfaces. Metal-on-metal technologyrepresents only a small portion of our hip sales. Therefore, ourmarket share position may have benefited from customersusing our hip systems instead of a competitor’s metal-on-metalsystem.
The Zimmer M/L Taper Stem, the Zimmer M/L TaperStem with Kinectiv Technology, the CLS Spotorno Stem fromthe CLS Hip System and the Alloclassic Zweymüller Hip Stemled hip stem sales. In addition, sales of the Continuum
Acetabular System, Trilogy IT Acetabular System and Allofit
IT Alloclassic Acetabular System and the Trabecular Metal
Revision Shell and Augment Cups were strong when comparedto the prior year periods, as were sales of BIOLOX delta Headsand Fitmore Hip Stems.
In Europe, changes in foreign currency exchange ratesaffected hip sales in the years ended December 31, 2011 and2010 by positive 6 percent and negative 2 percent,respectively. In Asia Pacific, our December 2010 acquisition ofBeijing Montagne Medical Device Co., Ltd. made a contributionto that operating segment’s sales growth in 2011. Additionallyin Asia Pacific, changes in foreign currency exchange ratespositively affected hip sales in the years ended December 31,2011 and 2010 by 10 percent and 8 percent, respectively.
Extremities
Extremities delivered solid sales growth the past twoyears, led by the Zimmer Trabecular Metal Reverse ShoulderSystem and the Bigliani/Flatow Complete Shoulder Solution.Trabecular Metal Technology is playing a critical role inaddressing previously unmet clinical needs in the expandingextremities market. We continue to see competitive pressurein this category, but expect that new product and instrumentintroductions will help to accelerate growth.
Dental
Dental experienced sales growth of 13 percent in 2011compared to 7 percent growth in 2010, including a 7 percentincrease in 2011 due to pricing. A significant portion of thispricing increase was due to a change in the agreement thatstarted in the fourth quarter of 2010 by which we distributecertain regenerative products. Under the prior agreement, wedid not take title to the products and only received acommission from the end-user sale. Under the new agreement,we take title to the product and recognize the final end-usersale along with the cost of products sold and any other selling-related costs. Sales were led by the Tapered Screw-Vent
Implant System.
Trauma
Trauma sales increased by 16 percent in 2011 afterexperiencing 5 percent sales growth in 2010. In 2011, wecontinued the launch of the Zimmer Natural Nail System,which contributed significantly to our trauma sales. In additionto the Zimmer Natural Nail System, Zimmer PeriarticularLocking Plates and the Zimmer NCB Plating System ledtrauma sales, while sales of cable products also made a strongcontribution.
Spine
We experienced mid to high single digit sales declines inSpine each of the past two years. The sales declines have comefrom our Americas segment, as both Europe and Asia Pacifichave experienced sales growth in each of the past two years. Inthe Americas segment, we have experienced operationalchallenges with our sales force, a difficult reimbursementlandscape and a significant decline in sales of our Dynesys
Dynamic Stabilization System. Overall, solid sales of thePathFinder and Sequoia Pedicle Screw Systems, ourUniversal Clamp System and Trabecular Metal Technologyproducts partly offset a decline in sales of the Dynesys
System.
Surgical and other
Surgical and other delivered solid sales growth the pasttwo years. Surgical and other sales were led by PALACOS
Bone Cement and tourniquet products. Our wounddebridement products also made a strong contribution to salesresults, as did our December 2010 acquisition of SodemDiffusion S.A.
25
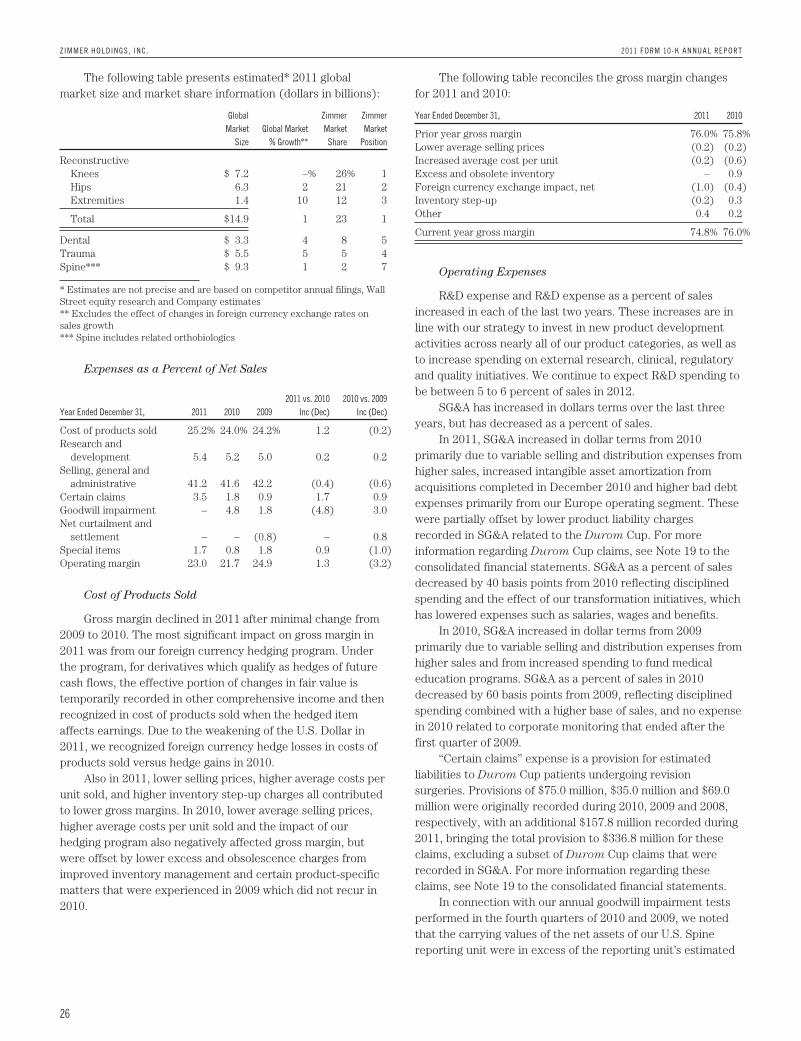
ZIMMER HOLDINGS, INC. 2011 FORM 10-K ANNUAL REPORT
The following table presents estimated* 2011 globalmarket size and market share information (dollars in billions):
Global
Market
Size
Global Market
% Growth**
Zimmer
Market
Share
Zimmer
Market
Position
ReconstructiveKnees $ 7.2 –% 26% 1Hips 6.3 2 21 2Extremities 1.4 10 12 3
Total $14.9 1 23 1
Dental $ 3.3 4 8 5Trauma $ 5.5 5 5 4Spine*** $ 9.3 1 2 7
* Estimates are not precise and are based on competitor annual filings, WallStreet equity research and Company estimates** Excludes the effect of changes in foreign currency exchange rates onsales growth*** Spine includes related orthobiologics
Expenses as a Percent of Net Sales
Year Ended December 31, 2011 2010 2009
2011 vs. 2010
Inc (Dec)
2010 vs. 2009
Inc (Dec)
Cost of products sold 25.2% 24.0% 24.2% 1.2 (0.2)Research and
development 5.4 5.2 5.0 0.2 0.2Selling, general and
administrative 41.2 41.6 42.2 (0.4) (0.6)Certain claims 3.5 1.8 0.9 1.7 0.9Goodwill impairment – 4.8 1.8 (4.8) 3.0Net curtailment and
settlement – – (0.8) – 0.8Special items 1.7 0.8 1.8 0.9 (1.0)Operating margin 23.0 21.7 24.9 1.3 (3.2)
Cost of Products Sold
Gross margin declined in 2011 after minimal change from2009 to 2010. The most significant impact on gross margin in2011 was from our foreign currency hedging program. Underthe program, for derivatives which qualify as hedges of futurecash flows, the effective portion of changes in fair value istemporarily recorded in other comprehensive income and thenrecognized in cost of products sold when the hedged itemaffects earnings. Due to the weakening of the U.S. Dollar in2011, we recognized foreign currency hedge losses in costs ofproducts sold versus hedge gains in 2010.
Also in 2011, lower selling prices, higher average costs perunit sold, and higher inventory step-up charges all contributedto lower gross margins. In 2010, lower average selling prices,higher average costs per unit sold and the impact of ourhedging program also negatively affected gross margin, butwere offset by lower excess and obsolescence charges fromimproved inventory management and certain product-specificmatters that were experienced in 2009 which did not recur in2010.
The following table reconciles the gross margin changesfor 2011 and 2010:
Year Ended December 31, 2011 2010
Prior year gross margin 76.0% 75.8%Lower average selling prices (0.2) (0.2)Increased average cost per unit (0.2) (0.6)Excess and obsolete inventory – 0.9Foreign currency exchange impact, net (1.0) (0.4)Inventory step-up (0.2) 0.3Other 0.4 0.2
Current year gross margin 74.8% 76.0%
Operating Expenses
R&D expense and R&D expense as a percent of salesincreased in each of the last two years. These increases are inline with our strategy to invest in new product developmentactivities across nearly all of our product categories, as well asto increase spending on external research, clinical, regulatoryand quality initiatives. We continue to expect R&D spending tobe between 5 to 6 percent of sales in 2012.
SG&A has increased in dollars terms over the last threeyears, but has decreased as a percent of sales.
In 2011, SG&A increased in dollar terms from 2010primarily due to variable selling and distribution expenses fromhigher sales, increased intangible asset amortization fromacquisitions completed in December 2010 and higher bad debtexpenses primarily from our Europe operating segment. Thesewere partially offset by lower product liability chargesrecorded in SG&A related to the Durom Cup. For moreinformation regarding Durom Cup claims, see Note 19 to theconsolidated financial statements. SG&A as a percent of salesdecreased by 40 basis points from 2010 reflecting disciplinedspending and the effect of our transformation initiatives, whichhas lowered expenses such as salaries, wages and benefits.
In 2010, SG&A increased in dollar terms from 2009primarily due to variable selling and distribution expenses fromhigher sales and from increased spending to fund medicaleducation programs. SG&A as a percent of sales in 2010decreased by 60 basis points from 2009, reflecting disciplinedspending combined with a higher base of sales, and no expensein 2010 related to corporate monitoring that ended after thefirst quarter of 2009.
“Certain claims” expense is a provision for estimatedliabilities to Durom Cup patients undergoing revisionsurgeries. Provisions of $75.0 million, $35.0 million and $69.0million were originally recorded during 2010, 2009 and 2008,respectively, with an additional $157.8 million recorded during2011, bringing the total provision to $336.8 million for theseclaims, excluding a subset of Durom Cup claims that wererecorded in SG&A. For more information regarding theseclaims, see Note 19 to the consolidated financial statements.
In connection with our annual goodwill impairment testsperformed in the fourth quarters of 2010 and 2009, we notedthat the carrying values of the net assets of our U.S. Spinereporting unit were in excess of the reporting unit’s estimated
26
ZIMMER HOLDINGS, INC. 2011 FORM 10-K ANNUAL REPORT
fair value. As a result, we recorded goodwill impairmentcharges of $204.0 million and $73.0 million during the yearsended December 31, 2010 and 2009, respectively. For moreinformation regarding goodwill impairment and the factors thatled to the impairment, see Note 9 to the consolidated financialstatements.
We recognized a net curtailment and settlement gain of$32.1 million during 2009 related to amending our U.S. andPuerto Rico postretirement benefit plans. For moreinformation regarding the net curtailment and settlement gain,see Note 14 to the consolidated financial statements.
“Special items” expenses for the years endedDecember 31, 2011, 2010 and 2009 were $75.2 million, $34.7million, and $75.3 million, respectively. In 2011, we continuedreducing management layers and restructured certain areas,resulting in $23.1 million of severance and termination-relatedexpenses. In 2011, we also incurred $26.0 million in consultingand professional fees associated with acquisitions and ourbusiness transformation initiatives. As a result of ouracquisitions and transformation initiatives, we also incurredasset impairments, facility and employee relocation costs,contract termination expenses and other costs.
“Special items” in 2010 included expenses related torestructuring of our information technology infrastructure aswell as our management structure. This resulted in $7.7 millionof asset impairment charges and $6.7 million of employeeseverance and termination-related expenses. In 2010, we alsoincurred consulting and professional fees, facility andemployee relocation costs, contract termination expenses andother various expenses resulting from acquisitions. “Specialitems” also included the impairment of an available-for-salesecurity that was acquired as part of a business acquisition andcertain litigation related matters.
“Special items” in 2009 included a workforce realignment,which resulted in the elimination of positions in some areasand increases in others to support long-term growth. As aresult of this realignment and headcount reductions fromacquisitions, we incurred approximately $19.0 million ofseverance and termination-related expenses. Other “Specialitems” in 2009 included approximately $9.4 million of expensesrelated to contract termination costs, $23.4 million related tocertain litigation matters that were recognized during theperiod and various costs related to acquisitions.
See Note 2 to the consolidated financial statements formore information regarding “Special items” charges.
Interest Income, Interest Expense, Income Taxes and
Net Earnings
Interest expense decreased in 2011 after a significantincrease in 2010 from 2009. In November 2009 we issued $1.0billion of senior unsecured notes which was the primary causeof the increase in 2010. The decrease in interest expense in2011 is the result of interest rate swap agreements we enteredinto in late 2010 and early 2011 to convert a portion of ourfixed-rate debt into variable-rate debt. Interest income hasincreased due to higher balances of cash and cash equivalentsand short-term and long-term investments and higher returnson certain investments.
Our effective tax rate (ETR) on earnings before incometaxes for the years ended December 31, 2011, 2010 and 2009was 22.4 percent, 30.6 percent and 28.1 percent, respectively.The variation of our ETR has largely been affected by “Certainclaims” and goodwill impairment charges. “Certain claims”expense favorably affects our ETR because it lowers theincome within our U.S. operations relative to our foreignoperations. Goodwill impairment charges negatively affect ourETR because no tax benefit is recorded on such charges.Additionally, in 2011 and 2010 our ETR was favorablyimpacted by the resolution of certain tax contingencies. Thesediscrete items account for the majority of the variation in ourETRs in the past three years.
As a result of the revenues and expenses discussedpreviously, net earnings in 2011 increased 27 percentcompared to 2010. In 2010, net earnings decreased 17 percentcompared to 2009. Basic and diluted earnings per shareincreased 36 percent in 2011 compared to 2010, while 2010basic and diluted earnings per share decreased 11 percentfrom 2009. The disproportionate change in earnings per shareas compared to net earnings is attributed to the effect of sharerepurchases.
Non-GAAP operating performance measures
We use non-GAAP financial measures to evaluate ouroperating performance that differ from financial measuresdetermined in accordance with U.S. generally acceptedaccounting principles (GAAP). Our non-GAAP financialmeasures exclude the impact of inventory step-up charges,“Special items,” “Certain claims,” net curtailment andsettlement and goodwill impairment, and the taxes on thoseitems in addition to certain other tax adjustments. We use thisinformation internally and believe it is helpful to investorsbecause it allows more meaningful period-to-periodcomparisons of our ongoing operating results, it helps toperform trend analysis and to better identify operating trendsthat may otherwise be masked or distorted by these types ofitems, and it provides a higher degree of transparency ofcertain items. Certain of these non-GAAP financial measuresare used as metrics for our incentive compensation programs.
Our non-GAAP adjusted net earnings used for internalmanagement purposes for the years ended December 31, 2011,2010 and 2009 were $905.6 million, $871.6 million, and $849.9million, respectively, and our non-GAAP adjusted dilutedearnings per share were $4.80, $4.33, and $3.94, respectively.
27

ZIMMER HOLDINGS, INC. 2011 FORM 10-K ANNUAL REPORT
The following are reconciliations from our GAAP netearnings and diluted earnings per share to our non-GAAPadjusted net earnings and non-GAAP adjusted diluted earningsper share used for internal management purposes.
Year Ended December 31, 2011 2010 2009
Net Earnings of Zimmer Holdings, Inc. $760.8 $596.9 $717.4Inventory step-up 11.4 1.4 12.5Special items 75.2 34.7 75.3Certain claims 157.8 75.0 35.0Net curtailment and settlement – – (32.1)Goodwill impairment – 204.0 73.0Taxes on inventory step-up, special items,
certain claims and net curtailment andsettlement and tax adjustments relatedto resolution of certain tax matters* (99.6) (40.4) (31.2)
Adjusted Net Earnings $905.6 $871.6 $849.9
Year Ended December 31, 2011 2010 2009
Diluted EPS $ 4.03 $ 2.97 $ 3.32Inventory step-up 0.06 0.01 0.06Special items 0.40 0.17 0.35Certain claims 0.84 0.37 0.16Net curtailment and settlement – – (0.15)Goodwill impairment – 1.01 0.34Taxes on inventory step-up, special items,
certain claims and net curtailment andsettlement and tax adjustments relatedto resolution of certain tax matters* (0.53) (0.20) (0.14)
Adjusted Diluted EPS $ 4.80 $ 4.33 $ 3.94
* The tax effect is calculated based upon the statutory rates for thejurisdictions where the items were incurred.
Healthcare Reform in the U.S.
We continue to assess the impact that federal healthcarereform will have on our business. Federal healthcare reformincludes a 2.3 percent excise tax on a majority of our U.S. salesthat is scheduled to be implemented in 2013.
LIQUIDITY AND CAPITAL RESOURCES
Cash flows provided by operating activities were $1,176.9million in 2011 compared to $1,193.5 million in 2010. Theprincipal source of cash from operating activities in 2011 wasnet earnings. Non-cash charges included in net earningsaccounted for another $412.1 million of operating cash. Allother items of operating cash flows in 2011 provided $4.8million of cash. The lower cash flows provided by operatingactivities in the 2011 period were primarily due to lowerreceivable collections and increased product liabilitypayments. We paid approximately $60 million, $45 million and$25 million in 2011, 2010 and 2009, respectively, related toDurom Cup product liability claims. We estimate the netremaining liability after insurance recovery for Durom Cupclaims as of December 31, 2011, is $234.8 million. We expect topay the majority of this amount over the next five years.
At December 31, 2011, we had 64 days of salesoutstanding in trade accounts receivable, an increase of 6 days
when compared to December 31, 2010, reflecting changes incertain accounts receivable factoring programs and theeconomic environment in our Europe operating segment. AtDecember 31, 2011, we had 277 days of inventory on hand, adecrease of 30 days compared to December 31, 2010. Days ofinventory on hand have decreased due to higher cost ofproducts sold as a percentage of net sales, most notably fromforeign currency hedge losses, and a reduction in U.S.consignment inventory that was achieved through newinventory management strategies.
Cash flows used in investing activities were $624.4 million in2011, compared to $726.9 million in 2010. Additions toinstruments decreased in 2011 compared to the 2010 periodbecause the 2010 period included investments in new productlaunches, such as our Continuum Acetabular System, andincluded instrumentation in our knee product category, such asposterior referencing instrumentation. Spending on otherproperty, plant and equipment increased in 2011 compared tothe 2010 period as there were no significant infrastructureinitiatives in 2010. During 2012, for both instruments andproperty, plant and equipment, we expect to purchaseapproximately $120 to $140 million. We feel this level of capitalspending is necessary to support new product-relatedinvestments and replacement of older machinery and equipment.Beginning in 2009 and with more significance thereafter, webegan investing some of our cash and cash equivalents in highly-rated debt securities. The purchases and any sales or maturitiesof these investments are reflected as cash flows from investingactivities. Acquired intellectual property rights relate tolump-sum payments made to certain healthcare professionalsand institutions in place of future royalty payments thatotherwise would have been due under the terms of existingcontractual arrangements. In the past three years, we have madevarious business acquisitions including ExtraOrtho, Inc., BeijingMontagne Medical Device Co., Ltd., Sodem Diffusion S.A. andcertain foreign-based distributors.
Cash flows used in financing activities were $455.8 millionfor 2011, compared to $489.6 million in 2010. In 2011 and2009, we issued senior unsecured notes in public offerings. Weused some of the proceeds to repurchase our common stockand to repay outstanding debt on our revolving credit facilities.
In December 2011, our Board of Directors declared adividend of $0.18 per share to be paid in April 2012 tostockholders of record as of the close of business on March 30,2012. Based upon shares outstanding as of December 31, 2011,we would pay $32.1 million. We expect to continue paying cashdividends on a quarterly basis; however future dividends aresubject to approval of the Board of Directors and may beadjusted as business needs or market conditions change.
We have four tranches of senior notes outstanding: $250million aggregate principal amount of 1.4 percent notes dueNovember 30, 2014, $500 million aggregate principal amount of4.625 percent notes due November 30, 2019, $300 millionaggregate principal amount of 3.375 percent notes dueNovember 30, 2021 and $500 million aggregate principalamount of 5.75 percent notes due November 30, 2039. Intereston each series is payable on May 30 and November 30 of eachyear until maturity.
28

ZIMMER HOLDINGS, INC. 2011 FORM 10-K ANNUAL REPORT
We may redeem the senior notes at our election in wholeor in part at any time prior to maturity at a redemption priceequal to the greater of 1) 100 percent of the principal amountof the notes being redeemed; or 2) the sum of the presentvalues of the remaining scheduled payments of principal andinterest (not including any portion of such payments ofinterest accrued as of the date of redemption), discounted tothe date of redemption on a semi-annual basis at the TreasuryRate (as defined in the debt agreement), plus 15 basis pointsin the case of the 2014 notes, 20 basis points in the case of the2019 and 2021 notes, and 25 basis points in the case of the2039 notes. We will also pay the accrued and unpaid intereston the senior notes to the redemption date.
We have a five year $1,350 million revolving, multi-currency, senior unsecured credit facility maturingNovember 30, 2012 (Senior Credit Facility). We had $143.0million outstanding under the Senior Credit Facility atDecember 31, 2011, and an availability of $1,207.0 million. Weintend to secure another senior credit facility in 2012 beforeour current Senior Credit Facility matures.
We also have available uncommitted credit facilitiestotaling $63.6 million.
We place our cash and cash equivalents in highly-ratedfinancial institutions and limit the amount of credit exposure toany one entity. We invest only in high-quality financialinstruments in accordance with our internal investment policy.
As of December 31, 2011, we had short-term and long-term investments in debt securities with a fair value of $672.7million. These investments are in debt securities of manydifferent issuers and therefore we have no significantconcentration of risk with a single issuer. All of these debtsecurities remain highly-rated and therefore we believe therisk of default by the issuers is low.
As of December 31, 2011, $1,131.9 million of our cash andcash equivalents and short-term and long-term investments areheld in jurisdictions outside of the U.S. and are expected to beindefinitely reinvested for continued use in foreign operations.Repatriation of these assets to the U.S. would have negativetax consequences. Approximately $970.0 million of thisamount is denominated in U.S. Dollars and therefore bears noforeign currency translation risk. The balance of these assets isdenominated in currencies of the various countries where weoperate.
We may use excess cash to repurchase additional commonstock under our share repurchase program. As ofDecember 31, 2011, we had authority to repurchase up to $1.5billion shares of common stock through December 31, 2014.
Management believes that cash flows from operations andavailable borrowings under the Senior Credit Facility aresufficient to meet our expected working capital, capitalexpenditure and debt service needs. Should investmentopportunities arise, we believe that our earnings, balance sheetand cash flows will allow us to obtain additional capital, ifnecessary.
CONTRACTUAL OBLIGATIONS
We have entered into contracts with various third partiesin the normal course of business that will require futurepayments. The following table illustrates our contractualobligations (in millions):
Contractual Obligations Total 2012
2013
and
2014
2015
and
2016
2017
and
Thereafter
Long-term debt $1,550.0 $ – $250.0 $ – $1,300.0
Interest payments 1,102.8 66.5 131.0 124.0 781.3
Operating leases 179.7 43.5 58.2 36.5 41.5
Purchaseobligations 26.1 24.8 1.3 – –
Other long-termliabilities 380.7 – 157.3 141.2 82.2
Total contractualobligations $3,239.3 $134.8 $597.8 $301.7 $2,205.0
$48.2 million of the other long-term liabilities on ourbalance sheet are liabilities related to defined benefit pensionplans. Defined benefit plan liabilities are based upon theunderfunded status of the respective plans; they are not basedupon future contributions. Due to uncertainties regardingfuture plan asset performance, changes in interest rates andour intentions with respect to voluntary contributions, we areunable to reasonably estimate future contributions beyond2012. Therefore, this table does not include any amountsrelated to future contributions to our plans. See Note 14 to ourconsolidated financial statements for further information onour defined benefit plans.
Also included in other long-term liabilities on our balancesheet are liabilities related to unrecognized tax benefits andcorresponding interest and penalties thereon. Due to theuncertainties inherent in these liabilities, such as the ultimatetiming and resolution of tax audits, we are unable toreasonably estimate the amount or period in which potentialtax payments related to these positions will be made.Therefore, this table does not include any obligations relatedto unrecognized tax benefits. See Note 15 to our consolidatedfinancial statements for further information on theseunrecognized tax benefits.
We have entered into various agreements that may resultin future payments dependent upon various events such as theachievement of certain product R&D milestones, salesmilestones, or at our discretion to maintain exclusive rights todistribute a product. Since there is uncertainty on the timingor whether such payments will have to be made, we have notincluded them in this table. These payments could range from$0 to $72 million.
29

ZIMMER HOLDINGS, INC. 2011 FORM 10-K ANNUAL REPORT
CRITICAL ACCOUNTING ESTIMATES
Our financial results are affected by the selection andapplication of accounting policies and methods. Significantaccounting policies which require management’s judgment arediscussed below.
Excess Inventory and Instruments – We mustdetermine as of each balance sheet date how much, if any, ofour inventory may ultimately prove to be unsaleable orunsaleable at our carrying cost. Similarly, we must alsodetermine if instruments on hand will be put to productive useor remain undeployed as a result of excess supply.Accordingly, inventory and instruments are written down totheir net realizable value. To determine the appropriate netrealizable value, we evaluate current stock levels in relation tohistorical and expected patterns of demand for all of ourproducts and instrument systems and components. The basisfor the determination is generally the same for all inventoryand instrument items and categories except forwork-in-process inventory, which is recorded at cost. Obsoleteor discontinued items are generally destroyed and completelywritten off. Management evaluates the need for changes toinventory and instruments net realizable values based onmarket conditions, competitive offerings and other factors on aregular basis.
Income Taxes – Our income tax expense, deferredtax assets and liabilities and reserves for unrecognized taxbenefits reflect management’s best assessment of estimatedfuture taxes to be paid. We are subject to income taxes in theU.S. and numerous foreign jurisdictions. Significant judgmentsand estimates are required in determining the consolidatedincome tax expense.
We estimate income tax expense and income tax liabilitiesand assets by taxable jurisdiction. Realization of deferred taxassets in each taxable jurisdiction is dependent on our abilityto generate future taxable income sufficient to realize thebenefits. We evaluate deferred tax assets on an ongoing basisand provide valuation allowances unless we determine it is“more likely than not” that the deferred tax benefit will berealized. Federal income taxes are provided on the portion ofthe income of foreign subsidiaries that is expected to beremitted to the U.S.
The calculation of our tax liabilities involves dealing withuncertainties in the application of complex tax laws andregulations in a multitude of jurisdictions across our globaloperations. We are subject to regulatory review or audit invirtually all of those jurisdictions and those reviews and auditsmay require extended periods of time to resolve. We recordour income tax provisions based on our knowledge of allrelevant facts and circumstances, including existing tax laws,our experience with previous settlement agreements, thestatus of current examinations and our understanding of howthe tax authorities view certain relevant industry andcommercial matters.
We recognize tax liabilities in accordance with theFinancial Accounting Standards Board’s (FASB) guidance onincome taxes and we adjust these liabilities when our judgmentchanges as a result of the evaluation of new information not
previously available. Due to the complexity of some of theseuncertainties, the ultimate resolution may result in a paymentthat is materially different from our current estimate of the taxliabilities. These differences will be reflected as increases ordecreases to income tax expense in the period in which theyare determined.
Commitments and Contingencies – Accruals forproduct liability and other claims are established with theassistance of internal and external legal counsel based oncurrent information and historical settlement information forclaims, related legal fees and for claims incurred but notreported. We use an actuarial model to assist management indetermining an appropriate level of accruals for productliability claims. Historical patterns of claim loss developmentover time are statistically analyzed to arrive at factors whichare then applied to loss estimates in the actuarial model.
In addition to our general product liability, we haverecorded provisions totaling $388.2 million related to theDurom Cup, including $162.0 million in 2011. See Note 19 toour consolidated financial statements for further discussion ofthe Durom Cup.
Goodwill and Intangible Assets – We evaluate thecarrying value of goodwill and indefinite life intangible assetsannually, or whenever events or circumstances indicate thecarrying value may not be recoverable. We evaluate thecarrying value of finite life intangible assets whenever eventsor circumstances indicate the carrying value may not berecoverable. Significant assumptions are required to estimatethe fair value of goodwill and intangible assets, most notablyestimated future cash flows generated by these assets. Assuch, these fair valuation measurements use significantunobservable inputs. Changes to these assumptions couldrequire us to record impairment charges on these assets.
In the fourth quarter of 2010, we determined our U.S.Spine reporting unit’s carrying value was in excess of itsestimated fair value. Fair value was determined using an equalweighting of income and market approaches. Fair value underthe income approach was determined by discounting topresent value the estimated future cash flows of the reportingunit. Fair value under the market approach utilized thecomparable transaction methodology, which uses valuationindicators determined from sales of other businesses that aresimilar to our U.S. Spine reporting unit.
As a result, we recorded a goodwill impairment charge forthe U.S. Spine reporting unit of $204.0 million during the yearended December 31, 2010. In the year ended December 31,2009, we also recorded an impairment charge related to thisreporting unit of $73.0 million. See Note 9 to our consolidatedfinancial statements for further discussion and the factors thatcontributed to these impairment charges.
In our annual impairment testing in 2011, we employed asimilar methodology of using income and market approaches toestimate fair value for the U.S. Spine reporting unit. The 2011impairment test concluded that goodwill was not impaired.However, since goodwill had been written down to its impliedfair value of $137.0 million in the prior year, the estimated fairvalue of the reporting unit was only 13 percent greater than itscarrying value. Therefore, minor changes to the estimated
30

ZIMMER HOLDINGS, INC. 2011 FORM 10-K ANNUAL REPORT
discounted cash flows or market conditions may cause us torecognize further impairment charges in the future.
We have six other reporting units with goodwill assignedto them. We estimated the fair value of those reporting unitsusing the income approach by discounting to present value theestimated future cash flows of the reporting unit, or by doing aqualitative assessment of changes in fair value from the prioryear’s income approach. For each of those six reporting units,the estimated fair values substantially exceeded their carryingvalue.
As of December 31, 2011, we had intangible assets of$205.8 million related to trademarks and trade names, ofwhich $192.3 million are classified as having an indefinite life.We currently have and anticipate future product developmentefforts that may replace the current products that use thosetrademarks and trade names. While it is anticipated, it is notcertain that these new products will utilize these trademarksand trade names. If these new products do not use thesetrademarks and trade names, these assets may be impairedand/or their useful lives may need adjusted.
Share-based Payment – We measure share-basedpayment expense at the grant date based on the fair value ofthe award and recognize expense over the requisite serviceperiod. Determining the fair value of share-based awards atthe grant date requires judgment, including estimating theexpected life of stock options and the expected volatility ofour stock. Additionally, we must estimate the amount of share-based awards that are expected to be forfeited. We estimateexpected volatility based upon the implied volatility of activelytraded options on our stock. The expected life of stock optionsand estimated forfeitures are based upon our employees’historical exercise and forfeiture behaviors. The assumptionsused in determining the grant date fair value and the expectedforfeitures represent management’s best estimates.
RECENT ACCOUNTING PRONOUNCEMENTS
See Note 2 to our consolidated financial statements to seehow recent accounting pronouncements have affected or mayaffect our financial position, results of operations or cashflows.
31

ZIMMER HOLDINGS, INC. 2011 FORM 10-K ANNUAL REPORT
ITEM 7A. Quantitative and Qualitative Disclosures About Market Risk
MARKET RISK
We are exposed to certain market risks as part of ourongoing business operations, including risks from changes inforeign currency exchange rates, interest rates and commodityprices that could affect our financial condition, results ofoperations and cash flows. We manage our exposure to theseand other market risks through regular operating andfinancing activities and through the use of derivative financialinstruments. We use derivative financial instruments solely asrisk management tools and not for speculative investmentpurposes.
FOREIGN CURRENCY EXCHANGE RISK
We operate on a global basis and are exposed to the riskthat our financial condition, results of operations and cashflows could be adversely affected by changes in foreigncurrency exchange rates. We are primarily exposed to foreigncurrency exchange rate risk with respect to transactions andnet assets denominated in Euros, Swiss Francs, Japanese Yen,British Pounds, Canadian Dollars, Australian Dollars, KoreanWon, Swedish Krona, Czech Koruna, Thai Baht, TaiwanDollars, South African Rand, Russian Rubles and IndianRupees. We manage the foreign currency exposure centrally,on a combined basis, which allows us to net exposures and totake advantage of any natural offsets. To reduce theuncertainty of foreign currency exchange rate movements ontransactions denominated in foreign currencies, we enter intoderivative financial instruments in the form of foreigncurrency exchange forward contracts and options with majorfinancial institutions. These forward contracts and options aredesigned to hedge anticipated foreign currency transactions,primarily intercompany sale and purchase transactions, forperiods consistent with commitments. Realized and unrealizedgains and losses on these contracts and options that qualify ascash flow hedges are temporarily recorded in othercomprehensive income, then recognized in cost of productssold when the hedged item affects net earnings.
For contracts outstanding at December 31, 2011, we hadobligations to purchase U.S. Dollars and sell Euros, JapaneseYen, British Pounds, Canadian Dollars, Australian Dollars,Korean Won, Swedish Krona, Czech Koruna, Thai Baht,Taiwan Dollars, South African Rand, Russian Rubles andIndian Rupees and purchase Swiss Francs and sell U.S. Dollarsat set maturity dates ranging from January 2012 through June2014. The notional amounts of outstanding forward contractsentered into with third parties to purchase U.S. Dollars atDecember 31, 2011 were $1.3 billion. The notional amounts ofoutstanding forward contracts entered into with third partiesto purchase Swiss Francs at December 31, 2011 were $246.7million. The weighted average contract rates outstanding atDecember 31, 2010 were Euro:USD 1.36, Swiss Franc:USD0.91, USD:Japanese Yen 81.18, British Pound:USD 1.58,USD:Canadian Dollar 1.02, Australian Dollar:USD 0.91,
USD:Korean Won 1,159, USD:Swedish Krona 6.89, USD:CzechKoruna 18.32, USD:Thai Baht 31.54, USD:Taiwan Dollar 29.21,USD:South African Rand 8.12, USD:Russian Ruble 32.01 andUSD:Indian Ruppee 48.98.
We maintain written policies and procedures governingour risk management activities. Our policy requires thatcritical terms of hedging instruments are the same as hedgedforecasted transactions. On this basis, with respect to cashflow hedges, changes in cash flows attributable to hedgedtransactions are generally expected to be completely offset bychanges in the fair value of hedge instruments. As part of ourrisk management program, we also perform sensitivityanalyses to assess potential changes in revenue, operatingresults, cash flows and financial position relating tohypothetical movements in currency exchange rates. Asensitivity analysis of changes in the fair value of foreigncurrency exchange forward contracts outstanding atDecember 31, 2011 indicated that, if the U.S. Dollar uniformlychanged in value by 10 percent relative to the variouscurrencies, with no change in the interest differentials, the fairvalue of those contracts would increase or decrease earningsbefore income taxes in periods through 2013, depending onthe direction of the change, by the following averageapproximate amounts (in millions):
CurrencyAverage
Amount
Euro $53.7Swiss Franc 23.4Japanese Yen 33.4British Pound 11.7Canadian Dollar 7.6Australian Dollar 11.4Korean Won 2.8Swedish Krona 2.3Czech Koruna 0.6Thai Baht 0.8Taiwan Dollars 1.8South African Rand 0.4Russian Rubles 1.1Indian Rupees 0.9
Any change in the fair value of foreign currency exchangeforward contracts as a result of a fluctuation in a currencyexchange rate is expected to be largely offset by a change inthe value of the hedged transaction. Consequently, foreigncurrency exchange contracts would not subject us to materialrisk due to exchange rate movements because gains and losseson these contracts offset gains and losses on the assets,liabilities and transactions being hedged.
We had net investment exposures to net foreign currencydenominated assets and liabilities of $2,404.7 million atDecember 31, 2011, primarily in Euros and Japanese Yen.$1,314.3 million of the net asset exposure at December 31,2011 relates to goodwill recorded in the Europe and AsiaPacific geographic segments.
32

ZIMMER HOLDINGS, INC. 2011 FORM 10-K ANNUAL REPORT
We enter into foreign currency forward exchangecontracts with terms of one month to manage currencyexposures for monetary assets and liabilities denominated in acurrency other than an entity’s functional currency. As aresult, foreign currency remeasurement gains/lossesrecognized in earnings are generally offset with gains/losses onthe foreign currency forward exchange contracts in the samereporting period.
COMMODITY PRICE RISK
We purchase raw material commodities such as cobaltchrome, titanium, tantalum, polymer and sterile packaging. Weenter into supply contracts generally with terms of 12 to 24months, where available, on these commodities to alleviate theeffect of market fluctuation in prices. As part of our riskmanagement program, we perform sensitivity analyses relatedto potential commodity price changes. A 10 percent pricechange across all these commodities would not have a materialeffect on our consolidated financial position, results ofoperations or cash flows.
INTEREST RATE RISK
In the normal course of business, we are exposed tomarket risk from changes in interest rates that could affect ourresults of operations and financial condition. We manage ourexposure to interest rate risks through our regular operationsand financing activities.
We invest our cash and cash equivalents primarily inhighly-rated corporate commercial paper and bank deposits.We also have short-term and long-term investments in highly-rated corporate debt securities, U.S. government and agencydebt securities, U.S. government treasury funds, municipalbonds, foreign government debt securities, commercial paperand certificates of deposit. The primary investment objective isto ensure capital preservation of our invested principal funds.Currently, we do not use derivative financial instruments inour investment portfolio.
We are exposed to interest rate risk on our debtobligations and our cash and cash equivalents. Presently, all ofour debt outstanding under the Senior Credit Facility bearsinterest at short-term rates.
In 2010, we entered into interest rate swap agreementswith a consolidated notional amount of $250 million that hedgea portion of our $500 million 4.625 percent Senior Notes dueNovember 30, 2019. On the interest rate swap agreementsoutstanding as of December 31, 2011, we receive a fixedinterest rate of 4.625 percent and we pay variable interestequal to the three-month LIBOR plus an average of 133 basispoints.
The interest rate swap agreements are to manage ourexposure to interest rate movements by converting fixed-ratedebt into variable-rate debt. The objective of the instruments isto more closely align interest expense with interest incomereceived on cash and cash equivalents.
These derivative instruments are designated as fair valuehedges under U.S. GAAP. Changes in the fair value of the
derivative instrument are recorded in earnings and are offsetby gains or losses on the underlying debt instrument.
In 2011, we entered into multiple cross-currency interestrate swap agreements with a total notional amount of11,798 million Japanese Yen to hedge U.S. Dollar debtborrowed by our Japan subsidiary. We designated these swapsas cash flow hedges of the foreign currency exchange andinterest rate risks. The effective portion of changes in fairvalue of the cross-currency interest rate swaps is temporarilyrecorded in other comprehensive income and then recognizedin interest expense when the hedged item affects net earnings.On the cross-currency interest rate swap agreementsoutstanding as of December 31, 2011, we pay a fixed interestrate of 0.1 percent and receive variable interest equal to thethree-month LIBOR plus 18.5 basis points.
The cross-currency interest rate swap agreements manageforeign currency exchange risk associated with remeasuringthe debt to Japanese Yen and the interest rate risk associatedwith the variable-rate debt. We entered into these instrumentsin order to take advantage of a market situation where wecould lock-in interest at a very low, fixed-rate on debt.
Based upon our overall interest rate exposure as ofDecember 31, 2011, a change of 10 percent in interest rates,assuming the amount outstanding remains constant, would nothave a material effect on net interest expense. This analysisdoes not consider the effect of the change in the level ofoverall economic activity that could exist in such anenvironment.
CREDIT RISK
Financial instruments, which potentially subject us toconcentrations of credit risk, are primarily cash and cashequivalents, short-term and long-term investments, derivativeinstruments, counterparty transactions and accountsreceivable.
We place our investments in highly-rated financialinstitutions or highly-rated debt securities and limit theamount of credit exposure to any one entity. We believe we donot have any significant credit risk on our cash and cashequivalents and investments.
We are exposed to credit loss if the financial institutionsor counterparties issuing the debt security fail to perform.However, this loss is limited to the amounts, if any, by whichthe obligations of the counterparty to the financial instrumentcontract exceed our obligation. We also minimize exposure tocredit risk by dealing with a diversified group of major financialinstitutions. We manage credit risk by monitoring the financialcondition of our counterparties using standard creditguidelines. We do not anticipate any nonperformance by any ofthe counterparties.
Concentration of credit risk with respect to trade accountsreceivable is limited due to the large number of customers andtheir dispersion across a number of geographic areas and byfrequent monitoring of the creditworthiness of the customersto whom credit is granted in the normal course of business.Substantially all of our trade receivables are concentrated inthe public and private hospital and healthcare industry in the
33

ZIMMER HOLDINGS, INC. 2011 FORM 10-K ANNUAL REPORT
U.S. and internationally or with distributors or dealers whooperate in international markets and, accordingly, are exposedto their respective business, economic and country specificvariables.
Repayment is dependent upon the financial stability ofthese industry sectors and the respective countries’ nationaleconomic and healthcare systems. Most notably, in Europehealthcare is sponsored by the government. Because we sellproducts to public hospitals in those countries, we areindirectly exposed to government budget constraints. Wecontinue to monitor the financial crisis in the Euro zone andthe indirect credit exposure we have to those governmentsthrough their public hospitals. In countries that have beenwidely recognized as presenting the highest risk, our accounts
receivable, net of allowances for doubtful accounts, in Greece,Italy, Portugal and Spain total $231.1 million, or 28% of ourtotal accounts receivable balance, net, with Italy and Spainaccounting for $217.9 million of that amount. We are activelymonitoring the situations in these countries and, to the extentthe respective governments’ ability to fund their publichospital programs deteriorates, we may have to recordsignificant bad debt expenses in the future.
While we are exposed to risks from the broaderhealthcare industry in Europe and around the world, there isno significant net exposure due to any individual customer.Exposure to credit risk is controlled through credit approvals,credit limits and monitoring procedures and we believe thatreserves for losses are adequate.
34

ZIMMER HOLDINGS, INC. 2011 FORM 10-K ANNUAL REPORT
Management’s Report on Internal Control Over Financial Reporting
The management of Zimmer Holdings, Inc. is responsible for establishing and maintaining adequate internal control overfinancial reporting. Internal control over financial reporting is defined in Rules 13a-15(f) or 15d-15(f) promulgated under theSecurities Exchange Act of 1934 as a process designed by, or under the supervision of, the company’s principal executive andprincipal financial officers and effected by the company’s Board of Directors, management and other personnel, to providereasonable assurance regarding the reliability of financial reporting and the preparation of financial statements for externalpurposes in accordance with U.S. generally accepted accounting principles and includes those policies and procedures that:
• Pertain to the maintenance of records that in reasonable detail accurately and fairly reflect the transactions and dispositionsof the assets of the company;
• Provide reasonable assurance that transactions are recorded as necessary to permit preparation of financial statements inaccordance with U.S. generally accepted accounting principles, and that receipts and expenditures of the company are beingmade only in accordance with authorizations of management and directors of the company; and
• Provide reasonable assurance regarding prevention or timely detection of unauthorized acquisition, use or disposition of thecompany’s assets that could have a material effect on the financial statements.
Because of its inherent limitations, the company’s internal control over financial reporting may not prevent or detectmisstatements. Also, projections of any evaluation of effectiveness to future periods are subject to the risk that controls maybecome inadequate because of changes in conditions, or that the degree of compliance with the policies or procedures maydeteriorate.
The company’s management assessed the effectiveness of the company’s internal control over financial reporting as ofDecember 31, 2011. In making this assessment, the company’s management used the criteria set forth by the Committee ofSponsoring Organizations of the Treadway Commission (COSO) in Internal Control-Integrated Framework.
Based on that assessment, management has concluded that, as of December 31, 2011, the company’s internal control overfinancial reporting is effective based on those criteria.
The company’s independent registered public accounting firm has audited the effectiveness of the company’s internal controlover financial reporting as of December 31, 2011, as stated in its report which appears in Item 8 of this Annual Report onForm 10-K.
35

ZIMMER HOLDINGS, INC. 2011 FORM 10-K ANNUAL REPORT
ITEM 8. Financial Statements and Supplementary Data
Zimmer Holdings, Inc.Index to Consolidated Financial Statements Page
Financial Statements:
Report of Independent Registered Public Accounting Firm 37
Consolidated Statements of Earnings for the Years Ended December 31, 2011, 2010 and 2009 38
Consolidated Statements of Comprehensive Income for the Years Ended December 31, 2011, 2010 and 2009 39
Consolidated Balance Sheets as of December 31, 2011 and 2010 40
Consolidated Statements of Stockholders’ Equity for the Years Ended December 31, 2011, 2010 and 2009 41
Consolidated Statements of Cash Flows for the Years Ended December 31, 2011, 2010 and 2009 42
Notes to Consolidated Financial Statements 43
36

ZIMMER HOLDINGS, INC. 2011 FORM 10-K ANNUAL REPORT
Report of Independent Registered Public Accounting Firm
To the Stockholders and Board of Directors of Zimmer Holdings, Inc.:
In our opinion, the consolidated financial statements listed in the index appearing under Item 15(a)(1) present fairly, in allmaterial respects, the financial position of Zimmer Holdings, Inc. and its subsidiaries at December 31, 2011 and 2010, and theresults of their operations and their cash flows for each of the three years in the period ended December 31, 2011 in conformitywith accounting principles generally accepted in the United States of America. In addition, in our opinion, the financial statementschedule listed in the accompanying index appearing under Item 15(a)(2) presents fairly, in all material respects, the informationset forth therein when read in conjunction with the related consolidated financial statements. Also in our opinion, the Companymaintained, in all material respects, effective internal control over financial reporting as of December 31, 2011, based on criteriaestablished in Internal Control - Integrated Framework issued by the Committee of Sponsoring Organizations of the TreadwayCommission (COSO). The Company’s management is responsible for these financial statements and financial statement schedule,for maintaining effective internal control over financial reporting and for its assessment of the effectiveness of internal control overfinancial reporting, included in the accompanying Report of Management on Internal Control over Financial Reporting. Ourresponsibility is to express opinions on these financial statements, on the financial statement schedule, and on the Company’sinternal control over financial reporting based on our integrated audits. We conducted our audits in accordance with the standardsof the Public Company Accounting Oversight Board (United States). Those standards require that we plan and perform the auditsto obtain reasonable assurance about whether the financial statements are free of material misstatement and whether effectiveinternal control over financial reporting was maintained in all material respects. Our audits of the financial statements includedexamining, on a test basis, evidence supporting the amounts and disclosures in the financial statements, assessing the accountingprinciples used and significant estimates made by management, and evaluating the overall financial statement presentation. Ouraudit of internal control over financial reporting included obtaining an understanding of internal control over financial reporting,assessing the risk that a material weakness exists, and testing and evaluating the design and operating effectiveness of internalcontrol based on the assessed risk. Our audits also included performing such other procedures as we considered necessary in thecircumstances. We believe that our audits provide a reasonable basis for our opinions.
A company’s internal control over financial reporting is a process designed to provide reasonable assurance regarding thereliability of financial reporting and the preparation of financial statements for external purposes in accordance with generallyaccepted accounting principles. A company’s internal control over financial reporting includes those policies and procedures that(i) pertain to the maintenance of records that, in reasonable detail, accurately and fairly reflect the transactions and dispositions ofthe assets of the company; (ii) provide reasonable assurance that transactions are recorded as necessary to permit preparation offinancial statements in accordance with generally accepted accounting principles, and that receipts and expenditures of thecompany are being made only in accordance with authorizations of management and directors of the company; and (iii) providereasonable assurance regarding prevention or timely detection of unauthorized acquisition, use, or disposition of the company’sassets that could have a material effect on the financial statements.
Because of its inherent limitations, internal control over financial reporting may not prevent or detect misstatements. Also,projections of any evaluation of effectiveness to future periods are subject to the risk that controls may become inadequate becauseof changes in conditions, or that the degree of compliance with the policies or procedures may deteriorate.
PricewaterhouseCoopers LLPChicago, IllinoisFebruary 24, 2012
37
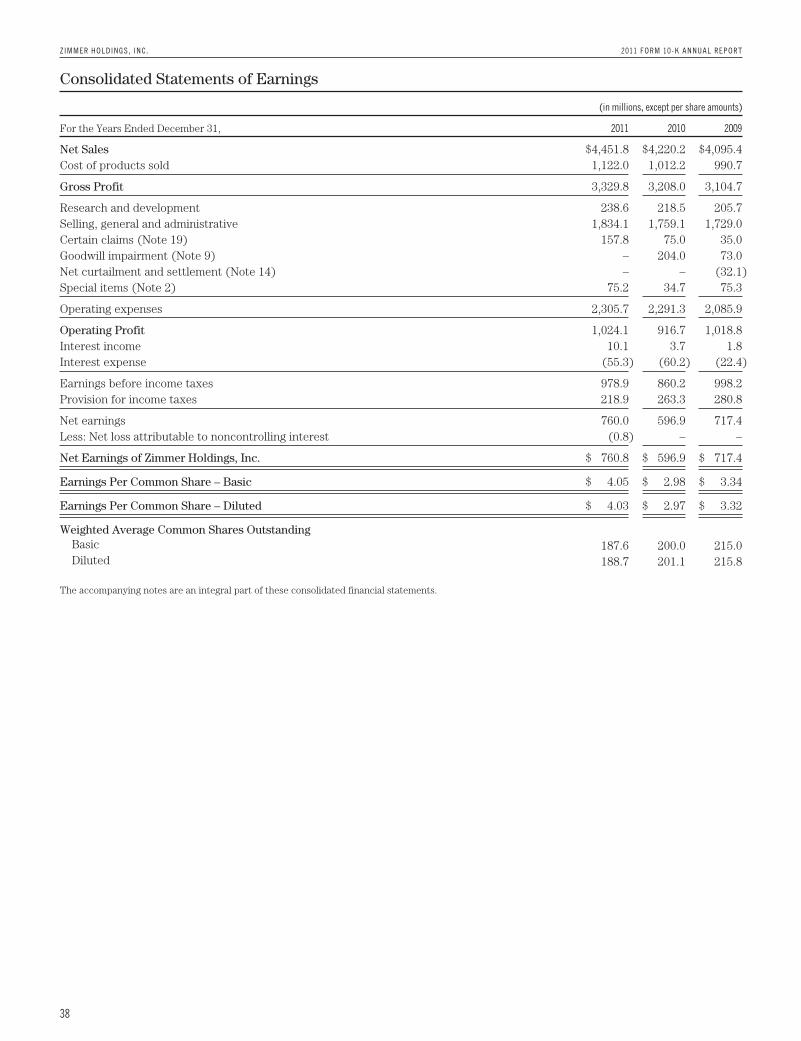
ZIMMER HOLDINGS, INC. 2011 FORM 10-K ANNUAL REPORT
Consolidated Statements of Earnings
(in millions, except per share amounts)
For the Years Ended December 31, 2011 2010 2009
Net Sales $4,451.8 $4,220.2 $4,095.4Cost of products sold 1,122.0 1,012.2 990.7
Gross Profit 3,329.8 3,208.0 3,104.7
Research and development 238.6 218.5 205.7Selling, general and administrative 1,834.1 1,759.1 1,729.0Certain claims (Note 19) 157.8 75.0 35.0Goodwill impairment (Note 9) – 204.0 73.0Net curtailment and settlement (Note 14) – – (32.1)Special items (Note 2) 75.2 34.7 75.3
Operating expenses 2,305.7 2,291.3 2,085.9
Operating Profit 1,024.1 916.7 1,018.8Interest income 10.1 3.7 1.8Interest expense (55.3) (60.2) (22.4)
Earnings before income taxes 978.9 860.2 998.2Provision for income taxes 218.9 263.3 280.8
Net earnings 760.0 596.9 717.4Less: Net loss attributable to noncontrolling interest (0.8) – –
Net Earnings of Zimmer Holdings, Inc. $ 760.8 $ 596.9 $ 717.4
Earnings Per Common Share – Basic $ 4.05 $ 2.98 $ 3.34
Earnings Per Common Share – Diluted $ 4.03 $ 2.97 $ 3.32
Weighted Average Common Shares OutstandingBasic 187.6 200.0 215.0Diluted 188.7 201.1 215.8
The accompanying notes are an integral part of these consolidated financial statements.
38

ZIMMER HOLDINGS, INC. 2011 FORM 10-K ANNUAL REPORT
Consolidated Statements of Comprehensive Income
(in millions)
For the Years Ended December 31, 2011 2010 2009
Net Earnings $760.0 $596.9 $717.4
Other Comprehensive Income (Loss):
Foreign currency cumulative translation adjustments 4.6 (38.6) 114.0
Unrealized cash flow hedge gains/(losses), net of tax effects of $4.3 in 2011, $10.1 in 2010 and $8.9in 2009 (30.6) 21.6 (28.9)
Reclassification adjustments on cash flow hedges, net of tax effects of $(16.7) in 2011, $(4.3) in2010 and $(0.1) in 2009 24.5 (11.6) (18.1)
Unrealized gains/(losses) on securities, net of tax effects of $0.0 in 2011, $0.3 in 2010 and $0.1 in2009 0.2 (0.8) (0.3)
Reclassification adjustments on securities, net of tax effects of $(1.2) in 2010 – 2.2 –
Adjustments to prior service cost and unrecognized actuarial assumptions, net of tax effects of$23.0 in 2011, $4.4 in 2010 and $(1.4) in 2009 (48.3) (10.4) 51.9
Total Other Comprehensive Income (Loss) (49.6) (37.6) 118.6
Comprehensive Income 710.4 559.3 836.0
Comprehensive Loss Attributable to Noncontrolling Interest (0.9) – –
Comprehensive Income Attributable to Zimmer Holdings, Inc. $ 711.3 $ 559.3 $ 836.0
The accompanying notes are an integral part of these consolidated financial statements.
39

ZIMMER HOLDINGS, INC. 2011 FORM 10-K ANNUAL REPORT
Consolidated Balance Sheets
(in millions)
As of December 31, 2011 2010
ASSETSCurrent Assets:
Cash and cash equivalents $ 768.3 $ 668.9Short-term investments 455.5 265.1Accounts receivable, less allowance for doubtful accounts 838.8 775.9Inventories 929.8 936.4Prepaid expenses and other current assets 73.7 127.7Deferred income taxes 210.5 235.7
Total Current Assets 3,276.6 3,009.7Property, plant and equipment, net 1,207.3 1,213.8Goodwill 2,626.0 2,580.8Intangible assets, net 798.5 827.1Other assets 606.9 368.5
Total Assets $ 8,515.3 $ 7,999.9
LIABILITIES AND STOCKHOLDERS’ EQUITYCurrent Liabilities:
Accounts payable $ 143.3 $ 129.6Income taxes 8.6 48.9Short-term debt 143.3 –Other current liabilities 571.9 524.0
Total Current Liabilities 867.1 702.5Other long-term liabilities 557.4 384.0Long-term debt 1,576.0 1,142.1
Total Liabilities 3,000.5 2,228.6
Commitments and Contingencies (Note 19)Stockholders’ Equity:
Common stock, $0.01 par value, one billion shares authorized,255.9 million (254.6 million in 2010) issued 2.5 2.5
Paid-in capital 3,399.2 3,293.5Retained earnings 6,426.8 5,699.4Accumulated other comprehensive income 271.4 321.0Treasury stock, 77.9 million shares (59.0 million shares in 2010) (4,592.7) (3,545.1)
Total Zimmer Holdings, Inc. stockholders’ equity 5,507.2 5,771.3Noncontrolling interest 7.6 –
Total Stockholders’ Equity 5,514.8 5,771.3
Total Liabilities and Stockholders’ Equity $ 8,515.3 $ 7,999.9
The accompanying notes are an integral part of these consolidated financial statements.
40

ZIMMER HOLDINGS, INC. 2011 FORM 10-K ANNUAL REPORT
Consolidated Statements of Stockholders’ Equity
(in millions)
Zimmer Holdings, Inc. Stockholders
AccumulatedOther Total
Common Shares Paid-in Retained Comprehensive Treasury Shares Noncontrolling Stockholders’
Number Amount Capital Earnings Income Number Amount Interest Equity
Balance January 1, 2009 253.7 $2.5 $3,138.5 $4,385.5 $240.0 (30.1) $(2,116.2) $ 3.6 $ 5,653.9
Net earnings – – – 717.4 – – – – 717.4
Other comprehensive income – – – – 118.6 – – – 118.6
Purchase of noncontrolling interest – – (5.0) – – – – (3.6) (8.6)
Stock compensation plans, including tax
benefits 0.4 – 81.1 (0.4) – – 0.4 – 81.1
Share repurchases – – – – – (19.8) (923.7) – (923.7)
Balance December 31, 2009 254.1 2.5 3,214.6 5,102.5 358.6 (49.9) (3,039.5) – 5,638.7
Net earnings – – – 596.9 – – – – 596.9
Other comprehensive loss – – – – (37.6) – – – (37.6)
Stock compensation plans, including tax
benefits 0.5 – 78.9 – – – – – 78.9
Share repurchases – – – – – (9.1) (505.6) – (505.6)
Balance December 31, 2010 254.6 2.5 3,293.5 5,699.4 321.0 (59.0) (3,545.1) – 5,771.3
Net earnings – – – 760.8 – – – (0.8) 760.0
Other comprehensive loss – – – – (49.6) – – (0.1) (49.7)
Business combination with a noncontrolling
interest – – – – – – – 8.5 8.5
Cash dividend declared of $0.18 per share of
common stock – – – (32.1) – – – – (32.1)
Stock compensation plans, including tax
benefits 1.3 – 105.7 (1.3) – – 2.4 – 106.8
Share repurchases – – – – – (18.9) (1,050.0) – (1,050.0)
Balance December 31, 2011 255.9 $2.5 $3,399.2 $6,426.8 $271.4 (77.9) $(4,592.7) $ 7.6 $ 5,514.8
The accompanying notes are an integral part of these consolidated financial statements.
41

ZIMMER HOLDINGS, INC. 2011 FORM 10-K ANNUAL REPORT
Consolidated Statements of Cash Flows
(in millions)
For the Years Ended December 31, 2011 2010 2009
Cash flows provided by (used in) operating activities:Net earnings $ 760.0 $ 596.9 $ 717.4Adjustments to reconcile net earnings to net cash provided by operating activities:
Depreciation and amortization 359.9 340.2 337.4Goodwill impairment – 204.0 73.0Net curtailment and settlement – – (32.1)Share-based compensation 60.5 62.0 75.3Income tax benefit from stock option exercises 12.9 4.2 3.5Excess income tax benefit from stock option exercises (5.0) (1.3) (0.4)Inventory step-up 11.4 1.4 12.5Deferred income tax provision (19.7) (72.5) (19.7)Changes in operating assets and liabilities, net of acquired assets and liabilities
Income taxes payable 14.6 7.7 7.0Receivables (63.2) (33.0) (4.6)Inventories 7.2 25.8 36.2Accounts payable and accrued liabilities 20.0 (0.8) (132.6)Other assets and liabilities 18.3 58.9 44.6
Net cash provided by operating activities 1,176.9 1,193.5 1,117.5
Cash flows provided by (used in) investing activities:Additions to instruments (155.4) (192.5) (123.7)Additions to other property, plant and equipment (113.8) (79.2) (105.1)Acquisition of intellectual property rights (18.9) (8.5) (35.8)Purchases of investments (662.1) (413.3) (66.4)Sales of investments 394.8 67.5 –Other business combination investments (56.8) (82.6) (39.5)Investments in other assets (12.2) (18.3) (10.7)
Net cash used in investing activities (624.4) (726.9) (381.2)
Cash flows provided by (used in) financing activities:Proceeds from issuance of notes 549.3 – 998.8Net proceeds (payments) under revolving credit facilities 0.5 (2.2) (330.0)Debt issuance costs (4.0) – (8.5)Proceeds from employee stock compensation plans 43.4 16.9 9.5Excess income tax benefit from stock option exercises 5.0 1.3 0.4Acquisition of noncontrolling interest – – (8.6)Repurchase of common stock (1,050.0) (505.6) (923.7)
Net cash used in financing activities (455.8) (489.6) (262.1)
Effect of exchange rates on cash and cash equivalents 2.7 0.2 4.9
Increase (decrease) in cash and cash equivalents 99.4 (22.8) 479.1Cash and cash equivalents, beginning of year 668.9 691.7 212.6
Cash and cash equivalents, end of year $ 768.3 $ 668.9 $ 691.7
The accompanying notes are an integral part of these consolidated financial statements.
42

ZIMMER HOLDINGS, INC. 2011 FORM 10-K ANNUAL REPORT
Notes to Consolidated Financial Statements
1. BUSINESS
We design, develop, manufacture and market orthopaedicreconstructive, spinal and trauma devices, biologics, dentalimplants and related surgical products. We also provide otherhealthcare related services. Orthopaedic reconstructivedevices restore function lost due to disease or trauma in jointssuch as knees, hips, shoulders and elbows. Dentalreconstructive implants restore function and aesthetics inpatients who have lost teeth due to trauma or disease. Spinaldevices are utilized by orthopaedic surgeons andneurosurgeons in the treatment of degenerative diseases,deformities and trauma in all regions of the spine. Traumaproducts are devices used primarily to reattach or stabilizedamaged bone and tissue to support the body’s natural healingprocess. Our related surgical products include surgicalsupplies and instruments designed to aid in orthopaedicsurgical procedures and post-operation rehabilitation. We haveoperations in more than 25 countries and market our productsin more than 100 countries. We operate in a single industry buthave three reportable geographic segments, the Americas,Europe and Asia Pacific.
The words “we,” “us,” “our” and similar words refer toZimmer Holdings, Inc. and its subsidiaries. Zimmer Holdingsrefers to the parent company only.
2. SIGNIFICANT ACCOUNTING POLICIES
Basis of Presentation – The consolidated financialstatements include the accounts of Zimmer Holdings and itssubsidiaries in which it holds a controlling financial interest.Investments in companies in which we exercise significantinfluence over the operating and financial affairs, but do notcontrol, are accounted for under the equity method. Under theequity method, we record the investment at cost and adjustthe carrying amount of the investment by our proportionateshare of the investee’s net earnings or losses. All significantintercompany accounts and transactions are eliminated. Theconsolidated financial statements for some of our internationalsubsidiaries are for an annual period that ended onDecember 25, 2011, 2010 and 2009. Certain amounts in the2010 and 2009 consolidated financial statements have beenreclassified to conform to the 2011 presentation.
Use of Estimates – The consolidated financial statementsare prepared in conformity with accounting principlesgenerally accepted in the U.S. which require us to makeestimates and assumptions that affect the reported amounts ofassets and liabilities and disclosure of contingent assets andliabilities at the date of the financial statements and thereported amounts of revenues and expenses during thereporting period. Actual results could differ from thoseestimates.
Foreign Currency Translation – The financial statementsof our foreign subsidiaries are translated into U.S. dollars usingperiod-end exchange rates for assets and liabilities and average
exchange rates for operating results. Unrealized translationgains and losses are included in accumulated othercomprehensive income in stockholders’ equity. When atransaction is denominated in a currency other than thesubsidiary’s functional currency, we recognize a transactiongain or loss when the transaction is settled. Foreign currencytransaction gains and losses included in net earnings for theyears ended December 31, 2011, 2010 and 2009 were notsignificant.
Revenue Recognition – We sell product through threeprincipal channels: 1) direct to healthcare institutions, referredto as direct channel accounts; 2) through stocking distributorsand healthcare dealers; and 3) directly to dental practices anddental laboratories. The direct channel accounts representapproximately 80 percent of our net sales. Through thischannel, inventory is generally consigned to sales agents orcustomers so that products are available when needed forsurgical procedures. No revenue is recognized upon theplacement of inventory into consignment as we retain title andmaintain the inventory on our balance sheet. Uponimplantation, we issue an invoice and revenue is recognized.Pricing for products is generally predetermined by contractswith customers, agents acting on behalf of customer groups orby government regulatory bodies, depending on the market.Price discounts under group purchasing contracts aregenerally linked to volume of implant purchases by customerhealthcare institutions within a specified group. At negotiatedthresholds within a contract buying period, price discountsmay increase.
Sales to stocking distributors, healthcare dealers, dentalpractices and dental laboratories account for approximately20 percent of our net sales. With these types of sales, revenueis recognized when title to product passes, either uponshipment of the product or in some cases upon implantation ofthe product. Product is generally sold at contractually fixedprices for specified periods. Payment terms vary by customer,but are typically less than 90 days.
If sales incentives are earned by a customer forpurchasing a specified amount of our product, we estimatewhether such incentives will be achieved and, if so, recognizethese incentives as a reduction in revenue in the same periodthe underlying revenue transaction is recognized. Occasionallyproducts are returned, and, accordingly, we maintain anestimated sales return reserve that is recorded as a reductionin revenue. Product returns were not significant for the yearsended December 31, 2011, 2010 and 2009.
Taxes collected from customers and remitted togovernmental authorities are presented on a net basis andexcluded from revenues.
Shipping and Handling – Amounts billed to customersfor shipping and handling of products are reflected in net salesand are not significant. Expenses incurred related to shippingand handling of products are reflected in selling, general andadministrative and were $142.1 million, $129.1 million and
43

ZIMMER HOLDINGS, INC. 2011 FORM 10-K ANNUAL REPORT
Notes to Consolidated Financial Statements (Continued)
$121.8 million for the years ended December 31, 2011, 2010and 2009, respectively.
Research and Development – We expense all research anddevelopment costs as incurred. Research and developmentcosts include salaries, prototypes, depreciation of equipmentused in research and development, consultant fees and servicefees paid to collaborative partners. Where contingentmilestone payments are due to third parties under researchand development arrangements, the milestone paymentobligations are expensed when the milestone results areachieved.
Litigation – We record a liability for contingent losses,including future legal costs, settlements and judgments, whenwe consider it is probable a liability has been incurred and theamount of the loss can be reasonably estimated.
Special Items – We recognize expenses resulting directlyfrom our business combinations, employee terminationbenefits, certain contract terminations, consulting andprofessional fees and asset impairment charges connected withglobal restructuring, quality excellence and transformationinitiatives, and other items as “Special items” in ourconsolidated statement of earnings. “Special items” included(in millions):
For the Years Ended December 31, 2011 2010 2009
Adjustment or impairment of assets andobligations, net $ 8.4 $11.4 $(1.5)
Consulting and professional fees 26.0 4.9 11.7Employee severance and retention, including
share-based compensation acceleration 23.1 6.7 19.0Information technology integration 0.5 0.1 1.1Vacated facilities – 0.2 1.4Facility and employee relocation 3.2 2.0 5.4Distributor acquisitions 2.0 1.9 1.1Certain litigation matters 0.1 (0.3) 23.4Contract terminations 6.3 3.9 9.4Other 5.6 3.9 4.3
Special items $75.2 $34.7 $75.3
Adjustment or impairment of assets and obligationsrelates to impairment on assets that were acquired in businesscombinations, impairment of fixed assets related to ourtransformation initiatives or adjustments to certain liabilities ofacquired companies due to changes in circumstancessurrounding those liabilities subsequent to the relatedmeasurement period.
Consulting and professional fees relate to third-partyconsulting and professional fees related to our qualityexcellence and transformation initiatives, third-partyconsulting fees related to certain information systemimplementations, third-party integration consulting performedin a variety of areas such as tax, compliance, logistics andhuman resources for our business combinations, third-partyfees related to severance and termination benefits matters andlegal fees related to litigation matters involving acquiredbusinesses that existed prior to our acquisition or resultedfrom our acquisition.
In 2011, 2010 and 2009, we terminated some employees aswe reduced management layers, restructured certain areas,and commenced initiatives to focus on business opportunitiesthat best support our strategic priorities. In 2011, 2010 and2009, approximately 500, 60 and 300 employees, respectively,from across the globe were affected by these actions. As aresult of these changes in our work force and headcountreductions from acquisitions, we incurred expenses related toseverance benefits, redundant salaries as we worked throughtransition periods, share-based compensation acceleration andother employee termination-related costs. The majority ofthese termination benefits were provided in accordance withour existing or local government policies and are consideredongoing benefits. These costs were accrued when they becameprobable and estimable and were recorded as part of othercurrent liabilities. The majority of these costs were paid duringthe year they were incurred.
Information technology integration relates to thenon-capitalizable costs associated with integrating theinformation systems of acquired businesses.
Vacated facilities relates to certain leased facilities weceased using in 2010 and 2009. Accordingly, we recordedexpense for the remaining lease payments, less estimatedsublease recoveries, and wrote-off any assets being used inthose facilities.
Facility and employee relocation relates to costsassociated with relocating certain facilities, employeerelocation resulting from our business combinations andsalaries and benefits of employees who are involved with ourtransformation initiatives.
Over the past few years we have acquired a number ofU.S. and foreign-based distributors. We have incurred variouscosts related to the consummation and integration of thosebusinesses.
Certain litigation matters relate to costs and adjustmentsrecognized during the year for the estimated or actualsettlement of various legal matters, including patent litigationmatters, commercial litigation matters and matters arisingfrom our acquisitions of certain competitive distributorships inprior years. In 2009, we made a concerted effort to settle someof these matters to avoid further litigation costs.
Contract termination costs relate to terminatedagreements in connection with the integration of acquiredcompanies and changes to our distribution model as part ofbusiness restructuring and transformation. The terminatedcontracts primarily relate to sales agents and distributionagreements.
Cash and Cash Equivalents – We consider all highlyliquid investments with an original maturity of three months orless to be cash equivalents. The carrying amounts reported inthe balance sheet for cash and cash equivalents are valued atcost, which approximates their fair value.
Investments – We invest our excess cash and cashequivalents in debt securities. Our investments includecorporate debt securities, U.S. government and agency debt
44
ZIMMER HOLDINGS, INC. 2011 FORM 10-K ANNUAL REPORT
Notes to Consolidated Financial Statements (Continued)
securities, municipal bonds, foreign government debtsecurities, commercial paper and certificates of deposit andare classified and accounted for as available-for-sale.Available-for-sale debt securities are recorded at fair value onour consolidated balance sheet. Investments with a contractualmaturity of less than one year are classified as short-terminvestments on our consolidated balance sheet, or in othernon-current assets if the contractual maturity is greater thanone year. Changes in fair value for available-for-sale securitiesare recorded, net of taxes, as a component of accumulatedother comprehensive loss on our consolidated balance sheet.We review our investments for other-than-temporaryimpairment at each reporting period. If an unrealized loss forany investment is considered to be other-than-temporary, theloss will be recognized in the consolidated statement ofearnings in the period the determination is made. See Note 7for more information regarding our investments.
Accounts Receivable – Accounts receivable consists oftrade and other miscellaneous receivables. We grant credit tocustomers in the normal course of business and maintain anallowance for doubtful accounts for potential credit losses. Wedetermine the allowance for doubtful accounts by geographicmarket and take into consideration historical creditexperience, creditworthiness of the customer and otherpertinent information. We make concerted efforts to collect allaccounts receivable, but sometimes we have to write-off theaccount against the allowance when we determine the accountis uncollectible. The allowance for doubtful accounts was $17.2million and $14.4 million as of December 31, 2011 and 2010,respectively.
Inventories – Inventories are stated at the lower of cost ormarket, with cost determined on a first-in first-out basis.
Property, Plant and Equipment – Property, plant andequipment is carried at cost less accumulated depreciation.Depreciation is computed using the straight-line method basedon estimated useful lives of ten to forty years for buildings andimprovements and three to eight years for machinery andequipment. Maintenance and repairs are expensed as incurred.We review property, plant and equipment for impairmentwhenever events or changes in circumstances indicate that thecarrying value of an asset may not be recoverable. Animpairment loss would be recognized when estimated futureundiscounted cash flows relating to the asset are less than itscarrying amount. An impairment loss is measured as theamount by which the carrying amount of an asset exceeds itsfair value.
Software Costs – We capitalize certain computer softwareand software development costs incurred in connection withdeveloping or obtaining computer software for internal usewhen both the preliminary project stage is completed and it isprobable that the software will be used as intended.Capitalized software costs generally include external directcosts of materials and services utilized in developing orobtaining computer software and compensation and relatedbenefits for employees who are directly associated with the
software project. Capitalized software costs are included inproperty, plant and equipment on our balance sheet andamortized on a straight-line or weighted average estimateduser basis when the software is ready for its intended use overthe estimated useful lives of the software, which approximatethree to ten years.
Instruments – Instruments are hand-held devices used bysurgeons during total joint replacement and other surgicalprocedures. Instruments are recognized as long-lived assetsand are included in property, plant and equipment.Undeployed instruments are carried at cost or realizable value.Instruments in the field are carried at cost less accumulateddepreciation. Depreciation is computed using the straight-linemethod based on average estimated useful lives, determinedprincipally in reference to associated product life cycles,primarily five years. We review instruments for impairmentwhenever events or changes in circumstances indicate that thecarrying value of an instrument may not be recoverable.Depreciation of instruments is recognized as selling, generaland administrative expense.
Goodwill – Goodwill is not amortized but is subject toannual impairment tests. Goodwill has been assigned toreporting units. We perform annual impairment tests by eithercomparing a reporting unit’s estimated fair value to its carryingamount or doing a qualitative assessment of a reporting unit’sfair value from the last quantitative assessment to determine ifthere is potential impairment. We do a qualitative assessmentwhen the results of the previous quantitative test indicated thereporting unit’s estimated fair value was significantly in excessof the carrying value of its net assets and we do not believethere have been significant changes in the reporting unit’soperations that would significantly decrease its estimated fairvalue or significantly increase its net assets. If a quantitativeassessment is performed, the fair value of the reporting unitand the implied fair value of goodwill are determined basedupon a discounted cash flow analysis. Significant assumptionsare incorporated into these discounted cash flow analyses suchas estimated growth rates and risk-adjusted discount rates. Weperform this test in the fourth quarter of the year or wheneverevents or changes in circumstances indicate that the carryingvalue of the reporting unit’s assets may not be recoverable. Ifthe fair value of the reporting unit is less than its carryingvalue, an impairment loss is recorded to the extent that theimplied fair value of the reporting unit goodwill is less than thecarrying value of the reporting unit goodwill. During the yearsended December 31, 2010 and 2009, we recorded goodwillimpairment charges of $204.0 million and $73.0 million,respectively, related to our U.S. Spine reporting unit. See Note9 for more information regarding goodwill and goodwillimpairment.
Intangible Assets – Intangible assets are initiallymeasured at their fair value. We have determined the fair valueof our intangible assets either by the fair value of theconsideration exchanged for the intangible asset or theestimated after-tax discounted cash flows expected to be
45

ZIMMER HOLDINGS, INC. 2011 FORM 10-K ANNUAL REPORT
Notes to Consolidated Financial Statements (Continued)
generated from the intangible asset. Intangible assets with anindefinite life, including certain trademarks and trade names,are not amortized. Indefinite life intangible assets are assessedannually to determine whether events and circumstancescontinue to support an indefinite life. Intangible assets with afinite life, including core and developed technology, certaintrademarks and trade names, customer-related intangibles,intellectual property rights and patents and licenses areamortized on a straight-line basis over their estimated usefullife, ranging from less than one year to 40 years. Intangibleassets with a finite life are tested for impairment wheneverevents or circumstances indicate that the carrying amount maynot be recoverable. Intangible assets with an indefinite life aretested for impairment annually or whenever events orcircumstances indicate that the carrying amount may not berecoverable. An impairment loss is recognized if the carryingamount exceeds the estimated fair value of the asset. Theamount of the impairment loss to be recorded would bedetermined based upon the excess of the asset’s carrying valueover its fair value. The fair values of indefinite lived intangibleassets are determined based upon a discounted cash flowanalysis using the relief from royalty method. The relief fromroyalty method estimates the cost savings associated withowning, rather than licensing, assets. Significant assumptionsare incorporated into these discounted cash flow analyses suchas estimated growth rates, royalty rates and risk-adjusteddiscount rates.
In determining the useful lives of intangible assets, weconsider the expected use of the assets and the effects ofobsolescence, demand, competition, anticipated technologicaladvances, changes in surgical techniques, market influencesand other economic factors. For technology-based intangibleassets, we consider the expected life cycles of products, absentunforeseen technological advances, which incorporate thecorresponding technology. Trademarks and trade names thatdo not have a wasting characteristic (i.e., there are no legal,regulatory, contractual, competitive, economic or other factorswhich limit the useful life) are assigned an indefinite life.Trademarks and trade names that are related to productsexpected to be phased out are assigned lives consistent withthe period in which the products bearing each brand areexpected to be sold. For customer relationship intangibleassets, we assign useful lives based upon historical levels ofcustomer attrition. Intellectual property rights are assigneduseful lives that approximate the contractual life of any relatedpatent or the period for which we maintain exclusivity over theintellectual property.
Income Taxes – We account for income taxes under theasset and liability method, which requires the recognition ofdeferred tax assets and liabilities for the expected future taxconsequences of events that have been included in thefinancial statements. Under this method, deferred tax assetsand liabilities are determined based on the differencesbetween the financial statements and tax basis of assets andliabilities using enacted tax rates in effect for the year in which
the differences are expected to reverse. The effect of a changein tax rates on deferred tax assets and liabilities is recognizedin income in the period that includes the enactment date.
We reduce our deferred tax assets by a valuationallowance if it is more likely than not that we will not realizesome portion or all of the deferred tax assets. In making suchdetermination, we consider all available positive and negativeevidence, including future reversals of existing taxabletemporary differences, projected future taxable income, taxplanning strategies and recent financial operations. In theevent we were to determine that we would be able to realizeour deferred income tax assets in the future in excess of theirnet recorded amount, we would make an adjustment to thevaluation allowance which would reduce the provision forincome taxes. Federal income taxes are provided on theportion of the income of foreign subsidiaries that is expectedto be remitted to the U.S.
We operate on a global basis and are subject to numerousand complex tax laws and regulations. Our income tax filingsare regularly under audit in multiple federal, state and foreignjurisdictions. Income tax audits may require an extendedperiod of time to reach resolution and may result in significantincome tax adjustments when interpretation of tax laws orallocation of company profits is disputed. Because income taxadjustments in certain jurisdictions can be significant, werecord accruals representing management’s best estimate ofthe probable resolution of these matters. To the extentadditional information becomes available, such accruals areadjusted to reflect the revised estimated probable outcome.
Derivative Financial Instruments – We measure allderivative instruments at fair value and report them on ourconsolidated balance sheet as assets or liabilities. We maintainwritten policies and procedures that permit, under appropriatecircumstances and subject to proper authorization, the use ofderivative financial instruments solely for hedging purposes.The use of derivative financial instruments for trading orspeculative purposes is prohibited by our policy. See Note 13for more information regarding our derivative and hedgingactivities.
Other Comprehensive Income – Other comprehensiveincome refers to revenues, expenses, gains and losses thatunder generally accepted accounting principles are included incomprehensive income but are excluded from net earnings asthese amounts are recorded directly as an adjustment tostockholders’ equity. Other comprehensive income iscomprised of foreign currency translation adjustments,unrealized gains and losses on cash flow hedges, unrealizedgains and losses on available-for-sale securities andamortization of prior service costs and unrecognized gains andlosses in actuarial assumptions.
Treasury Stock – We account for repurchases of commonstock under the cost method and present treasury stock as areduction of stockholders’ equity. We reissue common stockheld in treasury only for limited purposes.
46

ZIMMER HOLDINGS, INC. 2011 FORM 10-K ANNUAL REPORT
Notes to Consolidated Financial Statements (Continued)
Noncontrolling Interest – On January 1, 2009, we adoptedthe FASB’s new guidance related to noncontrolling interests.This guidance changed the accounting and reporting forminority interests, which are now characterized asnoncontrolling interests and classified as a component ofequity. This adoption did not have a material impact on ourconsolidated financial statements. During the year endedDecember 31, 2009, we acquired 100 percent ownership of anoutstanding noncontrolling interest for approximately$8.6 million. This purchase was recorded as an equitytransaction and is reflected as a financing activity in ourconsolidated statement of cash flows. As a result, the carryingbalance of the noncontrolling interests of $3.6 million waseliminated, and the remaining $5.0 million, representing thedifference between the purchase price and carrying balance,was recorded as a reduction in paid-in capital.
In 2011, we made an investment in a company in which weacquired a controlling financial interest, but not 100 percent ofthe equity. Further information related to the noncontrollinginterests of that investment has not been provided as it is notsignificant to our consolidated financial statements.
Accounting Pronouncements – In 2011, the FASB issuedan accounting standard update (ASU) that allowed companieswhen performing their annual goodwill impairment test to do aqualitative assessment to evaluate whether impairment hasoccurred versus performing a quantitative calculation ofestimated fair value. We elected to early adopt this standardand performed a qualitative assessment on three of ourreporting units that in prior years had estimated fair valuesthat were substantially in excess of their carrying values. ThisASU just changed the methodology of testing for goodwillimpairment and would not affect the outcome of impairmenttesting. Therefore, it did not have an effect on our financialposition, results of operations or cash flows.
In 2011 the FASB issued an ASU requiring companies topresent net income and other comprehensive income in either asingle continuous statement or in two separate, but consecutive,statements of net income and other comprehensive income. TheASU also required the reclassifications adjustments fromaccumulated other comprehensive income to net income bepresented on the statement of earnings by line item, but thisprovision of the ASU has been delayed indefinitely. Therequirement regarding presentation of net income and othercomprehensive income in a single or two separate, butconsecutive, statements will be effective for us on January 1,2012. The ASU only changes the presentation requirements ofother comprehensive income and does not change anyaccounting for other comprehensive income and therefore willhave no effect on our financial position, results of operations orcash flows. We intend to show other comprehensive income in aseparate, consecutive statement and have already done so inthis Annual Report on Form 10-K. Information regarding ourreclassification adjustments to net income may already be foundon our Consolidated Statements of Comprehensive Income,Note 13 and Note 14.
There are no other recently issued accountingpronouncements that we have not yet adopted that areexpected to have a material effect on our financial position,results of operations or cash flows.
3. SHARE-BASED COMPENSATION
Our share-based payments primarily consist of stockoptions, restricted stock, restricted stock units (RSUs), and anemployee stock purchase plan. Share-based compensationexpense is as follows (in millions):
For the Years Ended December 31, 2011 2010 2009
Stock options $ 41.7 $ 47.6 $ 61.9
RSUs and other 18.8 14.4 13.4
Total expense, pre-tax 60.5 62.0 75.3
Tax benefit related to awards (17.8) (16.2) (20.9)
Total expense, net of tax $ 42.7 $ 45.8 $ 54.4
Share-based compensation cost capitalized as part ofinventory for the years ended December 31, 2011, 2010 and2009 was $8.8 million, $12.2 million, and $17.2 million,respectively. As of December 31, 2011 and 2010,approximately $4.8 million and $6.6 million of capitalized costsremained in finished goods inventory.
Stock Options
We had two equity compensation plans in effect atDecember 31, 2011: the 2009 Stock Incentive Plan (2009 Plan)and the Stock Plan for Non-Employee Directors. The 2009 Plansucceeds the 2006 Stock Incentive Plan (2006 Plan) and theTeamShare Stock Option Plan (TeamShare Plan). Followingstockholder approval of the 2009 Plan in May 2009, no furtherawards were granted under the 2006 Plan or under theTeamShare Plan, and shares remaining available for grantunder those plans have been merged into the 2009 Plan.Vested and unvested stock options and unvested restrictedstock and RSUs previously granted under the 2006 Plan, theTeamShare Plan and another prior plan, the 2001 StockIncentive Plan, remained outstanding as of December 31,2011. We have reserved the maximum number of shares ofcommon stock available for award under the terms of each ofthese plans. We have registered 57.9 million shares of commonstock under these plans. The 2009 Plan provides for the grantof nonqualified stock options and incentive stock options, long-term performance awards in the form of performance shares orunits, restricted stock, RSUs and stock appreciation rights. TheCompensation and Management Development Committee ofthe Board of Directors determines the grant date for annualgrants under our equity compensation plans. The date forannual grants under the 2009 Plan to our executive officers isexpected to occur in the first quarter of each year followingthe earnings announcements for the previous quarter and fullyear. The Stock Plan for Non-Employee Directors provides forawards of stock options, restricted stock and RSUs to
47

ZIMMER HOLDINGS, INC. 2011 FORM 10-K ANNUAL REPORT
Notes to Consolidated Financial Statements (Continued)
non-employee directors. It has been our practice to issueshares of common stock upon exercise of stock options frompreviously unissued shares, except in limited circumstanceswhere they are issued from treasury stock. The total numberof awards which may be granted in a given year and/or overthe life of the plan under each of our equity compensationplans is limited. At December 31, 2011, an aggregate of10.6 million shares were available for future grants and awardsunder these plans.
Stock options granted to date under our plans generallyvest over four years and generally have a maximumcontractual life of 10 years. As established under our equity
compensation plans, vesting may accelerate upon retirementafter the first anniversary date of the award if certain criteriaare met. We recognize expense related to stock options on astraight-line basis over the requisite service period, lessawards expected to be forfeited using estimated forfeiturerates. Due to the accelerated retirement provisions, therequisite service period of our stock options range from one tofour years. Stock options are granted with an exercise priceequal to the market price of our common stock on the date ofgrant, except in limited circumstances where local law maydictate otherwise.
A summary of stock option activity for the year ended December 31, 2011 is as follows (options in thousands):
Weighted
Weighted Average
Average Remaining Intrinsic
Exercise Contractual Value
Stock Options Price Life (in millions)
Outstanding at January 1, 2011 17,438 $66.76
Options granted 1,617 60.07
Options exercised (1,137) 35.21
Options cancelled (416) 59.32
Options expired (754) 75.21
Outstanding at December 31, 2011 16,748 $68.04 5.4 $27.2
Vested or expected to vest as of December 31, 2011 16,224 $68.40 5.3 $26.0
Exercisable at December 31, 2011 12,608 $71.30 4.5 $16.5
We use a Black-Scholes option-pricing model todetermine the fair value of our stock options. Expectedvolatility was derived from the implied volatility of tradedoptions on our stock that were actively traded around thegrant date of the stock options with exercise prices similar tothe stock options and maturities of over one year. Theexpected term of the stock options has been derived fromhistorical employee exercise behavior. The risk-free interestrate is determined using the implied yield currently availablefor zero-coupon U.S. government issues with a remaining termapproximating the expected life of the options. We used adividend yield of zero percent as we had not paid anydividends since becoming a public company in 2001. InDecember 2011, we declared our first dividend and,accordingly, we will take our new dividend policy intoconsideration in our assumptions for future grants.
The following table presents information regarding theweighted average fair value for stock options granted, theassumptions used to determine fair value, and the intrinsicvalue of options exercised in the indicated year:
For the Years Ended December 31, 2011 2010 2009
Dividend yield –% –% –%
Volatility 26.1% 26.3% 41.6%
Risk-free interest rate 2.2% 2.8% 1.7%
Expected life (years) 6.1 5.9 5.4
Weighted average fair value of optionsgranted $18.33 $18.17 $16.02
Intrinsic value of options exercised (inmillions) $ 27.5 $ 8.5 $ 3.3
As of December 31, 2011, there was $45.3 million ofunrecognized share-based payment expense related tononvested stock options granted under our plans. Thatexpense is expected to be recognized over a weighted averageperiod of 2.3 years.
RSUs
We have awarded RSUs to our employees. The terms ofthe awards have been either four or five years with vestingoccurring ratably on the anniversary date of the award.However, based upon meeting certain criteria, as establishedunder our equity compensation plans, these awards may
48

ZIMMER HOLDINGS, INC. 2011 FORM 10-K ANNUAL REPORT
Notes to Consolidated Financial Statements (Continued)
accelerate upon retirement after the first anniversary date ofthe award. Accordingly, the requisite service period used forshare-based payment expense ranges from one to five years.
A summary of nonvested RSU activity for the year endedDecember 31, 2011 is as follows (in thousands):
Weighted Average
Grant Date
RSUs Fair Value
Outstanding at January 1, 2011 948 $52.30
Granted 651 60.14
Vested (195) 48.18
Forfeited (217) 58.95
Outstanding at December 31, 2011 1,187 56.25
The fair value of the awards was determined based uponthe fair market value of our common stock on the date ofgrant. We are required to estimate the number of RSUs thatwill vest and recognize share-based payment expense on astraight-line basis over the requisite service period. As ofDecember 31, 2011, we estimate that approximately 1,067,000outstanding RSUs will vest. If our estimate were to change inthe future, the cumulative effect of the change in estimate willbe recorded in that period. Based upon the number of RSUsthat we expect to vest, the unrecognized share-based paymentexpense as of December 31, 2011 was $38.0 million and isexpected to be recognized over a weighted average period of2.7 years. The fair value of RSUs vesting during the yearsended December 31, 2011, 2010 and 2009 based upon ourstock price on the date of vesting was $11.8 million, $3.2million and $7.0 million, respectively.
4. INVENTORIES
Inventories consisted of the following (in millions):
As of December 31, 2011 2010
Finished goods $743.0 $757.3Work in progress 47.8 47.0Raw materials 139.0 132.1
Inventories $929.8 $936.4
Amounts charged to the consolidated statement ofearnings for excess and obsolete inventory in the years endedDecember 31, 2011, 2010 and 2009 were $47.6 million, $45.8million and $81.7 million, respectively.
5. PROPERTY, PLANT AND EQUIPMENT
Property, plant and equipment consisted of the following(in millions):
As of December 31, 2011 2010
Land $ 22.3 $ 22.0Building and equipment 1,196.8 1,162.0Capitalized software costs 208.4 172.0Instruments 1,509.2 1,365.6Construction in progress 76.4 66.5
3,013.1 2,788.1Accumulated depreciation (1,805.8) (1,574.3)
Property, plant and equipment, net $ 1,207.3 $ 1,213.8
Depreciation expense was $266.1 million, $247.9 millionand $244.2 million for the years ended December 31, 2011,2010 and 2009, respectively.
6. ACQUISITIONS
We made a number of business acquisitions during theyears 2011, 2010 and 2009. In November 2011 we acquiredExtraOrtho, Inc. (ExtraOrtho). The ExtraOrtho acquisitionenhances our position in the estimated $820 million externalfixation market. In December 2010 we acquired BeijingMontagne Medical Device Co., Ltd. (Montagne) and SodemDiffusion S.A. (Sodem). The Montagne acquisition makes us asignificant provider of orthopaedic solutions in China andprovides product lines tailored exclusively to the rapidlygrowing Chinese market. The Sodem acquisition broadens ourportfolio of surgical power tools and strengthens our positionin the estimated $1 billion surgical power tool market.Additionally, we have acquired a number of foreign-baseddistributors during the three year period.
The results of operations of the acquired companies havebeen included in our consolidated results of operationssubsequent to the transaction dates, and the respective assetsand liabilities of the acquired companies have been recorded attheir estimated fair values in our consolidated statement offinancial position as of the transaction dates, with any excesspurchase price being allocated to goodwill. The estimated fairvalues of the ExtraOrtho assets are preliminary. Pro formafinancial information and other information required have notbeen included as the acquisitions did not have a materialimpact upon our financial position or results of operations.
49

ZIMMER HOLDINGS, INC. 2011 FORM 10-K ANNUAL REPORT
Notes to Consolidated Financial Statements (Continued)
7. INVESTMENTS
We invest in short and long-term investments classified asavailable-for-sale securities. Information regarding ourinvestments is as follows (in millions):
Amortized
Cost
Gross Unrealized
Fair valueGains Losses
As of December 31, 2011Corporate debt securities $324.8 $0.2 $(0.3) $324.7U.S. government and agency
debt securities 177.1 0.1 – 177.2Municipal bonds 1.0 – – 1.0Foreign government debt
securities 6.8 – – 6.8Commercial paper 74.5 – – 74.5Certificates of deposit 88.5 – – 88.5
Total short and long-terminvestments $672.7 $0.3 $(0.3) $672.7
As of December 31, 2010Corporate debt securities $203.9 $0.1 $(0.2) $203.8U.S. government and agency
debt securities 47.9 – – 47.9Municipal bonds 1.1 – – 1.1Foreign government debt
securities 10.3 – – 10.3Commercial paper 16.1 – – 16.1Certificates of deposit 131.5 – (0.1) 131.4
Total short and long-terminvestments $410.8 $0.1 $(0.3) $410.6
The following table shows the fair value and grossunrealized losses for all available-for-sale securities in anunrealized loss position deemed to be temporary (in millions):
As of December 31, 2011 As of December 31, 2010
Fair
Value
Unrealized
Losses
Fair
value
Unrealized
Losses
Corporate debt securities $164.5 $(0.3) $126.1 $(0.2)
Certificates of deposit – – 50.6 (0.1)
Total $164.5 $(0.3) $176.7 $(0.3)
All securities in the table above have been in an unrealizedloss position for less than twelve months. A total of 97securities were in an unrealized loss position as ofDecember 31, 2011.
The unrealized losses on our investments in corporatedebt securities were caused by increases in interest yieldsresulting from adverse conditions in the global credit markets.We believe the unrealized losses associated with ouravailable-for-sale securities as of December 31, 2011 aretemporary because we do not intend to sell these investmentsbefore maturity, and we do not believe we will be required tosell them before recovery of their amortized cost basis.
The amortized cost and fair value of our available-for-salefixed-maturity securities by contractual maturity are as follows(in millions):
As of December 31, 2011 Amortized Cost
Fair
Value
Due in one year or less $455.4 $455.5Due after one year through two years 217.3 217.2
Total $672.7 $672.7
8. FAIR VALUE MEASUREMENTS OF ASSETS AND LIABILITIES
The following financial assets and liabilities are recordedat fair value on a recurring basis (in millions):
As of December 31, 2011
Fair Value Measurements at Reporting Date Using:
Description
Recorded
Balance
Quoted Prices
in Active
Markets for
Identical
Assets
(Level 1)
Significant Other
Observable
Inputs
(Level 2)
Significant
Unobservable
Inputs
(Level 3)
Assets
Available-for-sale securities
Corporate debt securities $324.7 $– $324.7 $–
U.S. government andagency debt securities 177.2 – 177.2 –
Municipal bonds 1.0 – 1.0 –
Foreign government debtsecurities 6.8 – 6.8 –
Commercial paper 74.5 – 74.5 –
Certificates of deposit 88.5 – 88.5 –
Total available-for-salesecurities 672.7 – 672.7 –
Derivatives, current andlong-term
Foreign currency forwardcontracts and options 18.3 – 18.3 –
Interest rate swaps 27.8 – 27.8 –
$718.8 $– $718.8 $–
Liabilities
Derivatives, current andlong-term
Foreign currency forwardcontracts and options $ 25.2 $– $ 25.2 $–
Cross-currency interestrate swaps 8.2 – 8.2 –
$ 33.4 $– $ 33.4 $–
50

ZIMMER HOLDINGS, INC. 2011 FORM 10-K ANNUAL REPORT
Notes to Consolidated Financial Statements (Continued)
As of December 31, 2010
Fair Value Measurements at Reporting Date Using:
Description
Recorded
Balance
Quoted Prices
in Active
Markets for
Identical
Assets
(Level 1)
Significant Other
Observable
Inputs
(Level 2)
Significant
Unobservable
Inputs
(Level 3)
Assets
Available-for-sale securities
Corporate debt securities $203.8 $– $203.8 $–
U.S. government andagency debt securities 47.9 – 47.9 –
Municipal bonds 1.1 – 1.1 –
Foreign government debtsecurities 10.3 – 10.3 –
Commercial paper 16.1 – 16.1 –
Certificates of deposit 131.4 – 131.4 –
Total available-for-salesecurities 410.6 – 410.6 –
Derivatives, current andlong-term
Foreign currency forwardcontracts and options 34.5 – 34.5 –
Interest rate swaps 1.5 – 1.5 –
$446.6 $– $446.6 $–
Liabilities
Derivatives, current andlong-term
Foreign currency forwardcontracts and options $ 40.0 $– $ 40.0 $–
$ 40.0 $– $ 40.0 $–
We value our available-for-sale securities using a marketapproach based on broker prices for identical assets inover-the-counter markets and assess counterparty credit risk.
We value our foreign currency forward contracts andforeign currency options using a market approach based onforeign currency exchange rates obtained from active marketsand perform ongoing assessments of counterparty credit risk.
We value our interest rate swaps using a market approachbased on publicly available market yield curves and the termsof our swaps and assess counterparty credit risk.
We value our cross-currency interest rate swaps using amarket approach based upon publicly available market yieldcurves, foreign currency exchange rates obtained from activemarkets and the terms of our swaps. We also perform ongoingassessments of counterparty credit risk.
The following nonfinancial assets were measured at fairvalue on a nonrecurring basis (in millions):
Fair Value Measurements Using:
Description
Year Ended
December 31,
2010
Quoted Prices
in Active
Markets for
Identical
Assets
(Level 1)
Significant
Other
Observable
Inputs
(Level 2)
Significant
Unobservable
Inputs
(Level 3)
Total
Losses
Goodwill $137.0 $– $– $137.0 $204.0
$137.0 $– $– $137.0 $204.0
Fair Value Measurements Using:
Description
Year Ended
December 31,
2009
Quoted Prices
in Active
Markets for
Identical
Assets
(Level 1)
Significant
Other
Observable
Inputs
(Level 2)
Significant
Unobservable
Inputs
(Level 3)
Total
Losses
Goodwill $342.9 $– $– $342.9 $73.0
$342.9 $– $– $342.9 $73.0
In 2010, goodwill relating to our U.S. Spine reporting unitwith a carrying amount of $341.0 million was written down toits implied fair value of $137.0 million, resulting in animpairment charge of $204.0 million. The implied fair value ofgoodwill equals the estimated fair value of a reporting unitminus the fair value of the reporting unit’s net assets. Indetermining the implied fair value of the U.S. Spine reportingunit’s goodwill, we used unobservable inputs to estimate thefair value of the reporting unit and its assets and liabilities. Fairvalue was determined using an equal weighting of income andmarket approaches. Fair value under the income approach wasdetermined by discounting to present value the estimatedfuture cash flows of the reporting unit. Fair value under themarket approach utilized the comparable transactionmethodology, which uses valuation indicators determined fromsales of other businesses that are similar to our U.S. Spinereporting unit. In estimating the future cash flows of thereporting unit, we utilized a combination of market andcompany specific inputs that a market participant would use inassessing the fair value of the reporting unit. The primarymarket input was revenue growth rates. These rates werebased upon historical trends and estimated future growthdrivers such as an aging global population, obesity and moreactive lifestyles. Significant company specific inputs includedassumptions regarding how the reporting unit could leverageoperating expenses as revenue grows and the impact any newproducts will have on revenues. Under the comparabletransaction methodology, we took into consideration when thecomparable transaction occurred and the differences that mayexist due to changes in the economic environment. We alsotook into consideration differences between the comparablecompanies and our U.S. Spine reporting unit that could affectfair value, such as cash and debt levels.
51

ZIMMER HOLDINGS, INC. 2011 FORM 10-K ANNUAL REPORT
Notes to Consolidated Financial Statements (Continued)
The fair value of the reporting unit’s assets and liabilitieswas determined by using the same methods that are used inbusiness combination purchase accounting. See Note 9 forfurther information regarding this goodwill impairment.
In 2009, the implied fair value of goodwill was determinedusing the same methodologies utilized in the 2010 valuation.
9. GOODWILL AND OTHER INTANGIBLE ASSETS
The following table summarizes the changes in thecarrying amount of goodwill (in millions):
Americas Europe Asia Pacific Total
Balance at January 1, 2010Goodwill $1,547.9 $1,173.1 $135.5 $2,856.5Accumulated impairment
losses (73.0) – – (73.0)
1,474.9 1,173.1 135.5 2,783.5U.S. Spine reporting unit
impairment (204.0) – – (204.0)Acquisitions 13.1 3.7 37.3 54.1Currency translation 1.8 (69.7) 15.1 (52.8)
Balance at December 31,2010Goodwill 1,562.8 1,107.1 187.9 2,857.8Accumulated impairment
losses (277.0) – – (277.0)
1,285.8 1,107.1 187.9 2,580.8Acquisitions 26.7 6.6 – 33.3Currency translation (0.8) 4.7 8.0 11.9
Balance at December 31,2011Goodwill 1,588.7 1,118.4 195.9 2,903.0Accumulated impairment
losses (277.0) – – (277.0)
$1,311.7 $1,118.4 $195.9 $2,626.0
We conduct our annual impairment test in the fourthquarter of every year or whenever events occur orcircumstances change that would more likely than not reducethe fair value of a reporting unit below its carrying amount.During our 2009 and 2010 annual impairment tests, it wasdetermined that our U.S. Spine reporting unit’s carrying valuewas in excess of its estimated fair value. Fair value wasdetermined using an equal weighting of income and marketapproaches.
In the 2009 period, factors that contributed to theestimated fair value of the reporting unit being below itscarrying value included a decrease in projected revenuesrelated to the Dynesys Dynamic Stabilization System. Thisproduct line experienced increased competition and insurancereimbursement issues in 2009. We had been seeking approvalfrom the FDA to market this product differently in the U.S.,which would have enhanced its position in the market.However, in November 2009 an FDA advisory panel issued anon-approvable recommendation, increasing the uncertaintyof the estimated future cash flows at that time. In addition tothe Dynesys product, revenues from other products had been
affected as we worked through the integration of the saleschannel following an acquisition.
For our annual impairment testing in 2010, factors in thebroader U.S. spine marketplace as well as company specificfactors contributed to a further decrease in the estimated fairvalue of the reporting unit. At the time of our 2009 impairmenttest, we estimated that the U.S. spine market wasexperiencing year-over-year revenue growth in the low doubledigits that would continue into the foreseeable future. Sincethe time of our 2009 test, year-over-year growth continued todecelerate and after multiple quarters of deceleration weestimated this may be a longer-term trend instead of atemporary phenomenon. In our 2010 impairment test, weconcluded that year-over-year growth had fallen to the low tomid single digits which we estimate to be the trend in thenear-term. A portion of this decrease has come from lowerpricing as hospitals try to reduce their costs.
Another factor in the lower growth trend includedincreased scrutiny from insurance companies and continueddiscussion in the healthcare community on whether certainspine procedures are necessary. As an example, late in thethird quarter of 2010 in one state an insurer provided noticethat starting January 1, 2011, the insurer would require priorreview and certification that the patient has met specificclinical criteria before the procedure would be covered. Whilerevenues from these procedures in this one state are notsignificant to our overall revenues, it caused uncertainty onwhether more insurers may take similar actions.
As discussed above, we believed such deceleration anduncertainty as to revenue growth also decreased thevaluations of other spine companies in the U.S. market andthus affected our estimated fair value of our U.S. Spinereporting unit.
In addition, following the FDA advisory panel decision inNovember 2009 we continued to evaluate our regulatoryoptions for marketing the Dynesys product differently. In2010, we concluded that obtaining regulatory approval wouldtake more time and cost more money than originally expected.This conclusion also contributed to the decrease in ourestimated fair value of the reporting unit.
As a result, we recorded goodwill impairment charges of$204.0 million and $73.0 million during the years endedDecember 31, 2010 and 2009, respectively.
In our 2011 impairment test, we concluded that theestimated fair value of the U.S. Spine reporting unit was 13percent higher than its carrying value.
We have six other reporting units with goodwill assignedto them. We estimate the fair value of those reporting unitsusing the income approach by discounting to present value theestimated future cash flows of the reporting unit. For three ofthose reporting units, in 2011 we only performed a qualitativeassessment of changes in fair value as allowed by a newaccounting pronouncement as discussed in Note 2. For each ofthose six reporting units, the estimated fair value substantiallyexceeded its carrying value.
52

ZIMMER HOLDINGS, INC. 2011 FORM 10-K ANNUAL REPORT
Notes to Consolidated Financial Statements (Continued)
We will continue to monitor the fair value of our U.S.Spine reporting unit as well as our other six reporting units inour interim and annual reporting periods. If our estimatedcash flows for these reporting units decrease, we may have torecord further impairment charges in the future. Factors thatcould result in our cash flows being lower than our currentestimates include: 1) decreased revenues caused by
unforeseen changes in the healthcare market, or our inabilityto generate new product revenue from our research anddevelopment activities, and 2) if we are not able to achieve theestimated operating margins in our forecasts due tounforeseen factors. Additionally, changes in the broadereconomic environment could cause changes to our estimateddiscount rates, which will impact our estimated fair values.
The components of identifiable intangible assets are as follows (in millions):
Core
Technology
Developed
Technology
Intellectual
Property
Rights
Trademarks
and Trade
Names
Customer
Relationships Other Total
As of December 31, 2011:Intangible assets subject to amortization:
Gross carrying amount $144.1 $ 530.8 $ 172.5 $ 40.4 $164.3 $ 82.7 $1,134.8Accumulated amortization (59.9) (255.5) (100.2) (26.9) (46.7) (39.4) (528.6)
Intangible assets not subject to amortization:Gross carrying amount – – – 192.3 – – 192.3
Total identifiable intangible assets $ 84.2 $ 275.3 $ 72.3 $205.8 $117.6 $ 43.3 $ 798.5
As of December 31, 2010:Intangible assets subject to amortization:
Gross carrying amount $144.1 $ 511.5 $ 153.7 $ 36.8 $147.7 $ 70.0 $1,063.8Accumulated amortization (52.0) (219.3) (73.4) (23.4) (32.8) (33.1) (434.0)
Intangible assets not subject to amortization:Gross carrying amount – – – 197.3 – – 197.3
Total identifiable intangible assets $ 92.1 $ 292.2 $ 80.3 $210.7 $114.9 $ 36.9 $ 827.1
We currently have and anticipate future productdevelopment efforts that may replace the current productsthat use our trademarks and trade names. While it isanticipated, it is not certain that these new products willutilize these trademarks and trade names. If these newproducts do not use these trademarks and trade names, theseassets may be impaired and/or their useful lives may needadjusted.
Intangible amortization expense was recorded as follows(in millions):
For the Years Ended December 31, 2011 2010 2009
Cost of products sold $26.7 $33.1 $33.6
Selling, general and administrative 67.1 59.2 59.6
Total intangible amortization $93.8 $92.3 $93.2
Estimated annual amortization expense based uponintangible assets recognized as of December 31, 2011 for theyears ending December 31, 2012 through 2016 is (in millions):
For the Years Ending December 31,
2012 $94.1
2013 88.1
2014 84.9
2015 71.4
2016 67.1
10. OTHER CURRENT AND LONG-TERM LIABILITIES
Other current and long-term liabilities consisted of thefollowing (in millions):
As of December 31, 2011 2010
Other current liabilities:
License and service agreements $106.1 $108.5
Certain claims accrual (Note 19) 50.0 42.5
Salaries, wages and benefits 116.5 118.1
Accrued liabilities 299.3 254.9
Total other current liabilities $571.9 $524.0
Other long-term liabilities:
Long-term income tax payable $125.8 $113.5
Certain claims accrual (Note 19) 261.1 90.3
Other long-term liabilities 170.5 180.2
Total other long-term liabilities $557.4 $384.0
53

ZIMMER HOLDINGS, INC. 2011 FORM 10-K ANNUAL REPORT
Notes to Consolidated Financial Statements (Continued)
11. DEBT
Our debt consisted of the following (in millions):
As of December 31, 2011 2010
Short-term debt
Senior Credit Facility $ 143.0 $ –
Other short-term debt 0.3 –
Total short-term debt $ 143.3 $ –
Long-term debt
Senior Notes due 2014 $ 250.0 $ –
Senior Notes due 2019 500.0 500.0
Senior Notes due 2021 300.0 –
Senior Notes due 2039 500.0 500.0
Debt discount (1.8) (1.2)
Adjustment related to interest rate swaps 27.8 1.5
Senior Credit Facility – 141.8
Total long-term debt $1,576.0 $1,142.1
In November 2011, we sold $250 million aggregateprincipal amount of our 1.4 percent Senior Notes dueNovember 30, 2014 (2014 Notes) and $300 million aggregateprincipal amount of our 3.375 percent Senior Notes dueNovember 30, 2021 (2021 Notes, and together with the 2014Notes, the 2011 Notes) in a public offering. Interest is payableon May 30 and November 30 of each year until maturity. Wereceived net proceeds of $549.3 million, net of an offeringdiscount of $0.7 million. The 2014 Notes and 2021 Notes carryan effective interest rate of 1.424 percent and 3.396 percent,respectively.
In November 2009, we sold $500 million aggregateprincipal amount of our 4.625 percent Senior Notes dueNovember 30, 2019 (2019 Notes) and $500 million aggregateprincipal amount of our 5.75 percent Senior Notes dueNovember 30, 2039 (2039 Notes, and together with the 2019Notes the 2009 Notes) in a public offering. Interest is payableon May 30 and November 30 of each year until maturity. Wereceived net proceeds of $998.8 million, net of an offeringdiscount of $1.2 million. The 2019 Notes and 2039 Notes carryan effective interest rate of 4.634 percent and 5.762 percent,respectively.
The aggregate estimated fair values of the 2011 Notes and2009 Notes (together, the Senior Notes) as of December 31,2011 and 2010 was $1,693.0 million and $1,022.0 million,respectively.
We may redeem the Senior Notes at our election in wholeor in part at any time prior to maturity at a redemption priceequal to the greater of 1) 100 percent of the principal amountof the notes being redeemed; or 2) the sum of the presentvalues of the remaining scheduled payments of principal andinterest (not including any portion of such payments ofinterest accrued as of the date of redemption), discounted tothe date of redemption on a semi-annual basis at the TreasuryRate (as defined in the debt agreement), plus 15 basis points
in the case of the 2014 Notes, 20 basis points in the case of the2019 Notes and 2021 Notes, and 25 basis points in the case ofthe 2039 Notes. We will also pay the accrued and unpaidinterest on the Senior Notes to the redemption date.
In December 2010, we entered into interest rate swapagreements which we designated as fair value hedges ofunderlying fixed-rate obligations on our Senior Notes due2019. See Note 13 for additional information regarding theinterest rate swap agreements.
We have a five year $1,350 million senior credit agreement(Senior Credit Facility). The Senior Credit Facility is arevolving, multi-currency, senior unsecured credit facilitymaturing November 30, 2012. Available borrowings under theSenior Credit Facility at December 31, 2011 were$1,207.0 million. The carrying value of the Senior CreditFacility approximates fair value, as the underlying instrumentshave variable interest rates at market value.
We and certain of our wholly owned foreign subsidiariesare the borrowers under the Senior Credit Facility. Borrowingsunder the Senior Credit Facility bear interest at a LIBOR-basedrate plus an applicable margin determined by reference to oursenior unsecured long-term credit rating and the amountsdrawn under the Senior Credit Facility, at an alternate baserate, or at a fixed-rate determined through a competitive bidprocess. The Senior Credit Facility contains customaryaffirmative and negative covenants and events of default for anunsecured financing arrangement, including, among otherthings, limitations on consolidations, mergers and sales ofassets. Financial covenants include a maximum leverage ratioof 3.0 to 1.0 and a minimum interest coverage ratio of 3.5 to1.0. If we fall below an investment grade credit rating,additional restrictions would result, including restrictions oninvestments, payment of dividends and stock repurchases. Wewere in compliance with all covenants under the Senior CreditFacility as of December 31, 2011. Commitments under theSenior Credit Facility are subject to certain fees, including afacility and a utilization fee. Borrowings under the SeniorCredit Facility at December 31, 2011 were U.S. Dollar-basedand at December 31, 2010 were Japanese Yen-basedborrowings.
We also have available uncommitted credit facilitiestotaling $63.6 million.
At December 31, 2011, the weighted average interest ratefor short-term and long-term borrowings was 0.1 percent and3.8 percent, respectively. We paid $55.0 million, $59.8 millionand $17.0 million in interest during 2011, 2010 and 2009,respectively.
12. OTHER COMPREHENSIVE INCOME
Other comprehensive income items represent certainamounts that are reported as components of shareholders’equity in our consolidated balance sheet, including foreigncurrency translation adjustments, unrealized gains and losses,net of tax, on available-for-sale investments and hedginginstruments and pension liability adjustments.
54

ZIMMER HOLDINGS, INC. 2011 FORM 10-K ANNUAL REPORT
Notes to Consolidated Financial Statements (Continued)
Accumulated other comprehensive income consisted ofthe following:
As of December 31, 2011 2010
Foreign currency translation $ 399.4 $394.8Cash flow hedges (10.1) (4.0)Unrealized loss on securities – (0.2)Unrecognized prior service cost and unrecognized
loss in actuarial assumptions (117.9) (69.6)
Accumulated other comprehensive income $ 271.4 $321.0
13. DERIVATIVE INSTRUMENTS AND HEDGING ACTIVITIES
We are exposed to certain market risks relating to ourongoing business operations, including foreign currencyexchange rate risk, commodity price risk, interest rate risk andcredit risk. We manage our exposure to these and other marketrisks through regular operating and financing activities.Currently, the only risks that we manage through the use ofderivative instruments are interest rate risk and foreigncurrency exchange rate risk.
Interest Rate Risk
Derivatives Designated as Fair Value Hedges
We use interest rate derivative instruments to manage ourexposure to interest rate movements by converting fixed-ratedebt into variable-rate debt. Under these agreements, we agreeto exchange, at specified intervals, the difference betweenfixed and variable interest amounts calculated by reference toan agreed-upon notional principal amount. The objective of theinstruments is to more closely align interest expense withinterest income received on cash and cash equivalents. Thesederivative instruments are designated as fair value hedgesunder GAAP. Changes in the fair value of the derivativeinstrument are recorded in current earnings and are offset bygains or losses on the underlying debt instrument.
In 2010, we entered into multiple nine-yearfixed-to-variable interest rate swap agreements with a totalnotional amount of $250 million. These interest rate swapagreements were designated as fair value hedges of the fixedinterest rate obligation of our 2019 Notes. We receive a fixedinterest rate of 4.625 percent and pay variable interest equal tothe three-month LIBOR plus an average of 133 basis points onthese interest rate swap agreements.
Foreign Currency Exchange Rate Risk
We operate on a global basis and are exposed to the riskthat our financial condition, results of operations and cashflows could be adversely affected by changes in foreigncurrency exchange rates. To reduce the potential effects offoreign currency exchange rate movements on net earnings,we enter into derivative financial instruments in the form offoreign currency exchange forward contracts and options withmajor financial institutions. We are primarily exposed to
foreign currency exchange rate risk with respect totransactions and net assets denominated in Euros, SwissFrancs, Japanese Yen, British Pounds, Canadian Dollars,Australian Dollars, Korean Won, Swedish Krona, CzechKoruna, Thai Baht, Taiwan Dollars, South African Rand,Russian Rubles and Indian Rupees. We do not use derivativefinancial instruments for trading or speculative purposes.
Derivatives Designated as Cash Flow Hedges
Our revenues are generated in various currenciesthroughout the world. However, a significant amount of ourinventory is produced in U.S. Dollars. Therefore, movements inforeign currency exchange rates may have differentproportional effects on our revenues compared to our cost ofproducts sold. To minimize the effects of foreign currencyexchange rate movements on cash flows, we hedgeintercompany sales of inventory expected to occur within thenext 30 months with foreign currency exchange forwardcontracts and options. We designate these derivativeinstruments as cash flow hedges.
We perform quarterly assessments of hedge effectivenessby verifying and documenting the critical terms of the hedgeinstrument and that forecasted transactions have not changedsignificantly. We also assess on a quarterly basis whether therehave been adverse developments regarding the risk of acounterparty default. For derivatives which qualify as hedgesof future cash flows, the effective portion of changes in fairvalue is temporarily recorded in other comprehensive incomeand then recognized in cost of products sold when the hedgeditem affects net earnings. The ineffective portion of aderivative’s change in fair value, if any, is immediately reportedin cost of products sold.
For forward contracts and options outstanding atDecember 31, 2011, we have obligations to purchase U.S.Dollars and sell Euros, Japanese Yen, British Pounds, CanadianDollars, Australian Dollars, Korean Won, Swedish Krona, CzechKoruna, Thai Baht, Taiwan Dollars, South African Rand,Russian Rubles and Indian Rupees and purchase Swiss Francsand sell U.S. Dollars at set maturity dates ranging from January2012 through June 2014. As of December 31, 2011, thenotional amounts of outstanding forward contracts and optionsentered into with third parties to purchase U.S. Dollars were$1.3 billion. As of December 31, 2011, the notional amounts ofoutstanding forward contracts and options entered into withthird parties to purchase Swiss Francs were $246.7 million.
Derivatives Not Designated as Hedging Instruments
We enter into foreign currency forward exchangecontracts with terms of one month to manage currencyexposures for monetary assets and liabilities denominated in acurrency other than an entity’s functional currency. As aresult, any foreign currency remeasurement gains/lossesrecognized in earnings are generally offset with gains/losses onthe foreign currency forward exchange contracts in the samereporting period. These offsetting gains/losses are recorded in
55

ZIMMER HOLDINGS, INC. 2011 FORM 10-K ANNUAL REPORT
Notes to Consolidated Financial Statements (Continued)
cost of products sold as the underlying assets and liabilitiesexposed to remeasurement include inventory-relatedtransactions. These contracts are settled on the last day ofeach reporting period. Therefore, there is no outstandingbalance related to these contracts recorded on the balancesheet as of the end of the reporting period. The notionalamounts of these contracts are typically in a range of $1.2billion to $1.7 billion per quarter.
Foreign Currency Exchange and Interest Rate Risk
Derivatives Designated as Cash Flow Hedges
In 2011, our subsidiary in Japan, with a functionalcurrency of Japanese Yen, borrowed variable-rate debt of$143.0 million denominated in U.S. Dollars under our SeniorCredit Facility. To manage the foreign currency exchange riskassociated with remeasuring the debt to Japanese Yen and theinterest rate risk associated with the variable-rate debt, wehave entered into multiple cross-currency interest rate swapagreements with a total notional amount of 11,798 millionJapanese Yen. We designated these swaps as cash flow hedgesof the foreign currency exchange and interest rate risks. Theeffective portion of changes in fair value of the cross-currencyinterest rate swaps is temporarily recorded in othercomprehensive income and then recognized in interest
expense when the hedged item affects net earnings. We pay afixed interest rate of 0.1 percent and receive variable interestequal to the three-month LIBOR plus 18.5 basis points onthese cross-currency interest rate swap agreements.
Income Statement Presentation
Derivatives Designated as Fair Value Hedges
Derivative instruments designated as fair value hedgeshad the following effects on our consolidated statement ofearnings (in millions):
Gain on
Instrument
Loss on Hedged
Item
Location on
Statement of
Earnings
Year Ended
December 31,
Year Ended
December 31,
Derivative
Instrument 2011 2010 2011 2010
Interest rateswaps Interest expense $26.3 $1.5 $(26.3) $(1.5)
We had no ineffective fair value hedging instruments norany amounts excluded from the assessment of hedgeeffectiveness during the years ended December 31, 2011 and2010.
Derivatives Designated as Cash Flow Hedges
Derivative instruments designated as cash flow hedges had the following effects on other comprehensive income (OCI) on ourconsolidated balance sheet and our consolidated statement of earnings (in millions):
Amount of Gain / (Loss)
Recognized in OCI
Amount of Gain / (Loss)
Reclassified from OCI
Year Ended December 31, Year Ended December 31,
Derivative Instrument 2011 2010 2009 Location on Statement of Earnings 2011 2010 2009
Foreign exchange forward contracts $(34.9) $11.2 $(35.8) Cost of products sold $(32.9) $7.3 $16.8
Foreign exchange options (0.2) 0.3 (2.0) Cost of products sold – – 1.2
Cross-currency interest rate swaps 0.2 – – Interest expense (8.3) – –
$(34.9) $11.5 $(37.8) $(41.2) $7.3 $18.0
The net amount recognized in earnings during the years ended December, 2011, 2010 and 2009 due to ineffectiveness andamounts excluded from the assessment of hedge effectiveness were not significant.
The fair value of outstanding derivative instruments designated as cash flow hedges and recorded on the balance sheet atDecember 31, 2011, together with settled derivatives where the hedged item has not yet affected earnings, was a net unrealized lossof $22.8 million, or $10.1 million after taxes, which is deferred in accumulated other comprehensive income. Of the net unrealizedloss, $16.3 million, or $6.8 million after taxes, is expected to be reclassified to earnings over the next twelve months.
Derivatives Not Designated as Hedging Instruments
The following gains/(losses) from these derivative instruments were recognized on our consolidated statement of earnings (inmillions):
Location on
Statement of Earnings
Year Ended December 31,
Derivative Instrument 2011 2010 2009
Foreign exchange forward contracts Cost of products sold $2.7 $3.3 $(10.3)
Total $2.7 $3.3 $(10.3)
56

ZIMMER HOLDINGS, INC. 2011 FORM 10-K ANNUAL REPORT
Notes to Consolidated Financial Statements (Continued)
This impact does not include any offsetting gains/losses recognized in earnings as a result of foreign currency remeasurementof monetary assets and liabilities denominated in a currency other than an entity’s functional currency.
Balance Sheet Presentation
As of December 31, 2011 and December 31, 2010, all derivative instruments designated as fair value hedges and cash flowhedges are recorded at fair value on the balance sheet. On our consolidated balance sheet, we recognize individual forwardcontracts and options with the same counterparty on a net asset/liability basis if we have a master netting agreement with thecounterparty. The fair value of derivative instruments on a gross basis is as follows (in millions):
As of December 31, 2011 As of December 31, 2010
Balance Sheet Location
Fair
Value Balance Sheet Location
Fair
Value
Asset Derivatives
Foreign exchange forward contracts Other current assets $24.9 Other current assets $32.2
Foreign exchange options Other current assets 1.4 Other current assets 0.4
Foreign exchange forward contracts Other assets 14.5 Other assets 11.6
Foreign exchange options Other assets 1.0 Other assets 2.3
Interest rate swaps Other assets 27.8 Other assets 1.5
Total asset derivatives $69.6 $48.0
Liability Derivatives
Foreign exchange forward contracts Other current liabilities $35.6 Other current liabilities $37.6
Cross-currency interest rate swaps Other current liabilities 8.2 Other current liabilities –
Foreign exchange forward contracts Other long-term liabilities 13.1 Other long-term liabilities 14.4
Total liability derivatives $56.9 $52.0
14. RETIREMENT BENEFIT PLANS
We have defined benefit pension plans covering certain U.S. and Puerto Rico employees. The employees who are notparticipating in the defined benefit plans receive additional benefits under our defined contribution plans. Plan benefits areprimarily based on years of credited service and the participant’s average eligible compensation. In addition to the U.S. and PuertoRico defined benefit pension plans, we sponsor various non-U.S. pension arrangements, including retirement and terminationbenefit plans required by local law or coordinated with government sponsored plans.
We use a December 31 measurement date for our benefit plans.
Defined Benefit Plans
The components of net pension expense for our defined benefit retirement plans are as follows (in millions):
U.S. and Puerto Rico Non-U.S.
For the Years Ended December 31, 2011 2010 2009 2011 2010 2009
Service cost $ 11.4 $ 10.9 $ 12.3 $16.8 $14.6 $13.7
Interest cost 13.0 11.5 10.6 7.3 6.7 6.8
Expected return on plan assets (21.9) (18.1) (16.4) (9.6) (8.0) (8.2)
Curtailment – – 0.4 – – –
Amortization of prior service cost – (0.1) 0.1 (0.8) (0.7) (0.7)
Amortization of unrecognized actuarial loss 6.2 2.4 4.1 1.2 1.2 1.9
Net periodic benefit cost $ 8.7 $ 6.6 $ 11.1 $14.9 $13.8 $13.5
The weighted average actuarial assumptions used to determine net pension expense for our defined benefit retirement planswere as follows:
U.S. and Puerto Rico Non-U.S.
For the Years Ended December 31, 2011 2010 2009 2011 2010 2009
Discount rate 5.82% 6.26% 5.79% 2.82% 3.19% 3.40%
Rate of compensation increase 3.81% 3.80% 3.84% 2.64% 2.63% 2.39%
Expected long-term rate of return on plan assets 7.75% 7.50% 7.75% 4.01% 4.12% 4.16%
57

ZIMMER HOLDINGS, INC. 2011 FORM 10-K ANNUAL REPORT
Notes to Consolidated Financial Statements (Continued)
The expected long-term rate of return on plan assets is based on the historical and estimated future rates of return on thedifferent asset classes held in the plans. The expected long-term rate of return is the weighted average of the target asset allocationof each individual asset class. We believe that historical asset results approximate expected market returns applicable to thefunding of a long-term benefit obligation.
Discount rates were determined for each of our defined benefit retirement plans at their measurement date to reflect the yieldof a portfolio of high quality bonds matched against the timing and amounts of projected future benefit payments.
Changes in projected benefit obligations and plan assets were (in millions):
U.S. and Puerto Rico Non-U.S.
For the Years Ended December 31, 2011 2010 2011 2010
Projected benefit obligation – beginning of year $227.1 $187.6 $226.5 $197.3
Service cost 11.4 10.9 16.8 14.6
Interest cost 13.0 11.5 7.3 6.7
Employee contributions – – 15.9 12.6
Benefits paid (4.5) (3.6) (36.7) (18.1)
Actuarial loss 43.0 20.7 0.4 0.2
Prior service cost – – (1.6) –
Expenses paid – – (0.1) –
Translation loss – – 6.6 13.2
Projected benefit obligation – end of year $290.0 $227.1 $235.1 $226.5
Plan assets at fair market value – beginning of year $244.9 $202.1 $206.0 $179.0
Actual return on plan assets (2.1) 23.2 (2.5) 6.8
Employer contributions 36.8 23.2 16.0 14.0
Employee contributions – – 15.9 12.6
Benefits paid (4.5) (3.6) (36.7) (18.1)
Expenses paid – – (0.1) –
Translation gain – – 6.5 11.7
Plan assets at fair market value – end of year $275.1 $244.9 $205.1 $206.0
Funded status $(14.9) $ 17.8 $(30.0) $(20.5)
Amounts recognized in consolidated balance sheet:
Prepaid pension $ – $ 27.0 $ 4.3 $ 3.0
Short-term accrued benefit liability (1.0) (0.7) – –
Long-term accrued benefit liability (13.9) (8.5) (34.3) (23.5)
Net amount recognized $(14.9) $ 17.8 $(30.0) $(20.5)
Amounts recognized in accumulated other comprehensive income:
Unrecognized prior service cost $ 0.6 $ 0.6 $ (6.7) $ (5.7)
Unrecognized actuarial loss 140.4 79.5 45.5 33.5
Total amount recognized $141.0 $ 80.1 $ 38.8 $ 27.8
We estimate the following amounts recorded as part of accumulated other comprehensive income will be recognized as part ofour net pension expense during 2012 (in millions):
U.S. and
Puerto Rico Non-U.S.
Unrecognized prior service cost $ – $(0.9)
Unrecognized actuarial loss 13.0 2.0
$13.0 $ 1.1
58

ZIMMER HOLDINGS, INC. 2011 FORM 10-K ANNUAL REPORT
Notes to Consolidated Financial Statements (Continued)
The weighted average actuarial assumptions used to determine the projected benefit obligation for our defined benefitretirement plans were as follows:
U.S. and Puerto Rico Non-U.S.
For the Years Ended December 31, 2011 2010 2009 2011 2010 2009
Discount rate 5.05% 5.82% 6.26% 2.49% 2.82% 3.25%
Rate of compensation increase 3.81% 3.80% 3.80% 2.76% 2.61% 2.46%
Plans with projected benefit obligations in excess of plan assets were as follows (in millions):
U.S. and Puerto Rico Non-U.S.
As of December 31, 2011 2010 2011 2010
Projected benefit obligation $290.0 $9.2 $211.5 $200.7
Plan assets at fair market value 275.1 – 177.3 177.3
Plans with accumulated benefit obligations in excess of plan assets were as follows (in millions):
U.S. and Puerto Rico Non-U.S.
As of December 31, 2011 2010 2011 2010
Accumulated benefit obligation $22.4 $6.1 $190.4 $167.2
Plan assets at fair market value 13.0 – 168.7 154.1
The accumulated benefit obligation for U.S. and PuertoRico defined benefit retirement pension plans was$241.3 million and $182.1 million as of December 31, 2011 and2010, respectively. The accumulated benefit obligation fornon-U.S. defined benefit retirement plans was $219.9 millionand $212.9 million as of December 31, 2011 and 2010,respectively.
The benefits expected to be paid out in each of the nextfive years and for the five years combined thereafter are asfollows (in millions):
For the Years Ending December 31,
U.S. and
Puerto Rico Non-U.S.
2012 $ 6.9 $ 16.1
2013 6.9 16.2
2014 8.4 15.8
2015 9.6 16.5
2016 11.1 15.7
2017-2021 81.1 103.0
The U.S. and Puerto Rico defined benefit retirementplans’ overall investment strategy is to maximize total returnsby emphasizing long-term growth of capital while avoidingrisk. We have established target ranges of assets held by theplans of 45 to 50 percent for equity securities, 35 to 40 percentfor debt securities and 5 to 10 percent in non-traditionalinvestments. The plans strive to have sufficiently diversifiedassets so that adverse or unexpected results from one assetclass will not have an unduly detrimental impact on the entireportfolio. The investments in the plans may be rebalancedquarterly based upon the target asset allocation of the plans.
In the U.S. and Puerto Rico, we maintain an investmentpolicy statement that guides the investment allocation in theplans. The investment policy statement describes the targetasset allocation positions described above. We have a benefitscommittee to monitor compliance with the investment policystatement and manage the general investment strategy andobjectives of the plans. The benefits committee meetsquarterly to review performance and to ensure that thecurrent investment allocation is within the guidelines set forthin the investment policy statement.
The investment strategies of non-U.S. based plans varyaccording to the plan provisions and local laws. The majorityof the assets in non-U.S. based plans are located inSwitzerland-based plans. These assets are held in trusts andare commingled with the assets of other Swiss companies withrepresentatives of all the companies making the investmentdecisions. The overall strategy is to maximize total returnswhile avoiding risk. The trustees of the assets have establishedtarget ranges of assets held by the plans of 30 to 50 percent indebt securities, 20 to 37 percent in equity securities, 15 to 24percent in real estate, 3 to 15 percent in cash funds and 0 to12 percent in other funds.
59

ZIMMER HOLDINGS, INC. 2011 FORM 10-K ANNUAL REPORT
Notes to Consolidated Financial Statements (Continued)
The fair value of our U.S. and Puerto Rico pension planassets by asset category were as follows (in millions):
As of December 31, 2011
Fair Value Measurements at Reporting Date Using:
Asset Category Total
Quoted Pricesin Active
Markets forIdentical Assets
(Level 1)
SignificantOther
ObservableInputs
(Level 2)
SignificantUnobservable
Inputs(Level 3)
Cash and cashequivalents $ 1.4 $1.4 $ – $–
Equity securities:
U.S. large-cap 52.9 – 52.9 –
U.S. small-cap 17.4 – 17.4 –
International 50.0 – 50.0 –
Real estate 18.7 – 18.7 –
Commodity-linkedmutual funds 25.0 – 25.0 –
Intermediate fixedincome securities 109.7 – 109.7 –
Total $275.1 $1.4 $273.7 $–
As of December 31, 2010
Fair Value Measurements at Reporting Date Using:
Asset Category Total
Quoted Pricesin Active
Markets forIdentical
Assets(Level 1)
SignificantOther
ObservableInputs
(Level 2)
SignificantUnobservable
Inputs(Level 3)
Cash and cashequivalents $ 0.8 $0.8 $ – $–
Equity securities:
U.S. large-cap 34.1 – 34.1 –
U.S. small-cap 12.3 – 12.3 –
International 43.8 – 43.8 –
Real estate 14.8 – 14.8 –
Commodity-linkedmutual funds 25.7 – 25.7 –
Intermediate fixedincome securities 113.4 – 113.4 –
Total $244.9 $0.8 $244.1 $–
The fair value of our non-U.S. pension plan assets were asfollows (in millions):
As of December 31, 2011
Fair Value Measurements at Reporting Date Using:
Asset Category Total
Quoted Pricesin Active
Markets forIdentical
Assets(Level 1)
SignificantOther
ObservableInputs
(Level 2)
SignificantUnobservable
Inputs(Level 3)
Cash and cash equivalents $ 10.8 $10.8 $ – $ –
Equity securities:
Energy 1.9 1.9 – –
Materials 2.0 2.0 – –
Industrials 3.7 3.7 – –
Consumer discretionary 2.1 2.1 – –
Consumer staples 4.0 4.0 – –
Healthcare 6.0 6.0 – –
Financials 5.8 5.8 – –
Information technology 2.3 2.3 – –
Telecommunicationservices 1.0 1.0 – –
Utilities 1.6 1.6 – –
Other 28.9 26.6 2.3 –
Fixed income securities:
Government bonds 42.5 – 42.5 –
Corporate bonds 35.5 – 35.5 –
Asset-backed securities 8.4 – 8.4 –
Other debt 1.1 – 1.1 –
Other types of investments:
Mortgage loans 5.2 – 5.2 –
Insurance contracts 5.5 – 5.5 –
Other investments 5.0 – 5.0 –
Real estate 31.8 – – 31.8
Total $205.1 $67.8 $105.5 $31.8
As of December 31, 2010
Fair Value Measurements at Reporting Date Using:
Asset Category Total
Quoted Pricesin Active
Markets forIdentical
Assets(Level 1)
SignificantOther
ObservableInputs
(Level 2)
SignificantUnobservable
Inputs(Level 3)
Cash and cash equivalents $ 14.3 $14.3 $ – $ –
Equity securities:
Energy 2.0 2.0 – –
Materials 1.6 1.6 – –
Industrials 3.4 3.4 – –
Consumer discretionary 2.5 2.5 – –
Consumer staples 3.7 3.7 – –
Healthcare 6.7 6.7 – –
Financials 7.0 7.0 – –
Information technology 2.8 2.8 – –
Telecommunicationservices 1.0 1.0 – –
Utilities 2.2 2.2 – –
Other 27.1 24.2 2.9 –
Fixed income securities:
Government bonds 33.0 – 33.0 –
Corporate bonds 41.0 – 41.0 –
Asset-backed securities 7.4 – 7.4 –
Other debt 1.1 – 1.1 –
Other types of investments:
Mortgage loans 5.6 – 5.6 –
Insurance contracts 5.0 – 5.0 –
Other investments 7.1 – 7.1 –
Real estate 31.5 – – 31.5
Total $206.0 $71.4 $103.1 $31.5
60

ZIMMER HOLDINGS, INC. 2011 FORM 10-K ANNUAL REPORT
Notes to Consolidated Financial Statements (Continued)
As of December 31, 2011 and 2010, our defined benefitpension plans’ assets did not hold any direct investment inZimmer Holdings common stock.
Equity securities are valued using a market approach,based on quoted prices for the specific security fromtransactions in active exchange markets (Level 1), or in somecases where we are invested in mutual or collective funds,based upon the net asset value per unit of the fund which isdetermined from quoted market prices of the underlyingsecurities in the fund’s portfolio (Level 2). Fixed incomesecurities are valued using a market approach, based uponquoted prices for the specific security or from institutional bidevaluations. Some fixed income securities are in funds with anet asset value per unit which is determined using similartechniques for the underlying securities in the fund’s portfolio.Real estate is valued by discounting to present value the cashflows expected to be generated by the specific properties.
The following table provides a reconciliation of thebeginning and ending balances of our non-U.S. pension planassets measured at fair value that used significantunobservable inputs (Level 3):
December 31,
2011
Beginning Balance 31.5Gains on assets sold 0.2Change in fair value of assets 0.7Net purchases and sales (1.5)Translation gain 0.9
Ending Balance $31.8
We expect that we will have no legally required minimumfunding requirements in 2012 for the qualified U.S. and PuertoRico defined benefit retirement plans. We expect to voluntarilycontribute approximately $54 million to these plans during2012. Contributions to non-U.S. defined benefit plans areestimated to be approximately $14 million in 2012. We do notexpect the plan assets in any of our plans to be returned to usin the next year.
Defined Contribution Plans
We also sponsor defined contribution plans forsubstantially all of the U.S. and Puerto Rico employees andcertain employees in other countries. The benefits offeredunder these plans are reflective of local customs and practicesin the countries concerned. We expensed $25.7 million, $24.4million and $21.6 million related to these plans for the yearsended December 31, 2011, 2010 and 2009, respectively.
Postretirement Benefit Plans
During 2009, we amended the postretirement healthcarebenefit plans for certain U.S. and Puerto Rico employees.Participants in the plans between the ages of 55 and 65 whowere previously receiving benefits will continue to receivebenefits until reaching the age of 65. For all other participantsin the plans, no benefits will be paid after January 1, 2010.Additionally, we contributed approximately $7 million to a
Voluntary Employees’ Beneficiary Association (VEBA) trust tosettle any future obligations. We recognized a curtailment gainand settlement loss that netted to a gain of $32.1 millionrelated to these actions.
We have not provided further disclosures related to thesepostretirement benefit plans as other than the curtailment gainand settlement loss in 2009 discussed above, these plans werenot significant to our results of operations or financial position.
15. INCOME TAXES
The components of earnings before taxes consist of thefollowing (in millions):
For the Years Ended December 31, 2011 2010 2009
United States operations $485.7 $382.4 $489.7
Foreign operations 493.2 477.8 508.5
Total $978.9 $860.2 $998.2
The provision for income taxes consists of (in millions):
Current:
Federal $148.4 $235.3 $204.9
State 14.3 19.5 23.3
Foreign 75.9 81.0 72.3
238.6 335.8 300.5
Deferred:
Federal (2.6) (54.9) (17.4)
State (0.9) (2.0) (3.1)
Foreign (16.2) (15.6) 0.8
(19.7) (72.5) (19.7)
Provision for income taxes $218.9 $263.3 $280.8
Income taxes paid during 2011, 2010 and 2009 were$236.4 million, $330.6 million and $268.5 million, respectively.
A reconciliation of the U.S. statutory income tax rate toour effective tax rate is as follows:
For the Years Ended December 31, 2011 2010 2009
U.S. statutory income tax rate 35.0% 35.0% 35.0%
State taxes, net of federal deduction 0.7 1.3 1.4
Tax impact of foreign operations,including foreign tax credits (11.0) (10.6) (9.9)
Tax benefit relating to U.S.manufacturer’s deduction andexport sales (1.6) (2.6) (1.5)
R&D credit (0.5) (0.8) (0.3)
Goodwill impairment – 8.3 2.6
Other (0.2) – 0.8
Effective income tax rate 22.4% 30.6% 28.1%
Our operations in Puerto Rico, Switzerland and the Stateof Indiana benefit from various tax incentive grants. Unlessthese grants are extended, they will expire between fiscalyears 2016 and 2026.
61

ZIMMER HOLDINGS, INC. 2011 FORM 10-K ANNUAL REPORT
Notes to Consolidated Financial Statements (Continued)
Deferred income taxes reflect the net tax effects oftemporary differences between the carrying amounts of assetsand liabilities for financial reporting purposes and the amountsused for income tax purposes. Valuation allowances arerecorded to reduce deferred income tax assets when it is morelikely than not that an income tax benefit will not be realized.
The components of deferred taxes consisted of thefollowing (in millions):
As of December, 31 2011 2010
Deferred tax assets:
Inventory $ 218.5 $ 234.3
Net operating loss carryover 23.5 22.0
Tax credit carryover 16.9 32.5
Capital loss carryover 4.0 –
Accrued liabilities 116.1 91.3
Share-based compensation 98.3 85.4
Unremitted earnings of foreign subsidiaries 103.9 104.2
Other 73.1 59.2
Total deferred tax assets 654.3 628.9
Less: Valuation allowances (40.3) (39.9)
Total deferred tax assets after valuation 614.0 589.0
Deferred tax liabilities:
Fixed assets $(111.6) $(101.7)
Intangible assets (148.9) (151.9)
Accrued liabilities (1.0) (0.7)
Other – (1.0)
Total deferred tax liabilities (261.5) (255.3)
Total net deferred tax assets $ 352.5 $ 333.7
The net operating loss carryovers are available to reducefuture federal, state and foreign taxable earnings. AtDecember 31, 2011, these net operating loss carryoversgenerally expire within a period of 1 to 20 years. Valuationallowances for net operating loss carryovers have beenestablished in the amount of $14.6 million for bothDecember 31, 2011 and 2010. The tax credit carryovers areavailable to offset future federal, state and foreign taxliabilities. At December 31, 2011, these tax credit carryoversgenerally expire within a period of 1 to 10 years. We haveestablished valuation allowances for certain tax creditcarryovers in the amount of $15.3 million and $17.5 million atDecember 31, 2011 and 2010, respectively. The capital losscarryover is also available to reduce future federal taxableearnings. However, the entire $4.0 million capital losscarryover is subject to a valuation allowance and expires in 5years. The remaining valuation allowances of $6.4 million and$7.8 million at December 31, 2011 and 2010, respectively,relate primarily to potential capital losses.
At December 31, 2011, we had an aggregate ofapproximately $2,551 million of unremitted earnings of foreignsubsidiaries that have been, or are intended to be, indefinitelyreinvested for continued use in foreign operations. If the total
undistributed earnings of foreign subsidiaries were remitted, asignificant amount of the additional tax would be offset by theallowable foreign tax credits. It is not practical for us todetermine the additional tax of remitting these earnings.
The following is a tabular reconciliation of the totalamounts of unrecognized tax benefits (in millions):
For the Years Ended December 31, 2011 2010 2009
Balance at January 1 $168.0 $150.4 $129.5
Increases related to prior periods 11.4 23.1 32.9
Decreases related to prior periods (49.0) (6.1) (26.7)
Increases related to current period 34.4 23.7 17.4
Decreases related to settlements withtaxing authorities (4.8) (14.1) (1.1)
Decreases related to lapse of statute oflimitations (1.6) (9.0) (1.6)
Balance at December 31 $158.4 $168.0 $150.4
Included in the balance of unrecognized tax benefits atDecember 31, 2011 are $132.7 million of tax benefits that, ifrecognized, would affect the effective tax rate.
We recognize accrued interest and penalties related tounrecognized tax benefits as income tax expense. Wedecreased interest and penalties by $12.1 million during 2011,and as of December 31, 2011, had recognized a liability forinterest and penalties of $10.7 million. During 2010, wedecreased interest and penalties by $5.8 million, and as ofDecember 31, 2010, had recognized a liability for interest andpenalties of $22.8 million. During 2009, we accrued interestand penalties of $5.7 million, and as of December 31, 2009, hadrecognized a liability for interest and penalties of $28.6 million.
We operate on a global basis and are subject to numerousand complex tax laws and regulations. Our income tax filingsare regularly under audit in multiple federal, state and foreignjurisdictions. Income tax audits may require an extendedperiod of time to reach resolution and may result in significantincome tax adjustments when interpretation of tax laws orallocation of company profits is disputed. During 2011, weresolved tax matters with the IRS and multiple foreign andstate tax authorities resulting in a reduction in both the netamount of tax liability for unrecognized tax benefits andincome tax expense. The net amount of tax liability forunrecognized tax benefits may change within the next twelvemonths due to changes in audit status, expiration of statutes oflimitations and other events which could impact ourdetermination of unrecognized tax benefits. Currently, wecannot reasonably estimate the amount by which ourunrecognized tax benefits will change.
During the third quarter of 2009, we settled various taxmatters with the IRS for all years prior to 2005. During thesecond quarter of 2011, the IRS concluded their examinationof our U.S. federal returns for years 2005 through 2007 andissued income tax assessments reallocating profits betweencertain of our U.S. and foreign subsidiaries. We believe that we
62

ZIMMER HOLDINGS, INC. 2011 FORM 10-K ANNUAL REPORT
Notes to Consolidated Financial Statements (Continued)
have followed applicable U.S. tax laws and are vigorouslydefending our income tax positions. The ultimate resolution ofthis matter is uncertain and could have a material impact onour income tax expense, results of operations, and cash flowsfor future periods. Our U.S. federal returns for years 2008 and2009 are currently under IRS examination.
State income tax returns are generally subject toexamination for a period of 3 to 5 years after filing of therespective return. The state impact of any federal changesgenerally remains subject to examination by various states fora period of up to one year after formal notification to thestates. We have various state income tax returns in the processof examination, administrative appeals or litigation.
Our tax returns are currently under examination invarious foreign jurisdictions. Foreign jurisdictions havestatutes of limitations generally ranging from 3 to 5 years.Years still open to examination by foreign tax authorities inmajor jurisdictions include: Australia (2007 onward), Canada(2005 onward), France (2009 onward), Germany (2006onward), Ireland (2008 onward), Italy (2006 onward), Japan(2010 onward), Korea (2006 onward), Puerto Rico (2005onward), Switzerland (2010 onward), and the United Kingdom(2010 onward).
16. CAPITAL STOCK AND EARNINGS PER SHARE
We are authorized to issue 250 million shares of preferredstock, none of which were issued or outstanding as ofDecember 31, 2011.
The numerator for both basic and diluted earnings pershare is net earnings available to common stockholders. Thedenominator for basic earnings per share is the weightedaverage number of common shares outstanding during theperiod. The denominator for diluted earnings per share isweighted average shares outstanding adjusted for the effect ofdilutive stock options and other equity awards. The following isa reconciliation of weighted average shares for the basic anddiluted share computations (in millions):
For the Years Ended December 31, 2011 2010 2009
Weighted average shares outstanding for basicnet earnings per share 187.6 200.0 215.0
Effect of dilutive stock options and otherequity awards 1.1 1.1 0.8
Weighted average shares outstanding fordiluted net earnings per share 188.7 201.1 215.8
For the year ended December 31, 2011, an average of13.2 million options to purchase shares of common stock werenot included in the computation of diluted earnings per shareas the exercise prices of these options were greater than theaverage market price of the common stock. For the yearsended December 31, 2010 and 2009, an average of 13.7 millionand 14.3 million options, respectively, were not included.
During 2011, we repurchased 18.9 million shares of ourcommon stock at an average price of $55.54 per share for atotal cash outlay of $1,050.0 million, including commissions. InDecember 2011, we announced a new program authorizingpurchases of up to $1.5 billion through December 31, 2014 andannounced that we were no longer authorized to repurchaseshares under prior programs. As of December 31, 2011, all $1.5billion from the new program remained available to repurchaseshares.
In December 2011, we declared a dividend of $0.18 pershare to be paid in April 2012 to stockholders of record as ofthe close of business on March 30, 2012. As of December 31,2011, we have recognized a dividend payable of $32.1 millionbased upon the common stock outstanding on that date.Future declarations of dividends are subject to approval of theBoard of Directors and may be adjusted as business needs ormarket conditions change.
17. SEGMENT DATA
We design, develop, manufacture and market orthopaedicreconstructive implants, biologics, dental implants, spinalimplants, trauma products and related surgical products whichinclude surgical supplies and instruments designed to aid insurgical procedures and post-operation rehabilitation. We alsoprovide other healthcare-related services. Revenue related tothese services currently represents less than 1 percent of ourtotal net sales. We manage operations through three majorgeographic segments – the Americas, which is comprisedprincipally of the U.S. and includes other North, Central andSouth American markets; Europe, which is comprisedprincipally of Europe and includes the Middle East and Africanmarkets; and Asia Pacific, which is comprised primarily ofJapan and includes other Asian and Pacific markets. Thisstructure is the basis for our reportable segment informationdiscussed below. Management evaluates reportable segmentperformance based upon segment operating profit exclusive ofoperating expenses pertaining to share-based paymentexpense, inventory step-up, “Certain claims”, goodwillimpairment, “Special items”, net curtailment and settlementand global operations and corporate functions. Globaloperations and corporate functions include research,development engineering, medical education, brandmanagement, corporate legal, finance, and human resourcefunctions, U.S., Puerto Rico and Ireland-based manufacturingoperations and logistics and intangible asset amortizationresulting from business combination accounting. Intercompanytransactions have been eliminated from segment operatingprofit. Management reviews accounts receivable, inventory,property, plant and equipment, goodwill and intangible assetsby reportable segment exclusive of U.S., Puerto Rico andIreland-based manufacturing operations and logistics andcorporate assets.
63

ZIMMER HOLDINGS, INC. 2011 FORM 10-K ANNUAL REPORT
Notes to Consolidated Financial Statements (Continued)
Net sales and other information by segment is as follows (in millions):
Americas Europe
Asia
Pacific
Global
Operations
and
Corporate
Functions Total
As of and for the Year Ended December 31, 2011
Net sales $2,440.8 $1,214.5 $796.5 $ – $4,451.8Depreciation and amortization 81.0 74.9 36.3 167.7 359.9Segment operating profit 1,220.4 414.7 290.6 (596.7) 1,329.0
Share-based payment expense (60.5)Inventory step-up (11.4)Certain claims (157.8)Special items (75.2)
Operating profit 1,024.1Long-lived assets 769.0 330.6 107.7 – 1,207.3Total assets 2,571.6 2,345.5 602.4 2,995.8 8,515.3Additions to instruments – 15.2 7.7 132.5 155.4Additions to other property, plant and equipment 1.3 23.8 4.7 84.0 113.8
As of and for the Year Ended December 31, 2010
Net sales $2,431.6 $1,099.5 $689.1 $ – $4,220.2Depreciation and amortization 78.1 70.5 30.0 161.6 340.2Segment operating profit 1,214.6 398.0 259.9 (578.7) 1,293.8
Share-based payment expense (62.0)Inventory step-up (1.4)Certain claims (75.0)Goodwill impairment (204.0)Special items (34.7)
Operating profit 916.7Long-lived assets 841.5 281.7 90.6 – 1,213.8Total assets 2,578.0 2,210.8 561.4 2,649.7 7,999.9Additions to instruments – 22.9 5.2 164.4 192.5Additions to other property, plant and equipment 0.3 16.9 7.6 54.4 79.2
As of and for the Year Ended December 31, 2009
Net sales $2,372.4 $1,119.2 $603.8 $ – $4,095.4Depreciation and amortization 86.4 64.8 26.7 159.5 337.4Segment operating profit 1,168.7 436.8 257.4 (605.1) 1,257.8
Share-based payment expense (75.3)Inventory step-up (12.5)Certain claims (35.0)Goodwill impairment (73.0)Special items (75.3)Net curtailment and settlement 32.1
Operating profit 1,018.8Long-lived assets 851.0 285.0 85.7 – 1,221.7Total assets 3,022.4 2,273.6 443.6 2,045.9 7,785.5Additions to instruments – 17.0 5.3 101.4 123.7Additions to other property, plant and equipment 0.6 28.8 5.1 70.6 105.1
64

ZIMMER HOLDINGS, INC. 2011 FORM 10-K ANNUAL REPORT
Notes to Consolidated Financial Statements (Continued)
The Americas long-lived tangible assets are locatedprimarily in the U.S. $233.2 million of Europe long-livedtangible assets as of December 31, 2011 are located inSwitzerland.
For segment reporting purposes, deployed instrumentsare included in the measurement of reportable segment assetswhile undeployed instruments at U.S., Puerto Rico and Ireland-based manufacturing operations and logistics are included inglobal operations and corporate functions. The majority ofinstruments are purchased by U.S., Puerto Rico and Ireland-based manufacturing operations and logistics and are deployedto the reportable segments as needed for the business.Therefore, the reportable segment assets include deployedinstruments even though that reportable segment may notreport the instrument addition.
U.S. sales were $2,263.7 million, $2,277.2 million and$2,237.5 million for the years ended December 31, 2011, 2010and 2009, respectively. Sales within any other individualcountry were less than 10 percent of our consolidated sales.Sales are attributable to a country based upon the customer’scountry of domicile.
Net sales by product category are as follows (in millions):
For the Years Ended December 31, 2011 2010 2009
Reconstructive
Knees $1,825.1 $1,789.9 $1,756.3
Hips 1,355.6 1,262.3 1,228.5
Extremities 163.4 150.1 135.6
Total 3,344.1 3,202.3 3,120.4
Dental 248.1 219.0 204.7
Trauma 285.8 245.5 234.8
Spine 225.0 234.4 253.6
Surgical and other 348.8 319.0 281.9
Total $4,451.8 $4,220.2 $4,095.4
18. LEASES
Total rent expense for the years ended December 31,2011, 2010 and 2009 aggregated $47.0 million, $46.2 millionand $43.5 million, respectively.
Future minimum rental commitments undernon-cancelable operating leases in effect as of December 31,2011 were (in millions):
For the Years Ending December 31,
2012 $43.5
2013 35.5
2014 22.7
2015 19.9
2016 16.6
Thereafter 41.5
19. COMMITMENTS AND CONTINGENCIES
Product Liability-Related Claims
We are subject to product liability claims arising in theordinary course of our business. We establish standardaccruals for product liability claims in conjunction with outsidecounsel based on current information and historical settlementinformation for open claims, related legal fees and claimsincurred but not reported. These standard product liabilityaccruals are recognized in selling, general and administrativeexpense. We may also establish provisions for certain productliability claims outside of the standard accruals that arerecorded separately on our statement of earnings, such as theprovision for claims related to the Durom® AcetabularComponent (Durom Cup) discussed below. We maintaininsurance, subject to self-insured retention requirements, forlosses from these and other claims.
On July 22, 2008, we temporarily suspended marketingand distribution of the Durom Cup in the U.S. Subsequently, anumber of product liability lawsuits and other claims havebeen asserted against us. We have settled some of these claimsand the others are still pending. Additional claims may beasserted in the future.
Initially, we estimated that any revision surgeries requiredwould manifest themselves within two years of the originalsurgery. In the second quarter of 2010, based upon morerecent claims information available, we revised our estimate toinclude all claims for revisions of original surgeries performedbefore July 22, 2008 (i.e., before our temporary suspension) ona worldwide basis, regardless of the amount of time betweenthe revision surgery and the original surgery. In the fourthquarter of 2011, as additional claims information becameavailable, we revised our estimates and methodology again toconsolidate all estimated liabilities associated with Durom
Cup-related claims regardless of whether the original surgeryoccurred before or after our temporary sales suspension. Werecognized estimated claims that met the parameters noted inthis paragraph during that time period as “Certain claims” onour statement of earnings. We recognized estimated claimsoutside these parameters as part of selling, general andadministrative expense. The following table shows the line ofour statement of earnings and the period in which Durom
Cup-related claims were recognized:
For the Years Ended December 31, 2011 2010 2009 2008 Total
Certain claims $157.8 $75.0 $35.0 $69.0 $336.8
Selling, general andadministrative 4.2 15.4 24.6 7.2 51.4
Total $162.0 $90.4 $59.6 $76.2 $388.2
As noted above, we maintain insurance for productliability claims, subject to self-insurance retentionrequirements. In 2008, we notified our insurance carriers ofpotential claims related to the Durom Cup. Based upon ourmost recent estimates for liabilities associated with the Durom
65

ZIMMER HOLDINGS, INC. 2011 FORM 10-K ANNUAL REPORT
Notes to Consolidated Financial Statements (Continued)
Cup, as detailed above, we believe we may exhaust ourself-insured retention under our insurance program. In thisevent, we would have a claim for insurance proceeds forultimate losses which exceed the self-insured retentionamount, subject to a 20 percent co-payment requirement and acap. We believe our contracts with the insurance carriers areenforceable for these claims and therefore we believe it ishighly probable that we would recover some amount from ourinsurance carriers if our ultimate losses exceed our self-insured retention. Accordingly, we have recognized a $76.3million receivable in “other assets” on our consolidated balancesheet that reduced “Certain claims” expense for estimatedinsurance recoveries. As is customary in this process, ourinsurance carriers have reserved all rights under theirrespective policies and could still ultimately deny coverage forsome or all of our insurance claims.
Our estimate as of December 31, 2011, of the remainingliability for all Durom Cup-related claims is $311.1 million, ofwhich $50.0 million is classified as short-term in “Other currentliabilities” and $261.1 million is classified as long-term in“Other long-term liabilities” on our consolidated balance sheet.We expect to pay the majority of the Durom Cup-relatedclaims within the next five years.
Our understanding of clinical outcomes with the Durom
Cup continues to evolve. We rely on significant estimates indetermining the provisions for Durom Cup-related claims,including the number of claims that we will receive and theaverage amount we will pay per claim. The actual number ofclaims that we receive and the amount we pay per claim maydiffer from our estimates. Since our understanding of theclinical outcomes is still evolving, we cannot reasonablyestimate the possible loss or range of loss that may result fromDurom Cup-related claims in excess of the losses we haveaccrued.
On August 20, 2008, Margo and Daniel Polett filed anaction against us and an unrelated third party, PublicCommunications, Inc. (PCI), in the Court of Common Pleas,Philadelphia, Pennsylvania seeking an unspecified amount ofdamages for injuries and loss of consortium allegedly sufferedby Mrs. Polett and her spouse, respectively. The complaintalleged that defendants were negligent in connection withMrs. Polett’s participation in a promotional video featuring oneof our knee products. The case was tried in November 2010and the jury returned a verdict in favor of plaintiffs. The juryawarded $27.6 million in compensatory damages andapportioned fault 30 percent to plaintiffs, 34 percent to us and36 percent to PCI. Under applicable law, we may be liable forany portion of the damages apportioned to PCI that it does notpay. On December 2, 2010, we and PCI filed a Motion for Post-Trial Relief seeking a judgment notwithstanding the verdict, anew trial or a remittitur. On June 10, 2011, the trial courtentered an order denying our Motion for Post-Trial Relief andaffirming the jury verdict in full and entered judgment for$20.3 million against us and PCI. On June 29, 2011, we filed aNotice of Appeal to the Superior Court of Pennsylvania and
posted a bond for the verdict amount plus interest. Oralargument before a panel of the Superior Court is scheduled forMarch 13, 2012. We do not believe the facts and evidencesupport the jury’s verdict. We have not recorded any chargerelating to this matter in our consolidated statement ofearnings for the year ended December 31, 2011 or for any priorperiod, because we believe we have strong arguments forreversing the jury verdict on appeal. As a result, we do notbelieve that it is probable that we have incurred a liabilityconsistent with the verdict and we cannot reasonably estimateany loss that might eventually be incurred. Although webelieve we have strong grounds to reverse the jury’s verdict,the ultimate resolution of this matter is uncertain. We could inthe future be required to record a charge to our consolidatedstatement of earnings that could have a material adverse effecton our results of operations in any particular period.
Following a wide-spread advertising campaign conductedby certain law firms beginning in 2010, a number of productliability lawsuits have been filed against us in variousjurisdictions. The plaintiffs seek damages for personal injury,alleging that certain products within the NexGen Knee Systemsuffer from defects that cause them to loosen prematurely. Themajority of the cases are currently pending in a federalMultidistrict Litigation in the Northern District of Illinois.Other cases are pending in other state and federal courts, andadditional lawsuits may be filed.
As of December 31, 2011, these lawsuits were in the initialstages of discovery and no trial dates had been set. We havenot recorded any provision relating to these lawsuits becausewe believe the plaintiffs’ allegations are not consistent with therecord of clinical success for these products. As a result, we donot believe that it is probable that we have incurred a liability,and we cannot reasonably estimate any loss that mighteventually be incurred. Although we intend to vigorouslydefend these lawsuits, their ultimate resolution is uncertain.
Intellectual Property-Related Claims
We are involved in certain ongoing contractual and otherdisputes pertaining to certain royalty arrangements. We intendto defend ourselves vigorously against these claims. Becausethese matters are in an ongoing dispute resolution process, wecannot estimate the possible loss, if any, we may incur orpredict the likely outcome of these matters. An adverse resultin the legal proceedings could have an adverse effect on ourresults of operations.
Government Investigations
In September 2007, we and other orthopaedic companiessettled a U.S. government investigation pertaining toconsulting contracts, professional services agreements andother agreements by which remuneration is provided toorthopaedic surgeons. As part of the settlement, we enteredinto a Corporate Integrity Agreement (CIA) with the Office ofInspector General of the Department of Health and Human
66
ZIMMER HOLDINGS, INC. 2011 FORM 10-K ANNUAL REPORT
Notes to Consolidated Financial Statements (Continued)
Services (OIG-HHS). Under the CIA, which has a term expiringin September 2012, we agreed, among other provisions, tocontinue the operation of our enhanced Corporate ComplianceProgram, designed to promote compliance with federalhealthcare program requirements. We also agreed to retain anindependent review organization to perform annual reviews toassist us in assessing our compliance with the obligations setforth in the CIA to ensure that arrangements we enter into donot violate the Anti-Kickback Statute (42 U.S.C. § 1320a-7b). Amaterial breach of the CIA may subject us to exclusion byOIG-HHS from participation in all federal healthcare programs,which would have a material adverse effect on our financialposition, results of operations and cash flows.
In September 2007, the Staff of the U.S. Securities andExchange Commission (SEC) informed us that it wasconducting an investigation regarding potential violations ofthe Foreign Corrupt Practices Act (FCPA) in the sale ofmedical devices in a number of foreign countries by companiesin the medical device industry. In November 2007, we receiveda letter from the U.S. Department of Justice (DOJ) requestingthat any information provided to the SEC also be provided tothe DOJ on a voluntary basis. In the course of continuingdialogues with the agencies, we have voluntarily disclosedinformation to the SEC and DOJ relating to sales of ourproducts by independent distributors in two South Americancountries. In the first quarter of 2011, we received a subpoenafrom the SEC seeking documents and other records pertainingto our business activities in substantially all countries in theAsia Pacific region where we operate. We are in the process ofresponding to the subpoena. We cannot currently predict theoutcome of this investigation. If the result of the investigationis that we are found to be in violation of the FCPA, we couldface significant monetary penalties or be required to take otherremedial actions.
Putative Class Actions
On August 5, 2008, a complaint was filed in theU.S. District Court for the Southern District of Indiana,Plumbers and Pipefitters Local Union 719 Pension Fund v.Zimmer Holdings, Inc., et al., naming us and two of ourexecutive officers as defendants. The complaint related to aputative class action on behalf of persons who purchased ourcommon stock between January 29, 2008 and July 22, 2008.The complaint alleged that the defendants violated the federalsecurities law by allegedly failing to disclose developmentsrelating to our orthopaedic surgical products manufacturingoperations in Dover, Ohio and the Durom Cup. The plaintiffsought unspecified damages and interest, attorneys’ fees, costsand other relief. On December 24, 2008, the lead plaintiff fileda consolidated complaint that alleged the same claims andrelated to the same time period. The defendants filed a motionto dismiss the consolidated complaint on February 23, 2009.On December 1, 2009, the Court granted defendants’ motion todismiss, without prejudice. On January 15, 2010, the plaintifffiled a motion for leave to amend the consolidated complaint.
On January 28, 2011, the Court denied the plaintiff’s motionfor leave to amend the consolidated complaint and dismissedthe case. On February 25, 2011, the plaintiff filed a notice ofappeal to the U.S. Court of Appeals for the Seventh Circuit.The appellate court heard oral argument in the appeal onOctober 18, 2011 but has not yet ruled. We believe this lawsuitis without merit, and we and the individual defendants intendto continue to defend it vigorously.
On November 20, 2008, a complaint was filed in theU.S. District Court for the Northern District of Indiana,Dewald v. Zimmer Holdings, Inc., et al., naming us and certainof our current and former directors and employees asdefendants. The complaint relates to a putative class action onbehalf of all persons who were participants in or beneficiariesof our U.S. or Puerto Rico Savings and Investment Programs(plans) between October 5, 2007 and the date of filing andwhose accounts included investments in our common stock.The complaint alleges, among other things, that the defendantsbreached their fiduciary duties in violation of the EmployeeRetirement Income Security Act of 1974, as amended, bycontinuing to offer Zimmer stock as an investment option inthe plans when the stock purportedly was no longer a prudentinvestment and that defendants failed to provide planparticipants with complete and accurate information sufficientto advise them of the risks of investing their retirement savingsin Zimmer stock. The plaintiff seeks an unspecified monetarypayment to the plans, injunctive and equitable relief, attorneys’fees, costs and other relief. On January 23, 2009, the plaintifffiled an amended complaint that alleges the same claims andclarifies that the class period is October 5, 2007 throughSeptember 2, 2008. The defendants filed a motion to dismissthe amended complaint on March 23, 2009. On June 12, 2009,the U.S. Judicial Panel on Multidistrict Litigation entered anorder transferring the Dewald case to the U.S. District Courtfor the Southern District of Indiana for coordinated orconsolidated pretrial proceedings with the Plumbers &Pipefitters Local Union 719 Pension Fund case referencedabove. On December 23, 2011, the Court granted thedefendants’ motion to dismiss the amended complaint. OnJanuary 20, 2012, the plaintiff filed a motion for leave to file asecond amended complaint. That motion is pending with theCourt. We believe this lawsuit is without merit, and we and theindividual defendants intend to continue to defend itvigorously.
Regulatory Matters
In July 2011, the U.S. Food and Drug Administration(FDA) conducted an inspection of our Warsaw, Indianamanufacturing facility, following which it issued aForm FDA-483 (Form 483 notice). The Form 483 noticeidentified certain inspectional observations regarding thefacility’s quality systems. The facility manufacturesreconstructive products that are sold globally. We haveresponded in writing to the observations and met withrepresentatives of the district office of the FDA to discuss our
67
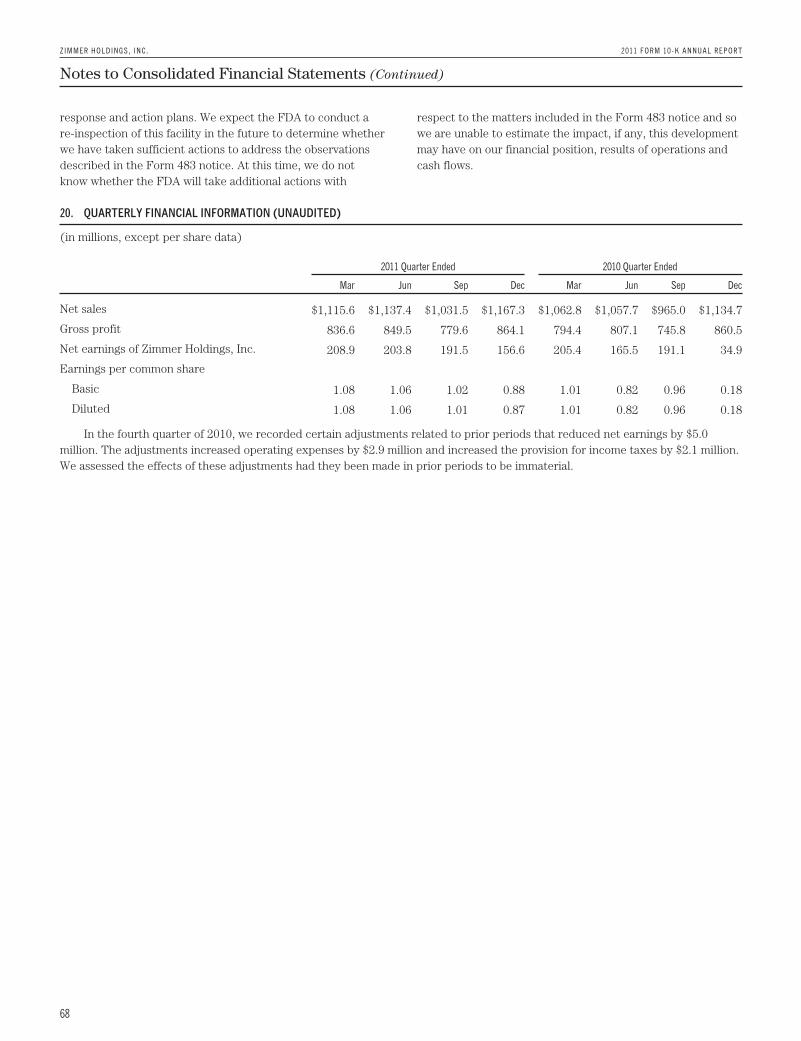
ZIMMER HOLDINGS, INC. 2011 FORM 10-K ANNUAL REPORT
Notes to Consolidated Financial Statements (Continued)
response and action plans. We expect the FDA to conduct are-inspection of this facility in the future to determine whetherwe have taken sufficient actions to address the observationsdescribed in the Form 483 notice. At this time, we do notknow whether the FDA will take additional actions with
respect to the matters included in the Form 483 notice and sowe are unable to estimate the impact, if any, this developmentmay have on our financial position, results of operations andcash flows.
20. QUARTERLY FINANCIAL INFORMATION (UNAUDITED)
(in millions, except per share data)
2011 Quarter Ended 2010 Quarter Ended
Mar Jun Sep Dec Mar Jun Sep Dec
Net sales $1,115.6 $1,137.4 $1,031.5 $1,167.3 $1,062.8 $1,057.7 $965.0 $1,134.7
Gross profit 836.6 849.5 779.6 864.1 794.4 807.1 745.8 860.5
Net earnings of Zimmer Holdings, Inc. 208.9 203.8 191.5 156.6 205.4 165.5 191.1 34.9
Earnings per common share
Basic 1.08 1.06 1.02 0.88 1.01 0.82 0.96 0.18
Diluted 1.08 1.06 1.01 0.87 1.01 0.82 0.96 0.18
In the fourth quarter of 2010, we recorded certain adjustments related to prior periods that reduced net earnings by $5.0million. The adjustments increased operating expenses by $2.9 million and increased the provision for income taxes by $2.1 million.We assessed the effects of these adjustments had they been made in prior periods to be immaterial.
68
ZIMMER HOLDINGS, INC. 2011 FORM 10-K ANNUAL REPORT
ITEM 9. Changes in and Disagreements With Accountants on Accounting and Financial Disclosure
None
ITEM 9A. Controls and Procedures
We maintain disclosure controls and procedures (asdefined in Rules 13a-15(e) under the Exchange Act) that aredesigned to provide reasonable assurance that informationrequired to be disclosed in the reports that we file or submitunder the Exchange Act is recorded, processed, summarizedand reported within the time periods specified in the SEC’srules and forms, and that such information is accumulated andcommunicated to our management, including our ChiefExecutive Officer and Chief Financial Officer, as appropriateto allow timely decisions regarding required disclosures.Because of inherent limitations, disclosure controls andprocedures, no matter how well designed and operated, canprovide only reasonable, and not absolute, assurance that theobjectives of disclosure controls and procedures are met.
Our management, with the participation of our ChiefExecutive Officer and Chief Financial Officer, evaluated theeffectiveness of the design and operation of our disclosurecontrols and procedures. Based on that evaluation, our ChiefExecutive Officer and Chief Financial Officer concluded that,as of the end of the period covered by this report, ourdisclosure controls and procedures are effective at areasonable assurance level.
In 2011, we signed a contract with a third-party serviceprovider to outsource certain finance functions thathistorically have been performed in multiple countriesthroughout Europe and in the U.S. We began transitioningwork to the service provider in the quarter ended
December 31, 2011. The outsourcing arrangement is expectedto create cost efficiencies by eliminating redundancies in theseadministrative functions. Additionally, we have begun tocentralize other finance functions that historically have beenperformed in a decentralized manner. This outsourcing andcentralization is part of our ongoing global businesstransformation initiatives, and we plan to continuetransitioning work to the service provider and the centralizedfinance departments over the course of 2012.
Also in 2012, we intend to implement new software toconsolidate our worldwide financial information. This softwareimplementation is part of our transformation initiatives inorder to improve the overall efficiency and effectiveness of ourfinancial reporting process.
In connection with the outsourcing, centralization offinance functions, and software implementation and theresulting business process changes, we continue to enhancethe design and documentation of our internal controlprocesses to ensure suitable controls over our financialreporting. There were no other changes in our internal controlover financial reporting (as defined in Rule 13a-15(f) of theExchange Act) that occurred during the quarter endedDecember 31, 2011 that have materially affected, or arereasonably likely to materially affect, our internal control overfinancial reporting. Management’s report on internal controlover financial reporting appears in this report at theconclusion of Part II, Item 7A.
ITEM 9B. Other Information
During the fourth quarter of 2011, the Audit Committee ofthe Board of Directors was not asked to and did not approvethe engagement of PricewaterhouseCoopers LLP, ourindependent registered public accounting firm, to perform anynon-audit services. This disclosure is made pursuant toSection 10A(i)(2) of the Securities Exchange Act of 1934, asadded by Section 202 of the Sarbanes-Oxley Act of 2002.
69

ZIMMER HOLDINGS, INC. 2011 FORM 10-K ANNUAL REPORT
PART III
ITEM 10. Directors, Executive Officers and Corporate Governance
Information required by this item regarding our Directors is incorporated by reference from the section entitled “ProposalNo. 1: Election of Directors” in our definitive Proxy Statement for the annual meeting of stockholders to be held on May 8, 2012(the “2012 Proxy Statement”). Information about our Audit Committee is incorporated by reference from the section entitled“Committees of the Board” in our 2012 Proxy Statement. Information regarding the procedures by which stockholders mayrecommend nominees to the Board of Directors is incorporated by reference from the section entitled “Corporate Governance –Nominations for Directors” in our 2012 Proxy Statement. Information regarding our executive officers is set forth in Item 1 of Part Iof this report under the caption “Executive Officers.” Information about compliance with Section 16(a) of the Securities ExchangeAct of 1934 is incorporated by reference from the section entitled “Section 16(a) Beneficial Ownership Reporting Compliance” inour 2012 Proxy Statement.
We have adopted the Zimmer Code of Ethics for Chief Executive Officer and Senior Financial Officers (the “finance code ofethics”), a code of ethics that applies to our Chief Executive Officer, Chief Financial Officer, Chief Accounting Officer andCorporate Controller, and other finance organization employees. The finance code of ethics is publicly available in the InvestorRelations section of our website, which may be accessed from our homepage at www.zimmer.com or directly at http://investor.zimmer.com. If we make any substantive amendments to the finance code of ethics or grant any waiver, including anyimplicit waiver, from a provision of the code to our Chief Executive Officer, Chief Financial Officer, or Chief Accounting Officer andCorporate Controller, we will disclose the nature of that amendment in the Investor Relations section of our website.
ITEM 11. Executive Compensation
Information required by this item is incorporated by reference from the sections entitled “Committees of the Board” and“Executive Compensation” in our 2012 Proxy Statement.
ITEM 12. Security Ownership of Certain Beneficial Owners and Management and Related Stockholder Matters
Information required by this item is incorporated by reference from the sections entitled “Security Ownership of CertainBeneficial Owners,” “Security Ownership of Directors and Executive Officers” and “Equity Compensation Plan Information” in our2012 Proxy Statement.
ITEM 13. Certain Relationships and Related Transactions and Director Independence
Information required by this item is incorporated by reference from the sections entitled “Corporate Governance – CertainRelationships and Related Person Transactions” and “Corporate Governance – Director Independence” in our 2012 ProxyStatement.
ITEM 14. Principal Accounting Fees and Services
Information required by this item is incorporated by reference from the sections entitled “Audit and Non-Audit Fees” and“Audit Committee Pre-Approval of Services of Independent Registered Public Accounting Firm” in “Proposal No. 3” of our 2012Proxy Statement.
70

ZIMMER HOLDINGS, INC. 2011 FORM 10-K ANNUAL REPORT
PART IV
ITEM 15. Exhibits, Financial Statement Schedules
(a) 1. Financial Statements
The following consolidated financial statements of Zimmer Holdings, Inc. and its subsidiaries are set forth in Part II,Item 8.
Report of Independent Registered Public Accounting Firm
Consolidated Statements of Earnings for the Years Ended December 31, 2011, 2010 and 2009
Consolidated Statements of Comprehensive Income for the Years Ended December 31, 2011, 2010 and 2009
Consolidated Balance Sheets as of December 31, 2011 and 2010
Consolidated Statements of Stockholders’ Equity for the Years Ended December 31, 2011, 2010 and 2009
Consolidated Statements of Cash Flows for the Years Ended December 31, 2011, 2010 and 2009
Notes to Consolidated Financial Statements
2. Financial Statement Schedules
Schedule II. Valuation and Qualifying Accounts
Other financial statement schedules are omitted because they are not applicable or the required information is shown inthe financial statements or the notes thereto.
3. Exhibits
A list of exhibits required to be filed as part of this report is set forth in the Index to Exhibits, which immediately precedessuch exhibits and is incorporated herein by reference.
71
ZIMMER HOLDINGS, INC. 2011 FORM 10-K ANNUAL REPORT
Signatures
Pursuant to the requirements of Section 13 or 15(d) of the Securities Exchange Act of 1934, the registrant has duly caused thisreport to be signed on its behalf by the undersigned, thereunto duly authorized.
ZIMMER HOLDINGS, INC.
By: /S/ DAVID C. DVORAK
David C. DvorakPresident and Chief Executive Officer
Dated: February 24, 2012
Pursuant to the requirements of the Securities Exchange Act of 1934, this report has been signed below by the following persons onbehalf of the registrant and in the capacities and on the dates indicated.
Signature Title Date
/S/ DAVID C. DVORAK
David C. Dvorak
President, Chief Executive Officer and Director(Principal Executive Officer)
February 24, 2012
/S/ JAMES T. CRINES
James T. Crines
Executive Vice President, Financeand Chief Financial Officer(Principal Financial Officer)
February 24, 2012
/S/ DEREK M. DAVIS
Derek M. Davis
Vice President, Finance, and Corporate Controllerand Chief Accounting Officer(Principal Accounting Officer)
February 24, 2012
/S/ BETSY J. BERNARD
Betsy J. Bernard
Director February 24, 2012
Marc N. Casper
Director February 24, 2012
/S/ LARRY C. GLASSCOCK
Larry C. Glasscock
Director February 24, 2012
/S/ ROBERT A. HAGEMANN
Robert A. Hagemann
Director February 24, 2012
/S/ ARTHUR J. HIGGINS
Arthur J. Higgins
Director February 24, 2012
/S/ JOHN L. MCGOLDRICK
John L. McGoldrick
Director February 24, 2012
/S/ CECIL B. PICKETT, PH.D.
Cecil B. Pickett, Ph.D.
Director February 24, 2012
72

ZIMMER HOLDINGS, INC. 2011 FORM 10-K ANNUAL REPORT
Index to Exhibits
Exhibit No Description
3.1 Restated Certificate of Incorporation of Zimmer Holdings, Inc. dated May 13, 2008 (incorporated by reference toExhibit 3.1 to the Registrant’s Quarterly Report on Form 10-Q filed August 5, 2008)
3.2 Restated By-Laws of Zimmer Holdings, Inc. effective May 6, 2008 (incorporated by reference to Exhibit 3.1 to theRegistrant’s Current Report on Form 8-K filed May 9, 2008)
4.1 Specimen Common Stock certificate (incorporated by reference to Exhibit 4.3 to the Registrant’s RegistrationStatement on Form S-8 filed January 20, 2006)
4.2 Indenture dated as of November 17, 2009 between Zimmer Holdings, Inc. and Wells Fargo Bank, National Association,as Trustee (incorporated by reference to the form filed as Exhibit 4.8 to the Registrant’s Registration Statement onForm S-3 filed November 12, 2009)
4.3 First Supplemental Indenture to the Indenture dated as of November 17, 2009 between Zimmer Holdings, Inc. andWells Fargo Bank, National Association, as Trustee (incorporated by reference to Exhibit 4.2 to the Registrant’sCurrent Report on Form 8-K filed November 17, 2009)
4.4 Form of 4.625% Note due 2019 (incorporated by reference to Exhibit 4.3 above)
4.5 Form of 5.750% Note due 2039 (incorporated by reference to Exhibit 4.3 above)
4.6 Second Supplemental Indenture dated as of November 10, 2011, to the Indenture dated as of November 17, 2009between Zimmer Holdings, Inc. and Wells Fargo Bank, National Association, as Trustee (incorporated by reference toExhibit 4.1 to the Registrant’s Current Report on Form 8-K filed November 10, 2011)
4.7 Form of 1.400% Note due 2014 (incorporated by reference to Exhibit 4.6 above)
4.8 Form of 3.375% Note due 2021 (incorporated by reference to Exhibit 4.6 above)
10.1* Zimmer Holdings, Inc. 2001 Stock Incentive Plan (incorporated by reference to Appendix B to the Registrant’sdefinitive Proxy Statement on Schedule 14A filed March 24, 2003)
10.2* First Amendment to the Zimmer Holdings, Inc. 2001 Stock Incentive Plan (incorporated by reference to Exhibit 10.1to the Registrant’s Current Report on Form 8-K filed December 15, 2005)
10.3* Zimmer Holdings, Inc. 2006 Stock Incentive Plan, as amended (incorporated by reference to Exhibit 10.1 to theRegistrant’s Current Report on Form 8-K filed December 13, 2006)
10.4* Zimmer Holdings, Inc. Executive Performance Incentive Plan, as amended (incorporated by reference to Appendix Bto the Registrant’s definitive Proxy Statement on Schedule 14A filed March 20, 2008)
10.5* Restated Zimmer, Inc. Long-Term Disability Income Plan for Highly Compensated Employees (incorporated byreference to Exhibit 10.9 to the Registrant’s Annual Report on Form 10-K filed February 28, 2007)
10.6* Change in Control Severance Agreement with David C. Dvorak (incorporated by reference to Exhibit 10.10 to theRegistrant’s Annual Report on Form 10-K filed February 27, 2009)
10.7* Form of Change in Control Severance Agreement with Bruno A. Melzi (incorporated by reference to Exhibit 10.3 tothe Registrant’s Quarterly Report on Form 10-Q filed May 8, 2002)
10.8* Form of Change in Control Severance Agreement with James T. Crines and Cheryl R. Blanchard (incorporated byreference to Exhibit 10.12 to the Registrant’s Annual Report on Form 10-K filed February 27, 2009)
10.9* Form of Change in Control Severance Agreement with Jeffery A. McCaulley and Chad F. Phipps (incorporated byreference to Exhibit 10.13 to the Registrant’s Annual Report on Form 10-K filed February 27, 2009)
10.10* Form of Change in Control Severance Agreement with Jeffrey B. Paulsen (incorporated by reference to Exhibit 10.1to the Registrant’s Quarterly Report on Form 10-Q filed May 5, 2010)
10.11* Change in Control Severance Agreement with Stephen Hong Liang, Ooi (incorporated by reference to Exhibit 10.21 tothe Registrant’s Annual Report on Form 10-K filed March 12, 2003)
10.12* Change in Control Severance Agreement with Derek M. Davis (incorporated by reference to Exhibit 10.14 to theRegistrant’s Annual Report on Form 10-K filed February 27, 2009)
10.13* Restated Benefit Equalization Plan of Zimmer Holdings, Inc. and Its Subsidiary or Affiliated Corporations Participatingin the Zimmer Holdings, Inc. Savings and Investment Program (incorporated by reference to Exhibit 10.16 to theRegistrant’s Annual Report on Form 10-K filed February 27, 2009)
10.14* Restated Benefit Equalization Plan of Zimmer Holdings, Inc. and Its Subsidiary or Affiliated Corporations Participatingin the Zimmer Holdings, Inc. Retirement Income Plan or the Zimmer Puerto Rico Retirement Income Plan(incorporated by reference to Exhibit 10.17 to the Registrant’s Annual Report on Form 10-K filed February 27, 2009)
73
ZIMMER HOLDINGS, INC. 2011 FORM 10-K ANNUAL REPORT
Exhibit No Description
10.15* Form of Confidentiality, Non-Competition and Non-Solicitation Employment Agreement with U.S.-Based ExecutiveOfficers (incorporated by reference to Exhibit 10.1 to the Registrant’s Quarterly Report on Form 10-Q filed August 7,2009)
10.16* Non-Disclosure, Non-Competition and Non-Solicitation Employment Agreement with Stephen Hong Liang, Ooi(incorporated by reference to Exhibit 10.2 to the Registrant’s Current Report on Form 8-K filed March 27, 2006)
10.17* Confidentiality, Non-Competition and Non-Solicitation Agreement with Bruno A. Melzi (incorporated by reference toExhibit 10.3 to the Registrant’s Current Report on Form 8-K filed March 27, 2006)
10.18* Form of Nonqualified Stock Option Award Letter under the Zimmer Holdings, Inc. 2001 Stock Incentive Plan(incorporated by reference to Exhibit 10.3 to the Registrant’s Current Report on Form 8-K filed January 11, 2006)
10.19* Form of Nonqualified Performance-Conditioned Stock Option Grant Award Letter under the Zimmer Holdings, Inc.2001 Stock Incentive Plan (incorporated by reference to Exhibit 10.1 to the Registrant’s Current Report on Form 8-Kfiled January 21, 2005)
10.20* Zimmer Holdings, Inc. Stock Plan for Non-Employee Directors, as amended (incorporated by reference to Appendix Cto the Registrant’s Definitive Proxy Statement filed March 20, 2009)
10.21* Form of Nonqualified Stock Option Award Letter under the Zimmer Holdings, Inc. Stock Plan for Non-EmployeeDirectors (incorporated by reference to Exhibit 10.2 to the Registrant’s Current Report on Form 8-K filed April 5,2005)
10.22* Form of Restricted Stock Unit Award Letter under the Zimmer Holdings, Inc. Stock Plan for Non-Employee Directors(incorporated by reference to Exhibit 10.1 to the Registrant’s Current Report on Form 8-K filed February 21, 2006)
10.23* Form of Nonqualified Stock Option Award Letter under the Zimmer Holdings, Inc. 2006 Stock Incentive Plan(incorporated by reference to Exhibit 10.2 to the Registrant’s Current Report on Form 8-K filed December 13, 2006)
10.24* Form of Nonqualified Stock Option Award Letter for Non-U.S. Employees under the Zimmer Holdings, Inc. 2006 StockIncentive Plan (incorporated by reference to Exhibit 10.3 to the Registrant’s Current Report on Form 8-K filedDecember 13, 2006)
10.25* Form of Restricted Stock Award Letter under the Zimmer Holdings, Inc. 2006 Stock Incentive Plan (five-year vesting)(incorporated by reference to Exhibit 10.4 to the Registrant’s Current Report on Form 8-K filed December 13, 2006)
10.26* Form of Performance-Based Restricted Stock Unit Award Letter under the Zimmer Holdings, Inc. 2006 StockIncentive Plan (incorporated by reference to Exhibit 10.1 to the Registrant’s Current Report on Form 8-K filedFebruary 17, 2009)
10.27* Restated Zimmer Holdings, Inc. Deferred Compensation Plan for Non-Employee Directors (incorporated by referenceto Appendix D to the Registrant’s Definitive Proxy Statement filed March 20, 2009)
10.28* Zimmer Holdings, Inc. 2009 Stock Incentive Plan (incorporated by reference to Appendix B to the Registrant’sDefinitive Proxy Statement filed March 20, 2009)
10.29* Form of Nonqualified Stock Option Award Letter under the Zimmer Holdings, Inc. 2009 Stock Incentive Plan(incorporated by reference to Exhibit 10.1 to the Registrant’s Quarterly Report on Form 10-Q filed May 5, 2011)
10.30* Form of Nonqualified Stock Option Award Letter for Non-U.S. Employees under the Zimmer Holdings, Inc. 2009 StockIncentive Plan (incorporated by reference to Exhibit 10.2 to the Registrant’s Quarterly Report on Form 10-Q filed May5, 2011)
10.31* Form of Performance-Based Restricted Stock Unit Award Letter (one-year performance period) under the ZimmerHoldings, Inc. 2009 Stock Incentive Plan (incorporated by reference to Exhibit 10.3 to the Registrant’s QuarterlyReport on Form 10-Q filed May 5, 2011)
10.32* Form of Performance-Based Restricted Stock Unit Award Letter for Non-U.S. Employees (one-year performanceperiod) under the Zimmer Holdings, Inc. 2009 Stock Incentive Plan (incorporated by reference to Exhibit 10.4 to theRegistrant’s Quarterly Report on Form 10-Q filed May 5, 2011)
10.33* Form of Restricted Stock Unit Award Letter (five-year vesting) under the Zimmer Holdings, Inc. 2009 Stock IncentivePlan (incorporated by reference to Exhibit 10.32 to the Registrant’s Annual Report on Form 10-K filed February 25,2010)
10.34* Form of Performance-Based Restricted Stock Unit Award Letter (three-year performance period) under the ZimmerHoldings, Inc. 2009 Stock Incentive Plan
10.35* Summary Compensation Sheet
74

ZIMMER HOLDINGS, INC. 2011 FORM 10-K ANNUAL REPORT
Exhibit No Description
10.36 $1,350,000,000 Amended and Restated Credit Agreement dated as of November 30, 2007 (incorporated by referenceto Exhibit 10.1 to the Registrant’s Current Report on Form 8-K filed December 6, 2007)
10.37 Corporate Integrity Agreement dated September 27, 2007, among Zimmer Holdings, Inc., Zimmer, Inc. and the Officeof Inspector General of the Department of Health and Human Services (incorporated by reference to Exhibit 10.2 tothe Registrant’s Quarterly Report on Form 10-Q filed November 9, 2007)
10.38 Form of Indemnification Agreement with Non-Employee Directors and Officers (incorporated by reference to Exhibit10.1 to the Registrant’s Current Report on Form 8-K filed July 31, 2008)
21 List of Subsidiaries of Zimmer Holdings, Inc.
23 Consent of PricewaterhouseCoopers LLP
31.1 Certification pursuant to Rule 13a-14(a)/15d-14(a) of the Securities Exchange Act of 1934 of the Chief ExecutiveOfficer, as adopted pursuant to Section 302 of the Sarbanes-Oxley Act of 2002
31.2 Certification pursuant to Rule 13a-14(a)/15d-14(a) of the Securities Exchange Act of 1934 of the Chief FinancialOfficer, as adopted pursuant to Section 302 of the Sarbanes-Oxley Act of 2002
32 Certification pursuant to 18 U.S.C. Section 1350, as adopted pursuant to Section 906 of the Sarbanes-Oxley Act of2002
101.INS XBRL Instance Document
101.SCH XBRL Taxonomy Extension Schema Document
101.CAL XBRL Taxonomy Extension Calculation Linkbase Document
101.LAB XBRL Taxonomy Extension Label Linkbase Document
101.PRE XBRL Taxonomy Extension Presentation Linkbase Document
101.DEF XBRL Taxonomy Extension Definition Linkbase Document
* Management contract or compensatory plan or arrangement
Schedule II
Valuation and Qualifying Accounts
(in millions)
Description
Balance at
Beginning
of Period
Additions
Charged
(Credited)
to Expense
Deductions
to Reserve
Effects of
Foreign
Currency
Acquired
Allowances
Balance at
End of
Period
Allowance for Doubtful Accounts:
Year Ended December 31, 2009 20.0 0.1 (1.8) 0.5 – 18.8
Year Ended December 31, 2010 18.8 (1.0) (3.1) (0.6) 0.3 14.4
Year Ended December 31, 2011 14.4 4.5 (1.7) – – 17.2
75
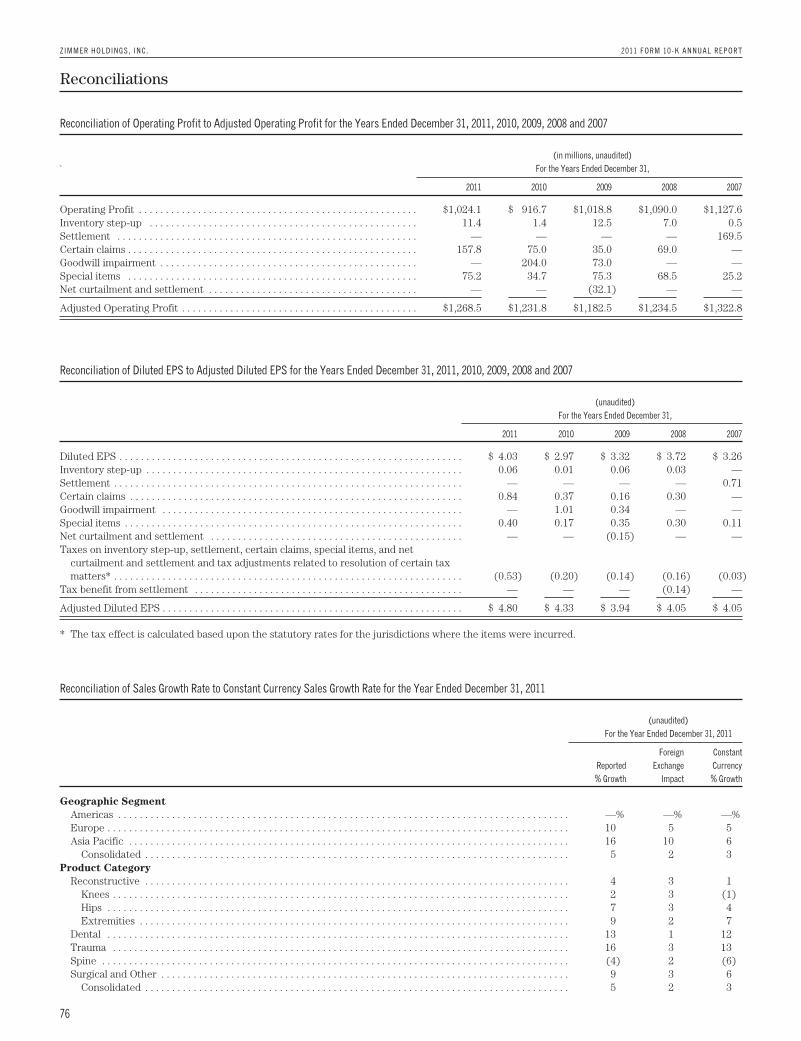
ZIMMER HOLDINGS, INC. 2011 FORM 10-K ANNUAL REPORT
Reconciliations
Reconciliation of Operating Profit to Adjusted Operating Profit for the Years Ended December 31, 2011, 2010, 2009, 2008 and 2007
`
(in millions, unaudited)
For the Years Ended December 31,
2011 2010 2009 2008 2007
Operating Profit . . . . . . . . . . . . . . . . . . . . . . . . . . . . . . . . . . . . . . . . . . . . . . . . . . . . $1,024.1 $ 916.7 $1,018.8 $1,090.0 $1,127.6Inventory step-up . . . . . . . . . . . . . . . . . . . . . . . . . . . . . . . . . . . . . . . . . . . . . . . . . . 11.4 1.4 12.5 7.0 0.5Settlement . . . . . . . . . . . . . . . . . . . . . . . . . . . . . . . . . . . . . . . . . . . . . . . . . . . . . . . . — — — — 169.5Certain claims . . . . . . . . . . . . . . . . . . . . . . . . . . . . . . . . . . . . . . . . . . . . . . . . . . . . . . 157.8 75.0 35.0 69.0 —Goodwill impairment . . . . . . . . . . . . . . . . . . . . . . . . . . . . . . . . . . . . . . . . . . . . . . . . — 204.0 73.0 — —Special items . . . . . . . . . . . . . . . . . . . . . . . . . . . . . . . . . . . . . . . . . . . . . . . . . . . . . . 75.2 34.7 75.3 68.5 25.2Net curtailment and settlement . . . . . . . . . . . . . . . . . . . . . . . . . . . . . . . . . . . . . . . — — (32.1) — —
Adjusted Operating Profit . . . . . . . . . . . . . . . . . . . . . . . . . . . . . . . . . . . . . . . . . . . . $1,268.5 $1,231.8 $1,182.5 $1,234.5 $1,322.8
Reconciliation of Diluted EPS to Adjusted Diluted EPS for the Years Ended December 31, 2011, 2010, 2009, 2008 and 2007
(unaudited)
For the Years Ended December 31,
2011 2010 2009 2008 2007
Diluted EPS . . . . . . . . . . . . . . . . . . . . . . . . . . . . . . . . . . . . . . . . . . . . . . . . . . . . . . . . . . . . . . . . $ 4.03 $ 2.97 $ 3.32 $ 3.72 $ 3.26Inventory step-up . . . . . . . . . . . . . . . . . . . . . . . . . . . . . . . . . . . . . . . . . . . . . . . . . . . . . . . . . . . 0.06 0.01 0.06 0.03 —Settlement . . . . . . . . . . . . . . . . . . . . . . . . . . . . . . . . . . . . . . . . . . . . . . . . . . . . . . . . . . . . . . . . . — — — — 0.71Certain claims . . . . . . . . . . . . . . . . . . . . . . . . . . . . . . . . . . . . . . . . . . . . . . . . . . . . . . . . . . . . . . 0.84 0.37 0.16 0.30 —Goodwill impairment . . . . . . . . . . . . . . . . . . . . . . . . . . . . . . . . . . . . . . . . . . . . . . . . . . . . . . . . — 1.01 0.34 — —Special items . . . . . . . . . . . . . . . . . . . . . . . . . . . . . . . . . . . . . . . . . . . . . . . . . . . . . . . . . . . . . . . 0.40 0.17 0.35 0.30 0.11Net curtailment and settlement . . . . . . . . . . . . . . . . . . . . . . . . . . . . . . . . . . . . . . . . . . . . . . . — — (0.15) — —Taxes on inventory step-up, settlement, certain claims, special items, and net
curtailment and settlement and tax adjustments related to resolution of certain taxmatters* . . . . . . . . . . . . . . . . . . . . . . . . . . . . . . . . . . . . . . . . . . . . . . . . . . . . . . . . . . . . . . . . . (0.53) (0.20) (0.14) (0.16) (0.03)
Tax benefit from settlement . . . . . . . . . . . . . . . . . . . . . . . . . . . . . . . . . . . . . . . . . . . . . . . . . . — — — (0.14) —
Adjusted Diluted EPS . . . . . . . . . . . . . . . . . . . . . . . . . . . . . . . . . . . . . . . . . . . . . . . . . . . . . . . . $ 4.80 $ 4.33 $ 3.94 $ 4.05 $ 4.05
* The tax effect is calculated based upon the statutory rates for the jurisdictions where the items were incurred.
Reconciliation of Sales Growth Rate to Constant Currency Sales Growth Rate for the Year Ended December 31, 2011
(unaudited)
For the Year Ended December 31, 2011
Reported
% Growth
Foreign
Exchange
Impact
Constant
Currency
% Growth
Geographic Segment
Americas . . . . . . . . . . . . . . . . . . . . . . . . . . . . . . . . . . . . . . . . . . . . . . . . . . . . . . . . . . . . . . . . . . . . . . . . . . . . . . . . . . . . —% —% —%Europe . . . . . . . . . . . . . . . . . . . . . . . . . . . . . . . . . . . . . . . . . . . . . . . . . . . . . . . . . . . . . . . . . . . . . . . . . . . . . . . . . . . . . . 10 5 5Asia Pacific . . . . . . . . . . . . . . . . . . . . . . . . . . . . . . . . . . . . . . . . . . . . . . . . . . . . . . . . . . . . . . . . . . . . . . . . . . . . . . . . . . 16 10 6
Consolidated . . . . . . . . . . . . . . . . . . . . . . . . . . . . . . . . . . . . . . . . . . . . . . . . . . . . . . . . . . . . . . . . . . . . . . . . . . . . . . . 5 2 3Product Category
Reconstructive . . . . . . . . . . . . . . . . . . . . . . . . . . . . . . . . . . . . . . . . . . . . . . . . . . . . . . . . . . . . . . . . . . . . . . . . . . . . . . . 4 3 1Knees . . . . . . . . . . . . . . . . . . . . . . . . . . . . . . . . . . . . . . . . . . . . . . . . . . . . . . . . . . . . . . . . . . . . . . . . . . . . . . . . . . . . . 2 3 (1)Hips . . . . . . . . . . . . . . . . . . . . . . . . . . . . . . . . . . . . . . . . . . . . . . . . . . . . . . . . . . . . . . . . . . . . . . . . . . . . . . . . . . . . . . 7 3 4Extremities . . . . . . . . . . . . . . . . . . . . . . . . . . . . . . . . . . . . . . . . . . . . . . . . . . . . . . . . . . . . . . . . . . . . . . . . . . . . . . . . 9 2 7
Dental . . . . . . . . . . . . . . . . . . . . . . . . . . . . . . . . . . . . . . . . . . . . . . . . . . . . . . . . . . . . . . . . . . . . . . . . . . . . . . . . . . . . . . 13 1 12Trauma . . . . . . . . . . . . . . . . . . . . . . . . . . . . . . . . . . . . . . . . . . . . . . . . . . . . . . . . . . . . . . . . . . . . . . . . . . . . . . . . . . . . . 16 3 13Spine . . . . . . . . . . . . . . . . . . . . . . . . . . . . . . . . . . . . . . . . . . . . . . . . . . . . . . . . . . . . . . . . . . . . . . . . . . . . . . . . . . . . . . . (4) 2 (6)Surgical and Other . . . . . . . . . . . . . . . . . . . . . . . . . . . . . . . . . . . . . . . . . . . . . . . . . . . . . . . . . . . . . . . . . . . . . . . . . . . . 9 3 6
Consolidated . . . . . . . . . . . . . . . . . . . . . . . . . . . . . . . . . . . . . . . . . . . . . . . . . . . . . . . . . . . . . . . . . . . . . . . . . . . . . . . 5 2 3
76
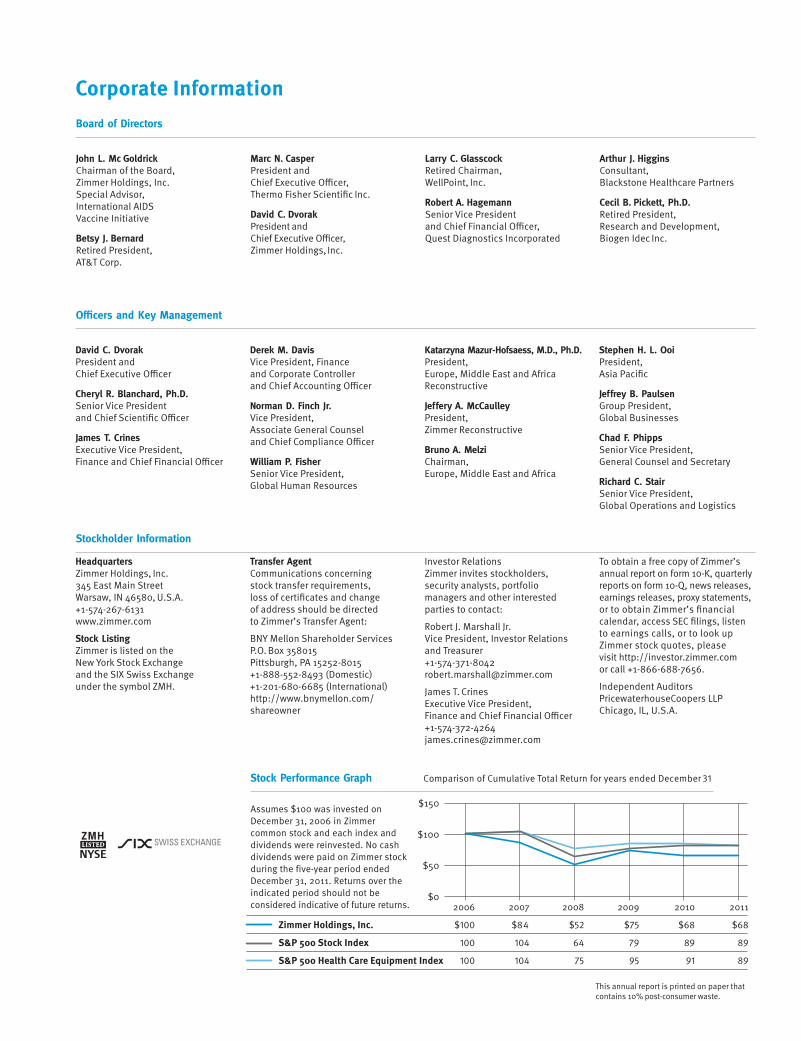
$0
$50
$100
$150
2006 2007 2008 2009 2010 2011
Zimmer Holdings, Inc. $100 $84 $52 $75 $68 $68
S&P 500 Stock Index 100 104 64 79 89 89
S&P 500 Health Care Equipment Index 100 104 75 95 91 89
Corporate InformationBoard of Directors
John L. Mc GoldrickChairman of the Board, Zimmer Holdings, Inc.Special Advisor, International AIDSVaccine Initiative
Betsy J. BernardRetired President, AT&T Corp.
Marc N. CasperPresident andChief Executive Offi cer, Thermo Fisher Scientifi c Inc.
David C. DvorakPresident and Chief Executive Offi cer,Zimmer Holdings, Inc.
Larry C. GlasscockRetired Chairman, WellPoint, Inc.
Robert A. HagemannSenior Vice President and Chief Financial Offi cer,Quest Diagnostics Incorporated
Arthur J. HigginsConsultant,Blackstone Healthcare Partners
Cecil B. Pickett, Ph.D.Retired President, Research and Development, Biogen Idec Inc.
Offi cers and Key Management
David C. DvorakPresident and Chief Executive Offi cer
Cheryl R. Blanchard, Ph.D.Senior Vice President and Chief Scientifi c Offi cer
James T. CrinesExecutive Vice President, Finance and Chief Financial Offi cer
Derek M. DavisVice President, Financeand Corporate Controller and Chief Accounting Offi cer
Norman D. Finch Jr.Vice President,Associate General Counsel and Chief Compliance Offi cer
William P. FisherSenior Vice President, Global Human Resources
Katarzyna Mazur-Hofsaess, M.D., Ph.D.President, Europe, Middle East and Africa Reconstructive
Jeffery A. McCaulleyPresident,Zimmer Reconstructive
Bruno A. MelziChairman, Europe, Middle East and Africa
Stephen H. L. OoiPresident, Asia Pacifi c
Jeffrey B. PaulsenGroup President, Global Businesses
Chad F. PhippsSenior Vice President,General Counsel and Secretary
Richard C. StairSenior Vice President, Global Operations and Logistics
Stockholder Information
HeadquartersZimmer Holdings, Inc.345 East Main StreetWarsaw, IN 46580, U.S.A.+1-574-267-6131www.zimmer.com
Stock ListingZimmer is listed on the New York Stock Exchange and the SIX Swiss Exchange under the symbol ZMH.
Transfer AgentCommunications concerning stock transfer requirements, loss of certifi cates and change of address should be directed to Zimmer’s Transfer Agent:
BNY Mellon Shareholder ServicesP.O. Box 358015Pittsburgh, PA 15252-8015+1-888-552-8493 (Domestic)+1-201-680-6685 (International)http://www.bnymellon.com/shareowner
Investor RelationsZimmer invites stockholders, security analysts, portfolio managers and other interested parties to contact:
Robert J. Marshall Jr.Vice President, Investor Relations and [email protected]
James T. CrinesExecutive Vice President, Finance and Chief Financial Offi [email protected]
To obtain a free copy of Zimmer’s annual report on form 10-K, quarterly reports on form 10-Q, news releases, earnings releases, proxy statements, or to obtain Zimmer’s fi nancial calendar, access SEC fi lings, listen to earnings calls, or to look up Zimmer stock quotes, please visit http://investor.zimmer.com or call +1-866-688-7656.
Independent AuditorsPricewaterhouseCoopers LLPChicago, IL, U.S.A.
This annual report is printed on paper that contains 10% post-consumer waste.
Stock Performance Graph Comparison of Cumulative Total Return for years ended December 31
Assumes $100 was invested on December 31, 2006 in Zimmer common stock and each index and dividends were reinvested. No cash dividends were paid on Zimmer stock during the five-year period ended December 31, 2011. Returns over the indicated period should not be considered indicative of future returns.

Zimmer Holdings, Inc.345 East Main Street, P.O. Box 708Warsaw, IN 46580, U.S.A.