| 1NEW workshop 9.12.2011
Vision for the internal electricity marketMatti SupponenUnit B2“Internal Market II: Wholesale markets; Electricity & Gas”
European day-ahead and intra-day pilot projects1st NWE Stakeholder Workshop 9 December 2011

| 2NEW workshop 9.12.2011
Contents
.Drivers of the European electricity market.European electricity market target model.Infrastructure package.Issues
| 3NEW workshop 9.12.2011
Drivers in energy policy regarding electricity
.Decarbonisation.Renewables targets.Security of supply.Competitiveness

| 4NEW workshop 9.12.2011
The 20-20-20 EU policy by 2020
Greenhousegas levels
Energyconsumption
Renewables inenergy mix
-20% -20%100%
+20%
8,5%
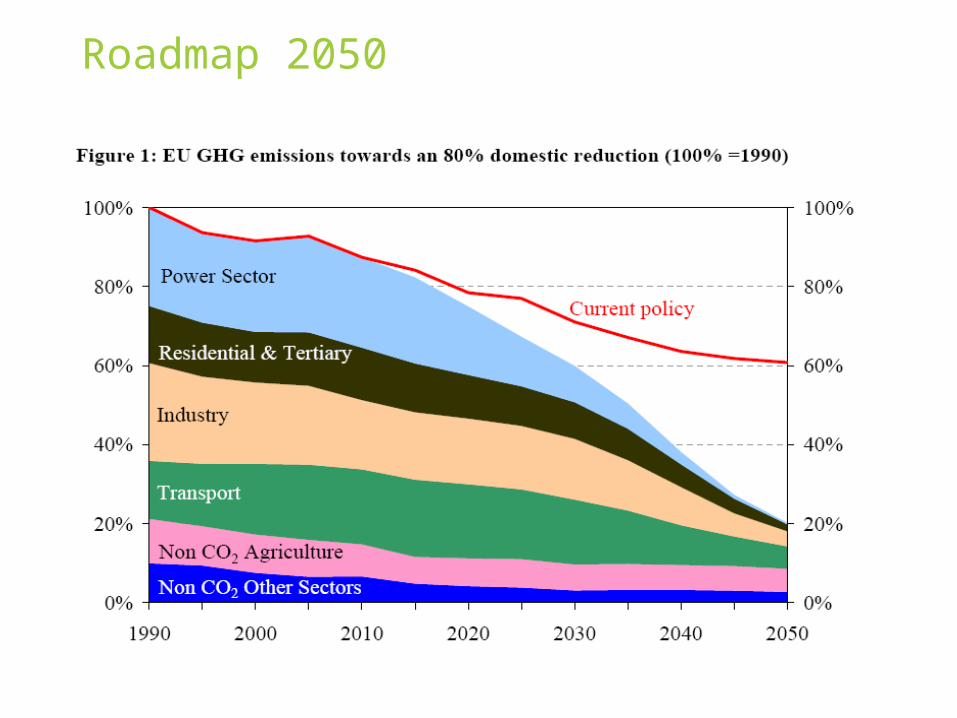
Roadmap 2050

| 6NEW workshop 9.12.2011
Surplus and deficit areas (2008)
Wind
Surplus
Deficit15
25
Storage Hydro
80
30 3025 35
1010
2525
25 25
40
50
20
25
20
30 45 50
20
10
10 10
10 25
20
TWh
20 TWh
TWh
TWh
25
40
15
5 15
10

| 7NEW workshop 9.12.2011
Wind Energy Production - Effects on the Market | 2010 | © Amprion7
Correlation Wind Energy Production ↔ Control Program DE
h-Values, 2010
Sou
rce:
Am
prio
n G
mbH
Trendline
7
+ E
xpor
t-
Impo
rt

| 8NEW workshop 9.12.2011
Infrastructure

| 9NEW workshop 9.12.2011
~~~ ~~~ ~~~ ~~~
Overlay network?
Transmission
380/220kV
Distribution
110kV
Distribution
Virtuelle Erzeugung
Virtuelle Last
~~~~~~~ ~
~
)*
Overlay network
Source: Klaus Kleinekorte in VDE DACH 2010 conference

| 10NEW workshop 9.12.2011
European infrastructures priorities by 2020 for electricity
Baltic energy market inter-connection plan
Interconnections in South West Europe
Interconnectionsin Central-South East Europe
Offshore grid in the Northern Seas and connection to Northern and Central Europe
Smart grids in the EU
Electricityhighways

| 11NEW workshop 9.12.2011
ACER opinion
National / regional TYNDP with PCIs
By 30 July 2013
TYNDP and CBA (electricity: 2014, gas: 2015)
EU infrastructure priorities
Commission decision on Union-wide PCI list
Regional Groups to propose regional PCI lists
Approval by concerned Member States
Energy & Climate Objectives
Overview of the process of identification of projects of common interest
| 12NEW workshop 9.12.2011
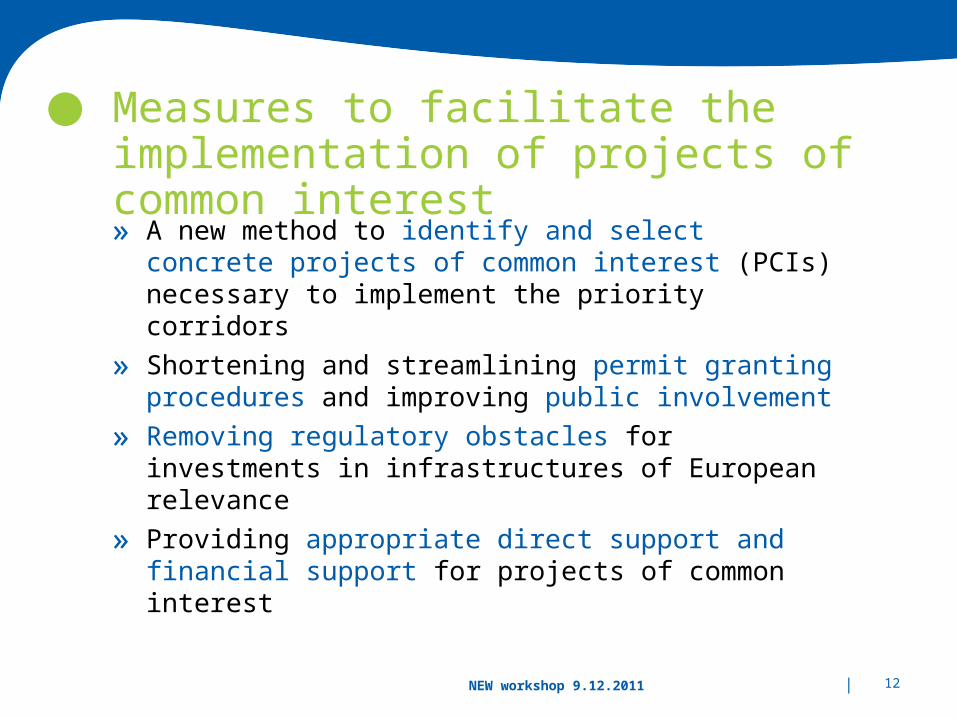
Measures to facilitate the implementation of projects of common interest
» A new method to identify and select concrete projects of common interest (PCIs) necessary to implement the priority corridors
» Shortening and streamlining permit granting procedures and improving public involvement
» Removing regulatory obstacles for investments in infrastructures of European relevance
» Providing appropriate direct support and financial support for projects of common interest

| 13NEW workshop 9.12.2011
Market design
.Forward markets based on spot markets.Cross-border trade optimisation based on day ahead market coupling.Long term cross border trade with financial products.Further cross-border trade optimisation through allowing intra-day trade with the remaining capacity.Final optimisation through a pan European balancing system

| 14NEW workshop 9.12.2011
Congestion management 1998
Nord Pool
Implicit auctions
Only explicit auctions
Other methods

| 15NEW workshop 9.12.2011
Congestion management 2000
Nord Pool
Arnhem auction office
Implicit auctions
Only explicit auctions
Other methods

| 16NEW workshop 9.12.2011
Congestion management 2010
Nord Pool
APX
CASC CAO
EMCC
Implicit auctions
Only explicit auctions
Other methods

| 17NEW workshop 9.12.2011
Congestion management 2014?
Euro Pool
Implicit auctions
Only explicit auctions
Other methods
| 18NEW workshop 9.12.2011
TLC 650TWh
NE
BS
FUI
SWE
CEE
CSE
SEE
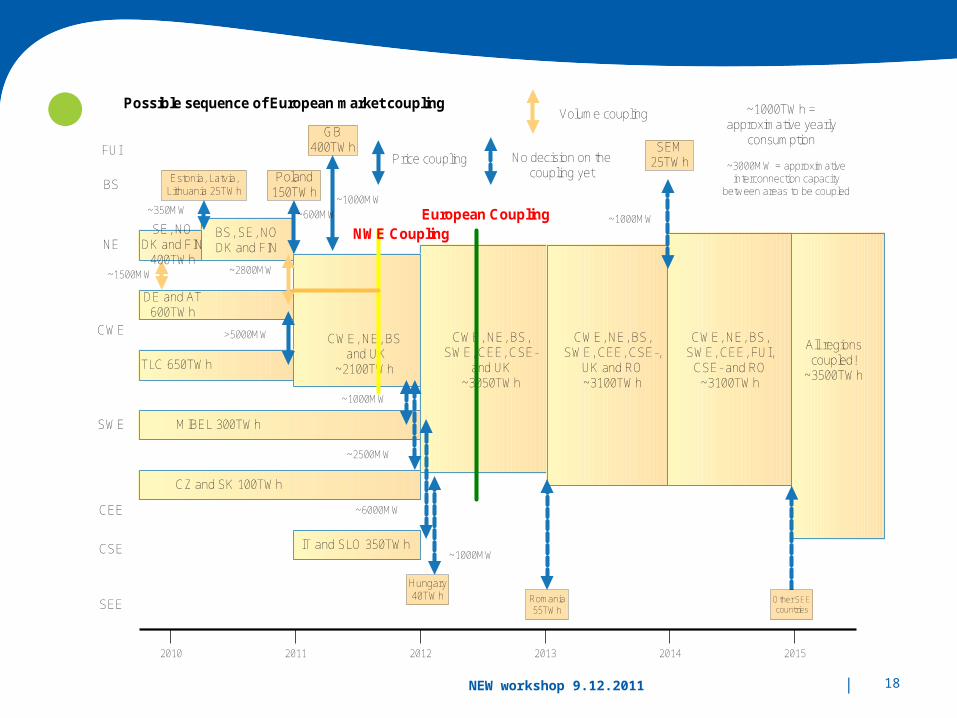
Volume coupling
Price coupling No decision on the coupling yet
Possible sequence of European market coupling
GB400TWh SEM
25TWh
Hungary40TWh Romania
55TWh
Poland150TWh
Estonia, Latvia, Lithuania 25TWh
Other SEE countries
DE and AT600TWh
CWE, NE, BS and UK
~2100TWh
CWE, NE, BS,SWE, CEE, CSE-,
UK and RO~3100TWh
MIBEL 300TWh
CZ and SK 100TWh
SE, NODK and FIN
400TWh
CWE CWE, NE, BS,SWE, CEE, CSE-
and UK~3050TWh
2010 2011 2012 2013 2014 2015
IT and SLO 350TWh
BS, SE, NODK and FIN
All regionscoupled!
~3500TWh
~350MW~1000MW
~2800MW~1500MW
~1000MW
~2500MW
~6000MW
~1000MW
~1000MW
~1000TWh = approximative yearly
consumption
~3000MW = approximative interconnection capacity
between areas to be coupled
CWE, NE, BS,SWE, CEE, FUI,
CSE- and RO~3100TWh
~600MW
>5000MW
NWE CouplingEuropean Coupling

| 19NEW workshop 9.12.2011
European electricity day ahead spot market
EPEX(DE/AT 23%FR 11%CH 13%)
Liquid (>30% spot trade/consumption)
Little liquidity (5%<<15%
No liquidity (<5%)
Some liquidity (15%< <30%)
Nord Pool (74%)
APX (NL 21% UK 4%)
OMEL (83%)
EXAA (4%)
OPCOM (9%)
IPEX (69%)
South Pool (0%)
BELPEX (12%)
OTE (~5%)
LITPX
HUPX
POLPX
Hellenic Pool (~100%)Volumes from 2008 data

| 20NEW workshop 9.12.2011
Matti’s price zones for Europe
| 21NEW workshop 9.12.2011
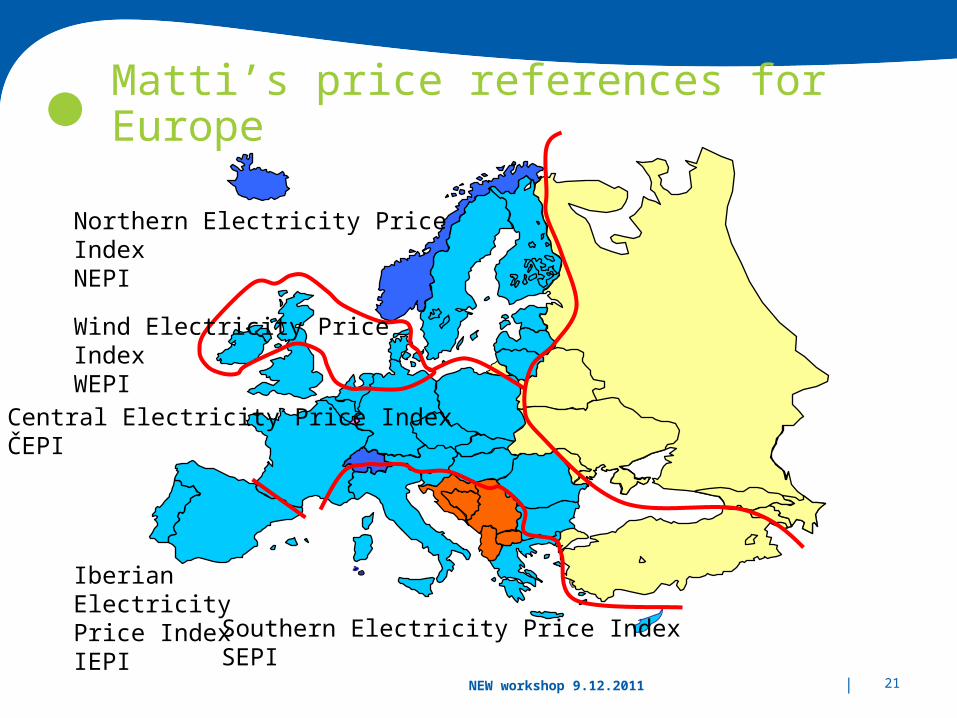
Northern Electricity Price IndexNEPI
Central Electricity Price IndexČEPI
Wind Electricity Price IndexWEPI
Iberian Electricity Price Index IEPI Southern Electricity Price Index
SEPI
Matti’s price references for Europe

| 22NEW workshop 9.12.2011
Issues
.Heretic local market designs.Governance of market coupling.Relations between power exchanges.Calculation of cross-border capacity» Price zones» Loop flows» Sharing of congestion rents» Flow based methods.Who will build and pay new infrastructure?

| 23NEW workshop 9.12.2011
Loop flows
---Deficit
1000 MW
+++Surplus
Physical flow
Commercial flow

| 24NEW workshop 9.12.2011
Loop flows
---Deficit
1000 MW
+++Surplus
Physical flow
Commercial flow

| 25NEW workshop 9.12.2011
DE+ 98 M€
NL- 0 M€
BE- 5 M€
CH- 35 M€
FR+ 235 M€
IT+ 20 M€
SI- 15 M€
AT- 35 M€
CZ- 97 M€
SK- 39 M€
PL- 40 M€
+ 4 TWh (- 20 M€)
- 7 TWh (+ 120 M€)
HR
+ 6 TWh(- 150 M€)
+ 4 TWh (- 20 M€)
- 3 TWh (+ 10 M€)
+ 4 TWh (- 20 M€)
+ 1 TWh (0 M€)
- 1 TWh (+ 10 M€)
+ 6 TWh (- 50 M€)
+ 2 TWh (- 40 M€)
- 13 TWh (+130 M€)
- 6 TWh (+ 120 M€)
+ 4 TWh (- 40 M€)
+ 3 TWh (- 20 M€)
HU- 4 M€
+ 1 TWh (- 7 M€)
+ 1 TWh (- 4 M€)
+ 11 TWh (- 110 M€) + 2 TWh
(- 0 M€)
+ 2 TWh (- 50 M€)
UA
CountryX M€
X = Net benefit for the country in 2008 on the difference between commercial and physical flows M€ Green = positive values Red = negative values
Y = Difference between the average physical and commercial flow in 2008 [TWh]
Z = Estimated monetary value of the difference in 2008 [M€]
Legend:
+ 0 TWh (- 0 M€)
0 TWh (0 M€)
0 TWh (0 M€)
DK SE SE
+ 1 TWh (0 M€)
- 3 TWh (0 M€)
+ 1 TWh (0 M€)
- 3 TWh (0 M€)
0 TWh (0 M€)
NO
- 21 TWh (+ 210 M€)
Y TWh (Z M€)
Loop flows

| 26NEW workshop 9.12.2011
Looking forward to the discussion
Recommended