© 2008 Prentice-Hall, Inc.
Chapter 13
To accompanyQuantitative Analysis for Management, Tenth Edition, by Render, Stair, and Hanna Power Point slides created by Jeff Heyl
Project Management
© 2009 Prentice-Hall, Inc.
© 2009 Prentice-Hall, Inc. 13 – 2
Learning Objectives
1. Understand how to plan, monitor, and control projects with the use of PERT and CPM
2. Determine earliest start, earliest finish, latest start, latest finish, and slack times for each activity, along with the total project completion time
3. Reduce total project time at the least total cost by crashing the network using manual or linear programming techniques
4. Understand the important role of software in project management
After completing this chapter, students will be able to:After completing this chapter, students will be able to:

© 2009 Prentice-Hall, Inc. 13 – 3
Chapter Outline
13.113.1 Introduction13.213.2 PERT/CPM13.313.3 PERT/Cost13.413.4 Project Crashing13.513.5 Other Topics in Project
Management
© 2009 Prentice-Hall, Inc. 13 – 4
Introduction
Most realistic projects are large and complex Tens of thousands of steps and millions of dollars
may be involved Managing large-scale, complicated projects
effectively is a difficult problem and the stakes are high
The first step in planning and scheduling a project is to develop the work breakdown structurework breakdown structure
Time, cost, resource requirements, predecessors, and people required are identified for each activity
Then a schedule for the project can be developed

© 2009 Prentice-Hall, Inc. 13 – 5
Introduction
The program evaluation and review techniqueprogram evaluation and review technique (PERTPERT) and the critical path methodcritical path method (CPMCPM) are two popular quantitative analysis techniques to help plan, schedule, monitor, and control projects
Originally the approaches differed in how they estimated activity times
PERT used three time estimates to develop a probabilistic estimate of completion time
CPM was a more deterministic technique They have become so similar they are commonly
considered one technique, PERT/CPM

© 2009 Prentice-Hall, Inc. 13 – 6
1. Define the project and all of its significant activities or tasks
2. Develop the relationships among the activities and decide which activities must precede others
3. Draw the network connecting all of the activities4. Assign time and/or cost estimates to each
activity5. Compute the longest time path through the
network; this is called the critical pathcritical path6. Use the network to help plan, schedule, monitor,
and control the project
Six Steps of PERT/CPM
The critical path is important since any delay in these activities can delay the completion of the project
© 2009 Prentice-Hall, Inc. 13 – 7
PERT/CPM
Given the large number of tasks in a project, it is easy to see why the following questions are important
1. When will the entire project be completed?2. What are the criticalcritical activities or tasks in the
project, that is, the ones that will delay the entire project if they are late?
3. Which are the non-criticalnon-critical activities, that is, the ones that can run late without delaying the entire project’s completion?
4. If there are three time estimates, what is the probability that the project will be completed by a specific date?

© 2009 Prentice-Hall, Inc. 13 – 8
PERT/CPM
5. At any particular date, is the project on schedule, behind schedule, or ahead of schedule?
6. On any given date, is the money spent equal to, less than, or greater than the budgeted amount?
7. Are there enough resources available to finish the project on time?
© 2009 Prentice-Hall, Inc. 13 – 9
General Foundry Example of PERT/CPM
General Foundry, Inc. has long been trying to avoid the expense of installing air pollution control equipment
The local environmental protection group has recently given the foundry 16 weeks to install a complex air filter system on its main smokestack
General Foundry was warned that it will be forced to close unless the device is installed in the allotted period
They want to make sure that installation of the filtering system progresses smoothly and on time
© 2009 Prentice-Hall, Inc. 13 – 10
General Foundry Example of PERT/CPM
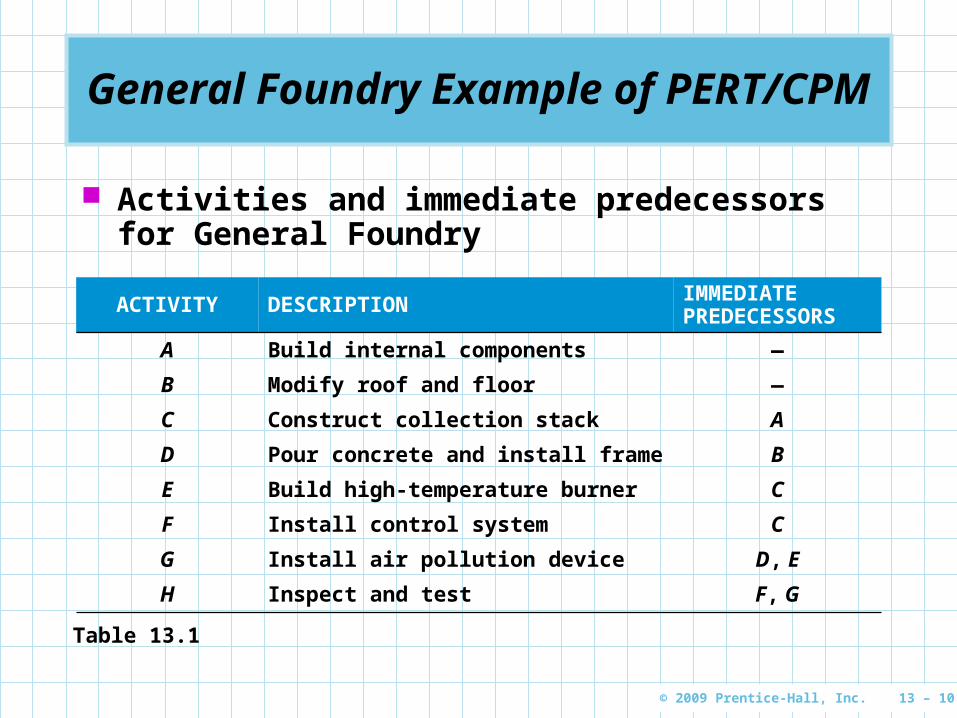
Activities and immediate predecessors for General Foundry
ACTIVITY DESCRIPTION IMMEDIATE PREDECESSORS
A Build internal components —
B Modify roof and floor —
C Construct collection stack A
D Pour concrete and install frame B
E Build high-temperature burner C
F Install control system C
G Install air pollution device D, E
H Inspect and test F, G
Table 13.1

© 2009 Prentice-Hall, Inc. 13 – 11
Drawing the PERT/CPM Network
There are two common techniques for drawing PERT networks
Activity-on-nodeActivity-on-node (AONAON) where the nodes represent activities
Activity-on-arcActivity-on-arc (AOAAOA) where the arcs are used to represent the activities
The AON approach is easier and more commonly found in software packages
One node represents the start of the project, one node for the end of the project, and nodes for each of the activities
The arcs are used to show the predecessors for each activity

© 2009 Prentice-Hall, Inc. 13 – 12
General Foundry Example of PERT/CPM
Network for General Foundry
A
Build Internal Components
H
Inspect and Test
E
Build Burner
C
Construct Collection Stack
Start
F
Install Control System
Finish
G
Install Pollution Device
D
Pour Concrete and Install Frame
B
Modify Roof and Floor
Figure 13.1

© 2009 Prentice-Hall, Inc. 13 – 13
Activity Times
In some situations, activity times are known with certainty
CPM assigns just one time estimate to each activity and this is used to find the critical path
In many projects there is uncertainty about activity times
PERT employs a probability distribution based on three time estimates for each activity
A weighted average of these estimates is used for the time estimate and this is used to determine the critical path

© 2009 Prentice-Hall, Inc. 13 – 14
Activity Times
The time estimates in PERT are
Optimistic timeOptimistic time (aa) =time an activity will take if everything goes as well as possible. There should be only a small probability (say, 1/100) of this occurring.
Pessimistic timePessimistic time (bb) =time an activity would take assuming very unfavorable conditions. There should also be only a small probability that the activity will really take this long.
Most likely timeMost likely time (mm) =most realistic time estimate to complete the activity
© 2009 Prentice-Hall, Inc. 13 – 15
Activity Times
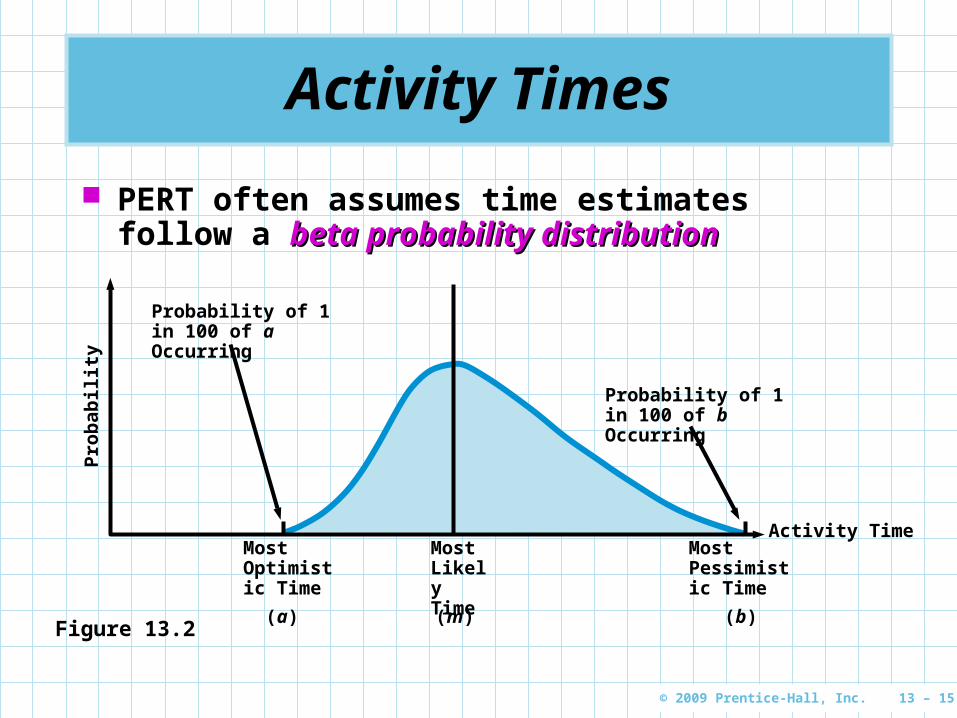
PERT often assumes time estimates follow a beta beta probability distributionprobability distribution
Probability of 1 in 100 of a Occurring
Probability of 1 in 100 of b Occurring
Pro
bab
ilit
y
Activity TimeMost Likely Time
(m)
Most Optimistic Time
(a)
Most Pessimistic Time
(b)Figure 13.2
© 2009 Prentice-Hall, Inc. 13 – 16
Activity Times
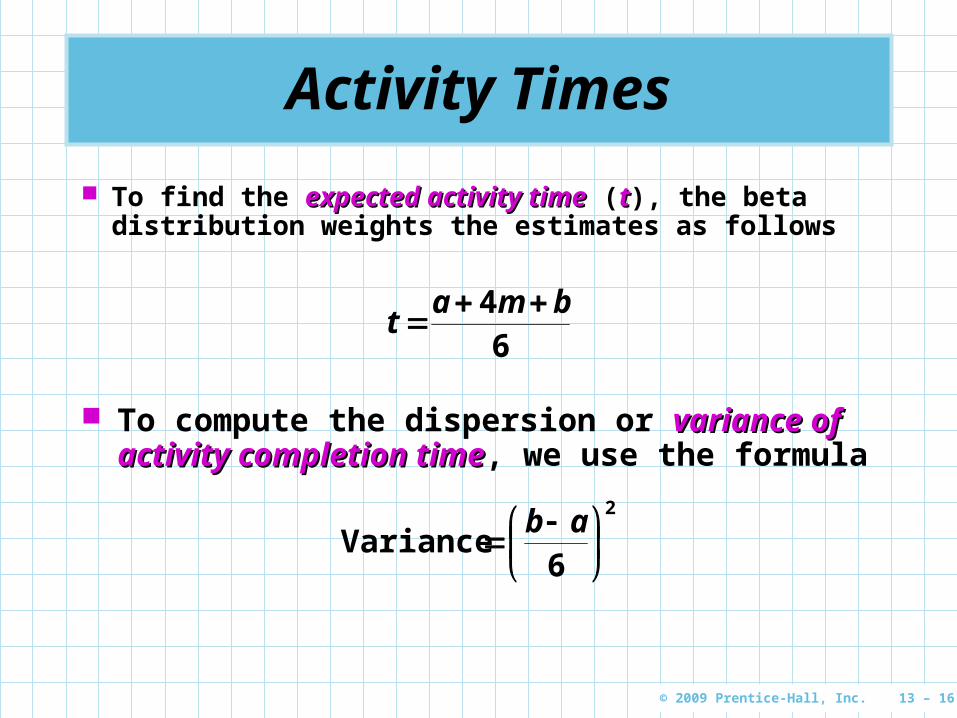
To find the expected activity timeexpected activity time (tt), the beta distribution weights the estimates as follows
64 bma
t
To compute the dispersion or variance of activity variance of activity completion timecompletion time, we use the formula
2
6Variance
ab
© 2009 Prentice-Hall, Inc. 13 – 17
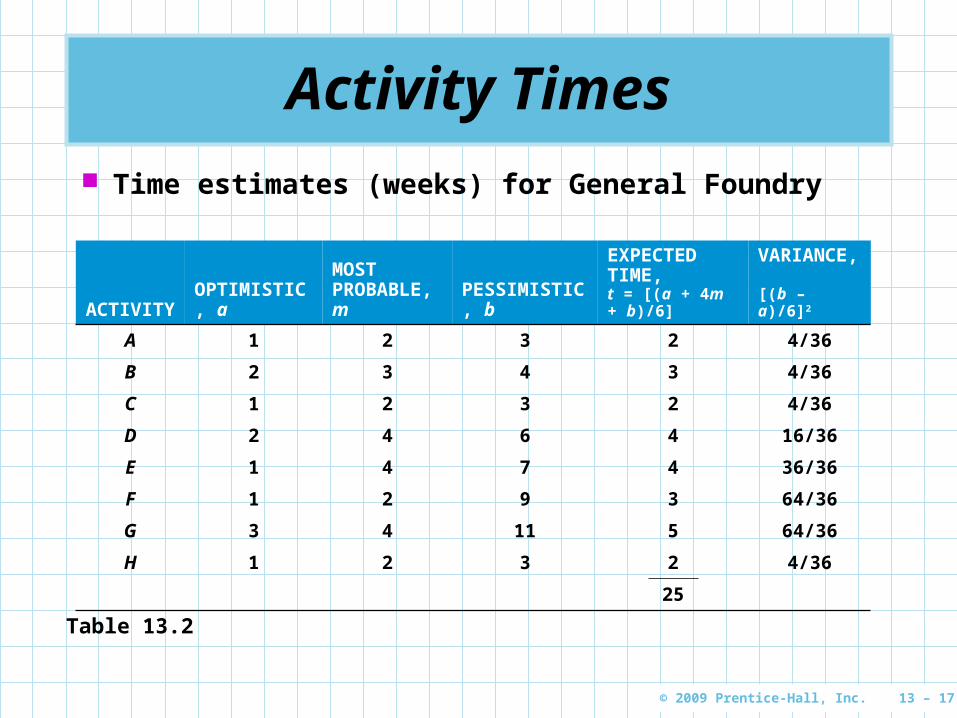
Activity Times
Time estimates (weeks) for General Foundry
ACTIVITYOPTIMISTIC, a
MOST PROBABLE, m
PESSIMISTIC, b
EXPECTED TIME, t = [(a + 4m + b)/6]
VARIANCE,
[(b – a)/6]2
A 1 2 3 2 4/36
B 2 3 4 3 4/36
C 1 2 3 2 4/36
D 2 4 6 4 16/36
E 1 4 7 4 36/36
F 1 2 9 3 64/36
G 3 4 11 5 64/36
H 1 2 3 2 4/36
25
Table 13.2
© 2009 Prentice-Hall, Inc. 13 – 18
How to Find the Critical Path
We accept the expected completion time for each task as the actual time for now
The total of 25 weeks in Table 13.2 does not take into account the obvious fact that some of the tasks could be taking place at the same time
To find out how long the project will take we perform the critical path analysis for the network
The critical pathcritical path is the longest path through the network
© 2009 Prentice-Hall, Inc. 13 – 19
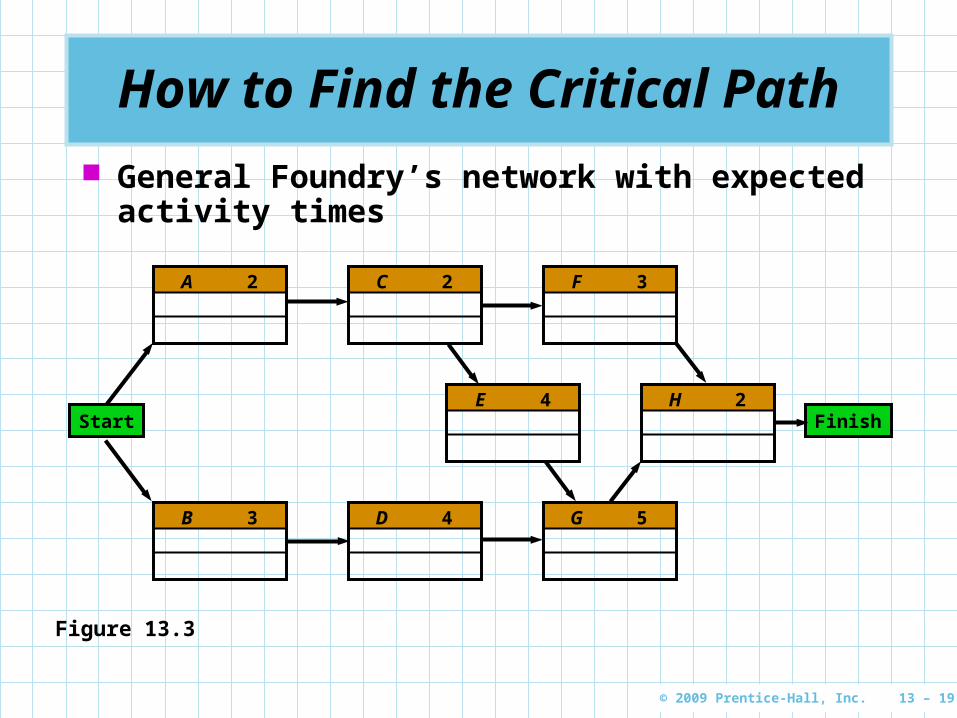
How to Find the Critical Path
General Foundry’s network with expected activity times
A 2 C 2
H 2E 4
B 3 D 4 G 5
F 3
Start Finish
Figure 13.3
© 2009 Prentice-Hall, Inc. 13 – 20
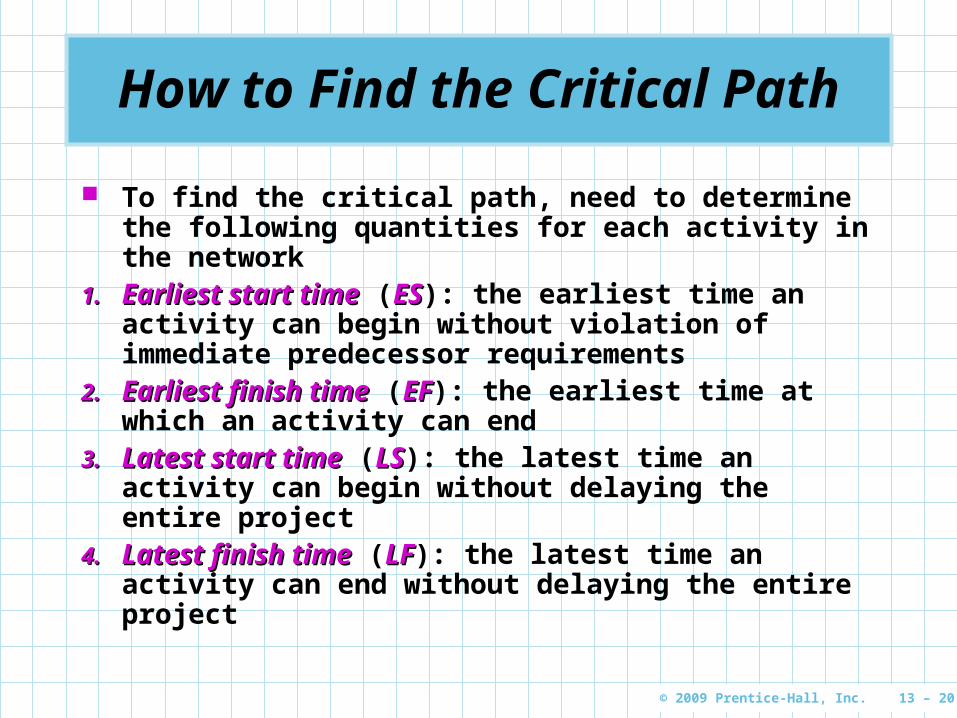
How to Find the Critical Path
To find the critical path, need to determine the following quantities for each activity in the network
1.1. Earliest start timeEarliest start time (ESES): the earliest time an activity can begin without violation of immediate predecessor requirements
2.2. Earliest finish timeEarliest finish time (EFEF): the earliest time at which an activity can end
3.3. Latest start timeLatest start time (LSLS): the latest time an activity can begin without delaying the entire project
4.4. Latest finish timeLatest finish time (LFLF): the latest time an activity can end without delaying the entire project
© 2009 Prentice-Hall, Inc. 13 – 21
How to Find the Critical Path
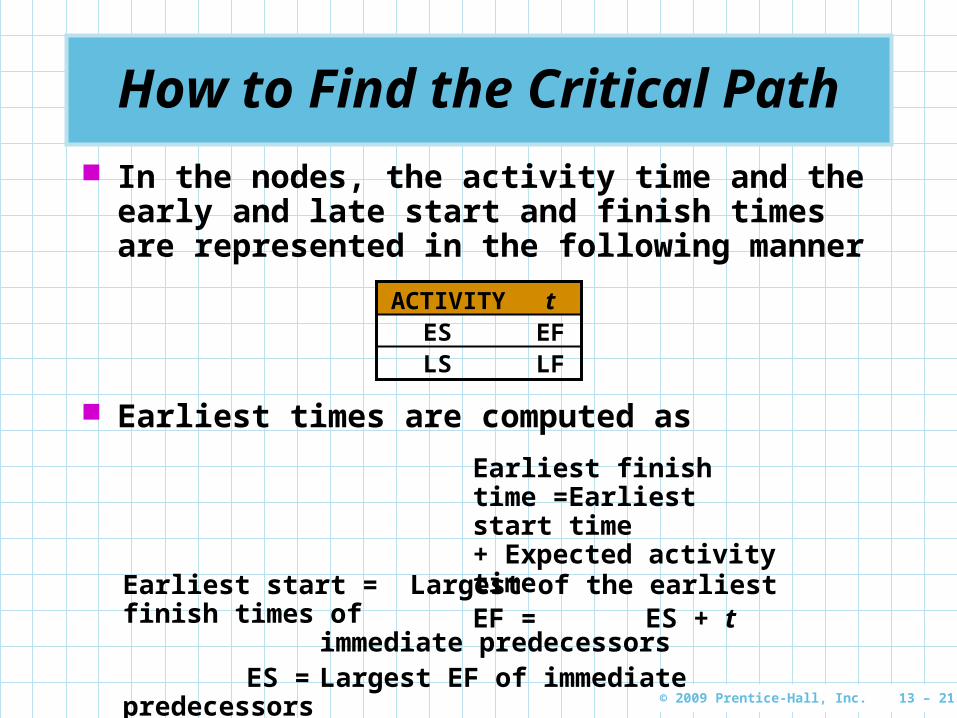
In the nodes, the activity time and the early and late start and finish times are represented in the following manner
ACTIVITY tES EFLS LF
Earliest times are computed as
Earliest finish time =Earliest start time + Expected activity timeEF = ES + t
Earliest start = Largest of the earliest finish times ofimmediate predecessors
ES = Largest EF of immediate predecessors
© 2009 Prentice-Hall, Inc. 13 – 22
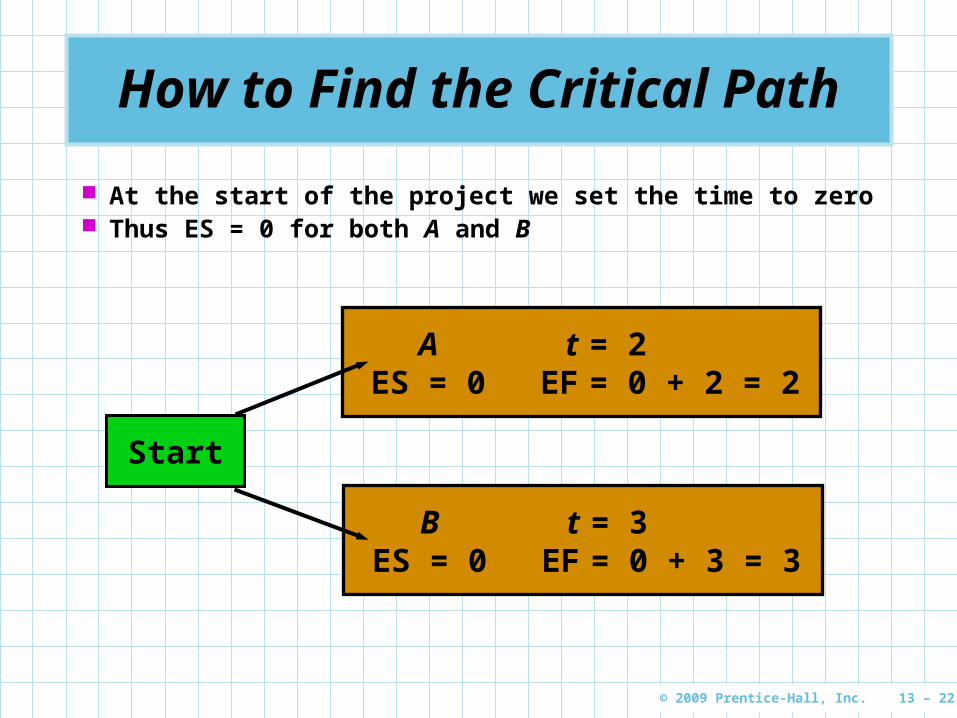
How to Find the Critical Path
At the start of the project we set the time to zero Thus ES = 0 for both A and B
Start
A t = 2ES = 0 EF = 0 + 2 = 2
B t = 3ES = 0 EF = 0 + 3 = 3
© 2009 Prentice-Hall, Inc. 13 – 23
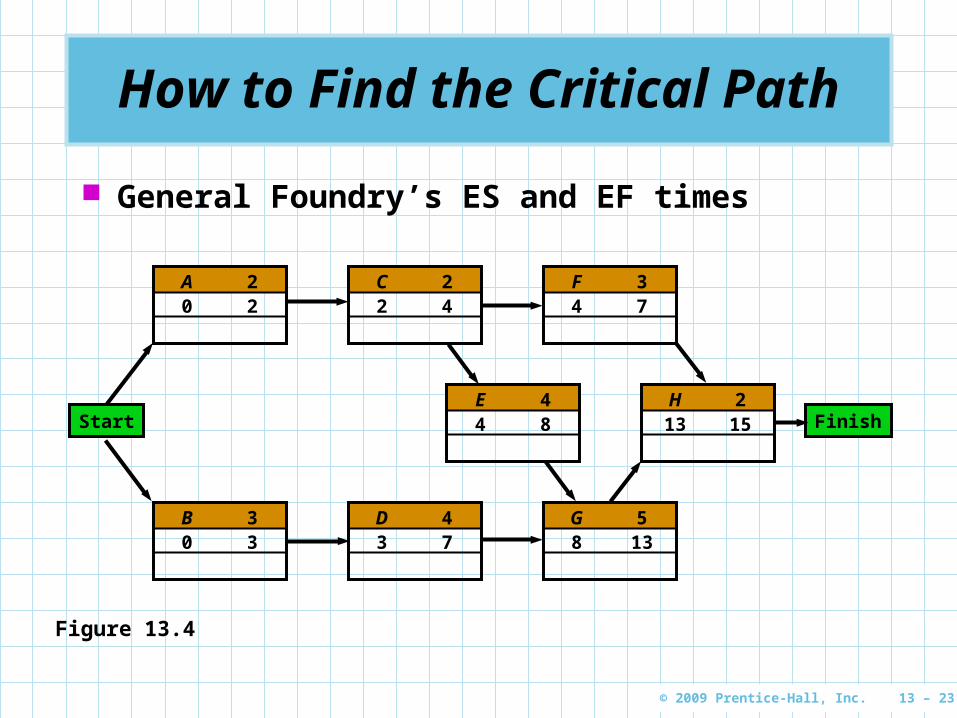
How to Find the Critical Path
General Foundry’s ES and EF times
A 20 2
C 22 4
H 213 15
E 44 8
B 30 3
D 43 7
G 58 13
F 34 7
Start Finish
Figure 13.4

© 2009 Prentice-Hall, Inc. 13 – 24
How to Find the Critical Path
Latest times are computed as
Latest start time =Latest finish time – Expected activity timeLS = LF – t
Latest finish time = Smallest of latest start timesfor following activities
LF = Smallest LS of following activities
For activity H
LS = LF – t = 15 – 2 = 13 weeks

© 2009 Prentice-Hall, Inc. 13 – 25
How to Find the Critical Path
General Foundry’s LS and LF times
A 20 20 2
C 22 42 4
H 213 1513 15
E 44 84 8
B 30 31 4
D 43 74 8
G 58 138 13
F 34 7
10 13
Start Finish
Figure 13.5
© 2009 Prentice-Hall, Inc. 13 – 26
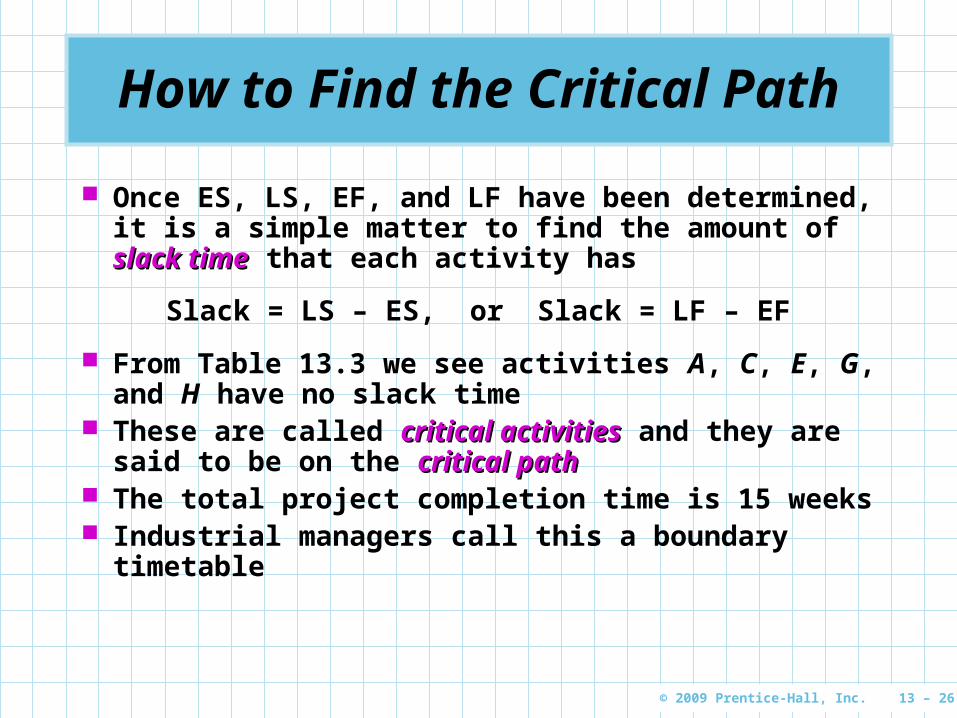
How to Find the Critical Path
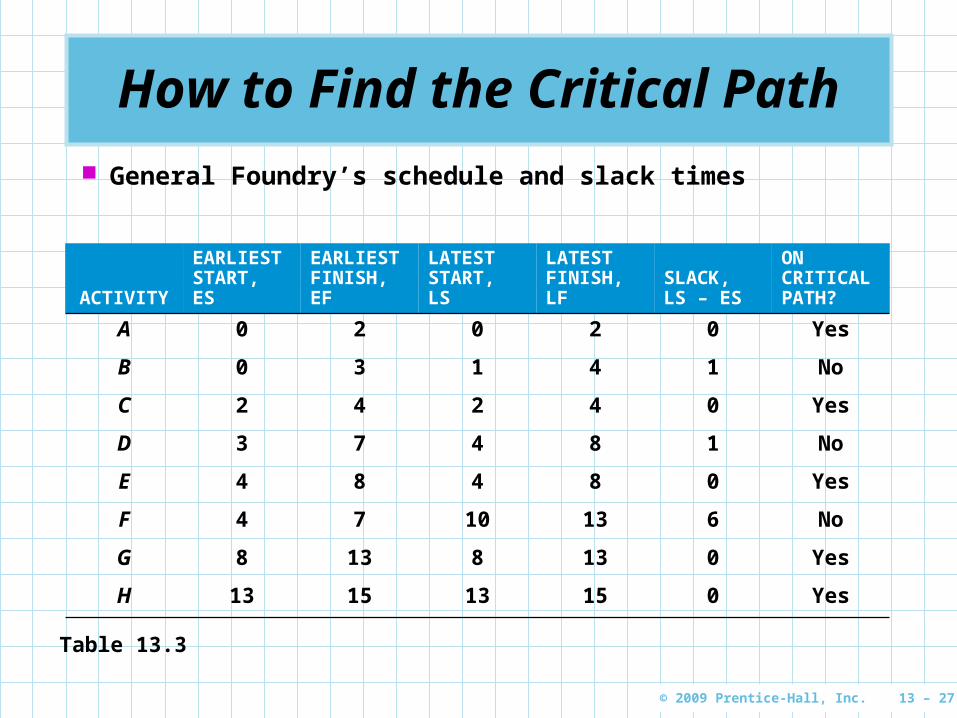
Once ES, LS, EF, and LF have been determined, it is a simple matter to find the amount of slack slack timetime that each activity has
Slack = LS – ES, or Slack = LF – EF
From Table 13.3 we see activities A, C, E, G, and H have no slack time
These are called critical activitiescritical activities and they are said to be on the critical pathcritical path
The total project completion time is 15 weeks Industrial managers call this a boundary
timetable
© 2009 Prentice-Hall, Inc. 13 – 27
How to Find the Critical Path
General Foundry’s schedule and slack times
ACTIVITY
EARLIEST START, ES
EARLIEST FINISH, EF
LATEST START, LS
LATEST FINISH, LF
SLACK, LS – ES
ON CRITICAL PATH?
A 0 2 0 2 0 Yes
B 0 3 1 4 1 No
C 2 4 2 4 0 Yes
D 3 7 4 8 1 No
E 4 8 4 8 0 Yes
F 4 7 10 13 6 No
G 8 13 8 13 0 Yes
H 13 15 13 15 0 Yes
Table 13.3
© 2009 Prentice-Hall, Inc. 13 – 28
How to Find the Critical Path
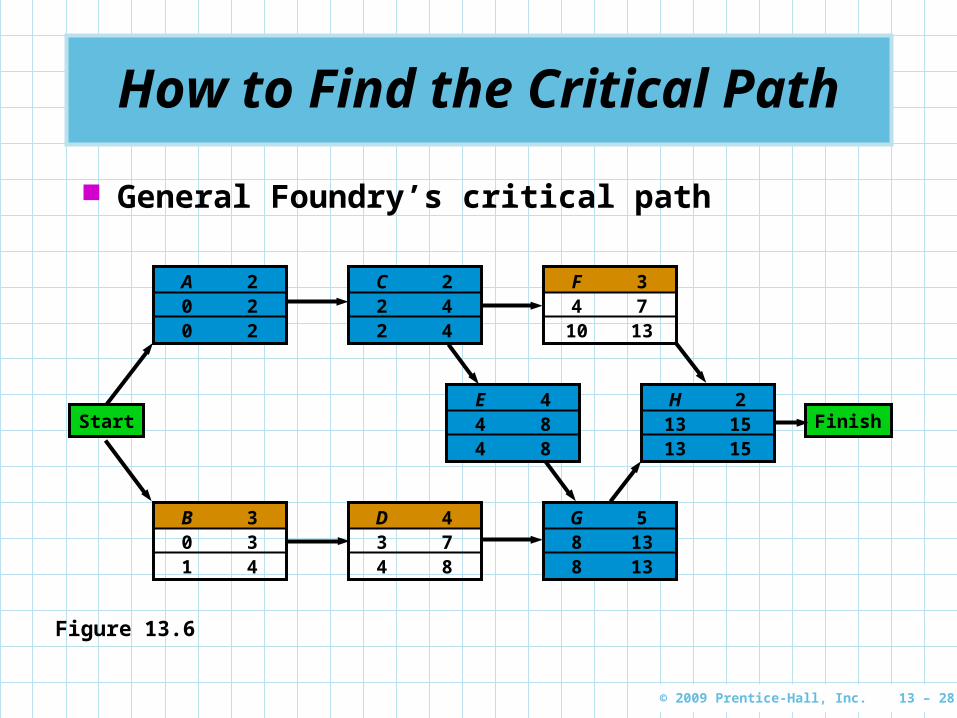
General Foundry’s critical path
A 20 20 2
C 22 42 4
H 213 1513 15
E 44 84 8
B 30 31 4
D 43 74 8
G 58 138 13
F 34 7
10 13
Start Finish
Figure 13.6
© 2009 Prentice-Hall, Inc. 13 – 29
Probability of Project Completion
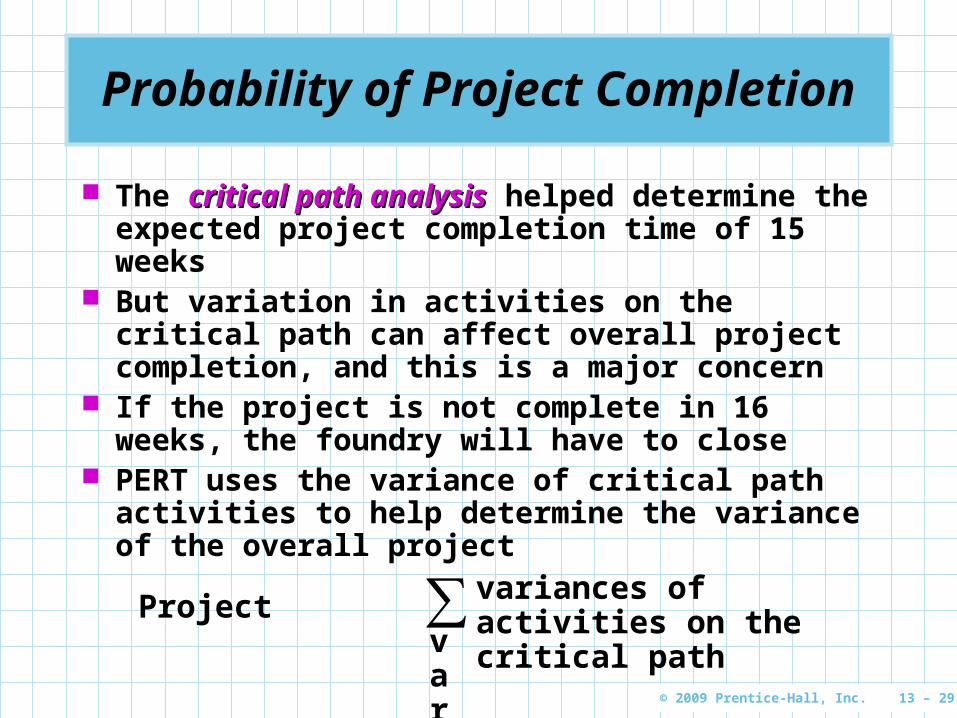
The critical path analysiscritical path analysis helped determine the expected project completion time of 15 weeks
But variation in activities on the critical path can affect overall project completion, and this is a major concern
If the project is not complete in 16 weeks, the foundry will have to close
PERT uses the variance of critical path activities to help determine the variance of the overall project
Project variance = ∑ variances of activities on the critical path
© 2009 Prentice-Hall, Inc. 13 – 30
Probability of Project Completion
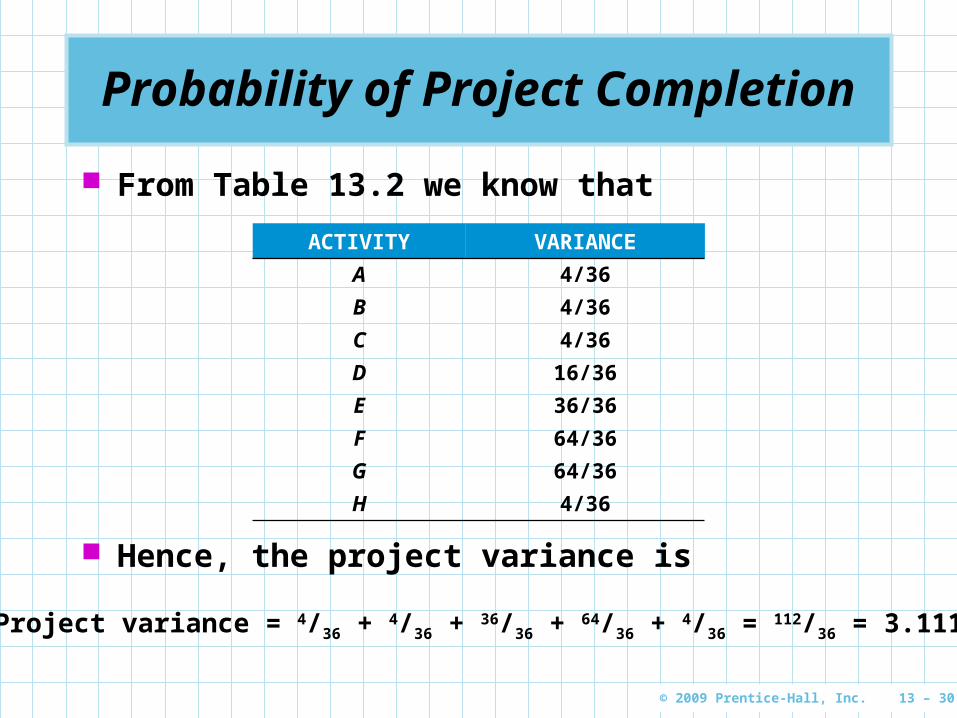
From Table 13.2 we know that
ACTIVITY VARIANCE
A 4/36
B 4/36
C 4/36
D 16/36
E 36/36
F 64/36
G 64/36
H 4/36
Hence, the project variance is
Project variance = 4/36 + 4/36 + 36/36 + 64/36 + 4/36 = 112/36 = 3.111
© 2009 Prentice-Hall, Inc. 13 – 31
Probability of Project Completion
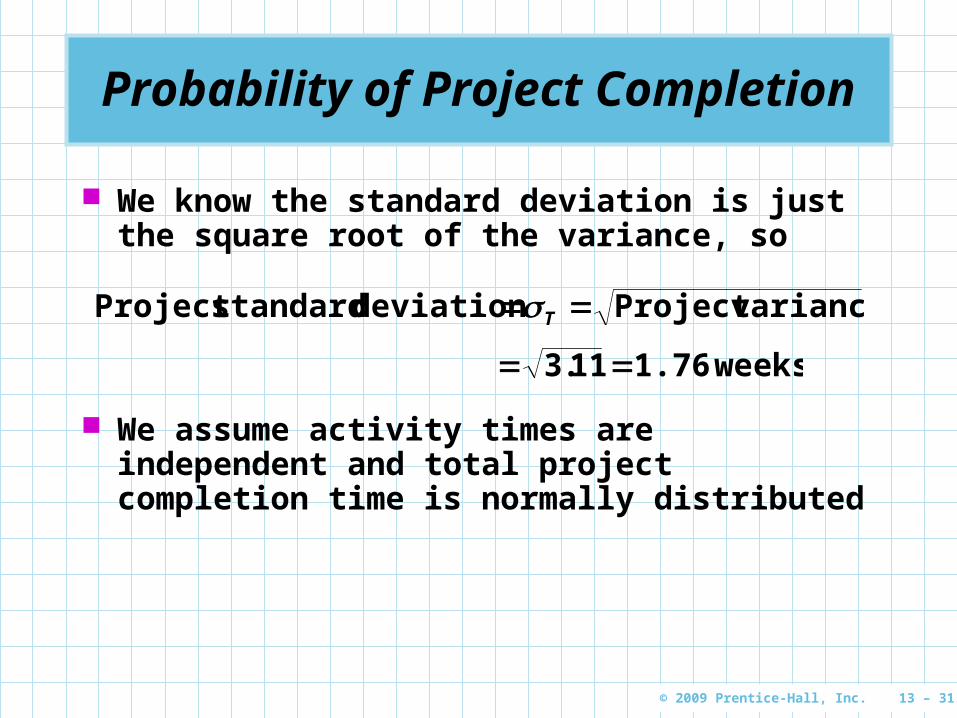
We know the standard deviation is just the square root of the variance, so
We assume activity times are independent and total project completion time is normally distributed
varianceProject deviation standardProject T
weeks1.76113 .
© 2009 Prentice-Hall, Inc. 13 – 32
Probability of Project Completion
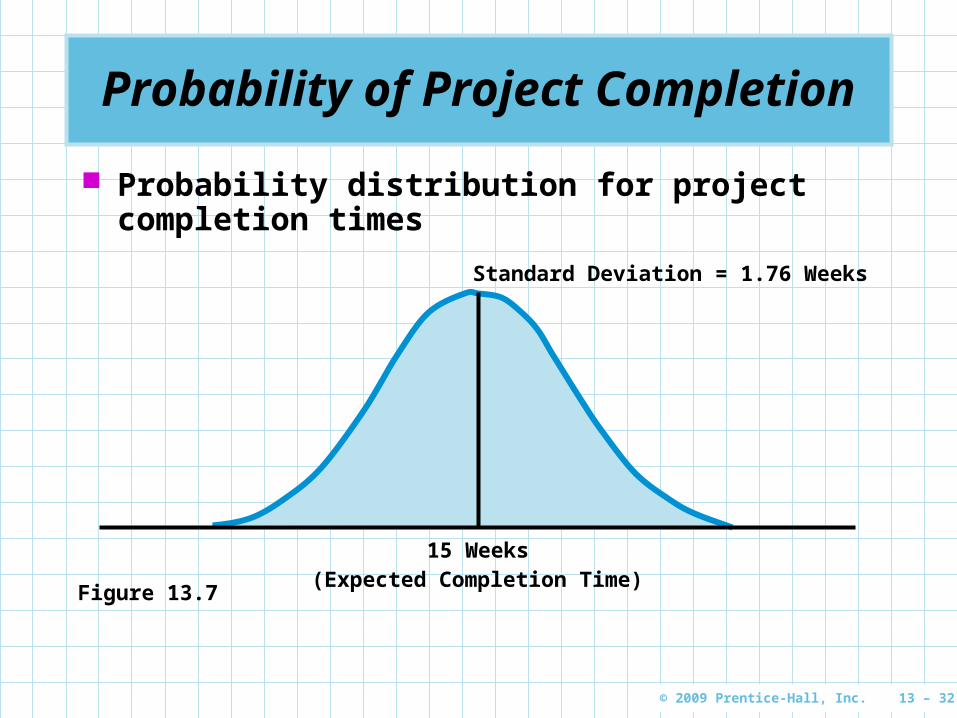
Probability distribution for project completion times
Standard Deviation = 1.76 Weeks
(Expected Completion Time)15 Weeks
Figure 13.7
© 2009 Prentice-Hall, Inc. 13 – 33
Probability of Project Completion
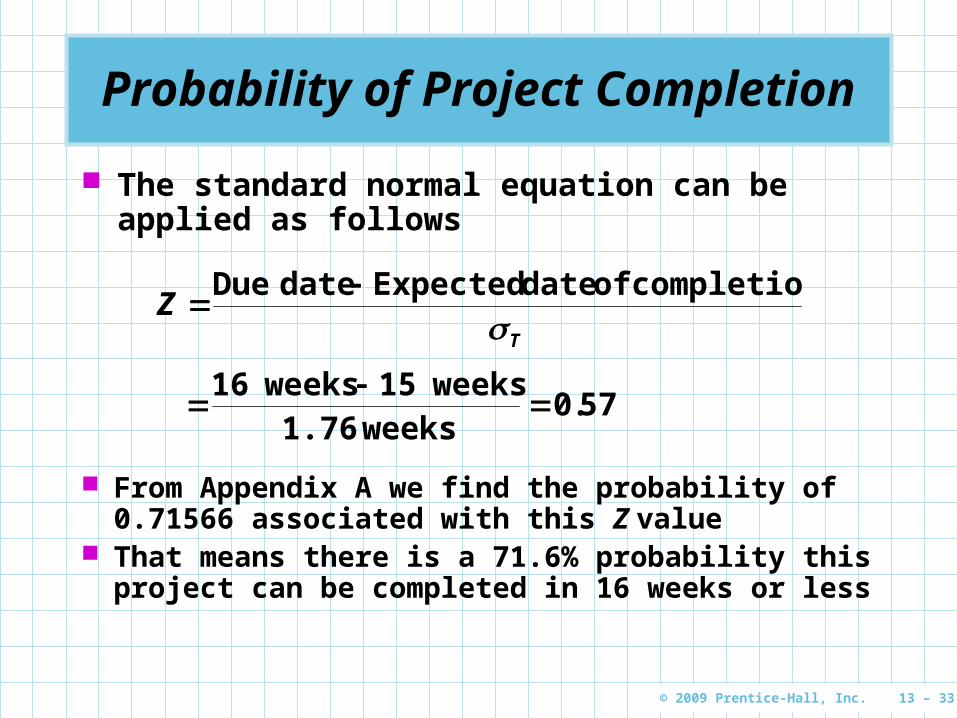
The standard normal equation can be applied as follows
T
Z
completion of date Expecteddate Due
570 weeks1.76
weeks15 weeks16.
From Appendix A we find the probability of 0.71566 associated with this Z value
That means there is a 71.6% probability this project can be completed in 16 weeks or less
© 2009 Prentice-Hall, Inc. 13 – 34
Probability of Project Completion
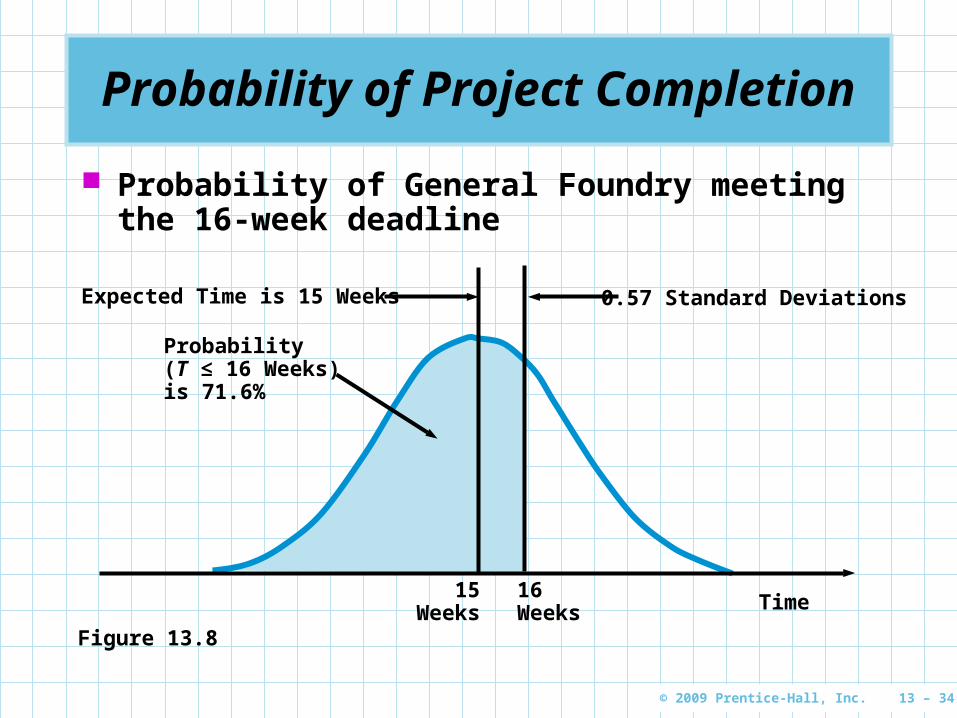
Probability of General Foundry meeting the 16-week deadline
0.57 Standard Deviations
Time15
WeeksFigure 13.8
16Weeks
Expected Time is 15 Weeks
Probability(T ≤ 16 Weeks)is 71.6%
© 2009 Prentice-Hall, Inc. 13 – 35
What PERT Was Able to Provide
PERT has been able to provide the project manager with several valuable pieces of information
The project’s expected completion date is 15 weeks
There is a 71.6% chance that the equipment will be in place within the 16-week deadline
Five activities (A, C, E, G, H) are on the critical path
Three activities (B, D, F) are not critical but have some slack time built in
A detailed schedule of activity starting and ending dates has been made available
© 2009 Prentice-Hall, Inc. 13 – 36
Sensitivity Analysis and Project Management
The time required to complete an activity can vary from the projected or expected time
If the activity is on the critical path, the completion time of the project will change
This will also have an impact on ES, EF, LS, and LF times for other activities
The exact impact depends on the relationship between the various activities
A predecessor activitypredecessor activity is one that must be accomplished before the given activity can be started
A successor activitysuccessor activity is one that can be started only after the given activity is finished
© 2009 Prentice-Hall, Inc. 13 – 37
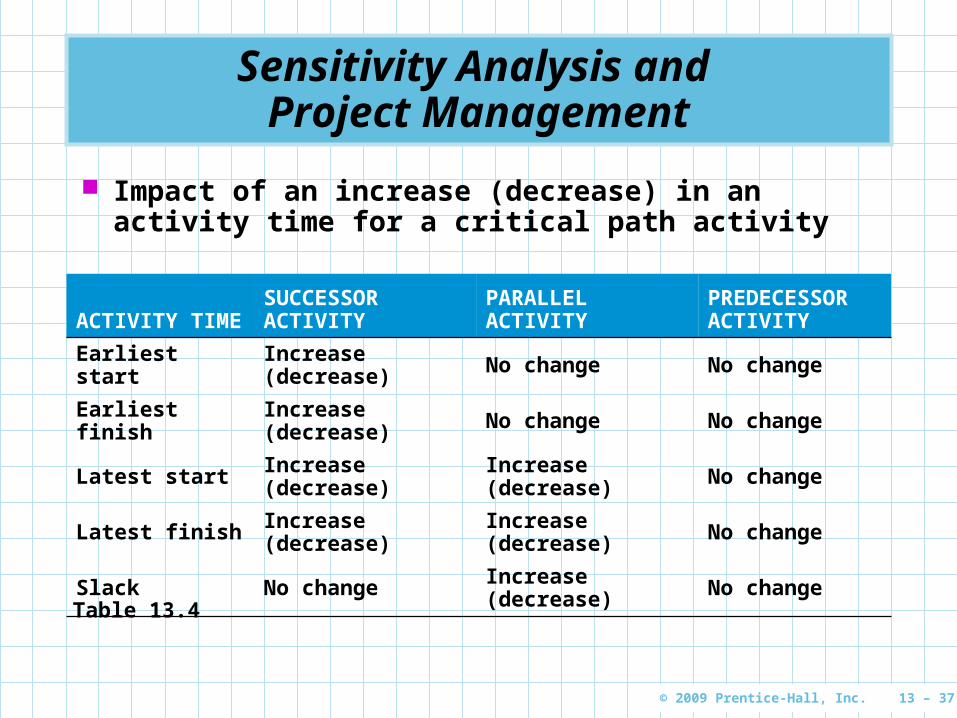
Sensitivity Analysis and Project Management
Impact of an increase (decrease) in an activity time for a critical path activity
ACTIVITY TIMESUCCESSOR ACTIVITY
PARALLEL ACTIVITY
PREDECESSOR ACTIVITY
Earliest start Increase (decrease) No change No change
Earliest finish Increase (decrease) No change No change
Latest start Increase (decrease) Increase (decrease) No change
Latest finish Increase (decrease) Increase (decrease) No change
Slack No change Increase (decrease) No change
Table 13.4
© 2009 Prentice-Hall, Inc. 13 – 38
PERT/COST
Although PERT is an excellent method of monitoring and controlling project length, it does not consider the very important factor of project cost
PERT/CostPERT/Cost is a modification of PERT that allows a manager to plan, schedule, monitor, and control cost as well as time
Using PERT/Cost to plan, schedule, monitor, and control project cost helps accomplish the sixth and final step of PERT

© 2009 Prentice-Hall, Inc. 13 – 39
Planning and Scheduling Project Costs: Budgeting Process
The overall approach in the budgeting process of a project is to determine how much is to be spent every week or month
This can be accomplished in four basic budgeting steps
© 2009 Prentice-Hall, Inc. 13 – 40
Four Steps of the Budgeting Process
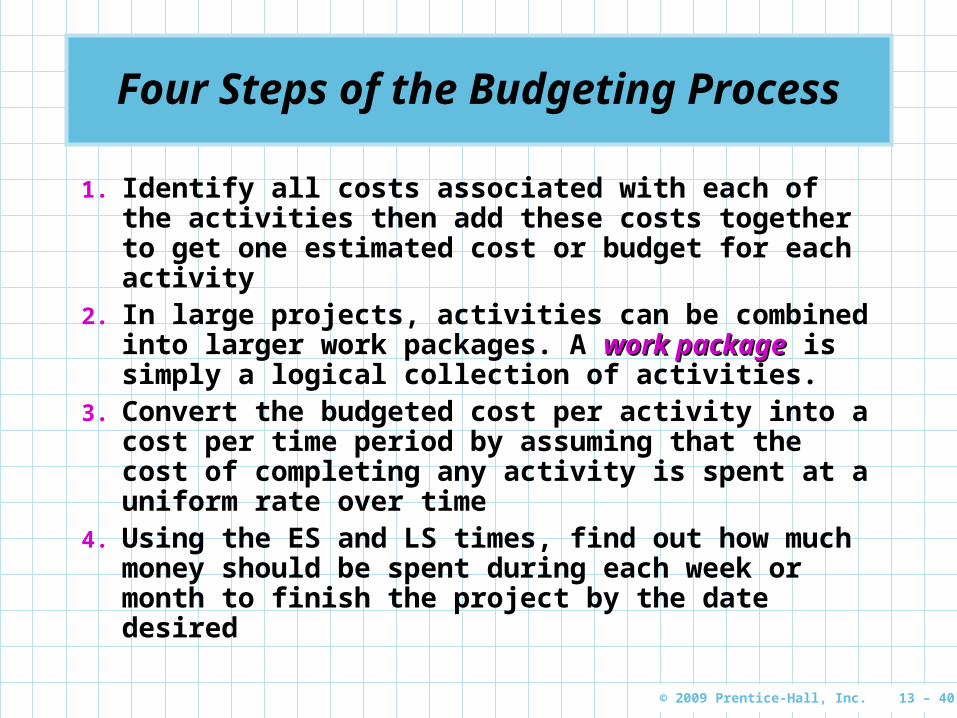
1. Identify all costs associated with each of the activities then add these costs together to get one estimated cost or budget for each activity
2. In large projects, activities can be combined into larger work packages. A work packagework package is simply a logical collection of activities.
3. Convert the budgeted cost per activity into a cost per time period by assuming that the cost of completing any activity is spent at a uniform rate over time
4. Using the ES and LS times, find out how much money should be spent during each week or month to finish the project by the date desired
© 2009 Prentice-Hall, Inc. 13 – 41
Budgeting for General Foundry
The Gantt chart in Figure 13.9 illustrates this project
The horizontal bars shown when each activity will be performed based on its ES-EF times
We determine how much will be spent on each activity during each week and fill these amounts into a chart in place of the bars
The following two tables show the activity costs and budgeted cost for the General Foundry project

© 2009 Prentice-Hall, Inc. 13 – 42
Budgeting for General Foundry
Gantt chart General Foundry project
A
B
C
D
E
F
G
H
Act
ivit
y
1 2 3 4 5 6 7 8 9 10 11 12 13 14 15Week
Figure 13.9
© 2009 Prentice-Hall, Inc. 13 – 43
Budgeting for General Foundry
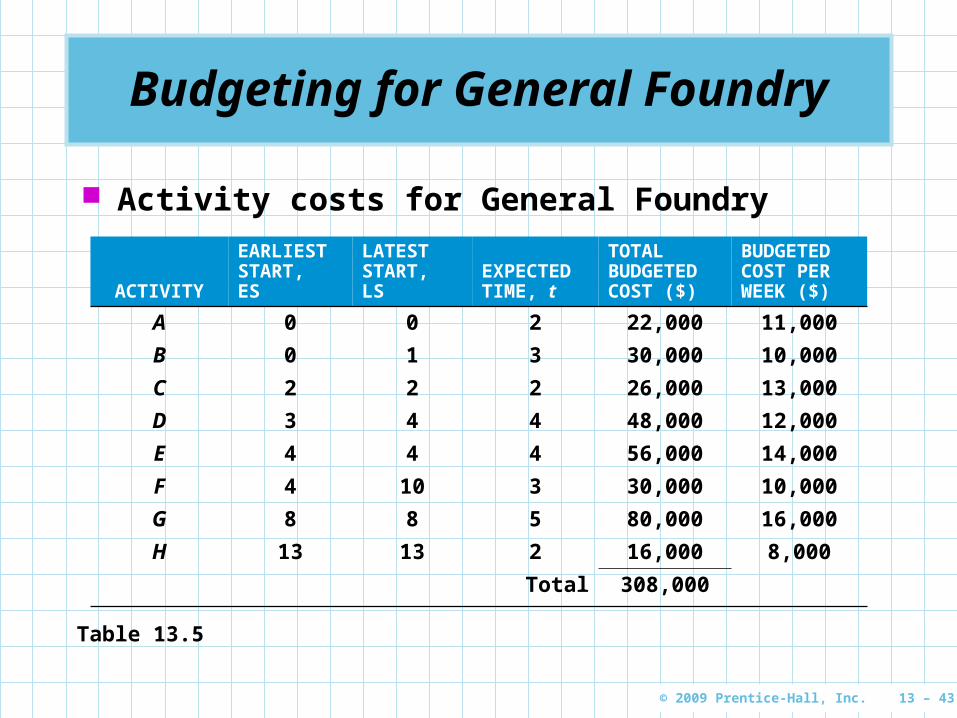
Activity costs for General Foundry
ACTIVITY
EARLIEST START, ES
LATEST START, LS
EXPECTED TIME, t
TOTAL BUDGETED COST ($)
BUDGETED COST PER WEEK ($)
A 0 0 2 22,000 11,000
B 0 1 3 30,000 10,000
C 2 2 2 26,000 13,000
D 3 4 4 48,000 12,000
E 4 4 4 56,000 14,000
F 4 10 3 30,000 10,000
G 8 8 5 80,000 16,000
H 13 13 2 16,000 8,000
Total 308,000
Table 13.5

© 2009 Prentice-Hall, Inc. 13 – 44
Budgeting for General Foundry
Budgeted cost for General Foundry
Table 13.6
WEEK
ACTIVITY 1 2 3 4 5 6 7 8 9 10 11 12 13 14 15 TOTAL
A 11 11 22
B 10 10 10 30
C 13 13 26
D 12 12 12 12 48
E 14 14 14 14 56
F 10 10 10 30
G 16 16 16 16 16 80
H 8 8 16
308
Total per week 21 21 23 25 36 36 36 14 16 16 16 16 16 8 8
Total to date 21 42 65 90 126 162 198 212 228 244 260 276 292 300 308
© 2009 Prentice-Hall, Inc. 13 – 45
Budgeting for General Foundry
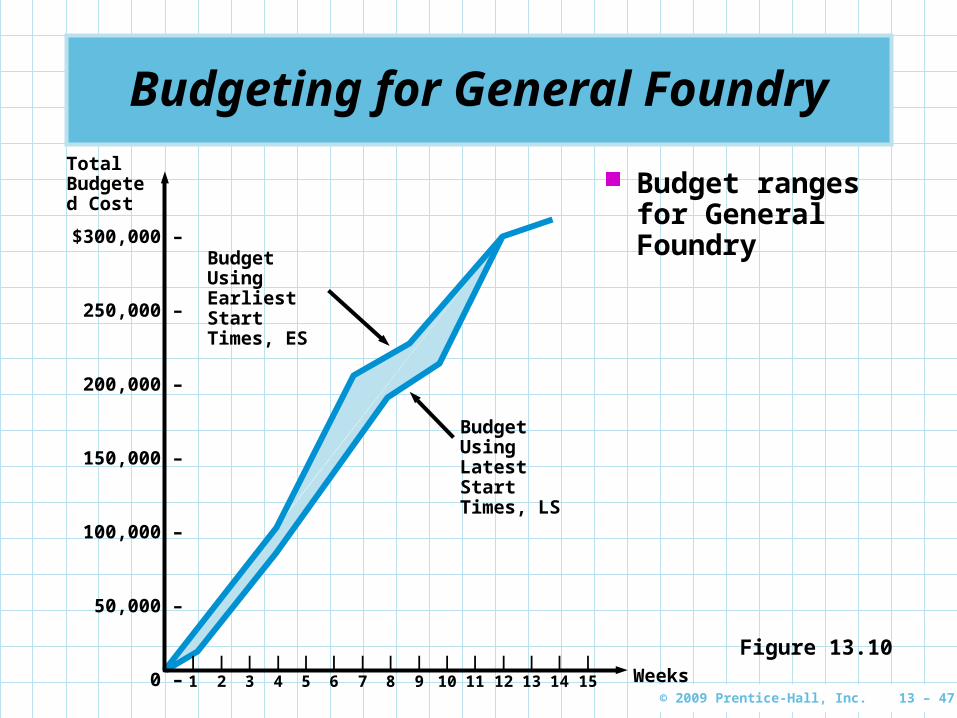
It is also possible to prepare a budget based on the latest starting time
This budget will delay the expenditure of funds until the last possible moment
The following table shows the latest start budget for the General Foundry project
The two tables form a budget range Any budget can be chosen between these two
values depending on when the company wants to actually spend the money
The budget ranges are plotted in Figure 13.10

© 2009 Prentice-Hall, Inc. 13 – 46
Budgeting for General Foundry
Late start budgeted cost for General Foundry
Table 13.7
WEEK
ACTIVITY 1 2 3 4 5 6 7 8 9 10 11 12 13 14 15 TOTAL
A 11 11 22
B 10 10 10 30
C 13 13 26
D 12 12 12 12 48
E 14 14 14 14 56
F 10 10 10 30
G 16 16 16 16 16 80
H 8 8 16
308
Total per week 11 21 23 23 26 26 26 26 16 16 26 26 26 8 8
Total to date 11 32 55 78 104 130 156 182 198 214 240 266 292 300 308
© 2009 Prentice-Hall, Inc. 13 – 47
Budgeting for General Foundry
Budget ranges for General FoundryBudget Using
Earliest Start Times, ES
Budget Using Latest Start Times, LS
$300,000 –
250,000 –
200,000 –
150,000 –
100,000 –
50,000 –
0 –
Total Budgeted Cost
Weeks| | | | | | | | | | | | | | |1 2 3 4 5 6 7 8 9 10 11 12 13 14 15
Figure 13.10
© 2009 Prentice-Hall, Inc. 13 – 48
Monitoring and Controlling Project Costs
Costs are monitored and controlled to ensure the project is progressing on schedule and that cost overruns are kept to a minimum
The status of the entire project should be checked periodically
The following table shows the state of the project in the sixth week
It can be used the answer questions about the schedule and costs so far

© 2009 Prentice-Hall, Inc. 13 – 49
Monitoring and Controlling Project Costs
Monitoring and controlling budgeted cost
ACTIVITY
TOTAL BUDGETED COST ($)
PERCENT OF COMPLETION
VALUE OF WORK COMPLETED ($)
ACTUAL COST ($)
ACTIVITY DIFFERENCE ($)
A 22,000 100 22,000 20,000 –2,000
B 30,000 100 30,000 36,000 6,000
C 26,000 100 26,000 26,000 0
D 48,000 10 4,800 6,000 1,200
E 56,000 20 11,200 20,000 8,800
F 30,000 20 6,000 4,000 –2,000
G 80,000 0 0 0 0
H 16,000 0 0 0 0
Total 100,000 112,000 12,000
Table 13.8 OverrunOverrun
© 2009 Prentice-Hall, Inc. 13 – 50
Monitoring and Controlling Project Costs
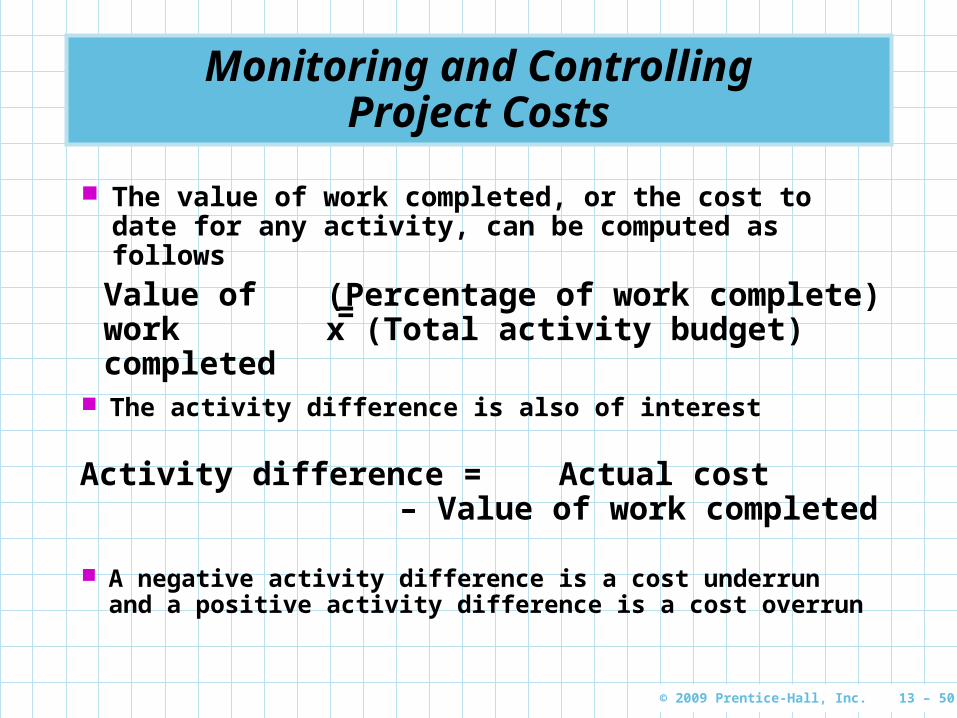
The value of work completed, or the cost to date for any activity, can be computed as follows
The activity difference is also of interest
Value of work completed = (Percentage of work complete)
x (Total activity budget)
Activity difference = Actual cost – Value of work completed
A negative activity difference is a cost underrun and a positive activity difference is a cost overrun
© 2009 Prentice-Hall, Inc. 13 – 51
Project Crashing
Projects will sometimes have deadlines that are impossible to meet using normal procedures
By using exceptional methods it may be possible to finish the project in less time than normally required
However, this usually increases the cost of the project
Reducing a project’s completion time is called crashingcrashing
© 2009 Prentice-Hall, Inc. 13 – 52
Project Crashing
Crashing a project starts with using the normal normal timetime to create the critical path
The normal costnormal cost is the cost for completing the activity using normal procedures
If the project will not meet the required deadline, extraordinary measures must be taken
The crash timecrash time is the shortest possible activity time and will require additional resources
The crash costcrash cost is the price of completing the activity in the earlier-than-normal time
© 2009 Prentice-Hall, Inc. 13 – 53
Four Steps to Project Crashing
1. Find the normal critical path and identify the critical activities
2. Compute the crash cost per week (or other time period) for all activities in the network using the formula
Crash cost/Time period =Crash cost – Normal costNormal time – Crash time
© 2009 Prentice-Hall, Inc. 13 – 54
Four Steps to Project Crashing
3. Select the activity on the critical path with the smallest crash cost per week and crash this activity to the maximum extent possible or to the point at which your desired deadline has been reached
4. Check to be sure that the critical path you were crashing is still critical. If the critical path is still the longest path through the network, return to step 3. If not, find the new critical path and return to step 2.
© 2009 Prentice-Hall, Inc. 13 – 55
General Foundry Example
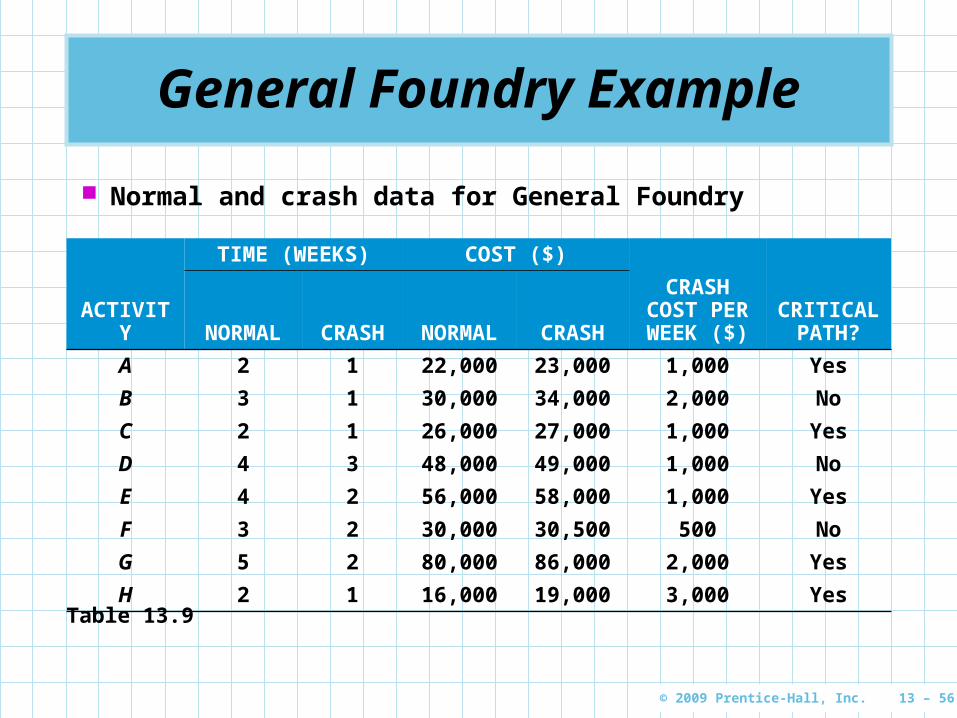
General Foundry has been given 14 weeks instead of 16 weeks to install the new equipment
The critical path for the project is 15 weeks What options do they have? The normal and crash times and costs are shown
in Table 13.9 Crash costs are assumed to be linear and Figure
13.11 shows the crash cost for activity B Crashing activities B and A will shorten the
completion time to 14 but it creates a second critical path
Any further crashing must be done to both critical paths
© 2009 Prentice-Hall, Inc. 13 – 56
General Foundry Example
Normal and crash data for General Foundry
ACTIVITY
TIME (WEEKS) COST ($)
CRASH COST PER WEEK ($)
CRITICAL PATH?NORMAL CRASH NORMAL CRASH
A 2 1 22,000 23,000 1,000 Yes
B 3 1 30,000 34,000 2,000 No
C 2 1 26,000 27,000 1,000 Yes
D 4 3 48,000 49,000 1,000 No
E 4 2 56,000 58,000 1,000 Yes
F 3 2 30,000 30,500 500 No
G 5 2 80,000 86,000 2,000 Yes
H 2 1 16,000 19,000 3,000 YesTable 13.9

© 2009 Prentice-Hall, Inc. 13 – 57
General Foundry Example
Crash and normal times and costs for activity B
Normal Cost
Crash Cost
Normal
Crash
Activity Cost
Time (Weeks)
$34,000 –
$33,000 –
$32,000 –
$31,000 –
$30,000 –
–
| | | |0 1 2 3
Normal TimeCrash Time
Crash Cost/Week =Crash Cost – Normal CostNormal Time – Crash Time
= = $2,000/Week$4,000
2 Weeks
$34,000 – $30,0003 – 1
=
Figure 13.11
© 2009 Prentice-Hall, Inc. 13 – 58
Project Crashing with Linear Programming
Linear programming is another approach to finding the best project crashing schedule
We can illustrate its use on General Foundry’s network
The data needed are derived from the normal and crash data for General Foundry and the project network with activity times

© 2009 Prentice-Hall, Inc. 13 – 59
Project Crashing with Linear Programming
General Foundry’s network with activity times
Figure 13.12
A 2
H 2
B 3 D 4 G 5
FinishStart
C 2
E 4
F 3

© 2009 Prentice-Hall, Inc. 13 – 60
Project Crashing with Linear Programming
The decision variables for the problem are
XA = EF for activity A
XB = EF for activity B
XC = EF for activity C
XD = EF for activity D
XE = EF for activity E
XF = EF for activity F
XG = EF for activity G
XH = EF for activity H
Xstart = start time for project (usually 0)
Xfinish = earliest finish time for the project
© 2009 Prentice-Hall, Inc. 13 – 61
Project Crashing with Linear Programming
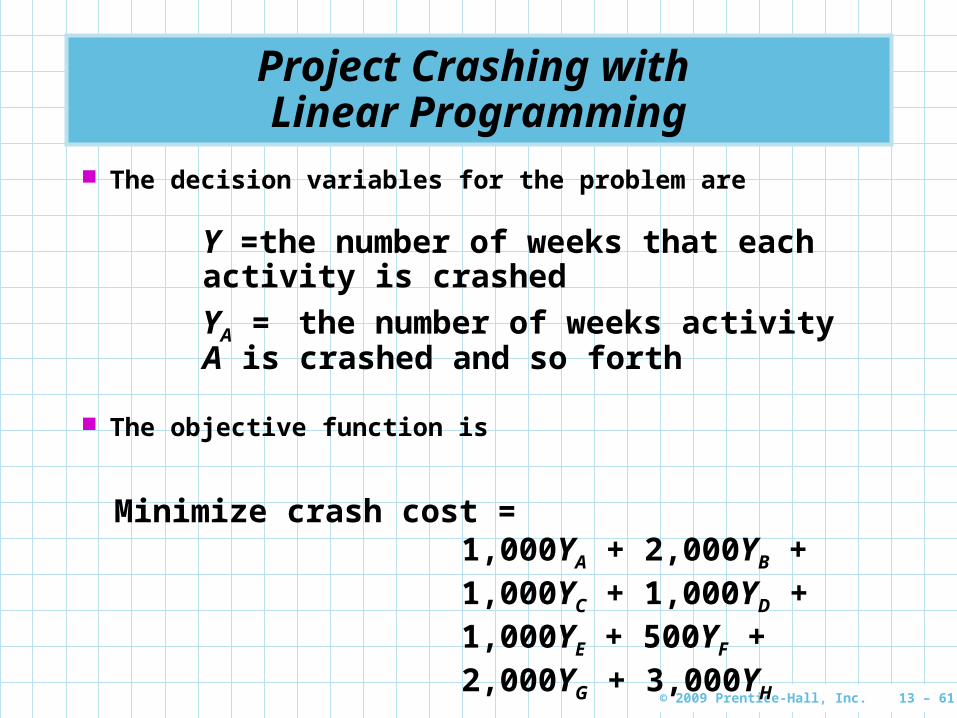
The decision variables for the problem are
Y =the number of weeks that each activity is crashed
YA =the number of weeks activity A is crashed and so forth
The objective function is
Minimize crash cost = 1,000YA + 2,000YB + 1,000YC + 1,000YD + 1,000YE + 500YF + 2,000YG + 3,000YH
© 2009 Prentice-Hall, Inc. 13 – 62
Project Crashing with Linear Programming
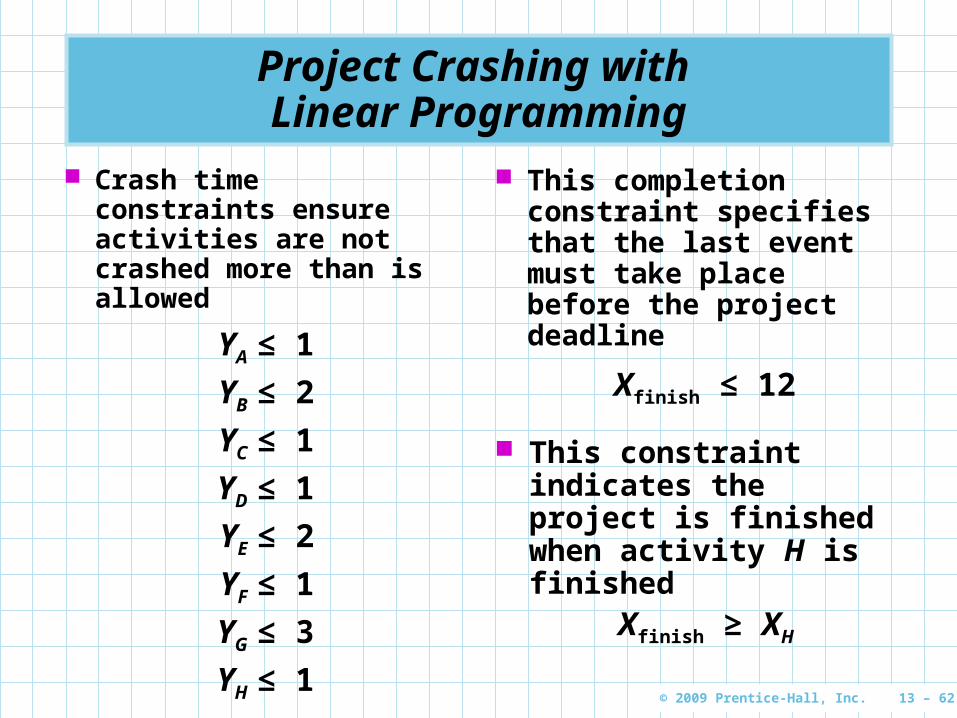
Crash time constraints ensure activities are not crashed more than is allowed
YA ≤ 1
YB ≤ 2
YC ≤ 1
YD ≤ 1
YE ≤ 2
YF ≤ 1
YG ≤ 3
YH ≤ 1
This completion constraint specifies that the last event must take place before the project deadline
Xfinish ≤ 12
This constraint indicates the project is finished when activity H is finished
Xfinish ≥ XH
© 2009 Prentice-Hall, Inc. 13 – 63
Project Crashing with Linear Programming
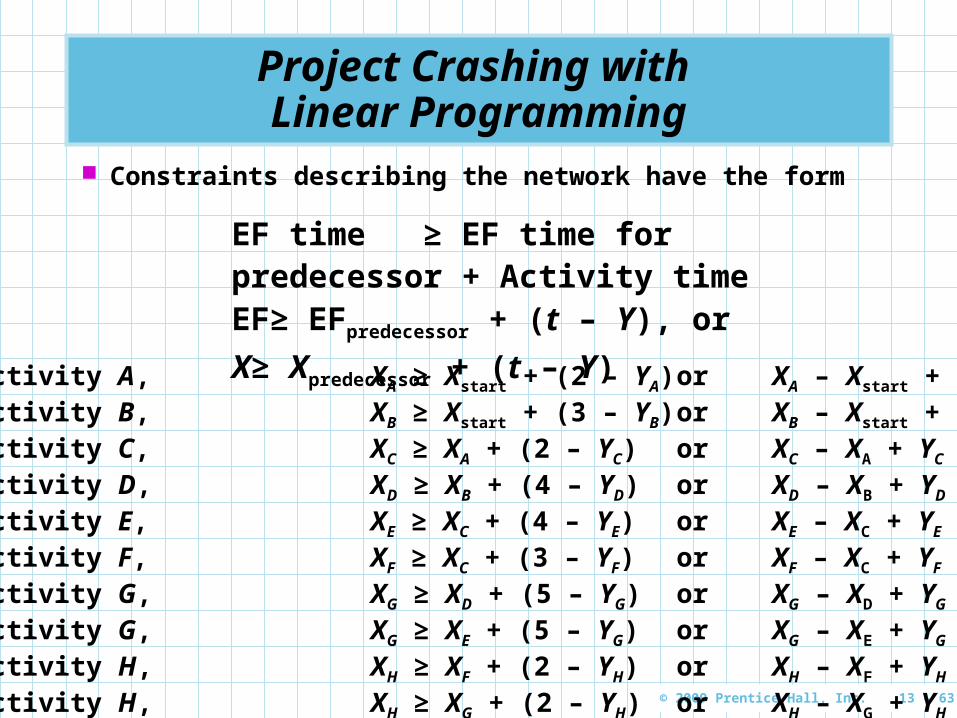
Constraints describing the network have the form
EF time≥ EF time for predecessor + Activity timeEF≥ EFpredecessor + (t – Y), or
X≥ Xpredecessor + (t – Y)For activity A, XA ≥ Xstart + (2 – YA) or XA – Xstart + YA ≥ 2For activity B, XB ≥ Xstart + (3 – YB) or XB – Xstart + YB ≥ 3For activity C, XC ≥ XA + (2 – YC) or XC – XA + YC ≥ 2For activity D, XD ≥ XB + (4 – YD) or XD – XB + YD ≥ 4For activity E, XE ≥ XC + (4 – YE) or XE – XC + YE ≥ 4For activity F, XF ≥ XC + (3 – YF) or XF – XC + YF ≥ 3For activity G, XG ≥ XD + (5 – YG) or XG – XD + YG ≥ 5For activity G, XG ≥ XE + (5 – YG) or XG – XE + YG ≥ 5For activity H, XH ≥ XF + (2 – YH) or XH – XF + YH ≥ 2For activity H, XH ≥ XG + (2 – YH) or XH – XG + YH ≥ 2
© 2009 Prentice-Hall, Inc. 13 – 64
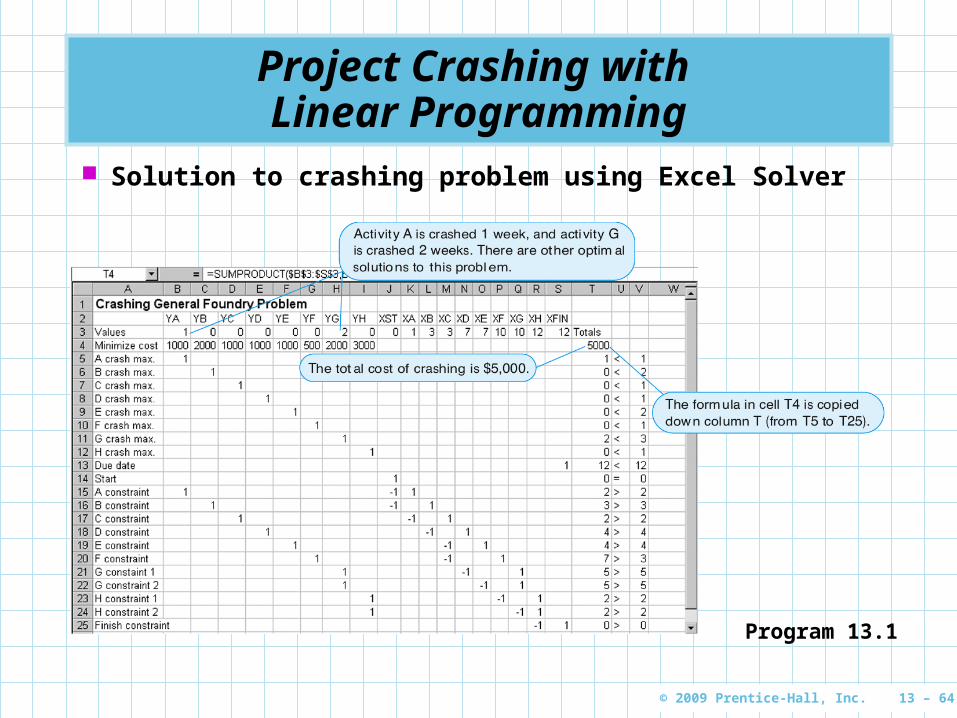
Project Crashing with Linear Programming
Solution to crashing problem using Excel Solver
Program 13.1

© 2009 Prentice-Hall, Inc. 13 – 65
Other Topics in Project Management
Subprojects For extremely large projects, an activity may
be made of several smaller subactivities which can be viewed as a smaller project or subproject of the original
Milestones Major events in a project are often referred to
as milestonesmilestones and may be reflected in Gantt Gantt chartscharts and PERT charts to highlight the importance of reaching these events
© 2009 Prentice-Hall, Inc. 13 – 66
Other Topics in Project Management
Resource Leveling Resource levelingResource leveling adjusts the activity start
away from the early start so that resource utilization is more evenly distributed over time
Software There are many project management software
packages on the market for both personal computers and larger mainframe machines
Most of these create PERT charts and Gantt charts and can be used to develop budget schedules, adjust future start times, and level resource utilization
Recommended


![[PPT]Render/Stair/Hanna Chapter 7 - Inter · Web viewSensitivity Analysis Sensitivity analysis often involves a series of what-if? questions concerning constraints, variable coefficients,](https://img.pdfslide.net/doc/110x75/5ae8171b7f8b9a08778f37fb/pptrenderstairhanna-chapter-7-viewsensitivity-analysis-sensitivity-analysis.jpg)