1
Business System Analysis & Decision Making- Lecture 14
Zhangxi Lin
ISQS 5340
Summer II 2006
2
Chapter 12: Improving Decision Making Outline of the chapter
Strategy 1: Acquiring Experience and Expertise
Strategy 2: Debiasing Judgment Strategy 3: Analogical Reasoning Strategy 4: Taking an Outsider’s View Strategy 5: Using Linear Models and Other
Statistical Techniques Strategy 6: Understanding Biases in Others

3
Decision Making in Sports
Statistics has outperformed experts in predicting the outcomes of sport games
The Future of NBA Statistics: Part 1, Part 2 Houston Rocket Performance in 2006
Yao Ming’s statistics Questions
Why did it take so long for rationality to enter into decision making in sports (baseball)?
To what extent are managers in other industries still replying on false expertise when better strategies exist?
4
Experience vs. Expertise
“Experience is a dear teacher” (Dawes 1988) “Learning from an experience of failure … is indeed
‘dear’, …” Need to realize the value of gaining a conceptual
understanding of how to make a rational decision, rather than simply depending on the relatively mindless, passive learning obtained via experience.
The final benefit of developing a strategic conceptualization of decision-making concerns transferability – the ability to pass on the knowledge to future generations.
Key element is to avoid the many biases in individual and group context.
5
Debiasing Judgment
Unfreezing Change Refreezing
6
Business Intelligence and Data Analysis
7
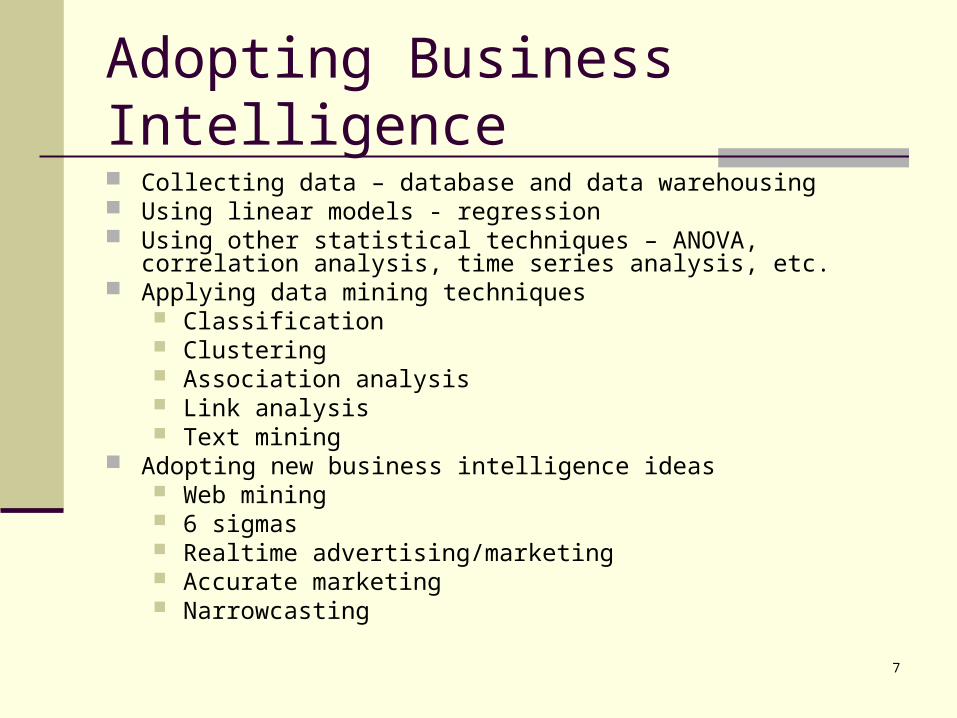
Adopting Business Intelligence Collecting data – database and data warehousing Using linear models - regression Using other statistical techniques – ANOVA, correlation analysis, time
series analysis, etc. Applying data mining techniques
Classification Clustering Association analysis Link analysis Text mining
Adopting new business intelligence ideas Web mining 6 sigmas Realtime advertising/marketing Accurate marketing Narrowcasting
8
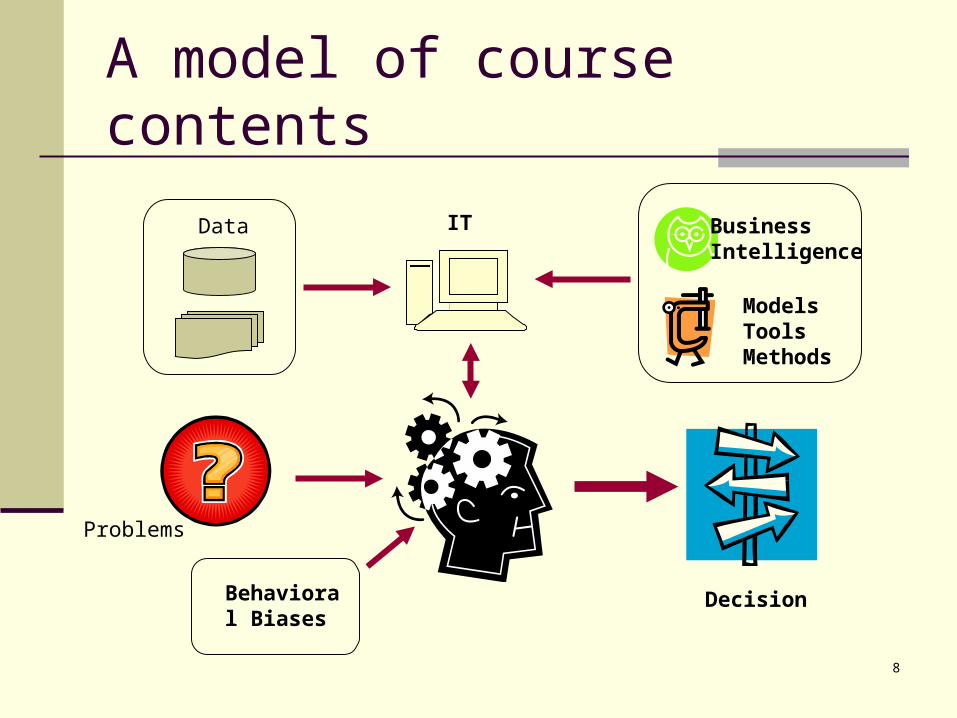
A model of course contents
IT BusinessIntelligence
Behavioral Biases
ModelsTools Methods
Data
Decision
Problems
9
Business Intelligence (restate)
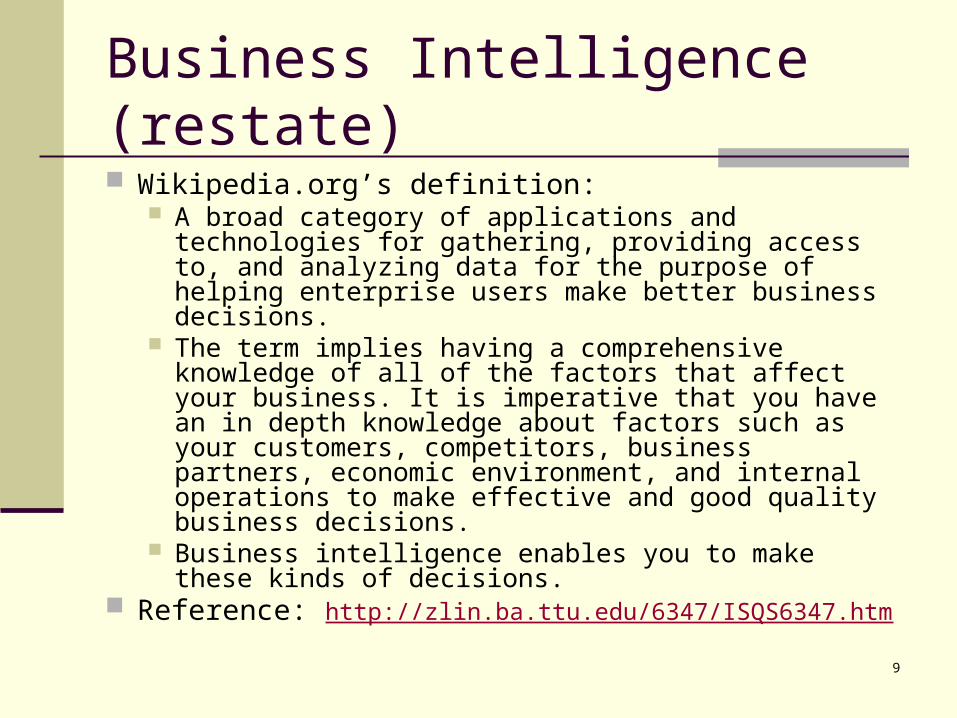
Wikipedia.org’s definition: A broad category of applications and technologies for
gathering, providing access to, and analyzing data for the purpose of helping enterprise users make better business decisions.
The term implies having a comprehensive knowledge of all of the factors that affect your business. It is imperative that you have an in depth knowledge about factors such as your customers, competitors, business partners, economic environment, and internal operations to make effective and good quality business decisions.
Business intelligence enables you to make these kinds of decisions.
Reference: http://zlin.ba.ttu.edu/6347/ISQS6347.htm
10
Business Intelligence (restate)
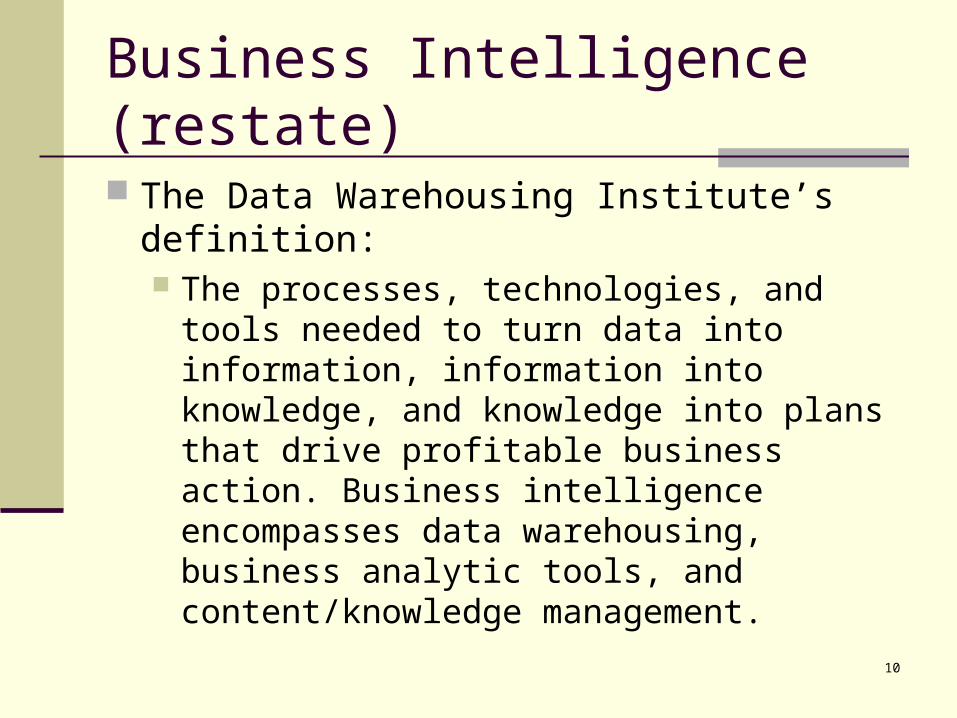
The Data Warehousing Institute’s definition: The processes, technologies, and tools
needed to turn data into information, information into knowledge, and knowledge into plans that drive profitable business action. Business intelligence encompasses data warehousing, business analytic tools, and content/knowledge management.
11
Benefits for MBA Students in Business Intelligence Understand the growing trend of demand in data
mining from industry Know the general concepts and ideas in data
analysis Be able to manage data mining projects for
businesses Understand what technical people are doing Understand the outcomes from data mining projects Catch the advanced business concepts, business
processes and new working patterns

12
Sending Advertising Materials
100,000 customer Only 10% of them may be interested in life insurance Mailing an insurance advertising package costs $1
(material printing, stamp, processing, etc.) If someone purchases the insurance, the company
will make $4 net profit. So, if a letter results no purchase of the insurance package, the loss is $1.
Questions What is the total profit if sending the ad to all
customers? How to improve the efficiency of advertising and make
positive profits?
13
Data
What like of data we have now? Historical dataset. It shows previous life
insurance purchase history Customers’ profile dataset. It contains
customers’ properties and other information, except the information whether they will purchase the life insurance.

14
Case: Life Insurance Promotion
IncomeLife insurance
Credit card insurance Gender Age
40-50,000 No No Male 45
30-40,000 Yes Yes Female 40
40-50,000 No No Female 42
30-40,000 No Yes Male 43
50-60,000 Yes Yes Female 38
20-30,000 No No Female 55
30-40,000 Yes Yes Male 35
20-30,000 No No Male 27
30-40,000 No No Male 43
30-40,000 Yes No Female 41
15
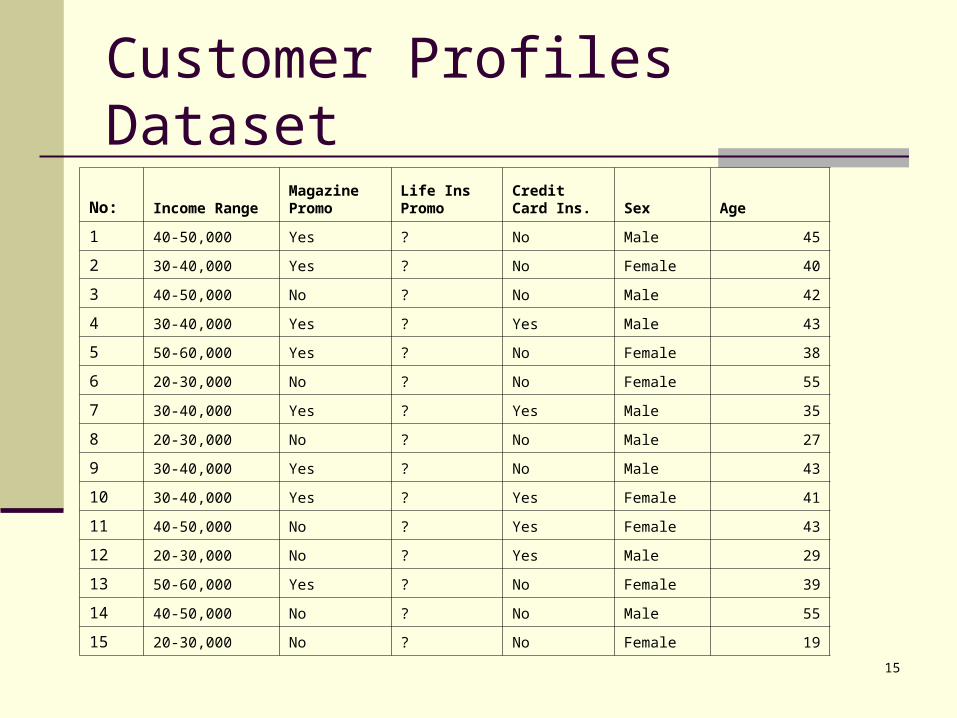
Customer Profiles Dataset
No: Income RangeMagazine Promo
Life Ins Promo
Credit Card Ins. Sex Age
1 40-50,000 Yes ? No Male 45
2 30-40,000 Yes ? No Female 40
3 40-50,000 No ? No Male 42
4 30-40,000 Yes ? Yes Male 43
5 50-60,000 Yes ? No Female 38
6 20-30,000 No ? No Female 55
7 30-40,000 Yes ? Yes Male 35
8 20-30,000 No ? No Male 27
9 30-40,000 Yes ? No Male 43
10 30-40,000 Yes ? Yes Female 41
11 40-50,000 No ? Yes Female 43
12 20-30,000 No ? Yes Male 29
13 50-60,000 Yes ? No Female 39
14 40-50,000 No ? No Male 55
15 20-30,000 No ? No Female 19
16
Performance Analysis
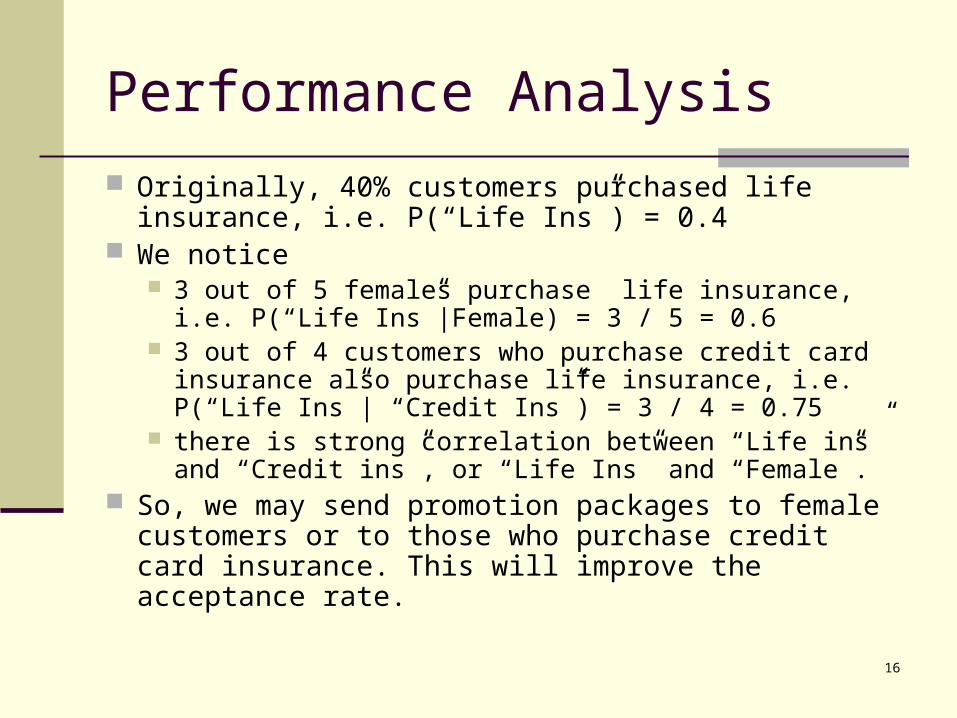
Originally, 40% customers purchased life insurance, i.e. P(“Life Ins”) = 0.4
We notice 3 out of 5 females purchase life insurance, i.e. P(“Life
Ins”|Female) = 3 / 5 = 0.6 3 out of 4 customers who purchase credit card
insurance also purchase life insurance, i.e. P(“Life Ins”| “Credit Ins”) = 3 / 4 = 0.75
there is strong correlation between “Life ins” and “Credit ins”, or “Life Ins” and “Female”.
So, we may send promotion packages to female customers or to those who purchase credit card insurance. This will improve the acceptance rate.

17
Definitions If we send the life insurance promotion package to female
customers, the acceptance rate is 0.6, which is called accuracy rate.
As the strategy will likely improve the acceptance rate from original 0.4 (based on all customers) to 0.6. The ratio of them, 0.6 / 0.4 = 1.5, is called Lift. A lift value greater than 1 indicates the improvement.
However, we can see that one of the customers who also purchases life insurance is a male. He will be excluded from the promotion mailing list. Therefore, using the rule “female” only covers 3 out of 4 customers who purchase life insurance. The ratio “# of included targets” / “# of all target”, i.e. 3 / 4 = 0.75 in this case, is called Coverage rate.
A coverage rate less than 1 implies some valuable customers are lost.
To improve the accuracy of decision-making, we may apply more than one criterion, e.g. “Female” plus “Credit Ins”.

18
Performance Evaluation (Rule: “Female”) Using a Confusion Matrix
ActualAccept
ActualReject
Computed Accept
Computed Reject
True or 13
True or 14
False or 02
False or 01
5Accuracy = 3 / (2+3)
=0.6
5
Coverage= 3 / (3 + 1)= 0.75
19
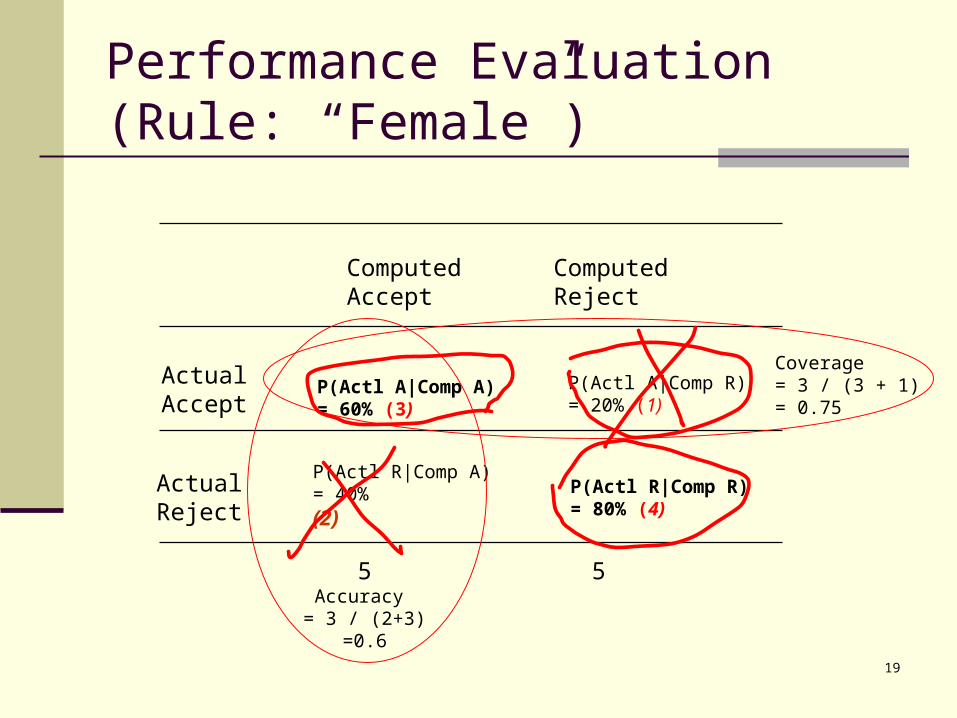
Performance Evaluation (Rule: “Female”)
ActualAccept
ActualReject
Computed Accept
Computed Reject
P(Actl A|Comp A)= 60% (3)
P(Actl R|Comp R)= 80% (4)
P(Actl R|Comp A)= 40%(2)
P(Actl A|Comp R)= 20% (1)
5Accuracy = 3 / (2+3)
=0.6
5
Coverage= 3 / (3 + 1)= 0.75

20
Decision Tree (1)
Total: 10Accept: 4Reject: 6
Accuracy: 40%Coverage: 100%
Gender
Female
Male
Total: 5Accept: 3Reject: 2
Accuracy: 60%Coverage: 75%
Total: 5Accept: 1Reject: 4
Accuracy: 20%Coverage: 25%
Credit CardInsurance
Yes
No
Total: 2Accept: 2Reject: 0
Accuracy: 100%Coverage: 50%
Total: 3Accept: 1Reject: 2
Accuracy: 33.3%Coverage: 25%
21
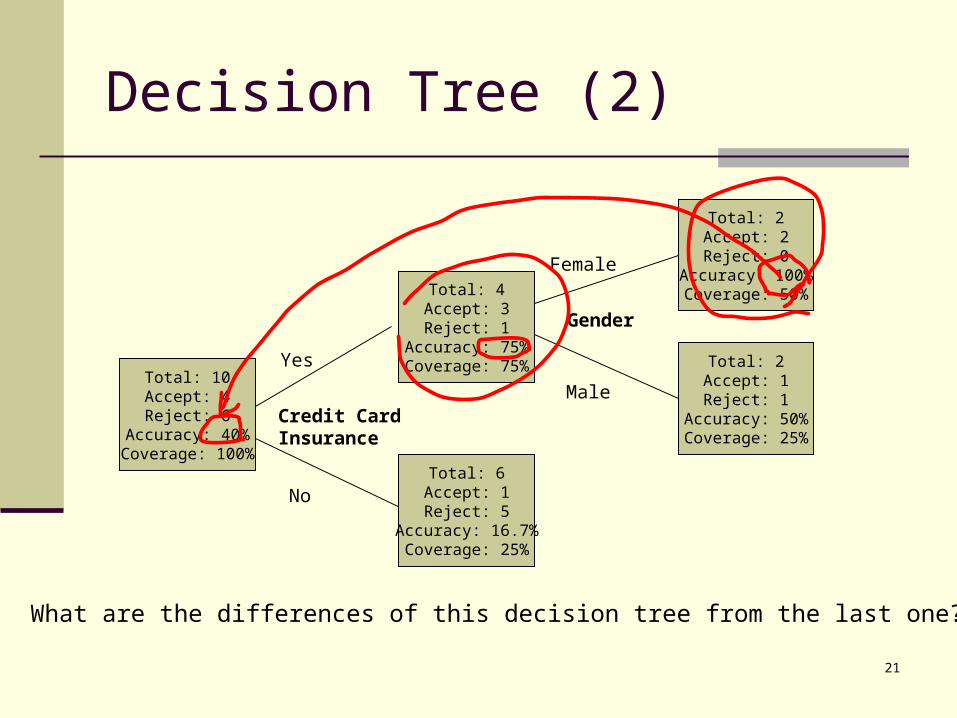
Decision Tree (2)
Total: 10Accept: 4Reject: 6
Accuracy: 40%Coverage: 100%
Gender
Female
Male
Total: 4Accept: 3Reject: 1
Accuracy: 75%Coverage: 75%
Total: 6Accept: 1Reject: 5
Accuracy: 16.7%Coverage: 25%
Credit CardInsurance
Yes
No
Total: 2Accept: 2Reject: 0
Accuracy: 100%Coverage: 50%
Total: 2Accept: 1Reject: 1
Accuracy: 50%Coverage: 25%
What are the differences of this decision tree from the last one?
22
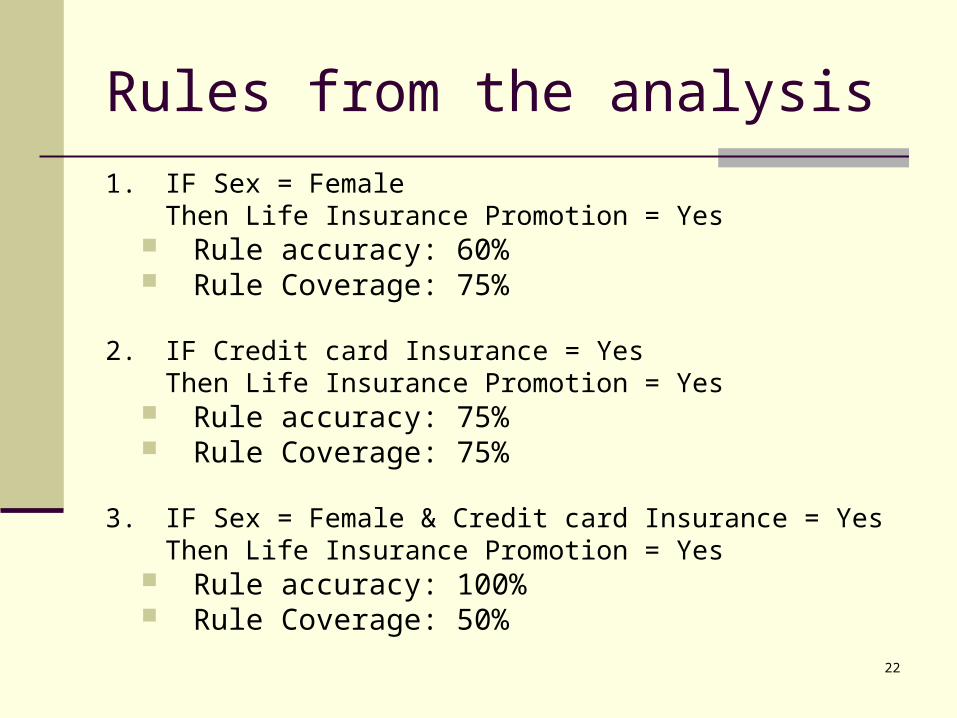
Rules from the analysis
1. IF Sex = FemaleThen Life Insurance Promotion = Yes
Rule accuracy: 60% Rule Coverage: 75%
2. IF Credit card Insurance = YesThen Life Insurance Promotion = Yes
Rule accuracy: 75% Rule Coverage: 75%
3. IF Sex = Female & Credit card Insurance = YesThen Life Insurance Promotion = Yes
Rule accuracy: 100% Rule Coverage: 50%
23
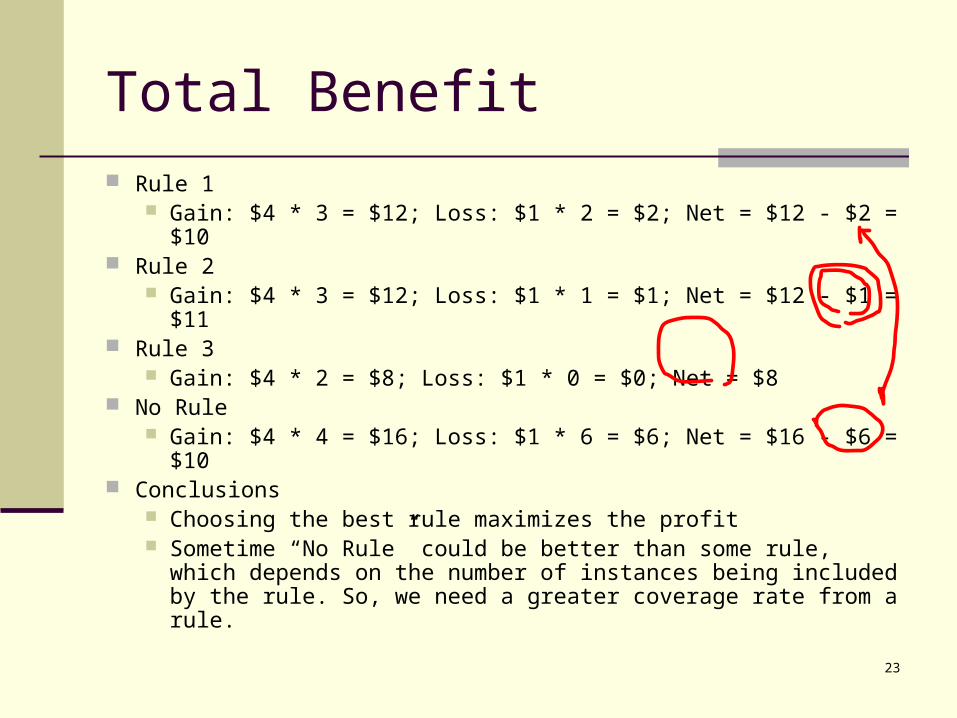
Total Benefit
Rule 1 Gain: $4 * 3 = $12; Loss: $1 * 2 = $2; Net = $12 - $2 = $10
Rule 2 Gain: $4 * 3 = $12; Loss: $1 * 1 = $1; Net = $12 - $1 = $11
Rule 3 Gain: $4 * 2 = $8; Loss: $1 * 0 = $0; Net = $8
No Rule Gain: $4 * 4 = $16; Loss: $1 * 6 = $6; Net = $16 - $6 = $10
Conclusions Choosing the best rule maximizes the profit Sometime “No Rule” could be better than some rule, which
depends on the number of instances being included by the rule. So, we need a greater coverage rate from a rule.
24
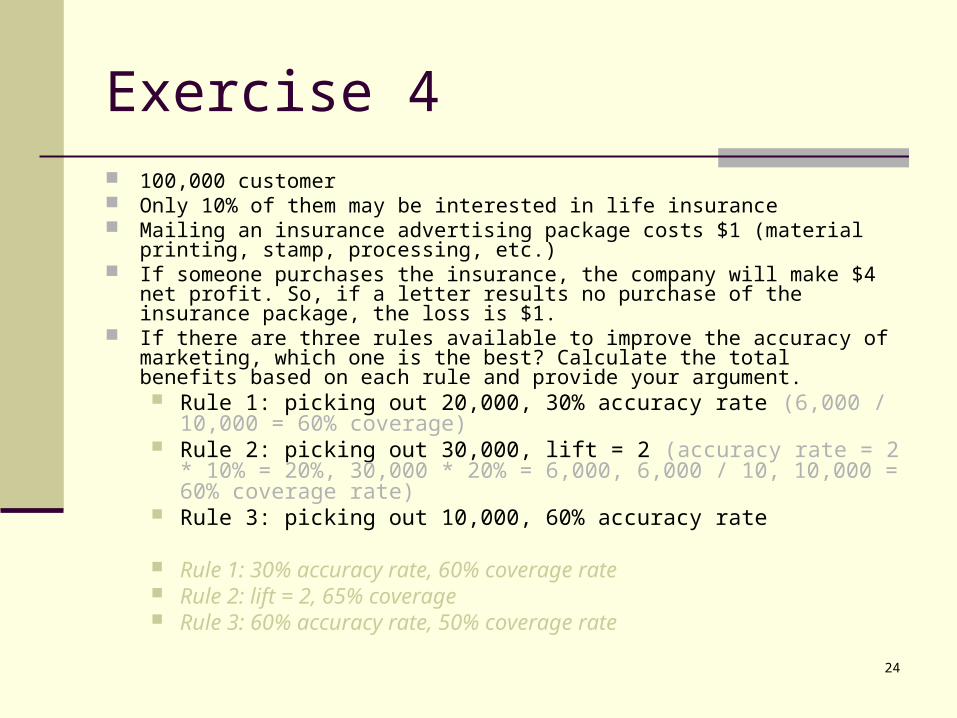
Exercise 4 100,000 customer Only 10% of them may be interested in life insurance Mailing an insurance advertising package costs $1 (material printing, stamp,
processing, etc.) If someone purchases the insurance, the company will make $4 net profit. So, if
a letter results no purchase of the insurance package, the loss is $1. If there are three rules available to improve the accuracy of marketing, which
one is the best? Calculate the total benefits based on each rule and provide your argument. Rule 1: picking out 20,000, 30% accuracy rate (6,000 / 10,000 = 60%
coverage) Rule 2: picking out 30,000, lift = 2 (accuracy rate = 2 * 10% = 20%,
30,000 * 20% = 6,000, 6,000 / 10, 10,000 = 60% coverage rate) Rule 3: picking out 10,000, 60% accuracy rate
Rule 1: 30% accuracy rate, 60% coverage rate Rule 2: lift = 2, 65% coverage Rule 3: 60% accuracy rate, 50% coverage rate
25
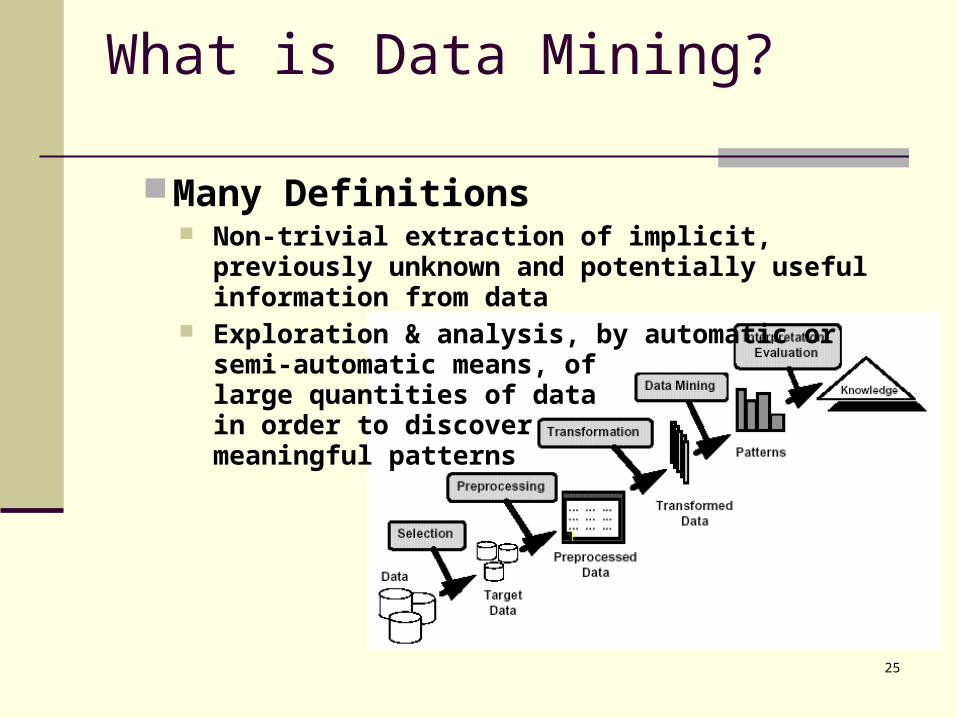
What is Data Mining?
Many Definitions Non-trivial extraction of implicit, previously unknown
and potentially useful information from data Exploration & analysis, by automatic or
semi-automatic means, of large quantities of data in order to discover meaningful patterns
26
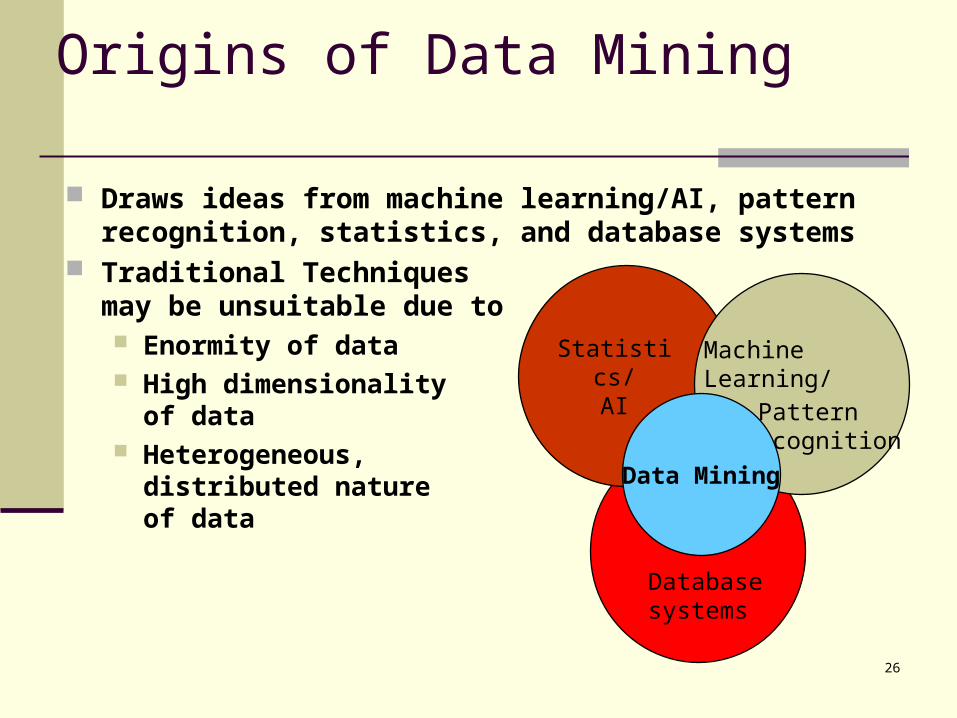
Draws ideas from machine learning/AI, pattern recognition, statistics, and database systems
Traditional Techniquesmay be unsuitable due to Enormity of data High dimensionality
of data Heterogeneous,
distributed nature of data
Origins of Data Mining
Machine Learning/Pattern
Recognition
Statistics/AI
Data Mining
Database systems
27
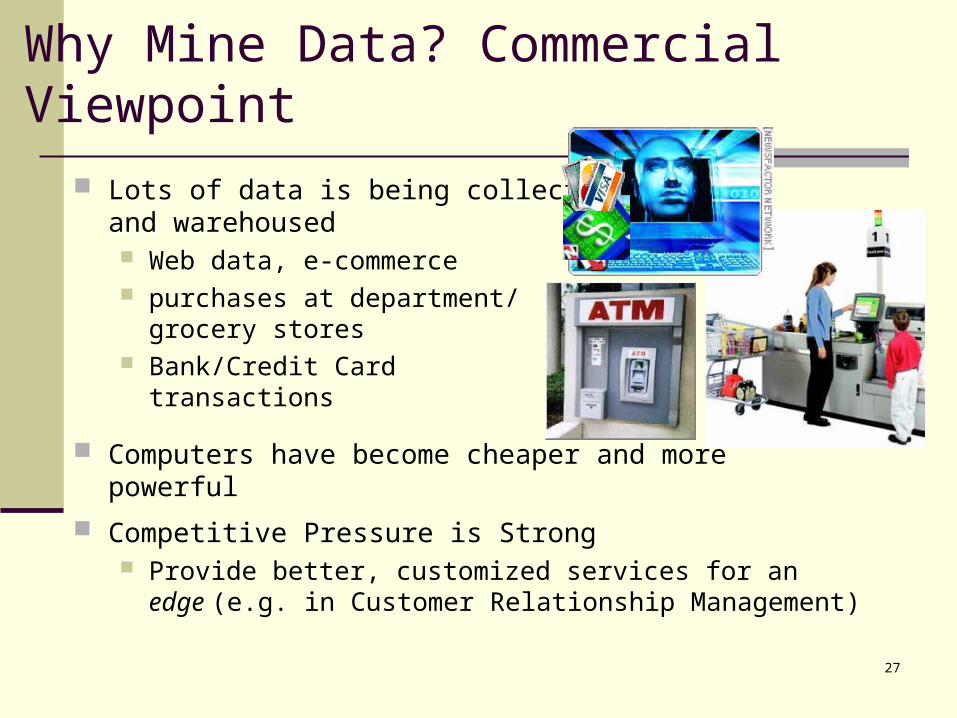
Lots of data is being collected and warehoused Web data, e-commerce purchases at department/
grocery stores Bank/Credit Card
transactions
Computers have become cheaper and more powerful
Competitive Pressure is Strong Provide better, customized services for an edge (e.g. in
Customer Relationship Management)
Why Mine Data? Commercial Viewpoint
28
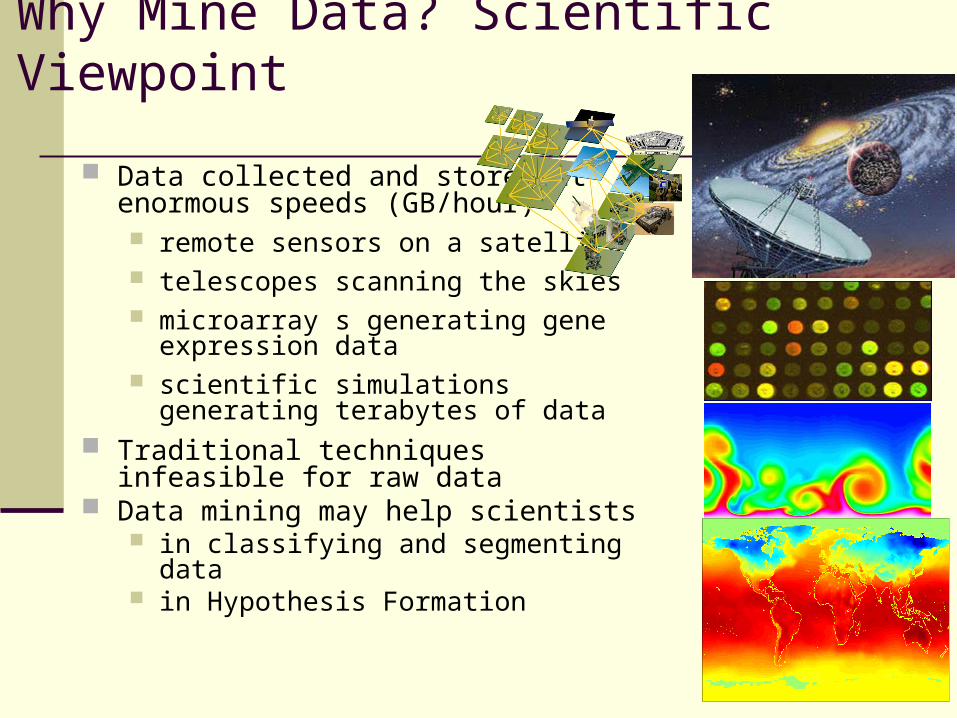
Why Mine Data? Scientific Viewpoint
Data collected and stored at enormous speeds (GB/hour) remote sensors on a satellite telescopes scanning the skies microarray s generating gene
expression data scientific simulations
generating terabytes of data Traditional techniques infeasible for raw
data Data mining may help scientists
in classifying and segmenting data in Hypothesis Formation
29
Data Mining Tasks
Prediction Methods Use some variables to predict unknown or
future values of other variables.
Description Methods Find human-interpretable patterns that
describe the data.
From [Fayyad, et.al.] Advances in Knowledge Discovery and Data Mining, 1996
30
Data Mining Tasks...
Classification [Predictive]
Clustering [Descriptive]
Association Rule Discovery [Descriptive]
Sequential Pattern Discovery [Descriptive]
Regression [Predictive]
Deviation Detection [Predictive]
31
Using Data Mining Tools
Statistics Analysis System (http://www.sas.org) “SAS®9 is the most recent release of SAS. It delivers analytical, data manipulation and reporting capabilities within a completely new framework. ”
SPSS (http://www.spss.com) “SPSS customers include telecommunications, banking, finance, insurance, healthcare, manufacturing, retail, consumer packaged goods, higher education, government, and market research. ”
Weka, an open source software product (http://www.cs.waikato.ac.nz/ml/weka/ )
Microsoft SQL Server comes with major data mining utilities
There are more.
32
SAS Data Mining Examples
Credit Promotion Dataset CreditProm
German Credit Data Online SAS materials (View PDF (2.24MB))
P70, dataset description P71, decision matrix

33
Life Insurance Promotion Data (more detailed)
No: Income RangeMagazine Promo
Life Ins Promo
Credit Card Ins. Sex Age
1 40-50,000 Yes No No Male 45
2 30-40,000 Yes Yes No Female 40
3 40-50,000 No No No Male 42
4 30-40,000 Yes No Yes Male 43
5 50-60,000 Yes Yes No Female 38
6 20-30,000 No No No Female 55
7 30-40,000 Yes Yes Yes Male 35
8 20-30,000 No No No Male 27
9 30-40,000 Yes No No Male 43
10 30-40,000 Yes Yes Yes Female 41
11 40-50,000 No Yes Yes Female 43
12 20-30,000 No Yes Yes Male 29
13 50-60,000 Yes Yes No Female 39
14 40-50,000 No No No Male 55
15 20-30,000 No No No Female 19
Recommended