7/28/2019 1xEVDO Perf Expect v5
http://slidepdf.com/reader/full/1xevdo-perf-expect-v5 1/37
Lucent Technologies – ProprietaryUse Pursuant to Company Instructions
1
1xEV-DO Performance Expectations
Version 5.0
Document Owner: Rajnish Sinha
September 27, 2005
7/28/2019 1xEVDO Perf Expect v5
http://slidepdf.com/reader/full/1xevdo-perf-expect-v5 2/37
Lucent Technologies – ProprietaryUse Pursuant to Company Instructions
2
Glossary
AT Access TerminalAN Access NetworkAWGN Additive White Gaussian NoiseBSC Base Station Controller
BS Base StationFL Forward LinkFMS Flexent Mobility ServerFTP File Transfer ProtocolHM Hybrid ModeICMP Internet Control Message ProtocolMIP Mobile Internet ProtocolRL Reverse LinkRLP Radio Link ProtocolRNC Radio Network ControllerRTT Round Trip TimeSCI Slot Cycle Index
SIP Simple Internet ProtocolSM Service MeasurementTCP Transport Control ProtocolUDP User Datagram ProtocolVPN Virtual Private NetworkWINDS Wireless IP Network Data Source

7/28/2019 1xEVDO Perf Expect v5
http://slidepdf.com/reader/full/1xevdo-perf-expect-v5 3/37
Lucent Technologies – ProprietaryUse Pursuant to Company Instructions
3
TABLE OF CONTENTS
1 INTRODUCTION.................................................................................................................... 4
1.1 ACKNOWLEDGMENTS ........................................................................................................................5
2 PRELIMINARIES...................................................................................................................6
2.1 DATA APPLICATIONS .........................................................................................................................6
2.1.1 FTP and HTTP Applications (TCP Protocol) .......... .......... ........... .......... ........... .......... ........... ..6
2.1.2 UDP Applications (WINDS and Flow-Control WINDS)........ .......... ........... .......... ........... ......... 7
2.1.3 The Ping Application.................................................................................................................8
2.2 TERMINAL LIMITATIONS....................................................................................................................8
2.2.1 Chip-Set Limitations..................................................................................................................8
2.2.2 Design Limitations ....................................................................................................................8
2.3 IMPACT OF HYBRID-MODE ON 1XEV-DO THROUGHPUT...................................................................8
2.3.1 Impact on FL Throughput .........................................................................................................8
2.3.2 Impact on RL Throughput .........................................................................................................9
2.4 IMPACT OF MOBILE-IP ON 1XEV-DO THROUGHPUT.........................................................................92.5 BACKBONE NETWORK DELAYS .......................................................................................................10
2.6 BACKHAUL CONFIGURATION...........................................................................................................10
2.7 VPN.................................................................................................................................................10
3 PERFORMANCE EXPECTATIONS FOR DIFFERENT SCENARIOS........................12
3.1 SCENARIO 1: BASELINE END-TO-END CONTROLLED TEST SCENARIO .............................................13
3.1.1 Test Conditions .......................................................................................................................13
3.1.2 Applicable Performance Metrics.............. .......... ........... .......... ........... .......... ........... .......... ......15
3.1.3 Performance Expectations – Experimental without VPN........ ........... .......... ........... .......... ......17
3.1.4 Performance Expectations – Experimental with VPN................. .......... ........... .......... ........... ..19
3.2 SCENARIO 2: CONTROLLED OPTIMIZATION TEST SCENARIO............................................................20
3.2.1 Test Conditions .......................................................................................................................20
3.2.2 Applicable Performance Metrics.............. .......... ........... .......... ........... .......... ........... .......... ......213.2.3 Performance Expectations ......................................................................................................22
3.3 SCENARIO 3: COMMERCIALLY DEPLOYED SYSTEM – CONTROLLED TEST SCENARIO......................24
3.3.1 Test Conditions .......................................................................................................................24
3.3.2 Applicable Performance Metrics.............. .......... ........... .......... ........... .......... ........... .......... ......25
3.3.3 Performance Expectations ......................................................................................................26
3.4 SCENARIO 4: COMMERCIALLY DEPLOYED SYSTEM – UNCONTROLLED TEST SCENARIO .................30
3.4.1 Test Conditions .......................................................................................................................30
3.4.2 Applicable Performance Metrics.............. .......... ........... .......... ........... .......... ........... .......... ......32
3.4.3 Performance Expectations ......................................................................................................33
3.5 SCENARIO 5: SERVICE MEASUREMENTS - COMMERCIALLY DEPLOYED SYSTEM .............................34
4 APPENDIX.............................................................................................................................35
4.1 IMPACT OF PACKET DELAY /DROP ON TCP-BASED APPLICATIONS ..................................................35
4.2 RL TRANSITION PROBABILITIES ......................................................................................................36
4.3 WINDS SETTINGS ...........................................................................................................................36
4.4 EC /IO-SINR MAPPING.....................................................................................................................37
5 REFERENCES....................................................................................................................... 37
7/28/2019 1xEVDO Perf Expect v5
http://slidepdf.com/reader/full/1xevdo-perf-expect-v5 4/37
Lucent Technologies – ProprietaryUse Pursuant to Company Instructions
4
1 Introduction
As 1xEV-DO is deployed in different environments, the level of performance experienced by the
end user varies. In some situations, the performance falls within the expected range, while in other
situations, basic configuration issues may cause it to fall outside the range. The increased
complexity of 1xEV-DO networks makes it difficult to compare the measured performance withthe expected performance in order to identify problems, isolate performance issues, or resolve
performance issues. The experience of an end-user in a 1xEV-DO system is influenced by a
number of factors in a complex and inter-related manner. These factors include but are not limited
to:
• RF environment including fading, loading, and handoff rate
• User device including chip set and type of device
• Client configuration
• Network configuration
• Measurement tools and measurement points
• File types and compression types
• Usage patterns
• Algorithm implementation
• Traffic engineering
• Applications
• Non-RF and RF resource availability
The purpose of this document is to define the range of expected performance for a variety of
“typical” scenarios encountered in commercial networks. We present the results of experimental
approaches to define the performance expectations. This version of the document baselines the
performance of the 1xEV-DO system as obtained on Release 23.
This document is intended for Lucent personnel to use to assess the performance of a particularcustomer network. We anticipate that this information can be applied proactively to scenarios
where Lucent personnel are auditing the health of the 1xEV-DO network or applied reactively to
assess the severity of perceived performance problems. A customer version of this document will
also be made available.
The nature of the 1xEV-DO implementation necessitates that this document be a “living”
document that is regularly updated to incorporate the latest view of the 1xEV-DO performance
expectations. Over time, a number of factors will likely influence the expected 1xEV-DO
performance. These factors include:
• Infrastructure enhancements• Changes in deployment guidelines including but not limited to translation
recommendations, client configuration recommendations, and network configuration recommendations
• Evolution and enhancement of access terminal technology
• Improved understanding of performance gained with an increased proliferation of commercial 1xEV-DO systems
• Better understanding of typical usage scenarios
7/28/2019 1xEVDO Perf Expect v5
http://slidepdf.com/reader/full/1xevdo-perf-expect-v5 5/37
Lucent Technologies – ProprietaryUse Pursuant to Company Instructions
5
In this document, we neither estimate the performance impact of upcoming technology
enhancements nor provide expectations for performance metrics (e.g. service measurements) that
are not available in a generally available product. Since it is not possible to experimentally verify
all of the performance metrics in a commercial environment and provide timely updates, we
estimate certain metrics based on previous laboratory and field experience.
1.1 Acknowledgments
This document represents the joint effort of many individuals. Content providers for the current
document include Rooby Jeune and Xin Wang. The test-planning and execution effort was
supported by Neil Bernstein, Guang Li, Ahmed Tarraf, Mathew Thomas, Vladan Jovanovic, Amit
Shah, Balaji Raghavachari, William Hsieh, Pragnesh Shah, and Matthew D. Callander. Technical
field support was provided by Jitendra V. Patel and Mamun Abdullah.
7/28/2019 1xEVDO Perf Expect v5
http://slidepdf.com/reader/full/1xevdo-perf-expect-v5 6/37
Lucent Technologies – ProprietaryUse Pursuant to Company Instructions
6
2 Preliminaries
2.1 Data Applications
Under exactly the same conditions in the 1x-EVDO network, different applications would give
different throughput performance results. Applications used for performance testing are chosen toreflect not only the variety of possible performance ranges, but also typical user behavior.
Two of the most widely used applications in the Internet world seem to be FTP and HTTP (filedownload and Web browsing), and they are most widely used for performance expectations testing
throughout this document as well. Both of these use TCP (Transport Control Protocol) and some
constraints of the TCP protocol have to be understood first for correct execution of the tests and
interpretation of the results. The less widely used UDP (User Datagram Protocol) is also described
in this document. UDP is used by end-users mostly in some real-time applications. Although UDPis used less by real users, it is often preferred for characterizing the RF performance of the Lucent
deployed system due to its lower sensitivity to external delays and packet losses over the
operator’s backbone data network (Intranet, Internet, remote server characteristics, etc.).
2.1.1 FTP and HTTP Applications (TCP Protocol)
FTP and HTTP use TCP, which is an interactive protocol that relies on reception of positive
acknowledgments at the server side to ensure proper ordering and reliable delivery of packets on
the client side. At any given time, the server can send a maximum of W bytes before receiving an
acknowledgment (W being the maximum TCP window size). If we let D (in seconds) denote theround-trip-time (time required for a server packet to reach the client and an acknowledgment to
come back to the server), then the maximum throughput B that can be obtained using TCP can be
calculated as follows:
D
W B = (1)
The product B*D is known as the Bandwidth-Delay-Product (BDP) [5]. For 1xEV-DO systems,assuming B=2.4 Mbps and D=110 msecs, B*D ~ 32 kbytes. The maximum TCP window size is
typically set to twice the BDP to reduce the impact of packet losses. Hence, the recommended
TCP window size for 1xEV-DO systems is 64 kbytes1.
Packet drops have a larger impact on FTP throughput than on HTTP, whereas network delays
impact HTTP performance more than FTP. The combined effect of packet losses and larger
network delays can often be disastrous for any TCP-based application. The impact of delays and
packet drops on the throughput of TCP-based applications is highly non-linear, and is illustratedthrough examples in Appendix 4.1. Based on these results, to obtain close to optimum TCP
performance in 1xEV-DO systems, packet drops should be kept below 0.05% and additional
network delays should be kept as small as possible. Present experience from real networks
suggests that these requirements are not always met, and one of the reasons for the different
Scenarios in this document is to account for various levels of uncertainty regarding the entirebackbone network.
For an FTP application, TCP uses bulk data flow to transfer the file. This allows for a relatively
smooth (compared to HTTP) flow of data from the server to the client. For FTP throughput tests
1 Note that most laptops have a default TCP window size of less than 64k bytes and they must be
reconfigured with the right value to perform efficiently on 1xEV-DO systems
7/28/2019 1xEVDO Perf Expect v5
http://slidepdf.com/reader/full/1xevdo-perf-expect-v5 7/37
Lucent Technologies – ProprietaryUse Pursuant to Company Instructions
7
over 1xEV-DO, typically files of size 5 MB and 0.5 MB are used for transfers on the forward and
reverse links, respectively. The FTP test is executed from the DOS prompt and the throughput
reported at the end of the transfer is noted. The test is repeated multiple times and finally the
average FTP application-layer throughput is calculated.
Average application layer throughput calculations can yield different results depending upon the
way the averaging is done. For example, consider FTP downloads of a 1 Mbits file. Let us assumethat this file is downloaded three times and that the first two transfers occur at 1 Mbps whereas the
third occurs at 0.5 Mbps due to poorer RF conditions. Note that since the file size is the same inthe three cases, the first two transfers will take 1 sec each, whereas the third one would take 2 secs.
A straight average would yield an average throughput of (1+1+0.5)/3 = 0.83 Mbps, whereas a
weighted average obtained by dividing total bits with total time would yield (1+1+1)/(1+1+2) =
0.75 Mbps. The weighted average yields more realistic numbers especially for comparison with
RLP and Physical layer throughputs. However, since the straight average method is the most
common, all FTP and HTTP average throughput numbers in this report are based on this method.
Web transactions carried over HTTP running on top of TCP account for the majority of traffic on
the Internet. Web transactions are typically bursty in nature compared to FTP traffic. In this report,
for the HTTP applications, both Application throughput and IP throughput are reported.
Application throughput is calculated as total size of the downloaded page in bits divided by totaltransaction time in seconds. The IP throughput is calculated at the IP layer and includes overheads
due to the HTTP, TCP and IP protocols. Therefore, although the transaction time is the same forthe two cases, the amount of data transferred is higher in the second case. This results in the IP
throughput being higher than the Application throughput.
It is important to note that when PPP Software Compression is turned ON, the following
relationship between the throughputs at different layers applies. PPP Software Compression
compresses the PPP payload at the PPP layer. Assume that the number of bytes passed from the IP
Layer to the PPP Layer is X Bytes. After compression, this number is reduced to a lower number
of bytes that we are going to denote as Y Bytes (where Y < X). The amount by which Y is less
than X is directly dependent on the nature of the payload and the traffic. However, in case of Web
browsing, the compression gain is usually significant (average gain is in the range of 25 - 40%).
This means that Y < X by a significant amount. Therefore, the number of bytes passed to the lower
layers (RLP and Physical) is now less than that seen at the IP layer. Hence, throughput seen at both
RLP and Physical layers in these cases will be lower than that of the IP Layer.
2.1.2 UDP Applications (WINDS and Flow-Control WINDS)
FTP applications are typically not a good candidate for demonstrating the peak throughput that can
be obtained using 1xEV-DO over the Lucent network. Since FTP is based on TCP, FTP
throughput is highly susceptible to packet drops. Packet drops outside of the Lucent network can
cause the TCP server to throttle its data rate, thereby leading to an under utilization of the 1xEV-
DO bandwidth offered by the Lucent network. As an alternative to FTP, an application based on a
best-effort protocol such as UDP is more suitable for purposes of optimization. An UDP-based
application known as WINDS (Wireless IP Network Data Source) has been developed by Lucentfor optimization purposes. The WINDS tool constantly serves data at the requested rate without
throttling the rate in response to any packet drops. Although this achieves the desired effect for
purposes of optimization, at times, this could lead to buffer overflows in routers. To circumvent
this problem, FC-WINDS (Flow-Controlled WINDS) was developed. FC-WINDS throttles the
served data rate just enough to match the available bandwidth of the network. FC-WINDS doesnot have any slow-start or a congestion-avoidance type mechanism present in TCP and it does not

7/28/2019 1xEVDO Perf Expect v5
http://slidepdf.com/reader/full/1xevdo-perf-expect-v5 8/37
Lucent Technologies – ProprietaryUse Pursuant to Company Instructions
8
guarantee reliable delivery of packets. Consequently, with FC-WINDS, packet losses degrade the
application throughput in a linear fashion in contrast to FTP.
2.1.3 The Ping Application
The Ping application is used to determine whether another host on the network is reachable. ThePing application sends an ICMP echo request message to a host, expecting an ICMP reply to be
returned [5]. If the target host is reachable, the application reports the minimum, maximum, and
average RTT to the host along with the percentage of packet drops at the end of a run. Since the
application is available on most hosts, it serves as a powerful diagnostic tool to assess the quality
of the link to a host.
2.2 Terminal Limitations
2.2.1 Chip-Set Limitations
The access terminals used for the tests belong to two generations of chip-sets: the MSM5500 and
the MSM6500. The Chester (test terminal) and the Airprime PCMCIA card (commercial terminal)
used for tests in this report are based on the MSM5500 chip-set. The LG VX8000 phone on the
other hand is based on the MSM6500 chip-set. Due to improvements in design, the MSM6500-based terminals yield improved performance over their MSM5500-based counterparts, especially
in Mobile-IP mode of operation as discussed in Section 2.4.
2.2.2 Design Limitations
The LG VX8000 only has a single receive-antenna as opposed to dual receive-antennas available
on the Chester and Airprime card. In typical fading RF scenarios, terminals with dual receive-
antennas yield an improvement in performance over terminals with single receive-antennas due to
the advantages of diversity reception.
2.3 Impact of Hybrid-Mode on 1xEV-DO Throughput
The impact of hybrid-mode on application performance is dependent on mobile implementation.
The MSM5500-based terminals experience a higher degradation in throughput performance
compared to the improved MSM6500-based terminals. The impact on both the chip-sets is
discussed in this section.
In hybrid-mode, the 1xEV-DO AT periodically tunes away to the 3G1x system to listen to 3G1xpage messages. A parameter known as the Slot-Cycle-Index (SCI), which has to be set both on the
3G1x network as well as on the AT, determines the frequency of the tune-away period. The lower
of the two SCI's is negotiated upon and used. The popular SCI values of 0, 1 and 2 correspond to
tune-away frequencies of 1.28, 2.56 and 5.12 secs, respectively. Depending upon the particular AT
model used, the minimum tune-away duration can typically vary between 150 and 300 msecs forthe MSM5500-based mobiles and between 65 and 150 msecs for the MSM6500-based mobiles. If
the AT engages in more activity on the 3G1x system (e.g. data transfer or voice call), then the
tune-away period can be longer.
2.3.1 Impact on FL Throughput
Assume average tune-away duration of 200 and 100 msecs for MSM5500 and MSM6500 based
mobiles, respectively. Under excellent RF conditions, the expected throughput degradation on the
FL for FTP/UDP based applications is shown in Table 1. The throughput degradation for HTTP-
based applications is expected to be 0-5% (for all SCI's) under ideal RF conditions.

7/28/2019 1xEVDO Perf Expect v5
http://slidepdf.com/reader/full/1xevdo-perf-expect-v5 9/37
Lucent Technologies – ProprietaryUse Pursuant to Company Instructions
9
Note: Even though the hybrid-mode operation degrades the FL throughput for a single user, it is
not expected to impact the overall sector throughput in a multi-user scenario as other users may be
scheduled for service while a particular user has tuned away to the 3G1x system.
Slot Cycle Index (SCI) FL Throughput Degradation
MSM5500 MSM6500
2 5-10% 3-5%1 10-15% 5-10%
0 20-25% 10-15%
Table 1: Impact of Hybrid-Mode on FL FTP/UDP throughput
2.3.2 Impact on RL Throughput
After a tune-away, an MSM5500-based AT starts its transmission from 9.6 kbps and can
potentially transition up through the RL rates of 19.2 kbps, 38.4 kbps and 76.8 kbps to finally
reach 153.6 kbps. Consider a RL FTP/UDP type application where the AT is constantly
transmitting data on the RL. Assume excellent RF conditions and a sector loading that will allow
the AT to sustain a RL rate of 153.6 kbps once the AT transitions to that rate. Under these
conditions, a hybrid-mode AT will start at 9.6 kbps after a tune-away and then transition all theway up to 153.6 kbps and maintain the rate until the next tune-away. This periodic transitioning
from 9.6 kbps to 153.6 kbps after each tune-away degrades RL throughput significantly. For a
sample set of Rate Transition Probabilities shown in the appendix in Table 19 and a tune-away
period of 200 msecs, the expected impact on RL throughput is as shown in Table 2.
Most of the MSM6500-based terminals on the other hand tune away for an average of 100 msecs
and start their transmission straight at 38.4 kbps after a tune-away. This reduces the throughput
degradation (especially at the lower SCI's) as shown in Table 2.
Slot Cycle Index (SCI) RL Throughput Degradation
MSM5500 MSM6500
2 5-10% 5-10%
1 15-20% 10-15%
0 30-35% 25-30%
Table 2: Impact of HM on RL FTP/UDP throughput (based on transition probabilities in Table 19)
2.4 Impact of Mobile-IP on 1xEV-DO Throughput
The MSM5500-based mobiles also have limitations in their Mobile-IP (MIP) implementations
compared to the improved MSM6500-based terminals.
As opposed to Simple-IP (SIP), in the network mode in MIP, an MSM5500-based AT experiences
additional latency. This causes the FL delay to increase to about 275 msecs (the RL delay remains
at around 100 msecs) resulting in a total RTT of 375 msecs. Substituting W = 64 kbytes and D =RTT = 375 msecs in Equation (1) yields a maximum TCP throughput B_MIP = 1330 kbps for an
MSM5500-based AT in Mobile-IP. Therefore, for an MSM5500-based terminal, operation inMobile-IP mode can cause a degradation in throughput if the DRCs requested by the terminal are
above B_MIP = 1330 kbps (1.8 or 2.4 Mbps) and the backhaul has sufficient capacity to support
these high rates.
7/28/2019 1xEVDO Perf Expect v5
http://slidepdf.com/reader/full/1xevdo-perf-expect-v5 10/37
Lucent Technologies – ProprietaryUse Pursuant to Company Instructions
10
Note: Even though the current implementation of MIP in the MSM5500 chip limits the achievable
FL throughput for a single user under stationary conditions, it is important to note that:
• in a multi-user scenario, the aggregate sector throughput is minimally impacted as other users
are served during the idle slots of a particular user
• under driving conditions, since the average DRC requested by the mobile is expected to be less
than B_MIP (1330 kbps), the current MIP limitation may only marginally impact the FLthroughput of a user
The MSM6500-based terminals have an improved design and do not show any degradation in
throughput while in the Mobile-IP mode of operation.
2.5 Backbone Network Delays
Due to the unpredictable nature of traffic on the Internet, the delay to a data server located on the
Internet can be high and variable. This can both lower the throughput of applications as well as
make it highly variable. Hence, throughput statistics obtained from tests run on the Internet are not
the best metrics for evaluating the full capabilities of the Lucent 1xEV-DO system. Instead, these
tests should be conducted on a link with the minimum possible delay. In practice, this is achievedby using a data server connected as close to the PDSN as possible.
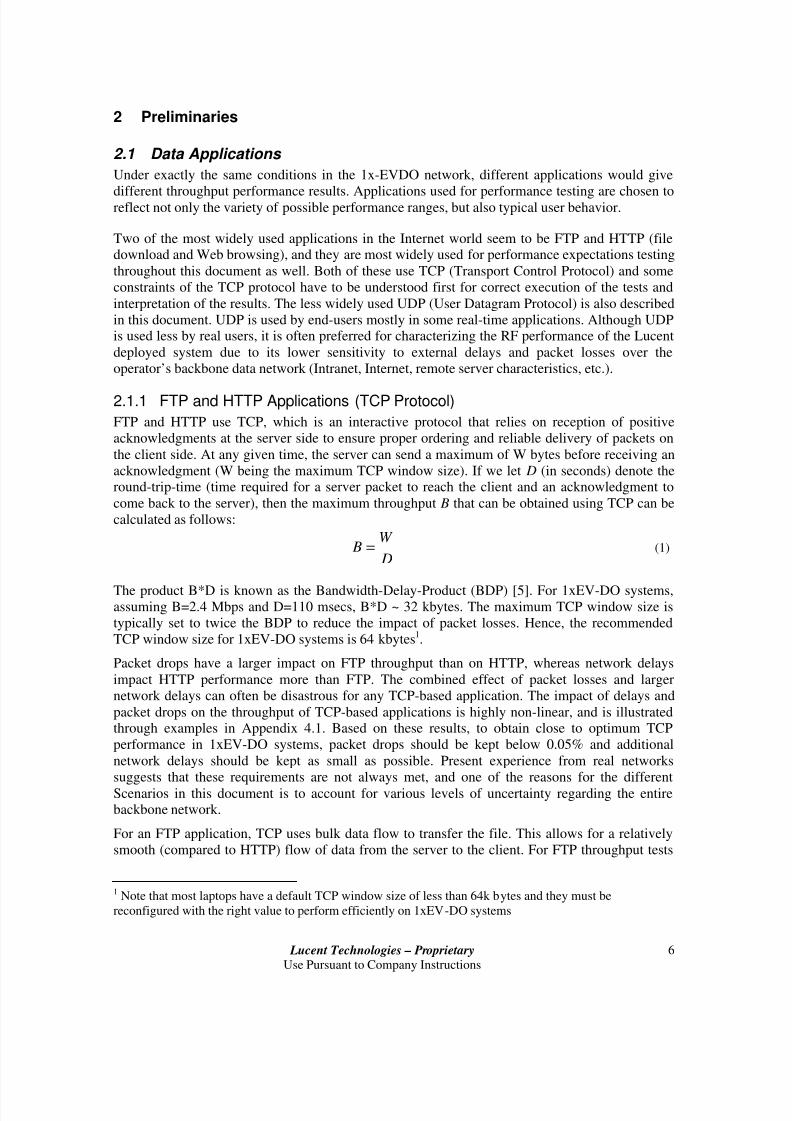
2.6 Backhaul Configuration
The physical link between the Base-Station (BS) and the Base-Station Controller (BSC) is known
as the backhaul. As shown in Figure 1, the most common current implementation in a Lucent
1xEV-DO system comprises of T1 (or E1) lines between the BS and an intermediate router and an
Ethernet connection from there to the BSC. Note that this is only one of several configurations
possible and the cellular operator may choose to implement the backhaul differently. It is
important to note that since the 1xEV-DO system is capable of serving throughputs close to the
peak value of 2.4 Mbps per sector, in order to achieve these high rates, the backhaul must have a
capacity greater than 2.4 Mbps per sector. As an example, in the case of a T1 backhaul, since thecapacity of a single T1 line is 1.5 Mbps, two T1 lines are required per sector to achieve forward-
link sector throughputs close to the peak value of 2.4 Mbps.
2.7 VPN
A VPN (Virtual Private Network) allows a user to access his/her corporate network from
anywhere on the Internet. A client application is used to establish a VPN tunnel from the remote
computer to the VPN gateway on the corporate network as shown in Figure 1. In this document,
tests over VPN were conducted using a Lucent IPSec client application. Data transmitted over a
VPN is encrypted to protect against unauthorized access. The additional overhead and processing
associated with the encryption and transmission of data over VPN impacts the throughput of
applications.

7/28/2019 1xEVDO Perf Expect v5
http://slidepdf.com/reader/full/1xevdo-perf-expect-v5 11/37
Lucent Technologies – ProprietaryUse Pursuant to Company Instructions
11
BSApplicationLaptop
BSC
PDSN
FTP/HTTP
Server
VPNGateway
Firewall
VPN Tunnel
Firewall
Carrier Network
User’s E nterprise
Network
Bypass for
Non-VPN
Router
IP
Backbone
IP
Backbone
T1/E1
User
Figure 1: 1xEV-DO Network Architecture

7/28/2019 1xEVDO Perf Expect v5
http://slidepdf.com/reader/full/1xevdo-perf-expect-v5 12/37
Lucent Technologies – ProprietaryUse Pursuant to Company Instructions
12
3 Performance Expectations for Different Scenarios
This section discusses the performance expectations for five common scenarios that will be
encountered when attempting to characterize or troubleshoot 1xEV-DO performance.
Scenario 1: Baseline End-to-End Controlled Test Scenario: The purpose of this scenario is to
ensure that the maximum expected performance can be achieved under ideal conditions. All
variability (e.g. RF, network and traffic loading) is eliminated for this test scenario. This is the
most fundamental scenario. 1xEV-DO performance should always be tested and met for this
scenario prior to attempting other in-market performance measurements.
Scenario 2: Controlled Optimization Test Scenario: This scenario corresponds to a typical drivetest optimization exit criteria test. Performance expectations should be provided for both loaded
and unloaded situations. The data collection tools and procedures defined in [2] must be applied
when testing this scenario.
Scenario 3: Commercially Deployed System – Controlled Test Scenario: Under certain conditions,
the severity or complexity of a 1xEV-DO performance problem will require an in-market drive
team to characterize and troubleshoot performance. Typically, in these environments, the test teamwill attempt to control as many variables (e.g., server, data collection tools) as possible before
drive testing the commercial network. This scenario defines performance expectations for
stationary and drive test cases.
Scenario 4: Commercially Deployed System – Uncontrolled Test Scenario: While it is often
desirable to control as many aspects of the test as possible, it is not always possible to control all
key test conditions. One example is when the customer has independently collected data and is
reporting performance problems. This scenario defines performance expectations for stationaryand drive test cases.
Scenario 5: Service Measurements - Commercially Deployed System: With the proliferation of
1xEV-DO technology, remote monitoring and troubleshooting of performance will become
increasingly critical through the use of 1xEV-DO Service Measurement (SM) peg counts.
Although SM data is not currently available for R23, in future versions of this document, thisscenario will define the performance expectations for the SM peg counts as well.
This section defines the test conditions that apply to each particular scenario. We also define the
primary and secondary performance metrics that apply for these test conditions. The primary
metrics represent the key performance metrics that quantify whether the expected performance is
being achieved for the given scenario. The secondary metrics should be applied if the primaryperformance metrics indicate a need for further evaluation.
7/28/2019 1xEVDO Perf Expect v5
http://slidepdf.com/reader/full/1xevdo-perf-expect-v5 13/37
Lucent Technologies – ProprietaryUse Pursuant to Company Instructions
13
3.1 Scenario 1: Baseline End-to-End Controlled Test Scenario
Scenario 1 is the most controlled of the test scenarios. By imposing relatively stringent test
conditions, we attempt to minimize external factors that can influence end-to-end performance.
Constraining the test conditions allows the engineer to validate that the network infrastructure is
capable of repeatedly delivering the maximum achievable throughput. Scenario 1 shouldessentially be viewed as an entrance criterion for all other performance testing. Experience has
shown that failure to execute this test case prior to more complex testing and analysis often results
in failure to uncover relatively straightforward network or test equipment problems. This scenario
is similar to the sector-test phase of optimization.
3.1.1 Test Conditions
3.1.1.1 Test Description
This scenario requires in-market collection of data. The test is usually performed in a very good
RF location on an unloaded sector. At times, the test may be performed by directly cabling(closed-loop) to the sector under test to eliminate any RF variability.
3.1.1.2 Client Configuration
Minimum configuration (+ indicates “later version”):
• Platform: Windows 2000 with all the latest updates and service packs issued byMicrosoft
• Web Browser: Internet Explorer 6.0+, Netscape 7.0+
• TCP/IP and PPP settings: according to CDMA 1xEV Translation Application Note
#5 (see [3])
• WINDS 1.2+ (Lucent internal UDP generator)
• LDAT3G 3.4+ (Lucent internal data analysis tool)
• CAIT version 2.9+
• IPSec version 4.4.364+
• Tools: CommView suite 3.4+ (license may be required)
3.1.1.3 Server Configuration
Recommended Configuration:
• Platform: Machine running Windows 2000 Web server
• Server location: Preferably, a local server connected directly to the PDSN shouldbe used. If a local server is unavailable or inaccessible, select a server with a
packet drop rate lower than 0.05% (as recommended in [1]), and a round-trip-delayof 105-135 msecs (with a 32-byte ping; without any compression)
• Server contents: The server should have
• the five static test web pages listed in Table 3 needed to baseline the HTTPthroughput
7/28/2019 1xEVDO Perf Expect v5
http://slidepdf.com/reader/full/1xevdo-perf-expect-v5 14/37
Lucent Technologies – ProprietaryUse Pursuant to Company Instructions
14
• the FTP files described later in 0, which are needed to measure FTPthroughput
• the WINDS application running for UDP data generation
• either Windows NetMeeting or VNC2
running so that applications such asWINDS can be remotely configured
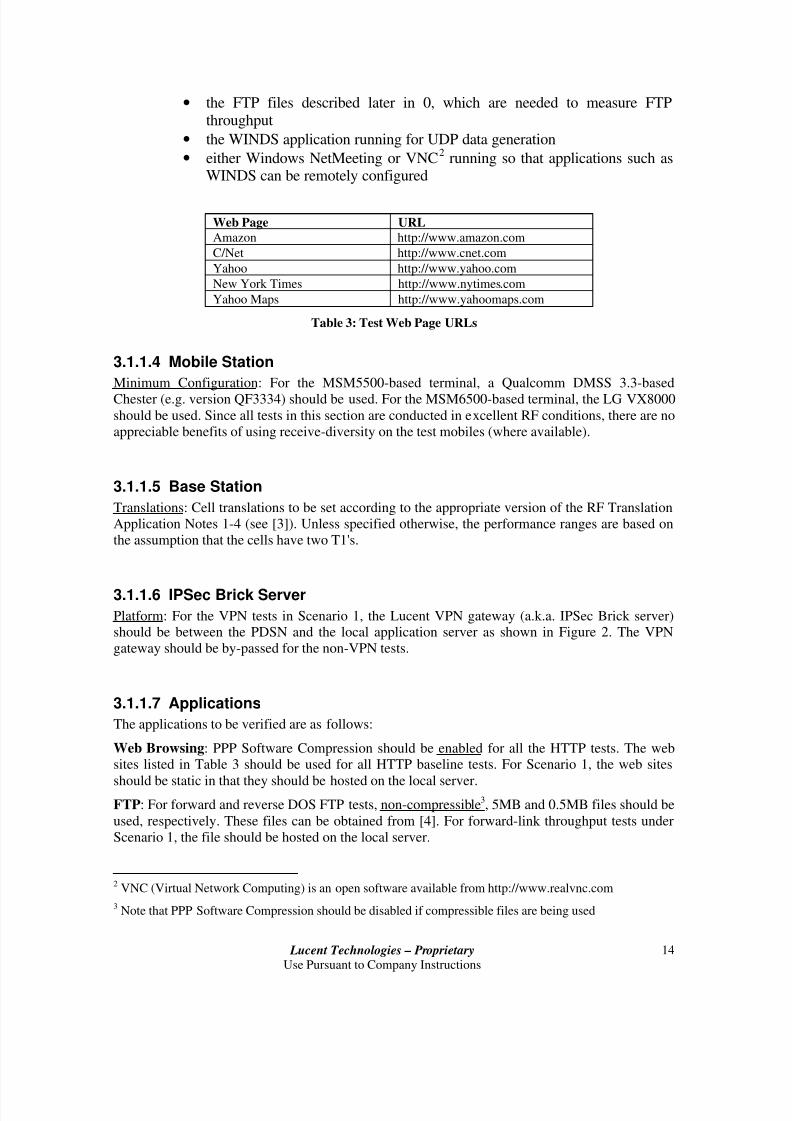
Web Page URL
Amazon http://www.amazon.com
C/Net http://www.cnet.com
Yahoo http://www.yahoo.com
New York Times http://www.nytimes.com
Yahoo Maps http://www.yahoomaps.com
Table 3: Test Web Page URLs
3.1.1.4 Mobile Station
Minimum Configuration: For the MSM5500-based terminal, a Qualcomm DMSS 3.3-based
Chester (e.g. version QF3334) should be used. For the MSM6500-based terminal, the LG VX8000
should be used. Since all tests in this section are conducted in excellent RF conditions, there are no
appreciable benefits of using receive-diversity on the test mobiles (where available).
3.1.1.5 Base Station
Translations: Cell translations to be set according to the appropriate version of the RF Translation
Application Notes 1-4 (see [3]). Unless specified otherwise, the performance ranges are based on
the assumption that the cells have two T1's.
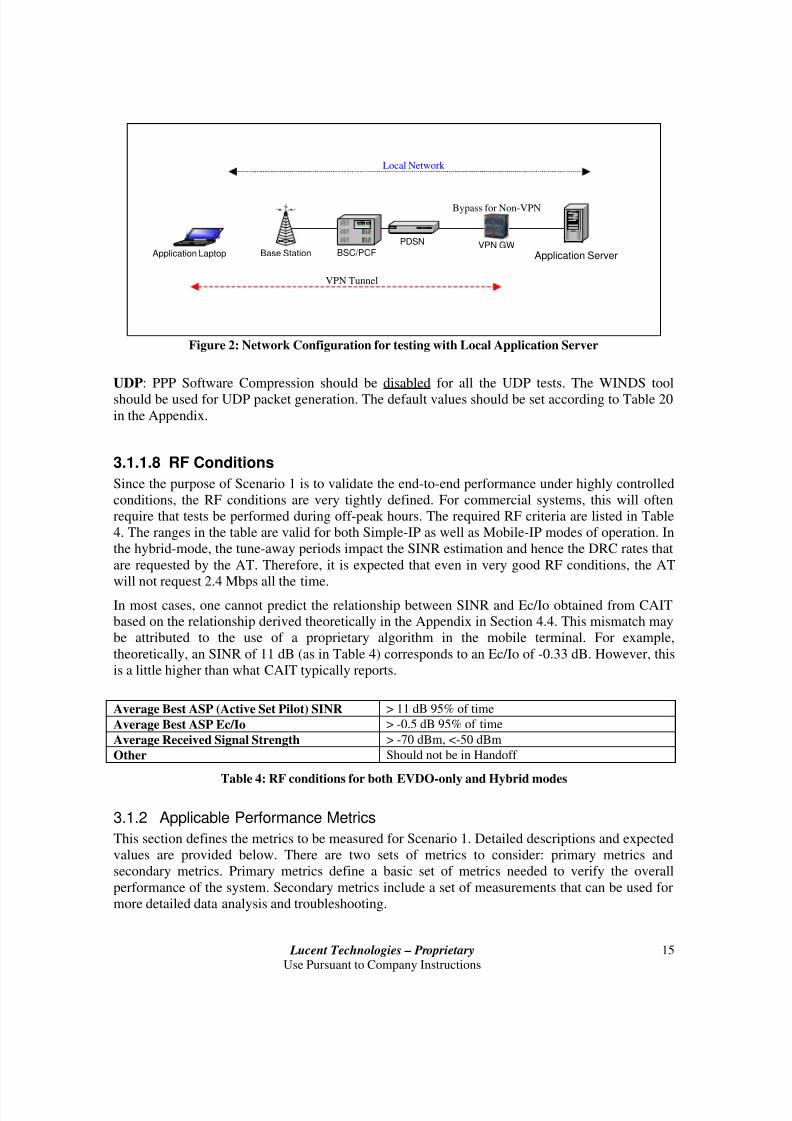
3.1.1.6 IPSec Brick Server
Platform: For the VPN tests in Scenario 1, the Lucent VPN gateway (a.k.a. IPSec Brick server)should be between the PDSN and the local application server as shown in Figure 2. The VPN
gateway should be by-passed for the non-VPN tests.
3.1.1.7 Applications
The applications to be verified are as follows:
Web Browsing: PPP Software Compression should be enabled for all the HTTP tests. The websites listed in Table 3 should be used for all HTTP baseline tests. For Scenario 1, the web sites
should be static in that they should be hosted on the local server.FTP: For forward and reverse DOS FTP tests, non-compressible3, 5MB and 0.5MB files should be
used, respectively. These files can be obtained from [4]. For forward-link throughput tests under
Scenario 1, the file should be hosted on the local server.
2VNC (Virtual Network Computing) is an open software available from http://www.realvnc.com
3Note that PPP Software Compression should be disabled if compressible files are being used
7/28/2019 1xEVDO Perf Expect v5
http://slidepdf.com/reader/full/1xevdo-perf-expect-v5 15/37
Lucent Technologies – ProprietaryUse Pursuant to Company Instructions
15
Base StationApplication Laptop BSC/PCF
PDSN
Application ServerVPN GW
VPN Tunnel
Local Network
Bypass for Non-VPN
Figure 2: Network Configuration for testing with Local Application Server
UDP: PPP Software Compression should be disabled for all the UDP tests. The WINDS tool
should be used for UDP packet generation. The default values should be set according to Table 20
in the Appendix.
3.1.1.8 RF Conditions
Since the purpose of Scenario 1 is to validate the end-to-end performance under highly controlled
conditions, the RF conditions are very tightly defined. For commercial systems, this will often
require that tests be performed during off-peak hours. The required RF criteria are listed in Table
4. The ranges in the table are valid for both Simple-IP as well as Mobile-IP modes of operation. In
the hybrid-mode, the tune-away periods impact the SINR estimation and hence the DRC rates that
are requested by the AT. Therefore, it is expected that even in very good RF conditions, the AT
will not request 2.4 Mbps all the time.
In most cases, one cannot predict the relationship between SINR and Ec/Io obtained from CAITbased on the relationship derived theoretically in the Appendix in Section 4.4. This mismatch may
be attributed to the use of a proprietary algorithm in the mobile terminal. For example,
theoretically, an SINR of 11 dB (as in Table 4) corresponds to an Ec/Io of -0.33 dB. However, this
is a little higher than what CAIT typically reports.
Average Best ASP (Active Set Pilot) SINR > 11 dB 95% of time
Average Best ASP Ec/Io > -0.5 dB 95% of time
Average Received Signal Strength > -70 dBm, <-50 dBm
Other Should not be in Handoff
Table 4: RF conditions for both EVDO-only and Hybrid modes
3.1.2 Applicable Performance Metrics
This section defines the metrics to be measured for Scenario 1. Detailed descriptions and expected
values are provided below. There are two sets of metrics to consider: primary metrics and
secondary metrics. Primary metrics define a basic set of metrics needed to verify the overall
performance of the system. Secondary metrics include a set of measurements that can be used for
more detailed data analysis and troubleshooting.
7/28/2019 1xEVDO Perf Expect v5
http://slidepdf.com/reader/full/1xevdo-perf-expect-v5 16/37
Lucent Technologies – ProprietaryUse Pursuant to Company Instructions
16
3.1.2.1 Primary Metrics
The following represent the primary metrics for Scenario 1:
• Connection failure rate
• Application throughput for FTP applications (Tool: DOS)• Application throughput for UDP applications (Tool: WINDS)
• Application and IP Throughput for Web applications (Tool: CommView)
• Ping (default 32 bytes) Round Trip Delay (Tool: DOS)
To measure the Connection Failure Rate, the call origination script in 1xEV RF Optimization
Guidelines (see [2]) should be run on the mobile unit. The script continuously performs a Ping
followed by a sleep period of 15 secs. The sleep period allows the mobile to go into dormancy.
The timeout to wait for each reply is set to 10 seconds, using the –w option in Ping. This gives the
mobile 10 secs to set up the traffic channel. Note that each Ping will involve the regular access
attempt followed by the handshake between the mobile station and the access network to set up the
traffic channel on which the Ping will be sent. If the connection is successfully established, the
Ping attempt would be successful otherwise it would time out. The fraction of time-outs as a
percentage of the total attempts is defined as the Connection Failure Rate. The total number of
attempts should be above 1000.
To measure DOS FTP application layer performance to compare with the expected performance,
transfer the specified non-compressible FTP file from the local server for forward link tests or to
the local server for reverse link tests. The files should be transferred continuously using a script so
that the mobile does not go into dormancy. Files of sizes of 5 Mbytes and 0.5 Mbytes should be
used for the forward and reverse transfers, respectively. Record the throughput given by the DOS
FTP application. This file transfer should be repeated at least 30 times in each direction. The
throughput measured for all of the forward link file transfers should be averaged. Similarly, the
throughput measured for all reverse link transfers should be averaged. These final averages shouldthen be compared to the expected performance ranges.
PPP Software Compression should be disabled for all the UDP tests. The WINDS tool should be
used for the UDP test. The default values should be set according to Table 20 in the Appendix.
The session throughput reported by WINDS at the end of the test period should be compared to the
expected performance range.
PPP Software Compression should be enabled for all the HTTP tests. To measure the IP
throughput for HTTP, download the 5 static web pages listed in Table 3 and record the IP
throughput for each of the 5 web pages using the CommView tool. A script can be used to
automate the downloading process. The script should not allow the mobile to go into dormancy
and should clear the cache on the client as well. Repeat the transfer of the 5 web pages at least 8
times and record the associated throughputs. Compute the average throughput by averaging over
all trials for all 5 web pages. This final average should be compared to the expected performance
range.
PPP Software Compression should be disabled for all the Ping tests. To measure round-trip delay
for each Ping, execute a minimum of 100 trials. The final average at the end of the 100 trials
should be compared to the expected performance range.
For each metric, no data should be discarded unless a clear error was made in data collection.

7/28/2019 1xEVDO Perf Expect v5
http://slidepdf.com/reader/full/1xevdo-perf-expect-v5 17/37
Lucent Technologies – ProprietaryUse Pursuant to Company Instructions
17
3.1.2.2 Secondary Metrics
Since obtaining secondary metrics for Scenario 1 requires more detailed testing and in-depthanalysis, the analysis may be performed for a single web page download and/or a single FTP
transfer. The following metrics will be used:
• Forward Link Packet Error Rate (Tool: CAIT)
• RLP throughput (Tool: CAIT, LDAT3G )
• Forward and reverse rate distributions (Tool: CAIT, LDAT3G )
3.1.3 Performance Expectations – Experimental without VPN
Table 5 provides the range for several metrics for a single user (only active user on the cell) in
Simple-IP and EVDO-only mode without VPN. In this configuration, the MSM5500 andMSM6500 based terminals are expected to yield the same performance. The theoretical maximum
FL FTP throughput can be calculated as follows. Assume very good RF conditions where loss in
throughput due to RF related impairments such as RLP errors and DRC erasures can be ignored.
Also assume that the RLP packets are packed optimally in the physical layer frames and that the
overheads associated with TCP/IP/PPP/RLP protocols and synchronous control-channel signaling
are 12% and 3%, respectively. Under these assumptions, the maximum FL FTP throughput thatcan be obtained over 1xEV-DO is around 0.85*2457 ~ 2088 kbps or 261 kbytes/sec. Note that in
practical scenarios, RLP losses and DRC erasures will further reduce the maximum achievable
throughput. In the table, the lower end of the range for FL FTP throughput is based on the
minimum value obtained from tests run under the RF conditions given in Table 4. Note that if theapplication-layer throughput obtained is greater than 2100 kbps, then it should be checked to see if
any compression schemes are turned on (for FTP/UDP tests, it is recommended that PPP Software
compression be turned off).
For the one T1 case, assuming a 90% utilization of the T1 link, 15% loss due to protocol
overheads and control-channel signaling, the maximum achievable application layer throughputcan be expected to be around 0.90*0.85*1544 kbps ~ 1180 kbps.
Table 5 also provides the range for RL FTP throughput. Since the maximum RL physical layer
rate in 1xEV-DO is 153.6 kbps, the maximum RL FTP throughput is limited to 145 kbps due to
protocol overheads (no RF impairments). However, RL FTP throughputs as high as 150 kbps can
be measured with DOS FTP due to inaccuracies in the timing calculations in DOS. Despite of thisinaccuracy, all the FTP throughput values in this report will be based on DOS FTP, as it is the
most widely used FTP tool. The lower end of the range for RL FTP throughput is based on the
minimum value obtained in the laboratory under RF conditions given in Table 4.
It is expected that the performance of the HTTP application in the one T1 case will be similar to
that of the case with two T1's as the bandwidth of a single T1 exceeds the bandwidth requirement
of the HTTP applications used in the tests.
Table 6 compares the throughput range of an MSM5500-based Chester and the MSM6500-based
LG terminal for a single user using Mobile-IP and in Hybrid (SCI=1) mode. As discussed in
Section 2.4, the MSM5500-based AT is impacted severely by Mobile-IP operation. As aconsequence, the FL throughput drops considerably to a value lower than the capacity of a single
T1. Hence, for an MSM5500-based terminal, the range in Table 6 is applicable for cells with one
T1 as well.
7/28/2019 1xEVDO Perf Expect v5
http://slidepdf.com/reader/full/1xevdo-perf-expect-v5 18/37
Lucent Technologies – ProprietaryUse Pursuant to Company Instructions
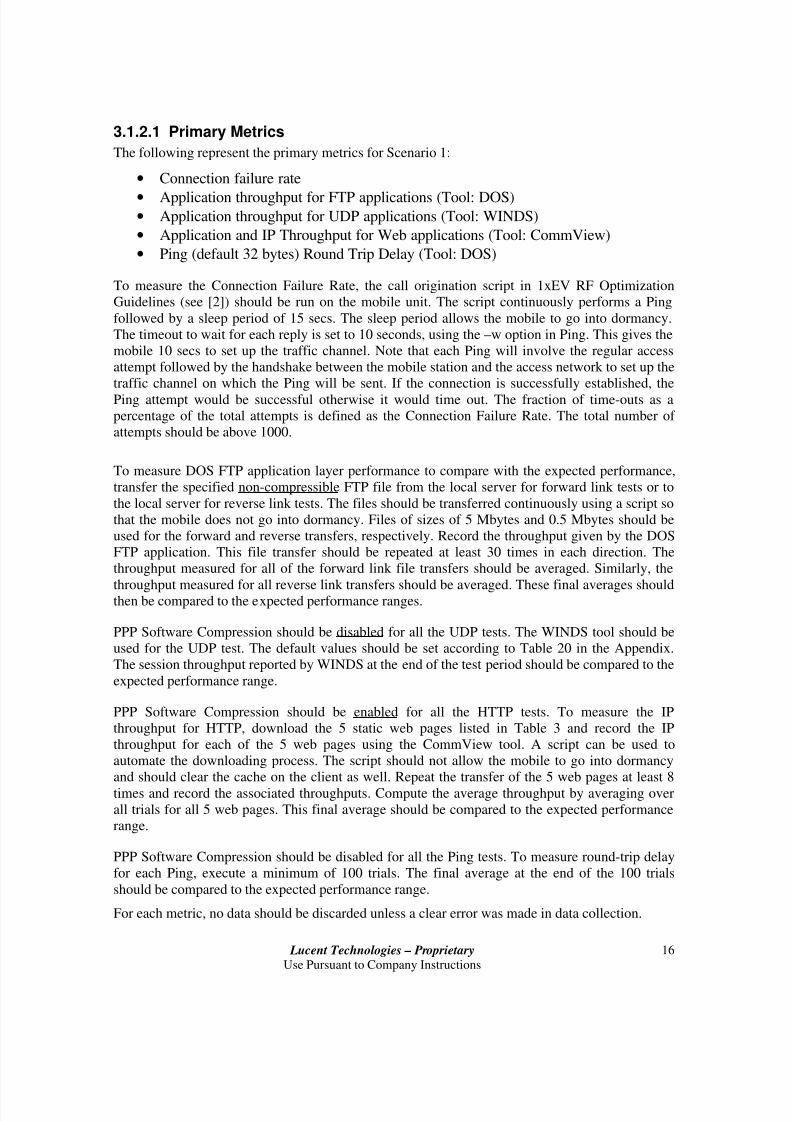
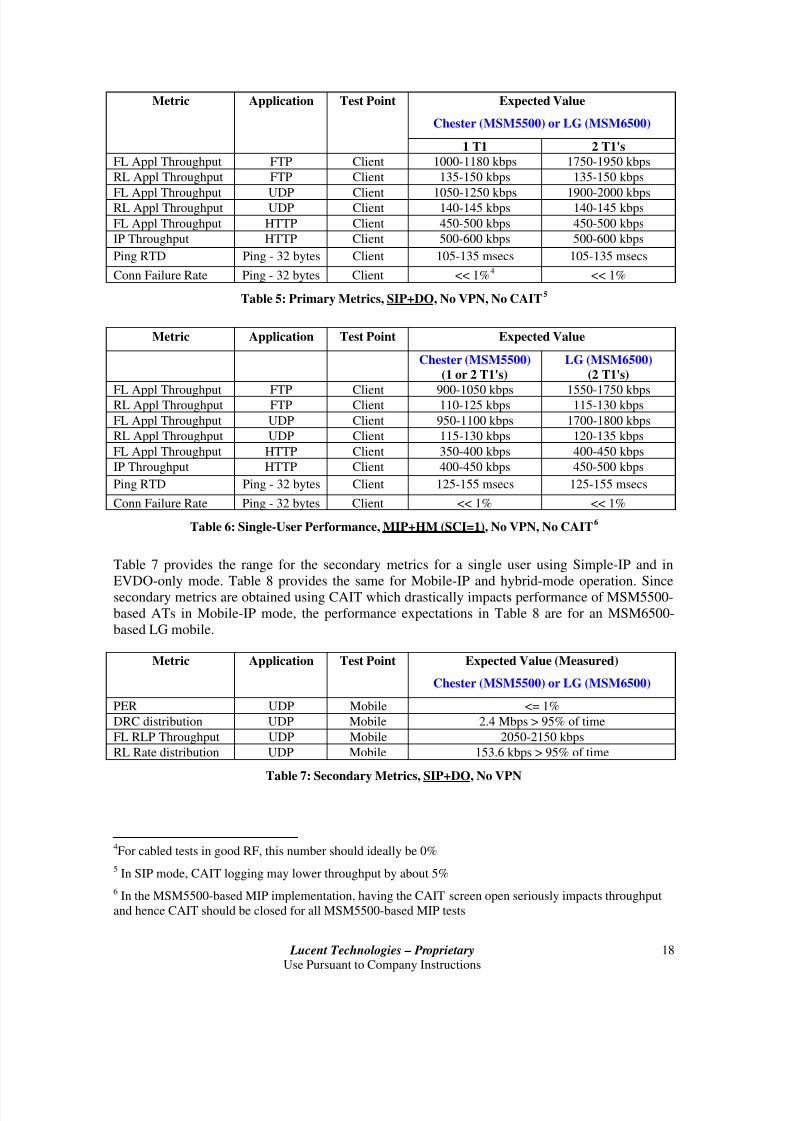
18
Expected Value
Chester (MSM5500) or LG (MSM6500)
Metric Application Test Point
1 T1 2 T1's
FL Appl Throughput FTP Client 1000-1180 kbps 1750-1950 kbps
RL Appl Throughput FTP Client 135-150 kbps 135-150 kbps
FL Appl Throughput UDP Client 1050-1250 kbps 1900-2000 kbpsRL Appl Throughput UDP Client 140-145 kbps 140-145 kbps
FL Appl Throughput HTTP Client 450-500 kbps 450-500 kbps
IP Throughput HTTP Client 500-600 kbps 500-600 kbps
Ping RTD Ping - 32 bytes Client 105-135 msecs 105-135 msecs
Conn Failure Rate Ping - 32 bytes Client << 1%4
<< 1%
Table 5: Primary Metrics, SIP+DO, No VPN, No CAIT5
Metric Application Test Point Expected Value
Chester (MSM5500)
(1 or 2 T1's)
LG (MSM6500)
(2 T1's)
FL Appl Throughput FTP Client 900-1050 kbps 1550-1750 kbpsRL Appl Throughput FTP Client 110-125 kbps 115-130 kbps
FL Appl Throughput UDP Client 950-1100 kbps 1700-1800 kbps
RL Appl Throughput UDP Client 115-130 kbps 120-135 kbps
FL Appl Throughput HTTP Client 350-400 kbps 400-450 kbps
IP Throughput HTTP Client 400-450 kbps 450-500 kbps
Ping RTD Ping - 32 bytes Client 125-155 msecs 125-155 msecs
Conn Failure Rate Ping - 32 bytes Client << 1% << 1%
Table 6: Single-User Performance, MIP+HM (SCI=1), No VPN, No CAIT6
Table 7 provides the range for the secondary metrics for a single user using Simple-IP and in
EVDO-only mode. Table 8 provides the same for Mobile-IP and hybrid-mode operation. Since
secondary metrics are obtained using CAIT which drastically impacts performance of MSM5500-
based ATs in Mobile-IP mode, the performance expectations in Table 8 are for an MSM6500-
based LG mobile.
Metric Application Test Point Expected Value (Measured)
Chester (MSM5500) or LG (MSM6500)
PER UDP Mobile <= 1%
DRC distribution UDP Mobile 2.4 Mbps > 95% of time
FL RLP Throughput UDP Mobile 2050-2150 kbps
RL Rate distribution UDP Mobile 153.6 kbps > 95% of time
Table 7: Secondary Metrics, SIP+DO, No VPN
4For cabled tests in good RF, this number should ideally be 0%
5In SIP mode, CAIT logging may lower throughput by about 5%
6 In the MSM5500-based MIP implementation, having the CAIT screen open seriously impacts throughput
and hence CAIT should be closed for all MSM5500-based MIP tests
7/28/2019 1xEVDO Perf Expect v5
http://slidepdf.com/reader/full/1xevdo-perf-expect-v5 19/37
Lucent Technologies – ProprietaryUse Pursuant to Company Instructions
19
Metric Application Test Point Expected Value
LG (MSM6500)
PER UDP Mobile <= 1%
DRC distribution UDP Mobile 2.4 Mbps > 95% of time
FL RLP Throughput UDP Mobile 1850-1950 kbps
RL Rate Distribution UDP Mobile 153.6 kbps > 85%7
of time
Table 8: Secondary Metrics, MIP+HM (SCI=1), No VPN
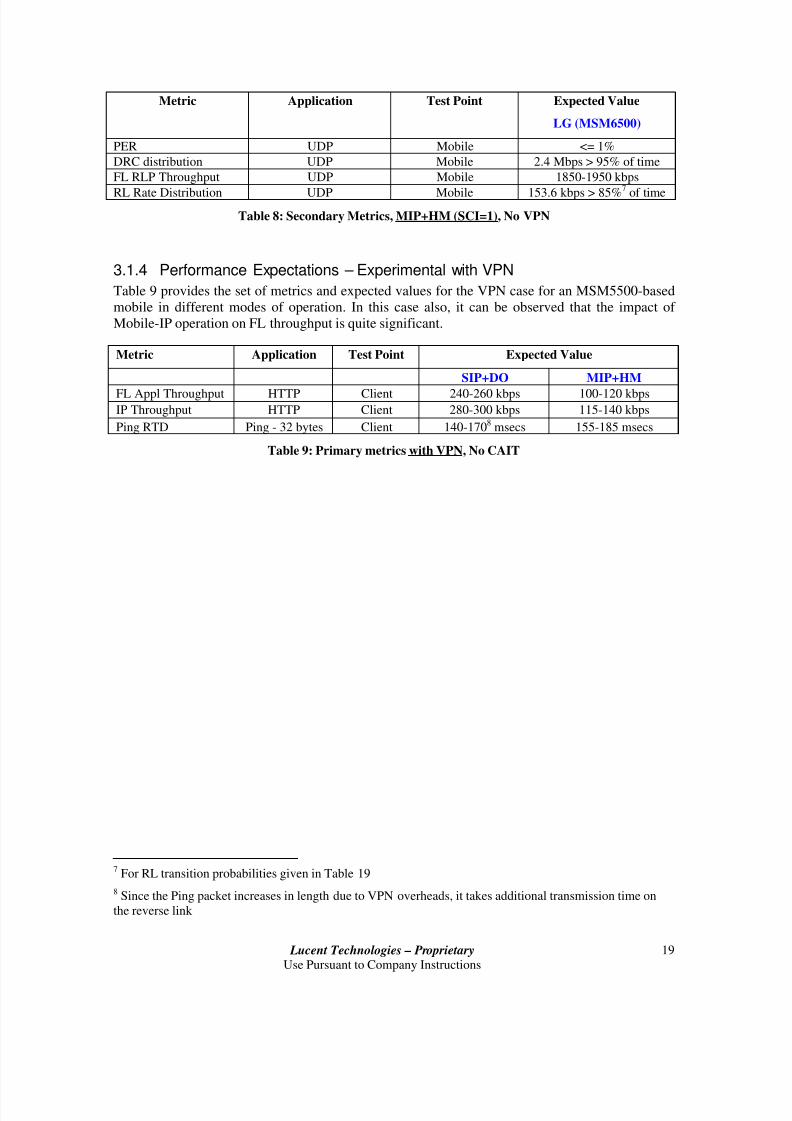
3.1.4 Performance Expectations – Experimental with VPN
Table 9 provides the set of metrics and expected values for the VPN case for an MSM5500-based
mobile in different modes of operation. In this case also, it can be observed that the impact of
Mobile-IP operation on FL throughput is quite significant.
Metric Application Test Point Expected Value
SIP+DO MIP+HM
FL Appl Throughput HTTP Client 240-260 kbps 100-120 kbpsIP Throughput HTTP Client 280-300 kbps 115-140 kbps
Ping RTD Ping - 32 bytes Client 140-1708
msecs 155-185 msecs
Table 9: Primary metrics with VPN, No CAIT
7For RL transition probabilities given in Table 19
8 Since the Ping packet increases in length due to VPN overheads, it takes additional transmission time on
the reverse link

7/28/2019 1xEVDO Perf Expect v5
http://slidepdf.com/reader/full/1xevdo-perf-expect-v5 20/37
Lucent Technologies – ProprietaryUse Pursuant to Company Instructions
20
3.2 Scenario 2: Controlled Optimization Test Scenario
Scenario 2 is based on tests and acceptance criteria associated with the Lucent-recommended RF
optimization procedures for a 1xEV-DO network. The tests and criteria are based on drive testing.
They apply to a system introducing 1xEV-DO as an overlay onto an existing 2G/3G network, or to
one deployed from scratch.
To characterize cluster-wide or system-wide performance, this scenario requires two main drive
tests. One test will be performed under lightly loaded or unloaded conditions and the other under
loaded conditions. The tests will be performed after the system has been RF-optimized.
The performance expectations presented in this scenario can be construed as acceptance criteria to
be met at the conclusion of key optimization phases (unloaded or loaded) in a typical RF
optimization process. Refer to [2] for more details on these optimization phases.
This scenario is only valid when tests are conducted by Lucent personnel following [2].
3.2.1 Test Conditions
The test conditions defined below should be consistent with [2]. If any discrepancies are found
between this document and [2], then the criteria defined in [2] should be utilized.
3.2.1.1 Test Description
This scenario focuses on drive-test data collection under unloaded and loaded conditions. The tests
can be performed either on a cluster-wide basis or on a system-wide basis. Refer to [2] for test
procedures on data collection and analysis for the unloaded and loaded tests.
The tests in Scenario 2 are to be performed without VPN.
The same Client and Server configurations as in Scenario 1 are to be used.
3.2.1.2 Mobile Station
Minimum Configuration: Qualcomm DMSS 3.3-based Chester (e.g. version QF3334) should be
used. Antenna diversity should be enabled on the AT.
3.2.1.3 Base Station
Translations: Cell translations to be set according to the appropriate version of the RF Translation
Application Notes 1-4 (see [3]). Unless specified otherwise, the performance ranges are based onthe assumption that the cells have two T1's.
3.2.1.4 Applications
UDP: The optimization drive tests should preferably be performed using a UDP application. In
case the UDP tool is unavailable, FTP based applications may be used. PPP Software Compression
7/28/2019 1xEVDO Perf Expect v5
http://slidepdf.com/reader/full/1xevdo-perf-expect-v5 21/37
Lucent Technologies – ProprietaryUse Pursuant to Company Instructions
21
should be disabled for all the UDP tests. The WINDS tool should be used for UDP packet
generation. The default values should be set according to Table 20 in the appendix.
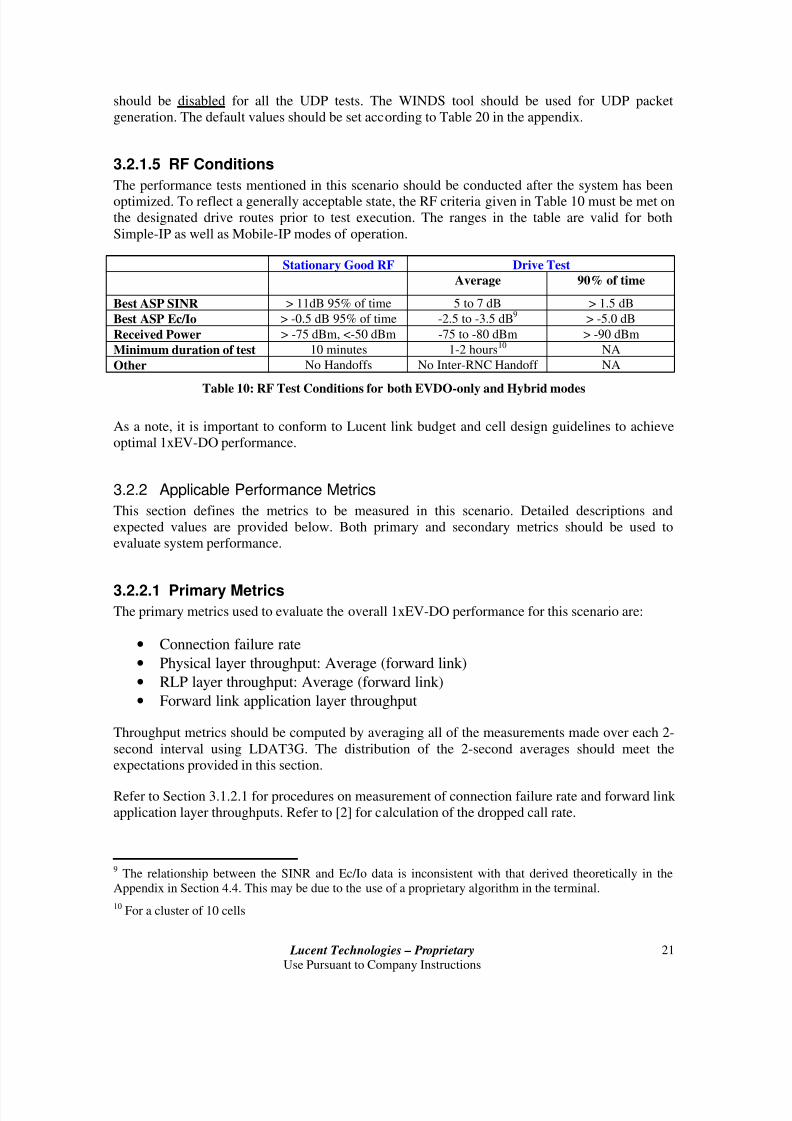
3.2.1.5 RF Conditions
The performance tests mentioned in this scenario should be conducted after the system has been
optimized. To reflect a generally acceptable state, the RF criteria given in Table 10 must be met onthe designated drive routes prior to test execution. The ranges in the table are valid for both
Simple-IP as well as Mobile-IP modes of operation.
Stationary Good RF Drive Test
Average 90% of time
Best ASP SINR > 11dB 95% of time 5 to 7 dB > 1.5 dB
Best ASP Ec/Io > -0.5 dB 95% of time -2.5 to -3.5 dB9
> -5.0 dB
Received Power > -75 dBm, <-50 dBm -75 to -80 dBm > -90 dBm
Minimum duration of test 10 minutes 1-2 hours10
NA
Other No Handoffs No Inter-RNC Handoff NA
Table 10: RF Test Conditions for both EVDO-only and Hybrid modes
As a note, it is important to conform to Lucent link budget and cell design guidelines to achieve
optimal 1xEV-DO performance.
3.2.2 Applicable Performance Metrics
This section defines the metrics to be measured in this scenario. Detailed descriptions and
expected values are provided below. Both primary and secondary metrics should be used to
evaluate system performance.
3.2.2.1 Primary MetricsThe primary metrics used to evaluate the overall 1xEV-DO performance for this scenario are:
• Connection failure rate
• Physical layer throughput: Average (forward link)
• RLP layer throughput: Average (forward link)
• Forward link application layer throughput
Throughput metrics should be computed by averaging all of the measurements made over each 2-
second interval using LDAT3G. The distribution of the 2-second averages should meet the
expectations provided in this section.
Refer to Section 3.1.2.1 for procedures on measurement of connection failure rate and forward link
application layer throughputs. Refer to [2] for calculation of the dropped call rate.
9The relationship between the SINR and Ec/Io data is inconsistent with that derived theoretically in the
Appendix in Section 4.4. This may be due to the use of a proprietary algorithm in the terminal.
10For a cluster of 10 cells
7/28/2019 1xEVDO Perf Expect v5
http://slidepdf.com/reader/full/1xevdo-perf-expect-v5 22/37
Lucent Technologies – ProprietaryUse Pursuant to Company Instructions
22
3.2.2.2 Secondary Metrics
For more detailed analysis and troubleshooting, secondary metrics can be utilized. These include:
• Best ASP (Active Set Pilot) SINR
• DRC Requested
3.2.3 Performance Expectations
Since tests were not performed under loaded conditions, this section provides performance
expectations for drive testing under unloaded conditions only.
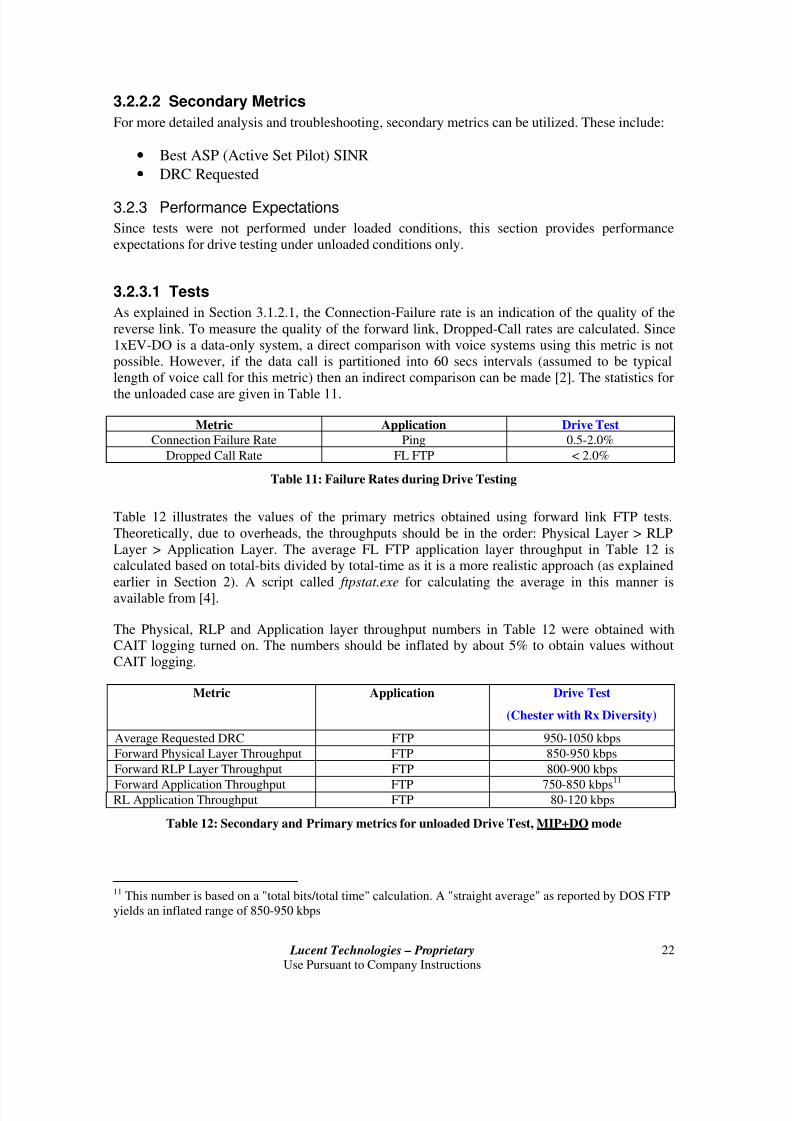
3.2.3.1 Tests
As explained in Section 3.1.2.1, the Connection-Failure rate is an indication of the quality of the
reverse link. To measure the quality of the forward link, Dropped-Call rates are calculated. Since
1xEV-DO is a data-only system, a direct comparison with voice systems using this metric is not
possible. However, if the data call is partitioned into 60 secs intervals (assumed to be typical
length of voice call for this metric) then an indirect comparison can be made [2]. The statistics for
the unloaded case are given in Table 11.
Metric Application Drive Test
Connection Failure Rate Ping 0.5-2.0%
Dropped Call Rate FL FTP < 2.0%
Table 11: Failure Rates during Drive Testing
Table 12 illustrates the values of the primary metrics obtained using forward link FTP tests.
Theoretically, due to overheads, the throughputs should be in the order: Physical Layer > RLP
Layer > Application Layer. The average FL FTP application layer throughput in Table 12 iscalculated based on total-bits divided by total-time as it is a more realistic approach (as explained
earlier in Section 2). A script called ftpstat.exe
for calculating the average in this manner isavailable from [4].
The Physical, RLP and Application layer throughput numbers in Table 12 were obtained withCAIT logging turned on. The numbers should be inflated by about 5% to obtain values without
CAIT logging.
Metric Application Drive Test
(Chester with Rx Diversity)
Average Requested DRC FTP 950-1050 kbps
Forward Physical Layer Throughput FTP 850-950 kbps
Forward RLP Layer Throughput FTP 800-900 kbps
Forward Application Throughput FTP 750-850 kbps11
RL Application Throughput FTP 80-120 kbps
Table 12: Secondary and Primary metrics for unloaded Drive Test, MIP+DO mode
11 This number is based on a "total bits/total time" calculation. A "straight average" as reported by DOS FTP
yields an inflated range of 850-950 kbps
7/28/2019 1xEVDO Perf Expect v5
http://slidepdf.com/reader/full/1xevdo-perf-expect-v5 23/37
Lucent Technologies – ProprietaryUse Pursuant to Company Instructions
23
When the AT is in Hybrid-mode, the throughput ranges are expected to be lower than those in
Table 12. As illustrated in Table 1, the degradation is expected to be anywhere from 5-25%
depending upon the particular SCI used.
The gain in throughput in a cluster where all the cells have two T1's compared to a cluster where
all the cells have one T1 can be estimated as follows. The capacity of a single T1 is approximately
1.5 Mbps. Under driving conditions, the mobile requests rates greater than 1.5 Mbps only about10%12 of the time. If we take the average rate between 1.5 Mbps and 2.4 Mbps at which the mobile
could be served with two T1's to be around 1950 kbps, then the gain in throughput is 10% of the
difference between 1950 kbps and 1500 kbps which is 45 kbps. Hence, for a single user in driving
conditions, the loss in throughput due to a single T1 is not expected to be significant. A similar
analysis can be carried out for a single E1 scenario. Since the capacity of a single E1 is
approximately 2 Mbps, and since a rate of 2.4 Mbps is requested only about 5% of the time under
driving conditions, the loss in throughput is roughly 0.05*(2.4-2) Mbps=20 kbps.
12This number depends on the way the network has been designed and optimized
7/28/2019 1xEVDO Perf Expect v5
http://slidepdf.com/reader/full/1xevdo-perf-expect-v5 24/37
Lucent Technologies – ProprietaryUse Pursuant to Company Instructions
24
3.3 Scenario 3: Commercially Deployed System – Controlled Test Scenario
This scenario represents a controlled test scenario in a commercial 1xEV-DO network. Although
there will be fewer restrictions specified in the test conditions section than for the previous
scenario, the range of performance will be greater.
3.3.1 Test Conditions
3.3.1.1 Test Description
Single and multi-user tests are performed in the market with commercial applications such as
HTTP and FTP.
3.3.1.2 Client Configuration
The client configuration must meet the minimum configuration defined for Scenario 1 in Section
3.1.1.2.
3.3.1.3 Server Configuration
The server configuration must meet the recommended configuration defined for Scenario 1 in
Section 3.1.1.3. The server should preferably be a local server as shown in Figure 2. If such a
server is unavailable, then an external server on the Internet may be used provided the routes
between the client and the server have latency and packet drop rates comparable to that to the local
server.
3.3.1.4 Mobile Station
Minimum Configuration: For the MSM5500-based terminal, a Qualcomm DMSS 3.3-based
Chester (e.g. version QF3334) should be used with receive-diversity enabled. For the MSM6500-
based terminal, the LG VX8000 should be used (receive-diversity is not available on this model).
3.3.1.5 Base Station
Translations: Cell translations to be set according to the appropriate version of the RF Translation
Application Notes 1-4 (see [3]). Unless specified otherwise, the performance ranges are based on
the assumption that the cells have two T1's.
3.3.1.6 Applications
The following applications are to be tested:Web Browsing: PPP Software Compression should be enabled for all the HTTP tests. The web
sites listed in Table 3 should be used for all HTTP baseline tests. In this scenario, the web sites
should be static and hosted on the local server (or on an external server with characteristics
specified in Section 3.3.1.3).
FTP: PPP Software Compression should be disabled for all the FTP tests. For forward and reverse
DOS FTP tests, files of sizes 5 MB and 500 KB should be used, respectively. For forward link
7/28/2019 1xEVDO Perf Expect v5
http://slidepdf.com/reader/full/1xevdo-perf-expect-v5 25/37
Lucent Technologies – ProprietaryUse Pursuant to Company Instructions
25
throughput tests in this scenario, the files should be hosted on the local server (or on an external
server with characteristics specified in Section 3.3.1.3).
3.3.1.7 RF Conditions
In this scenario, we consider different sets of RF conditions as shown in Table 13. The range in the
table is valid for both Simple-IP as well as Mobile-IP modes of operation. Since the values of metrics such as SINR, Ec/Io, received signal strength, etc. obtained from a cluster drive-test
depend heavily on the way the cluster has been optimized, different optimization scenarios can
lead to different distributions of these metrics. Hence, to reflect a typical range of scenarios in the
field, a relatively wide range has been assigned to the expected drive-test values in Table 13.
Stationary Good RF Drive Test
Average Best ASP SINR > 11dB 95% of time 0 to 7 dB
Average Best ASP Ec/Io > -0.5 dB 95% of time -5 to -2 dB
Average Received Signal Strength > -70 dBm, <-50 dBm -80 to -70 dBm
Minimum duration of test 30 minutes 2 hours13
Other Should not be in Handoff Drive route should not include
inter-RNC boundaries
Table 13: RF Test Conditions for both EVDO-only and Hybrid modes
3.3.2 Applicable Performance Metrics
This section defines the metrics to be measured in this scenario. Detailed descriptions and
expected values are provided below.
3.3.2.1 Primary Metrics
The primary metrics for this scenario are:
• Application throughput for FTP applications (Tool: DOS)
• Application and IP Throughput for Web browsing applications (Tool: CommView)• Ping (32 bytes) Round Trip Delay (Tool: DOS)
PPP Software Compression should be disabled for all the FTP tests. The FTP application
throughput is determined by transferring the specified FTP file to/from the local server using DOS
FTP and recording the throughput given by the application. For stationary test cases, this file
transfer should be repeated at least 30 times and the average throughput should be recorded. For
the drive test, this file transfer should be repeated for the duration of the specified drive route. Thisfinal average number should then be compared to the expected performance range.
PPP Software Compression should be enabled for all the HTTP tests. To compute IP throughput
for HTTP tests, the series of 5 static web pages hosted on the local server should be transferred
and the IP throughput should be recorded separately for each of the 5 web pages. The IPthroughput can be measured using the CommView tool. A script can be used to automate the
downloading process. The script should not allow the mobile to go into dormancy and should clear
the cache on the client as well. For stationary test cases, the transfer of 5 web pages should then be
repeated at least 8 times and the IP throughputs recorded. For the drive test, this should be
repeated for the duration of the specified drive route. A final average should be determined by
13For a cluster of 10 cells

7/28/2019 1xEVDO Perf Expect v5
http://slidepdf.com/reader/full/1xevdo-perf-expect-v5 26/37
Lucent Technologies – ProprietaryUse Pursuant to Company Instructions
26
averaging over all trials for all 5 web pages. This average of all of the transfers should be
compared to the expected performance range.
PPP Software Compression should be disabled for all the Ping tests. To measure round trip delay
for each Ping, a minimum of 100 trials should be executed.
3.3.3 Performance Expectations
3.3.3.1 Single-User Scenarios
Table 14 illustrates the FL throughput and RF metrics associated with a single user using Mobile-
IP and Hybrid-mode at various cell locations. An MSM6500-based LG terminal was used for the
tests.
Stationary LocationsMetric Application Test
Point Near-Cell Mid-Cell Edge-Cell
Average Rx Power CAIT Client > -70 dBm -85 to -75 dBm -95 to -90 dBm
Average SINR CAIT Client > 11 dB 4 to 7 dB -3 to 0 dB
Average DRC CAIT Client > 2.4 Mbps 1100-1300 kbps 300-600 kbpsFL Appl Throughput FTP Client 1550-1750 kbps 750-850 kbps 300-400 kbps
FL Appl Throughput HTTP Client 400-450 kbps 400-450 kbps 200-300 kbps
Table 14: RF and Throughput metrics, MIP+HM (SCI=1), noVPN
Although it is the intention of this document to provide guidelines on performance metrics for
multi-user drive-test data, currently metrics are available only for a single user drive-test scenario
in MIP and HM as shown in Table 15. Under driving conditions, since the RF is poorer (DRCs are
lower), the gain in performance of the LG terminal over the Chester is lower than it is in the good
RF stationary case. Moreover, this gain is reduced further due to the lack of receive-diversity on
the LG terminal. Therefore, in Mobile-IP mode, under driving conditions, both terminals are
expected to broadly yield the same performance range.
Also, in this case, since the throughput ranges are below the capacity of one T1, the performance
expectations are valid for one T1 case as well.
For the FL FTP scenario, the percentage of FL slots utilized by the Chester/LG terminals is around
70-75%. Therefore, in a multi-user scenario, the throughput of the test user may get impacteddepending upon the DRCs and applications of the other users.
Metric Application Test Point Drive Tests
Chester or LG
(1 or 2 T1’s)
FL Appl Throughput FTP Client 400-700 kbpsRL Appl Throughput FTP Client 70-110 kbps
FL Appl Throughput HTTP Client 200-400 kbps
IP Throughput HTTP Client 250-450 kbps
Table 15: Single-user performance, MIP +HM (SCI=1), no VPN, no CAIT
7/28/2019 1xEVDO Perf Expect v5
http://slidepdf.com/reader/full/1xevdo-perf-expect-v5 27/37
Lucent Technologies – ProprietaryUse Pursuant to Company Instructions
27
3.3.3.2 FL Multi-user Scenarios
Since tests in this scenario are to be conducted on a commercial system, multiple users may sharethe same backhaul (T1/E1) and air-link resources as the test user, which may impact the
performance of the test user. The extent of the impact will depend on the number of users, the RF
conditions, and traffic patterns of the test user as well as of the other users. For example, the loss
in throughput for the test user will be greater under stationary, good RF conditions than under
driving conditions when the DRCs are relatively lower. Also, applications such as FTP will beimpacted more than bursty HTTP application. The interplay of these different variables will be
illustrated through some examples below. Note that these examples are only intended to serve as
guidelines to illustrate the interactions qualitatively.
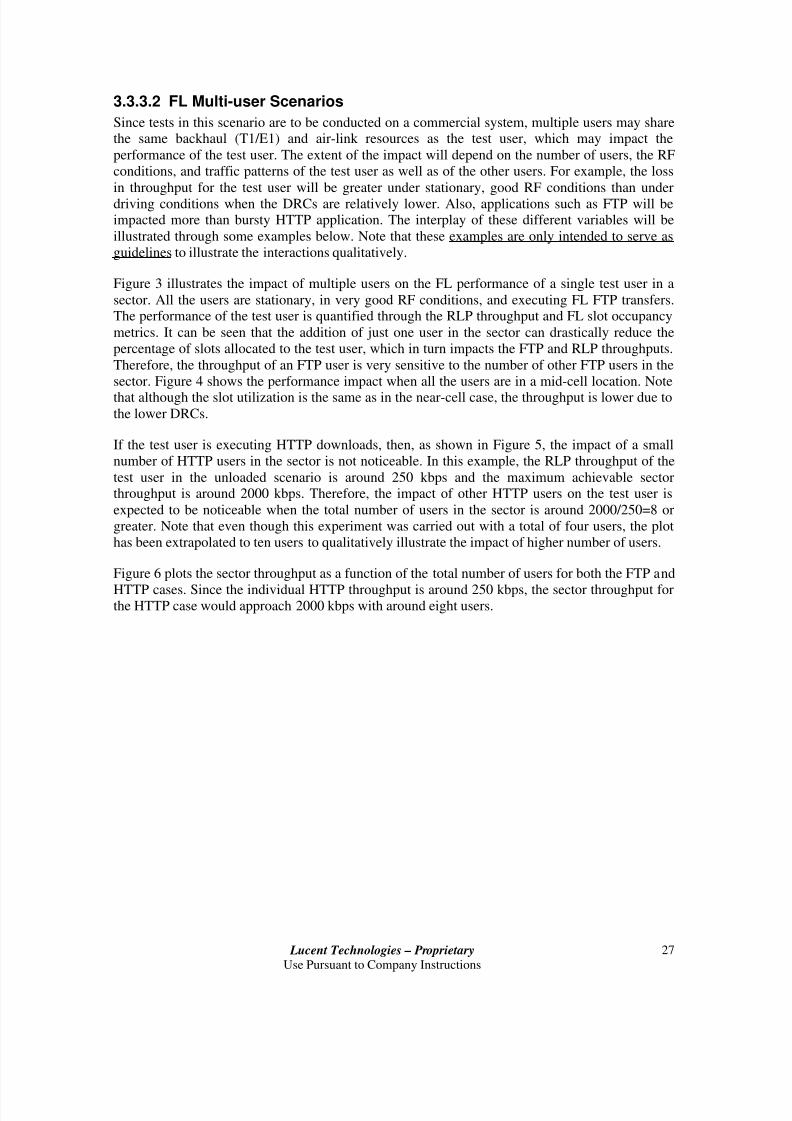
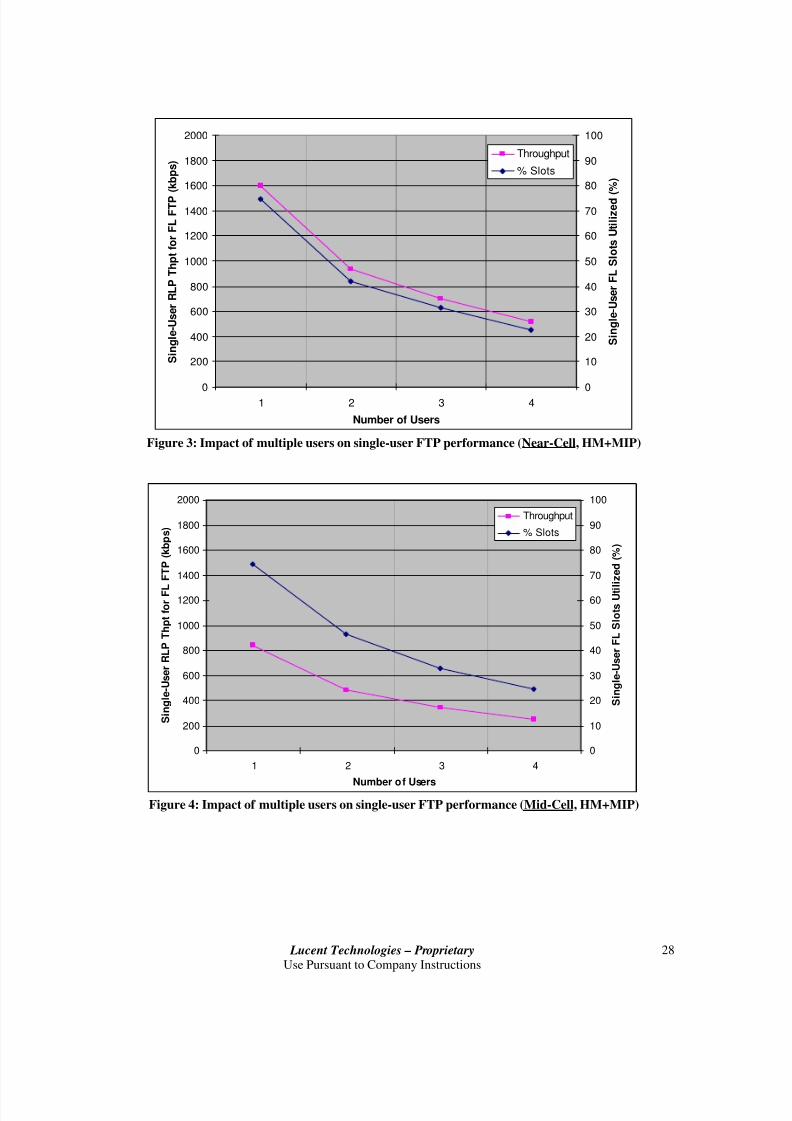
Figure 3 illustrates the impact of multiple users on the FL performance of a single test user in a
sector. All the users are stationary, in very good RF conditions, and executing FL FTP transfers.The performance of the test user is quantified through the RLP throughput and FL slot occupancy
metrics. It can be seen that the addition of just one user in the sector can drastically reduce the
percentage of slots allocated to the test user, which in turn impacts the FTP and RLP throughputs.
Therefore, the throughput of an FTP user is very sensitive to the number of other FTP users in the
sector. Figure 4 shows the performance impact when all the users are in a mid-cell location. Note
that although the slot utilization is the same as in the near-cell case, the throughput is lower due tothe lower DRCs.
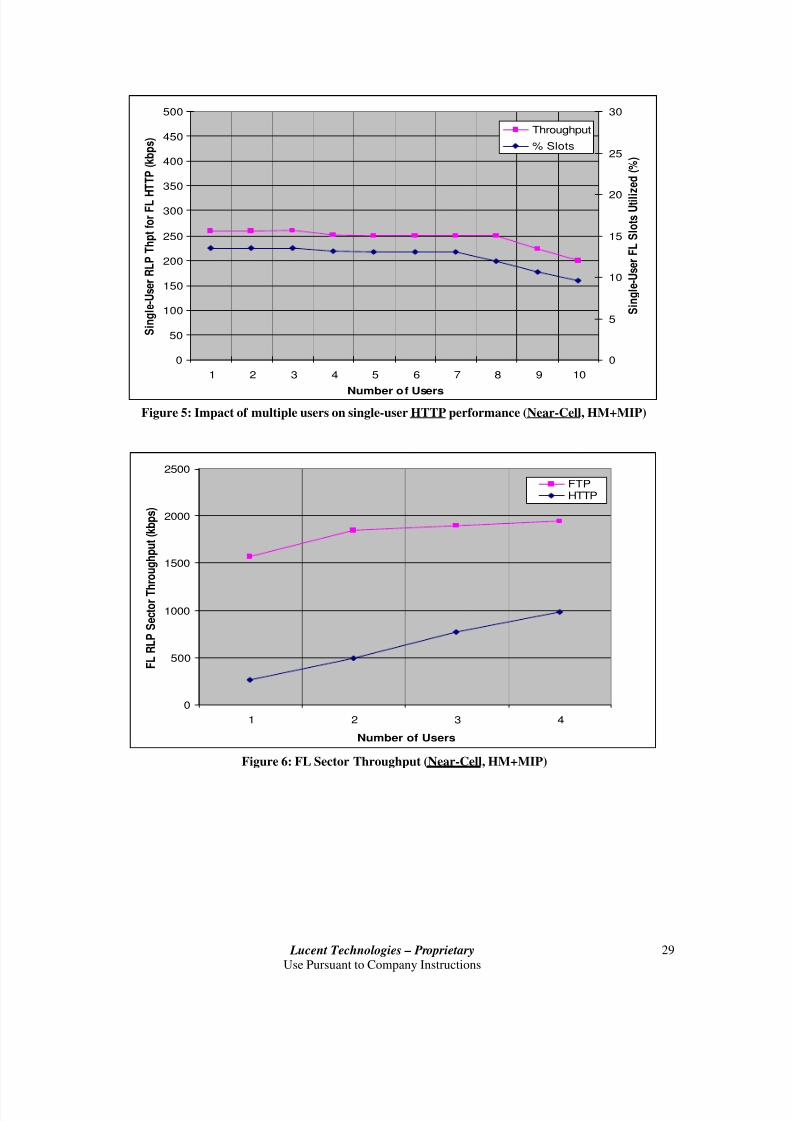
If the test user is executing HTTP downloads, then, as shown in Figure 5, the impact of a small
number of HTTP users in the sector is not noticeable. In this example, the RLP throughput of the
test user in the unloaded scenario is around 250 kbps and the maximum achievable sectorthroughput is around 2000 kbps. Therefore, the impact of other HTTP users on the test user is
expected to be noticeable when the total number of users in the sector is around 2000/250=8 or
greater. Note that even though this experiment was carried out with a total of four users, the plot
has been extrapolated to ten users to qualitatively illustrate the impact of higher number of users.
Figure 6 plots the sector throughput as a function of the total number of users for both the FTP and
HTTP cases. Since the individual HTTP throughput is around 250 kbps, the sector throughput forthe HTTP case would approach 2000 kbps with around eight users.
7/28/2019 1xEVDO Perf Expect v5
http://slidepdf.com/reader/full/1xevdo-perf-expect-v5 28/37
Lucent Technologies – ProprietaryUse Pursuant to Company Instructions
28
0
200
400
600
800
1000
1200
1400
1600
1800
2000
1 2 3 4
Number of Users
S i n g l e - U s e r R L P T h p t f o r F L F T P
( k b p s )
0
10
20
30
40
50
60
70
80
90
100
S i n g l e - U s e r F L S l o t s U t i l i z e d ( % )
Throughput
% Slots
Figure 3: Impact of multiple users on single-user FTP performance (Near-Cell, HM+MIP)
0
200
400
600
800
1000
1200
1400
1600
1800
2000
1 2 3 4
Number of Users
S i n g l e - U s e r R L P T h p t f o r F L
F T P ( k b p s )
0
10
20
30
40
50
60
70
80
90
100
S i n g l e - U s e r F L S l o t s U t i l i z e d ( % )
Throughput
% Slots
Figure 4: Impact of multiple users on single-user FTP performance (Mid-Cell, HM+MIP)
7/28/2019 1xEVDO Perf Expect v5
http://slidepdf.com/reader/full/1xevdo-perf-expect-v5 29/37
Lucent Technologies – ProprietaryUse Pursuant to Company Instructions
29
0
50
100
150
200
250
300
350
400
450
500
1 2 3 4 5 6 7 8 9 10
Number of Users
S i n g l e - U
s e r R L P T h p t f o r F L H
T T P ( k b p s )
0
5
10
15
20
25
30
S i n g l e - U
s e r F L S l o t s U t i l i z e d ( % )
Throughput
% Slots
Figure 5: Impact of multiple users on single-user HTTP performance (Near-Cell, HM+MIP)
0
500
1000
1500
2000
2500
1 2 3 4
Number of Users
F L R L P S e c t o r T h
r o u g h p u t ( k b p s )
FTPHTTP
Figure 6: FL Sector Throughput (Near-Cell, HM+MIP)
7/28/2019 1xEVDO Perf Expect v5
http://slidepdf.com/reader/full/1xevdo-perf-expect-v5 30/37
Lucent Technologies – ProprietaryUse Pursuant to Company Instructions
30
3.4 Scenario 4: Commercially Deployed System – Uncontrolled Test Scenario
This scenario represents an uncontrolled test scenario in a commercial 1xEV-DO network. Some
examples of uncontrolled scenarios may include:
• an application server that is not local
• a commercial device as opposed to a test device
This scenario may be most useful when first addressing customer complaints. The Lucent engineer
troubleshooting performance should understand the test conditions that produced the reported
performance. If the test conditions described below are met, then the performance can be
compared to the expected ranges given below. If the test conditions are not met, then the Lucentengineer will need to assess whether test conditions are similar enough to make a useful
comparison, perhaps with some minor adjustments.
When Lucent personnel are in market, it is recommended that Scenario 3 test conditions be met
whenever possible. However, equipment availability or other logistical issues may make this
impossible. In this case, the performance expectations outlined below should be applied.
3.4.1 Test Conditions
This test should be performed in a commercial system. It is expected that the system has beeneffectively optimized and no known major performance issues exist.
3.4.1.1 Test Description
Single-user stationary and drive tests are performed in the market with FTP and HTTP
applications.
3.4.1.2 Client Configuration
The client configuration must meet the minimum configuration defined for Scenario 1 in Section
3.1.1.2. The preferred configuration should be used where possible, especially if Lucent personnel
are executing the test.
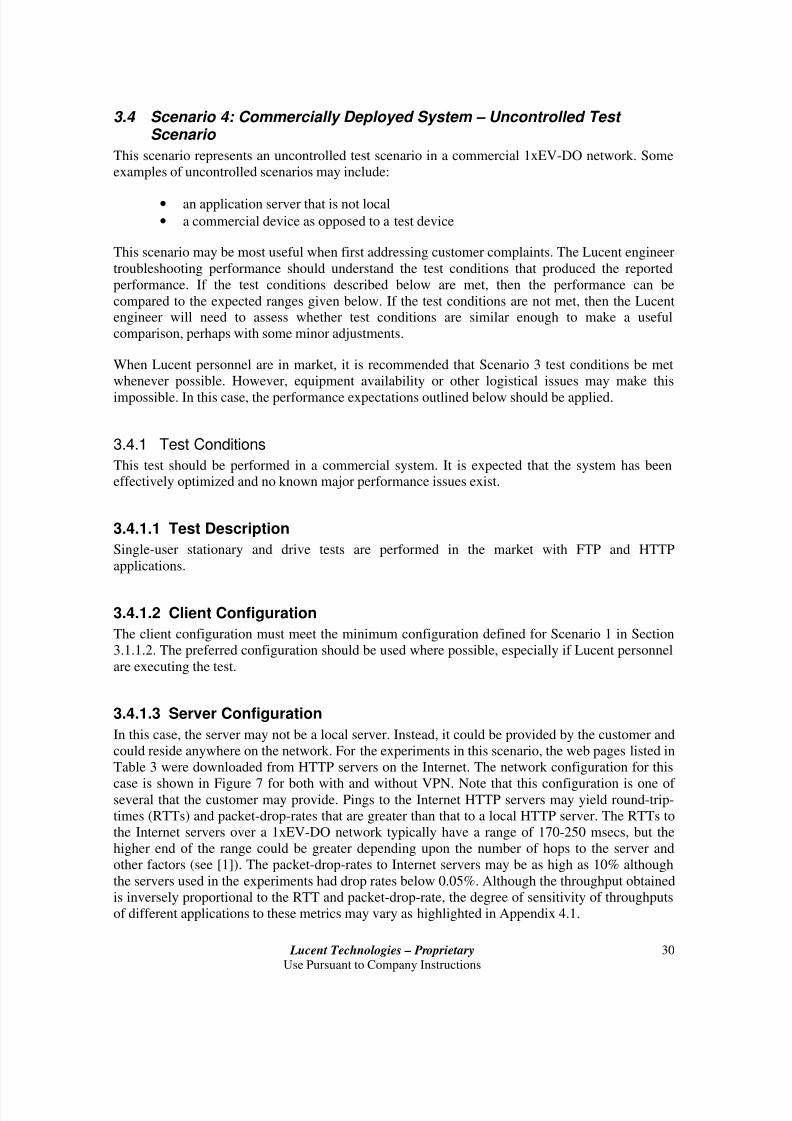
3.4.1.3 Server Configuration
In this case, the server may not be a local server. Instead, it could be provided by the customer and
could reside anywhere on the network. For the experiments in this scenario, the web pages listed in
Table 3 were downloaded from HTTP servers on the Internet. The network configuration for this
case is shown in Figure 7 for both with and without VPN. Note that this configuration is one of several that the customer may provide. Pings to the Internet HTTP servers may yield round-trip-
times (RTTs) and packet-drop-rates that are greater than that to a local HTTP server. The RTTs to
the Internet servers over a 1xEV-DO network typically have a range of 170-250 msecs, but the
higher end of the range could be greater depending upon the number of hops to the server and
other factors (see [1]). The packet-drop-rates to Internet servers may be as high as 10% although
the servers used in the experiments had drop rates below 0.05%. Although the throughput obtained
is inversely proportional to the RTT and packet-drop-rate, the degree of sensitivity of throughputs
of different applications to these metrics may vary as highlighted in Appendix 4.1.
7/28/2019 1xEVDO Perf Expect v5
http://slidepdf.com/reader/full/1xevdo-perf-expect-v5 31/37
Lucent Technologies – ProprietaryUse Pursuant to Company Instructions
31
Base StationApplicationLaptop
BSC/PCF
PDSN
HTTP Server
VPN GWIP Backbone
Firewall
VPN Tunnel
Firewall
Carrier Network Lucent Network
IP Backbone
Bypass for
Non-VPN
Figure 7: Network Architecture, with and without VPN
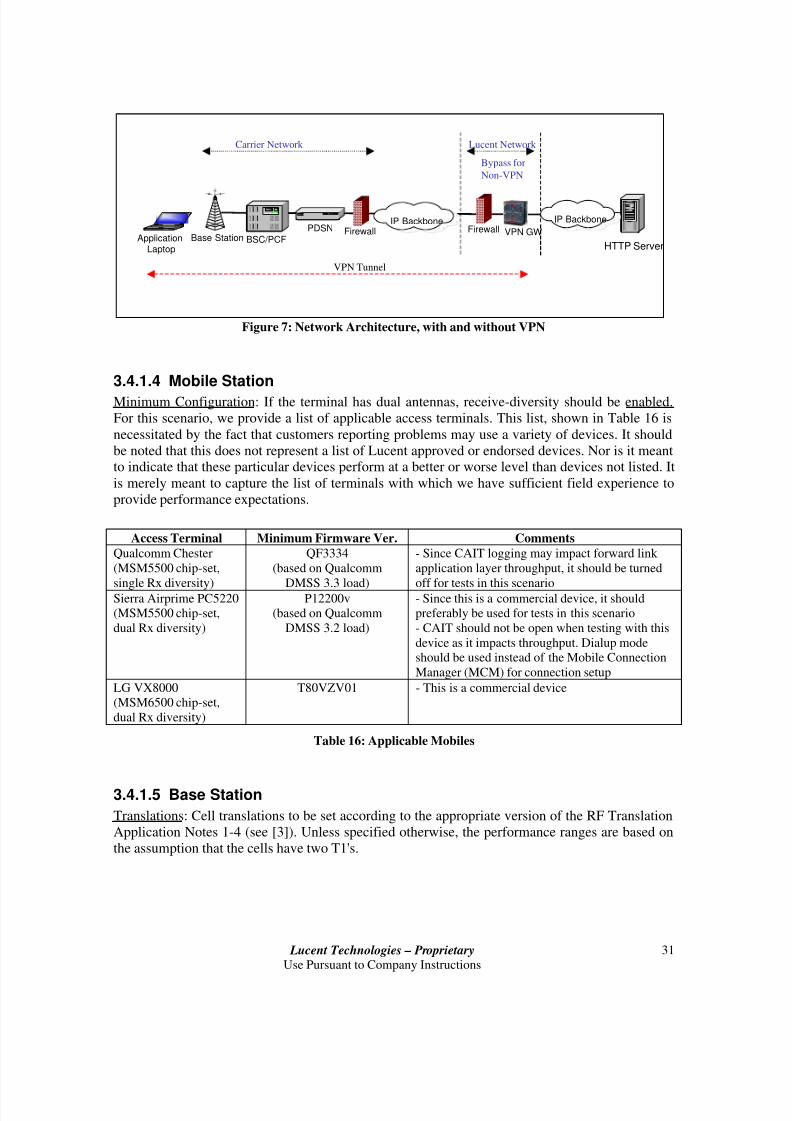
3.4.1.4 Mobile Station
Minimum Configuration: If the terminal has dual antennas, receive-diversity should be enabled.
For this scenario, we provide a list of applicable access terminals. This list, shown in Table 16 is
necessitated by the fact that customers reporting problems may use a variety of devices. It should
be noted that this does not represent a list of Lucent approved or endorsed devices. Nor is it meantto indicate that these particular devices perform at a better or worse level than devices not listed. It
is merely meant to capture the list of terminals with which we have sufficient field experience to
provide performance expectations.
Access Terminal Minimum Firmware Ver. Comments
Qualcomm Chester
(MSM5500 chip-set,
single Rx diversity)
QF3334
(based on Qualcomm
DMSS 3.3 load)
- Since CAIT logging may impact forward link
application layer throughput, it should be turned
off for tests in this scenarioSierra Airprime PC5220
(MSM5500 chip-set,
dual Rx diversity)
P12200v
(based on Qualcomm
DMSS 3.2 load)
- Since this is a commercial device, it should
preferably be used for tests in this scenario
- CAIT should not be open when testing with this
device as it impacts throughput. Dialup mode
should be used instead of the Mobile Connection
Manager (MCM) for connection setup
LG VX8000
(MSM6500 chip-set,
dual Rx diversity)
T80VZV01 - This is a commercial device
Table 16: Applicable Mobiles
3.4.1.5 Base Station
Translations: Cell translations to be set according to the appropriate version of the RF Translation
Application Notes 1-4 (see [3]). Unless specified otherwise, the performance ranges are based on
the assumption that the cells have two T1's.
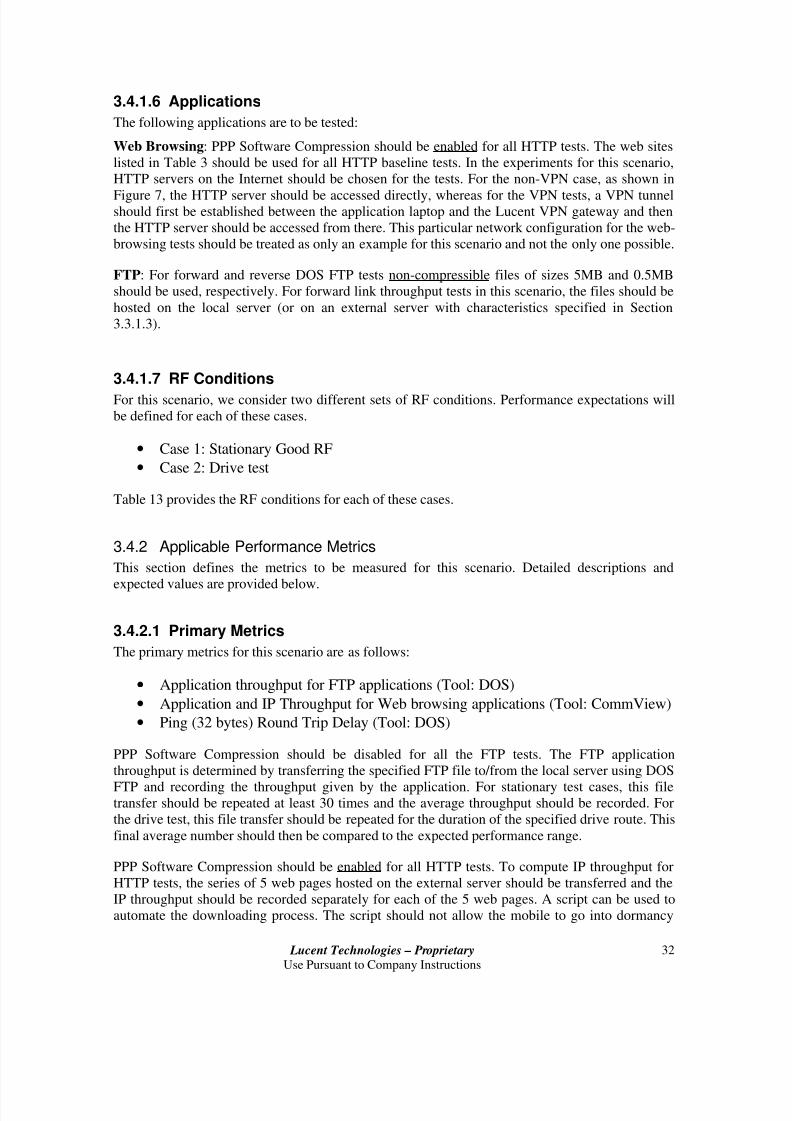
7/28/2019 1xEVDO Perf Expect v5
http://slidepdf.com/reader/full/1xevdo-perf-expect-v5 32/37
Lucent Technologies – ProprietaryUse Pursuant to Company Instructions
32
3.4.1.6 Applications
The following applications are to be tested:
Web Browsing: PPP Software Compression should be enabled for all HTTP tests. The web sites
listed in Table 3 should be used for all HTTP baseline tests. In the experiments for this scenario,
HTTP servers on the Internet should be chosen for the tests. For the non-VPN case, as shown in
Figure 7, the HTTP server should be accessed directly, whereas for the VPN tests, a VPN tunnelshould first be established between the application laptop and the Lucent VPN gateway and then
the HTTP server should be accessed from there. This particular network configuration for the web-
browsing tests should be treated as only an example for this scenario and not the only one possible.
FTP: For forward and reverse DOS FTP tests non-compressible files of sizes 5MB and 0.5MB
should be used, respectively. For forward link throughput tests in this scenario, the files should be
hosted on the local server (or on an external server with characteristics specified in Section
3.3.1.3).
3.4.1.7 RF Conditions
For this scenario, we consider two different sets of RF conditions. Performance expectations will
be defined for each of these cases.
• Case 1: Stationary Good RF
• Case 2: Drive test
Table 13 provides the RF conditions for each of these cases.
3.4.2 Applicable Performance Metrics
This section defines the metrics to be measured for this scenario. Detailed descriptions and
expected values are provided below.
3.4.2.1 Primary Metrics
The primary metrics for this scenario are as follows:
• Application throughput for FTP applications (Tool: DOS)
• Application and IP Throughput for Web browsing applications (Tool: CommView)
• Ping (32 bytes) Round Trip Delay (Tool: DOS)
PPP Software Compression should be disabled for all the FTP tests. The FTP application
throughput is determined by transferring the specified FTP file to/from the local server using DOS
FTP and recording the throughput given by the application. For stationary test cases, this filetransfer should be repeated at least 30 times and the average throughput should be recorded. For
the drive test, this file transfer should be repeated for the duration of the specified drive route. This
final average number should then be compared to the expected performance range.
PPP Software Compression should be enabled for all HTTP tests. To compute IP throughput for
HTTP tests, the series of 5 web pages hosted on the external server should be transferred and the
IP throughput should be recorded separately for each of the 5 web pages. A script can be used to
automate the downloading process. The script should not allow the mobile to go into dormancy
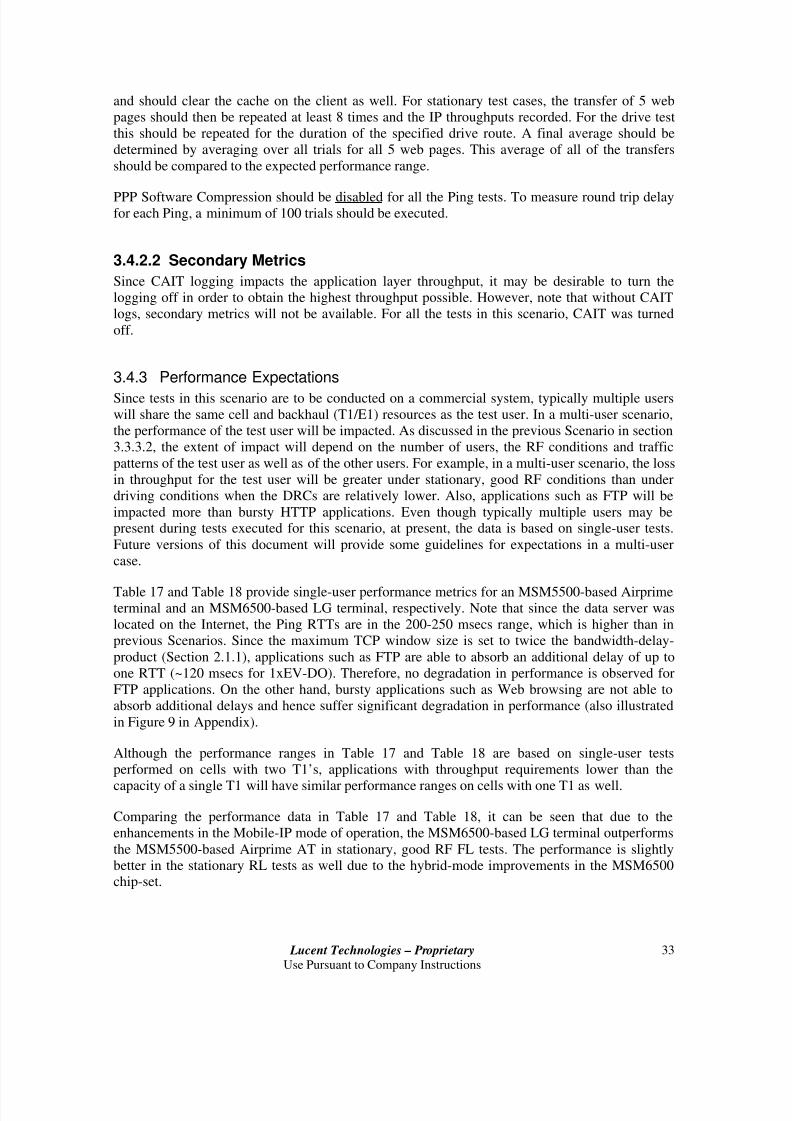
7/28/2019 1xEVDO Perf Expect v5
http://slidepdf.com/reader/full/1xevdo-perf-expect-v5 33/37
Lucent Technologies – ProprietaryUse Pursuant to Company Instructions
33
and should clear the cache on the client as well. For stationary test cases, the transfer of 5 web
pages should then be repeated at least 8 times and the IP throughputs recorded. For the drive test
this should be repeated for the duration of the specified drive route. A final average should be
determined by averaging over all trials for all 5 web pages. This average of all of the transfers
should be compared to the expected performance range.
PPP Software Compression should be disabled for all the Ping tests. To measure round trip delayfor each Ping, a minimum of 100 trials should be executed.
3.4.2.2 Secondary Metrics
Since CAIT logging impacts the application layer throughput, it may be desirable to turn the
logging off in order to obtain the highest throughput possible. However, note that without CAIT
logs, secondary metrics will not be available. For all the tests in this scenario, CAIT was turned
off.
3.4.3 Performance Expectations
Since tests in this scenario are to be conducted on a commercial system, typically multiple users
will share the same cell and backhaul (T1/E1) resources as the test user. In a multi-user scenario,
the performance of the test user will be impacted. As discussed in the previous Scenario in section
3.3.3.2, the extent of impact will depend on the number of users, the RF conditions and traffic
patterns of the test user as well as of the other users. For example, in a multi-user scenario, the loss
in throughput for the test user will be greater under stationary, good RF conditions than under
driving conditions when the DRCs are relatively lower. Also, applications such as FTP will be
impacted more than bursty HTTP applications. Even though typically multiple users may bepresent during tests executed for this scenario, at present, the data is based on single-user tests.
Future versions of this document will provide some guidelines for expectations in a multi-user
case.
Table 17 and Table 18 provide single-user performance metrics for an MSM5500-based Airprimeterminal and an MSM6500-based LG terminal, respectively. Note that since the data server was
located on the Internet, the Ping RTTs are in the 200-250 msecs range, which is higher than in
previous Scenarios. Since the maximum TCP window size is set to twice the bandwidth-delay-
product (Section 2.1.1), applications such as FTP are able to absorb an additional delay of up to
one RTT (~120 msecs for 1xEV-DO). Therefore, no degradation in performance is observed for
FTP applications. On the other hand, bursty applications such as Web browsing are not able to
absorb additional delays and hence suffer significant degradation in performance (also illustrated
in Figure 9 in Appendix).
Although the performance ranges in Table 17 and Table 18 are based on single-user tests
performed on cells with two T1’s, applications with throughput requirements lower than the
capacity of a single T1 will have similar performance ranges on cells with one T1 as well.
Comparing the performance data in Table 17 and Table 18, it can be seen that due to the
enhancements in the Mobile-IP mode of operation, the MSM6500-based LG terminal outperforms
the MSM5500-based Airprime AT in stationary, good RF FL tests. The performance is slightly
better in the stationary RL tests as well due to the hybrid-mode improvements in the MSM6500chip-set.
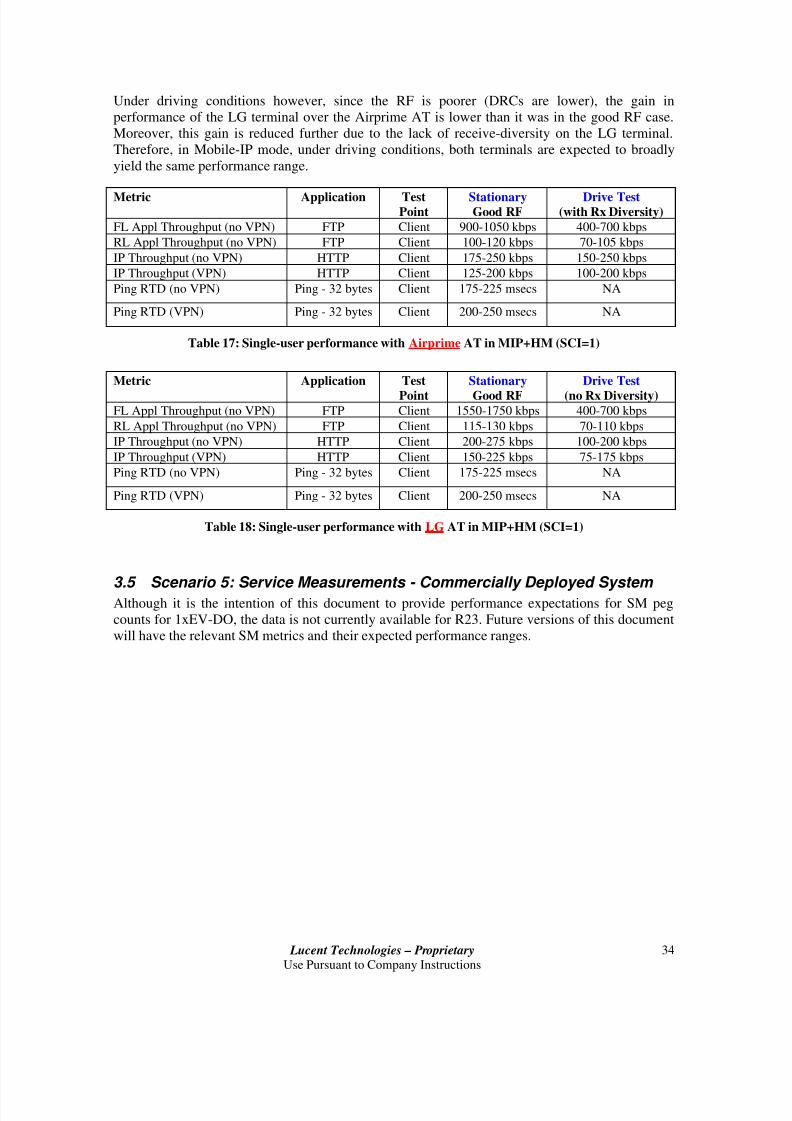
7/28/2019 1xEVDO Perf Expect v5
http://slidepdf.com/reader/full/1xevdo-perf-expect-v5 34/37
Lucent Technologies – ProprietaryUse Pursuant to Company Instructions
34
Under driving conditions however, since the RF is poorer (DRCs are lower), the gain in
performance of the LG terminal over the Airprime AT is lower than it was in the good RF case.
Moreover, this gain is reduced further due to the lack of receive-diversity on the LG terminal.
Therefore, in Mobile-IP mode, under driving conditions, both terminals are expected to broadly
yield the same performance range.
Metric Application TestPoint
StationaryGood RF
Drive Test (with Rx Diversity)
FL Appl Throughput (no VPN) FTP Client 900-1050 kbps 400-700 kbps
RL Appl Throughput (no VPN) FTP Client 100-120 kbps 70-105 kbps
IP Throughput (no VPN) HTTP Client 175-250 kbps 150-250 kbps
IP Throughput (VPN) HTTP Client 125-200 kbps 100-200 kbps
Ping RTD (no VPN) Ping - 32 bytes Client 175-225 msecs NA
Ping RTD (VPN) Ping - 32 bytes Client 200-250 msecs NA
Table 17: Single-user performance with Airprime AT in MIP+HM (SCI=1)
Metric Application Test
Point
Stationary
Good RF
Drive Test
(no Rx Diversity)FL Appl Throughput (no VPN) FTP Client 1550-1750 kbps 400-700 kbps
RL Appl Throughput (no VPN) FTP Client 115-130 kbps 70-110 kbps
IP Throughput (no VPN) HTTP Client 200-275 kbps 100-200 kbps
IP Throughput (VPN) HTTP Client 150-225 kbps 75-175 kbps
Ping RTD (no VPN) Ping - 32 bytes Client 175-225 msecs NA
Ping RTD (VPN) Ping - 32 bytes Client 200-250 msecs NA
Table 18: Single-user performance with LG AT in MIP+HM (SCI=1)
3.5 Scenario 5: Service Measurements - Commercially Deployed System Although it is the intention of this document to provide performance expectations for SM peg
counts for 1xEV-DO, the data is not currently available for R23. Future versions of this document
will have the relevant SM metrics and their expected performance ranges.
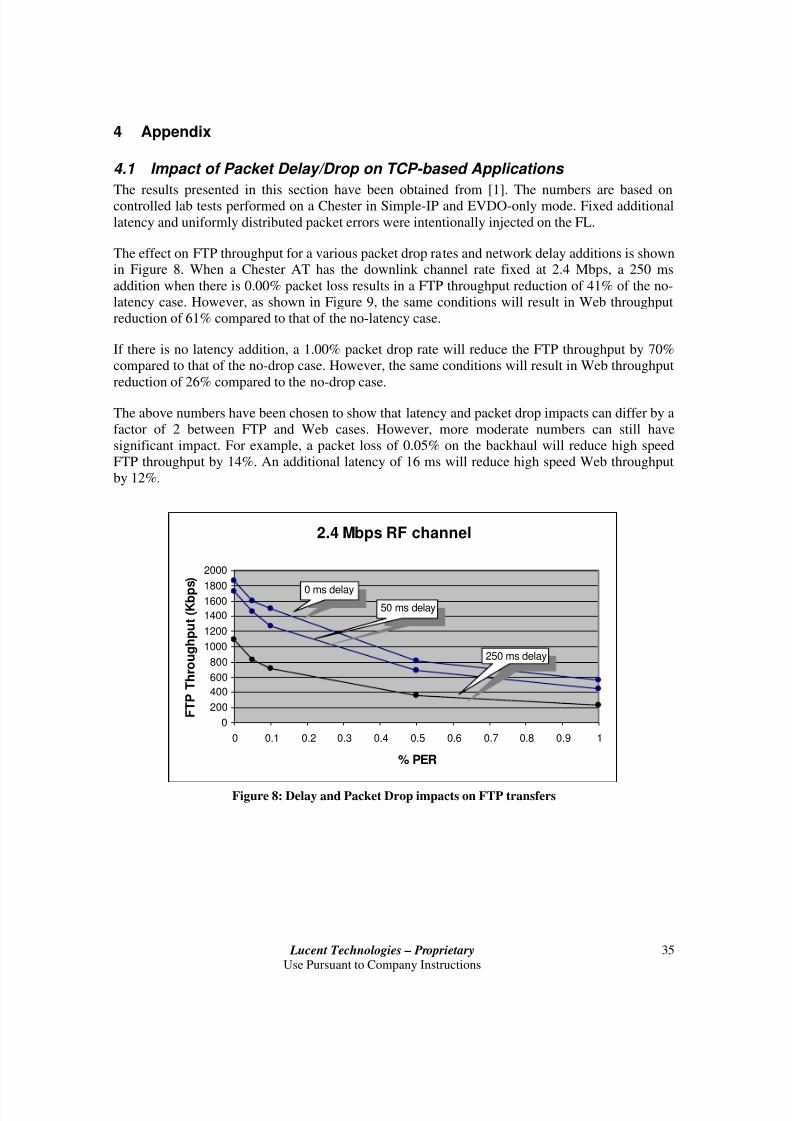
7/28/2019 1xEVDO Perf Expect v5
http://slidepdf.com/reader/full/1xevdo-perf-expect-v5 35/37
Lucent Technologies – ProprietaryUse Pursuant to Company Instructions
35
4 Appendix
4.1 Impact of Packet Delay/Drop on TCP-based Applications
The results presented in this section have been obtained from [1]. The numbers are based oncontrolled lab tests performed on a Chester in Simple-IP and EVDO-only mode. Fixed additional
latency and uniformly distributed packet errors were intentionally injected on the FL.
The effect on FTP throughput for a various packet drop rates and network delay additions is shownin Figure 8. When a Chester AT has the downlink channel rate fixed at 2.4 Mbps, a 250 ms
addition when there is 0.00% packet loss results in a FTP throughput reduction of 41% of the no-
latency case. However, as shown in Figure 9, the same conditions will result in Web throughput
reduction of 61% compared to that of the no-latency case.
If there is no latency addition, a 1.00% packet drop rate will reduce the FTP throughput by 70%
compared to that of the no-drop case. However, the same conditions will result in Web throughput
reduction of 26% compared to the no-drop case.
The above numbers have been chosen to show that latency and packet drop impacts can differ by a
factor of 2 between FTP and Web cases. However, more moderate numbers can still have
significant impact. For example, a packet loss of 0.05% on the backhaul will reduce high speed
FTP throughput by 14%. An additional latency of 16 ms will reduce high speed Web throughput
by 12%.
2.4 Mbps RF channel
0
200
400
600
800
1000
1200
1400
16001800
2000
0 0.1 0.2 0.3 0.4 0.5 0.6 0.7 0.8 0.9 1
% PER
F T P T h r o u g h p u t ( K b p s )
0 ms delay
50 ms delay
250 ms delay
Figure 8: Delay and Packet Drop impacts on FTP transfers
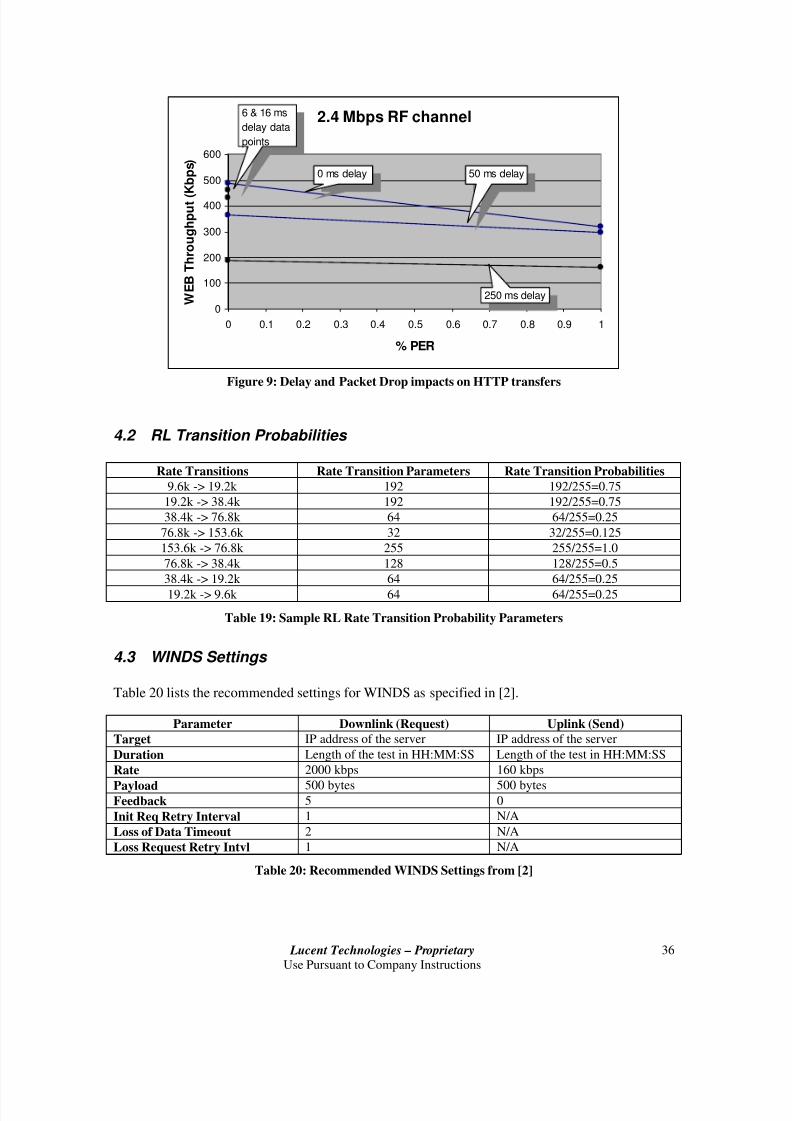
7/28/2019 1xEVDO Perf Expect v5
http://slidepdf.com/reader/full/1xevdo-perf-expect-v5 36/37
Lucent Technologies – ProprietaryUse Pursuant to Company Instructions
36
2.4 Mbps RF channel
0
100
200
300
400
500
600
0 0.1 0.2 0.3 0.4 0.5 0.6 0.7 0.8 0.9 1
% PER
W E B T h r o u g h p u t ( K b p s )
0 ms delay 50 ms delay
250 ms delay
6 & 16 ms
delay data
points
Figure 9: Delay and Packet Drop impacts on HTTP transfers
4.2 RL Transition Probabilities
Rate Transitions Rate Transition Parameters Rate Transition Probabilities
9.6k -> 19.2k 192 192/255=0.75
19.2k -> 38.4k 192 192/255=0.75
38.4k -> 76.8k 64 64/255=0.25
76.8k -> 153.6k 32 32/255=0.125
153.6k -> 76.8k 255 255/255=1.0
76.8k -> 38.4k 128 128/255=0.5
38.4k -> 19.2k 64 64/255=0.25
19.2k -> 9.6k 64 64/255=0.25
Table 19: Sample RL Rate Transition Probability Parameters
4.3 WINDS Settings
Table 20 lists the recommended settings for WINDS as specified in [2].
Parameter Downlink (Request) Uplink (Send)
Target IP address of the server IP address of the server
Duration Length of the test in HH:MM:SS Length of the test in HH:MM:SS
Rate 2000 kbps 160 kbps
Payload 500 bytes 500 bytesFeedback 5 0
Init Req Retry Interval 1 N/A
Loss of Data Timeout 2 N/A
Loss Request Retry Intvl 1 N/A
Table 20: Recommended WINDS Settings from [2]
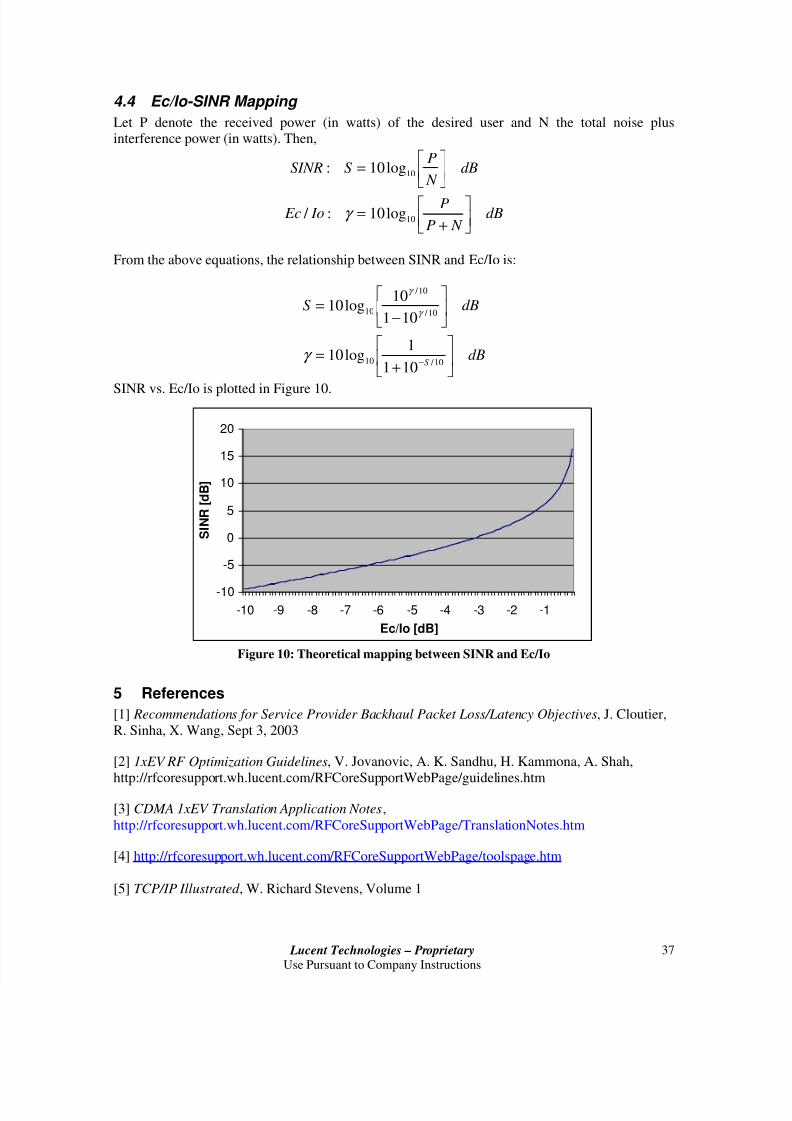
7/28/2019 1xEVDO Perf Expect v5
http://slidepdf.com/reader/full/1xevdo-perf-expect-v5 37/37
4.4 Ec/Io-SINR Mapping
Let P denote the received power (in watts) of the desired user and N the total noise plusinterference power (in watts). Then,
dB N P
P Io Ec
dB N
PS SINR
+
=
=
10
10
log10: /
log10:
γ
From the above equations, the relationship between SINR and Ec/Io is:
dB
dBS
S
+
=
−
=
− 10 / 10
10 /
10 /
10
101
1log10
101
10log10
γ
γ
γ
SINR vs. Ec/Io is plotted in Figure 10.
-10
-5
0
5
10
15
20
-10 -9 -8 -7 -6 -5 -4 -3 -2 -1
Ec/Io [dB]
S I N R [ d B ]
Figure 10: Theoretical mapping between SINR and Ec/Io
5 References
[1] Recommendations for Service Provider Backhaul Packet Loss/Latency Objectives, J. Cloutier,
R. Sinha, X. Wang, Sept 3, 2003
[2] 1xEV RF Optimization Guidelines, V. Jovanovic, A. K. Sandhu, H. Kammona, A. Shah,
http://rfcoresupport.wh.lucent.com/RFCoreSupportWebPage/guidelines.htm
[3] CDMA 1xEV Translation Application Notes,
http://rfcoresupport.wh.lucent.com/RFCoreSupportWebPage/TranslationNotes.htm
[4] http://rfcoresupport.wh.lucent.com/RFCoreSupportWebPage/toolspage.htm
[5] TCP/IP Illustrated , W. Richard Stevens, Volume 1
Recommended