2016 Environmental reportAdolfo Suárez Madrid-Barajas Airport

Page 1 of 25
Contents
1. Presentation of Aena SME S.A.......................................................................................... 2
2. Presentation of the Adolfo Suárez Madrid-Barajas Airport ................................................. 2
3. Integrated Quality and Environmental Management System ............................................. 3 3.1. Aena’s Integrated Quality, Environmental and Energy Efficiency Management Policy .................... 3
4. Environmental aspects ...................................................................................................... 4 4.1. Noise .................................................................................................................................................. 4
4.1.1. South Configuration / Operations .................................................................................................. 4 4.1.2. Measures to minimize noise pollution ............................................................................................ 5
4.2. Atmosphere........................................................................................................................................ 7 4.2.1. Carbon Footprint ............................................................................................................................ 7 4.2.2. Air Quality in the Airport Complex................................................................................................ 10
4.3. Soil ................................................................................................................................................... 13 4.3.1. Actions ......................................................................................................................................... 13
4.4. Water ............................................................................................................................................... 13 4.4.1. Water quality ................................................................................................................................ 13 4.4.2. Rain water .................................................................................................................................... 13 4.4.3. Wastewater monitoring ................................................................................................................ 14 4.4.4. Surface water. Streams and lagoon. ........................................................................................... 15
4.5. Waste ............................................................................................................................................... 15 4.5.1. Hazardous Waste ........................................................................................................................ 15 4.5.2. Non-hazardous waste .................................................................................................................. 16
4.6. Use of natural resources .................................................................................................................. 16 4.6.1. City water usage .......................................................................................................................... 16 4.6.2. Fuel use in furnaces .................................................................................................................... 17 4.6.3. Electricity usage ........................................................................................................................... 18 4.6.4. Paper usage................................................................................................................................. 18
4.7. Biodiversity....................................................................................................................................... 18 4.7.1. Vegetation .................................................................................................................................... 18 4.7.2. Fauna ........................................................................................................................................... 21
5. Aena Environmental Office .............................................................................................. 22 5.1. Complaints and information requests received and analyzed ......................................................... 22
5.1.1. Types of complaints and information requests ............................................................................ 23 5.1.2. Distribution of C&I by municipality ............................................................................................... 23
6. Notable environmental initiatives at the airport ................................................................ 24 6.1. Expoambiente Area Visits ................................................................................................................ 24 6.2. World Environment Day ................................................................................................................... 25
7. Environmental awards and distinctions ............................................................................ 25 7.1. Ministry of the Environment’s Carbon Footprint Registry. ............................................................... 25

Page 2 of 25
1. Presentation of Aena SME S.A.
Aena SME S.A. (hereinafter, Aena) is the largest airport operator in the world in terms of passenger traffic.
Over 500 million passed through Spain’s airports in the last three years.
The company runs 46 airports and 2 heliports in Spain and is directly and indirectly involved in managing an
additional 15 airports throughout the world.
The company’s experience, capacity and professional staff make it a leader in managing airport services. It
offers its clients - passengers, airlines, handling agents and general users - a comprehensive, top-quality
service.
The airports of Aena are among the most modern and functional in the world and feature the most advanced
technologies. Their efficient services and ample shopping options, in exclusive settings with highly
prestigious brands and innovative products, guarantee that passengers will have a safe and comfortable
stay. They are also designed for everyone, with full accessibility and a service for persons with reduced
mobility that is internationally renowned for its excellence.
Aena is a responsible company, one that is aware of the need to carry out its role as the economic engine in
the areas of influence of its airports while remaining committed to development and sustainability.
2. Presentation of the Adolfo Suárez Madrid-Barajas Airport
The Adolfo Suárez Madrid-Barajas Airport is currently part of the company Aena, which began its activity on
8 June 2011 pursuant to Development Ministry Order 1525/2011. This Order specifies the effective start date
for the company’s activities and obligations in the area of airport management, as determined by Royal
Decree 13/2010 of 3 December.
The airport is firmly committed to providing its services in a way that is sustainable and compatible with
preserving the environment. Over the years, the way that Aena has been managed has allowed it to obtain
and renew an ISO 14001 certificate, which accredits the proper environmental management of the airport,
thanks to the efforts and hard work of Aena, airlines, entities, institutions and airport users.
Aena has a management system that combines an environmental and energy policy with a quality policy that
is designed to save resources and make the company more efficient and competitive.
The implementation of energy-saving measures, such as the installation of low-energy systems, the
optimization of the Automated Baggage Handling System (SATE) and the installation of solar panels, along
with other measures to more efficiently use resources and recover waste, highlight the airport’s continuing
commitment to improve the environment.
The minimization and monitoring of noise pollution from operations also remains one of the most important
aspects, and is the focus of a lot of work and investment. Improved operations, by implementing precision
aviation systems, changing routes in consensus with all of the parties involved in aviation activity, updating
the Web-Track application, which is accessible through the Aena website, in order to offer reliable and

Page 3 of 25
transparent information on operations and associated noise levels, and actions to control and monitor routes,
are all essential to minimizing the effects of our activity on the environment.
Lastly, we note that this report is intended to make available to users, clients and employees the information
on the environmental performance of the Adolfo Suárez Madrid-Barajas Airport for the year 2016, so as to
complement the information that is published annually on its public website.
3. Integrated Quality and Environmental Management System
The Adolfo Suárez Madrid-Barajas Airport has had an ISO 14001:2004 certified Environmental Management
System since the year 2000. The environmental management has evolved at the corporate level, resulting in
its inclusion in the Integrated Management System (IMS), which also incorporates quality management, as
per the UNE-EN ISO 9001:2008 Standard.
In 2011, Aena adopted the environmental and energy principles that were ratified by the Aena Committee in
September of 2011. The most recent version of Aena’s policy was approved in November 2016 and is
presented below:
3.1. Aena’s Integrated Quality, Environmental and Energy Efficiency Management Policy
Aena, as a leader in providing air transport services in a framework of quality and environmental
management and efficiency, reiterates its firm commitment to excellence in managing the services it offers
for the purpose of promoting the safe, efficient and sustainable development of air transport and sustaining
outstanding results over time for the organization’s stakeholders.
To this end, it engages in constant and ongoing activities in these areas by planning and implementing
various strategic areas of action, the goal being to contribute to the sustainable development of air transport
so as to make its activity compatible with the preservation of the environment.
In keeping with this commitment, Aena promotes the implementation and maintenance of an Integrated
Quality and Environmental Management System that is based on the requirements specified in the
applicable international standards and that can be certified pursuant to EU, national, regional and local laws.
Along these lines, Aena undertakes the following guiding principles, which provide a framework for the
conduct of its activity:
Promote the systematic integration of quality, environmental and energy efficiency management and
periodically evaluate the sustainable performance of our organization and the perception of our clients
for the purpose of constantly improving our management and services by laying out priority areas of
activity based on our results.
Rely on the involvement and commitment of its executives to achieve the goals proposed, using
Aena’s values and strategies as the main reference for everyone at the organization.

Page 4 of 25
Ensure the constant training of our professionals through quality and environmental training and
awareness programs to ensure the correct performance of their activities.
Offer excellent facilities and services to our stakeholders by employing and enhancing the knowledge
that exists within our organization and innovating and assimilating new technological advances.
Promote the ongoing collaboration and partnership with stakeholders in a way that is transparent, in
order to satisfy their needs and expectations as these relate to our activity.
Enforce the legal requirements applicable to our area of activity, as well as other requirements that the
organization commits to in the areas of quality, environmental protection and energy efficiency.
Manage resources efficiently and ensure that information is available to promote and achieve the
goals and targets specified, as well as to constantly improve the performance of the organization’s
processes and their results.
Promote energy efficiency and phase in the use of renewable energies as the cornerstone for
reducing greenhouse gas emissions, optimizing energy consumption and the use of fossil fuels.
Promote activities intended to reduce atmospheric, water and soil pollution, minimize noise levels in
and around the airport, reuse, recycle and properly handle the waste generated by our activity, and
more efficiently use our natural resources.
Communicate this Policy to every employee and company that engages in activity at Aena and make it
available to the stakeholders.
4. Environmental aspects
The Adolfo Suárez Madrid-Barajas Airport identifies and monitors the environmental aspects associated with
its activity so as to minimize their potential impact.
Below is a brief summary of the prevention and monitoring activities applied in each case and the results for
the 2016 calendar year.
4.1. Noise
The Environmental Department takes the following steps to ensure that the specified noise limits are
complied with:
Monitoring of operations to detect possible violations of established procedures.
Noise controls using a noise monitoring system that takes sound readings in affected municipalities
around the airport.
Reporting and engaging with the parties involved in aviation activities.
4.1.1. South Configuration / Operations

Page 5 of 25
Table 1 shows the number of hours in the South Configuration and the percent with respect to the annual
total.
Number of hours in South Configuration and percent with respect to annual total
Year 2016 (Period) # hours SC % SC / Total hours
Day (7 am - 11 pm) 1507.27 17.21%
Night (11 pm - 7 pm) 432.41 4.94%
TOTAL 1939.68 22.15%
Table 1. Number of hours in South Configuration and percent with respect to annual total Source: Environmental Department.
The tables below show the distribution of operations at night and during the day in both the north and south
configurations (Tables 2 and 3).
Distribution of operations 2016 Daytime period
Operational Configuration Daytime routes No. of operations Aggregate
SOUTH
Takeoffs 14R&14L Total D14 44,587 13.1
Arrivals 18R&18L Total A18 42,906 12.5
Total Operations South Configuration 87,493 25.6%
NORTH
Departures 36R&36L Total D36 128,023 37.5
Arrivals 32R&32L Total A32 125,867 36.9
Total Operations North Configuration 253,890 74.4%
Total Daytime Operations 2016 341,383 100%
Table 2. Total daytime operations in 2016. Source: Environmental Department.
Distribution of operations 2016 Nighttime period
Configuration South configuration Nighttime routes Operations Aggregate
SOUTH
Departures 14R&14L Total D14 2,184 6.7
Arrivals 18R&18L Total A18 2,920 9.0
Total Operations South Configuration 5,104 15.70%
NORTH
Departures 36R&36L Total D36 12,234 37.6
Arrivals 32R&32L Total A32 15,188 46.7
Total Operations North Configuration 27,422 84.30%
Total Nighttime Operations 2016 32,526 100%
Table 3. Total nighttime operations in 2016 Source: Environmental Department.
4.1.2. Measures to minimize noise pollution
A brief description of the measures implemented at the airport to minimize noise pollution is provided below:

Page 6 of 25
1. Preferred runways and routes
Preferred runways and routes are used for noise abatement so as to separate the initial and final flight paths.
This includes the use of turns to move airplanes away from noise sensitive areas.
In the South configuration, the nighttime period is in effect from 11 pm to 9 am LT on Friday and Saturday
nights, whenever allowed by operating circumstances. Standard instrument departures (SID) for the daytime
period must be used for their assigned times.
2. Threshold displacement
The modification to the runway threshold is maintained, thus increasing the flyover altitude over towns near
the airport and reducing the noise levels in said towns, as required by the Aeronautical Information
Publication (AIP) and the Action Plan. Airport noise easements.
3. Noise abatement procedures during takeoff
Aircraft cannot leave a standard instrument departure before reaching a flight level of 10000 ft. The use of
flight paths is limited to certain aircraft whose noise levels are higher than the rest. Moreover, noise
abatement departure procedures (NADP) are also applied.
4. Noise abatement procedures during landing
In normal weather conditions, approach and landing operations are carried out at an angle equal to or
greater than that defined by the GP of the ILS or PAPI for each runway.
Landings on 18R must intercept the ILS in a minimum flaps and gear-up configuration until 5 DMEILS, as
long as operational safety can be maintained at all times.
5. Implementation of continuous descent approaches (CDA)
Continuous descent approaches (CDA) have been in use since 2010, replacing the stairstep approaches,
which have a higher acoustic impact due to the change in engine thrust.
6. APU usage restrictions
The prohibition on using the airplane’s Auxiliary Power Unit (APU) in certain parking stands is maintained,
requiring instead the use of 400-Hz electricity supplied through mobile units or permanent connections on
the jet bridge.
7. Restrictions on engine testing
Engines cannot be tested above idle thrust outside designated times and/or areas.
8. Prohibition to use reverse thrust
Reverse thrust cannot be used above idle thrust on certain runways at certain times, except for safety
reasons.

Page 7 of 25
9. Noise fees and quotas
Penalties are applied to the landing fee for those aircraft that exceed the acoustic certification limits in place,
which are based on International Civil Aviation Organization Annex 16. Moreover, each airline has a total
noise quota assigned for carrying out its operations that is based on the effective perceived and certified
noise level.
10. Prohibition on training and test flights.
No training or testing flights may be conducted in any configuration. No aircraft that is not in radio contact
may enter the aerodrome.
11. General taxi, movement and parking procedure
Engines cannot be started up above idle thrust until the aircraft is lined up in the taxiway. Also, reverse thrust
cannot be used to leave a parking stand that normally requires pushback with a tractor.
12. Flight path tracking and compliance
The noise monitoring system (SIRMA) at the Madrid-Barajas Airport is used to check for compliance with the
noise abatement routes and procedures in place at the airport and to identify potential violations.
13. Reduced operations of ICAO Chapter II aircraft
Since 2002, all operations involving aircraft certified under Chapter 2 of Annex 16, Vol. 1, Part 2, of the
International Civil Aviation Organization have been prohibited.
14. Restrictions on marginally compliant aircraft
Operations involving aircraft that exceed the limit certification values in Vol. 1, Part 2, Chapter 3, Annex 16 of
the International Civil Aviation Organization by an aggregate margin of 5 EPNdB (effective perceived noise in
decibels) are prohibited.
15. Restriction of aircraft movements during nighttime period in parking stands on R-5, R-6 and the
South Dock.
Movements on R-5, R-6 and the South Dock are prohibited from 11 pm to 7 am LT.
4.2. Atmosphere
4.2.1. Carbon Footprint
For the fifth year in a row, the Adolfo Suárez Madrid-Barajas Airport prepared a greenhouse gas (GHG)
emissions report to determine the carbon footprint associated with its activity so as to maintain its
certification in ACI Europe’s Airport Carbon Accreditation Program. This is a voluntary program with 190
member airports, 116 of them in European countries (Illustration 1).

Page 8 of 25
The requirements used to carry out and verify the inventory, as well as to write the associated reports, are
contained in ISO 14064 “Greenhouse Gases”. This standard details the principles and requirements for
organizations of all kinds to design, develop and manage GHG inventories.
Airport Carbon Accreditation Program
Illustration 1. Airports in the program Source: http://www.airportcarbonaccredited.org/
On 18 June 2008, via a resolution on climate change, ACI Europe (Airports Council International, European
Region) committed to helping airports evaluate and reduce their carbon footprints. To this end, this
organization, along with WSP Environmental, created “Airport Carbon Accreditation” (ACA), a voluntary
accreditation system for airports that promotes and allows for the implementation of management processes
to reduce emissions associated with airport operations.
In 2012, the Adolfo Suárez Madrid-Barajas Airport reached Level 2: “Reduction”, a level that recognizes the
airport’s efforts to manage and reduce its CO2 emissions by mapping and monitoring its carbon footprint and
establishing reduction measures (Illustration 12).
The airports of Adolfo Suárez Madrid-Barajas, Barcelona-El Prat and Palma de Mallorca are the only
Spanish airports that are accredited in the Airport Carbon Accreditation at this level.
22
6
9
116 37

Page 9 of 25
Illustration 2. Airport Carbon Accreditation Level-2 certificate for the Adolfo Suárez Madrid-Barajas Airport, valid until 3 April 2017: “Reduction”. Source: Airport Carbon Accreditation
The year 2016 saw a reduction in CO2 emissions with respect to 2015 due to the emission factor used for the
calculation and to the energy saving activities implemented.
Emission factor used: In 2016, the factor published by Red Eléctrica de España was 0.214
kgCO2/kWh, as compared to the one published for 2015: 0.266 kgCO2/kWh.
Energy saving initiatives carried out in 2016: installation of LED technology in HVAC rooms, P1
baggage sorting area, replacement of lights on runway 36L, P2 photovoltaic installation and
replacement of lights in hall 1 of T1.
This yielded a total savings of 13,344.20 TCO2, which is equivalent to a 12.41% reduction with respect to the
previous year.
As the table below shows, the emissions/passenger ratio fell considerably in 2016, remaining below the
average for the past three years.
Comparison of passenger/TCO2ratios in past three years
2013 2014 2015 2016
Emissions (TCO2) 100,321.35 98,950.30 107,682.72 94,338.52
Passengers 39,735,618 41,833,686 46,828,279 50,420,583
Ratio kg CO2 emissions/passenger 2.524 2.365 2.299 1.869
3-year average 2.396 kg CO2/passenger
Table 4. Comparison of passenger/TCO2 ratios for past three years by location criteria. Source: Compiled internally

Page 10 of 25
As Table 4 shows, the kgCO2 to passenger ratio calculated for 2016 (1.869 kgCO2/passenger) is below the
average ratios for the three previous years (2.396 kgCO2/passenger). Graph 1 shows the presence of a clear
downward trend in the kgCO2/passenger ratio.
0,000000
0,500000
1,000000
1,500000
2,000000
2,500000
3,000000
2013 2014 2015 2016
Ratio emisiones por pasajero (kgCO2/pasajero)
Ratio emisiones
KgCO2/pasajero
Media 3 años
Graph 1: Trend in passenger/kgCO2 ratio, 2013-2016 Source: Compiled internally.
4.2.2. Air Quality in the Airport Complex
The air quality in and around the airport is monitored using a system that constantly measures the air
pollution. The system is called REDAIR (Air Quality Monitoring Network), and it is used to determine the
concentrations of the main pollutants produced as a result of the airport’s activity.
Particulate matter (PM10 and PM2.5).
Nitrogen dioxide / Nitrogen oxides
(NO2/NOx)
Ozone - (O3)
Sulfur dioxide – (SO2)
Total hydrocarbons (methane and non-
methane).
Lead (Pb).
Benzene (C6H6).
Carbon monoxide (CO).
The Air Quality Monitoring Network consists of three fixed stations and one mobile laboratory. The
purpose of these stations is to constantly and automatically monitor the air quality in areas affected by airport
operations (takeoff, landing and taxi) in order to determine the level of compliance with the limits specified in
the applicable law.
The locations of these stations, agreed to with the Ministry of the Environment and the Madrid regional
government, are shown in the map provided below. The locations of two REDAIR stations were modified this
past year:

Page 11 of 25
Redair 3: Moved on 31 August 2016. It was relocated from the vicinity of the South Dock, across from
the R5-R6 apron, to its new location in the “T-4 Satellite Terminal Firefighting Service Building”.
SATELLITE FFS
Mobile Laboratory: Moved on 20 December 2016. Moved from its original location in the “T-4
Satellite Terminal Firefighting Service Building” (SATELLITE FFS), where it had been since 18 May
2010, to UTM X coordinates 453602.06 andUTM Y 4479007.88.
The data obtained in 2016 show that the main pollutants in the air quality monitoring network of the Madrid-
Barajas Airport were nitrogen dioxide (NO2), particulate matter (PM10) and ozone (O3).
Over the course of 2016, however, there was a slight to moderate downward trend for NO2 and PM10.
Reaching a general conclusion on the sources of the various pollutants analyzed is not simple, but the
concentrations of NO2 in the networks of both the region and city of Madrid exhibit the same trend as in the
REDAIR network, which may lead to the conclusion that the generalized presence of this pollutant is similar
throughout the region of Madrid.
Considering how one of the main emission sources for these two pollutants is road traffic, how the airport is
bounded by the A-2, M-14, M-11 and M-50 highways (see map Illustration 3) and how no relationship has
been found between pollution levels and the number of aircraft arrivals and departures, it may be concluded
that the levels of NO2and PM10 detected in the REDAIR stations of the Adolfo Suárez Madrid-Barajas Airport
are due primarily to road traffic.
It should be noted that REDAIR station 3 had been in the area that is most affected by nearby road traffic
until 31 August 2016.
As for ozone, no violations of the alert threshold were recorded at any of the REDAIR stations in 2016.
The map below shows the locations of the REDAIR stations.
For more information, please see the following link: http://www.Aena.es/es/aeropuerto-madrid-
barajas/calidad-aire.html

Page 12 of 25
Illustration 3. Locations of the REDAIR stations. Source: Aena.

Page 13 of 25
4.3. Soil
4.3.1. Actions
The monitoring network defined by the airport’s Environmental Department in the “Action Plan for 1 July
2014 to 30 June 2018. Maintenance and Comprehensive Monitoring Service for Soil and Groundwater at the
Adolfo Suárez Madrid-Barajas Airport”, consists of
308 piezometers associated with the hydrocarbon (HC) plume monitoring activities and tracking of
piezometric levels of other systems to monitor soil quality.
The following activities were carried out in 2016:
Activities to intercept and extract hydrocarbons, associated with fuel storage and distribution actions.
Campaigns to monitor the quality of groundwater.
Campaigns to monitor the quality of interstitial air.
Start of work to expand the airport’s network of piezometers.
4.4. Water
4.4.1. Water quality
The quality of the water in the bodies of water that run through the airport, as well as of the water discharged
into them as a result of its activities, is monitored through annual samples (Water Control Program) that
collect water from surface, rain water, underground and wastewater sample points. All of the samples are
taken and tested under a water analysis and quality control service contract that is awarded to an accredited
partner agency of the water authority for the purposes of water quality monitoring and control. This agency is
duly accredited to take and test the required samples.
4.4.2. Rain water
The airport has 16 units for treating rain water: 10 oil-water separators (OWS) and 6 desanders. One unit is
located at each of the 16 discharge points authorized by the Tajo Water Authority (CHT).
The quality of the rain water discharged to a public body of water is analyzed every six months. The results
of the physical/chemical analyses are compared to the limits imposed by the Tajo Water Authority in the
associated discharge permit.
In 2016, the analysis values for suspended solids (SS) and hydrocarbons (HC) were below those specified in
said Discharge Permit (Table 5).

Page 14 of 25
Rain Water Sample Points 2016
No.
Name
SS (mg/l) HC (mg/l)
H1 H2 H1 H2
1 Zorreras N & S OWS 17 4.7 <0.5 0.35 Limit in Discharge Permit
2 Valdebebas S. OWS 7 3.1 <0.5 <0.05
3 Valdebebas N. OWS 19 3.6 <0.5 <0.05 Parameter Limit
4 Apron OWS 10 3.5 <0.5 0.44 HC (mg/l) 5
5 Remote OWS 9 5.2 <0.5 0.27 SS (mg/l) 35
6 PIC area OWS 5 3.5 <0.5 0.5
7 Z Cab 36ROWS 5 7 <0.5 2
8 18L/36ROWS no. 1 4 3.7 <0.5 0.05
9 18L/36RDesander 1 4 5.5 <0.5 <0.05
10 18L/36RDesander 3 6 3 <0.5 <0.05
11 18L/36R Apron OWS 4 5.2 <0.5 <0.05
12 14L/32R Dep. Bom. 10 4.4 <0.5 <0.05
13 14L/32RDesander 1 8 5.9 <0.5 0.10
14 14L/32R Apron OWS 6 7.1 <0.5 <0.05
15 18L/36RDesander 2 4 4.1 <0.5 <0.05
16 14L/32RDesander 2 3 5.1 <0.5 0.14
Table 5. Rain Water Sample Points 2016 Source: Compiled internally
4.4.3. Wastewater monitoring
The household, urban and industrial wastewater generated in the airport’s various buildings and facilities are
routed into the airport’s sewage system and sent to the municipal sewage network (Barajas Integrated
Sewage System).
The airport has nine points for discharging wastewater: Barajas, Airside Powerplant (CELA) - Control Tower
(TWR), T4 Satellite, T4 South, T4 North, End of line for terminals T1, T2&T3, Modular Cargo Zone, Iberia
MET-MASA Zone and Technology Systems Lot.
In order to comply with the legal requirements in terms of the maximum discharge parameter values
specified in Decree 57/2005 of the Region of Madrid, the airport monitors the activities of Aena as well as of
its concessionaires by taking readings at the nine wastewater discharge points:
Annual checks: “Technology Systems Lot” discharge point, which includes the wastewater from the
waste transfer plant, the cogeneration plant, the aircraft sewage treatment plant and the airport’s
number 1 powerplant.
Monthly checks: sampling at the Barajas, T4 Satellite, End of line for terminals T123, the modular
cargo zone, and the Barajas and Iberia MET MASA points.

Page 15 of 25
Quarterly checks: sampling at the four discharge points in the airport expansion area: T4 South, T4
North, CELA-TWR.
The total nitrogen levels in the terminals were exceeded in 2016 due to the nature of the discharge
(bathroom water). Hydrocarbon and grease readings were also exceeded, mainly at the end of the line for
terminals T123. Actions are being taken to resolve this problem by improving the discharge conditions.
4.4.4. Surface water. Streams and lagoon.
A chemical/physical analysis of the water in the airport lagoon and upstream and downstream of the
Valdebebas, Zorreras and La Vega streams is done every six months. All of the sample points analyzed in
2016 satisfy the quality targets specified in the Tajo Water Plan for this segment of the Jarama River basin,
with the exception of the La Vega and Zorreras streams, which receive discharges from treatment stations,
meaning they enter the airport with a high pollutant load, primarily nitrogen. As a result, their status as they
flow through the airport is tracked to verify that the pollutant load decreases. This way it can be shown that
the airport does not contribute to polluting these streams.
4.5. Waste
The Adolfo Suárez Madrid-Barajas Airport generates a considerable amount of waste, both hazardous and
non-hazardous, due to the constant passenger traffic and to all of the activities that take place there.
The airport’s priorities in terms of handling the waste generated are: optimize, reduce, promote best
practices among employees, ensure the waste is properly sorted, stored and managed and track the waste
generated by the companies that operate at the airport through the Environmental Monitoring of Companies
Service (SERCOM).
In order to ensure that the waste is correctly handled and sorted, the airport has ten public waste collection
points, a waste transfer plant, a waste triage plant and twenty private collection points for companies that are
regarded as large waste producers.
4.5.1. Hazardous Waste
In 2016, the amount of hazardous waste (HW) generated at the airport fell considerably due to the spike in
2015 caused by the amount of fiber cement generated by cleaning activities in the area of La Cuña. The year
2016 saw a total of 176.10 tons of HW generated, versus the 270.05 generated in 2015 (Table 6).
Last year, 47.75 tons of lead batteries were processed due to the periodic removal of batteries from the
UPS’s, which accounted for over 25% of the HW generated in 2016.
As well as lowering the amount of HW generated, the airport also managed to increase the amount of HW
that was recovered with respect to the previous year, going from 20.91% in 2015 to 39.11% in 2016 (Table 6
and Graph 2).

Page 16 of 25
Hazardous waste
2015 2016
Hazardous
Waste Tons % Tons %
Disposed 213.60 79.09 107.22 60.89
Recovered 56.46 20.91 68.87 39.11
TOTAL 270.06 100 176.10 100
10%
15%
20%
25%
30%
35%
40%
2015 2016
% Valorización Residuos Peligrosos
Table 6. Tons and percent of waste disposed and recovered since 2015 Source: Compiled internally.
Graph 2. Hazardous waste recovered 2015-2016 Source: Compiled internally.
4.5.2. Non-hazardous waste
The amount of non-hazardous waste (NHW) generated at the airport has been on the rise since 2014. This
trend is directly related to the increase in the number of passengers handled in recent years. If we relate the
generation of NHW to the number of passengers, we see a drop in the ratio of kg NHW/passenger (Table 7
and Graph 3):
Non-hazardous waste
2014 2015 2016
Passengers 41,833,686 46,828,279 50,420,583
kg Non-hazardous
waste
10,380,650 11,032,485 11,354,982
Ratio kg NHW/Passenger
0.2485 0.2359 0.2252
0,22
0,23
0,24
0,25
0,26
2014 2015 2016
Ratio kg RNP/pasajero
Table 7. Ratio between number of passengers and kg of NHW
generated Source: Compiled internally. Graph 3. Ratio kg NHW/Passenger 2016 Source: Compiled
internally.
4.6. Use of natural resources
The trend in the use of natural resources at the airport is shown below:
4.6.1. City water usage
Water use in the last three years has gone down slightly due to the implementation of measures for the
responsible use of water. (Table 8 and Graph 4).Graph 4

Page 17 of 25
City water usage (m3)
Year 2014 2015 2016
m3 1,032,384 1,133,792 1,106,617
Passengers 41,833,686 46,828,279 50,420,583
Liters/passenger 24.67 24.21 21.94
Table 8. City water usage (m3). Source: Compiled internally. Graph 4. City water usage (m
3). Source: Compiled internally.
4.6.2. Fuel use in furnaces
The amount of fuel used in HVAC furnaces went up in 2016, due to being a slightly colder year (Table 9 and
Graph 5).
Use in furnaces (m3)
Year 2014 2015 2016
m3 1,560.62 1,491.32 1,765.17
1.350
1.400
1.450
1.500
1.550
1.600
1.650
1.700
1.750
1.800
2014 2015 2016
m3
Consumo de combustible de calderas
Table 9. Use in furnaces (liters) Source: Compiled internally. Graph 5. Use in furnaces (m3) Source: Compiled internally.

Page 18 of 25
4.6.3. Electricity usage
The increase in electricity use is due to the rise in passenger traffic and operations at the airport (Table10
and Graph 6). As we can see, the kWh/passenger ratio shows a downward trend. These results are
indicative of the efforts made at the airport to reduce its electricity use and the emissions associated with it.
Table10. Electricity usage (kWh) Source: Compiled internally.
Electricity usage
Year 2014 2015 2016
kWh 272,042,197 269,832,896 274,801,783
Passengers 41,833,686 46,828,279 50,420,583
kWh/passenger
6.50 5.76 5.45 4,8
5
5,2
5,4
5,6
5,8
6
6,2
6,4
6,6
2014 2015 2016kW
h/pasajero
Consumo eléctrico
Graph 6. Electricity usage (kWh) Compiled internally.
4.6.4. Paper usage
As the data shown below (Table 11 and Graph 7) demonstrate, the efforts made by the airport to reduce
paper usage in offices are bearing fruit, having yielded a 10.9% reduction in paper use with respect to 2014.
Paper usage (kg)
2014 2015 2016
11,989 11,688 10,998
5.000
6.000
7.000
8.000
9.000
10.000
11.000
12.000
13.000
2014 2015 2016
kg
Evolución del consumo de papel en Kg
Table 11. Paper usage (kg) Source: Compiled internally. Graph 7. Paper usage (kg) Source: Compiled internally.
4.7. Biodiversity
4.7.1. Vegetation
According to the map of potential vegetation (Rivas Martínez, 1987), the potential vegetation in the study
area at the Adolfo Suárez Madrid-Barajas Airport is:
Oak groves with meso-Mediterranean dry and basophylous series of the Bupleurorigidi -
Quercetorotundifoliae holm oaks and supra-Mediterranean silicicole of the Juniperusoxycedri-
Quercetorotundifoliae holm oak.
Page 19 of 25
Riverbank forests of Mediterranean and irrigation riparian geomegaseries.
The natural plant formations that can be found at the airport, then, are as follows:
Meadows. Consisting of formations that colonize already altered lands. At the airport they occupy
most of the areas of natural vegetation (Illustration 4).
Illustration 4: Examples of meadows at the Adolfo Suárez Madrid-Barajas Airport Source: Compiled internally.
There are two types of meadows:
- Nitrophilous meadows of thero-brometalia that formed over abandoned cropland. In them we
find legumes of the Medicago, Trifolium and Astragalus genera, and poaceae of the Aegilops,
Bromus and Dactylis genera.
In some areas of the airport, these nitrophilous meadows support a layer of scattered trees.
The main species to be found are the black poplar (Populusnigra) and elm (Ulmuspumila)
trees.
- There are also ruderal meadows formerly used for farming. Growing in them are species of the
Carthamus genus, cruciferae of the Sinapis genus, leguminosae of the Trifolium, Medicago,
Astragalus and Vicia genera and poaceae of the Avena, Bromus, Hordeumand Poa genera.
Shrubs. Formation consisting of flowering plants located primarily at the north side of the airport
complex. They are found as small formations of plants of the Genistoscorpii-Retametum grouping
in areas that have regenerated on land formerly used for crops. In addition to
Retamasphaerocarp, there are bramble bushes of the Rubusgenus and numerous herbaceous
species.
Page 20 of 25
Repopulated pine groves.There are dense areas of stone pine (Pinuspinea) and Aleppo pine
(Pinushalepensis) that in some parts are mixed in with Arizona cypresses. They lack a woody
sublayer and grasses are very scarce (Illustration 5).
Illustration 5: Repopulated pine groves. Source: Compiled internally.
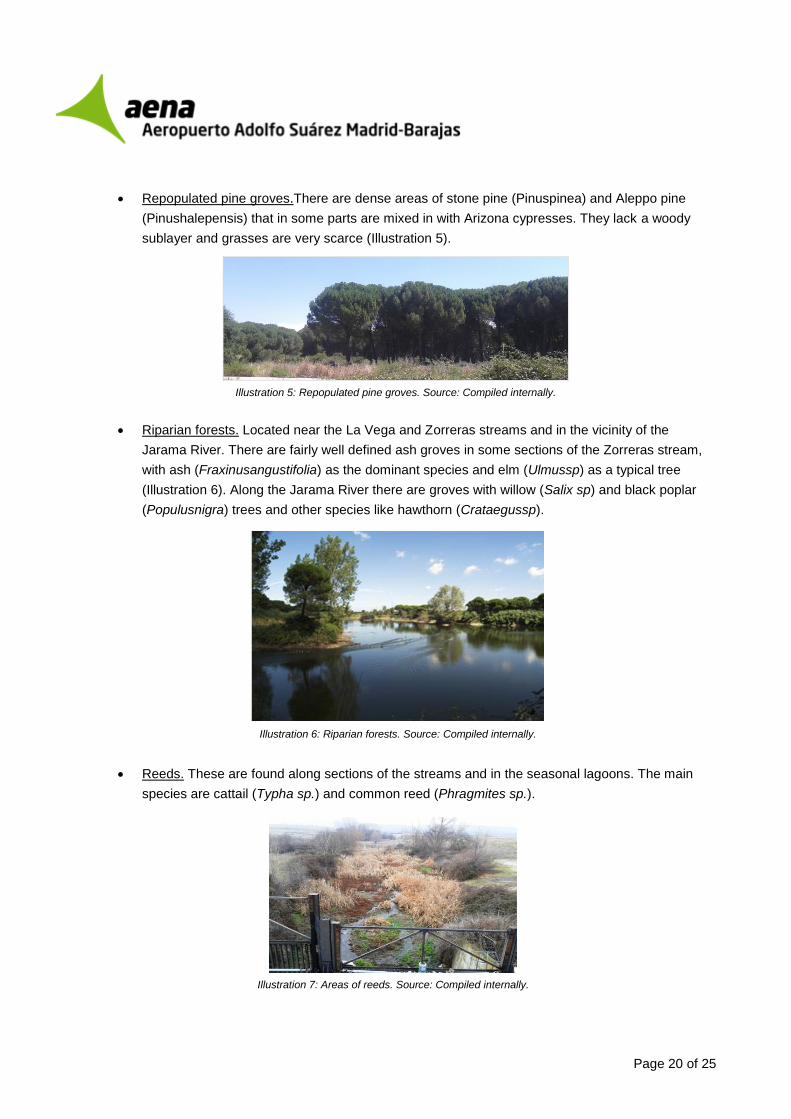
Riparian forests. Located near the La Vega and Zorreras streams and in the vicinity of the
Jarama River. There are fairly well defined ash groves in some sections of the Zorreras stream,
with ash (Fraxinusangustifolia) as the dominant species and elm (Ulmussp) as a typical tree
(Illustration 6). Along the Jarama River there are groves with willow (Salix sp) and black poplar
(Populusnigra) trees and other species like hawthorn (Crataegussp).
Illustration 6: Riparian forests. Source: Compiled internally.
Reeds. These are found along sections of the streams and in the seasonal lagoons. The main
species are cattail (Typha sp.) and common reed (Phragmites sp.).
Illustration 7: Areas of reeds. Source: Compiled internally.

Page 21 of 25
4.7.2. Fauna
The presence of wildlife in the airport complex poses a problem to operational safety. Birds in particular pose
a potential threat to aircraft, and can cause anything from minor damage to serious accidents.
In order to regulate the presence of wildlife in the airport and ensure the safety of airport operations, a series
of preventive measures is carried out in concert with the relevant authorities that vary depending on the time
of year and the species.
The airport has had a Wildlife Control Service (WCS) since 1970. Its main function is to deter the presence of
birds through various means, such as by recreating dangerous conditions for birds, neutralizing possible
factors that may appeal to birds and diverting movement patterns so as to keep the most dangerous species
away from the runways.
In addition to these activities on the runways, the WCS carries out other tasks intended to reduce the
population of dangerous wildlife in and around the airport complex. The actions taken are designed to
manage the existing habitats at the airport so as to keep them from providing shelter to various wildlife
species.
The following actions were taken in 2016:
Measures intended to manage habitats
Mowing of grassy areas to limit their height.
Control of the height of grasses around the runways by applying herbicides.
Cleaning landscaping waste.
Removal of the remains of small mammals, birds, etc.
Comprehensive monitoring and control of insects (wetlands, dry areas, forests).
Maintenance of vegetation cover.
Measures intended to drive away wildlife
Biological controls by way of birds of prey (falconry).
Use of pyrotechnics.
Other devices: warning calls, siren.
Measures intended to keep out wildlife
Checks of the perimeter enclosure and safety fence.
Placement of anti-nesting and anti-perching devices.
Removal of perches.
Measures for capturing wildlife
Capture in traps using birds of prey: snares, nets, cages.
Location and removal of nests outside breeding season.
Page 22 of 25
Removal of chicks and eggs from nests (in concert with regional forest rangers).
Management of roosting places.
Control of pigeon populations.
Population control of prey species (lagomorphs) inside airport complex with shotguns, ferrets and
nets.
Population control of boar using traps/cages and sweeps.
Capture of mammals using snares, nets and cages.
Other measures
Tracking of wildlife populations.
Tracking of nests.
Identification of areas of interest to wildlife.
Identification of species involved in collisions.
Identification and control of nests.
Cooperation with neighboring hunting preserves.
Study to identify areas with a high number of rabbit holes.
Testing of new plant covers that are unappealing to wildlife.
Implementation and monitoring of the Program to Manage Risks Associated with Wildlife.
5. Aena Environmental Office
5.1. Complaints and information requests received and analyzed
Aena has an Environmental Office for handling environmental issues (available through its website at the
following link http://www.aena.es/es/corporativa/oficina-atencion-ambiental.html), as well as an office specific
to the Madrid-Barajas Airport (OFIMA), intended exclusively to process, record, handle and reply to queries
of an environmental nature.
In 2016, a total of 1,837 complaints and information requests were received from 205 individuals through the
various channels in place.
This was far lower than the number of complaints received the previous year. The trend with respect to 2015
and 2014 is shown in the graph below Graph 8.

Page 23 of 25
0
100
200
300
400
500
600
ene feb mar abr may jun jul ago sep oct nov dic
Queja
s c
onta
bili
zadas
Evolución de quejas recibidas durante 2014-2015-2016
2014
2015
2016
16/15
Graph 8. Trend in complaints in 2014-2015-2016 Source: Compiled internally.
5.1.1. Types of complaints and information requests
As the graph below shows, most of the complaints and information requests (C&I) involved noise (91%),
information (2%) and other (7%) (Graph 9).
Ruido91%
Otros7%
Información2%
Motivo de las quejas
Graph 9. Types of complaints and information requests. Source: OFIMA
5.1.2. Distribution of C&I by municipality
In 2016, most of the complaints and information requests were received from Velilla de San Antonio and San
Sebastián de los Reyes (Graph 10).

Page 24 of 25
Algete5% El Casar
5%
Madrid5%
San Agustín de Guadalix
2%
San Fernando de Henares
7%
San Sebastián de los Reyes
30%
Velilla de San Antonio34%
Otros12%
Distribución por municipios de las Q+I
Graph 10. Distribution of C&I by Municipality. Source: OFIMA.
6. Notable environmental initiatives at the airport
6.1. Expoambiente Area Visits
In 2016, a total of 5,192 visitors were received in the Expoambiente Area. (Table 12)
The level of satisfaction of visitors, calculated using questionnaires handed out to each group that visited the
Expoambiente Area, was rated as Good to Very Good in all of the questionnaires.
2016
No. of Groups Visitors
January 22 526
February 27 630
March 19 429
April 26 643
May 23 474
June 24 500
July 10 192
August 14 291
September 28 642
October 23 543
November 14 322
December 22 526
Table 12. Total monthly visits in 2016 Source: OFIMA.

Page 25 of 25
6.2. World Environment Day
As it does every year, the Madrid-Barajas Airport observed World Environment Day, which is celebrated on 5
June every year in over 100 countries around the world.
On this occasion, the Environmental Department organized the following activities:
Presentation of corporate environmental competition awards
Public exhibit “The Airport cares for the Environment”
Presentation of awards in the “Adivina” (Guess) contest.
7. Environmental awards and distinctions
7.1. Ministry of the Environment’s Carbon Footprint Registry.
In 2016 the airport renewed its registration in the Spanish Ministry of the Environment’s Carbon Footprint,
Carbon Dioxide Offset and Absorption Registry. This is voluntary registry, governed by Royal Decree
163/2014, which was created to encourage Spanish organizations to calculate and reduce their carbon
footprint.
Through this registry, the Adolfo Suárez Madrid-Barajas Airport reaffirms its commitment to respecting and
preserving the environment.
The goal in coming years will be to further its reduction efforts and recognize the steps taken by the airport to
not only calculate its emissions, but to establish measures to reduce them.
Illustration 8. Seal indicating membership in the Carbon Footprint Registry of the Ministry of Agriculture, Fishing, Food and the Environment.

Recommended