STUDY ON PARAMETRIC BEHAVIOUR OF SINGLE
CELL BOX GIRDER UNDER DIFFERENT RADIUS OF
CURVATURE
A thesis
Submitted by
Laxmi Priya Gouda
(210CE2025)
In partial fulfillment of the requirements
for the award of the degree of
Master of Technology
In
Civil Engineering
(Structural Engineering)
Department of Civil Engineering
National Institute of Technology Rourkela
Odisha -769008, India
May 2013
STUDY ON PARAMETRIC BEHAVIOUR OF SINGLE
CELL BOX GIRDER UNDER DIFFERENT RADIUS
OF CURVATURE
A thesis
Submitted by
Laxmi Priya Gouda
(210CE2025)
In partial fulfillment of the requirements
for the award of the degree of
Master of Technology
In
Civil Engineering
(Structural Engineering)
Under The Guidance of
Dr. Robin Davis P., Prof. Dept. of Civil Engineering &
Sir.N.P.Sharma,Chief Engineer,BMRC,Banguluru
Department of Civil Engineering
National Institute of Technology Rourkela
Odisha -769008, India
May 2013
i
ACKNOWLEDGEMENTS
First and foremost, praise and thanks goes to my God for the blessing that has
bestowed upon me in all my endeavours
During my Project period, I have been supported by so many peoples; for which I
remain deeply grateful .to all of them. I am deeply thankful to my Project Guides Dr.
Robin Davis P., Professor of Structural Engineering Division; NIT, Rourkela. and
Mr. N.P.Sharma, Chief Engineer; Bangalore Metro Rail Corporation Ltd.,
Bangalore. for their efforts to mould me from scratch.
It is my pleasure to express my gratitude to Prof. Robin Davis. P, my advisor and
guide, for his guidance, patience, and wonderful ideas throughout the project work. I
appreciate his broad range of expertise and attention to detail, as well as constant
encouragement he has given me over the years.
I am grateful to Prof. N Roy, Head, Department of Civil Engineering providing me
the necessary facilities for the research work.
I am extremely thankful to Mr. N.P.Sharma, Chief Engineer, BMRC, without whom
this thesis might not have been realised. The interaction with him always helped me to
understand the project better. He used to spend his valuable time to listen to me.
I am grateful to Mr. B. Sudhir. Chandra, Head of Design & Planning; for necessary
facilities for the research work.
I would like to thank my husband, parents and sisters. Without their love, patience and
support, I could not have completed this work.
I thank to Kuppa Mannigandan, for helping me whenever I was in difficult situation.
Laxmi Priya Gouda
Roll No-210CE 2025
ii
ABSTRACT
Bangalore metropolis, the silicon valley of India, has experienced phenomenal growth
in population in the last two decades. So, to meet the traffic demands, Metro Rail
Transport started. Bangalore Metro Rail Corporation; is constructing some phase of
Metro Rail to be of elevated one. There are different structural elements for a typical
box girder bridge. The present study focus on the parametric study of single cell box
girder bridges curved in plan.
For the purpose of the parametric study, five box girder bridge models with constant
span length and varying curvature. In order to validate the finite element modelling
method, an example of box girder bridge is selected from literature to conduct a
validation study. The example box girder is modelled and analysed in SAP 2000 and
the responses are found to be fairly matching with the results reported in literature.
For the purpose of the parametric study, the five box girder bridges are modelled in
SAP2000. The span length , cross-section and material property remains unchanged.
The only parameter that changes is the radius of curvature. The cross section of the
superstructure of the box girder bridge consists of single cell box. The curvature of the
bridges varies only in horizontal direction. All the models are subjected to self weight
and moving load of IRC class A tracked vehicle. A static analysis for dead load and
moving load, and a modal analysis are performed. The longitudinal stress at top and
bottom of cross sections, bending moment, torsion, deflection and fundamental
frequency are recorded. The responses of a box girder bridge curved in plan are
compared with that of a straight bridge. The ratio of responses is expressed in terms of
a parameter. From the responses it is found that; the parameters like torsion, bending
moment, and deflection is increasing as curvature of the bridges increase.
iii
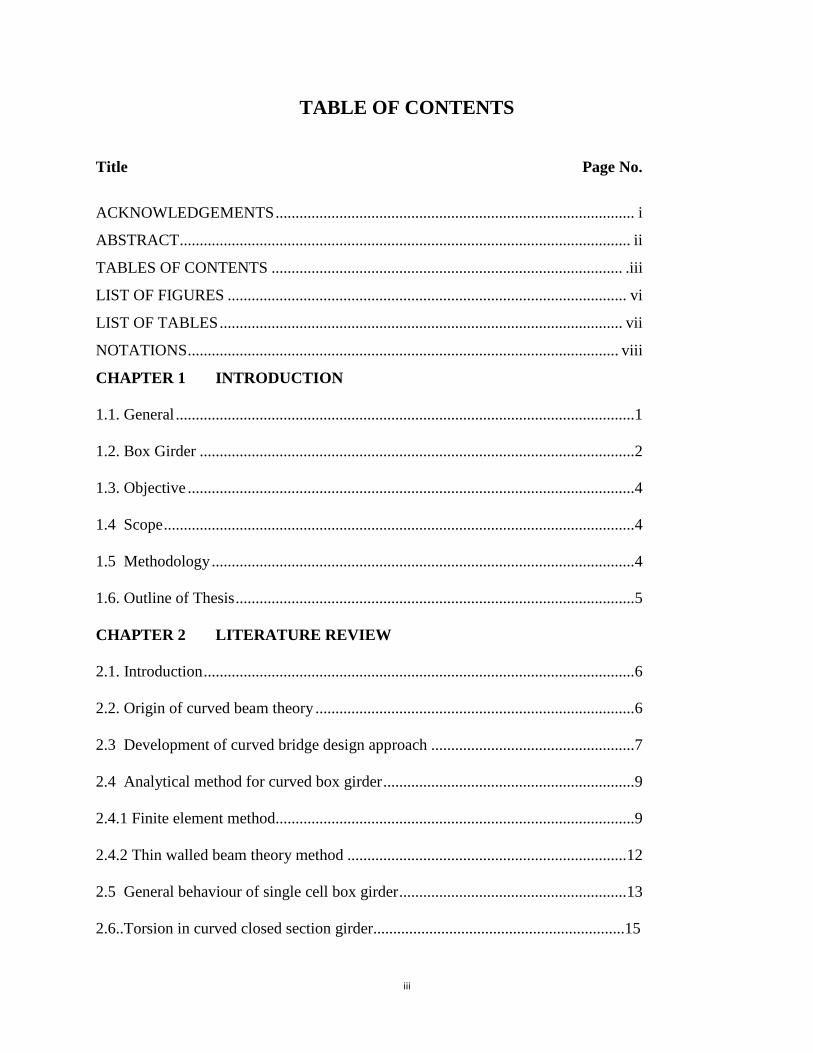
TABLE OF CONTENTS
Title Page No.
ACKNOWLEDGEMENTS .......................................................................................... i
ABSTRACT ................................................................................................................. ii
TABLES OF CONTENTS ........................................................................................ .iii
LIST OF FIGURES .................................................................................................... vi
LIST OF TABLES ..................................................................................................... vii
NOTATIONS ............................................................................................................ viii
CHAPTER 1 INTRODUCTION
1.1. General ................................................................................................................... 1
1.2. Box Girder ............................................................................................................. 2
1.3. Objective ................................................................................................................ 4
1.4 Scope ...................................................................................................................... 4
1.5 Methodology .......................................................................................................... 4
1.6. Outline of Thesis .................................................................................................... 5
CHAPTER 2 LITERATURE REVIEW
2.1. Introduction ............................................................................................................ 6
2.2. Origin of curved beam theory ................................................................................ 6
2.3 Development of curved bridge design approach ................................................... 7
2.4 Analytical method for curved box girder ............................................................... 9
2.4.1 Finite element method.......................................................................................... 9
2.4.2 Thin walled beam theory method ...................................................................... 12
2.5 General behaviour of single cell box girder ......................................................... 13
2.6..Torsion in curved closed section girder...............................................................15
iv
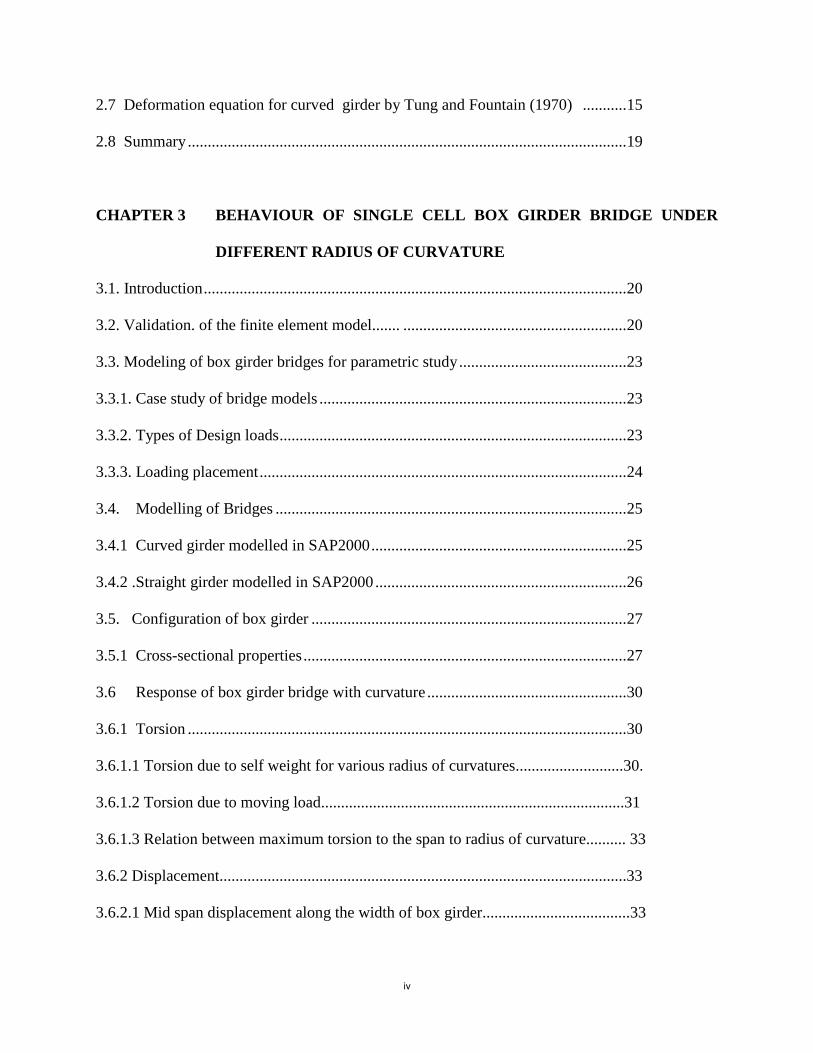
2.7 Deformation equation for curved girder by Tung and Fountain (1970) ........... 15
2.8 Summary .............................................................................................................. 19
CHAPTER 3 BEHAVIOUR OF SINGLE CELL BOX GIRDER BRIDGE UNDER
DIFFERENT RADIUS OF CURVATURE
3.1. Introduction .......................................................................................................... 20
3.2. Validation. of the finite element model....... ........................................................ 20
3.3. Modeling of box girder bridges for parametric study .......................................... 23
3.3.1. Case study of bridge models ............................................................................. 23
3.3.2. Types of Design loads ....................................................................................... 23
3.3.3. Loading placement ............................................................................................ 24
3.4. Modelling of Bridges ........................................................................................ 25
3.4.1 Curved girder modelled in SAP2000 ................................................................ 25
3.4.2 .Straight girder modelled in SAP2000 ............................................................... 26
3.5. Configuration of box girder ............................................................................... 27
3.5.1 Cross-sectional properties ................................................................................. 27
3.6 Response of box girder bridge with curvature .................................................. 30
3.6.1 Torsion .............................................................................................................. 30
3.6.1.1 Torsion due to self weight for various radius of curvatures...........................30.
3.6.1.2 Torsion due to moving load............................................................................31
3.6.1.3 Relation between maximum torsion to the span to radius of curvature.......... 33
3.6.2 Displacement......................................................................................................33
3.6.2.1 Mid span displacement along the width of box girder.....................................33
v
3.6.2.2 α (maximum vertical deflection ) along the width of box girder compared with l/r ratio..... 34
3.6.2.3 Maximum deflection along the length of box girder..............................................35
3.6.3 Bending Moment....................................................................................................36
3.6.3.1 Bending moment due to self weight...................................................................... 37
3.6.3.2 Bending moment due to moving load.....................................................................38
3.6.3.3 α(bending moment) with L/R ratio...................................................................................39
3.6.4 Longitudinal stress due to moving load.....................................................................40
3.6.4.1 Longitudinal stress (top & bottom)-left side of girder............................................40
3.6.4.2 Longitudinal stress (top & bottom)-centre..............................................................41
3.6.4.3 Longitudinal stress (top & bottom)-right................................................................42
3.6.4.4 α (max. longitudinal stress)-top...............................................................................43
3.6.4.5 α (max. longitudinal stress)-bottom.........................................................................44
3.6.5 Frequencies for the bridge models..............................................................................45
3.6.5.1 Frequencies for the bridge models...........................................................................46
3.6.5.2. Fundamental frequency to L/R ratio.......................................................................47
3.7 Summary.................................................................................................................47
CHAPTER 4 CONCLUSIONS
4.1. Summary........................................................................................................................48
4.2. Conclusion......................................................................................................................48
REFERENCES.....................................................................................................................52
vi
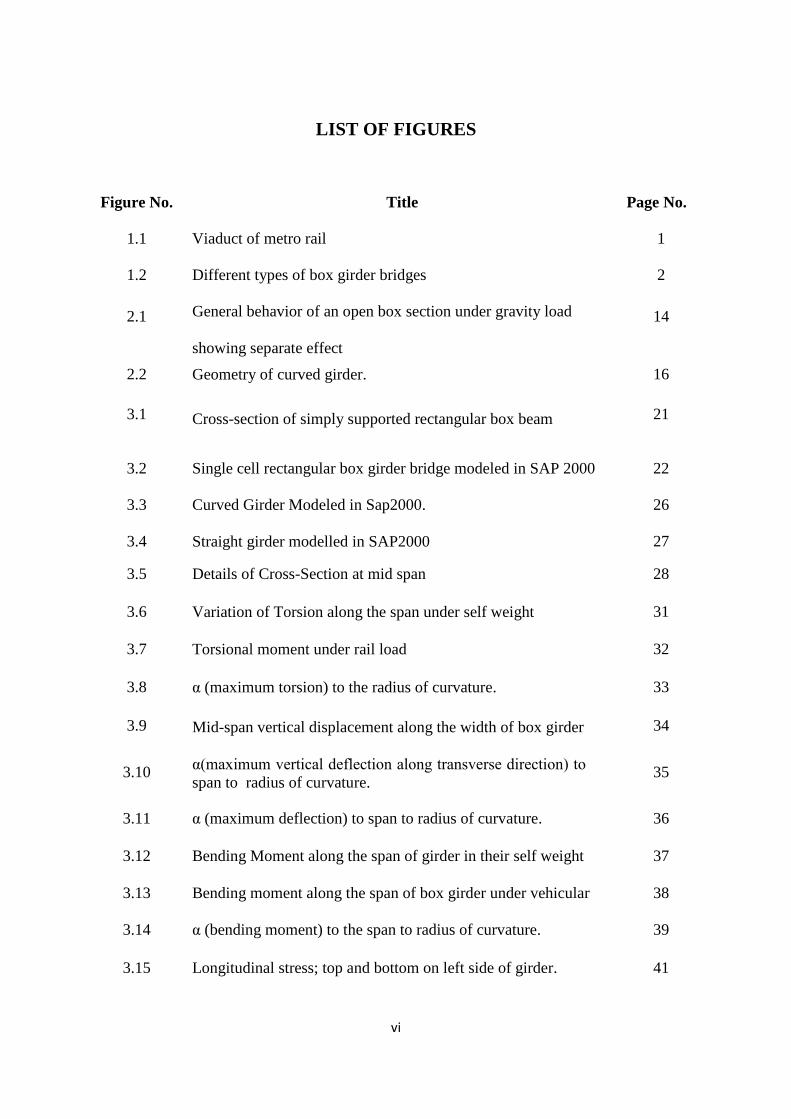
LIST OF FIGURES
Figure No. Title Page No.
1.1 Viaduct of metro rail 1
1.2 Different types of box girder bridges 2
2.1 General behavior of an open box section under gravity load
showing separate effect
14
2.2 Geometry of curved girder. 16
3.1 Cross-section of simply supported rectangular box beam 21
3.2 Single cell rectangular box girder bridge modeled in SAP 2000 22
3.3 Curved Girder Modeled in Sap2000. 26
3.4 Straight girder modelled in SAP2000 27
3.5 Details of Cross-Section at mid span 28
3.6 Variation of Torsion along the span under self weight 31
3.7 Torsional moment under rail load 32
3.8 α (maximum torsion) to the radius of curvature. 33
3.9 Mid-span vertical displacement along the width of box girder 34
3.10 α(maximum vertical deflection along transverse direction) to
span to radius of curvature. 35
3.11 α (maximum deflection) to span to radius of curvature. 36
3.12 Bending Moment along the span of girder in their self weight 37
3.13 Bending moment along the span of box girder under vehicular
live load
38
3.14 α (bending moment) to the span to radius of curvature. 39
3.15 Longitudinal stress; top and bottom on left side of girder. 41
vii
3.16 Longitudinal stress at centre of girder (top and bottom) 42
3.17 Longitudinal stress for right side of girder (top and bottom) 43
3.18 Maximum longitudinal stress (Top of box girder) to L/R ratio 44
3.19 Maximum longitudinal stress (bottom of girder) to L/R ratio. 45
3.20 Various mode shapes with the different radius of curvature 46
3.21 Fundamental mode frequency to the L/R ratio 47
Table LIST OF TABLES Page.No
2.1 Bridge types 11
3.1 Comparison of responses obtained in present study and Gupta et.
al (2010) 23
3.2 Material Property
25
3.3 Cross-sectional dimensions 27
3.4 Material Property of Trapezoidal Box Girder 28
3.5 Torsion and bending moment due to self weight calculated by
hand calculation compared with SAP2000 29
3.6 Frequencies for the bridge models 45
LIST OF NOTATIONS
L Length span
H Depth box girder
b tf Width top flange
t tf Thickness top flange
b w Width of web
b bf Width bottom flange
t bf Thickness bottom flange
b boxts Width box top side
L cant Cantilever length top flange
H box Depth webs
g Acceleration due to gravity
R Radius of curvature
α Parameter curved/ Parameter straight
ρ c Density of concrete
Ac Area of concrete
Z cb Distance from bottom to centroidal axis
Z ct Distance from top to centroidal axis
I c Second moment of area of the concrete section
W b Section modulus bottom
W z Section modulus top
u Perimeter concrete box girder
E Young's modulus
G Shear modulus
υ Poisson's ratio
A Coefficient of thermal expansion
f c' Specific compressive strength of concrete
1
CHAPTER 1
INTRODUCTION
1.1 GENERAL
Bangalore metropolis, the silicon valley of India, has experienced phenomenal growth
in population in the last two decades. To meet the traffic demands, Metro Rail
Transport has been started. Some part of the metro rail is elevated one, known as
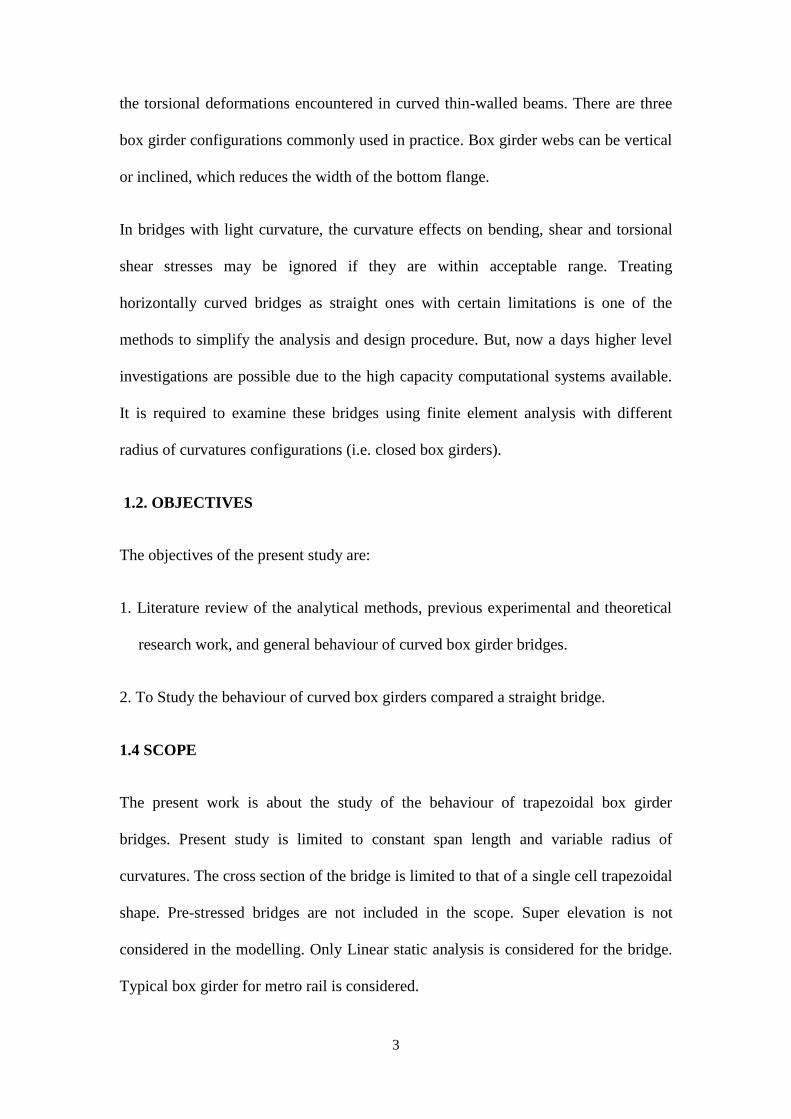
viaduct. The viaduct has trapezoidal box girders of single cell. There are different
structural elements for a typical box girder bridge.
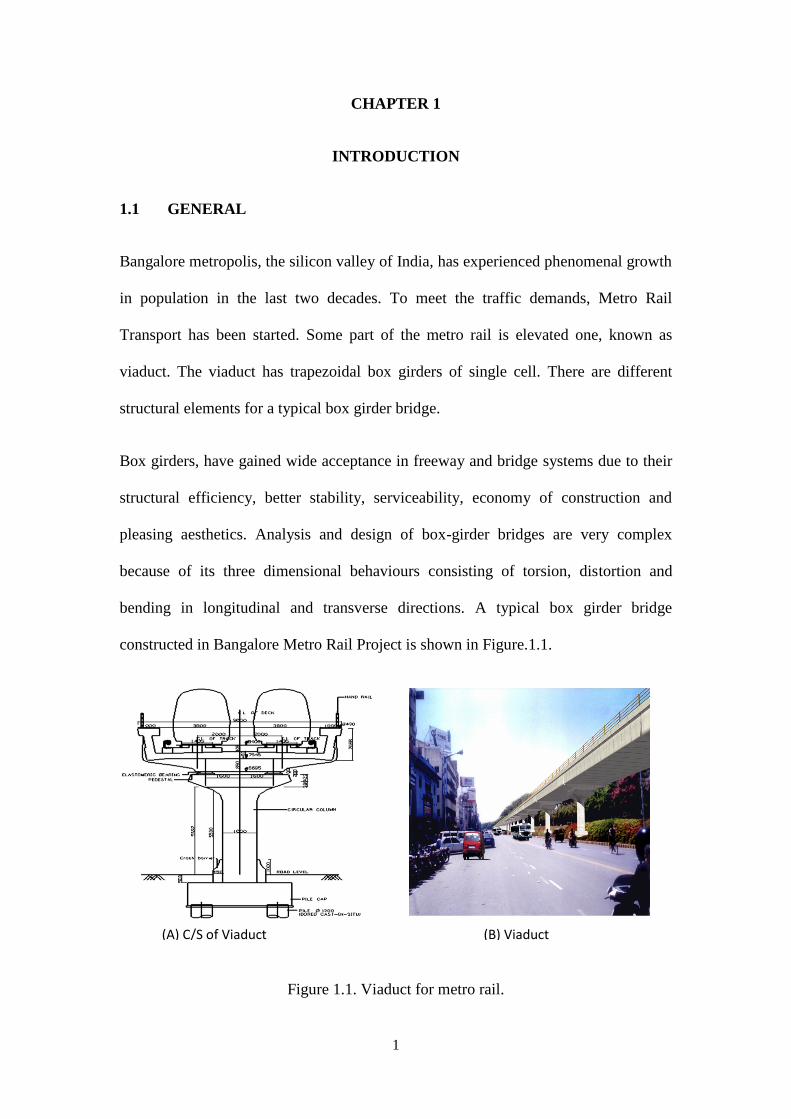
Box girders, have gained wide acceptance in freeway and bridge systems due to their
structural efficiency, better stability, serviceability, economy of construction and
pleasing aesthetics. Analysis and design of box-girder bridges are very complex
because of its three dimensional behaviours consisting of torsion, distortion and
bending in longitudinal and transverse directions. A typical box girder bridge
constructed in Bangalore Metro Rail Project is shown in Figure.1.1.
Figure 1.1. Viaduct for metro rail.
(B) Viaduct (A) C/S of Viaduct
2
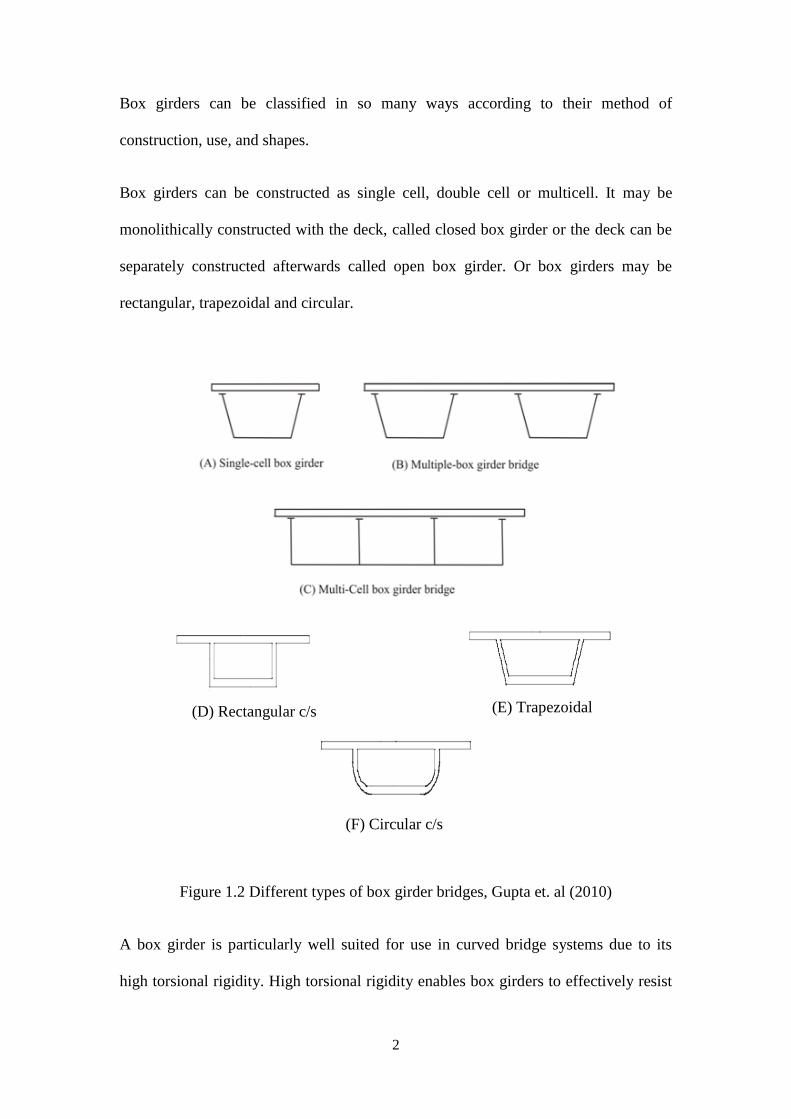
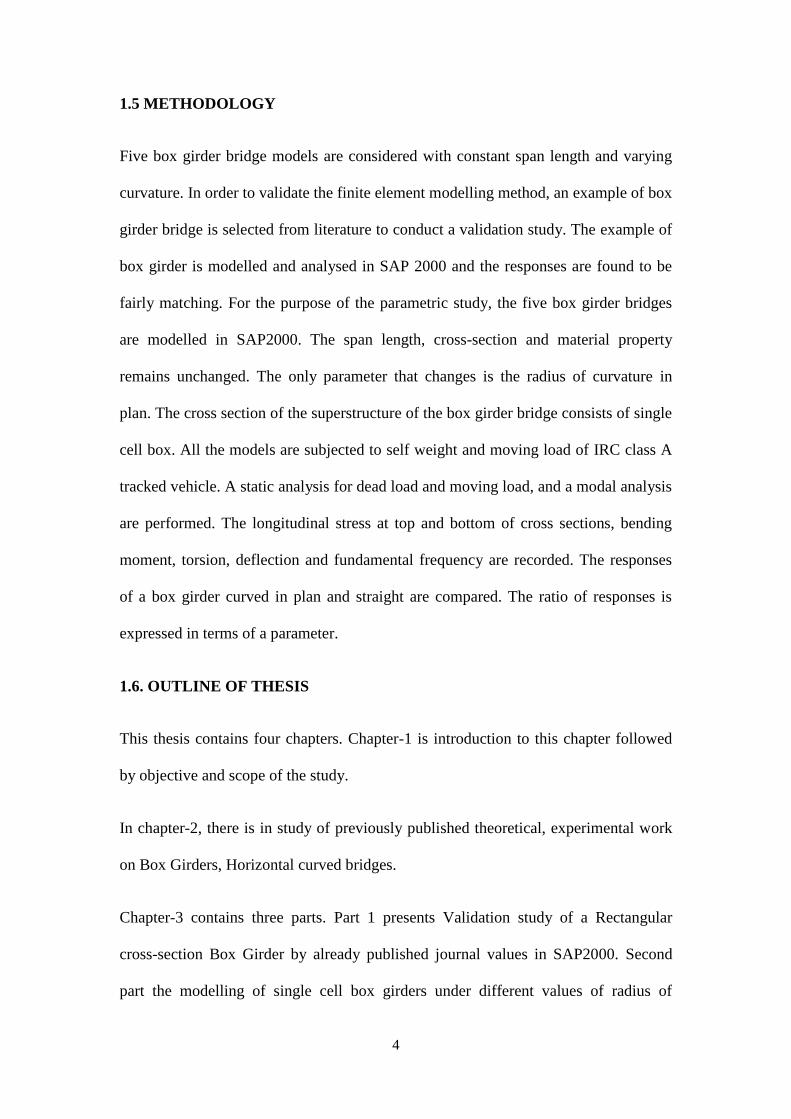
Box girders can be classified in so many ways according to their method of
construction, use, and shapes.
Box girders can be constructed as single cell, double cell or multicell. It may be
monolithically constructed with the deck, called closed box girder or the deck can be
separately constructed afterwards called open box girder. Or box girders may be
rectangular, trapezoidal and circular.
Figure 1.2 Different types of box girder bridges, Gupta et. al (2010)
A box girder is particularly well suited for use in curved bridge systems due to its
high torsional rigidity. High torsional rigidity enables box girders to effectively resist
(F) Circular c/s
(E) Trapezoidal (D) Rectangular c/s
3
the torsional deformations encountered in curved thin-walled beams. There are three
box girder configurations commonly used in practice. Box girder webs can be vertical
or inclined, which reduces the width of the bottom flange.
In bridges with light curvature, the curvature effects on bending, shear and torsional
shear stresses may be ignored if they are within acceptable range. Treating
horizontally curved bridges as straight ones with certain limitations is one of the
methods to simplify the analysis and design procedure. But, now a days higher level
investigations are possible due to the high capacity computational systems available.
It is required to examine these bridges using finite element analysis with different
radius of curvatures configurations (i.e. closed box girders).
1.2. OBJECTIVES
The objectives of the present study are:
1. Literature review of the analytical methods, previous experimental and theoretical
research work, and general behaviour of curved box girder bridges.
2. To Study the behaviour of curved box girders compared a straight bridge.
1.4 SCOPE
The present work is about the study of the behaviour of trapezoidal box girder
bridges. Present study is limited to constant span length and variable radius of
curvatures. The cross section of the bridge is limited to that of a single cell trapezoidal
shape. Pre-stressed bridges are not included in the scope. Super elevation is not
considered in the modelling. Only Linear static analysis is considered for the bridge.
Typical box girder for metro rail is considered.
4
1.5 METHODOLOGY
Five box girder bridge models are considered with constant span length and varying
curvature. In order to validate the finite element modelling method, an example of box
girder bridge is selected from literature to conduct a validation study. The example of
box girder is modelled and analysed in SAP 2000 and the responses are found to be
fairly matching. For the purpose of the parametric study, the five box girder bridges
are modelled in SAP2000. The span length, cross-section and material property
remains unchanged. The only parameter that changes is the radius of curvature in
plan. The cross section of the superstructure of the box girder bridge consists of single
cell box. All the models are subjected to self weight and moving load of IRC class A
tracked vehicle. A static analysis for dead load and moving load, and a modal analysis
are performed. The longitudinal stress at top and bottom of cross sections, bending
moment, torsion, deflection and fundamental frequency are recorded. The responses
of a box girder curved in plan and straight are compared. The ratio of responses is
expressed in terms of a parameter.
1.6. OUTLINE OF THESIS
This thesis contains four chapters. Chapter-1 is introduction to this chapter followed
by objective and scope of the study.
In chapter-2, there is in study of previously published theoretical, experimental work
on Box Girders, Horizontal curved bridges.
Chapter-3 contains three parts. Part 1 presents Validation study of a Rectangular
cross-section Box Girder by already published journal values in SAP2000. Second
part the modelling of single cell box girders under different values of radius of

5
curvatures. Third the parametric study on the models, how they behave in different
curvatures under same loading conditions, same material property, same boundary
condition and under same span length.
6
CHAPTER 2
LITERATURE REVIEW
2.1. GENERAL
This chapter is about the description of various literatures on curved type bridge. This
discusses; the origin of curved beam theory, development of design approach,
analytical methods such as finite element and thin walled beam theory, general
behaviour and torsional behaviour in closed sections, formulation on deformation
equation by Tung and Fountain (1970). First, the curved beam theory was given by
first Saint-Venant (1843) and later the thin-walled beam theory by Vlasov (1965) has
put foundation for all research works published to till date on the analysis and design
of straight and curved box-girder bridges.
2.2. ORIGIN OF CURVED BEAM THEORY
In recent past of modern bridge design, engineers were reluctant to use curved girders
due to the mathematical complexities associated with the design of such systems.
Curved girders are subjected to not only major axis flexural stresses but also to
significant torsional stresses, even under gravitational loading alone. Deflection, cross
section distortion, and large deflection effects are much more pronounced in curved
girder systems. The inherent rotation characteristics of horizontally curved girders
require that the diaphragms and bracing that are used in straight girder systems simply
to prevent premature lateral buckling become very important (primary) load carrying
components in curved systems. In the past two decades, the availability of digital
computers to carry out the complex structural analysis and design of such girders,
7
along with advancements in fabrication and erection technology, have made
horizontally curved girder superstructures a viable and cost efficient option for
designers.
Design considerations are kept different in the curved I-girder bridge design compared
with the curved box girder design. As, the I-girder is an "open" section and is
characterized by very low torsional resistance. The twisting of the I-girder results in
significant normal stresses in the flanges. The closed box girder has generally
improved torsional resistance over the I-section.
St. Venant (1843) worked on curved beam theory which is 150 years ago. Since then,
a number of other European and Japanese researchers have contributed towards the
analysis of curved beams. These researchers include Gottfield (1932), Umanskii
(1948), Dabrowski (1964, 1965, 1968), Vlasov (1961), Timoshenko (1905), Shimada
and Kuranashi (1966), and others. Comprehensive presentations of the basic theory of
thin walled beams including flexure, torsion, distortion, and stress distribution is
provided in several texts (Nakai and Yoo 1988, Vlasov 1961, Dabrowski 1968,
Kollbrunner 1969, Heins 1975).
2.3. DEVELOPMENT OF CURVED BRIDGE DESIGN APPROACH
Research prior to the mid-sixties on the behaviour of curved girders was generally
limited to theoretical work on the linear elastic static behaviour of isolated curved
members and based on strength of materials assumptions, namely, that the cross
section does not distort, that Hooke's law applies, and that small deflection theory
applies. Since the mid-sixties an emphasis in curved girder research in the United
States and Japan has been placed on the practical use of curved beam theory towards
the design of horizontally curved bridges. Theory has been formulated for the
8
horizontally curved girder in the curved bridge system including buckling behaviour,
large displacement behaviour, and ultimate strength behaviour.
In 1965, U.S. Steel (Highway 1965) published an approximate procedure called "V-
load Analysis" for determining moments and shears in horizontally curved open-
framed highway bridges.
Heins and Jin (1984) provided V-load method for analysing curved bridge design .
Previously it has been noted that the live load distribution factors used in straight
bridge design do not appropriately model the distribution in curved bridges. But it has
certain limitations. Accuracy of this method with regard to live load depends upon the
ability of the user. This method is also given by Brockenbrough 1986).
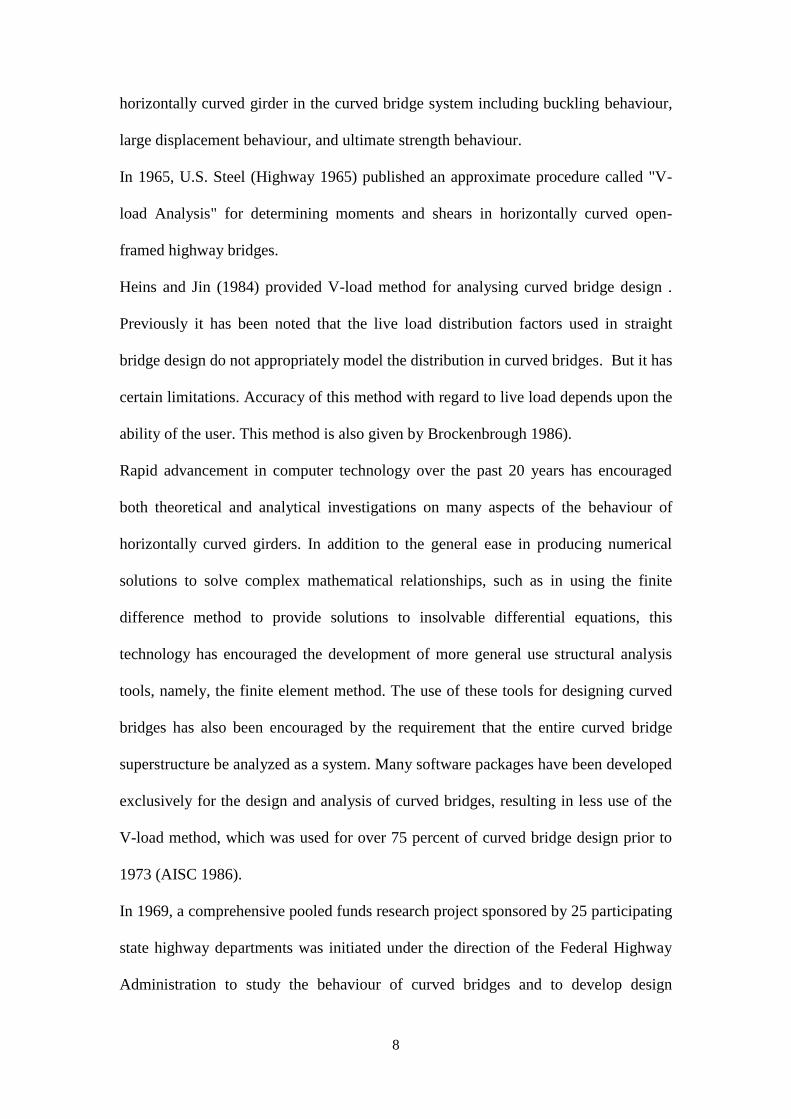
Rapid advancement in computer technology over the past 20 years has encouraged
both theoretical and analytical investigations on many aspects of the behaviour of
horizontally curved girders. In addition to the general ease in producing numerical
solutions to solve complex mathematical relationships, such as in using the finite
difference method to provide solutions to insolvable differential equations, this
technology has encouraged the development of more general use structural analysis
tools, namely, the finite element method. The use of these tools for designing curved
bridges has also been encouraged by the requirement that the entire curved bridge
superstructure be analyzed as a system. Many software packages have been developed
exclusively for the design and analysis of curved bridges, resulting in less use of the
V-load method, which was used for over 75 percent of curved bridge design prior to
1973 (AISC 1986).
In 1969, a comprehensive pooled funds research project sponsored by 25 participating
state highway departments was initiated under the direction of the Federal Highway
Administration to study the behaviour of curved bridges and to develop design
9
requirements. This project, referred to as CURT (Consortium of University Research
Teams), was comprised of Carnegie Mellon University, the University of
Pennsylvania, the University of Rhode Island, and Syracuse University.
This work was performed throughout the 1970's and resulted in the AASHTO Guide
Specifications for Horizontally Curved Highway Bridges (subsequently referred to as
the Guide Specifications), which was officially adopted in 1980. The CURT project
involved:
(1) Reviewing all published information on the subject of curved bridges;
(2) Conducting analytical and experimental studies to confirm or supplement this
published information and assimilate information from related research
programs sponsored by state highway departments;
(3) Developing simplified analysis and design methods along with supporting
computer programs and design aids; and
(4) Correlating the developed analysis and design methods with analytical and
experimental data.
The Guide Specifications in its original form was disjointed and difficult to use. The
strength predicted by the formulation did not feel appropriate that predicted by the
formulation for straight girders as the radius of the curved girder approaches infinity.
The commentary was incomplete and lacked the detail.
In 1993, NCHRP Project 12-38, "Improved Design Specifications for Horizontally
Curved Steel Girder Highway Bridges," was initiated.
10
2.4. ANALYTICAL METHODS FOR BOX GIRDER BRIDGES
2.4.1 Finite Element Method
The finite element method of analysis is generally the most powerful, versatile and
accurate analytical method of all the available methods and has rapidly become a very
popular technique for the computer solution of complex problems in engineering. It is
very effective in the analysis of complicated structures such as that of a box girder
bridge with complex geometry, material properties and support conditions and
subjected to a variety of loading conditions. Canadian Highway Bridge Design Code
has recommended the finite element method for all type of bridges.
A large number of elements have been developed for use in the finite element
technique that includes one-dimensional beam-type elements, two dimensional plate
or shell elements or even three-dimensional solid elements. Since the structure is
composed of several finite elements interconnected at nodal points, the individual
element stiffness matrix, which approximates the behaviour in the continuum, is
assembled based on assumed displacement or stress patterns. Then, the nodal
displacements and hence the internal stresses in the finite element are obtained by the
overall equilibrium equations. By using adequate mesh refinement, results obtained
from finite element model usually satisfy compatibility and equilibrium
Zienkeiwicz (1977), Sisodiya,et.al (1970) presented finite element analyses for single
box girder skew bridges that were curved in plan. The bridge that could be analyzed
by this method may be of varying width, curved in any shape, not just a circular shape
and with any support conditions. They used rectangular elements for the webs and
parallelogram or triangular elements for top and bottom flanges. This approximation
would require a large number of elements to achieve a satisfactory solution. Such an
approach is impractical, especially for highly curved box bridges.
11
Chapman,et al (1971) conducted a finite element analysis on steel and concrete box
girder bridges with different cross section shapes to investigate the effect of
intermediate diaphragms on the warping and distortional stresses. They showed that
curved steel boxes even with symmetrical load components gave rise to distortional
stresses, and showed that the use of sloping webs resulted in an increase in
distortional stresses.
Lim,et al. (1971) developed an element that has a beam-like-in-plane displacement
field which is trapezoidal in shape, and hence, can be used to analyze right, skew, or
curved box-girder bridges with constant depth and width.
Fam and Turkstra (1975) developed a finite element scheme for static and free
vibration analysis of box girders with orthogonal boundaries and arbitrary
combination of straight and horizontally curved sections. Four-node plate bending
annular elements with two straight radial boundaries, for the top and bottom flanges,
and conical elements for the inclined web members were used. The importance of
warping and distortional stresses in single-cell curved bridges was established in
relation to the longitudinal normal bending stresses, using the finite element method,
Dezi (1985) examined the influence of some parameters including transverse and
longitudinal locations of external loads, span-to-radius ratio, width-to-depth of the
cell, and number of cross diaphragms on the deformation of the cross section in
curved single-cell box beams over those in straight single-cell box beams.
Ishac and Smith (1985) presented approximations for determining the transverse
moments in single-span single-cell concrete box-girder bridges. Dilger,et al. (1988)
studied the effect of presence and orientation of diaphragms on the reaction, internal
forces, and the behaviour of skew, single cell, concrete box-girder bridges.
12
Galuta and Cheung (1995) developed a hybrid analytical solution that combines the
boundary element method with the finite-element method to analyze box-girder
bridges. The finite-element method was used to model the webs and bottom flange of
the bridge, while the boundary element method was employed to model the deck.
The bending moments and vertical deflection were found to be in good agreement
when compared with the finite strip solution.
2.4 2 Thin Walled Beam Theory Method
Saint-Venant (1843) established the curved beam theory for the case of a solid curved
bar loaded in a direction normal to the plane of curvature. In general, curved beam
theory cannot be applied to curved box girders bridges, because it cannot account for
warping, distortion, and bending deformations of the individual wall elements of the
box. Curved beam theory can only provide the designer with an accurate distribution
of the resultant bending moments, torque, and shear at any section of a curved beam if
the axial, torsional and bending rigidities of the section are accurately known. The
thin-walled beam theory was established by Vlasov (1965) for axisymmetric sections,
and then extended by Dabrowski (1968) for asymmetric section who derived the
fundamental equations that account for warping deformations caused by the gradient
of normal stresses in individual box element.
The theory assumes non-distortional cross section and, hence, does not account for all
warping or bending stresses. The predication of shear lag or the response of deck slabs
to local wheel load cannot be obtained using the theory.
Oleinik and Heins (1975), and Heins and Oleinik (1976) analyzed the curved box
girders in two parts. In the first part of the analysis, the box sections were assumed to
retain their shape under the load. The load-deformation response of such a curved box
13
that considers bending, torsion and warping deformations was developed by Vlasov.
Vlasov’s differential equations were solved using a finite difference approach to
calculate the normal bending and normal warping stresses. In the second part of the
analysis, the effect of cross sectional deformations was considered. These cross
sectional deformations were calculated using a differential equation developed by
Dabrowski. This equation was also solved using the finite difference approach and the
normal stresses that resulting from cross-sectional deformations were calculated. The
effects of both parts were summed to give the total normal stress distribution.
Maisel (1982, 1985, 1986) extended Vlasov’s thin-walled beam theory to account for
torsional, distortional, and shear lag effects of straight, thin-walled cellular box
beams.
Mavaddat and Mirza (1989) utilized Maisel’s formulations to develop computer
programs to analyze straight concrete box beams with one, two, or three cells and side
cantilevers over a simple span or two spans with symmetric midspan loadings.
The structure was idealized as a beam, and the normal and shear stresses were
calculated using the simple bending theory and Saint- Venant’s (1843) theory of
torsion. Then, the secondary stresses arising from torsional and distortional warping
and shear lag were calculated.
Fu and Hsu (1995) generated a new finite element based on Vlasov’s theory of curved
thin walled beams. The horizontally curved thin walled beam element stiffness was
developed directly in the cylindrical coordinate system.
2.5. GENERAL BEHAVIOUR OF SINGLE CELL BOX GIRDER
A general loading on a box girder, for single cell box, has components which bend,
twist, and deform the cross section. Thin walled closed section girders are so stiff and
strong in torsion that the designer might assume, after computations based on the
14
elemental torsional theory. In this theory torsional component of loading has
negligible influence on box girder response. If the torsional component of the loading
is applied as shears on the plate elements that are in proportion to St. Venant torsion
shear flows, the section is twisted without deformation of the cross section. The
resulting longitudinal warping stresses are small, and no transverse flexural distortion
stresses are induced. However, if the torsional loading is applied, there are also forces
acting on the plate elements, which tend to deform the cross section. Movements of
the plate elements of the cross section cause distortion stresses in the transverse
direction and warping stresses in the longitudinal direction.
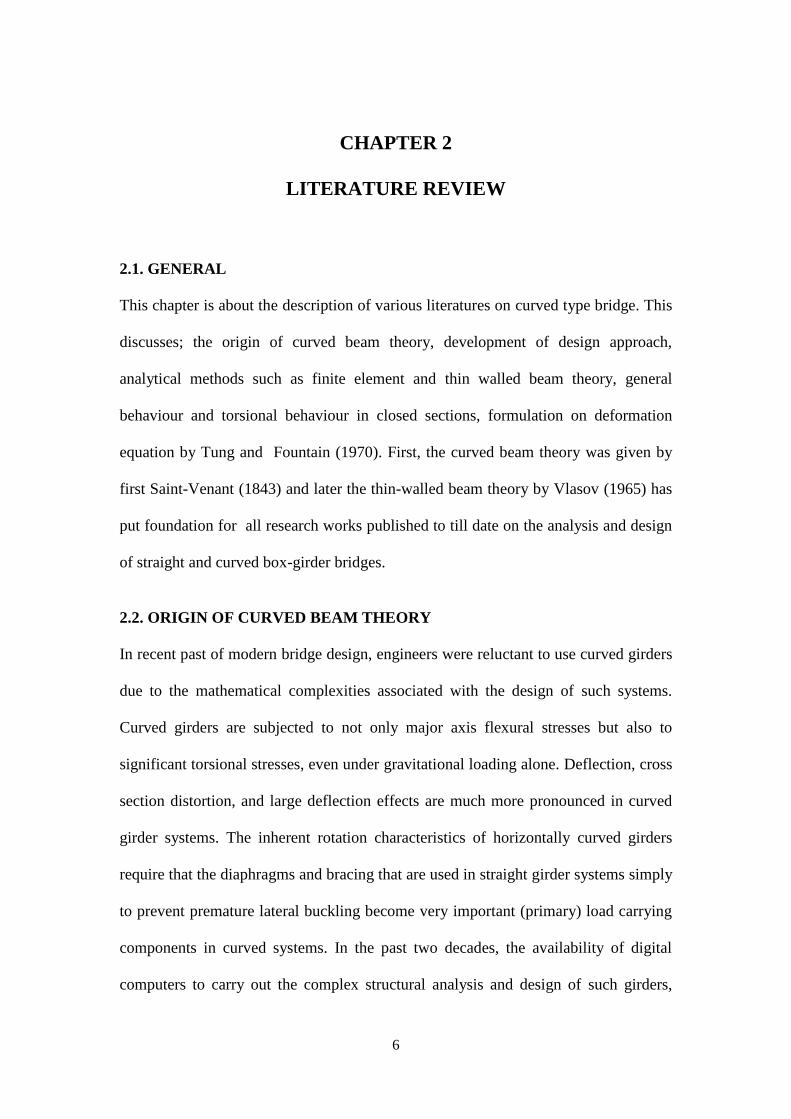
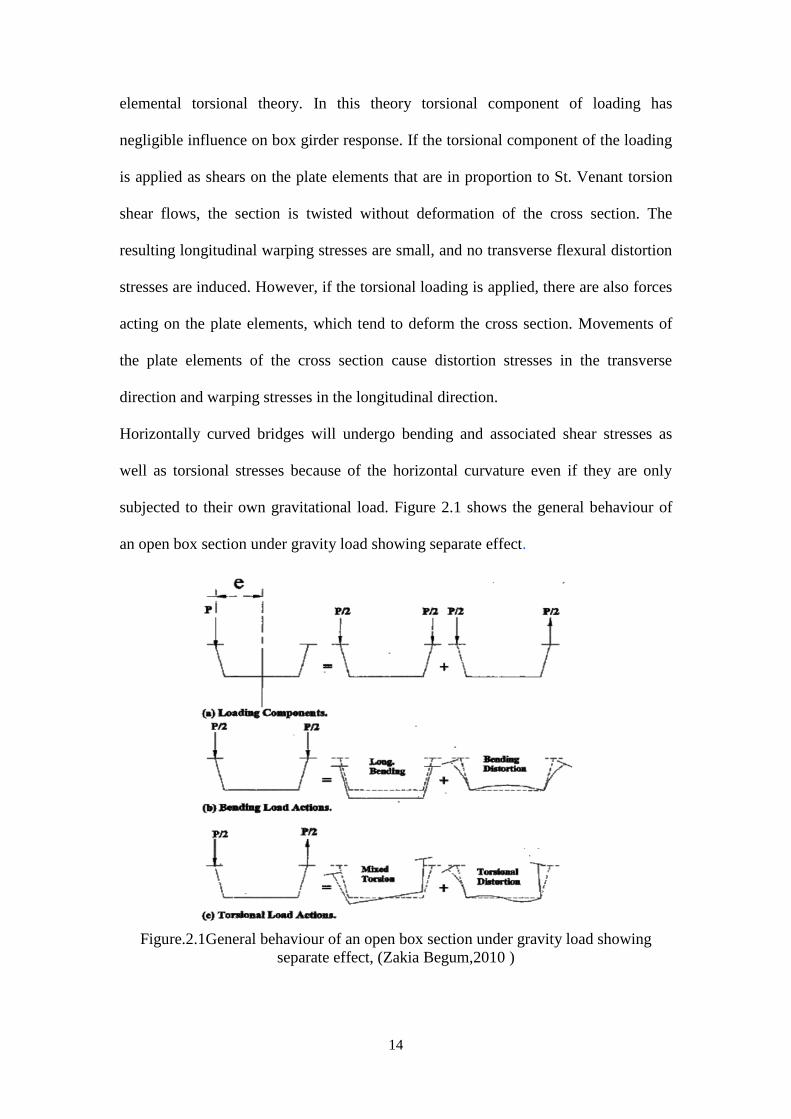
Horizontally curved bridges will undergo bending and associated shear stresses as
well as torsional stresses because of the horizontal curvature even if they are only
subjected to their own gravitational load. Figure 2.1 shows the general behaviour of
an open box section under gravity load showing separate effect.
Figure.2.1General behaviour of an open box section under gravity load showing
separate effect, (Zakia Begum,2010 )
15
2.6. TORSION IN CURVED CLOSED SECTION GIRDERS
There are two types of torsion that act on cross-sections; one is Saint-Venant torsion
and other is Warping torsion. Saint-Venant torsion is a result of shear flow around the
cross-section, while the other one is warping is due to bending deformation in the
cross-section. In closed sections, warping torsion is neglected (Kolbrunner and Basler,
1969).
16
2.7. DEFORMATION EQUATION FOR CURVED GIRDER BY TUNG
AND FOUNTAIN (1970)
It is difficult to calculate exact moments and stresses for curved girders. The analysis
requires sophisticated computer analysis programs. One approximate method is to
analyse that the girder is straight.
Tung and Fountain (1970) demonstrated that this approximation is acceptable for
girders that have subtended angle per span is up to 400. The bending moment of the
girder can be determined by neglecting the curvature and using traditional beam
theory for straight girders .But, for torsion the same assumption cannot be adopted.
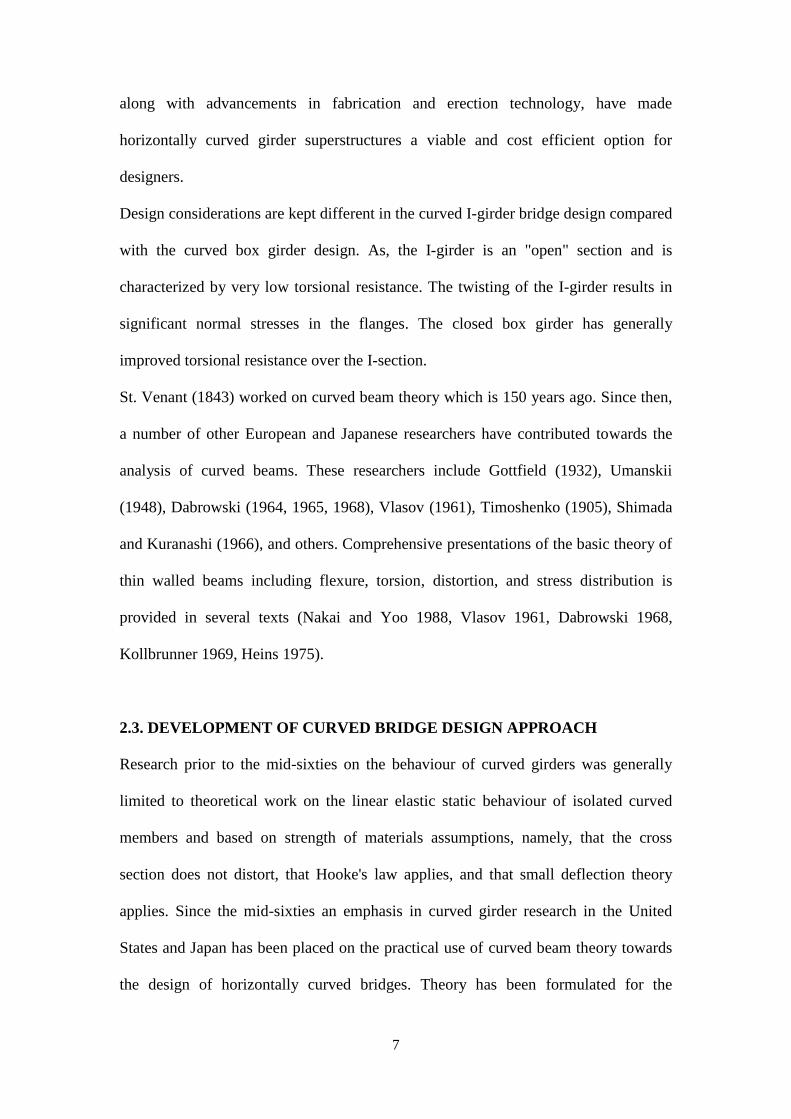
The parameters such as Moment, Torque, Vertical Deflection and Rotation of the
Curved Box Girder can be calculated using Tung and Fountain's equation.
A single span girder with radial support is employed in the derivation to show the
behaviour due to curvature, as shown in Figure 2.2.
17
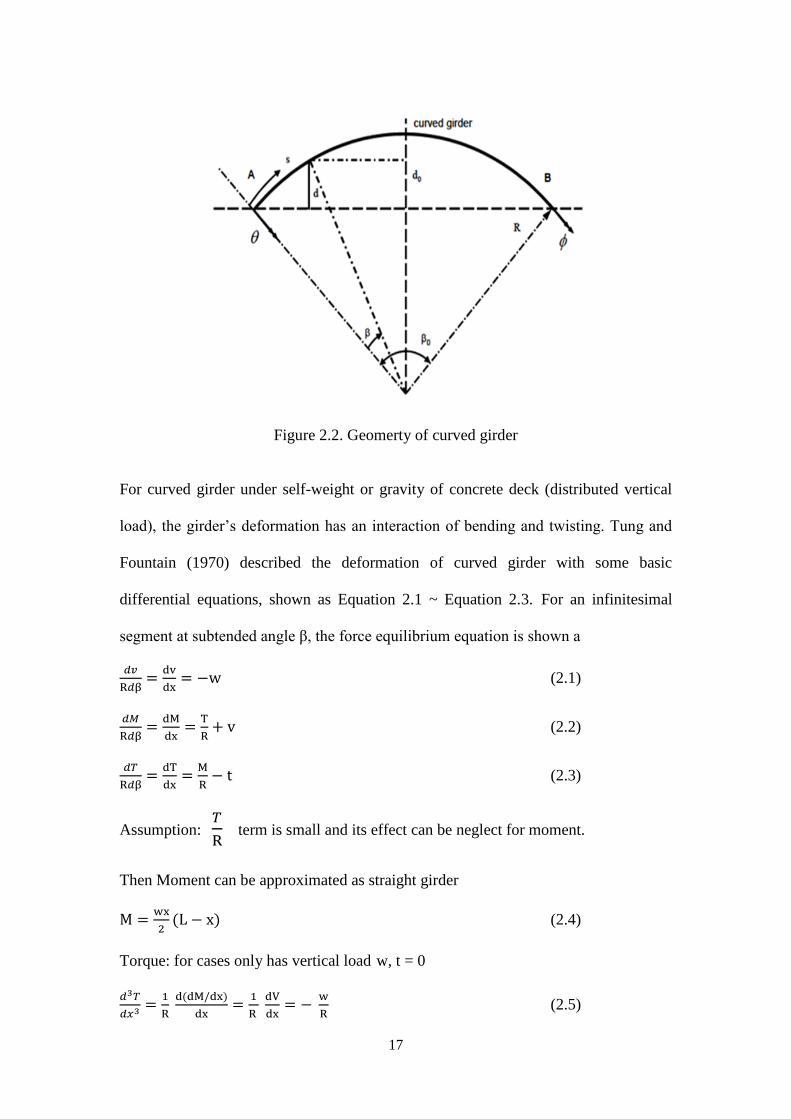
Figure 2.2. Geomerty of curved girder
For curved girder under self-weight or gravity of concrete deck (distributed vertical
load), the girder’s deformation has an interaction of bending and twisting. Tung and
Fountain (1970) described the deformation of curved girder with some basic
differential equations, shown as Equation 2.1 ~ Equation 2.3. For an infinitesimal
segment at subtended angle β, the force equilibrium equation is shown a
(2.1)
(2.2)
(2.3)
Assumption:
term is small and its effect can be neglect for moment.
Then Moment can be approximated as straight girder
(2.4)
Torque: for cases only has vertical load w, t = 0
(2.5)
18
Integrating Equation 2.5 and get the general expression of T(x)
∭
(2.6)
Boundary conditions:
(2.7)
Thus, the approximate Torque is
(2.8)
Similarly, deformation equilibrium is shown in Equation 2.9 and Equation 2.10:
β
(2.9)
β
(2.10)
Where, is rotation about the radially (about R-axis) and φ is rotation longitudinally.
Differentiating Equation 2.9 by x and substitute Equation 2.10 and Equation 2.3, the
equation will transform into Equation 2.11.
+
(
)
(2.11)
Usually has small value compared with other terms in the Equation 2.11. If no
distributed torque t is applied, the equation is simplified as Equation 2.12.
(2.12)
Thus, the longitudinal rotation of the curved girder is presented as
(
) ∫
(2.13)
For curved girder with vertical load w, if substituting the torque Equation 2.8 into
Equation 2.13, the rotation would be
19
(
) ∫
(
) ∫ (
)
(2.14)
(
) (2.15)
At mid-span, the maximum rotation is
(
)
(
) (2.16)
The deflection of curved girder can be approximate by straight girder deflection and
curved effect, such as
(2.17)
From Figure 2.2,
⁄ ), which can be substituted into Equation 2.17
to give
(
)
⁄ )] (2.18)
(
)
(
)
⁄ )] (2.19)
These equations can be used to calculate the parameters like torsion, deflection of a
curved bridge under dead load case.
2.8 SUMMARY
The literature review presented above shows that there are a number of published
work on study of box girder bridges under various radius of curvatures. Also, tells
about birth of curved bridge to modern day popularity of curved bridges. Due to rapid
advancement of computers; it became easy to analyse the complex model of curved
bridges and the finite element method for the analysis of curved models made it

20
popular. The thin walled beam theory made it easier to understand about the
behaviour of a beam in curvature.
20
CHAPTER 3
BEHAVIOUR OF SINGLE CELL BOX GIRDER BRIDGE UNDER
DIFFERENT RADIUS OF CURVATURES
3.1 INTRODUCTION
There are many methods available for analyzing curved bridges, as mentioned earlier
in Chapter 2. However, of all the available analysis methods, the finite element
method is considered to be the most powerful, versatile and flexible method. Due to
recent development in computer technology, the method has become an important
part of engineering analysis and design because nowadays finite element computer
programs are used practically in all branches of engineering. A complex geometry,
such as that of continuous curved steel box girder bridges, can be readily modelled
using the finite element technique. The method is also capable of dealing with
different material properties, relationships between structural components, boundary
conditions, as well as statically or dynamically applied loads. The linear and nonlinear
structural response of such bridges can be predicted with good accuracy using this
method. In the current research, various structural elements are modelled using finite
element method.
Program SAP2000 that was utilized throughout this study for the structural modelling
and analysis and finally the description of the models of the straight and curved box
bridges is presented. Before conducting a parametric study, the finite element model
is validated using a recent study presented by .Gupta. et. al(2010)
3.2 VALIDATION OF THE FINITE ELEMENT MODEL
To validate the finite element model of bridge deck in SAP-2000 a numerical example
reported by Gupta et.al (2010) has been considered.
21
SAP is a commercially available, general-purpose finite element-modelling package
for numerically solving a wide variety of civil engineering problems. These problems
include static/dynamic analysis. The program employs the matrix displacement
method of analysis based on finite element idealization.
The shell element has both bending and membrane capabilities. Both in-plane and
normal loads are permitted. The element has six degrees of freedom at each node:
translations in the nodal x, y, and z directions and rotations about the nodal x, y, and
z-axes.
In the recent past Yapping Wu (2003) has given an initial value solution of the static
equilibrium differential equation of thin walled box beam, considering both shear lag
and shear deformation.
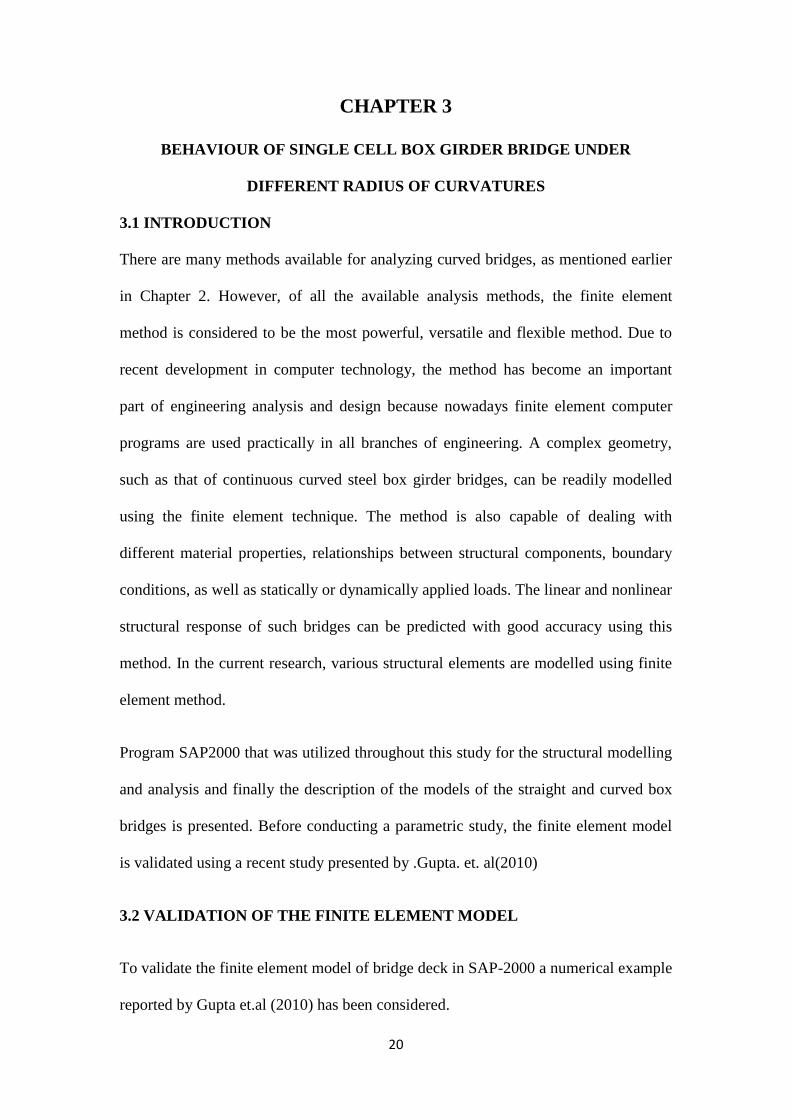
Figure 3.1 shows the the cross section of the simply supported box beam bridge model
used for the validation study. It is subjected to two equal concentrated load
(P=2x800N) at the two webs of mid span.
Figure 3.1. Cross-section of simply supported rectangular box beam
22
Length of Span is considered as 800mm, Modulus of elasticity (E) as 2.842GPa and
Modulus of rigidity (G) as 1.015GPa. The model is Modelled in SAP refer Figure 3.2.
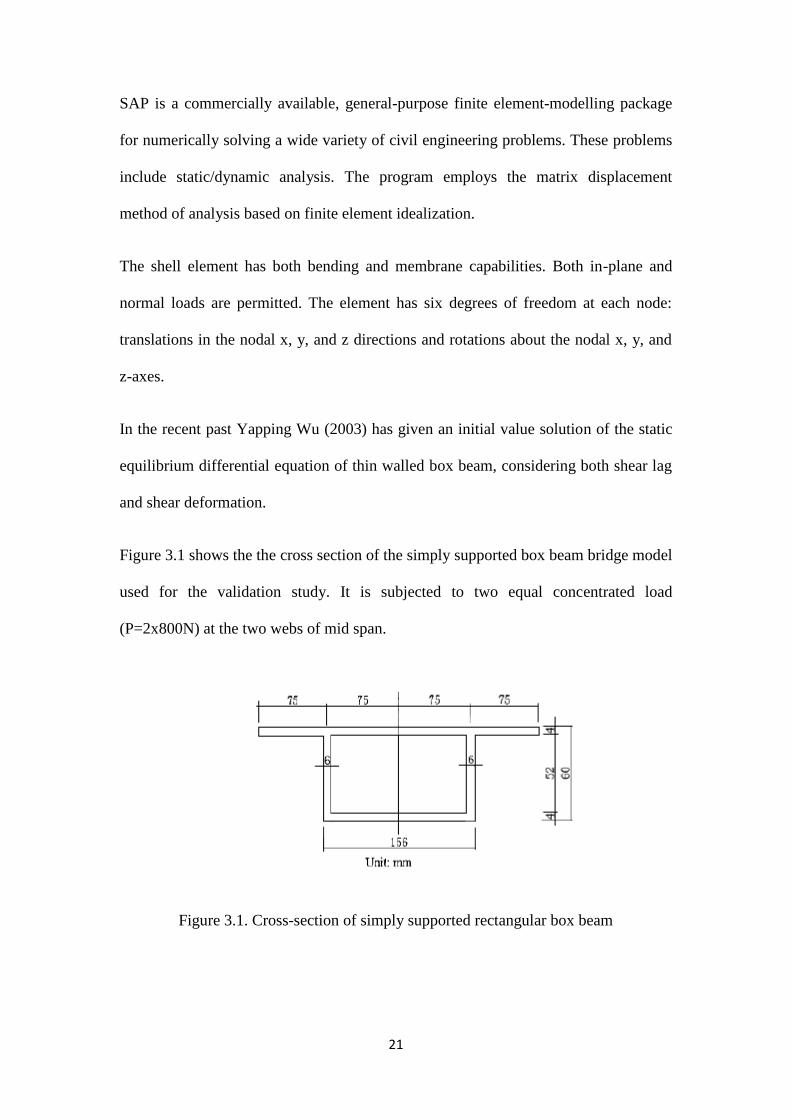
The rectangular box girder is modelled with Bridge Wizard having Shell elements.
The boundary condition is taken is simply supported. It is assigned with point loads
along the negative Z direction. Static analysis is conducted for the model.
(A) Model without load (B) Model with load
Figure 3.2. Single cell rectangular box girder bridge modelled in SAP 2000
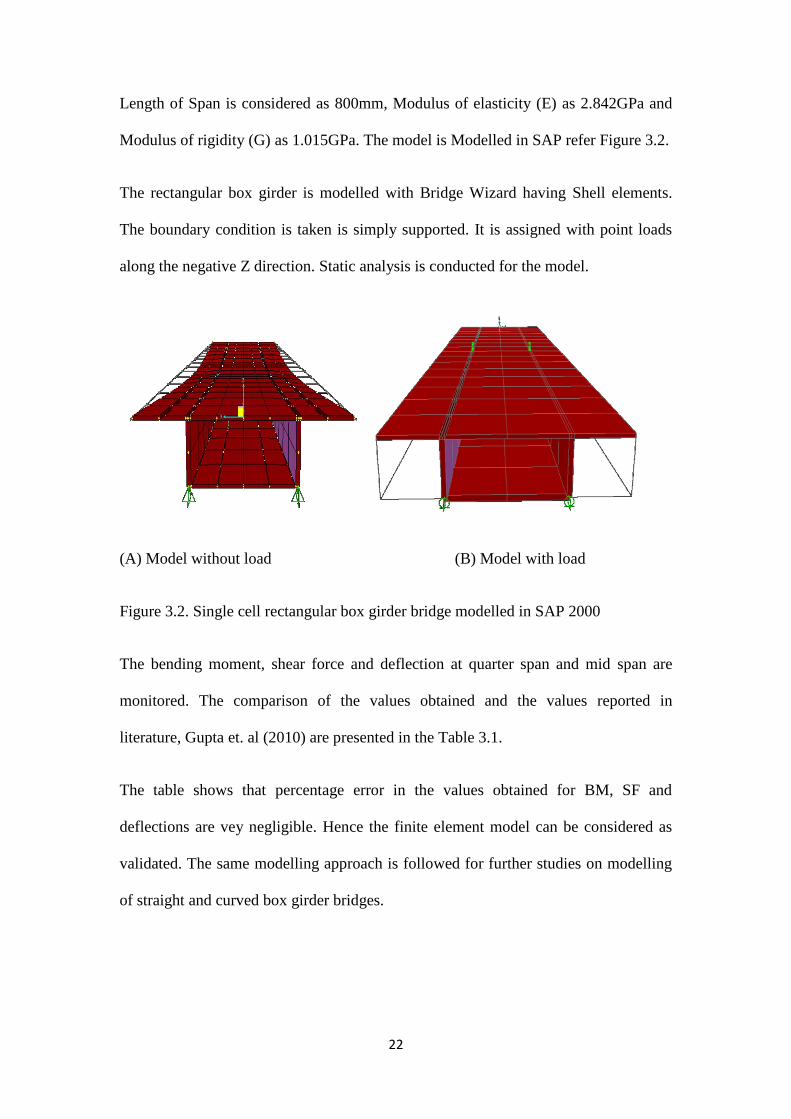
The bending moment, shear force and deflection at quarter span and mid span are
monitored. The comparison of the values obtained and the values reported in
literature, Gupta et. al (2010) are presented in the Table 3.1.
The table shows that percentage error in the values obtained for BM, SF and
deflections are vey negligible. Hence the finite element model can be considered as
validated. The same modelling approach is followed for further studies on modelling
of straight and curved box girder bridges.
23
Table 3.1 Comparison of responses obtained in present study and Gupta et. al (2010)
Parameters Location Present Study Gupta et.al(2010) % Error
Bending
Moment
(KN-m)
L/4th of
span 0.16 0.16 0
Mid
span 0.32 0.32 0
Shear Force
(KN)
L/4th of
span 0.8 0.8 0
Mid
span 0.8 0.8 0
Deflection
(mm)
Mid-
span 4.35 4.91 12.87
3.3 MODELLING OF BOX GIRDER BRIDGES FOR PARAMETRIC STUDY
All the five models are modelled in SAP2000 for the parametric study.
3.3.1. Case study of Bridge Models
A 66m strip of a viaduct of elevated system of Metro Rail of BMRC is modelled as a
bridge which is horizontally curved in plan. Its slab is monolithically constructed with
the concrete box girder. The Girder is a single cell Box Girder having Trapezoid in
cross-section. The bridge is simply supported. The reason for simply supported, is that
the restraining effect of slab is not considered here. In reality the slab will help to
restrict the rotation of girder. There are five models, among which one is straight and
other four are curved in plan, modelled in SAP2000; which is Structural analysis
software.
3.3.2 Types of design loads
The loads that are to be considered on the superstructure of a typical box girder
bridges are listed below;
A) Permanent Loads:
24
• Dead Loads
• Superimposed Dead Loads
• Pressures (earth, water, ice, etc.)
B) Temporary Loads:
• Vehicle Live Loads
• Earthquake Forces
• Wind Forces
• Channel Forces
• Longitudinal Forces
• Centrifugal Forces
• Impact Forces
• Construction Loads
C) Deformation and Response Loads:
• Creep
• Shrinkage
• Settlement
• Uplift
• Thermal Forces
D) Group Loading Combinations.
Although there are various kinds of loading present in a typical bridge, for the present
parametric study of bridges curved in plan, the scope is limited to Dead Loads and
Vehicle live loads only.
3.3.3 Loading Placement
I.R.C Class A Tracked Vehicle loading are first applied on a simply supported girder,
as lane loads with a span equal to 66m. Subsequently two loading cases were
25
considered for each bridge prototype, I.R.C Class A Tracked Vehicle loading, and
bridge dead load.
3.4 MODELLING OF BRIDGES
The finite element modelling of one straight and four curved bridges are conducted in
SAP2000.
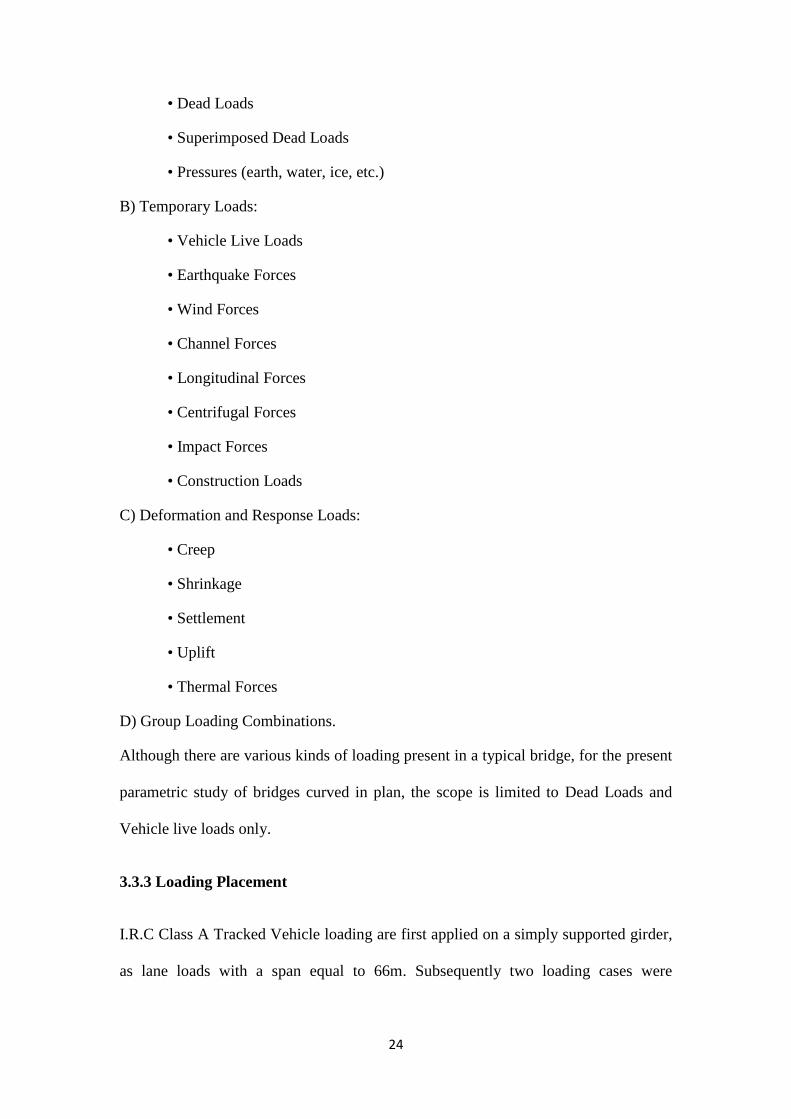
3.4.1. Curved girder bridge modelled in SAP2000
The curved Box Girder Model is made using Bridge module with shell elements of
SAP2000 .The Horizontal alignment from Bridge Wizard is made curved by
horizontally. Four curved bridges are modelled having radius of curvatures 205m,
210m, 220m and 306m. The curved bridge with radius of curvature of 205m is
denoted as 205R. Similarly, 210R represents a curved bridge with radius 210m.
Similar notation is followed for all the other cases. The Box Girders has Trapezoid in
cross section. The Deck section was taken as per BMRC model and having a single
span, of length 66m. The boundary condition is simply supported.
Table 3.2 Material properties.
Material Properties Values
weight /unit volume 25000 N/m3
Young's modulus (E) 32500 e6 N/m
2
Poisson's ratio (υ) 0.15
Shear Modulus (G) 1.413 e 10 N/m2
Coefficient of thermal expansion (A) 1.17 e -5
/0C
Specific compressive strength of concrete (fc') 45 e6 N/m
2
26
Figure 3.3 Curved Box Girder Modelled in SAP2000
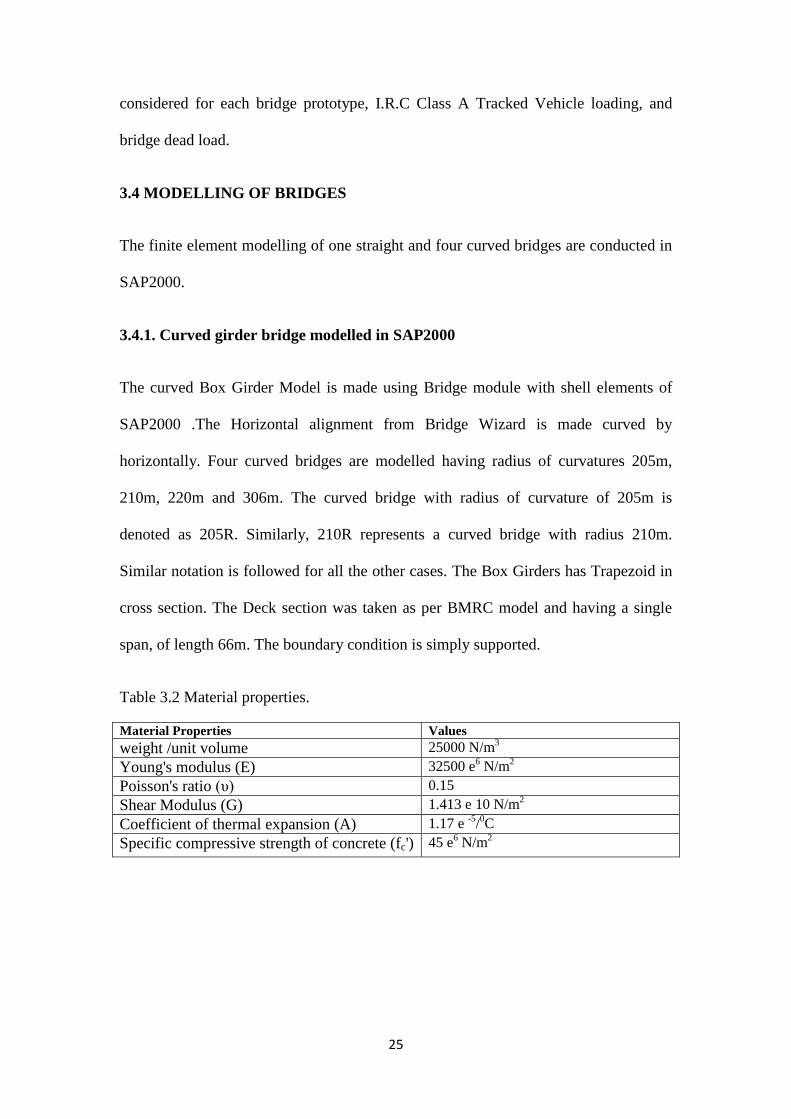
3.4.2 Straight girder bridge modelled in SAP2000
The straight Box Girder Model is made using Bridge Wizard Commands with shell
elements of SAP2000 .The Horizontal alignment from Bridge Wizard is made straight
by horizontally. The Box Girders has Trapezoid in cross section. The Deck section
was taken as per BMRC model and having a single span, of length 66m. The
boundary condition is simply supported. The material property is same as for the
curved models.
Figure 3.4 Straight girder modelled in SAP2000
27
3.5. CONFIGURATION OF BOX GIRDER
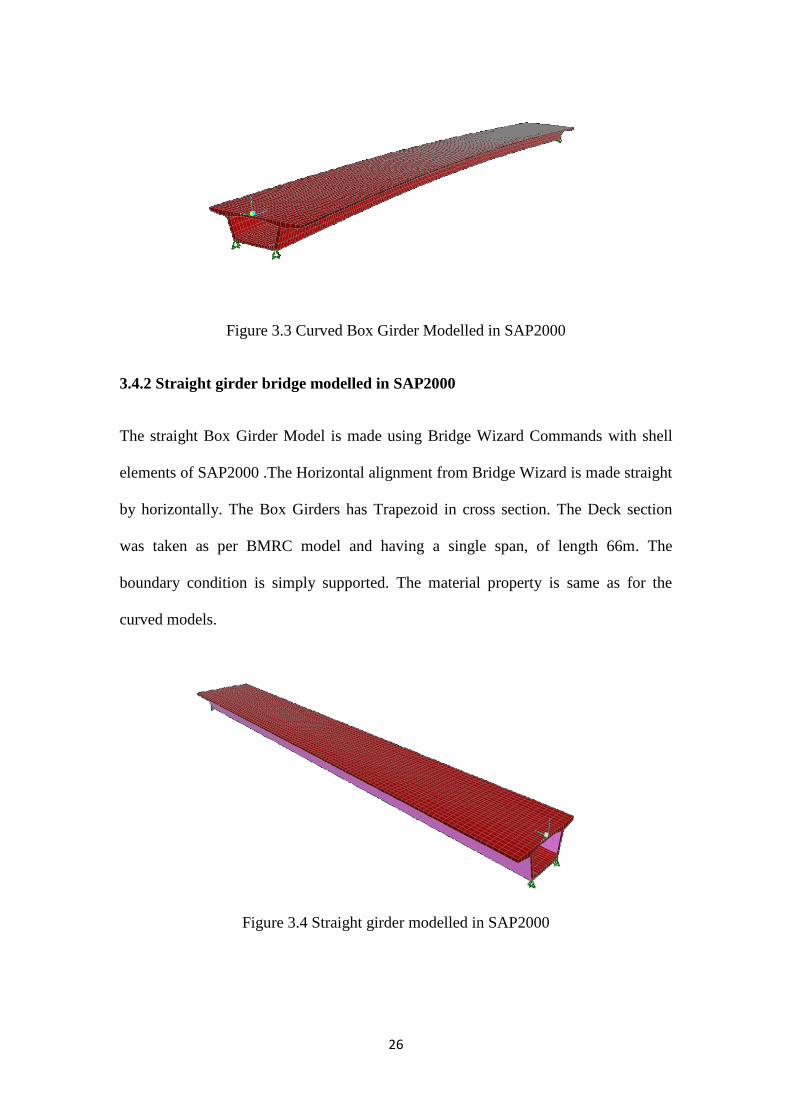
3.5.1. Cross-sectional properties
The cross-sectional properties for the trapezoidal box girder like span length, width of
bridge, depth of bridge, thickness of top flange, width of top flange, width of bottom
flange etc. is shown in Figure 3.5 and Table 3.3 and the material properties like cross
sectional area, moment of inertia, distance from bottom to centroidal axis etc. are
given in Table 3.4
Figure 3.5 Details of cross-section at mid span
28
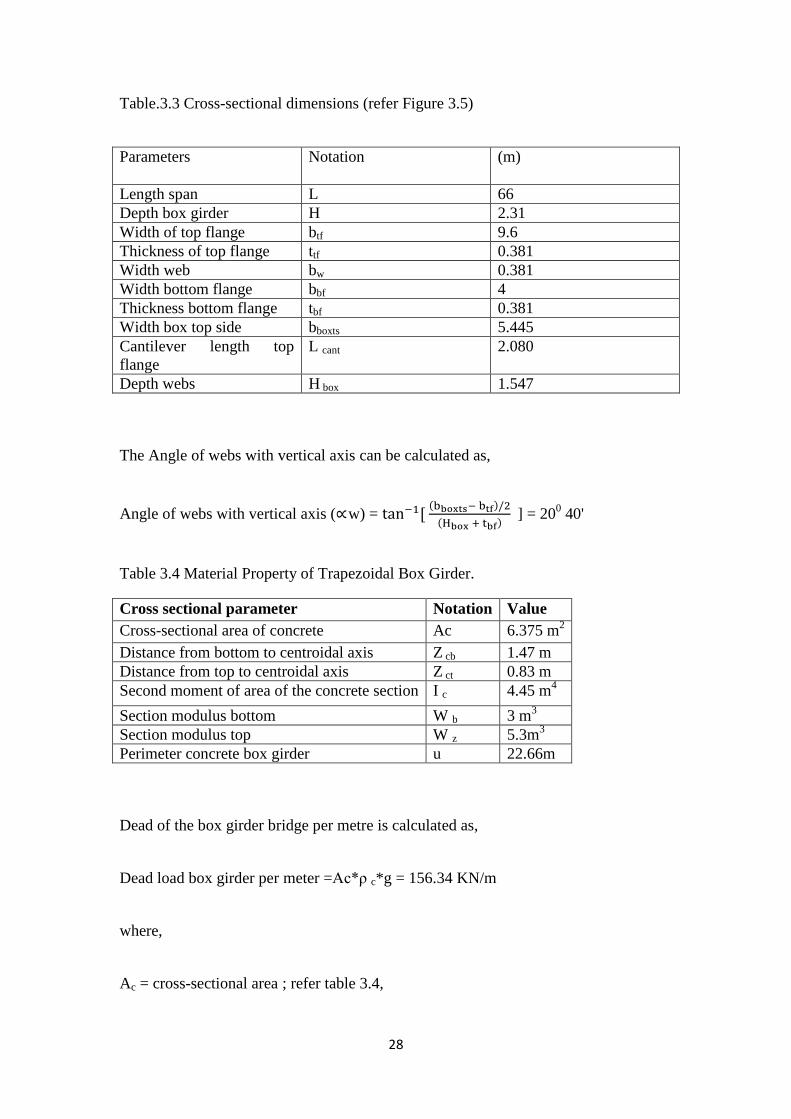
Table.3.3 Cross-sectional dimensions (refer Figure 3.5)
Parameters Notation (m)
Length span L 66
Depth box girder H 2.31
Width of top flange btf 9.6
Thickness of top flange ttf 0.381
Width web bw 0.381
Width bottom flange bbf 4
Thickness bottom flange tbf 0.381
Width box top side bboxts 5.445
Cantilever length top
flange
L cant 2.080
Depth webs H box 1.547
The Angle of webs with vertical axis can be calculated as,
Angle of webs with vertical axis (∝w) = ( )
( ) ] = 20
0 40'
Table 3.4 Material Property of Trapezoidal Box Girder.
Cross sectional parameter Notation Value
Cross-sectional area of concrete Ac 6.375 m2
Distance from bottom to centroidal axis Z cb 1.47 m
Distance from top to centroidal axis Z ct 0.83 m
Second moment of area of the concrete section I c 4.45 m4
Section modulus bottom W b 3 m3
Section modulus top W z 5.3m3
Perimeter concrete box girder u 22.66m
Dead of the box girder bridge per metre is calculated as,
Dead load box girder per meter =Ac*ρ c*g = 156.34 KN/m
where,
Ac = cross-sectional area ; refer table 3.4,
29
ρc = density of concrete; 2500 Kg/m3.
g = acceleration due to gravity; 9.81m/s2
.
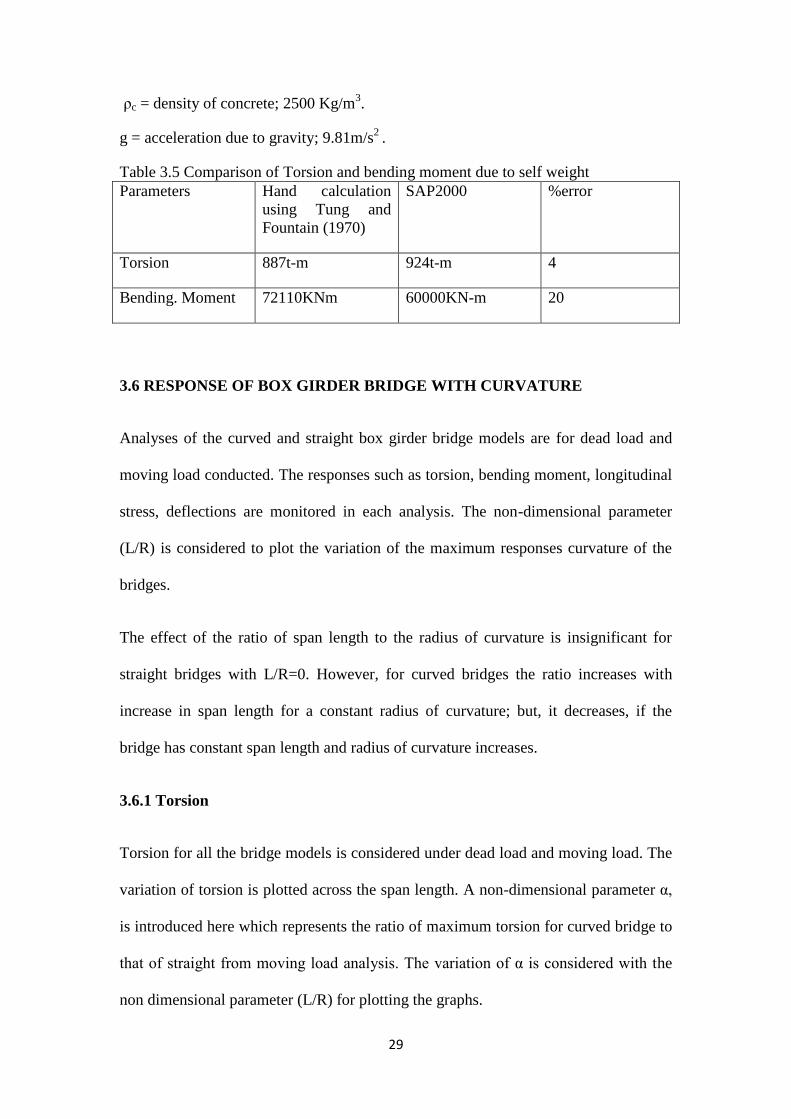
Table 3.5 Comparison of Torsion and bending moment due to self weight
Parameters Hand calculation
using Tung and
Fountain (1970)
SAP2000 %error
Torsion 887t-m 924t-m 4
Bending. Moment 72110KNm 60000KN-m 20
3.6 RESPONSE OF BOX GIRDER BRIDGE WITH CURVATURE
Analyses of the curved and straight box girder bridge models are for dead load and
moving load conducted. The responses such as torsion, bending moment, longitudinal
stress, deflections are monitored in each analysis. The non-dimensional parameter
(L/R) is considered to plot the variation of the maximum responses curvature of the
bridges.
The effect of the ratio of span length to the radius of curvature is insignificant for
straight bridges with L/R=0. However, for curved bridges the ratio increases with
increase in span length for a constant radius of curvature; but, it decreases, if the
bridge has constant span length and radius of curvature increases.
3.6.1 Torsion
Torsion for all the bridge models is considered under dead load and moving load. The
variation of torsion is plotted across the span length. A non-dimensional parameter α,
is introduced here which represents the ratio of maximum torsion for curved bridge to
that of straight from moving load analysis. The variation of α is considered with the
non dimensional parameter (L/R) for plotting the graphs.
30
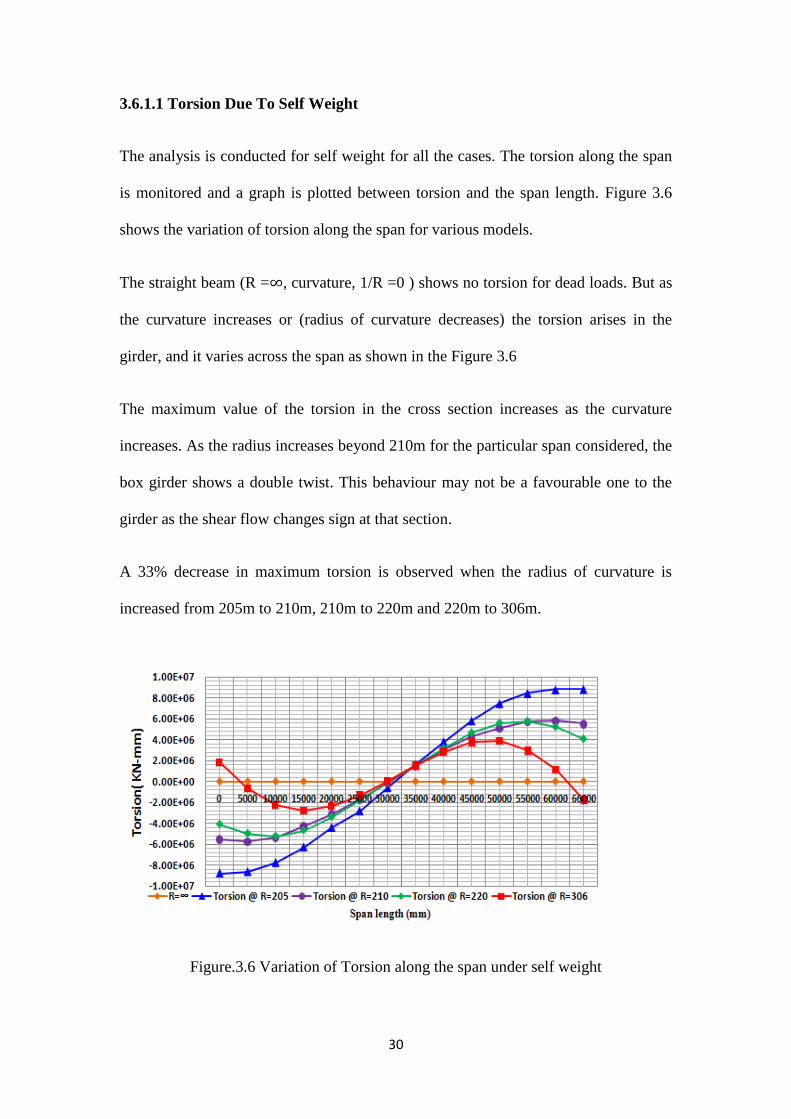
3.6.1.1 Torsion Due To Self Weight
The analysis is conducted for self weight for all the cases. The torsion along the span
is monitored and a graph is plotted between torsion and the span length. Figure 3.6
shows the variation of torsion along the span for various models.
The straight beam (R = , curvature, 1/R =0 ) shows no torsion for dead loads. But as
the curvature increases or (radius of curvature decreases) the torsion arises in the
girder, and it varies across the span as shown in the Figure 3.6
The maximum value of the torsion in the cross section increases as the curvature
increases. As the radius increases beyond 210m for the particular span considered, the
box girder shows a double twist. This behaviour may not be a favourable one to the
girder as the shear flow changes sign at that section.
A 33% decrease in maximum torsion is observed when the radius of curvature is
increased from 205m to 210m, 210m to 220m and 220m to 306m.
Figure.3.6 Variation of Torsion along the span under self weight
31
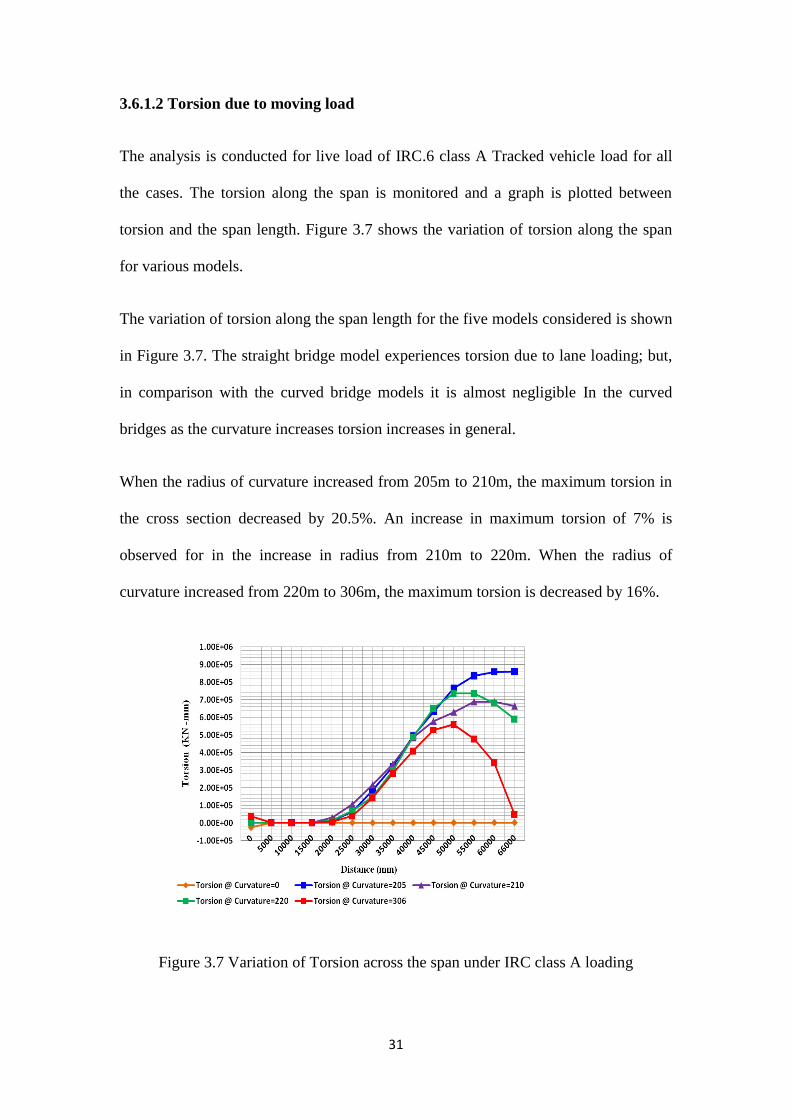
3.6.1.2 Torsion due to moving load
The analysis is conducted for live load of IRC.6 class A Tracked vehicle load for all
the cases. The torsion along the span is monitored and a graph is plotted between
torsion and the span length. Figure 3.7 shows the variation of torsion along the span
for various models.
The variation of torsion along the span length for the five models considered is shown
in Figure 3.7. The straight bridge model experiences torsion due to lane loading; but,
in comparison with the curved bridge models it is almost negligible In the curved
bridges as the curvature increases torsion increases in general.
When the radius of curvature increased from 205m to 210m, the maximum torsion in
the cross section decreased by 20.5%. An increase in maximum torsion of 7% is
observed for in the increase in radius from 210m to 220m. When the radius of
curvature increased from 220m to 306m, the maximum torsion is decreased by 16%.
Figure 3.7 Variation of Torsion across the span under IRC class A loading
32
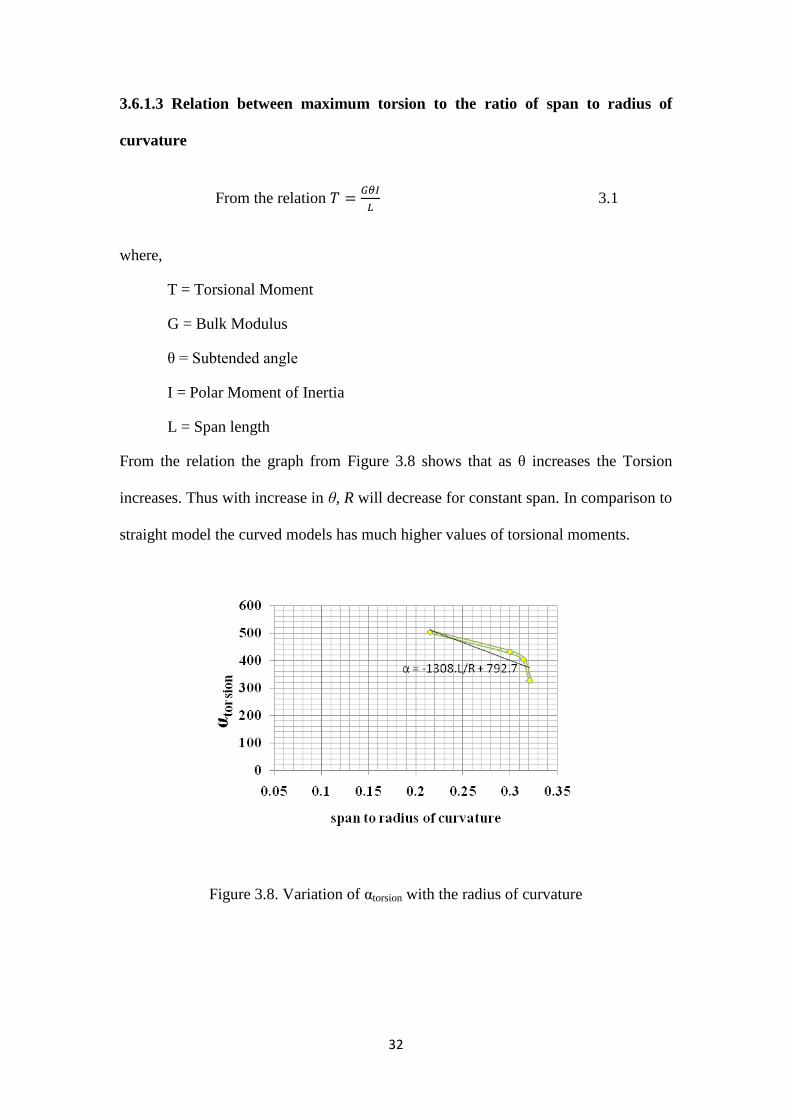
3.6.1.3 Relation between maximum torsion to the ratio of span to radius of
curvature
From the relation
3.1
where,
T = Torsional Moment
G = Bulk Modulus
θ = Subtended angle
I = Polar Moment of Inertia
L = Span length
From the relation the graph from Figure 3.8 shows that as θ increases the Torsion
increases. Thus with increase in θ, R will decrease for constant span. In comparison to
straight model the curved models has much higher values of torsional moments.
Figure 3.8. Variation of αtorsion with the radius of curvature
33
Maximum Torsion can also be expressed in terms of L/R ratio by the following Linear
Equation
α torsion= -1308.L/R +792.7 3.2
where,
α torsion = (max. torsion, curved/max. torsion, straight)
L/R = span to radius of curvature
3.6.2 Deflection of the box girder
The deflection is recorded both along transverse direction of the trapezoidal box
girder and also along the longitudinal direction of box girder.
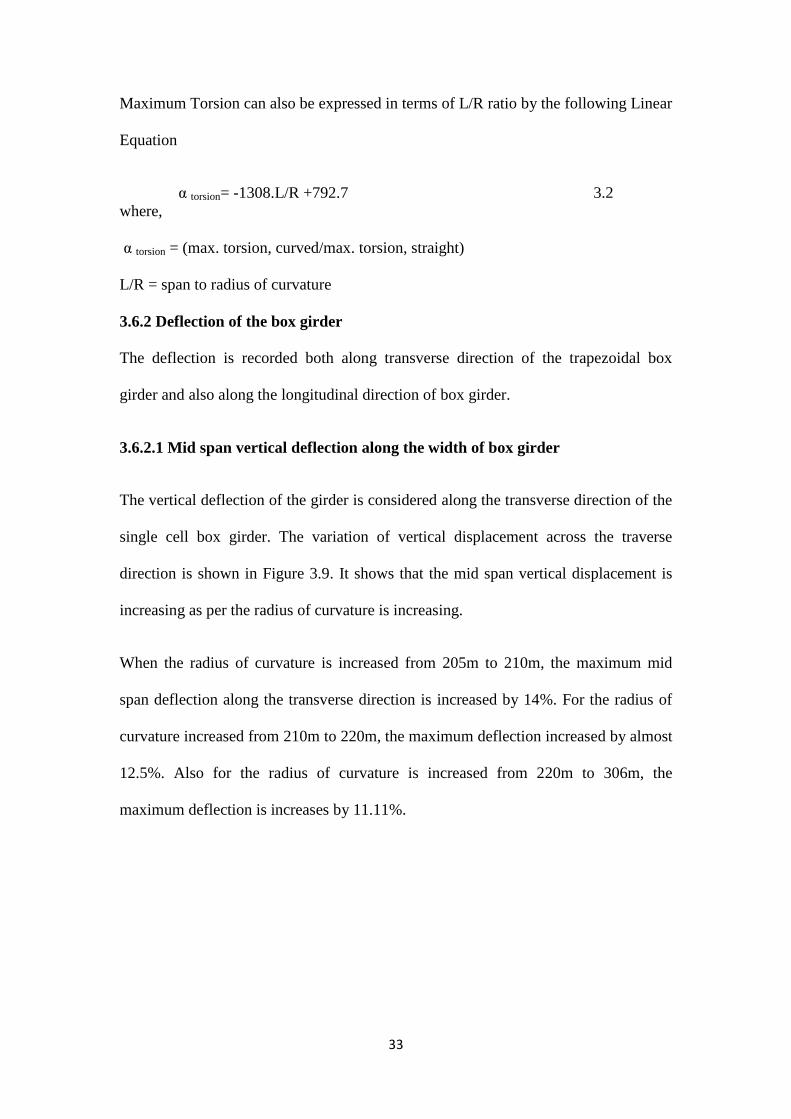
3.6.2.1 Mid span vertical deflection along the width of box girder
The vertical deflection of the girder is considered along the transverse direction of the
single cell box girder. The variation of vertical displacement across the traverse
direction is shown in Figure 3.9. It shows that the mid span vertical displacement is
increasing as per the radius of curvature is increasing.
When the radius of curvature is increased from 205m to 210m, the maximum mid
span deflection along the transverse direction is increased by 14%. For the radius of
curvature increased from 210m to 220m, the maximum deflection increased by almost
12.5%. Also for the radius of curvature is increased from 220m to 306m, the
maximum deflection is increases by 11.11%.
34
Figure.3.9.Mid-span vertical displacement along the width of box girder
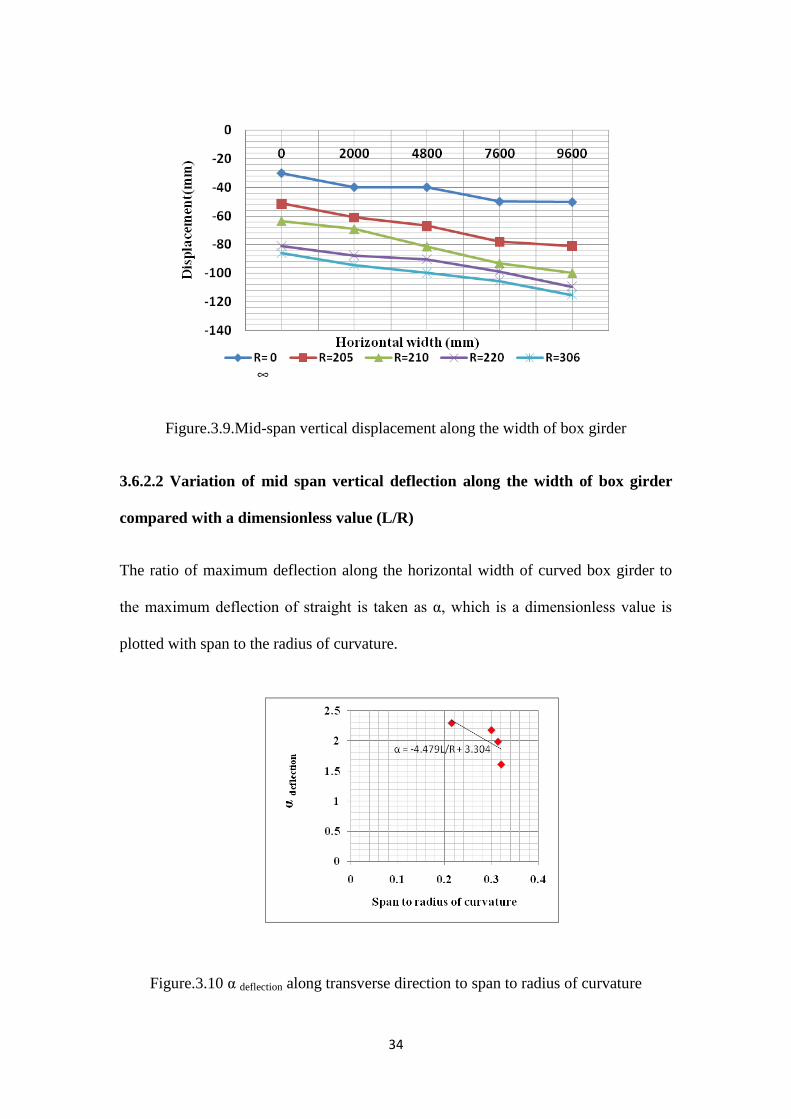
3.6.2.2 Variation of mid span vertical deflection along the width of box girder
compared with a dimensionless value (L/R)
The ratio of maximum deflection along the horizontal width of curved box girder to
the maximum deflection of straight is taken as α, which is a dimensionless value is
plotted with span to the radius of curvature.
Figure.3.10 α deflection along transverse direction to span to radius of curvature
35
The Figure 3.10 shows that, α deflection is increasing as the L/R ratio decreases; it means
that mid span vertical deflection along the transverse direction increases with increase
in radius of curvature.
α deflection can also be expressed approximately using a linear equation in terms
of L/R.
α = -4.479L/R + 3.304 3.3
where,
α =mid span deflection along the width of box girder
L/R = span to radius of curvature
3.6.2.3. Maximum deflection along the length of box girder
The deflection parameter is recorded for all the bridge models along the length of box
girder. The α deflection is a non dimensional parameter plotted along with L/R ratio and
it is shown in Figure 3.11
When the radius of curvature increased from 205m to 210m, the maximum mid span
deflection along the span is decreased by 7.7%. As the radius of curvature is increased
to 220m, the maximum deflection is decreased by almost 16.67%. Also, when the
radius of curvature is increased from 220m to 306m, the maximum deflection is found
to be decreased by 75%, which behaves more like a straight bridge.
The dimensionless ratio α maximum deflection(deflection of curved to deflection of straight
girder) decreases with decrease in span to radius of curvature. The deflection along
the span of bridge increases with increase in curvature.
36
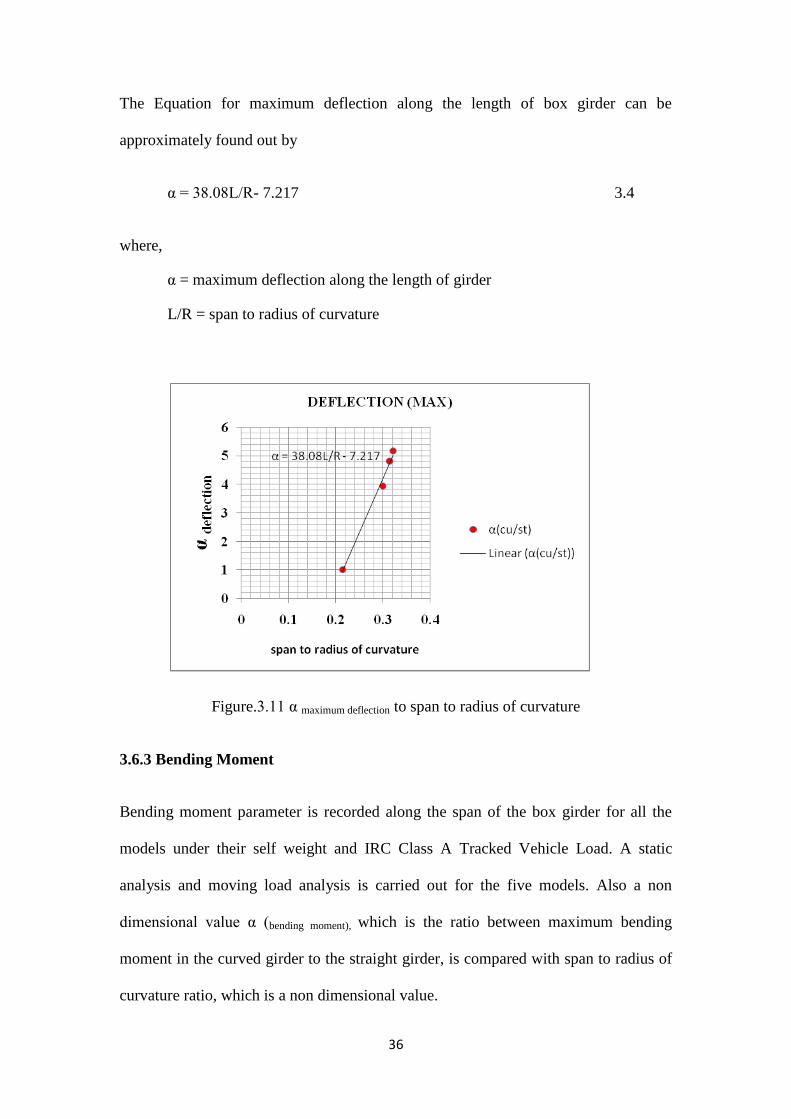
The Equation for maximum deflection along the length of box girder can be
approximately found out by
α = 38.08L/R- 7.217 3.4
where,
α = maximum deflection along the length of girder
L/R = span to radius of curvature
Figure.3.11 α maximum deflection to span to radius of curvature
3.6.3 Bending Moment
Bending moment parameter is recorded along the span of the box girder for all the
models under their self weight and IRC Class A Tracked Vehicle Load. A static
analysis and moving load analysis is carried out for the five models. Also a non
dimensional value α (bending moment), which is the ratio between maximum bending
moment in the curved girder to the straight girder, is compared with span to radius of
curvature ratio, which is a non dimensional value.
37
3.6.3 1 Bending moment due to self-weight
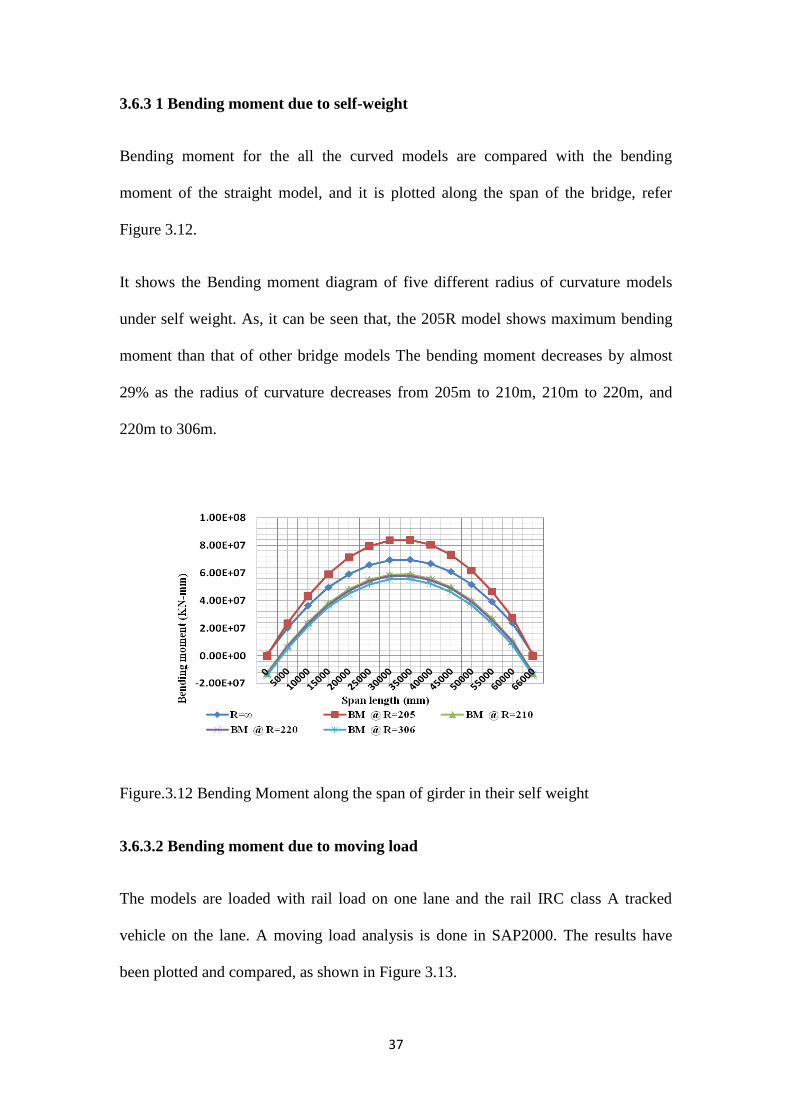
Bending moment for the all the curved models are compared with the bending
moment of the straight model, and it is plotted along the span of the bridge, refer
Figure 3.12.
It shows the Bending moment diagram of five different radius of curvature models
under self weight. As, it can be seen that, the 205R model shows maximum bending
moment than that of other bridge models The bending moment decreases by almost
29% as the radius of curvature decreases from 205m to 210m, 210m to 220m, and
220m to 306m.
Figure.3.12 Bending Moment along the span of girder in their self weight
3.6.3.2 Bending moment due to moving load
The models are loaded with rail load on one lane and the rail IRC class A tracked
vehicle on the lane. A moving load analysis is done in SAP2000. The results have
been plotted and compared, as shown in Figure 3.13.
38
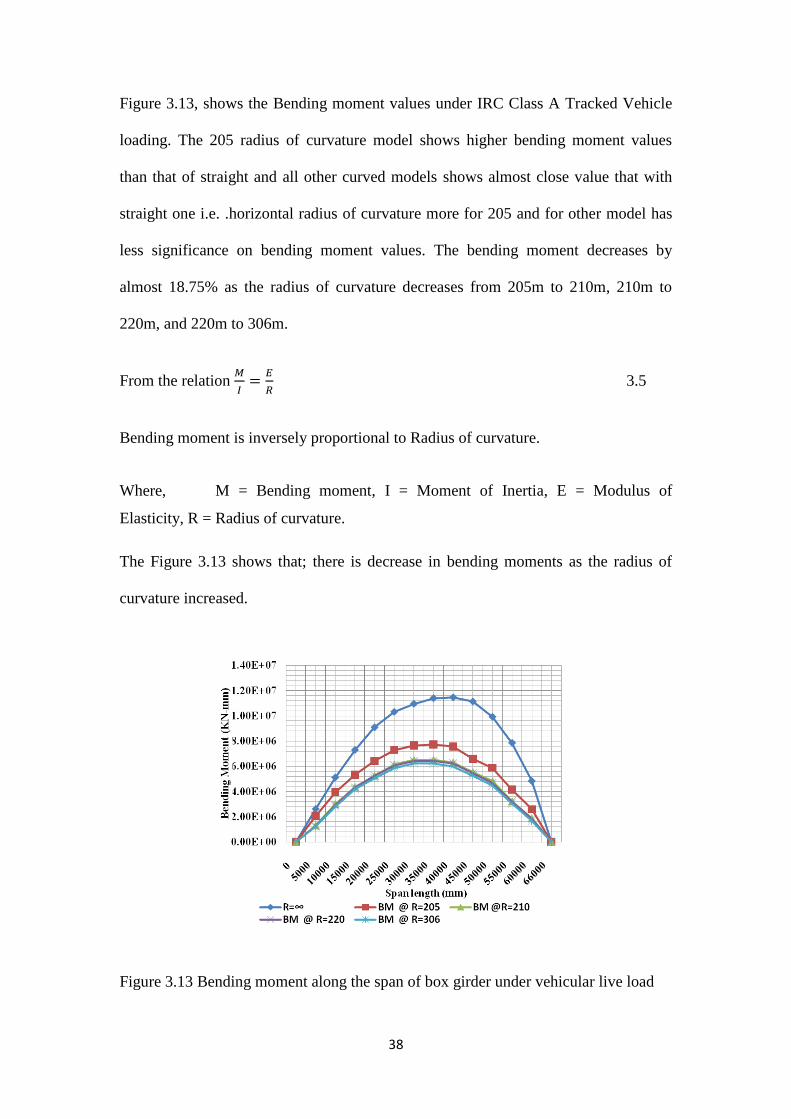
Figure 3.13, shows the Bending moment values under IRC Class A Tracked Vehicle
loading. The 205 radius of curvature model shows higher bending moment values
than that of straight and all other curved models shows almost close value that with
straight one i.e. .horizontal radius of curvature more for 205 and for other model has
less significance on bending moment values. The bending moment decreases by
almost 18.75% as the radius of curvature decreases from 205m to 210m, 210m to
220m, and 220m to 306m.
From the relation
3.5
Bending moment is inversely proportional to Radius of curvature.
Where, M = Bending moment, I = Moment of Inertia, E = Modulus of
Elasticity, R = Radius of curvature.
The Figure 3.13 shows that; there is decrease in bending moments as the radius of
curvature increased.
Figure 3.13 Bending moment along the span of box girder under vehicular live load
39
3.6.3.3 α bending moment(bending moment of curved girder to the straight girder)
with L/R ratio
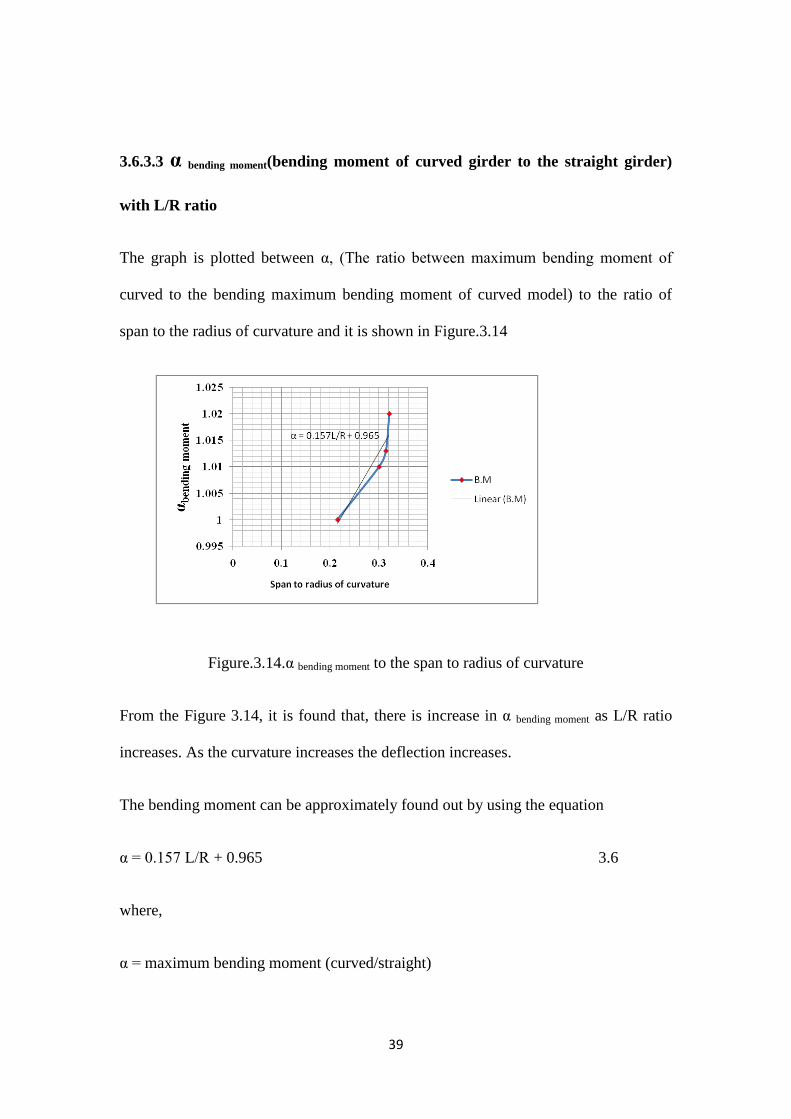
The graph is plotted between α, (The ratio between maximum bending moment of
curved to the bending maximum bending moment of curved model) to the ratio of
span to the radius of curvature and it is shown in Figure.3.14
Figure.3.14.α bending moment to the span to radius of curvature
From the Figure 3.14, it is found that, there is increase in α bending moment as L/R ratio
increases. As the curvature increases the deflection increases.
The bending moment can be approximately found out by using the equation
α = 0.157 L/R + 0.965 3.6
where,
α = maximum bending moment (curved/straight)
40
L/R = span to radius of curvature ratio
3.6.4 Longitudinal stresses due to moving load
All the models are analysed for a moving load analysis under IRC Class A Tracked
Vehicle load. The longitudinal stress parameter is recorded across the span length for
left overhanging portion, centre, right side overhanging portion of the box girder.
Also, α longitudinal stress for top and bottom face of box girder is plotted for span to radius
of curvature ratio.
3.6.4.1 Longitudinal Stress (Top and Bottom) - Left side overhanging potion of
box girder
The longitudinal stress at the top and bottom of the left overhanging potion of girder
is found out from moving load analysis.
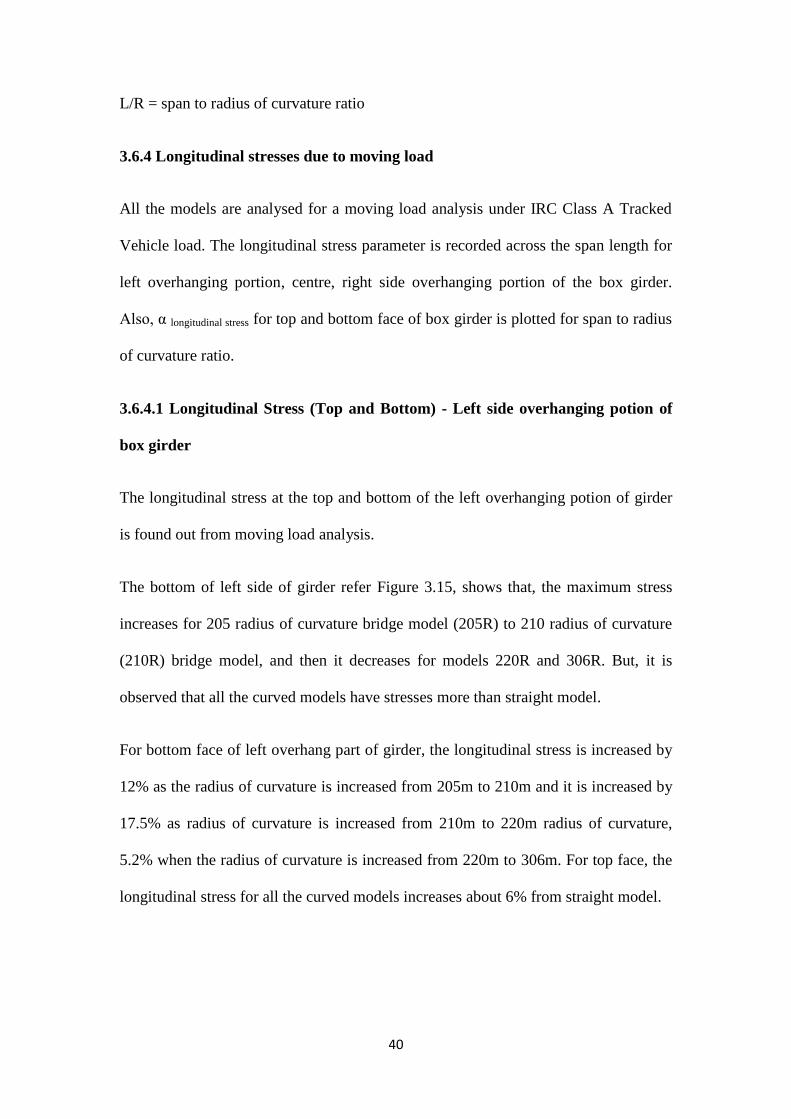
The bottom of left side of girder refer Figure 3.15, shows that, the maximum stress
increases for 205 radius of curvature bridge model (205R) to 210 radius of curvature
(210R) bridge model, and then it decreases for models 220R and 306R. But, it is
observed that all the curved models have stresses more than straight model.
For bottom face of left overhang part of girder, the longitudinal stress is increased by
12% as the radius of curvature is increased from 205m to 210m and it is increased by
17.5% as radius of curvature is increased from 210m to 220m radius of curvature,
5.2% when the radius of curvature is increased from 220m to 306m. For top face, the
longitudinal stress for all the curved models increases about 6% from straight model.
41
Figure 3.15 Longitudinal stress; top and bottom on left side of girder
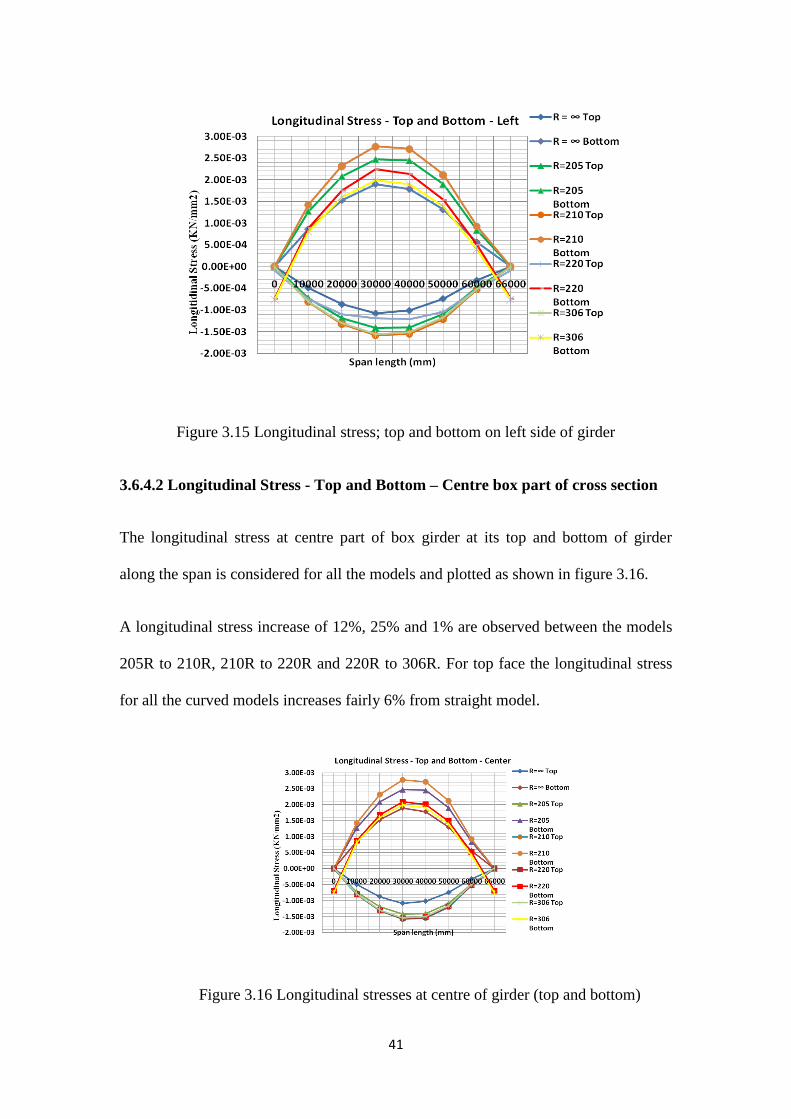
3.6.4.2 Longitudinal Stress - Top and Bottom – Centre box part of cross section
The longitudinal stress at centre part of box girder at its top and bottom of girder
along the span is considered for all the models and plotted as shown in figure 3.16.
A longitudinal stress increase of 12%, 25% and 1% are observed between the models
205R to 210R, 210R to 220R and 220R to 306R. For top face the longitudinal stress
for all the curved models increases fairly 6% from straight model.
Figure 3.16 Longitudinal stresses at centre of girder (top and bottom)
42
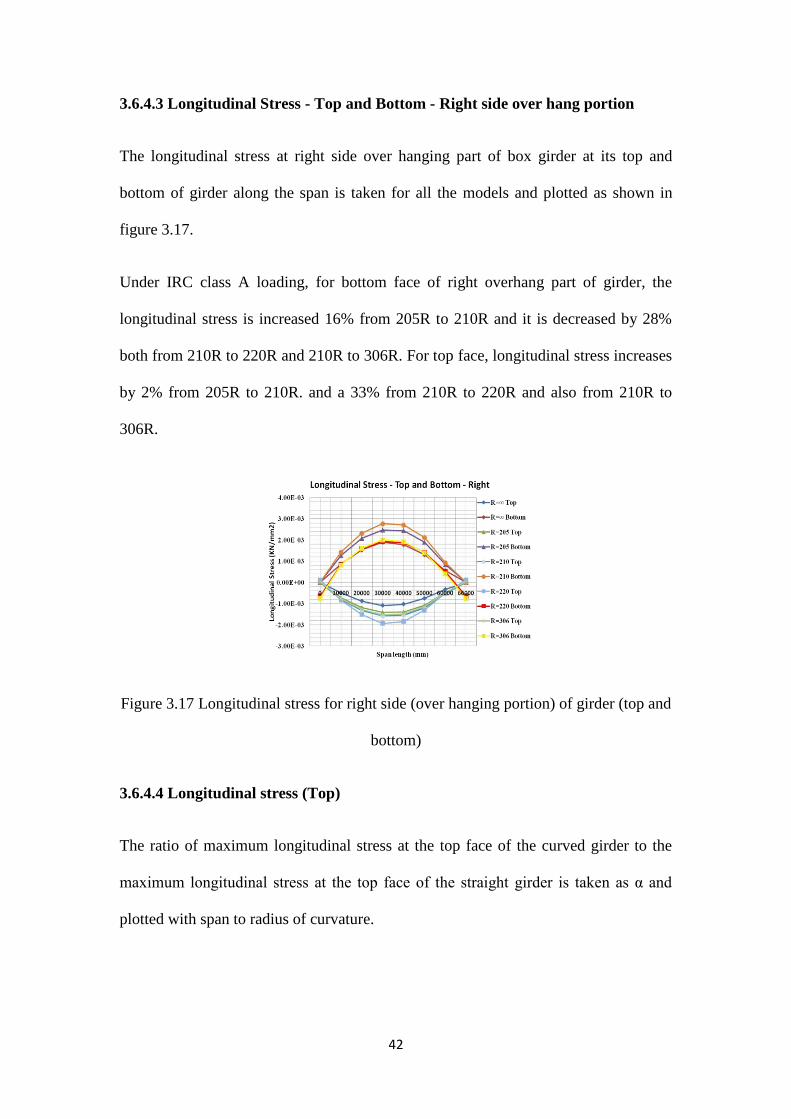
3.6.4.3 Longitudinal Stress - Top and Bottom - Right side over hang portion
The longitudinal stress at right side over hanging part of box girder at its top and
bottom of girder along the span is taken for all the models and plotted as shown in
figure 3.17.
Under IRC class A loading, for bottom face of right overhang part of girder, the
longitudinal stress is increased 16% from 205R to 210R and it is decreased by 28%
both from 210R to 220R and 210R to 306R. For top face, longitudinal stress increases
by 2% from 205R to 210R. and a 33% from 210R to 220R and also from 210R to
306R.
Figure 3.17 Longitudinal stress for right side (over hanging portion) of girder (top and
bottom)
3.6.4.4 Longitudinal stress (Top)
The ratio of maximum longitudinal stress at the top face of the curved girder to the
maximum longitudinal stress at the top face of the straight girder is taken as α and
plotted with span to radius of curvature.
43
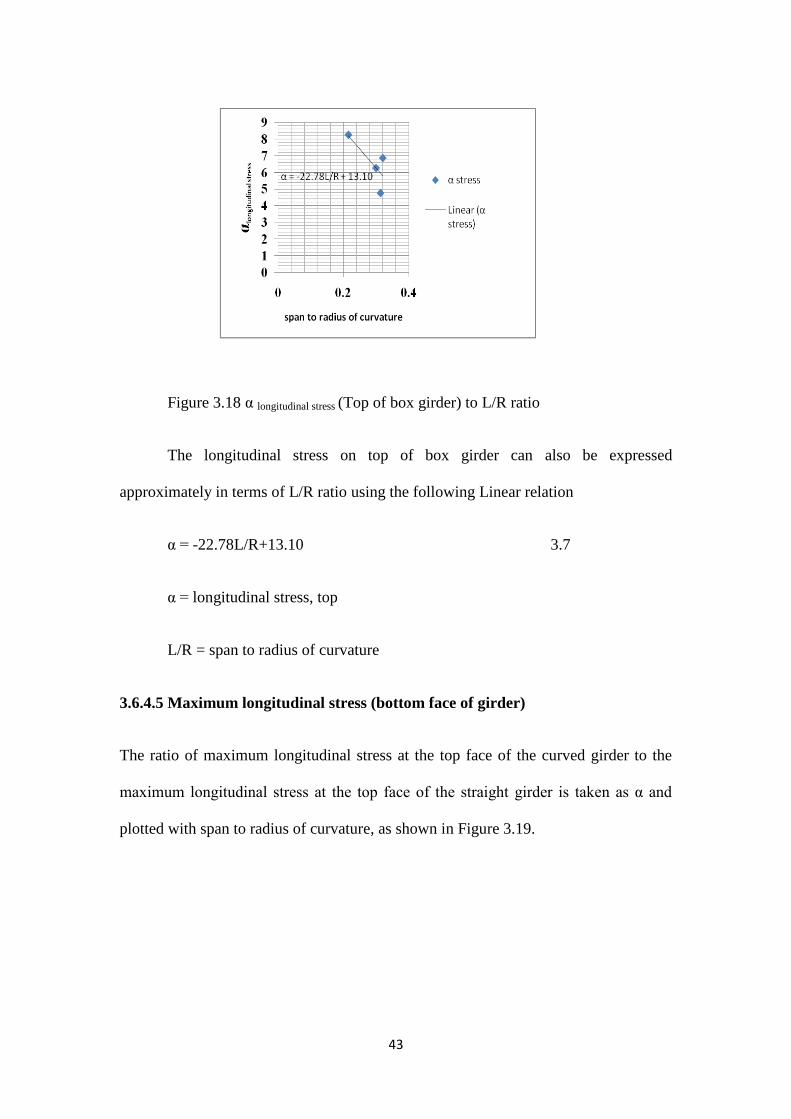
Figure 3.18 α longitudinal stress (Top of box girder) to L/R ratio
The longitudinal stress on top of box girder can also be expressed
approximately in terms of L/R ratio using the following Linear relation
α = -22.78L/R+13.10 3.7
α = longitudinal stress, top
L/R = span to radius of curvature
3.6.4.5 Maximum longitudinal stress (bottom face of girder)
The ratio of maximum longitudinal stress at the top face of the curved girder to the
maximum longitudinal stress at the top face of the straight girder is taken as α and
plotted with span to radius of curvature, as shown in Figure 3.19.
44
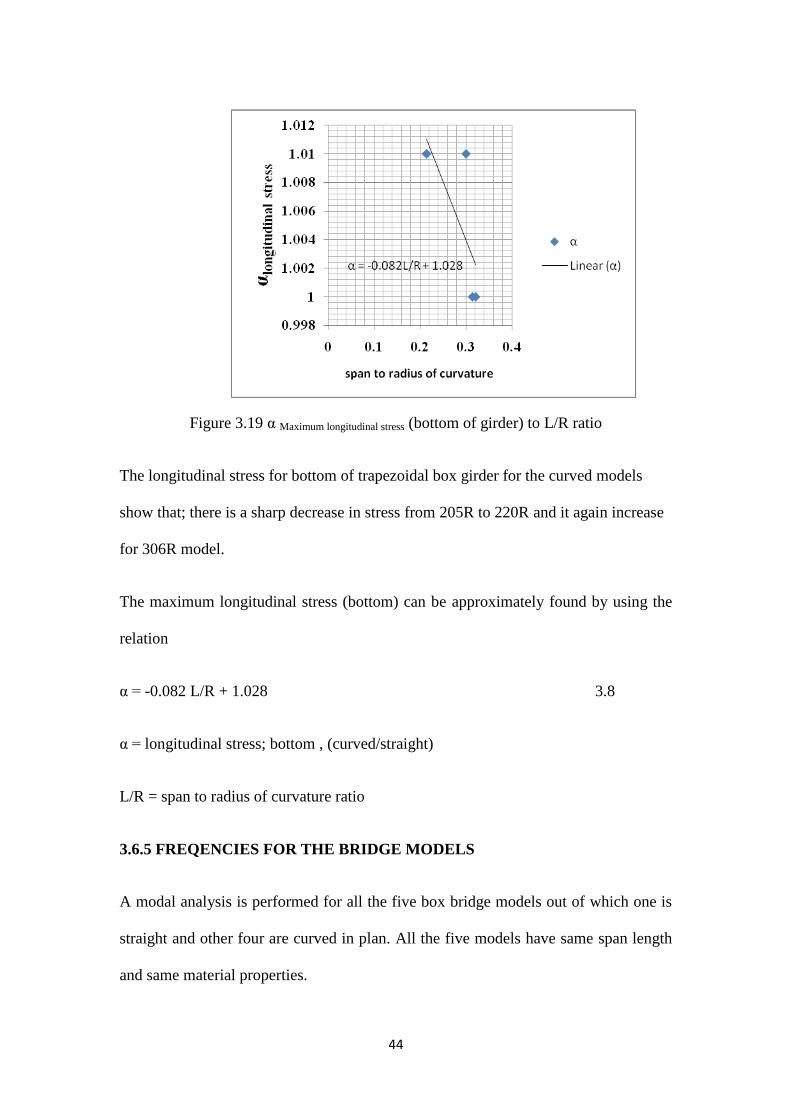
Figure 3.19 α Maximum longitudinal stress (bottom of girder) to L/R ratio
The longitudinal stress for bottom of trapezoidal box girder for the curved models
show that; there is a sharp decrease in stress from 205R to 220R and it again increase
for 306R model.
The maximum longitudinal stress (bottom) can be approximately found by using the
relation
α = -0.082 L/R + 1.028 3.8
α = longitudinal stress; bottom , (curved/straight)
L/R = span to radius of curvature ratio
3.6.5 FREQENCIES FOR THE BRIDGE MODELS
A modal analysis is performed for all the five box bridge models out of which one is
straight and other four are curved in plan. All the five models have same span length
and same material properties.
45
Table 3.6 Frequencies for the bridge models
Output
case
Frequency
(Cycle/sec)
R=205
Frequency
(Cycle/sec)
R=210
Frequency
(Cycle/sec)
R=220
Frequency
(Cycle/sec)
R=306
Frequency
(Cycle/sec)
R=0
Mode1 0.493 0.493 0.494 0.493 0.492
Mode2 0.963 0.964 0.971 1.006 0.998
Mode3 3.269 3.260
3.260 3.239 3.219
Mode4 3.771 3.772 3.803 3.829 3.798
Mode5 4.512 4.512 4.516 4.555 4.549
Mode6 7.644 7.640 7.646 7.698 7.642
Mode7 8.072 8.065 8.070 8.110 7.642
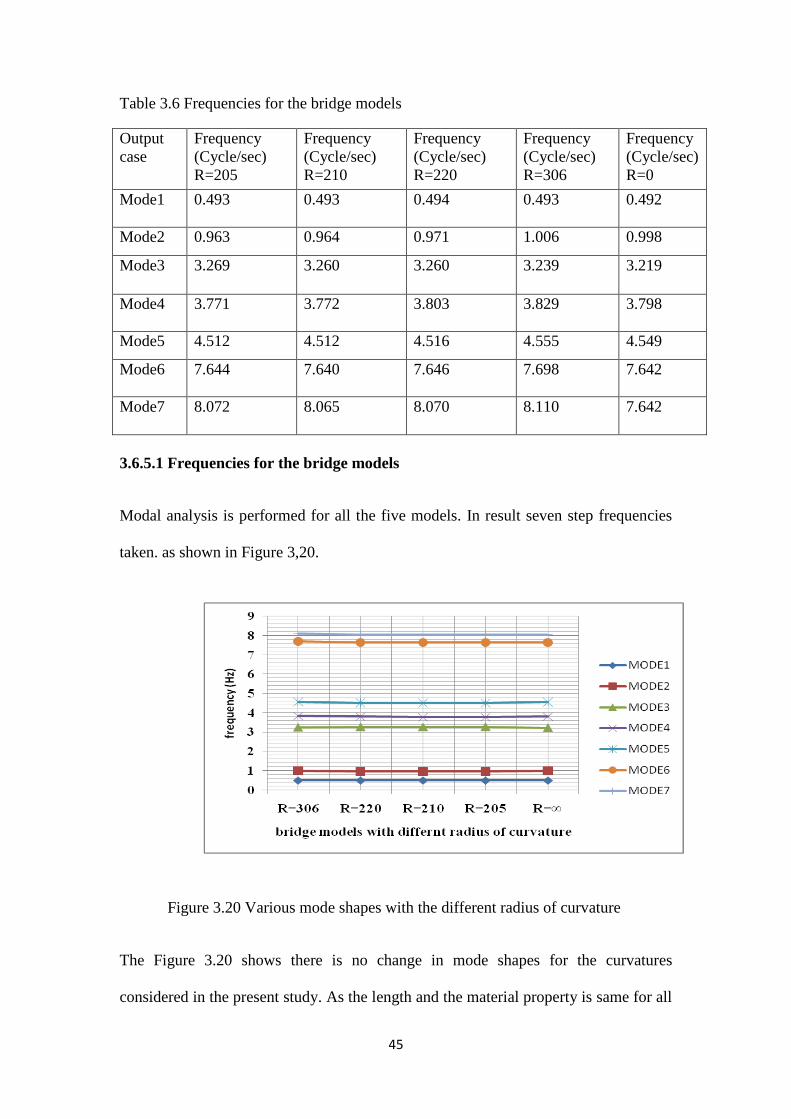
3.6.5.1 Frequencies for the bridge models
Modal analysis is performed for all the five models. In result seven step frequencies
taken. as shown in Figure 3,20.
Figure 3.20 Various mode shapes with the different radius of curvature
The Figure 3.20 shows there is no change in mode shapes for the curvatures
considered in the present study. As the length and the material property is same for all
46
the models so, the mass for all the five models are same; therefore there is no change
in mode shapes.
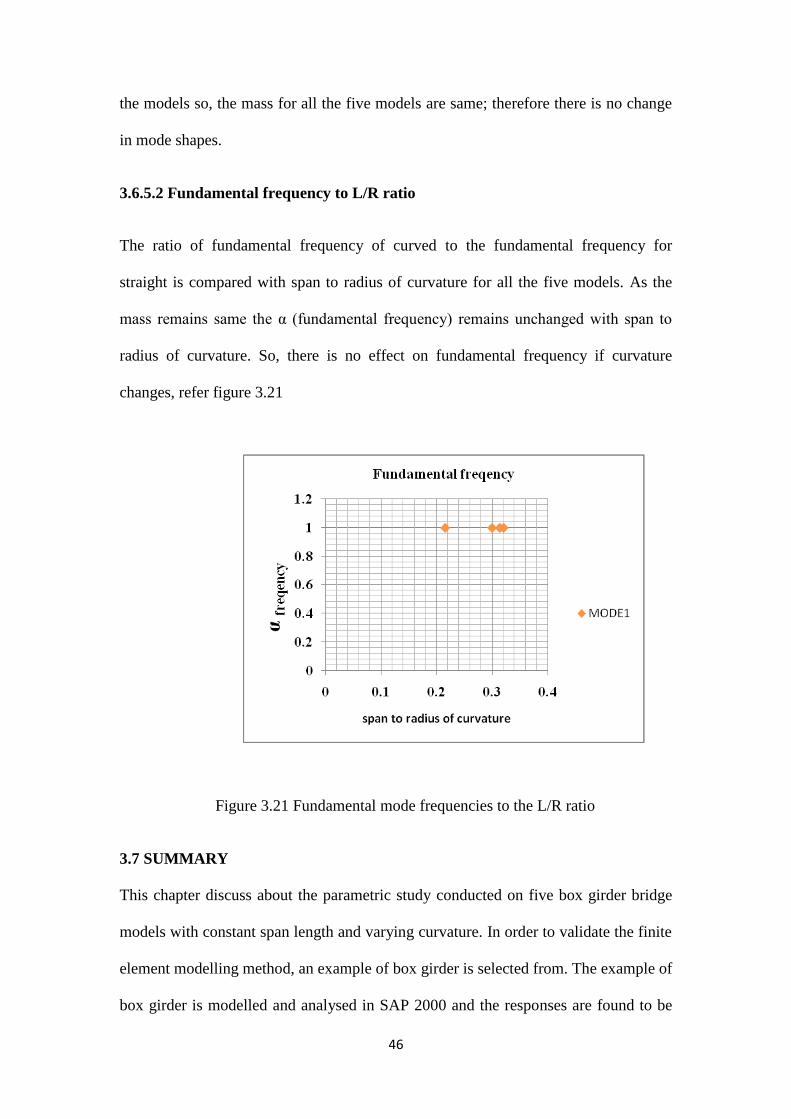
3.6.5.2 Fundamental frequency to L/R ratio
The ratio of fundamental frequency of curved to the fundamental frequency for
straight is compared with span to radius of curvature for all the five models. As the
mass remains same the α (fundamental frequency) remains unchanged with span to
radius of curvature. So, there is no effect on fundamental frequency if curvature
changes, refer figure 3.21
Figure 3.21 Fundamental mode frequencies to the L/R ratio
3.7 SUMMARY
This chapter discuss about the parametric study conducted on five box girder bridge
models with constant span length and varying curvature. In order to validate the finite
element modelling method, an example of box girder is selected from. The example of
box girder is modelled and analysed in SAP 2000 and the responses are found to be
47
fairly matching. For the purpose of the parametric study, the five box girder bridges
are modelled in SAP2000. The span length, cross-section and material property
remains unchanged. The only parameter that changes is the radius of curvature. The
cross section of the superstructure of the box girder bridge consists of single cell box.
The curvature of the bridges varies only in horizontal direction. All the models are
subjected to self weight and moving load of IRC class A tracked vehicle. A static
analysis for dead load and moving load, and a modal analysis are performed. The
longitudinal stress at top and bottom of cross sections, bending moment, torsion,
deflection and fundamental frequency are recorded. The responses of a box girder
bridges curved in plan and straight are compared. The ratio of responses is expressed
in terms of a parameter.
Under dead load; it is recorded that, there is a 33% decrease in maximum torsion is
observed when the radius of curvature is increased from 205m to 210m, 210m to
220m and 220m to 306m.
Under IRC class A loading; it shows that the as radius of curvature increased from
205m to 210m, the maximum torsion in the cross section decreased by 20.5%. An
increase in maximum torsion of 7% is observed for in the increase in radius from
210m to 220m. When the radius of curvature increased from 220m to 306m, the
maximum torsion is decreased by 16%.
From this it concluded that, as the curvature increases the torsion also increases.
Under IRC Class A loading, it shows that; when the radius of curvature increased
from 205m to 210m, the maximum mid span deflection along the transverse direction
increases by 14%. For the radius of curvature increased to 220m, the maximum
48
deflection increases by almost 12.5%. Also for the radius of curvature is increased
from 220m to 306m, the maximum deflection is increases by 11.11%.
Under IRC Class A loading, it shows that; when the radius of curvature increased
from 205m to 210m, the maximum mid span deflection along the span is decreased by
7.7%. As the radius of curvature is increased to 220m, the maximum deflection is
decreased by almost 16.67%. Also, when the radius of curvature is increased from
220m to 306m, the maximum deflection is found to be decreased by 75%, which
behaves more like a straight bridge.
Under dead load, the bending moment decreases by almost 29% as the radius of
curvature decreases from 205m to 210m, 210m to 220m, and 220m to 306m.
Under IRC Class A loading, the bending moment decreases by almost 18.75% as the
radius of curvature decreases from 205m to 210m, 210m to 220m, and 220m to 306m.
Under IRC class A loading, for bottom face of left overhang part of girder, the
longitudinal stress is increased by 12% as the radius of curvature is increased from
205m to 210m and it is increased by 17.5% as radius of curvature is increased from
210m to 220m radius of curvature, 5.2% when the radius of curvature is increased
from 220m to 306m. For top face, the longitudinal stress for all the curved models
increases about 6% from straight model.
Under IRC class A loading, the longitudinal stress increase of 12%, 25% and 1% are
observed between the models 205R to 210R, 210R to 220R and 220R to 306R. for the
bottom face of central cross section. For top face the longitudinal stress for all the
curved models increases fairly 6% from straight model.
49
Under IRC class A loading, for bottom face of right overhang part of girder, the
longitudinal stress is increased 16% from 205R to 210R and it is decreased by 28%
both from 210R to 220R and 210R to 306R. For top face, longitudinal stress increases
by 2% from 205R to 210R. and a 33% from 210R to 220R and also from 210R to
306R.
For fundamental frequency; it shows, as the mass remains same the α (fundamental
frequency) remains unchanged with span to radius of curvature. So, there is no effect
on fundamental frequency if curvature changes.
Therefore, it shows that the parameters, torsion, deflection and bending moment is
increasing as the curvature increases.
48
CHAPTER 4
CONCLUSIONS
4.1 SUMMARY
The present study focus on the parametric study of single cell box girder bridges
curved in plan. For the purpose of the parametric study, five box girder bridge models
with constant span length and varying curvature. In order to validate the finite element
modelling method, an example of box girder bridge is selected from literature to
conduct a validation study. The example box girder is modelled and analysed in SAP
2000 and the responses are found to be fairly matching. The five box girder bridges
are modelled in SAP2000. The span length, cross-section and material property
remains unchanged. The only parameter that changes is the radius of curvature. The
cross section of the superstructure of the box girder bridge consists of single cell box.
The curvature of the bridges varies only in horizontal direction. All the models are
subjected to self weight and moving load of IRC class A tracked vehicle. A static
analysis for dead load and moving load, and a modal analysis are performed. The
longitudinal stress at top and bottom of cross sections, bending moment, torsion,
deflection and fundamental frequency are recorded. These four models are analysed
and have been compared with the straight model.
4.2 CONCLUSIONS
The major conclusions are listed below:
The vertical displacement of simply supported curved box girder bridges at
mid-span is related to horizontal radius of curvature. The deflection is taken
along the width of the box girder. When the radius is below 210m,
49
displacement increases more rapidly, but, when the radius is more than 210 m,
displacement curve gradually tends to level, the characteristics is the same as
straight bridge.
Under IRC Class A loading, it shows that; when the radius of curvature
increased from 205m to 210m, the maximum mid span deflection along the
transverse direction increases by 14%. For the radius of curvature increased to
220m, the maximum deflection increases by almost 12.5%. Also for the radius
of curvature is increased from 220m to 306m, the maximum deflection is
increases by 11.11%.
The mid span vertical displacement along the width of box girder showed that
the deflection on the right side of girder is more than left side of girder (centre
of curvature is on right).
Under IRC Class A loading, it shows that; when the radius of curvature
increased from 205m to 210m, the maximum mid span deflection along the
span is decreased by 7.7%. As the radius of curvature is increased to 220m, the
maximum deflection is decreased by almost 16.67%. Also, when the radius of
curvature is increased from 220m to 306m, the maximum deflection is found
to be decreased by 75%, which behaves more like a straight bridge.
As the span to radius of curvature increases the value of α (for all cases)
increases. The range of α is in between 1 to 6 except for the torsion. This
means that the forces or deflections in the curved bridge can be obtained by
multiplying the straight bridge with the corresponding values of α.
Under dead load; it is recorded that, there is a 33% decrease in maximum
torsion is observed when the radius of curvature is increased from 205m to
210m, 210m to 220m and 220m to 306m.
50
Under IRC class A loading; it shows that as radius of curvature is increased
from 205m to 210m, the maximum torsion in the cross section decreased by
20.5%. An increase in maximum torsion of 7% is observed for in the increase
in radius from 210m to 220m. When the radius of curvature increased from
220m to 306m, the maximum torsion is decreased by 16%.
For relation of torsional moment to the L/R ratio, it showed that with decrease
in span to radius of curvature, the dimensionless value α for maximum torsion
is increasing.
Under dead load, the bending moment decreases by almost 29% as the radius
of curvature decreases from 205m to 210m, 210m to 220m, and 220m to
306m.
Under IRC Class A loading, the bending moment decreases by almost 18.75%
as the radius of curvature decreases from 205m to 210m, 210m to 220m, and
220m to 306m
As the curvature increases the bending moment values also increases.
Under IRC class A loading, for bottom face of left overhang part of girder, the
longitudinal stress is increased by 12% as the radius of curvature is increased
from 205m to 210m and it is increased by 17.5% as radius of curvature is
increased from 210m to 220m radius of curvature, 5.2% when the radius of
curvature is increased from 220m to 306m. For top face, the longitudinal stress
for all the curved models increases about 6% from straight model
Under IRC class A loading, the longitudinal stress increase of 12%, 25% and
1% are observed between the models 205R to 210R, 210R to 220R and 220R
to 306R for the bottom face of central cross section. For top face the
51
longitudinal stress for all the curved models increases fairly 6% from straight
model.
Under IRC class A loading, for bottom face of right overhang part of girder,
the longitudinal stress is increased 16% from 205R to 210R and it is decreased
by 28% both from 210R to 220R and 210R to 306R. For top face, longitudinal
stress increases by 2% from 205R to 210R and by 33% from 210R to 220R
and also from 210R to 306R.
The fundamental mode is same for all the five models of bridges; as the mass
and stiffness remains almost the same.
52
REFERENCES
1. AASHTO (1994).AASHTO LRFD "Bridge Design Specifications"
Washington, D.C.
2. AASHTO (2004) AASHTO LRFD "Bridge Design Specification" 2nd Edition
with Interims, American Association of State Highway and Transportation
Officials Washington D.C.
3. Bhaskar Sengar (2005) "Load Distribution Factors for Composite Multi-Cell
Box-Girder Bridges" Master in Engineering. Delhi College of Engineering.
4. Cagri Ozgur (2007) "Behaviour and Analysis of a Horizontally Curved and
Skewed I-girder bridge" for MSc, School of Civil and Environmental Engineering
5. Chu, K. J, and Pinjarkar, S. G. (1971) "Analysis of Horizontally Curved Box-
Girder Bridges" Journal of the Structural Division ASCE 97(10), 2481–2501
6. D. Linzell, D. Hall, and D. White (2004) "Historical Perspective on
Horizontally Curved I Girder Bridge Design" Journal Bridge Engineering 9
(3), 218-229.
7. Dabrowski, R. (1968). "Curved thin-walled girders, theory and analysis"
Springer, New York.
8. Dezi, L. (1985). ‘‘Aspects of the deformation of the cross-section in curved
singlecell box beams.’’ Industria Italiana Del Cemento, 55(7–8), 500–808 (in
Italian).
9. Heins, C.P. and Oleinik, J.C. 1976 "Curved Box Beam Bridge Analysis"
Computers and Structures, Vol.(6), Pergamon Press 1976:65-73.
53
10. IRC: 6-2000, Standard Specifications and Code of Practice for Road Bridges,
Section II, Loads and Stresses, The Indian Roads Congress, 2000.
11. James S. Davidson, Ramy S. Abdalla and Mahendra Madhavan (2004).
"Stability of Curved Bridges During Construction" University of
Transportation Centre for Alabama.
12. Liu Fangping (2012) "The Deformation Analysis of the Curved Box Girder
Bridges under Different Radius" School of Civil Engineering & Architecture,
Chongqing Jiao tong University.
13. M. A. Memberg, J. A. Yura, K. H. Frank, and E. B. Williamson (2002). "A
Design Procedure for Intermediate External Diaphragms on Curved Steel
Trapezoidal Box Girder Bridges" University of Texas at Austin. Centre for
Transportation Research, United States.
14. Maisel, B. I. (1982). "Analysis of concrete box beams sing small-computer
capacity" Cement and Concrete Association.
15. Mark Rossow, PhD, PE, "Retired Bridge Mechanics (BIRM)" CED
Engineering.
16. Martin Alenius (2003) "Finite Element Modelling of Composite Bridge
Stability" MSc. Thesis , Department of Mechanics., Royale Institute of
Technology.
17. Nakai, H., and Murayama, Y. (1981). ‘‘Distortional stress analysis and design
aid of horizontally curved box girder bridges with diaphragms.’’ Proc., Jpn.
Soc. Civ.Eng., 309, 25–39 (in Japanese).
18. Nikolaos Pnevmatikos and Vassilis Sentzas (2012) "Preliminary Estimation of
Torsion of Curved Bridges Subjected to Earthquake Loading" Journal of Civil
Engineering and Architecture, Volume 6, No. 11.
54
19. P.K. Gupta, K K Singh and A. Mishra, (2010) "Parametric study on behaviour
of box-girder bridges using finite element method" Asian journal of civil
engineering (building and housing) vol. 11,Pages-135-148.
20. Saint-Venant, B. (1843). ‘‘Memoire sur le calcul de la resistance et de la
flexiondes peices solides a simple ou a double courbure, en prenant
simultanement enconsideration les divers efforts auxquels elles peuvent entre
soumises dans touts lessens.’’ Compts-Rendus, 27.
21. Samih Qaqish (2012)"Finite Element Analysis of Two Continuous Skew
Spans Of Box Girder Bridge And The Reaction Distribution At The Edges
With 49 Degrees Skew Angle." Orlando International Academic Conference.
22. SAP2000, Integrated Software for Structural Analysis and Design
23. Siddiqui, A.H. and Ng, S.F. 1988 "Effect of Diaphragms on Stress Reduction
in Box Girder Bridge Sections" Canadian Journal of Civil Engineering,
15.,127-135.
24. Structural modeling and analysis (2012), LRFD; Bridge Design Practice.
25. Todd Helwing et.al.,(2007) "Design Guidelines for Steel Trapezoidal Box
Girder System." University of Texas at Austin. Centre for Transportation
Research, United States.
26. Trukstra, C. J., and Fam, A. R. (1978). ‘‘Behaviour study of curved box
bridges.’’J. Struct. Div., 104(ST3), 453–462.
27. Vlasov, V. Z. (1965). ‘‘Thin-walled elastic beams.’’ OTS61-11400, National
Science Foundation, Washington, D. C.
28. Yaping Wu.( 2003) "Matrix analysis of shear lag and shear deformation in
thin-walled box beams" Journal of Engineering Mechanics ASCE, , 129, 944-
950.

55
29. Zakia Begum, (2010) "Analysis and behaviour investigations of box girder
bridges." MSc. Graduate School of Maryland.
Recommended


