25 January 2005 Lecture 1 Part 2Dirmeyer
CLIM 714Land-Climate Interactions
Introduction toLand-Climate Interactions
Part 2
Paul DirmeyerCenter for Ocean-Land-Atmosphere
Studies

25 January 2005 Lecture 1 Part 2Dirmeyer
CLIM 714Land-Climate Interactions
Climate is different than weather
Weather• Time scale
Hours-Days (less than 2 weeks)
• Spatial scale Local-Regional
• Main Components Atmosphere (ocean and
land beyond a few days)
• Prediction Deterministic (evolution
and movement of specific events over time) Initial Value Problem
Climate• Time scale
Months-Years-Beyond (more than 2 weeks)
• Spatial scale Local-Regional-Global
• Main Components Atmosphere, Ocean,
Land… Humans
• Prediction Probabilistic (deviation
from averages, categorical) Boundary Value ProblemClimate is weather
averaged over time

25 January 2005 Lecture 1 Part 2Dirmeyer
CLIM 714Land-Climate Interactions
Orbital parameters/Extraterrestrial Impacts
Geology/Volcanology
Human Impacts (LUCC/Industry)
Biochemistry/Biology
Aerosols/Chemistry
Ocean
What is the “Climate System”?
• Internal versus external
Land
Atmosphere

25 January 2005 Lecture 1 Part 2Dirmeyer
CLIM 714Land-Climate Interactions
Ocean versus Land
Water• Flows (x,y: 1y; z: 102y)• High heat capacity (4.2×10⁶ J m-3 K-1)• Moderate heat conductivity (0.6 J m-1K-1s-1)• Dark (α=0.05)• Evaporation at potential rate
Dry Soil• Stationary (essentially)• Low heat capacity (0.6-1.3×10⁶ J m-3 K-1)• Low heat conductivity (0.08-0.2 J m-1K-1s-1)• Light (α=0.13-0.50)• No evaporation
Wet Soil• Water flows (x,y: 0-30d; z: 0-104y)• Moderate heat capacity (2.2-2.9×10⁶ J m-3K-1)• High heat conductivity (0.8-1.7 J m-1K-1s-1)• Not as light (α=0.1-0.4)• Evaporation is a function of soil moisture
Vegetation• Varies with time (species, density, color, coverage)• Canopy creates microenvironment for radiation, heat exchange, interception of rain and snow• Generally Dark (α=0.08-0.25)• Transpiration controlled by photosynthesis, moisture stress

25 January 2005 Lecture 1 Part 2Dirmeyer
CLIM 714Land-Climate Interactions
• Simple Version
VqEP
Fluxes at the land surface
Vertically through the atmosphere
Air near the surface
State of the land surface
EvapSensible HeatRadiation
Solar rad.Precip.TemperatureWinds
Soil waterVegetationSnow
HumidityTemperatureWinds Vq
AlbedoRoughness
Soil WetnessLocal circulation
Large-scale dynamics
20-30% 70-80%
Land-Climate Interaction

25 January 2005 Lecture 1 Part 2Dirmeyer
CLIM 714Land-Climate Interactions
It’s all in the fluxes
• Momentum Orographic drag, surface roughness, turbulence
• Radiation Solar radiation absorbed, reflected (albedo); longwave
radiation
• Heat Sensible heat (conduction), Latent heat (evaporation), Heat
storage
• Moisture Precipitation, evaporation, transpiration
• Aerosols• Trace Gases
Basic notions of the land’s effects on climate (mean, diurnal cycle, seasonal cycle)
These fluxes are the means of communication between land and atmosphere

25 January 2005 Lecture 1 Part 2Dirmeyer
CLIM 714Land-Climate Interactions
Impact of High Terrain
• Himalayas affect the entire depth of the troposphere Temperatures at 500mb (about
halfway up through the atmosphere) are considerably warmer because of the presence of the mountain range.
This “elevated heat source” is the main engine driving the Asian monsoon.
Impacts are even seen in the opposite hemisphere.

25 January 2005 Lecture 1 Part 2Dirmeyer
CLIM 714Land-Climate Interactions
General Circulation in Low Latitudes
• Hadley Circulation Meridional (north-south) Rising air, convection, rainfall
in deep tropics. Subsidence, clear and dry in
subtropics.
• Walker Circulation Zonal (east-west) Rising air, convection, rainfall
over heat sources (continents, islands, warm SST)
Subsidence over cooler oceans.

25 January 2005 Lecture 1 Part 2Dirmeyer
CLIM 714Land-Climate Interactions
Land determines the location of precipitation
1. Tropical convection clusters at 60W (Amazon), 30E (Africa), and 120E (Indonesia)
2. Mid-latitude storm tracks form on the eastern margins of continents.
3. Deserts form in the subtropics on the western sides of continents.
4. Mid-latitude rain forests form where oceanic westerlies hit the coast.
1. Tropical convection clusters at 60W (Amazon), 30E (Africa), and 120E (Indonesia)
2. Mid-latitude storm tracks form on the eastern margins of continents.
3. Deserts form in the subtropics on the western sides of continents.
1. Tropical convection clusters at 60W (Amazon), 30E (Africa), and 120E (Indonesia)
2. Mid-latitude storm tracks form on the eastern margins of continents.
1. Tropical convection clusters at 60W (Amazon), 30E (Africa), and 120E (Indonesia).

25 January 2005 Lecture 1 Part 2Dirmeyer
CLIM 714Land-Climate Interactions
Monsoons
• Over land, monsoons characterized by rainy/dry seasons Summer wet / winter dry monsoons exist primarily in the
subtropical regions, but can extend into mid-latitudes. Winter monsoons (a.k.a. Mediterranean climates) exist in the
Northern Hemisphere (California, North Africa, Middle East)

25 January 2005 Lecture 1 Part 2Dirmeyer
CLIM 714Land-Climate Interactions
Precipitation and the Upper Troposphere
• Position of major convection regions and deserts determines the large-scale divergence patterns at 200mb.

25 January 2005 Lecture 1 Part 2Dirmeyer
CLIM 714Land-Climate Interactions
Climate Feedback
• Does the cycle between land and atmosphere lead to amplification or damping of climate anomalies?
• Climate attractors (potential) can be a useful way to visualize this
time
Negative feedback
Positive feedback
Neutral
Stable (negative feedback)
Unstable (positive feedback)

25 January 2005 Lecture 1 Part 2Dirmeyer
CLIM 714Land-Climate Interactions
Precipitation and Soil Moisture
• Lack of precipitation leads to dry soil (drought).
• Does dry soil lead to lack of precipitation?
• This is an example of positive feedback between land and atmosphere.

25 January 2005 Lecture 1 Part 2Dirmeyer
CLIM 714Land-Climate Interactions
Tropical land and teleconnections
• Heating of the atmosphere over the tropical convective areas can induce “wavetrains” that arc into the mid-latitudes. These wavetrains may provide a teleconnective link between changes to the land surface in the tropics, and climate in the mid-latitudes
Nigam (1988)

25 January 2005 Lecture 1 Part 2Dirmeyer
CLIM 714Land-Climate Interactions
Energy Balance Over Land
Storage
The sun is the ultimate source of
all energy
Energy which reaches the
ground and is not reflected is
absorbed
Absorbed energy raises the surface
temperature; heat radiated
from the surface
increases
If there is moisture available, most of the
remaining energy will go towards evaporating it.
Water has a high heat, capacity, so retards warming. Dry soil will warm quickly, increasing sensible heat flux.
σTa4
σTs4
Ta
Ts
Shortwave Longwave Evapotranspiration SensibleHeat

25 January 2005 Lecture 1 Part 2Dirmeyer
CLIM 714Land-Climate Interactions
Only about 45% of the Sun’s energy is visible
Plants mostly make use of visible
light for photo-
synthesis

25 January 2005 Lecture 1 Part 2Dirmeyer
CLIM 714Land-Climate Interactions
The rest is in infrared (43%) and UV (12%)
The ozone layer
blocks most of the UV
from reachin
g the surface
25 January 2005 Lecture 1 Part 2Dirmeyer
CLIM 714Land-Climate Interactions
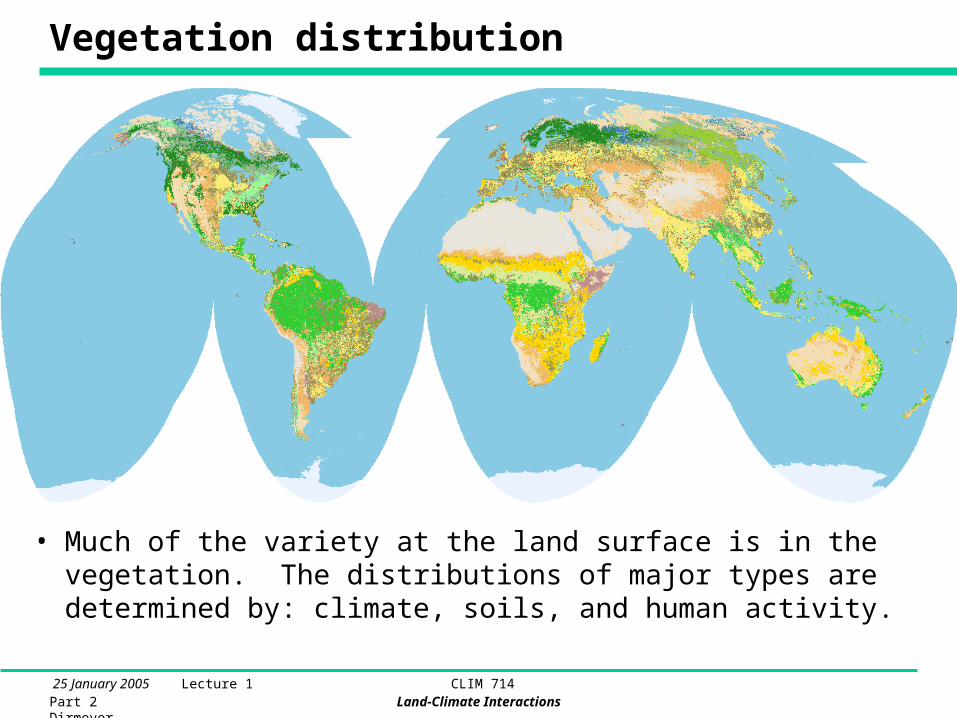
Vegetation distribution
• Much of the variety at the land surface is in the vegetation. The distributions of major types are determined by: climate, soils, and human activity.

25 January 2005 Lecture 1 Part 2Dirmeyer
CLIM 714Land-Climate Interactions
Land Surface Time Scales
• L(t) Time-varying land surface quantity
• A Mean annual cycle (climatology)
• A’ Perturbation on mean annual cycle (climate anomaly)
• D Mean diurnal cycle
• D’ Perturbation on mean diurnal cycle (synoptic variations; weather)
Relevant to seasonal-interannual studies
L(t) = A + A’ + D + D’

25 January 2005 Lecture 1 Part 2Dirmeyer
CLIM 714Land-Climate Interactions
Land Surface Time Scales
• L(t) Time-varying land surface quantity
• T Trend (climate change)
• A Mean annual cycle (climatology)
• A’ Perturbation on mean annual cycle (climate anomaly)
• D Mean diurnal cycle
• D’ Perturbation on mean diurnal cycle (synoptic variations; weather)
Relevant to decadal-centennial studies
L(t) = T + A + A’ + D + D’

25 January 2005 Lecture 1 Part 2Dirmeyer
CLIM 714Land-Climate Interactions
Continental vs. Maritime Climate
• Atlanta shows a large annual temperature cycle (>25C). Land has small heat capacity, and Atlanta is inland.

25 January 2005 Lecture 1 Part 2Dirmeyer
CLIM 714Land-Climate Interactions
Continental vs. Maritime Climate
• San Diego has a small annual cycle (10C), as its climate is strongly influenced by SST from the adjacent ocean.

25 January 2005 Lecture 1 Part 2Dirmeyer
CLIM 714Land-Climate Interactions
So isn’t this simple then?
• Reality is but one “realization.” We cannot do controlled sensitivity studies with the “real world” to understand it better.
• So we construct and use models. But models are imperfect Assumptions Simplifications Parameterizations Errors
• The climate system is non-linear Utterly sensitive to initial conditions Instabilities exist that make prediction difficult
• The system is not closed (as we simulate it)
Understanding land-climate interaction is not a “piece of cake”.

25 January 2005 Lecture 1 Part 2Dirmeyer
CLIM 714Land-Climate Interactions
Class Notes on the Web
• www.iges.org/lci/ (Land-Climate Interactions)• Syllabus• Status of assignments• PowerPoint files of lectures • References and pointers to supplementary
material on the web.
Paul [email protected]
Randy [email protected] 301-614-5781

25 January 2005 Lecture 1 Part 2Dirmeyer
CLIM 714Land-Climate Interactions
References
• Gibson, R. K., P. Kallberg, S. Uppala, A. hernandez, A. Nomura, and E. Serrano, 1997: ECMWF Re-analysis (ERA) Description. ERA Technical Report No. 1, ECMWF, Reading, UK.
• Hahn, D. G., and S. Manabe, 1975: The role of mountains in the South Asian monsoon circulation. J. Atmos. Sci., 32, 1515-1541.
• Nigam, S., I. M. Held, and S. W. Lyons, 1988: Linear simulation of stationary eddies in a general circulation model. Part II: The mountain model. J. Atmos. Sci., 45, 1433-1452.
• Xie, P., and P. A. Arkin, 1997: Global precipitation: A 17-year monthly analysis based on gauge observations, satellite estimates, and numerical model outputs. Bull. Amer. Meteor. Soc., 78, 2539-2558.
Recommended