1
Chapter One
AN INTRODUCTION TO THE PETROLEUM INDUSTRY
"As I began my business life as a bookkeeper, I learned to have great respect for figures and facts, no matter how small they were."
John D. Rockefeller, petroleum tycoon and the richest man of his time who gave away over $500 million to charity. Born 1839. Died 1937.
BASIC TERMS AND CONCEPTS
Petroleum refers to crude oil and natural gas or simply oil and gas. These are mixtures of hydrocarbons which are molecules, in various shapes and sizes, of hydrogen and carbon atoms found in the small, connected pore spaces of some underground rock formations. These petroleum reservoirs are generally thousands of feet below the surface. Crude oil and natural gas are believed to be the remains of plants and animals, mostly small marine life, that lived many millions of years ago.
Oil and gas are discovered and produced through wells drilled down to the reservoirs. An exploratory well is one drilled to discover or delineate petroleum reservoirs. A development well is one drilled to produce a portion of previously discovered oil and gas. A large producing reservoir may have one or more producing exploratory wells and several producing development wells.
Estimated volumes of recoverable oil and gas within the petroleum reservoir are called oil and gas reserves. Reserves are classified as proved, probable, or possible, depending on the likelihood that the estimated volumes can be economically produced.
From petroleum we get numerous useful products:
♦ Transportation fuels, such as gasoline, diesel fuel, jet fuel, compressed natural gas (or CNG) and propane;
♦ Heating fuels, such as propane, liquefied petroleum gas, heating oil, and natural gas burned to heat buildings;
Chapter 1 ~ An Introduction to the Petroleum Industry
2
♦ Sources of electricity, such as natural gas and residual fuel oil burned to generate 14 percent of U.S. electricity (with coal, nuclear energy, and renewable sources generating the rest); and
♦ Petrochemicals from which plastics as well as some clothing, building materials, and other diverse products are made.
Different mixtures of hydrocarbons have different uses and different
economic values. It is necessary to recognize some basic types of hydrocarbon mixtures to understand portions of this book. Crude oil refers to hydrocarbon mixtures produced from underground reservoirs that are liquid at normal atmospheric pressure and temperature. Natural gas refers to hydrocarbon mixtures that are not liquid, but gaseous, at normal atmospheric pressure and temperature.
The gas mixtures consist largely of methane (the smallest natural hydrocarbon molecule consisting of one carbon atom and four hydrogen atoms). Natural gas usually contains some of the next smallest hydrocarbon molecules commonly found in nature:
Ethane (two carbon, six hydrogen atoms, abbreviated C2H6), Propane (C5H8), Butane (C4 H10), and Natural gasolines (C5H12 to C10H22). These four types of hydrocarbons are collectively called natural gas
liquids (abbreviated NGL1) which are valuable feedstock for the petrochemical industry. When removed from the natural gas mixture, these larger, heavier molecules become liquid under various combinations of increased pressure and lower temperature. Liquefied petroleum gas (abbreviated LPG) usually refers to an NGL mix of primarily propane and butane typically stored in a liquid state under pressure. LPG (alias bottled gas) is the fuel in those pressurized tanks used in portable "gas" barbeque grills. Sometimes the term LPG is used loosely to refer to NGL or propane.
In the United States natural gas is measured in two ways, both important in petroleum accounting: ________________________________________________________________________ 1The term natural gas liquids is sometimes abbreviated in other publications as NGLs or NGL's. The lighter NGLs (ethane, propane and butane) are gases at normal atmospheric pressure and temperature and are not crude oil. Natural gasolines are liquid at normal atmospheric pressure and temperature and may be called crude oil. Chapter Twenty-Eight explains how reserve disclosures may classify insignificant NGL reserves as crude oil reserves.
Chapter 1 ~ An Introduction to the Petroleum Industry
3
♦ by the amount of energy or heating potential when burned, generally expressed in million British thermal units (abbreviated mmBtu) and
♦ by volume, generally expressed in - thousand cubic feet (abbreviated as mcf), - million cubic feet (abbreviated as mmcf), - billion cubic feet (abbreviated as bcf), or - trillion cubic feet (abbreviated as tcf). In many other parts of the world, gas volumes are measured in cubic
meters (kiloliters) and energy is measured in gigajoules. A kiloliter (or cubic meter) approximates 1.31 cubic yards and 35.3 cubic feet. A gigajoule (or a billion joules) approximates 0.95 mmBtu.
Gas volumes are necessarily measured at a standard pressure and temperature, typically at an atmospheric pressure base of 14.65 to 15.025 pounds per square inch absolute (or psia) and a temperature of 60 degrees Fahrenheit.2
The ratio of mmBtu (energy) to mcf (volume) varies from approximately 1:1 to 1.3:1. The more natural gas liquids in the gas mixture, the higher the ratio, the greater the energy, and the "richer" or "wetter" the gas.
For various economic reasons, wet gas is commonly sent by pipeline to a gas processing plant for removal of substantially all natural gas liquids. The NGL are sold. The remaining gas mixture, called residue gas or dry gas, is over 90 percent methane and is the natural gas burned for home heating, gas fireplaces, and many other uses.
As wet gas is produced to the surface and sent through a mechanical separator near the well, some natural gasolines within the gas condense into a liquid classified as a light crude oil and called condensate. Crude oil is measured in the U.S. by volume expressed as barrels (abbreviated as bbl).3 A barrel equates to 42 U.S. gallons. In some other parts of the world, crude oil is measured by weight, such as metric tons, or by volume
________________________________________________________________________ 2The typical atmospheric pressure base is 14.65 psia for Texas and Oklahoma production, 15.025 psia for Louisiana production, and 14.73 psia in many other instances. Canadian gas is predominantly from Alberta, which uses the standard international metric system pressure base equivalent to 14.696 psia at 59 degrees Fahrenheit. 3Reportedly, the abbreviation bbl arose in the late 1800s when Standard Oil dominated the U.S. petroleum industry and transported crude oil in standardized barrels painted blue. The term blue barrels was abbreviated bbl. Source: Oil & Gas Journal, August 14, 1995, page 24.
Chapter 1 ~ An Introduction to the Petroleum Industry
4
expressed in kiloliters (equivalent to 6.29 barrels). A metric ton of crude oil approximates 7.33 barrels of crude oil, but the ratio varies since some crude oil mixtures are heavier per barrel than others.
Volumes of crude oil and natural gas combined are often expressed in barrels of oil equivalent (abbreviated boe) whereby gas volumes in mcf are converted to barrels on the basis of energy content or sales value. In general, approximately 5.6 mcf of dry gas have the same 5.8 mmBtu energy content as one average U.S. barrel of oil. However, one mcf of gas might be selling for $1.50 when oil is selling for $15 per barrel whereby ten mcf equate to one barrel of oil, based on the given sales prices. For one million boe of gas, the corresponding mcf are shown below for the aforementioned conversion ratios.
Conversion
Basis Assumed
Ratio
boe
mcf Energy 5.6 to 1 1,000,000 5,600,000 Value 10 to 1 1,000,000 10,000,000
Note that many companies use an energy conversion ratio of 6 mcf per barrel, which is the required ratio for certain income tax rules in Internal Revenue Code Section 613A(c)(4).
Crude oil can be many different mixtures of liquid hydrocarbons. Crude oil is classified as light or heavy, depending on the density of the mixture. Density is measured in API gravity as explained in Chapter Eleven. Heavy crude oil has more of the longer, larger hydrocarbon molecules and, thus, has greater density than light crude oil. Heavy crude oil may be so dense and thick that it is difficult to produce and transport to market. Heavy crude oil is also more expensive to process into valuable products such as gasoline. Consequently, heavy crude oils sell for much less per barrel than light crude oils but weigh more per barrel.
Both natural gas and crude oil may contain contaminants, such as sulphur compounds and carbon dioxide (CO2), that must be substantially removed before marketing the oil and gas. The contaminant hydrogen sulfide (H2S) is poisonous and, when dissolved in water, corrosive to metals. Natural gas and crude oil high in sulfur compounds are called sour gas and sour crude oil as opposed to sweet crude oil or intermediate (between sour and sweet). Some crude oils contain small amounts of metals that require special equipment for refining the crude.
The petroleum industry, commonly referred to as the oil and gas industry, has four major segments:
Chapter 1 ~ An Introduction to the Petroleum Industry
5
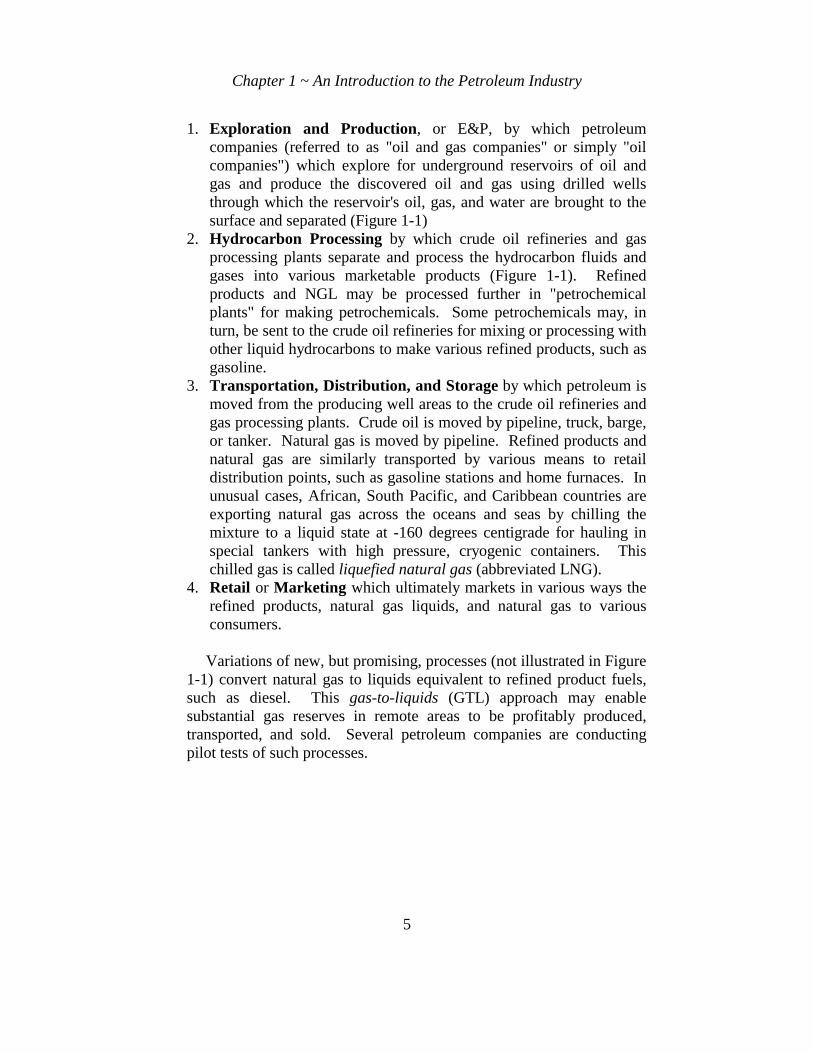
1. Exploration and Production, or E&P, by which petroleum companies (referred to as "oil and gas companies" or simply "oil companies") which explore for underground reservoirs of oil and gas and produce the discovered oil and gas using drilled wells through which the reservoir's oil, gas, and water are brought to the surface and separated (Figure 1-1)
2. Hydrocarbon Processing by which crude oil refineries and gas processing plants separate and process the hydrocarbon fluids and gases into various marketable products (Figure 1-1). Refined products and NGL may be processed further in "petrochemical plants" for making petrochemicals. Some petrochemicals may, in turn, be sent to the crude oil refineries for mixing or processing with other liquid hydrocarbons to make various refined products, such as gasoline.
3. Transportation, Distribution, and Storage by which petroleum is moved from the producing well areas to the crude oil refineries and gas processing plants. Crude oil is moved by pipeline, truck, barge, or tanker. Natural gas is moved by pipeline. Refined products and natural gas are similarly transported by various means to retail distribution points, such as gasoline stations and home furnaces. In unusual cases, African, South Pacific, and Caribbean countries are exporting natural gas across the oceans and seas by chilling the mixture to a liquid state at -160 degrees centigrade for hauling in special tankers with high pressure, cryogenic containers. This chilled gas is called liquefied natural gas (abbreviated LNG).
4. Retail or Marketing which ultimately markets in various ways the refined products, natural gas liquids, and natural gas to various consumers.
Variations of new, but promising, processes (not illustrated in Figure
1-1) convert natural gas to liquids equivalent to refined product fuels, such as diesel. This gas-to-liquids (GTL) approach may enable substantial gas reserves in remote areas to be profitably produced, transported, and sold. Several petroleum companies are conducting pilot tests of such processes.
Chapter 1 ~ An Introduction to the Petroleum Industry
6
Figure 1-1: Petroleum Production and Processing Schematic
The E&P segment is sometimes called upstream operations, and the
other three segments are downstream operations. Companies having both upstream and downstream operations are vertically integrated in the petroleum industry and, hence, are called Integrated. Other companies involved in upstream only are referred to as Independents. The several largest integrated petroleum companies are called Majors.
In this book, petroleum accounting focuses on United States generally accepted accounting principles (GAAP) for financial reporting of the exploration and production of petroleum. Chapter Twenty-Five introduces accounting for international operations. Chapters Twenty-Six and Twenty-Seven touch upon accounting for income tax reporting of petroleum exploration and production.
AN OVERVIEW OF PETROLEUM EXPLORATION AND PRODUCTION
Preliminary Exploration. Before an oil company drills for oil, it first
evaluates where oil and gas reservoirs might be economically discovered and developed (as explained more fully in Chapter Five).
Leasing the Rights to Find and Produce. When suitable prospects are identified, the oil company determines who (usually a government in international areas) owns rights to any oil and gas in the prospective areas. In the United States, whoever owns "land" usually owns both the surface
Chapter 1 ~ An Introduction to the Petroleum Industry
7
rights and mineral rights to the land. U.S. landowners may be individuals, corporations, partnerships, trusts, and, of course, governments. A landowner may sell the surface rights and then separately sell (or pass on to heirs) the mineral rights. Whoever owns, (i.e., has title to), the mineral rights negotiates a lease with the oil company for the rights to explore, develop, and produce the oil and gas.
The lease requires the lessee (the oil company), and not the lessor, to pay all exploration, development, and production costs and gives the oil company ownership in a negotiated percentage (often 75 percent to 90 percent) of production. The lessor owns the remaining portion of production. Leasing is explained further in Chapter Seven.
The oil company may choose to form a joint venture with other oil and gas companies to co-own the lease and jointly explore and develop the property as explained in Chapter Ten.
Exploring the Leased Property. To find underground petroleum reservoirs requires drilling exploratory wells (as discussed in Chapter Eight). Exploration is risky; two-thirds of U.S. exploration wells for 1998 were abandoned as dry holes, i.e., not commercially productive.4 Wildcat wells are exploratory wells drilled far from producing fields on structures with no prior production. Consequently, 80 to 90 percent of these wells are dry holes. Several dry holes might be drilled on a large lease before an economically producible reservoir is found.
To drill a well, a U.S. oil company typically subcontracts much of the work to a drilling company that owns and operates rigs for drilling wells.
Evaluating and Completing a Well. After a well is drilled to its targeted depth, sophisticated measuring tools are lowered into the hole to help determine the nature, depth, and productive potential of the rock formations encountered. If these recorded measurements, known as well logs, along with recovered rock pieces, i.e., cuttings and core samples, indicate the presence of sufficient oil and gas reserves, then the oil company will elect to spend substantial sums to "complete" the well for safely producing the oil and gas.
Developing the Property. After the reservoir (or field of reservoirs) is found, additional wells may be drilled and surface equipment installed (as explained in Chapters Eight and Eleven) to enable the field to be efficiently and economically produced.
Producing the Property. Oil and gas are produced, separated at the surface, and sold as explained further in Chapters Eleven and Twelve. Any accompanying water production is usually pumped back into the ________________________________________________________________________ 4 American Petroleum Institute’s Joint Association Survey on 1998 Drilling Costs, p. 21.
Chapter 1 ~ An Introduction to the Petroleum Industry
8
reservoir or another nearby underground rock formation (Figure 1-1). Production life varies widely by reservoir. Some U.S. oil and gas reservoirs have produced over 50 years, some for only a few years, and some for only a few days. The rate of production typically declines with time because of the reduction in reservoir pressure from reducing the volume of fluids and gas in the reservoir. Production costs are largely fixed costs independent of the production rate. Eventually, a well's production rate declines to a level at which revenues will no longer cover production costs. Petroleum engineers refer to that level or time as the well's economic limit.
Plugging and Abandoning the Financial Property. When a well reaches its economic limit, the well is plugged, i.e., the hole is sealed off at and below the surface, and the surface equipment is removed. Some well and surface equipment can be salvaged for use elsewhere. Plugging and abandonment costs, or P&A costs, are commonly referred to as dismantlement, restoration, and abandonment costs or DR&A costs.
Equipment salvage values may offset the plugging and abandonment costs of onshore wells so that net DR&A costs are zero. However, for some offshore wells, estimated future net DR&A costs may exceed $1 million per well due to the cost of removing offshore platforms, equipment, and perhaps pipelines.
When a leased property is no longer productive, the lease expires and the oil company plugs the wells and abandons the property. All rights to exploit the minerals revert back to the lessor as the mineral rights owner.
ACCOUNTING DILEMMAS
The nature of petroleum exploration and production raises numerous accounting problems. Here are a few:
♦ Should the cost of preliminary exploration be recorded as an asset or an expense when no right or lease might be obtained?
♦ Given the low success rates for exploratory wells should the well costs be treated as assets or as expenses? Should the cost of a dry hole be capitalized as a cost of finding oil and gas reserves? Suppose a company drills five exploratory wells costing $1 million each, but only one well finds a reservoir and that reservoir is worth $20 million to the company. Should the company recognize an asset for the total $5 million of cost, the $1 million cost of the successful well, the $20 million value of the productive property, or some other amount?

Chapter 1 ~ An Introduction to the Petroleum Industry
9
♦ The sales prices of oil and gas can fluctuate widely over time. Hence, the value of rights to produce oil and gas may fluctuate widely. Should such value fluctuations affect the amount of the related assets presented in financial statements?
♦ If production declines over time and productive life varies by property, how should capitalized costs be amortized and depreciated?
♦ Should DR&A costs be recognized when incurred, or should an estimate of future DR&A costs be amortized over the well's estimated productive life?
♦ If the oil company forms a joint venture and sells portions of the lease to its venture partners, should gain or loss be recognized on the sale?
As will be explained in this book, the nature, complexity, and importance of the petroleum E&P industry have caused the creation of an unusual and complex set of rules and practices for petroleum accounting and financial presentation.
HISTORY OF THE PETROLEUM INDUSTRY IN THE UNITED STATES
In order to understand the importance and nature of financial
accounting and reporting in the petroleum industry, it is helpful to briefly review the industry's history, particularly in the United States over the past twenty years.5 Several exhibits will be presented to show how the industry's economic characteristics have changed over the years and to portray the industry's current economic status.
In ancient history, pitch (a heavy, viscous petroleum) was used for ancient Egyptian chariot axle grease. Early Chinese history reports the first use of natural gas that seeped from the ground; a simple pipeline made of hollowed bamboo poles transported the gas a short distance where it fueled a fire used to boil water.
Seventeenth century missionaries to America reported a black flammable fluid floating in creeks. From these creeks, Indians and colonists skimmed the crude oil, then called rock oil, for medicinal and other purposes. Later, the term rock oil would be replaced by the term petroleum from petra (a Latin word for rock) and oleum (a Latin word for ________________________________________________________________________ 5More extensive discussions of global and U.S. petroleum history are found in Daniel Yergin, The Prize (New York: Simon & Schuster, 1991), Harold F. Williams and Arnold R. Arum, The American Petroleum Industry (Evanston: Northwestern University Press, 1959), and Stanley Clark, The Oil Century (Norman: The University of Oklahoma Press, 1958).
Chapter 1 ~ An Introduction to the Petroleum Industry
10
oil). Eventually, the term petroleum came to refer to both crude oil and natural gas.
By the early 1800s, whale oil was widely used as lamp fuel, but the dwindling supply was uncertain, and people began using alternative illuminating oils called kerosene or coal oil extracted from mined coal, mined asphalt, and crude oil obtained from surface oil seepages. At the same time, U.S. settlers were drilling wells to produce salt brine for salt production and occasionally encountered crude oil mixed with the produced brine. In 1856, George Bissell, an investor in the Pennsylvania Rock Oil Company, surmised that similar wells could be drilled to find and economically produce crude oil from which valuable kerosene could be extracted.
The petroleum exploration and production industry may be said to have begun in 1859. While there is mention of an oil discovery in Ontario, Canada, in 1858, it is generally recognized that Bissell's company had the first commercial oil drilling venture in 1859 near Titusville, Pennsylvania.
Colonel Edwin L. Drake, a retired railroad conductor, supervised the drilling activity on behalf of the Pennsylvania Rock Oil Company. A steam-powered, cable-tool rig with a wooden derrick was used to drill the 69-foot well, which produced approximately five barrels of crude oil per day.
Soon after the Drake well began oil production, other wells were drilled in the Titusville area using cable-tool rigs, and the supply of oil increased dramatically, causing a decline in the price of crude oil from $10 per barrel in January 1860 to about ten cents a barrel two years later. Shortly thereafter, a number of refineries began distilling valuable kerosene from crude oil, including facilities that had previously extracted kerosene from other sources.
THE INDUSTRIAL REVOLUTION AND THE GROWTH OF "BIG OIL"
At the start of the U.S. Civil War, approximately 200 wells were producing over one-half million barrels annually. The introduction of petroleum-based lamp fuel was only the beginning of an increasing variety of uses for crude oil and its refined products. For example, the Industrial Revolution and the Civil War created a demand for lubricants as a replacement for turpentine. By the year 1870, annual total production of petroleum exceeded 25 million barrels.
Transportation of crude oil was a problem faced from the earliest days of oil production. The coopers’ union constructed wooden barrels (with a capacity of 42 to 50 gallons) that were filled with oil and hauled by
Chapter 1 ~ An Introduction to the Petroleum Industry
11
teamsters on horse-drawn wagons to railroad spurs or river barge docks. At the railroad spurs, the oil was emptied into large wooden tanks that were placed on flatbed railroad cars. The quantity of oil that could be moved by this method was limited. However, the industry's attempts to construct pipelines were delayed by the unions whose members would face unemployment and by railroad and shipping companies who would suffer from the loss of business by the change in method of transportation. Nevertheless, pipelines did come into existence in the 1860s; the first line was made of wood and was less than a thousand feet long.
Growth in the physical production of petroleum corresponded with growth in the size and investment of corporations engaged in producing and refining petroleum. One of the companies involved in the petroleum industry was partially owned by John D. Rockefeller; in 1865 he acquired the entire interest in the company. In 1870 Rockefeller merged his firm with four other companies to form the Standard Oil Company. His original goal was to become paramount in the refining, transporting, and marketing of petroleum; but shortly after the merger, he also moved into the area of oil production.6
Rockefeller's plan for dominance succeeded, and during the 1880s Standard controlled approximately 90 percent of the refining industry in the country and dominated the global petroleum industry. Standard's control of refineries as well as its ownership of railroads, pipelines, and marketing outlets forced most petroleum customers in the United States to purchase their products from the company.7 Standard's dominance did not escape federal and state antitrust regulators. After the discovery of the prolific Spindletop field near Beaumont, Texas, in 1901, the Texas legislature passed laws preventing Standard's involvement in Spindletop. As a result, other companies were formed, and some evolved into vertically integrated companies, such as Texaco, organized in 1901. In addition to state antitrust laws, federal legislation had a great impact on Standard Oil Company and led to its break-up in 1911-1915 into several companies that today have a combined market value exceeding $200 billion. They include:
________________________________________________________________________ 6Albert Z. Carr. Rockefeller's Secret Weapon (New York: McGraw-Hill Book Co., Inc., 1962). 7J.G. McLean and R.W. Haigh, The Growth of Integrated Oil Companies (Boston: Harvard University Graduate School of Business Administration, 1954).
Chapter 1 ~ An Introduction to the Petroleum Industry
12
♦ Standard Oil of New Jersey (i.e., Exxon) and Standard Oil of New York (i.e., Mobil) that merged in 1999 to form ExxonMobil, the largest U.S. petroleum company and a world giant;
♦ Standard Oil of California (now Chevron, the second largest U.S. petroleum company);
♦ Standard Oil of Indiana (subsequently renamed Amoco) and Standard Oil of Ohio, both now a part of BP Amoco, following merger with or acquisition by British Petroleum to create a world giant rivaling ExxonMobil;
♦ Continental Oil (now Conoco, eighth largest U.S. oil company).8 After the breakup of the Standard Oil Company, Europe's Royal
Dutch/Shell Group succeeded Standard Oil as the world's largest oil company. The group was an unusual amalgamation that was owned 60 percent by the Netherlands’s Royal Dutch Company and 40 percent by England's Shell Transport and Trading Company. Royal Dutch had made its fortunes in oil production in the Dutch East Indies, now Indonesia. Shell had prospered in global oil trading and transportation before expanding into production and refining.
THE 1920s: THE AUTOMOBILE COMES OF AGE
With increased competition in the oil industry and an increased demand
for petroleum products (created by the growing number of automobiles), many small companies were formed and soon joined the few large companies in the search for and production of petroleum. New demands for petroleum were created in the 1920s; petroleum products were used to generate electricity, operate tractors, and power automobiles. The oil industry was able to increase production to meet the greater demand without a sharp rise in price.
The search by American companies for foreign oil began around 1920 and was encouraged by the United States government, which feared that a shortage of oil was developing domestically. By the middle of the 1920’s approximately 35 companies had invested upwards of $1 billion exploring for and developing reserves in the Middle East, South America, Africa, and the Far East. However, the discovery of the giant East Texas oil field in 1930 created a world surplus of oil, and companies slowed their operations in foreign countries. Some companies did continue to search
________________________________________________________________________ 8Rankings are per the Oil & Gas Journal, September 1999, on the basis of total assets.
Chapter 1 ~ An Introduction to the Petroleum Industry
13
for oil in the Middle East during the 1930s, and significant discoveries were made, especially in Saudi Arabia and Kuwait. THE DEPRESSION: STATE CONTROL OVER PRODUCTION
When the depression began in the 1930s, the oil industry entered a period of increased production with the discovery of the East Texas oil field by an independent wildcatter. This field is the third largest in North America; only the Prudhoe Bay field on the North Slope of Alaska and a Mexican field are larger. The abundance of oil from the East Texas field and the economic depression coupled to temporarily reduce oil prices by 90 percent to just ten cents a barrel.
In 1933 the Texas legislature recognized the need for conservation measures to avoid wasting oil and, thus, gave the job of industry regulation to the existing Texas Railroad Commission. Since that time other oil-producing states have created agencies or commissions to regulate the development and production of oil and gas reserves.
The 1930s also saw an increase use of gasoline, natural gas, and natural gas liquids. While some shallow "offshore" drilling occurred as early as the late 1800s, it was not until the late 1930s that wells were drilled from structures resembling the offshore drilling platforms of today. WORLD WAR II: PETROLEUM FOR DEFENSE
The United States started to recover from the economic depression by
the mid-1930s. The onset of World War II in 1939 accelerated the pace of economic recovery. Compared with World War I, World War II used more mechanized equipment, airplanes, automotive equipment, and ships, all of which required huge amounts of petroleum. The industry easily met the United States' and allies' demands for petroleum. However, as World War II progressed, the U.S. and British governments feared an eventual shortage of crude oil. In 1943 the U.S. government even proposed buying from Chevron and Texaco the petroleum company that became Saudi Aramco, now the world's largest oil producing company.
During and after World War II, huge capital investments were made to further develop the enormous reserves found in the Persian Gulf area. Chevron, joined later by Texaco, and still later by Exxon and Mobil, owned the Arabian-American Oil Company or Aramco, which developed the giant Saudi Arabian oil fields and downstream infrastructure. Today the company is owned by Saudi Arabia and has been renamed Saudi Aramco. Other companies explored, developed, and produced oil in other countries, but in the first half of the twentieth century, the United States
Chapter 1 ~ An Introduction to the Petroleum Industry
14
typically produced and consumed from 50 percent to 75 percent of the world's annual oil production.
AFTER WORLD WAR II: GROWTH OF THE NATURAL GAS AND PETROCHEMICAL INDUSTRIES
At the end of World War II, two events contributed to the tremendous growth in the natural gas industry. Natural gas had previously been discovered in large quantities in Texas, Louisiana, and other southwestern states; however, it was difficult to transport the gas long distances. This problem was alleviated by the development of a new technique for welding large pipe joints; gas under high pressure thus became transportable to the heavily populated midwestern and eastern regions of the country. Also, after World War II, the country witnessed the birth of the petrochemical industry, which used natural gas liquids for some of its basic raw materials.
THE 1950s AND 1960s: IMPORTED OIL AND THE FORMING OF OPEC
During the 1950s and the 1960s, there was ample world oil production,
with prices remaining stable and averaging approximately $3.00 per barrel. However, these two decades also saw an increased U.S. reliance on imported crude oil and refined products. In 1950 ten percent of oil used in the United States was supplied by imported oil and refined products; by 1970 that percentage had increased to 23 percent.
In 1960 the Organization of Petroleum Exporting Countries (OPEC) was formed by Saudi Arabia, Kuwait, Iran, Iraq, and Venezuela. Later, eight other countries joined OPEC—the United Arab Emirates and Qatar in the Middle East; the African countries of Algeria, Gabon, Libya and Nigeria; and the countries of Indonesia and Ecuador. Ecuador withdrew in late 1992. By 1973 OPEC members produced 80 percent of world oil exports, and OPEC had become a world oil cartel. Member countries began to nationalize oil production within their borders.
THE 1970s: OIL AND GAS PRICES SKYROCKET. U.S. IMPOSES PRICE CONTROLS
Beginning in October 1973, Arab OPEC members cut off all oil exports to the U.S. in response to the U.S.'s proposed $2.2 billion military aid package to Israel, which was reeling from surprise attacks by Egypt and Syria that month. The price for Saudi Arabian oil rose dramatically— $1.80 per barrel in 1971, $2.18 in 1972, $2.90 by mid-1973, $5.12 in
Chapter 1 ~ An Introduction to the Petroleum Industry
15
October 1973, and $11.65 in December 1973. Thereafter, world crude oil prices increased slowly through 1978 when Saudi oil sold for $12.70 per barrel. The 1979 Iranian Revolution caused prices to again escalate rapidly, peaking at $42 per barrel for some U.S. crude oil in December 1979.
During the 1960s and early 1970s, some people warned of petroleum shortages, but their warnings went unheeded until the 1973 Arab oil embargo. Because of the embargo, a large portion of the oil normally imported by the United States was cut off for several months, and citizens were faced with a shortage of gasoline and other petroleum products and with increasing prices. The federal government created the Federal Energy Administration in 1973 and gave it the power to control prices of crude oil. The price regulations were complex, and compliance procedures were not always clearly determinable, even after petroleum company personnel consulted with officials of the Federal Energy Administration, predecessor to the U.S. Department of Energy (DOE).
A two-tier oil pricing structure was established with a low price for "old" or "lower-tier oil" and a higher price for "new" or "upper-tier oil." Lower-tier oil generally came from properties that were producing prior to 1973, while upper-tier oil came from properties that began producing after 1972. Producers often had both kinds of properties and therefore sold some oil at less than half the price of other oil of the same quality. By 1979 the U.S. allowed free market prices for U.S. oil from newly drilled properties or properties producing less than 10 barrels per day per well. However, on average, domestic oil was selling at only a fraction of the price paid in this country for imported oil.
Foreign oil continued to be imported (at prices exceeding domestic oil prices) to meet the continued growth in domestic demand. In 1977, approximately 47 percent of the United States' needs were met by imported oil.
THE WINDFALL PROFIT TAX (1980 TO 1988)
President Carter's call for phased decontrol of oil prices by late 1981
was coupled with enactment of the Windfall Profit Tax Act in March 1980. The Act levied a tax from 30 percent to 70 percent on windfall profit, i.e., the excess of the selling price of a barrel of oil over the adjusted base price for that barrel. The adjusted base price was an inflation-adjusted average price of similar oil sold in late 1979. Congress repealed the windfall profit tax in 1988 after oil prices had fallen so low that no windfall profit was left to tax.
Chapter 1 ~ An Introduction to the Petroleum Industry
16
ALASKA NORTH SLOPE OIL
In 1968 Prudhoe Bay, the United States' largest oil field, was discovered on the North Slope of Alaska bordering the Arctic Ocean. In 1969, the giant Kuparuk field adjacent to Prudhoe Bay was discovered. Prior to the Prudhoe Bay discovery by Atlantic Richfield Company (ARCO), seven very expensive, but unsuccessful, exploratory wells had been drilled in the area, and ARCO almost canceled drilling the discovery well. Even after discovery, Prudhoe Bay development was stalled until the 1973 Arab oil embargo prompted Congress to allow the Trans Alaska Pipeline System (or TAPS) to be built. Finally, in 1977 Prudhoe Bay and Kuparuk crude oils were produced and marketed.
For Prudhoe Bay and Kuparuk, estimated ultimate oil production, i.e., all prior production plus estimated future production, is 13.2 billion and 2.6 billion barrels, respectively. Gas reserves approximate 4 billion additional equivalent barrels. These North Slope fields are immense. In the entire lower 48 states where over one million wells have been drilled, only three discovered oil fields have ultimate oil production exceeding 2 billion barrels, and their combined ultimate production is only 10.9 billion barrels. Alaska North Slope oil (ANS crude) made up approximately 18 percent of all 1998 U.S. oil production.
The North Slope infrastructure for production of Prudhoe Bay and Kuparuk is used to economically produce some 20 smaller North Slope reservoirs. However, the huge 32 trillion cubic feet (tcf) of recoverable natural gas reserves from North Slope fields cannot now be economically transported to the Lower 48 states. Advances in converting gas to liquids (GTL, described on page 5) offer hope. Alternatively, the gas may eventually be chilled as LNG and shipped to Asia’s Pacific Rim.
North Slope operations are an industry model for environmental protection, far different from the typical Russian operation. A Russian environmental scientist touring the Prudhoe Bay production facilities declared that north slope production must be a government hoax because he found no oil leaks or spills. Gas produced at Prudhoe Bay is not vented into the atmosphere or burned as waste, but reinjected back into the reservoir. Gas reinjection improves oil recovery and saves the gas for potential future use. The North Slope’s Alpine field, the largest U.S. onshore oil discovery in fifteen years, spans 40,000 acres; yet its oil (70,000 barrels per day) will be produced from two 50-well gravel pads on less than 120 acres. The Alpine field has no permanent roads or bridges.
In 1998 Alaskan oil production (nearly all from the North Slope) provided 73 percent of the state government’s unrestricted general fund.
Chapter 1 ~ An Introduction to the Petroleum Industry
17
The oil royalty has provided a permanent and growing $25 billion trust fund for the half million residents of Alaska.
Despite the industry’s success in safeguarding the North Slope environment and adding to the nation’s wealth, and contrary to the wishes of most Alaskans and local Inuits, the North Slope’s 19 million acre Arctic National Wildlife Refuge (ANWR) remains closed by the federal government to drilling and production. The federal government estimates that the western half of ANWR’s 1.7 million acre coastal plain has recoverable oil reserves of several billion barrels.
THE 1980s: BOOM AND BUST. MARKET FORCES PREVAIL
Several factors set the stage for a U.S. petroleum industry boom in 1981 and 1982:
♦ World oil prices had increased astronomically in 1973 and 1979.
These price increases improved exploration economics and created an expectation of substantial price increases in the future.
♦ In January 1981, President Reagan removed U.S. price controls on crude oil, which gave producers additional cash to reinvest. In the 1970s, Libya and several other countries seized U.S. companies' interests in petroleum fields. These nationalizations encouraged a preference for U.S. companies to explore within the United States.
♦ The Natural Gas Policy Act of 1978 created incentive pricing schemes to stimulate the exploration and development of natural gas reserves.
In 1981 U.S. tax laws were changed to reduce the highest individual
income tax rates from 70 percent to 50 percent and reduce windfall profit taxes on new oil fields. Individuals investing in wells drilled in 1981 could earn a 40 percent profit, after income tax effects, on wells that had no profit before income tax effects. Consequently, in 1981 and 1982, U.S. individuals invested billions of dollars in limited partnerships for petroleum exploration and production.
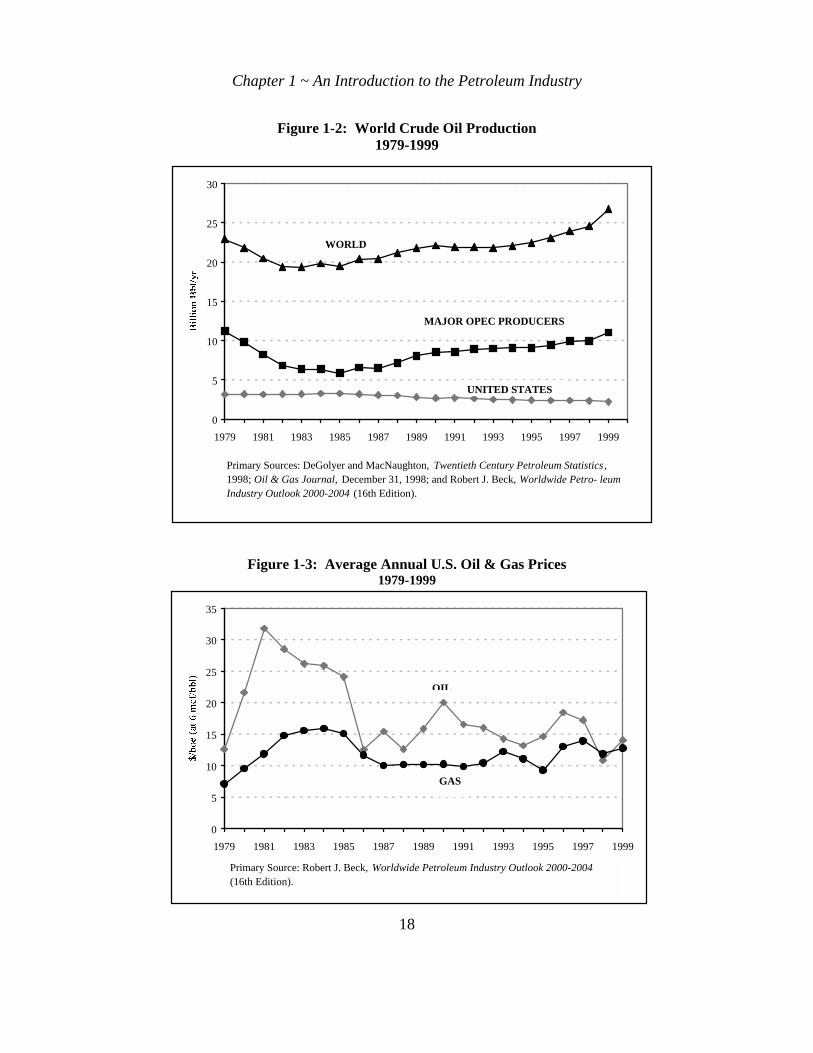
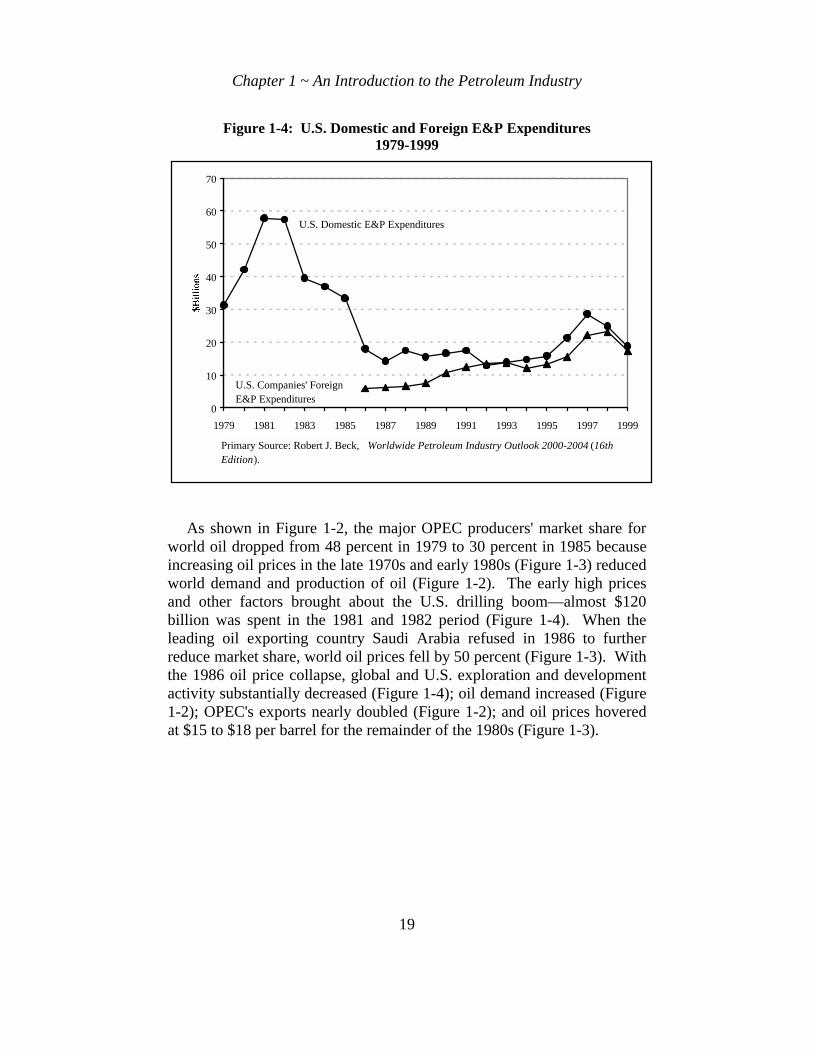
Figures 1-2, 1-3, and 1-4 present a history of annual production, prices, and E&P expenditures from 1979 through 1999 that portray the boom and bust of the 1980s.
Chapter 1 ~ An Introduction to the Petroleum Industry
18
0
5
10
15
20
25
30
1979 1981 1983 1985 1987 1989 1991 1993 1995 1997 1999
Primary Sources: DeGolyer and MacNaughton, Twentieth Century Petroleum Statistics , 1998; Oil & Gas Journal, December 31, 1998; and Robert J. Beck, Worldwide Petro- leum Industry Outlook 2000-2004 (16th Edition).
WORLD
MAJOR OPEC PRODUCERS
UNITED STATES
Figure 1-2: World Crude Oil Production 1979-1999
Figure 1-3: Average Annual U.S. Oil & Gas Prices 1979-1999
0
5
10
15
20
25
30
35
1979 1981 1983 1985 1987 1989 1991 1993 1995 1997 1999
Primary Source: Robert J. Beck, Worldwide Petroleum Industry Outlook 2000-2004 (16th Edition).
OIL
GAS
Chapter 1 ~ An Introduction to the Petroleum Industry
19
Figure 1-4: U.S. Domestic and Foreign E&P Expenditures 1979-1999
As shown in Figure 1-2, the major OPEC producers' market share for world oil dropped from 48 percent in 1979 to 30 percent in 1985 because increasing oil prices in the late 1970s and early 1980s (Figure 1-3) reduced world demand and production of oil (Figure 1-2). The early high prices and other factors brought about the U.S. drilling boom—almost $120 billion was spent in the 1981 and 1982 period (Figure 1-4). When the leading oil exporting country Saudi Arabia refused in 1986 to further reduce market share, world oil prices fell by 50 percent (Figure 1-3). With the 1986 oil price collapse, global and U.S. exploration and development activity substantially decreased (Figure 1-4); oil demand increased (Figure 1-2); OPEC's exports nearly doubled (Figure 1-2); and oil prices hovered at $15 to $18 per barrel for the remainder of the 1980s (Figure 1-3).
0
10
20
30
40
50
60
70
1979 1981 1983 1985 1987 1989 1991 1993 1995 1997 1999
Primary Source: Robert J. Beck, Worldwide Petroleum Industry Outlook 2000-2004 (16th Edition).
U.S. Domestic E&P Expenditures
U.S. Companies' Foreign E&P Expenditures
Chapter 1 ~ An Introduction to the Petroleum Industry
20
THE 1990s: FUTURES, NATURAL GAS, GOING INTERNATIONAL, AND TECHNOLOGY ADVANCEMENTS
The 1990s have been marked by five trends: (1) growing use of oil and gas futures, (2) growth in natural gas production and value in the U.S., (3) restructuring of the U.S. gas industry, (4) increasing focus by U.S. companies on foreign E&P investments, and (5) continued improvements in technological and operational efficiencies.
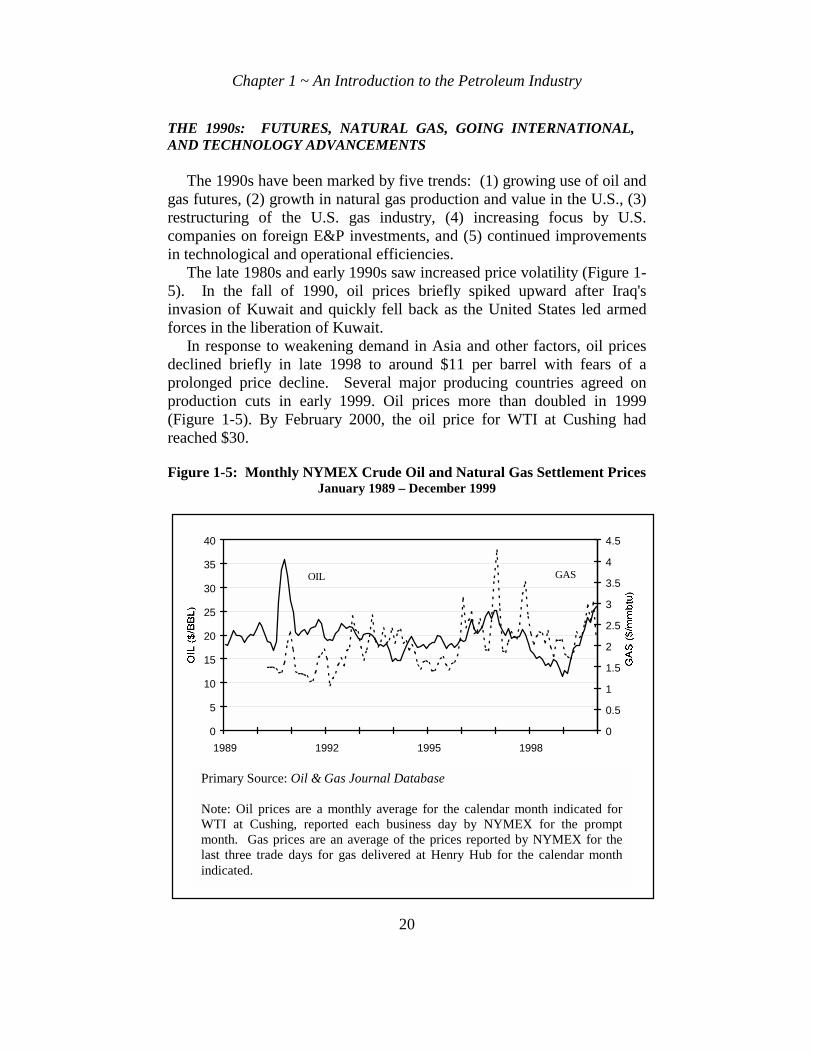
The late 1980s and early 1990s saw increased price volatility (Figure 1-5). In the fall of 1990, oil prices briefly spiked upward after Iraq's invasion of Kuwait and quickly fell back as the United States led armed forces in the liberation of Kuwait.
In response to weakening demand in Asia and other factors, oil prices declined briefly in late 1998 to around $11 per barrel with fears of a prolonged price decline. Several major producing countries agreed on production cuts in early 1999. Oil prices more than doubled in 1999 (Figure 1-5). By February 2000, the oil price for WTI at Cushing had reached $30. Figure 1-5: Monthly NYMEX Crude Oil and Natural Gas Settlement Prices
January 1989 – December 1999
0
5
10
15
20
25
30
35
40
1989 1992 1995 1998
0
0.5
1
1.5
2
2.5
3
3.5
4
4.5
OIL GAS
Primary Source: Oil & Gas Journal Database Note: Oil prices are a monthly average for the calendar month indicated for WTI at Cushing, reported each business day by NYMEX for the prompt month. Gas prices are an average of the prices reported by NYMEX for the last three trade days for gas delivered at Henry Hub for the calendar month indicated.

Chapter 1 ~ An Introduction to the Petroleum Industry
21
With greater historical and expected price volatility, petroleum producers, processors, and users increased their use of petroleum futures and saw the 1990 birth of natural gas futures. Oil and gas futures are publicly traded standardized contracts to buy or sell specified quantities of crude oil or natural gas at specified times in the future at specified prices. Futures may be used to hedge or speculate on crude oil and natural gas prices, as further explained in Chapter Thirty-Two. Similar contracts have arisen for call (and put) options to buy (and sell) specified quantities at specified prices until specified dates.
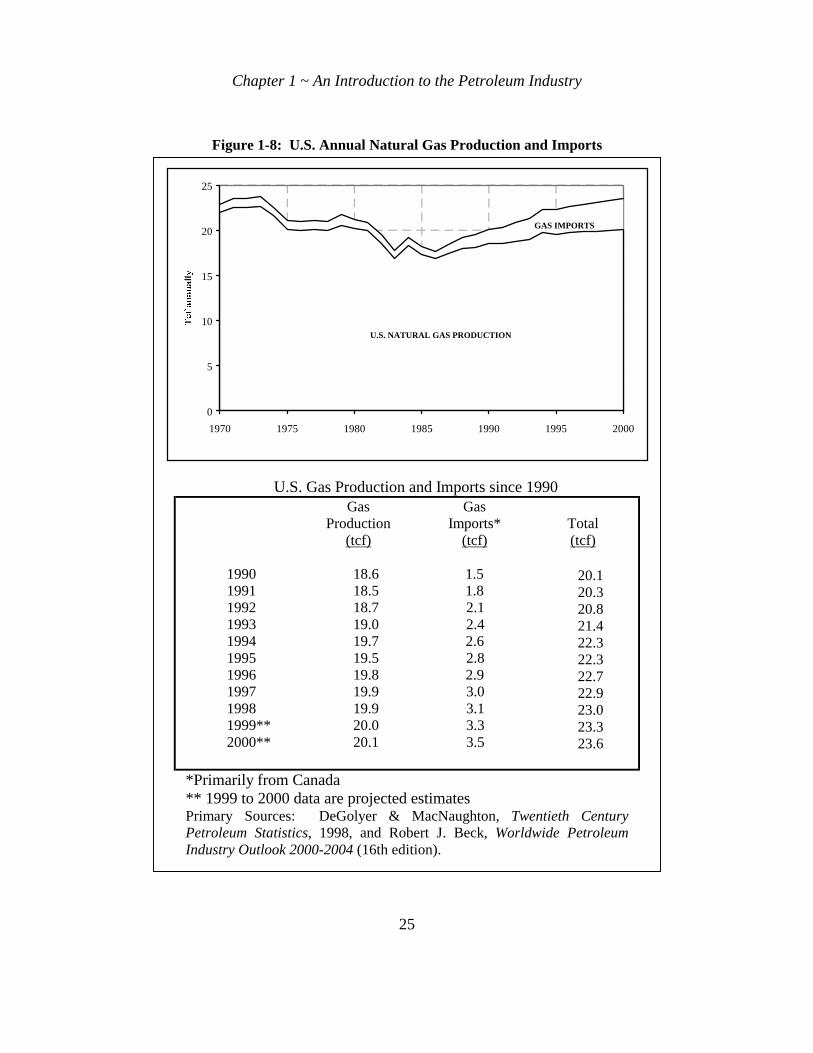
Worldwide, natural gas demand is growing faster than crude oil demand. Natural gas is a cleaner fuel, appealing to growing environmental concerns. In 1993, for the first time in history, the value of U.S. natural gas production exceeded the value of U.S. crude oil production. In that sense, the U.S. petroleum industry has become the "gas and oil" industry.
The traditional marketing of natural gas to gas pipelines under long-term contracts has been replaced by selling gas at spot prices to gas marketers and gas consumers (end-users) under month-long contracts. Average U.S. gas prices have become seasonal—high in winter months when cold weather increases gas demand for space heating and relatively low in the warmer summer months (see Figure 1-5). Changes in federal regulation of interstate gas pipelines have enabled pipelines to become providers of gas transportation rather than serve as the traditional first purchasers and resellers of produced natural gas (as further explained in Chapter Twelve).
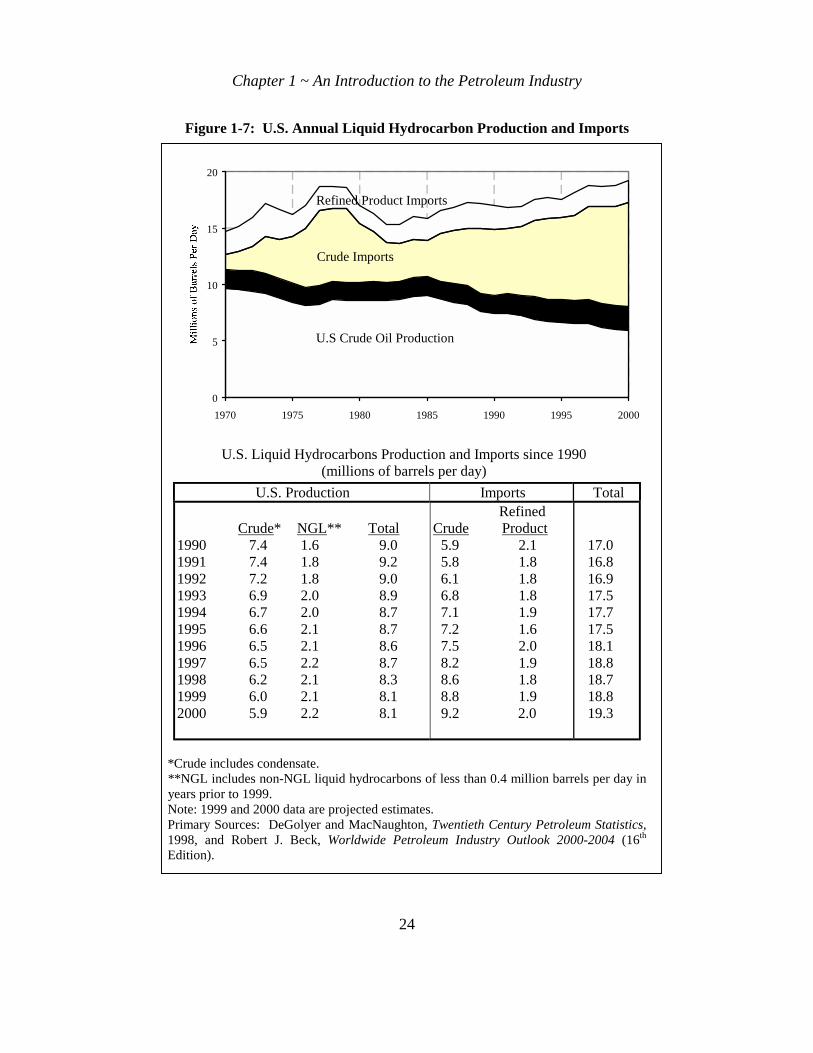
In the 1990s, U.S. petroleum companies doubled their petroleum exploration and development costs outside the United States (Figure 1-4). Foreign E&P opportunities have emerged following (1) the political restructurings of the Former Soviet Union and (2) the growing sophistication and interest of countries, such as Venezuela, in attracting investments by petroleum companies from around the world. Flat domestic spending has contributed to declining U.S. production and increased reliance on imports. In 1998, imported crude and refined products supplied over half of U.S. demand (Figure 1-7).
In the late 1980s, the United States was viewed as a poor area of the world for new discoveries. It had been heavily drilled by world standards, and its most promising regions for new fields were off limits to protect local environment. In the 1990s, U.S. prospects were favorably reversed by technology advancements that substantially reduced exploration and development risks and costs. Exploration and development activity in the United States more than doubled from 1990 to 1999.
Chapter 1 ~ An Introduction to the Petroleum Industry
22
Productive offshore fields are being explored and developed in deeper waters. As explained in Chapter Five, exploration success, both onshore and offshore, has been improved by the use of 3D seismic to identify likely reservoirs with less use of exploratory wells. Well cost per reserve volume has declined through the use of new techniques to drill horizontal wells in which the well bore starts vertically downward and bends to become a horizontal shaft through wide reservoirs of limited thickness. The industry has learned to economically produce substantial natural gas and oil from exotic sources, primarily:
♦ methane contained in underground coalbeds, ♦ natural gas from continuous tight sands formations that are opened
up by fracturing the rock with fracing material temporarily pumped under high pressure into the reservoir, and
♦ oil recovered from mined oil sands, such as the vast oil sands of Alberta that are being developed to provide some 25 percent of Canada’s light oil production.
Coalbed methane production in the U.S. increased ten-fold in the 1990s
and now exceeds 1 trillion cubic feet per year, from over 7,500 wells. Coalbed methane reservoirs are estimated to contain 146 tcf, or 14 percent, of the United States total recoverable natural gas resources.
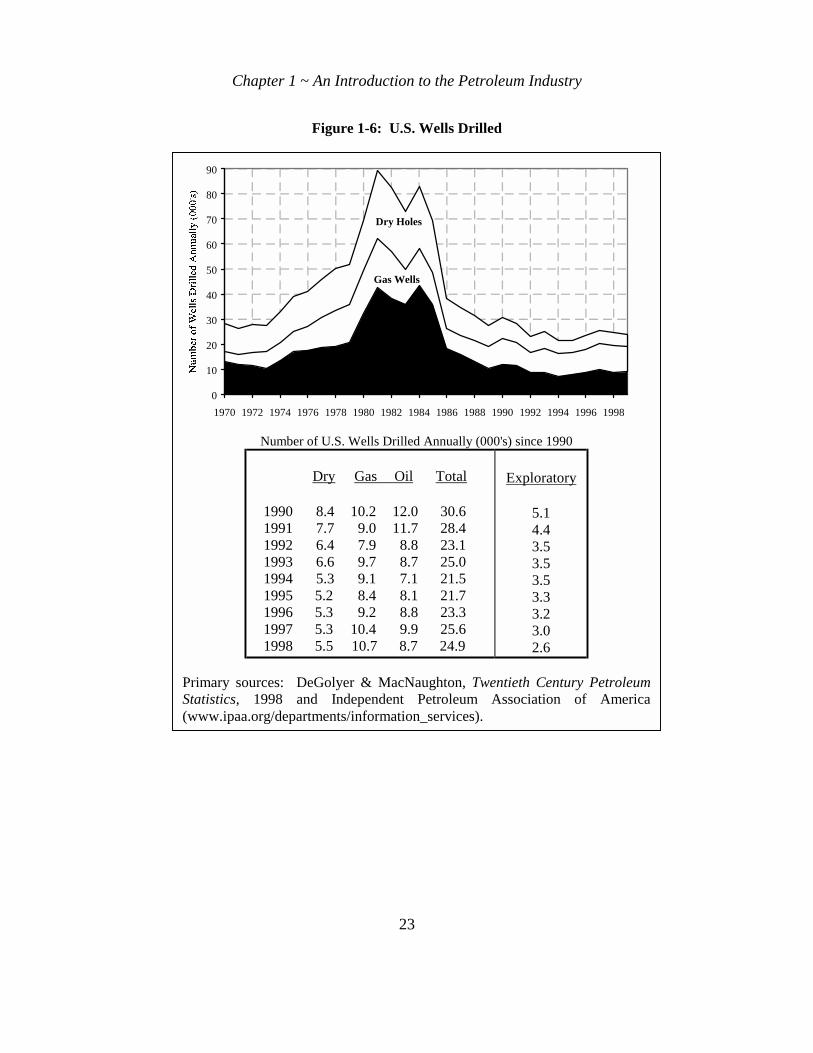
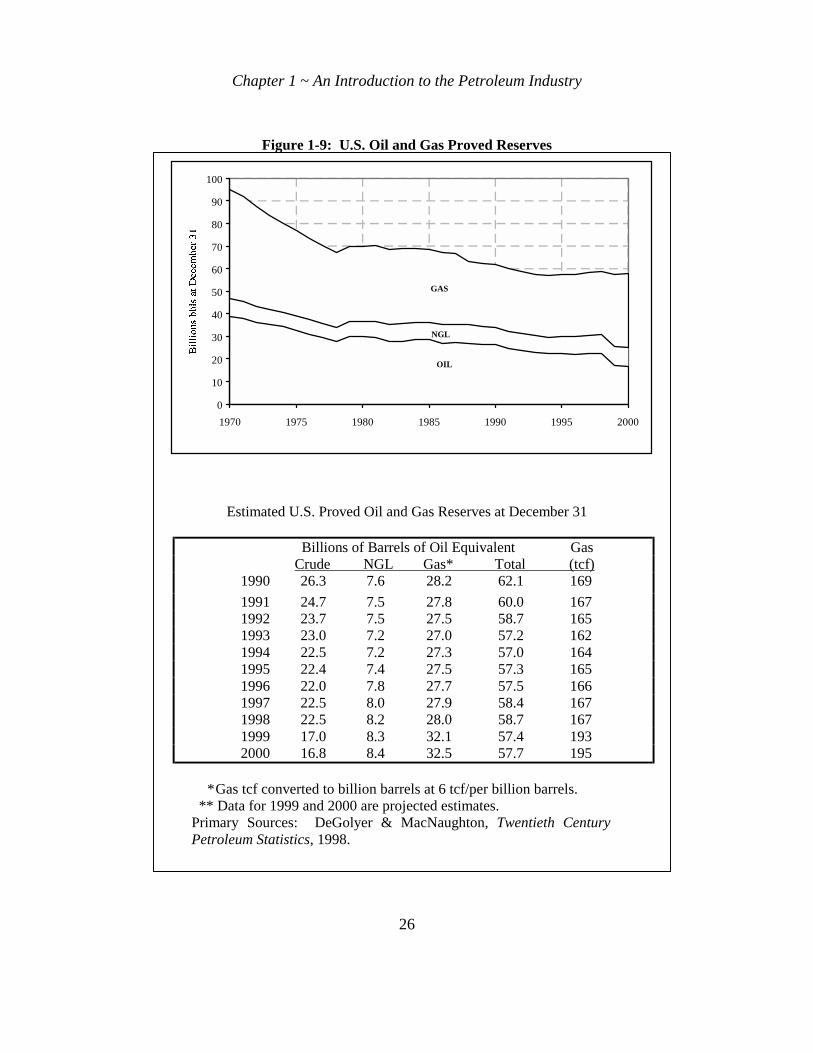
STATISTICAL HISTORY OF THE PETROLEUM INDUSTRY To supplement the preceding history of the petroleum industry, Figures
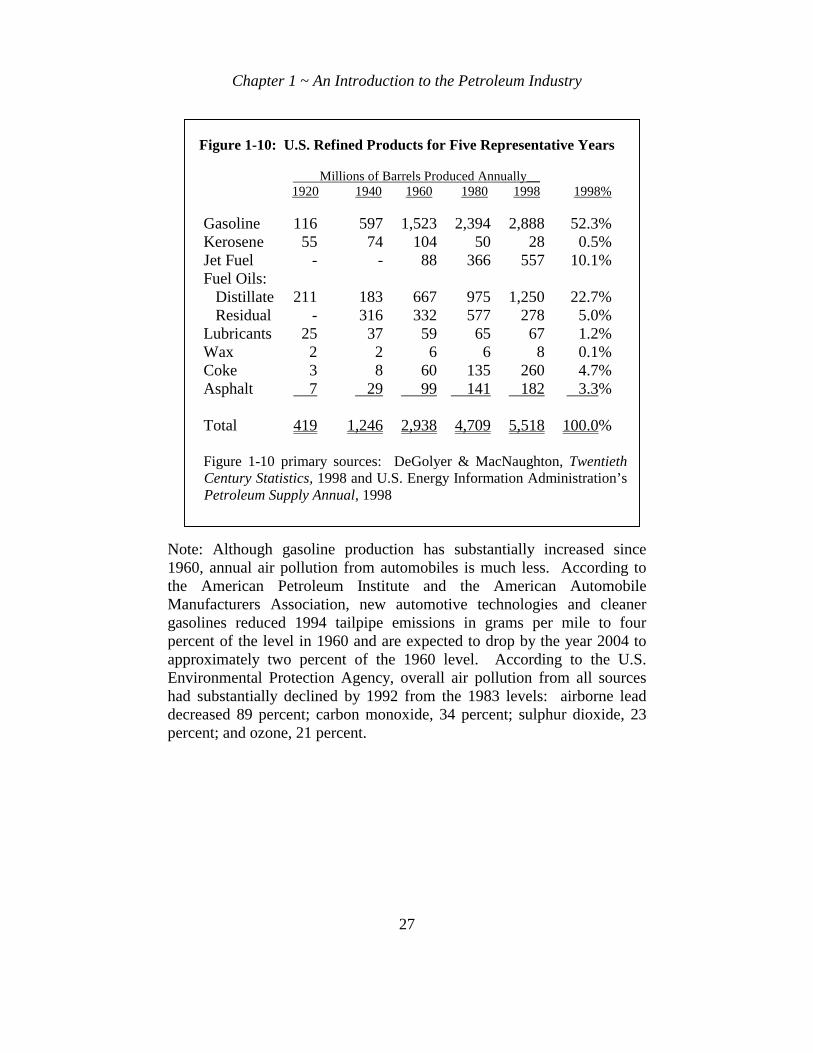
1-6 through 1-9 provide graphical histories from 1970 to the late 1990s and tabular histories for the past ten years of U.S. drilling, production, imports, and reserves. Figure 1-10 illustrates changes since 1920 in the mix of products refined from crude oil.
Chapter 1 ~ An Introduction to the Petroleum Industry
23
Figure 1-6: U.S. Wells Drilled
Number of U.S. Wells Drilled Annually (000's) since 1990
Dry Gas Oil Total
1990 8.4 10.2 12.0 30.6 1991 7.7 9.0 11.7 28.4 1992 6.4 7.9 8.8 23.1 1993 6.6 9.7 8.7 25.0 1994 5.3 9.1 7.1 21.5 1995 5.2 8.4 8.1 21.7 1996 5.3 9.2 8.8 23.3 1997 5.3 10.4 9.9 25.6 1998 5.5 10.7 8.7 24.9
Exploratory
5.1 4.4 3.5 3.5 3.5 3.3 3.2 3.0 2.6
Primary sources: DeGolyer & MacNaughton, Twentieth Century Petroleum Statistics, 1998 and Independent Petroleum Association of America (www.ipaa.org/departments/information_services).
0
10
20
30
40
50
60
70
80
90
1970 1972 1974 1976 1978 1980 1982 1984 1986 1988 1990 1992 1994 1996 1998
Oil Wells
Gas Wells
Dry Holes
Chapter 1 ~ An Introduction to the Petroleum Industry
24
Figure 1-7: U.S. Annual Liquid Hydrocarbon Production and Imports
U.S. Liquid Hydrocarbons Production and Imports since 1990 (millions of barrels per day)
U.S. Production Imports Total 1990 1991 1992 1993 1994 1995 1996 1997 1998 1999 2000
Crude* 7.4 7.4 7.2 6.9 6.7 6.6 6.5 6.5 6.2 6.0 5.9
NGL** 1.6 1.8 1.8 2.0 2.0 2.1 2.1 2.2 2.1 2.1 2.2
Total 9.0 9.2 9.0 8.9 8.7 8.7 8.6 8.7 8.3 8.1 8.1
Refined Crude Product 5.9 2.1 5.8 1.8 6.1 1.8 6.8 1.8 7.1 1.9 7.2 1.6 7.5 2.0 8.2 1.9 8.6 1.8 8.8 1.9
9.2 2.0
17.0 16.8 16.9 17.5 17.7 17.5 18.1 18.8 18.7 18.8 19.3
*Crude includes condensate. **NGL includes non-NGL liquid hydrocarbons of less than 0.4 million barrels per day in years prior to 1999. Note: 1999 and 2000 data are projected estimates. Primary Sources: DeGolyer and MacNaughton, Twentieth Century Petroleum Statistics, 1998, and Robert J. Beck, Worldwide Petroleum Industry Outlook 2000-2004 (16th
Edition).
0
5
10
15
20
1970 1975 1980 1985 1990 1995 2000
Refined Product Imports
Crude Imports
U.S. NGL Production
U.S Crude Oil Production
Chapter 1 ~ An Introduction to the Petroleum Industry
25
Figure 1-8: U.S. Annual Natural Gas Production and Imports
U.S. Gas Production and Imports since 1990
1990 1991 1992 1993 1994 1995 1996 1997 1998 1999** 2000**
Gas Production
(tcf)
18.6 18.5 18.7 19.0 19.7 19.5 19.8 19.9 19.9 20.0 20.1
Gas Imports*
(tcf)
1.5 1.8
2.1 2.4
2.6 2.8
2.9 3.0 3.1 3.3 3.5
Total (tcf)
20.1 20.3 20.8 21.4 22.3 22.3 22.7 22.9 23.0 23.3 23.6
*Primarily from Canada ** 1999 to 2000 data are projected estimates Primary Sources: DeGolyer & MacNaughton, Twentieth Century Petroleum Statistics, 1998, and Robert J. Beck, Worldwide Petroleum Industry Outlook 2000-2004 (16th edition).
0
5
10
15
20
25
1970 1975 1980 1985 1990 1995 2000
U.S. NATURAL GAS PRODUCTION
GAS IMPORTS
Chapter 1 ~ An Introduction to the Petroleum Industry
26
Figure 1-9: U.S. Oil and Gas Proved Reserves
Estimated U.S. Proved Oil and Gas Reserves at December 31
Billions of Barrels of Oil Equivalent Gas Crude NGL Gas* Total (tcf) 1990 26.3 7.6 28.2 62.1 169
1991 24.7 7.5 27.8 60.0 167 1992 23.7 7.5 27.5 58.7 165 1993 23.0 7.2 27.0 57.2 162 1994 22.5 7.2 27.3 57.0 164 1995 22.4 7.4 27.5 57.3 165 1996 22.0 7.8 27.7 57.5 166 1997 22.5 8.0 27.9 58.4 167 1998 22.5 8.2 28.0 58.7 167 1999 17.0 8.3 32.1 57.4 193 2000 16.8 8.4 32.5 57.7 195 * Gas tcf converted to billion barrels at 6 tcf/per billion barrels. ** Data for 1999 and 2000 are projected estimates. Primary Sources: DeGolyer & MacNaughton, Twentieth Century Petroleum Statistics, 1998.
0
10
20
30
40
50
60
70
80
90
100
1970 1975 1980 1985 1990 1995 2000
OIL
GAS
NGL
Chapter 1 ~ An Introduction to the Petroleum Industry
27
Figure 1-10: U.S. Refined Products for Five Representative Years
Millions of Barrels Produced Annually__ 1920 1940 1960 1980 1998 1998%
Gasoline 116 597 1,523 2,394 2,888 52.3% Kerosene 55 74 104 50 28 0.5% Jet Fuel - - 88 366 557 10.1% Fuel Oils: Distillate 211 183 667 975 1,250 22.7% Residual - 316 332 577 278 5.0% Lubricants 25 37 59 65 67 1.2% Wax 2 2 6 6 8 0.1% Coke 3 8 60 135 260 4.7% Asphalt 7 29 99 141 182 3.3% Total 419 1,246 2,938 4,709 5,518 100.0% Figure 1-10 primary sources: DeGolyer & MacNaughton, Twentieth
Century Statistics, 1998 and U.S. Energy Information Administration’s Petroleum Supply Annual, 1998
Note: Although gasoline production has substantially increased since 1960, annual air pollution from automobiles is much less. According to the American Petroleum Institute and the American Automobile Manufacturers Association, new automotive technologies and cleaner gasolines reduced 1994 tailpipe emissions in grams per mile to four percent of the level in 1960 and are expected to drop by the year 2004 to approximately two percent of the 1960 level. According to the U.S. Environmental Protection Agency, overall air pollution from all sources had substantially declined by 1992 from the 1983 levels: airborne lead decreased 89 percent; carbon monoxide, 34 percent; sulphur dioxide, 23 percent; and ozone, 21 percent.

Chapter 1 ~ An Introduction to the Petroleum Industry
28
Recommended