Citation: Tindall, Jess and Pendle, Jamie (2017) A comparison of UK domestic water services sizing methods with each other and with empirical data. Building Services Engineering Research and Technology, 38 (6). pp. 635-649. ISSN 0143-6244
Published by: SAGE Publications
URL: http://journals.sagepub.com/doi/full/10.1177/01436... <http://journals.sagepub.com/doi/full/10.1177/0143624417719009>
This version was downloaded from Northumbria Research Link: http://nrl.northumbria.ac.uk/32821/
Northumbria University has developed Northumbria Research Link (NRL) to enable users to access the University’s research output. Copyright © and moral rights for items on NRL are retained by the individual author(s) and/or other copyright owners. Single copies of full items can be reproduced, displayed or performed, and given to third parties in any format or medium for personal research or study, educational, or not-for-profit purposes without prior permission or charge, provided the authors, title and full bibliographic details are given, as well as a hyperlink and/or URL to the original metadata page. The content must not be changed in any way. Full items must not be sold commercially in any format or medium without formal permission of the copyright holder. The full policy is available online: http://nrl.northumbria.ac.uk/policies.html
This document may differ from the final, published version of the research and has been made available online in accordance with publisher policies. To read and/or cite from the published version of the research, please visit the publisher’s website (a subscription may be required.)
Page 1 of 26
A comparison of UK domestic water services
sizing methods with each other and with empirical
data
JESS TINDALL BENG(HONS)
Faculty of Engineering and Environment, Northumbria University
JAMIE PENDLE MENG
Graduate Mechanical Engineer, Arup
Abstract
Evidence suggests that DCWS sizing methods in many countries around the world tend to
overestimate the actual peak water volume flow rate. Oversizing DWS systems does waste
materials and money, but it also increases the length of time that it takes for water to pass through
the system which can increase water temperatures with the associated risks that presents. This
paper compares the three commonly used UK DCWS sizing methods and reveals variance in the
methods, the design flow rates calculated and the amount of diversity applied by each method. BS
EN 8061 returns the lowest design flow rates of the three methods and also applies significantly
greater diversity.
Empirical DCWS volume flow rate data from two case study buildings revealed that all three UK
sizing methods significantly overestimated the peak water volume flow rates but that BS EN 8061

Page 2 of 26
was the closest. Additional empirical data from seven more buildings has been used to validate the
data from this study and add confidence to the findings. This research provides useful evidence to
help engineers select the most appropriate UK DCWS sizing method and to anticipate the likely
range and fluctuation of DCWS flow rates.
Keywords DWS, domestic water service, DCWS, domestic cold water service, DHWS,
domestic hot water service, water, loading unit, volume flow rate, probability, oversizing
Engineers tend to be conservative by nature and generally err on the side of caution to ensure that
there is never any cause for customer complaint about their designs. This is understandable but
there can be negative consequences if the full implications of such decisions are not fully
understood. This paper reveals significant oversizing compared to empirical data from each of the
three UK DWS sizing methods and highlights the reasons for this. The practical application of this
paper lies in the presented results data and analysis which will help engineers make this important
choice between the available sizing methods.
1.0 Introduction
There are three commonly used sizing methods for domestic cold water services (DCWS) for
United Kingdom (UK) buildings at the time of publication. BS EN 8061 is the current European sizing
standard, but in part 3 Annex C it grants engineers discretion to use the ‘UK method’ as defined in
BS 85582 when deemed appropriate. Some engineers have preferred to use the guidance issued
by the Institution of Plumbing3 believing that this results in more accurate sizing than the “UK
method”. BS 85582 also offers complementary guidance to BS EN 8061 and confirms that an
investigation is underway into the loading units (LUs) used in the UK’s traditional sizing guidance

Page 3 of 26
(i.e. BS 85582). Until the publication of new recommendations, designers may use BS EN 8061 for
residential applications and BS 85582 elsewhere.
CIBSE AM124 states that “experience from continental schemes indicates that BS 67005 factors
(now published as BS 85582) are too conservative” for predicting design Domestic Hot Water
Service (DHWS) volume flow rates. Instead, it directs readers to use the Danish Standard DS 4396.
Agudelo-Vera C7 states that oversizing pipework reduces water velocities which mean that the
water remains in the distribution pipework longer than is ideal for health and hygiene reasons. This
problem is most extreme in tall buildings where the domestic cold and hot water pipework may run
within the same riser space resulting in undesired heating of the cold water.
There have been some reports that current sizing methods can lead to an overestimation of water
demand. Wong L8 calculated a theoretical design water flow rate using a ‘fixture unit’ method,
probably following the ASHRAE9 guidance, although not specifically stated in the article. This
prediction was compared with theoretical data from a model developed using measured data from
1300 households in 14 typical Hong Kong high rise buildings. The data revealed that the water
demand predicted from analysis of the measured data method was around 50 – 60% of that
calculated using the ‘fixture unit’ estimation method, which was said to be the current design
practice adopted for high-rise residential buildings in Hong Kong. A Brazilian team10 found similar
results with measured data being 23% lower than the design flow rate calculated using the Brazilian
standards.
Researchers from The Netherlands7 analysed the Dutch guidance on drinking water supply
systems, which had been developed using data measured between 1976 and 1980. The authors
state that the old guidelines overestimated peak demand values due to an increased range of
available appliances and changes in the behaviour of building occupants. The importance of
accurately estimating peak demand values is stressed as poorly designed, and oversized systems

Page 4 of 26
are less efficient thus more expensive, but can also cause stagnant water. By using data gathered
from a range of buildings of different water usages the team constructed a stochastic model called
SIMDEUM, standing for Simulation of Water Demand, an End-Use Model. Subsequent research11
highlights that in designing a DCWS distribution system, the peak value of the total water demand,
referred to in their report as the MMFcold, or maximum momentary flow of cold water, is of great
importance. The research uses a procedure developed in 2010 to derive design demand equations
for the peak demand values of DHWS and DCWS in both residential and non-residential buildings.
The study found a good correlation between their demand equations and measured patterns of
use, which was much more accurate than the current Dutch guidance, indicating that their
calculations were reputable.
Using these demand equations, the Dutch study7 found that the results of simulations matched
measured values of peak water demand and that the pipe diameters in the systems they studied
were considerably larger than necessary. They hypothesise that the issue of oversizing may be
present in other countries, and state that their SIMDEUM model could be easily adapted for use in
other countries when specific information of users and appliances is available. The authors confirm
that a 2013 revision of the Dutch guidelines incorporated the design demand equations presented
in the paper.
Based on this review, it is likely that the UK DWS sizing methods may be overestimating the peak
flow rates for buildings. The questions were how significant is the margin of oversizing, and which
of the three UK sizing methods would be most appropriate for multi-unit residential buildings. This
research has been designed to answer these two questions. The next section compares the three
sizing methods and draws out the distinctive features of each. The latter sections set out the method
by which measured data was obtained and compared to the design flow rates predicted by each of
the three sizing methods. Additional datasets gathered from the same type of building are used to

Page 5 of 26
validate the data from this study. The results published in this paper enable engineers to be
confident regarding which DWS sizing method to apply to avoid oversizing their DCWS systems.
2.0 Sizing method review
This section introduces the three most commonly used UK DWS sizing methods and compares
them with each other. All three methods utilise ‘loading units’ (LUs) generated from a probability
analysis, developed from the original work of Hunter12. These methods set the chance that the
design volume flow rate will be exceeded for 1% of the time as discussed in CIBSE Guide G13. All
three methods require the summation of the downstream loading units for each pipe section, and
some form of conversion chart is used to determine the design volume flow rate. These charts
apply varying levels of diversity. The differences in approach taken by each method are discussed
and compared in the following three sections.
2.1 BS 8558:20152 Guide to the design, installation, testing and maintenance
of services supplying water for domestic use within buildings and their
curtilages
“The UK method” as defined initially in BS 67005 which was first published in 1987, revised in 1997
and 2006 before being withdrawn and superseded by BS 8558 in 2011 which itself has been revised
in 2015. The harmonised European standard BS EN 806-3 explains in Appendix C that designers
are free to use their nationally approved sizing method (BS 67005 for the UK – now BS 85582) if
they deem it appropriate. BS 8558:20152 suggests that BS EN 806-31 may be used for residential
buildings and that “traditional UK loading units” (BS 85582) may be used for commercial and public
buildings.
Page 6 of 26
In “the UK method” there is a single LU value given for each outlet type with the exception being
wash hand basins where a higher value is applicable in buildings with periods of peak usage such
as schools or theatres and a lower value for non-peak uses.
A chart is provided to convert LUs to a design volume flow rate. The chart is formatted with a
logarithmic scale allowing ample detail to be provided at LUs between 10 and 200 while enabling
the chart to extend up to a total of 8000 loading units, which equates to a flow rate more than 30
litres per second.
2.2 BS EN 806-3:20061. Specifications for installations inside buildings
conveying water for human consumption
In 2000 Britain began the process of standardising the guidance for DWS with the European Union
(EU). In 2006 BS EN 806-31 which presented new guidance for the sizing and design of DWS was
published and superseded BS 67005.
The use of LUs in BS EN 806-31 is the same as BS 85582 apart from there are no ranges of loading
units given for any outlet type to account for peak or non-peak use.
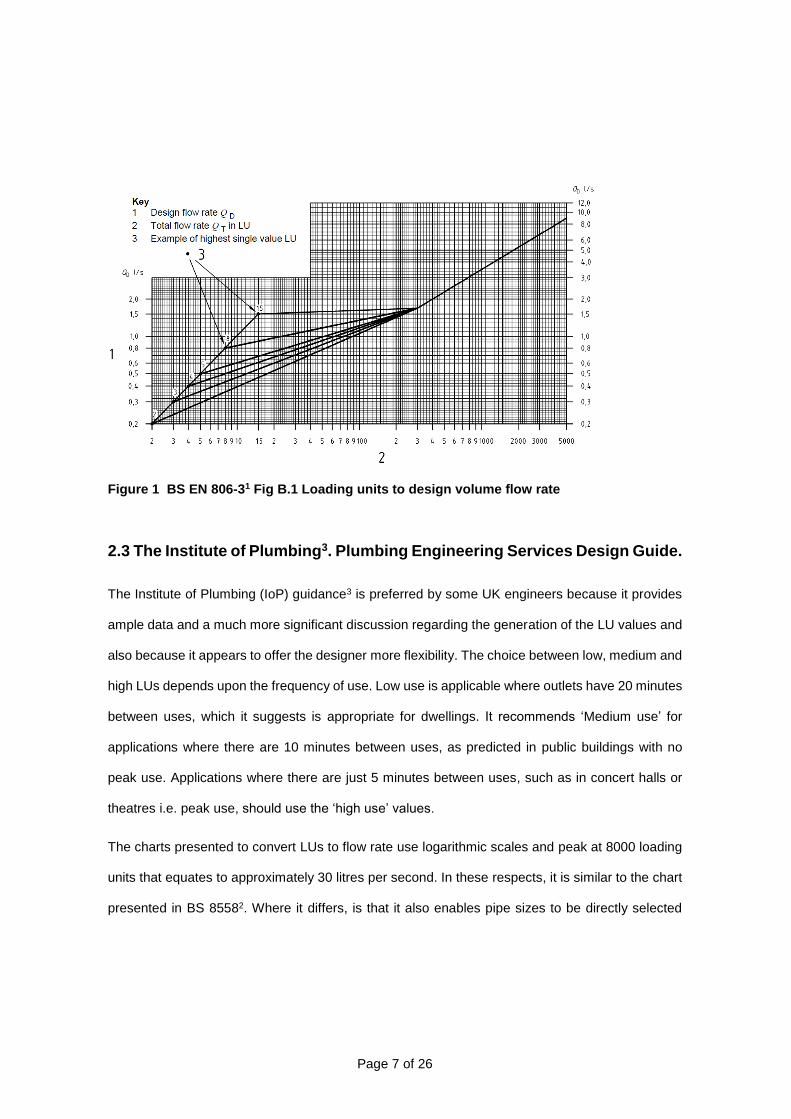
Figure 1 is the LU to volume flow rate conversion chart for BS EN 806-31. Again, the axes use
logarithmic scales, but this time the largest LU value is 5000 loading units, which equate to 9 litres
per second, significantly less than the two other methods. A notable feature of this conversion chart
is that for loading units below 300 the resultant design flow rate depends upon the highest single
value LU fed from that pipe section.
Page 7 of 26
Figure 1 BS EN 806-31 Fig B.1 Loading units to design volume flow rate
2.3 The Institute of Plumbing3. Plumbing Engineering Services Design Guide.
The Institute of Plumbing (IoP) guidance3 is preferred by some UK engineers because it provides
ample data and a much more significant discussion regarding the generation of the LU values and
also because it appears to offer the designer more flexibility. The choice between low, medium and
high LUs depends upon the frequency of use. Low use is applicable where outlets have 20 minutes
between uses, which it suggests is appropriate for dwellings. It recommends ‘Medium use’ for
applications where there are 10 minutes between uses, as predicted in public buildings with no
peak use. Applications where there are just 5 minutes between uses, such as in concert halls or
theatres i.e. peak use, should use the ‘high use’ values.
The charts presented to convert LUs to flow rate use logarithmic scales and peak at 8000 loading
units that equates to approximately 30 litres per second. In these respects, it is similar to the chart
presented in BS 85582. Where it differs, is that it also enables pipe sizes to be directly selected

Page 8 of 26
based on the pressure (head) loss per metre run of pipe and the resultant water velocity. In this
way, many useful features are combined into the one chart.
2.4 Comparison of Loading Units between the three sizing methods
BS EN 806-31 states that “one loading unit is equivalent to a draw-off rate of 0.1 litres per second.”
In contrast, the LUs presented in the Institute of Plumbing Guide, and BS 85582 are not simply
linked to flow rate as BS EN 806-31 but also take account of the length of time which the outlet will
be in use and the outlet's patterns of usage. Therefore, the basis for the value of LUs is significantly
different for BS EN 806-31 compared to the other two sizing methods.
Table 1 displays the LUs for a range of common outlet types for each of the three sizing methods.
The number of LUs for the BS EN 806-31 and Institute of Plumbing3 ‘low use’ columns are identical,
where values are displayed. BS 85582 LUs are similar to those provided by the Institute of
Plumbring3 for ‘medium use’ and therefore appear broadly comparable. In contrast, the Institute of
Plumbing ‘high use’ loading units are significantly higher than either alternative method.
Table 1 Loading Units comparison
BS 8558 LUs BS EN 806-3 LUs IoP LUs
Low Med High
WC flushing cistern 2 1 1 2 5
Wash basin (15mm) 1.5 - 3 1 1 2 4
Sink tap (15mm) 3 2 2 5 10
Bath tap (domestic) - 4 4 8 16
Bath tap (20mm) 10 8 - 11 -
Bath tap (25mm) 22 - - - -
Shower 3 2 2 3 6
Page 9 of 26
2.5 Comparison between conversion charts
All three sizing methods provide a conversion chart to determine a design flow rate for a known
number of loading units. Data from these charts have been used to produce Figure 2, which
illustrates the relationship between flow rate and LUs for each method. The data for BS EN 8061
assumes that the largest single outlet LU was two (i.e. a sink or a shower).
The relationship between LU and flow rate for BS 85582 and the Institute of Plumbing3 is very
similar up to flow rates of 12 l/s, and even after this point the maximum difference is only
approximately 8%. In contrast, the values for BS EN 8061 are extremely different. In Figure 2 it
appears that the flow rate is always lower for any number of loading units for BS EN 8061, however,
for flow rates up to 0.6 l/s, BS EN 8061 has a lower number of LUs than either of the other methods.
This effect can be seen more clearly in Figure 3.

Page 10 of 26
Figure 2 Loading unit to flow rate comparison
The gradient of the trend lines shown in Figure 2 relates directly to the amount of diversity applied
by each method. With no diversity, a doubling of the number of loading units would double the flow
rate. For BS EN 8061 a doubling of LUs from 1000 to 2000 equates to an increase in flow rate of
approximately 51%. Both the Institute of Plumbing3 and BS 85582 methods result in an increase of
approximately 75% over the same range. In other words, within this range, BS EN 8061 provides a
diversity of 49% compared to just 25% for the other two methods.

Page 11 of 26
Figure 3 is formatted to focus on the pipe sections closer to the system outlets i.e. with loading
units less than 280. Additionally in Figure 3 data from BS EN 8061 assuming a largest single outlet
loading unit of 15 (i.e. a DN 20 flush valve), labelled ‘806 LU (15)’, has been added to show the full
extent to which BS EN 8061 may lead to larger pipe sizes closer to the system outlets. This effect
may seem extreme, but there is a clear logic to this approach, namely that the pipe size should be
selected to provide the design flow rate of the largest outlet type served. In practice, this is not likely
to result in different pipe sizes between the sizing methods since high flow rate outlets have larger
pipe connection sizes to suit. Hence, in practice, the pipe sizes close to a large outlet will tend to
be determined by the type and size of outlet rather than what size the sizing methodology suggests.
Figure 3 Loading unit to flow rate comparison near the outlet

Page 12 of 26
The next section sets out the method used to gather empirical data to compare with the flow rate
predictions from each sizing method and outlines the building data used and the assumptions
made.
3.0 Method
A leading UK manufacturer of booster sets kindly provided datasets of flow measurements
recorded at a range of different building types with the intention that these could be used to validate
the data recorded in this study. The largest number of datasets were available for multiunit
residential buildings, and so the decision was taken to record additional data sets for this building
type to generate the largest dataset possible. A number of different multi-storey residential blocks
were initially selected, and following surveys, two were deemed as appropriate case study
buildings. These buildings are named Block A and Block B within this study.
Design flow rates for each block were calculated using each of the three UK sizing methods for
comparison with the measured (empirical) data. To gather the empirical data, it was advantageous
to utilise a non-intrusive flow measurement technique. Therefore a Bell Flow Systems BFU-100M
Ultrasonic Flowmeter was used with the transducers installed in a ‘V’ configuration as illustrated in
Figure 4.
Figure 4 Image showing the installation method of transducers
Page 13 of 26
A Tinytag TGP-0804 Current Input Data Logger was used to record the data at a frequency of 10
seconds. This recording rate enabled data to be gathered for a full week while also being of
sufficiently fine resolution to capture short term peaks in the water flow rate. The recorded current
data was converted to volume flow rate in a spreadsheet and the volume flow rate exceeded for
1% of the measurement period was determined for each block. The additional datasets are
incorporated with the two gathered within this study to validate the study data and therefore
increase confidence in the study conclusions.
3.1 Building Data and Assumptions
Block A is a 26 storey residential block consisting of 125 two bedroom flats. The building dates
from 1966 but has recently benefited by being renovated. The landlord restricts the tenancies to
residents over 55 years of age, and therefore most occupants are retired, which may result in the
use of water being spread relatively evenly throughout the day.
Block B is a 43m tall apartment block with 60 two bedroom flats and 30 single residences. The
building was completed in 1961 although it has also benefitted from the modernisation of individual
flats. The building occupants range in age and employment status and so it may be anticipated that
it will be more likely that there will be morning and evening peaks in the water consumption.
According to the landlord’s records, both buildings were fully let to tenants although it could not be
verified how many people were resident in the buildings during the measurement periods.
Flats in both blocks had the following outlet types installed; shower, WC, wash hand basin, bath,
and kitchen sink. Both blocks use electrically heated DHWS storage vessels within each flat fed
from the incoming DCWS supply. The authours have assumed that showers were to be
thermostatically mixing and fitted with flow limiting devices and that the wash hand basins had
mixer taps fitted. Therefore, only the cold water LUs were accounted for these two outlet types and

Page 14 of 26
DHWS LUs only allocated for the baths and kitchen sinks. These points align with the guidance
given in BS 85582. The ‘low usage’ LU values were utilised for the two sizing methods that offered
a range of values based upon building usage.
Table 2 shows the total number of LUs and the design flow rates calculated using each of the three
UK methods.
The numbers of washing machines and dishwashers could have only been ascertained by a survey
or return of questionnaire from each flat, which time constraints precluded, and therefore these
outlet types were excluded from the analysis. Consequently, the degree of oversizing reported by
this study may be underestimated to some extent.
Table 2 Total loading units and design flow rates for each case study building and method
BS EN 806-3 BS 8558 (non-
peak) IoP (Low)
Block A (LUs) 2,000 4,062 2,000
Block B (LUs) 1,440 2,925 1,440
Block A design volume flow rate (l/s)
5.3 19.9 11.0
Block B design volume flow rate (l/s)
4.3 14.8 8.4
4.0 Data Analysis
This section presents the recorded volume flow rate data from Blocks A and B, and on each graph,
a broken red line indicates the measured volume flow rate exceeded 1% of the measurement time.
As discussed earlier in section 2.0, all three sizing methods use a probability analysis which is
designed to return a design value that statistically will be exceeded for 1% of the time.
Page 15 of 26
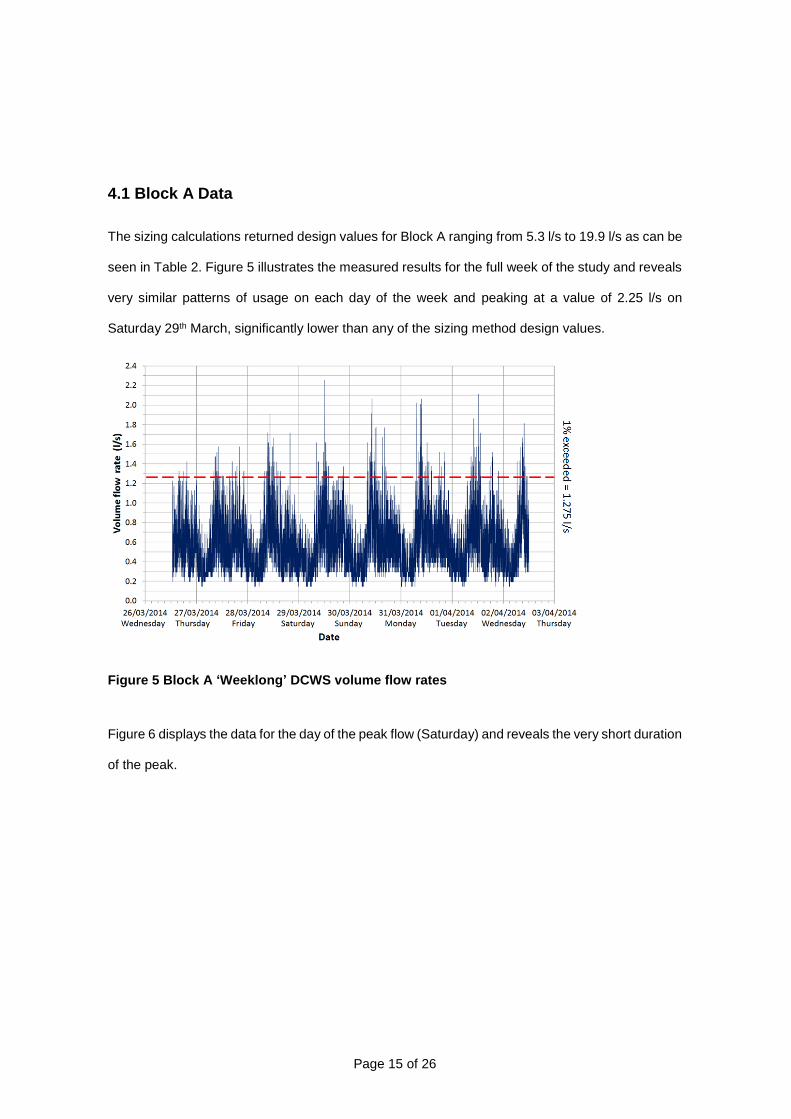
4.1 Block A Data
The sizing calculations returned design values for Block A ranging from 5.3 l/s to 19.9 l/s as can be
seen in Table 2. Figure 5 illustrates the measured results for the full week of the study and reveals
very similar patterns of usage on each day of the week and peaking at a value of 2.25 l/s on
Saturday 29th March, significantly lower than any of the sizing method design values.
Figure 5 Block A ‘Weeklong’ DCWS volume flow rates
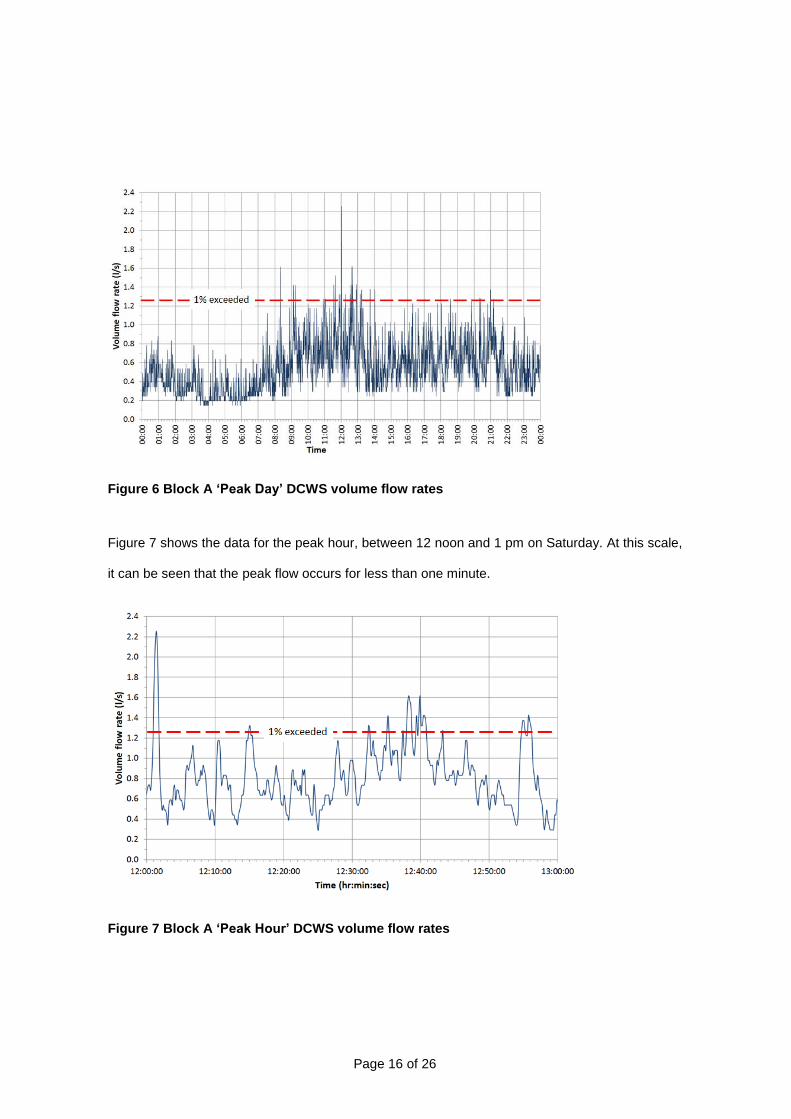
Figure 6 displays the data for the day of the peak flow (Saturday) and reveals the very short duration
of the peak.
Page 16 of 26
Figure 6 Block A ‘Peak Day’ DCWS volume flow rates
Figure 7 shows the data for the peak hour, between 12 noon and 1 pm on Saturday. At this scale,
it can be seen that the peak flow occurs for less than one minute.
Figure 7 Block A ‘Peak Hour’ DCWS volume flow rates

Page 17 of 26
4.2 Block B Data
The sizing methods returned design values ranging from 4.3 l/s to 14.8 l/s for Block B as displayed
in Table 2. Figure 8 illustrates the measured results for the full week of the study and reveals more
variability in the day to day patterns of usage than Block A. The peak value of approximately 1.3 l/s
on Friday 4th April is again significantly lower than any of the sizing method design values.
Figure 8 Block B ‘Weeklong’ DCWS volume flow rates
Figure 9 shows the data for the peak hour between 8 am and 9 am on Friday and reveals two
similar peak values around five minutes apart.

Page 18 of 26
Figure 9 Block B ‘Peak Hour’ DCWS volume flow rates
4.3 Design vs. measured peak volume flow rates
Figure 10 displays the variance between the design volume flow rate calculated using the three UK
sizing methods and both the measured peak for each block as well as the 1% exceeded flow rate.
BS EN 8061 returns a design flow rate significantly lower than the Institute of Plumbing guide3 which
is itself much lower than that returned by BS 85582. Even the BS EN 8061 design values are 233%
greater than the measured peak for Block A and 331% greater for Block B. Arguably the fair
comparison should be with the 1% exceeded flow rate, and this takes the percentage increases to
412% for Block A and 488% for Block B.

Page 19 of 26
Figure 10 Design vs. recorded peak values
5.0 Validation
DCWS volume flow rate data sets for seven multi-unit residential buildings were provided by a
leading UK manufacturer of booster sets for the purpose of validating the data from this study.
Data for each building was recorded for one week using an ultrasonic flow meter. The details of
the buildings are shown inTable 3 along with the calculated total number of LUs.
Page 20 of 26
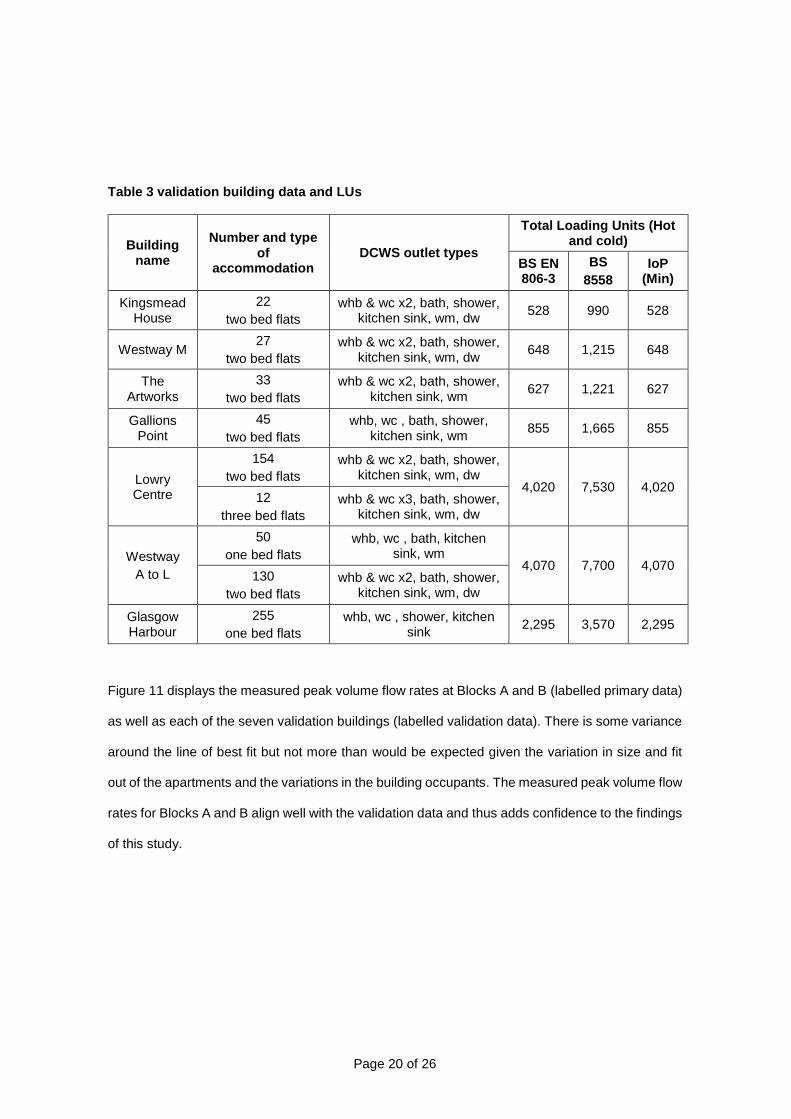
Table 3 validation building data and LUs
Building name
Number and type of
accommodation DCWS outlet types
Total Loading Units (Hot and cold)
BS EN 806-3
BS
8558
IoP (Min)
Kingsmead House
22
two bed flats
whb & wc x2, bath, shower, kitchen sink, wm, dw
528 990 528
Westway M 27
two bed flats
whb & wc x2, bath, shower, kitchen sink, wm, dw
648 1,215 648
The Artworks
33
two bed flats
whb & wc x2, bath, shower, kitchen sink, wm
627 1,221 627
Gallions Point
45
two bed flats
whb, wc , bath, shower, kitchen sink, wm
855 1,665 855
Lowry Centre
154
two bed flats
whb & wc x2, bath, shower, kitchen sink, wm, dw
4,020 7,530 4,020 12
three bed flats
whb & wc x3, bath, shower, kitchen sink, wm, dw
Westway
A to L
50
one bed flats
whb, wc , bath, kitchen sink, wm
4,070 7,700 4,070 130
two bed flats
whb & wc x2, bath, shower, kitchen sink, wm, dw
Glasgow Harbour
255
one bed flats
whb, wc , shower, kitchen sink
2,295 3,570 2,295
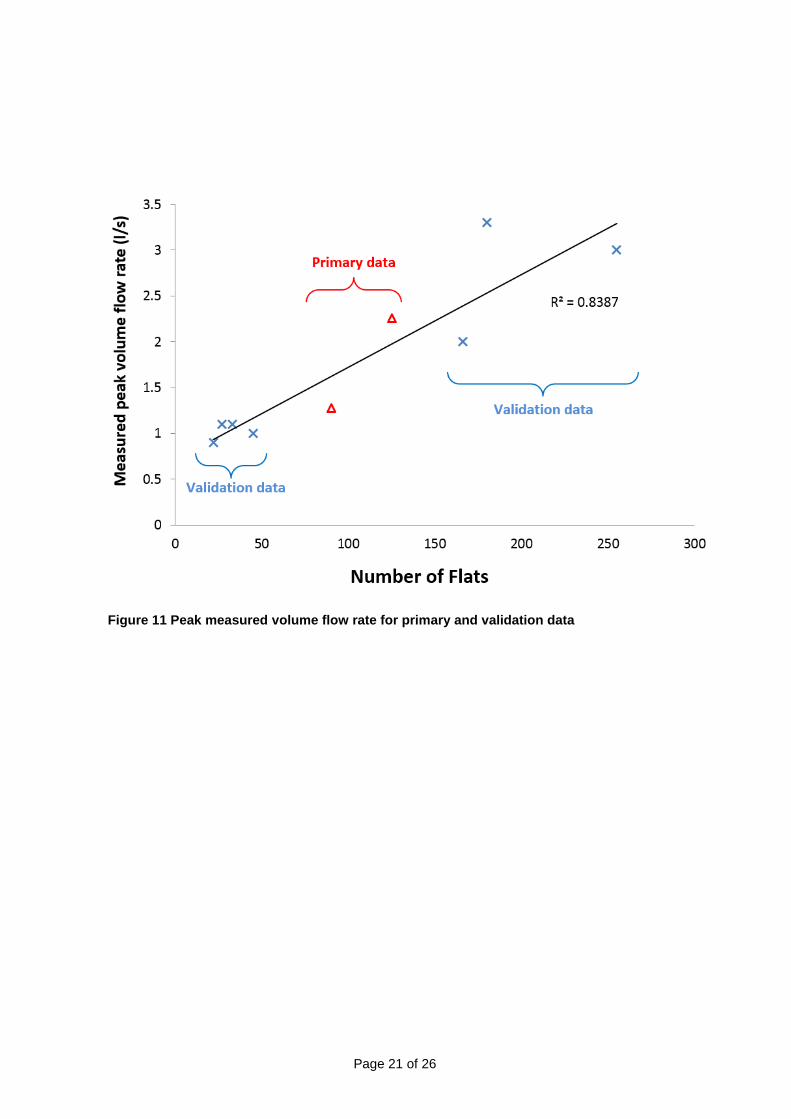
Figure 11 displays the measured peak volume flow rates at Blocks A and B (labelled primary data)
as well as each of the seven validation buildings (labelled validation data). There is some variance
around the line of best fit but not more than would be expected given the variation in size and fit
out of the apartments and the variations in the building occupants. The measured peak volume flow
rates for Blocks A and B align well with the validation data and thus adds confidence to the findings
of this study.
Page 21 of 26
Figure 11 Peak measured volume flow rate for primary and validation data

Page 22 of 26
Figure 12 displays the measured peak and the design flow rates for each of the three UK sizing
methods for Blocks A and B and the seven validation buildings.
Figure 12 Peak and design volume flow rates for all buildings
It is evident that BS EN 806-31 is the best of the three UK sizing methods for predicting DCWS
volume flow rates for multi-unit residential buildings on two grounds. Firstly, the predicted volume
flow rate is closer than those returned by the other two methods for all buildings in the study.
Secondly, the gradient of the line of best fit is almost parallel to that for the measured data. This
should mean that BS EN 806-31 can be used for larger residential projects without excessively
oversizing the pipework. The same cannot be said of the IoP3 and BS 85582 methods both of which
indicate, due to the gradient of the lines of best fit, that as the size of the development increases
so will the margin of error.
It is interesting to note that there is significantly less variance from the line of best fit for the
measured data compared to the sizing method trend lines. Focusing on the three buildings to the

Page 23 of 26
right-hand side of Figure 12 it can be seen that the first two from the left (Lowry Centre and Westway
A to L) are both well above the trend lines while the one to the extreme right (Glasgow Harbour) is
well below. The apartments at the Lowry Centre and Westway A to L developments are mainly two
bedrooms and have two WC’s and baths, whereas those at Glasgow Harbour are exclusively one
bedroom, have just one WC and showers instead of baths. Whether an apartment has two separate
WC’s or one will not affect the overall use of WCs, rather the occupancy rate will be the more
important factor. In addition, bath taps have large LU’s and are not frequently used and this appears
to have contributed to the higher predicted design flow rates for the Lowry Centre and Westway A
to L. In combination, these facts explain the variance in the predicted design flow rates shown in
Figure 12. Therefore, if design flow rate calculation methods are to be made more accurate in future
they will need to take into account the number of occupants and their preferences rather than
focusing entirely upon the number and type of outlets. It is interesting to note that Danish Standard
DS 4396 bases the heating required for DHWS purely upon the number of dwellings, a method that
the data from this study would support.
6.0 Conclusion
This study has shown that the three UK DCWS sizing methods make different assumptions
regarding the generation of Loading Units, and they differ regarding the amount of diversity applied
when converting the number of LUs into a design volume flow rate. BS EN 8061 applies significantly
greater diversity once the number of loading units exceeds 50, i.e. away from the final pipe runs to
the outlets. This greater diversity appears to closely match the empirical data from this study which
makes BS EN 8061 suitable for use for very large projects without excessively overestimating the
design flow rate.

Page 24 of 26
BS EN 8061 has been shown to provide the closest design values for the residential buildings within
this study. There is still a significant margin between the measured peak flow rates and the design
values, and so this should help designers to feel confident in applying this method rather than either
the Institute of Plumbing guidance3 or BS 85582.
Finally, it would be wise for Engineers to consider carefully what the likely range of actual flow rates
for a project is likely to be given the data presented in this study. All three sizing methods
overestimated the design flow rates for the multi-unit residential buildings, and this knowledge
should influence decisions such as the selection and specification of booster sets.
These findings should be welcome news for all Building Services Engineers who are interested in
narrowing the design to operation performance gap.
7.0 Reference list
1. Institution BS. BS EN 806-3 Specifications for installations inside buildings
conveying water for human consumption – Part 3: Pipe sizing – Simplified method.
. London: British Standards Institution, 2006.
2. Institution BS. BS 8558 Guide to the design, installation, testing and
maintenance of services for supplying water for domestic use within buildings and
their curtilages - Complementary guidance to BS EN 806. British Standards
Institution, 2015.
Page 25 of 26
3. Plumbing TIo. Plumbing Engineering Services Design Guide. Hornchurch:
The Institute of Plumbing, 2002.
4. CIBSE. CIBSE AM12 Combined heat and power for buildings. 2013.
5. Institution BS. BS 6700 Design, installation, testing and maintenance of
services supplying water for domestic use within buildings and their curtilages -
Specification. London: British Standards Institution, 2006.
6. Standard D. DS 439 Code of Practice for domestic water supply
installations. Denmark2009.
7. Agudelo-Vera C SW, Pieterse-Quirijns I, Blokker M. . New Method to Design
Domestic Water Systems. . REHVA Journal. 2013: 12-6.
8. Wong L MK. Stochastic Modelling of Water Demand by Domestic
Washrooms in Residential Tower Blocks. Water and Environment Journal. 2008:
125-30.
9. ASHRAE. Handbook; HVAC Applications. Atlanta: ASHRAE, 2011.

Page 26 of 26
10. Oliveira L CL, Goncalves O, Massolino P. Modelling of Water Demand in
Building Supply Systems using Fuzzy Logic. Building Services Engineering
Research and Technology. 2011; 34: 145-63.
11. Pieterse-Quirijns J BH, Van Der Schee W. Validation of design rules for
peak demand values and hot water use in non-residential buildings. In: Afonso
PDABS, (ed.). Proceedings of 37th International Symposium CIB W062 on Water
Supply and Drainage for Buildings. Aveiro, Portugal2011, p. 86-92.
12. Hunter R. Methods of Estimating Loads in Plumbing Systems. National
Bureau of Standards. 1940.
13. Chartered Institution of Building Services Engineers. CIBSE guide. G,
Public health engineering. [2nd ed. London: CIBSE, 2004, p.1 v. [various pagings].
8.0 List of figures
Figure 2 BS EN 806-3(1) Fig B.1 Loading units to design volume flow rate .................................. 7 Figure 2 Loading unit to flow rate comparison ............................................................................... 10 Figure 3 Loading unit to flow rate comparison near the outlet ...................................................... 11 Figure 4 Image showing the installation method of transducers ................................................... 12 Figure 5 Block A ‘Weeklong’ DCWS volume flow rates ................................................................. 15 Figure 6 Block A ‘Peak Day’ DCWS volume flow rates ................................................................. 16 Figure 7 Block A ‘Peak Hour’ DCWS volume flow rates ................................................................ 16 Figure 8 Block B ‘Weeklong’ DCWS volume flow rates ................................................................. 17 Figure 9 Block B ‘Peak Hour’ DCWS volume flow rates ................................................................ 18 Figure 10 Design vs. recorded peak values .................................................................................. 19 Figure 11 Peak measured volume flow rate for primary and validation data ................................ 21 Figure 12 Peak and design volume flow rates for all buildings ..................................................... 22
Recommended