A Contribution to the A Contribution to the Global Measurement Global Measurement
of the ICT Sector: of the ICT Sector: ALETI CensusALETI Census
November 13th, 2013GPATS 2013
São Paulo – SP - Brazil
Initial Diagnosis
• In-depth indicators about the IT Sector do not exist• Few existing data do not allow for comparison among
geographic areas, both inside the country and internationally• Governments’ data:
– Focus just on revenues and employment• Due to being derived from tax and labour declarations
• Global Market Research Companies:– Focus on Sales of ICT products and services– Local ICT industry covered only partially
• Mostly to find business partners for huge global players
First Stated in writing during Assespro Nacional Strategic Planning
developed November 2010
Our Goals
• Deep Understanding of the ICT Sector– As has never been available– Be able to evaluate Public Policies
• When being developed/proposed by governments• Monitor their impact over time when implemented
• Knowledge and action in benefit of associations´ members– Benchmarking– Matchmaking– Business Opportunities Generation
Our Strategy
• Totally focused on Producers/Resellers of ICT Goods and Services
• Questionnaire Size– Bigger than any commercial survey– Doesn't impact on effort to push for participation – Web data collection
• Respondents: Company owners and Chief-Level executives– By going through Associations, direct access to them– Warrants high quality of data collected
• Data Collection gets Repeated every year– Allow for development of historical series
Pilot Round
• Assespro Nacional’s Board – Structured the project during 2011– To be run only in Brazil, as a ‘pilot project’– But planned to be expanded to other countries
• Called “Censo Assespro do Setor de TI”– First round of data collection
& analysis during 2012
Public Policy: A practical case
• Brazilian Science and Technology Ministry launched “TI Maior” (‘Bigger IT’) program Aug/2012– One of proposed measures:
• Develop a new national certification process (“CerTICs”) – Aimed at certifying
“local development of innovative products”– Certified products would receive 25% of margin of preference for
procurement by the Brazilian Federal Government
– Details not known during Census preparation, but able to evaluate:• Which companies would benefit• Real size of market impact
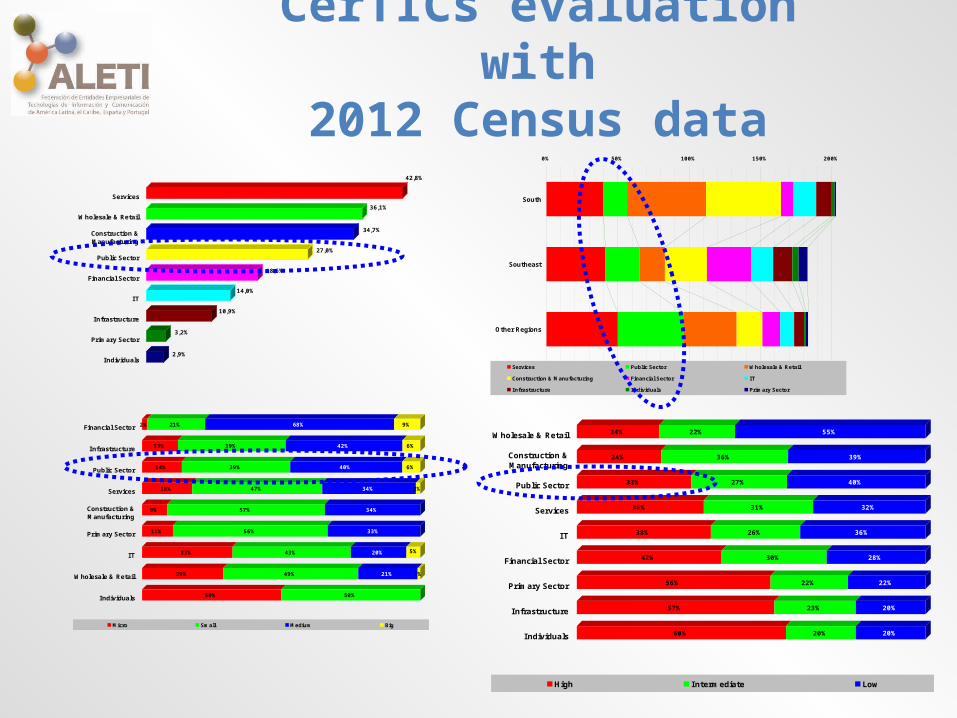
CerTICs evaluation with2012 Census data
2,9%
3,2%
10,9%
14,0%
18,6%
27,0%
34,7%
36,1%
42,8%
Services
Wholesale & Retail
Construction &Manufacturing
Public Sector
Financial Sector
IT
Infrastructure
Primary Sector
Individuals
0% 50% 100% 150% 200%
Other Regions
Southeast
South
Services Public Sector Wholesale & Retail
Construction & Manufacturing Financial Sector IT
Infrastructure Individuals Primary Sector
50% 50%
29% 49% 21% 1%
33% 43% 20% 5%
11% 56% 33%
9% 57% 34%
18% 47% 34% 2%
14% 39% 40% 6%
13% 39% 42% 6%
2% 21% 68% 9%
Individuals
Wholesale & Retail
IT
Primary Sector
Construction &Manufacturing
Services
Public Sector
Infrastructure
Financial Sector
Micro Small Medium Big
60% 20% 20%
57% 23% 20%
56% 22% 22%
42% 30% 28%
38% 26% 36%
36% 31% 32%
33% 27% 40%
24% 36% 39%
24% 22% 55%
Individuals
Infrastructure
Primary Sector
Financial Sector
IT
Services
Public Sector
Construction &Manufacturing
Wholesale & Retail
High Intermediate Low
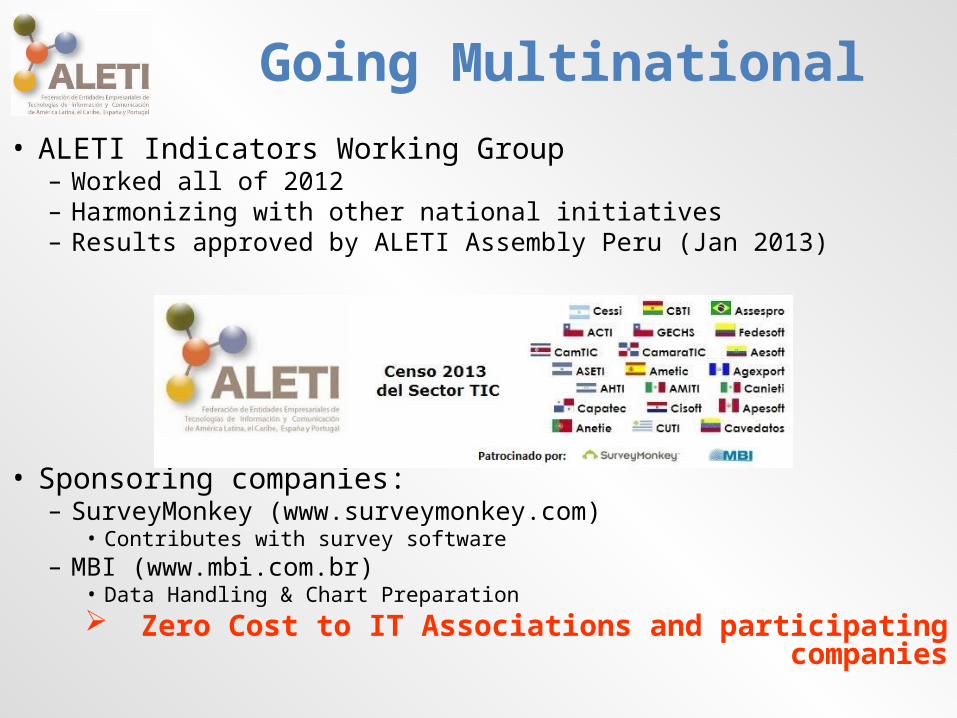
• ALETI Indicators Working Group– Worked all of 2012– Harmonizing with other national initiatives– Results approved by ALETI Assembly Peru (Jan 2013)
• Sponsoring companies:– SurveyMonkey (www.surveymonkey.com)
• Contributes with survey software– MBI (www.mbi.com.br)
• Data Handling & Chart Preparation Zero Cost to IT Associations and participating companies
Going Multinational
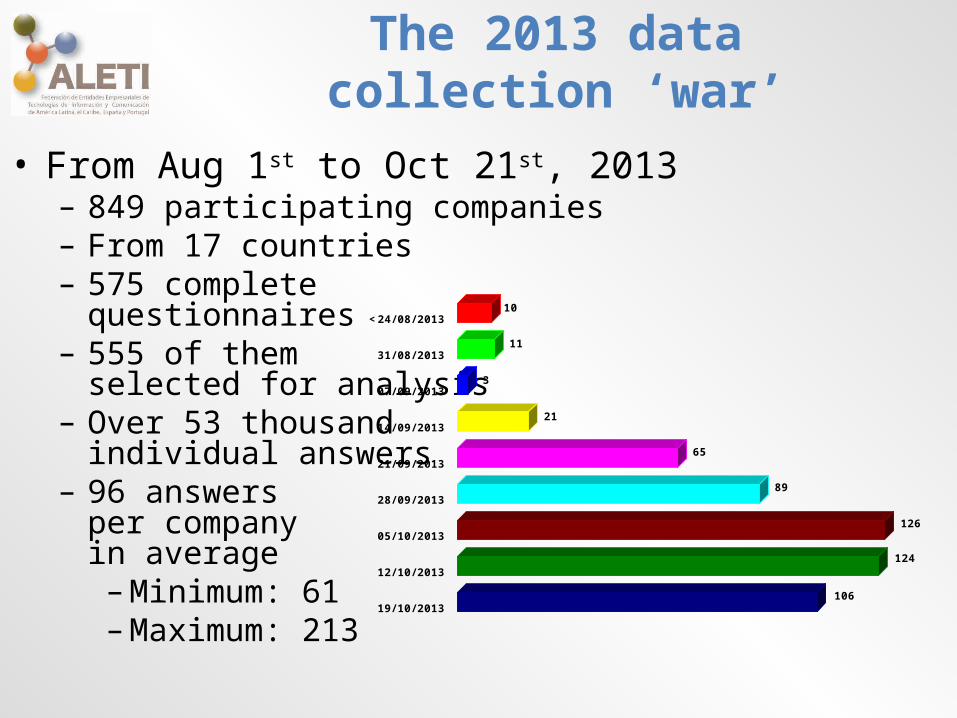
The 2013 data collection ‘war’
• From Aug 1st to Oct 21st, 2013– 849 participating companies– From 17 countries– 575 complete
questionnaires– 555 of them
selected for analysis– Over 53 thousand
individual answers– 96 answers
per company in average–Minimum: 61–Maximum: 213
106
124
126
89
65
21
3
11
10<24/ 08/ 2013
31/ 08/ 2013
07/ 09/ 2013
14/ 09/ 2013
21/ 09/ 2013
28/ 09/ 2013
05/ 10/ 2013
12/ 10/ 2013
19/ 10/ 2013
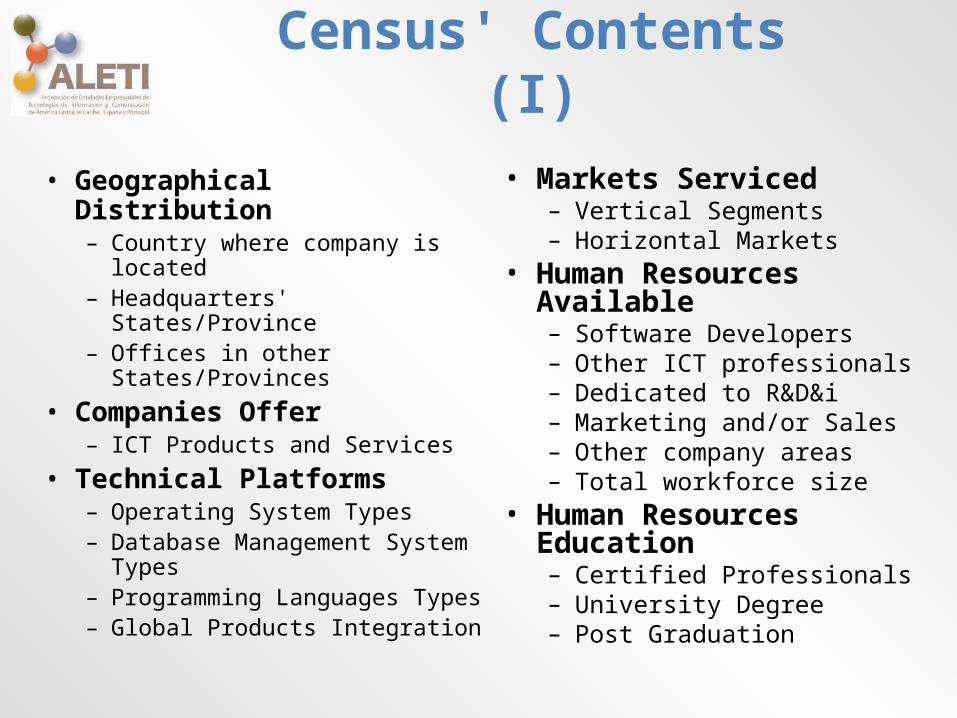
Census' Contents (I)
• Geographical Distribution– Country where company is
located– Headquarters' States/Province– Offices in other States/Provinces
• Companies Offer– ICT Products and Services
• Technical Platforms– Operating System Types– Database Management System
Types– Programming Languages Types– Global Products Integration
• Markets Serviced– Vertical Segments– Horizontal Markets
• Human Resources Available– Software Developers– Other ICT professionals– Dedicated to R&D&i– Marketing and/or Sales– Other company areas– Total workforce size
• Human Resources Education– Certified Professionals– University Degree– Post Graduation
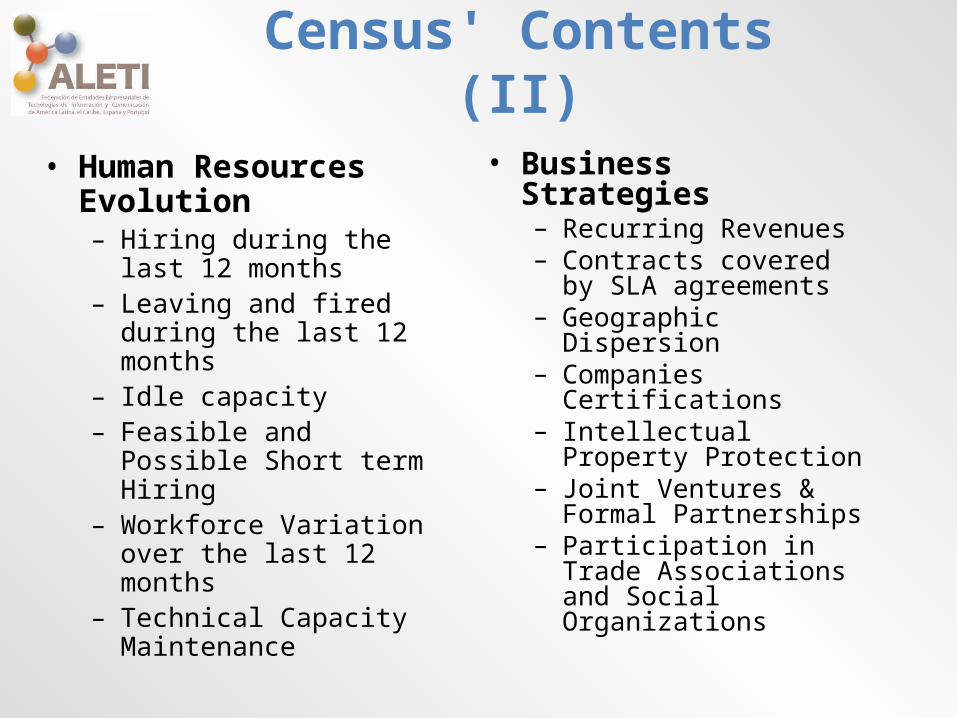
Census' Contents (II)
• Human Resources Evolution– Hiring during the last 12
months– Leaving and fired during the
last 12 months– Idle capacity– Feasible and Possible Short
term Hiring– Workforce Variation over the
last 12 months– Technical Capacity
Maintenance
• Business Strategies– Recurring Revenues– Contracts covered by SLA
agreements– Geographic Dispersion– Companies Certifications– Intellectual Property
Protection– Joint Ventures & Formal
Partnerships– Participation in Trade
Associations and Social Organizations
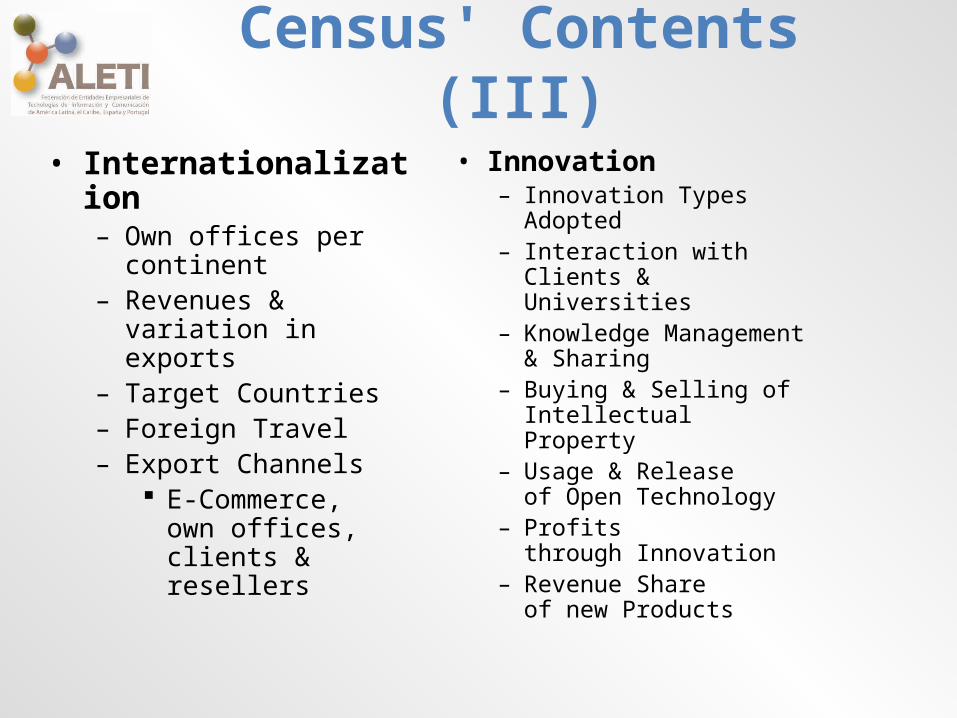
Census' Contents (III)
• Internationalization– Own offices per continent– Revenues & variation in
exports– Target Countries– Foreign Travel– Export Channels
E-Commerce, own offices, clients & resellers
• Innovation– Innovation Types
Adopted– Interaction with
Clients & Universities– Knowledge Management
& Sharing– Buying & Selling of
Intellectual Property– Usage & Release
of Open Technology– Profits
through Innovation– Revenue Share
of new Products
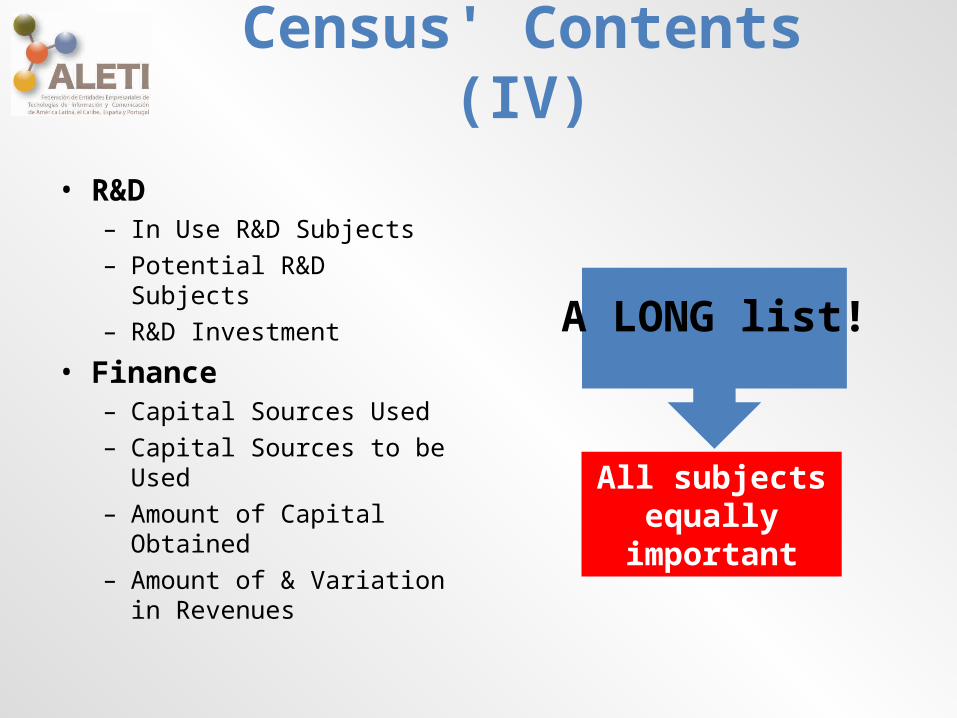
Census' Contents (IV)
• R&D– In Use R&D Subjects– Potential R&D Subjects– R&D Investment
• Finance– Capital Sources Used– Capital Sources to be Used– Amount of Capital Obtained– Amount of & Variation in
Revenues
All subjects equally important
A LONG list!
Designing Answers
• Usage of ranges instead of values– Easier to get answers– Range averages are more precise
• Based on standard classification systems– E.g. vertical markets, R&D subjects
• Need to be simultaneously:– Sufficiently detailed to allow for matchmaking– Structured to be grouped during analysis– In case specific answers are not selected
frequently enough to be statistically significant
Cross Analysis
• Understanding relations between apparently unrelated aspects
• Frequently reveals ‘pearls’ of wisdom• Let’s see TWO examples:– Which size of companies are the most aggressive
innovators?– How does R & D budget relate to the adoption of
open source technologies?
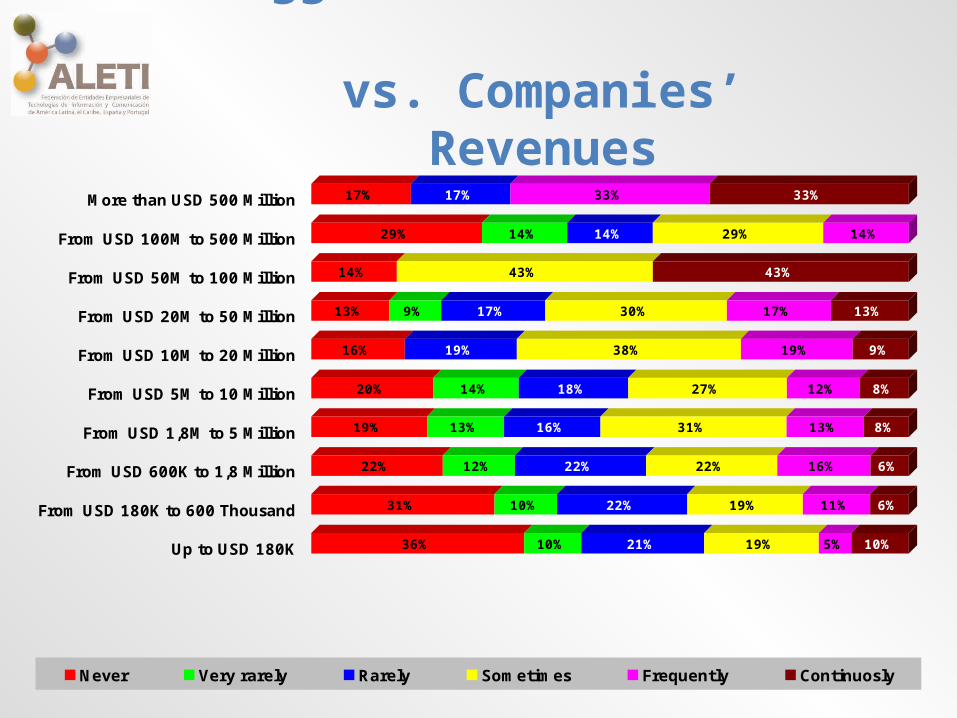
Aggressive Innovation vs. Companies’ Revenues
36% 10% 21% 19% 5% 10%
31% 10% 22% 19% 11% 6%
22% 12% 22% 22% 16% 6%
19% 13% 16% 31% 13% 8%
20% 14% 18% 27% 12% 8%
16% 19% 38% 19% 9%
13% 9% 17% 30% 17% 13%
14% 43% 43%
29% 14% 14% 29% 14%
17% 17% 33% 33%
Up to USD 180K
From USD 180K to 600 Thousand
From USD 600K to 1,8 Million
From USD 1,8M to 5 Million
From USD 5M to 10 Million
From USD 10M to 20 Million
From USD 20M to 50 Million
From USD 50M to 100 Million
From USD 100M to 500 Million
More than USD 500 Million
Never Very rarely Rarely Sometimes Frequently Continuosly
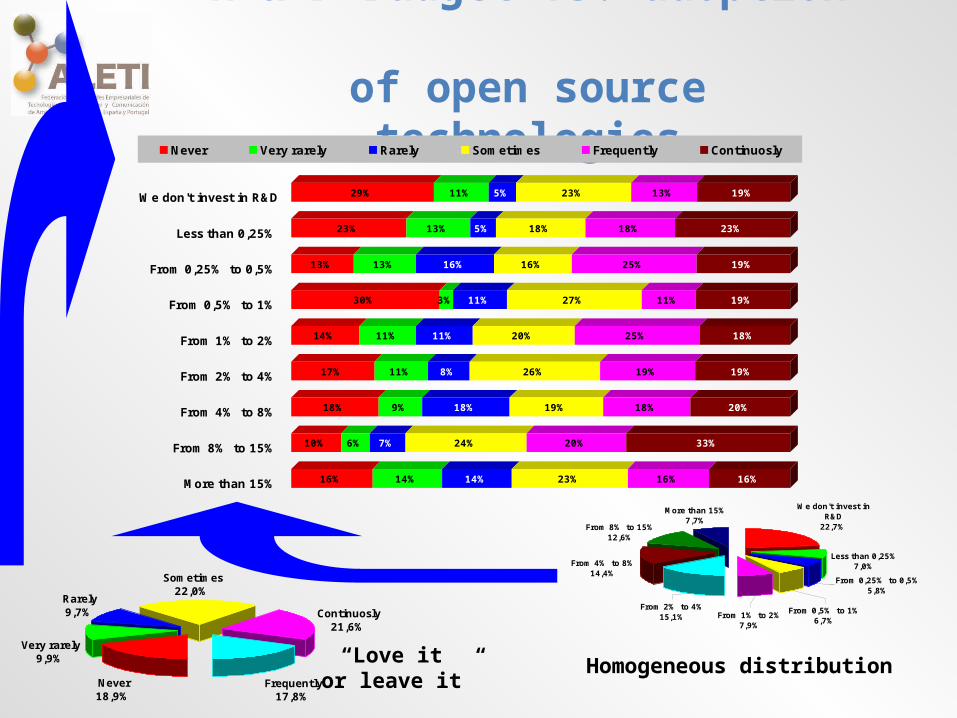
R & D Budget vs. adoption of open source technologies
16% 14% 14% 23% 16% 16%
10% 6% 7% 24% 20% 33%
18% 9% 18% 19% 18% 20%
17% 11% 8% 26% 19% 19%
14% 11% 11% 20% 25% 18%
30% 3% 11% 27% 11% 19%
13% 13% 16% 16% 25% 19%
23% 13% 5% 18% 18% 23%
29% 11% 5% 23% 13% 19%We don't invest in R&D
Less than 0,25%
From 0,25% to 0,5%
From 0,5% to 1%
From 1% to 2%
From 2% to 4%
From 4% to 8%
From 8% to 15%
More than 15%
Never Very rarely Rarely Sometimes Frequently Continuosly
We don't invest in R&D
22,7%
More than 15%7,7%
From 8% to 15%12,6%
From 4% to 8%14,4%
From 2% to 4%15,1%
From 0,25% to 0,5%5,8%
Less than 0,25%7,0%
From 0,5% to 1%6,7%
From 1% to 2%7,9%
Never18,9%
Very rarely9,9%
Rarely9,7%
Sometimes22,0%
Continuosly21,6%
Frequently17,8%
“Love it or leave it”
Homogeneous distribution
Subset Analysis
• Based on considering subset of companies with a specific answer to a specific question
• Examples:– Are revenues of companies betting on mobile
platforms higher or lower than the sector’s average?
– Do companies offering Software as a Service export more or less than average?
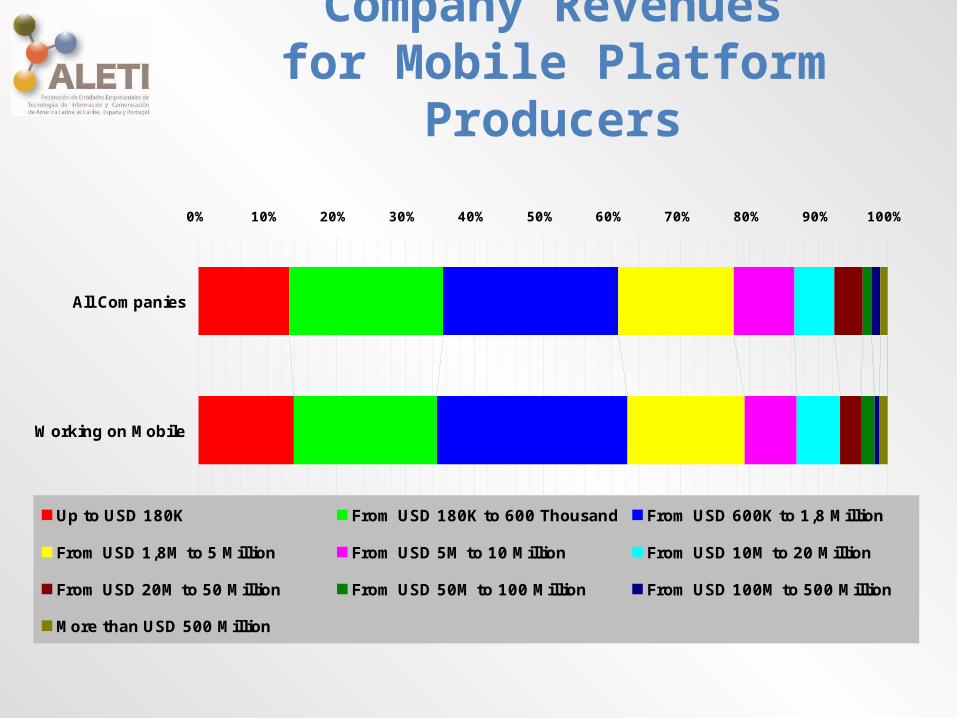
Company Revenuesfor Mobile Platform Producers
0% 10% 20% 30% 40% 50% 60% 70% 80% 90% 100%
Working on Mobile
All Companies
Up to USD 180K From USD 180K to 600 Thousand From USD 600K to 1,8 Million
From USD 1,8M to 5 Million From USD 5M to 10 Million From USD 10M to 20 Million
From USD 20M to 50 Million From USD 50M to 100 Million From USD 100M to 500 Million
More than USD 500 Million
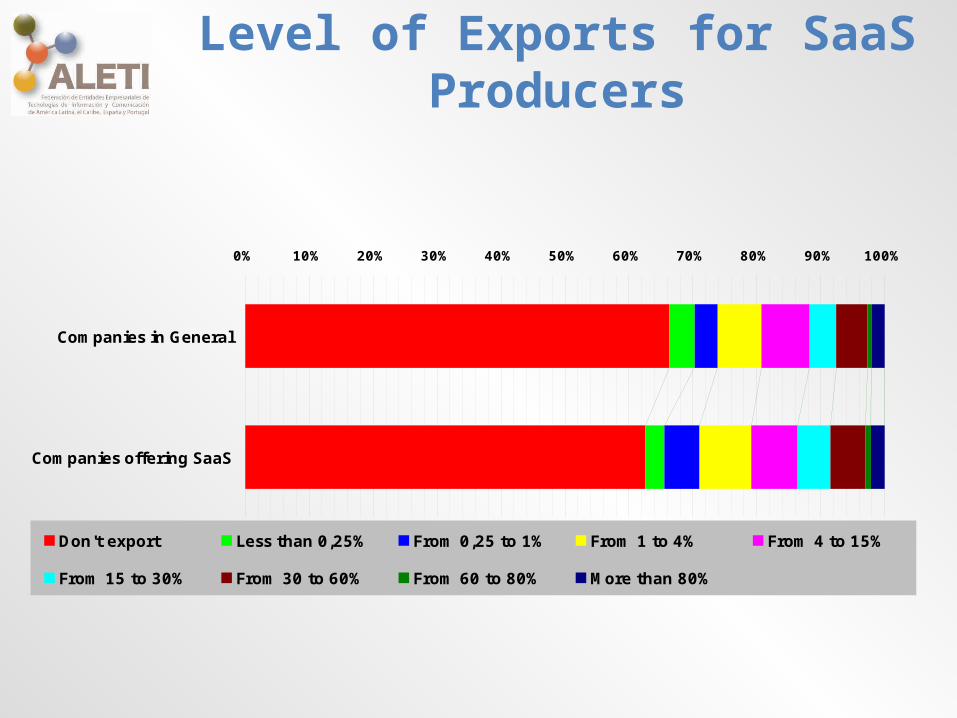
Level of Exports for SaaS Producers
0% 10% 20% 30% 40% 50% 60% 70% 80% 90% 100%
Companies offering SaaS
Companies in General
Don't export Less than 0,25% From 0,25 to 1% From 1 to 4% From 4 to 15%
From 15 to 30% From 30 to 60% From 60 to 80% More than 80%
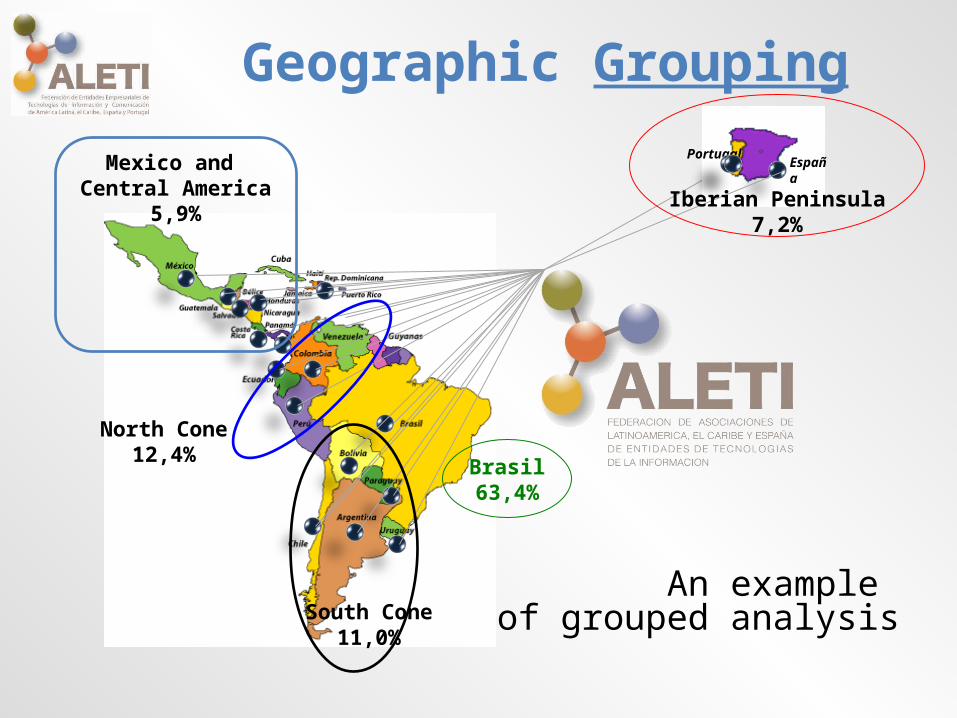
Geographic GroupingPortugal
España
Iberian Peninsula7,2%
Brasil63,4%
South Cone11,0%
North Cone12,4%
Mexico and Central America
5,9%
An example of grouped analysis
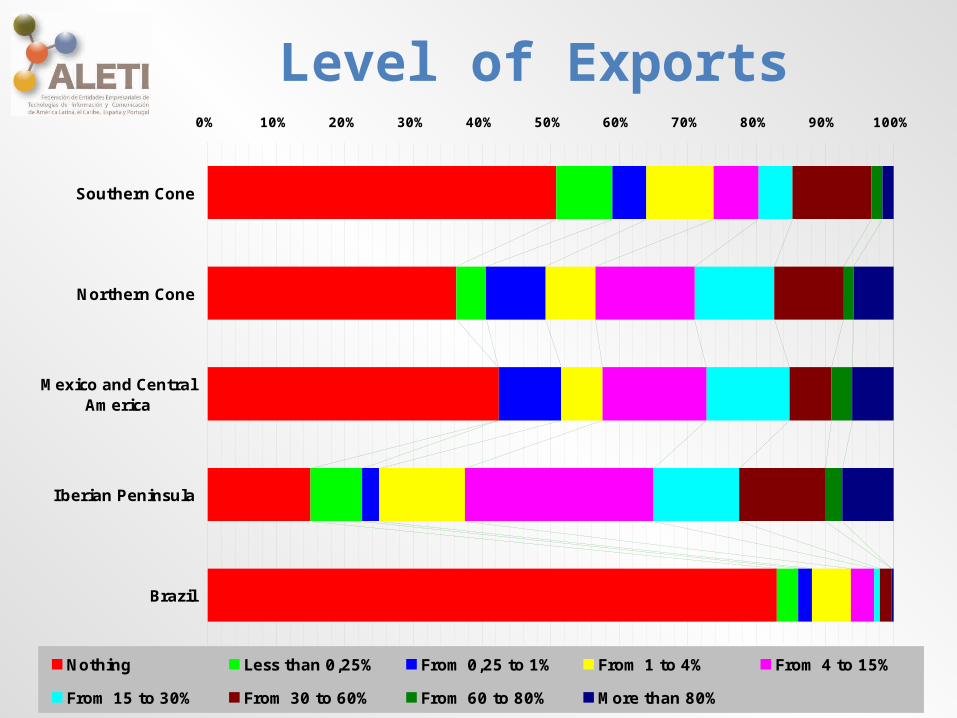
Level of Exports0% 10% 20% 30% 40% 50% 60% 70% 80% 90% 100%
Brazil
Iberian Peninsula
Mexico and CentralAmerica
Northern Cone
Southern Cone
Nothing Less than 0,25% From 0,25 to 1% From 1 to 4% From 4 to 15%
From 15 to 30% From 30 to 60% From 60 to 80% More than 80%
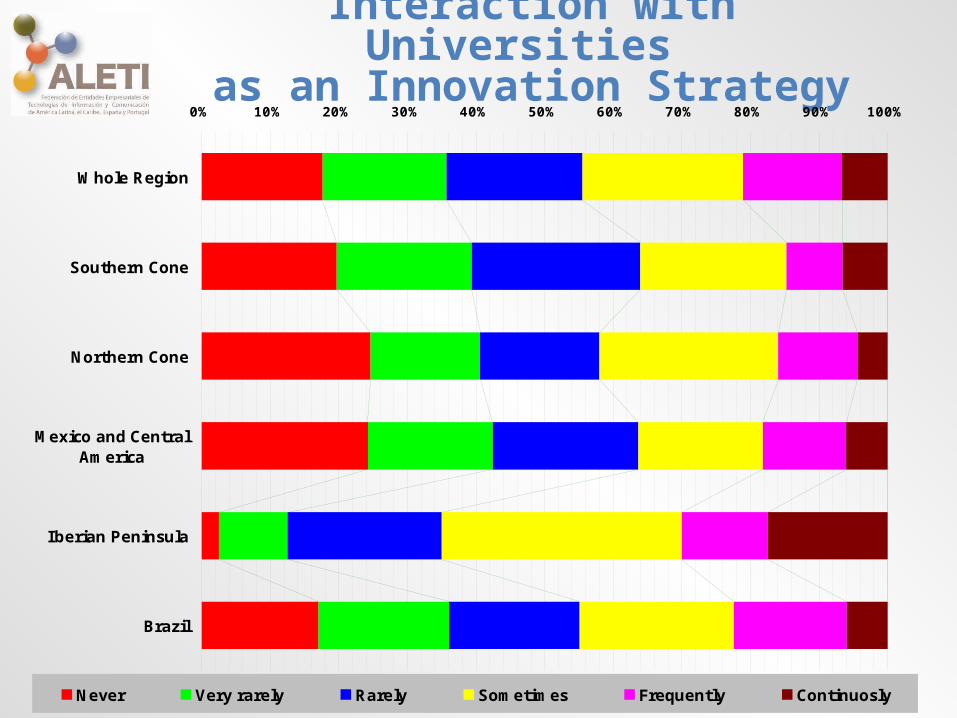
Interaction with Universities as an Innovation Strategy
0% 10% 20% 30% 40% 50% 60% 70% 80% 90% 100%
Brazil
Iberian Peninsula
Mexico and CentralAmerica
Northern Cone
Southern Cone
Whole Region
Never Very rarely Rarely Sometimes Frequently Continuosly
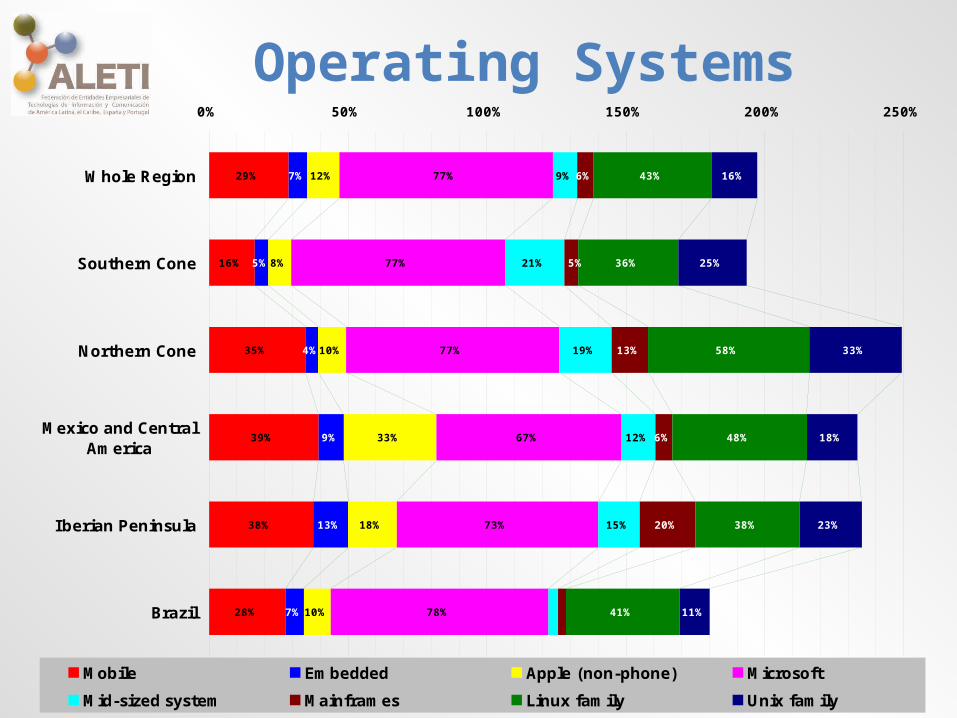
Operating Systems
28%
38%
39%
35%
16%
29%
7%
13%
9%
4%
5%
7%
10%
18%
33%
10%
8%
12%
78%
73%
67%
77%
77%
77%
15%
12%
19%
21%
9%
20%
6%
13%
6%
41%
38%
48%
58%
36%
43%
11%
23%
18%
33%
25%
16%
5%
0% 50% 100% 150% 200% 250%
Brazil
Iberian Peninsula
Mexico and CentralAmerica
Northern Cone
Southern Cone
Whole Region
Mobile Embedded Apple (non-phone) Microsoft
Mid-sized system Mainframes Linux family Unix family
Census’ Data Sharing Policy
• Because of:– Huge number of possible analysis
• Much bigger than IT associations resources– Wider usage of data brings wider recognition
• Census database is shared with interested:– Governments– Universities– Research Centers– International and Multilateral Organizations– Plus other non-profit organizations
• Free of Charge– We just ask for the signature of a simple MOU
Next Goals
• Grow number of participating companies – During each annual rollout
• Grow number of participating countries– Including new geographic areas
WITSA is our natural ‘network hub’
Thank you!
• WITSA Board Member (2012-2014)ALETI President (2011-2013)Assespro Nacional Vice-President (2011-2014)Assespro São Paulo President (2007-2010)Assespro São Paulo Director (2003-2006)Columnist at Information Week Brasil (since 1999)M.Sc. In Computer Science at São Paulo University (USP) - 1992Founder & CEO at MBI – since 1990Former University Professor in Computer Science (USP) - 1988-1998Working in IT since 1979
Roberto C. [email protected]
Recommended


![[GPATS 2013] Makoto (Mac) Yokozawa - Cyber Immune Systems That Helps Trust and Reliability, Helped By Cross Boarder Corporation](https://img.pdfslide.net/doc/110x75/545ca436b1af9f280a8b480f/gpats-2013-makoto-mac-yokozawa-cyber-immune-systems-that-helps-trust-and-reliability-helped-by-cross-boarder-corporation.jpg)

![[GPATS 2013 ] Bernd FRIEDRICH and Milena SEIBOLD - Measuring the IT Industry Globally the itib approach v0.4](https://img.pdfslide.net/doc/110x75/54532c19b1af9f7f248b57a3/gpats-2013-bernd-friedrich-and-milena-seibold-measuring-the-it-industry-globally-the-itib-approach-v04.jpg)


![[GPATS 2013] Luís Stein - Free Trade Policies in ICT Goods and Services](https://img.pdfslide.net/doc/110x75/545ca3e7af7959be0e8b48ae/gpats-2013-luis-stein-free-trade-policies-in-ict-goods-and-services.jpg)

