Cankaya et al. Earth, Planets and Space (2016) 68:133 DOI 10.1186/s40623-016-0507-0
FULL PAPER
A new GIS-based tsunami risk evaluation: MeTHuVA (METU tsunami human vulnerability assessment) at Yenikapı, IstanbulZeynep Ceren Cankaya1, Mehmet Lutfi Suzen1, Ahmet Cevdet Yalciner2*, Cagil Kolat3, Andrey Zaytsev4,5 and Betul Aytore2
Abstract
Istanbul is a mega city with various coastal utilities located on the northern coast of the Sea of Marmara. At Yenikapı, there are critical vulnerable coastal utilities, structures, and active metropolitan life. Fishery ports, commercial ports, small craft harbors, passenger terminals of intercity maritime transportation, waterfront commercial and/or recrea-tional structures with residential/commercial areas and public utility areas are some examples of coastal utilization that are vulnerable to marine disasters. Therefore, the tsunami risk in the Yenikapı region is an important issue for Istanbul. In this study, a new methodology for tsunami vulnerability assessment for areas susceptible to tsunami is proposed, in which the Yenikapı region is chosen as a case study. Available datasets from the Istanbul Metropolitan Municipality and Turkish Navy are used as inputs for high-resolution GIS-based multi-criteria decision analysis (MCDA) evaluation of tsunami risk in Yenikapı. Bathymetry and topography database is used for high-resolution tsunami numerical modeling where the tsunami hazard, in terms of coastal inundation, is deterministically computed using the NAMI DANCE numerical code, considering earthquake worst case scenarios. In order to define the tsunami human vulnerability of the region, two different aspects, vulnerability at location and evacuation resilience maps were created using the analytical hierarchical process (AHP) method of MCDA. A vulnerability at location map is composed of metropolitan use, geology, elevation, and distance from shoreline layers, whereas an evacuation resilience map is formed by slope, distance within flat areas, distance to buildings, and distance to road networks layers. The tsunami risk map is then computed by the proposed new relationship which uses flow depth maps, vulnerability at location maps, and evacuation resilience maps.
Keywords: METU tsunami human vulnerability assessment (MeTHuVA), Tsunami risk analysis, Geographic information systems (GIS), Multi-criteria decision analysis (MCDA), Analytical hierarchical process (AHP), Tsunami, Istanbul, Yenikapı
© 2016 The Author(s). This article is distributed under the terms of the Creative Commons Attribution 4.0 International License (http://creativecommons.org/licenses/by/4.0/), which permits unrestricted use, distribution, and reproduction in any medium, provided you give appropriate credit to the original author(s) and the source, provide a link to the Creative Commons license, and indicate if changes were made.
IntroductionTsunamis are the giant waves mostly triggered by earth-quakes and/or submarine landslides. Despite the rare occurrence of tsunamis, they have been of interest to worldwide media since the early twenty first century with the repetition of mega earthquakes (Cartwright and Nakamura 2008; Mas et al. 2014). There are many asso-ciations researching and developing models to forecast
tsunamis and create tsunami inundation and evacua-tion maps all over the world. The scientific and techni-cal approaches for tsunami risk assessment are still in development despite the progress made after the Indian Ocean tsunami of 2004. In the last two decades, there have been considerably more studies related to hazard, risk, and vulnerability (Alexander 2000; Wisner et al. 2004). Many models have been developed to understand, assess, and map these three concepts (Fischer et al. 2002; Gambolati et al. 2002; Cheung et al. 2003). Validation of these models is required in order to make an accurate estimation of the real effects of natural disasters. The requisite of validation of hazard, risk, and vulnerability
Open Access
*Correspondence: [email protected] 2 Civil Engineering Department, Middle East Technical University, Ankara, TurkeyFull list of author information is available at the end of the article

Page 2 of 22Cankaya et al. Earth, Planets and Space (2016) 68:133
models is crucial, as the models based on these will form the foundation of the outputs used to define land use zoning and planning, emergency response actions, dis-aster planning, and insurance premiums (Tüfekci 1995; Jenkins 2000; Dominey-Howes and Papathoma 2007). Geographic Information Systems (GIS) are used in vul-nerability assessment models for many types of natural or industrial hazards. Starting with the 2004 Indian Ocean tsunami, different methodologies have been developed to evaluate vulnerability to various types of natural haz-ards, including tsunamis (Papathoma et al. 2003; Ghoba-rah et al. 2006; Dominey-Howes and Papathoma 2007; Reese et al. 2007; Taubenböck et al. 2008; Dall’Osso et al. 2009a, b; Koshimura et al. 2009a, b; Wood 2009; Omira et al. 2010; Pendleton et al. 2010; Atillah et al. 2011; Leone et al. 2011; Murthy et al. 2011; Sinaga et al. 2011; Valencia et al. 2011; Eckert et al. 2012; Ismail et al. 2012; Suppasri et al. 2012a, b; Tarbotton et al. 2012; Usha et al. 2012; Suppasri et al. 2013; Santos et al. 2014; Benchek-roun et al. 2015). In order to create appropriate models for hazard assessments, GIS tools are required for ana-lyzing large amounts of data while generating thematic maps. The integration of various data sources can be per-formed, and the results obtained from the models can be presented as integrated with spatial and thematic data of selected region. In coherence with this approach, GIS tools are used in this study for further generating vulner-ability assessment models while analyzing and integrat-ing the results of numerical models.
The aim of this study is to further develop existing approaches, yielding a new methodology for GIS-based tsunami risk analysis, and thereby (i) to use high resolu-tion (1 m) GIS-based data in tsunami numerical mod-eling and inundation analysis (hazard assessment), (ii) propose a new human vulnerability assessment method by further improving known vulnerability assessment aspects (locational vulnerability) and introducing new resilience assessment features (evacuation resilience), and (iii) propose a further developed tsunami risk evaluation equation by integrating the result of meter-size gridded high-resolution tsunami numerical models of different scenarios in the Yenikapı region in Istanbul, in order to obtain human vulnerability assessments.
Study area: the sea of Marmara and YenikapıApart from its amazing historical sites and natural attrac-tions, Turkey has a crucial geopolitical position with economically significant places. Turkey is surrounded by seas on three sides and is shaped by active faults, result-ing in inevitable interactions, yielding tsunami potential. Some of those active faults are in the Sea of Marmara. Istanbul is one of the most important metropolitan cities in the world, and is located near the faults in the Sea of
Marmara. Based on Altınok et al. 2011, there were more than 134 tsunamis impacting Turkey and its surround-ing coasts from the seventeenth century BC to 1999 AD. Those tsunamis were triggered by earthquakes and/or submarine landslides. The Sea of Marmara is an inland sea which connects the Black Sea to the Aegean Sea, and also separates Asia from Europe. It is connected to the Black Sea by the Bosporus strait and to the Aegean Sea by the Dardanelles. It occupies an area with the approximate dimensions of 275 km (E–W direction) and 80 km (N–S direction). The maximum depth reaches around 1200 m; it is a large-scale intercontinental sea (Smith et al. 1995; Yalçıner et al. 2002). The locations of the historical tsuna-mis (120–1999 AD) in the Sea of Marmara are shown in Fig. 1, in which the numbers are in chronological order.
As shown in Fig. 2, Yenikapı, which is in the Fatih dis-trict, is located in the southern part of Haliç, the Euro-pean side of Istanbul. One of the ancient city walls of Istanbul is located on the Yenikapı coast. Yenikapı station hosts a suburban railway, subway line, and undersea rail-way connection (Marmaray) between Europe and Asia. The entrance to the Eurasia Undersea Highway Tunnel on the European side is also located near the coast of Yenikapı.
Tsunamigenic scenarios and numerical modelingMitigation of tsunami impact can be achieved by provid-ing faster evacuation for humans and by increasing the resistivity and performance of structures against tsuna-mis. Tsunami modeling is one of the important phases of tsunami hazard assessment. The source mechanisms, bathymetric, and topographical data in adequate resolu-tion, as well as selection of probable tsunami scenarios, are used in tsunami numerical modeling (Aytöre et al. 2014; Aytöre 2015; Aytöre et al. 2015).
In this study, the critical tsunami scenarios that may be effective for Yenikapı are selected from different reports and papers considering seismic mechanisms (Yalçıner et al. 2002; Hebert et al. 2005; OYO-IMM Report 2008; Ayca 2012). However, the origin of tsunami waves due to submarine landslides and turbidity currents, espe-cially along the steep submarine slopes north of Yalova and south of Yenikapı may be a considerable threat to the Istanbul coast, which have not included in this study. In terms of seismic activity, there are six potential sources that may be responsible for the generation of tsunamis in the Sea of Marmara. They are the Prince’s Islands (PI) (oblique-normal) fault, Prince’s Islands (PIN) (normal) fault, Ganos (GA) (oblique-normal and oblique-reverse) fault, Yalova (YAN) (oblique-normal and normal) fault, Central Marmara (CMN) (normal) fault, and the com-bination of PI and GA. Among these, the PIN and YAN are selected as critical sources that may cause tsunamis

Page 3 of 22Cankaya et al. Earth, Planets and Space (2016) 68:133
with higher water levels, flow depth, and strong current velocities at Yenikapı. The rupture parameters of each segment of PIN and YAN are given in Table 1 (Ayca 2012; Özdemir 2014).
Tsunami source PIN is the normal component of the first four oblique-normal segments of tsunami source PI. In the simulations, it is assumed that four segments of PIN rupture have been broken entirely and generated the tsunami source. Tsunami source YAN consists of eight segments, of which three are oblique-normal and five are normal faults. In the simulations, it is assumed that eight segments of YAN have been broken entirely and gener-ated the tsunami source.
Tsunami numerical simulations are performed using the NAMI DANCE code (NAMI DANCE 2015). The model solves nonlinear forms of shallow water equations with a friction term. The duration of simulations used is 90 min, and the time step is set as 0.005 s. Since the larg-est tsunami waves hit the study area in the first 50 min, the 90 min simulation duration is sufficient to obtain the major tsunami impact in Yenikapi, including additional reflections from all boundaries. In this study, the bottom friction coefficient is taken as zero in order to be on the safe side in the vulnerability analysis, which computes further inundation.
The nested domains are created to be high resolu-tion, covering the Yenikapı region and surroundings. Three nested domains (from large to small B, C, and D) are selected with different resolutions. The corner coor-dinates of each domain is given as 40.210°–41.260°N, 26.542°–30.020°E; 40.971°–41.041°N, 28.920°–29.045°E;
and 40.9949°–41.0050°N, 28.9520°–29.9794°E for B, C, and D, respectively. The largest domain (B) covers the whole Marmara with a resolution of about 90 m, the medium domain (C) covers the Yenikapı region with a resolution of 30 m, and the smaller domain (D) with a resolution of 10 m.
Since the tsunami computational tool NAMI DANCE allows a grid nesting ratio of three, at least five domains should be created for the high-resolution analysis (90 > 30 > 10 > 3.3 > 1.1 m). This process takes a very long computational time (up to a few months) even with a 64 processor computer. In order to save time, it is preferred to run the tsunami numerical model once for the nested domains (B, C, and D) and to obtain the water level change at the border of the smallest domain (Domain D). Afterwards, a very high resolution (1 m grid size) Domain D is developed using GIS implementation considering buildings, transportation networks, and infrastructure. At the final stage, a single domain (Domain D with 1 m grid size) simulation using the wave input from the bor-der (computed from nested simulations) is applied.
In order to perform higher-resolution numerical mod-eling, necessary implementations for the dataset are performed. Two different types of data are used in this study. They are: (i) the topographical data in XYZ (longi-tude, latitude, and elevation) format made of 5 m spaced points to construct the natural topography of the Istan-bul region and (ii) the building and infrastructure vec-tor data with elevations to construct the metropolitan topography. A very high-resolution metropolitan digi-tal elevation model with 1 m grid size is constructed by
Fig. 1 The seismotectonic map and the locations of the past tsunamis in the sea of Marmara. Modified from Yaltırak et al. (2000) and Yalçıner et al. (2002)

Page 4 of 22Cankaya et al. Earth, Planets and Space (2016) 68:133
combining these two data sources, which are then joined with high-resolution bathymetry data to produce a seam-less bathymetry and land topography input for detailed tsunami numerical model runs.
Two preliminary tsunami simulations are performed considering PIN and YAN earthquake sources (Table 1). The nested domains are created with high resolution (1 m), covering the Yenikapı region and environs. Three nested domains (from large to small B, C, and D) are selected in different resolutions. The grid model of the smallest domain (D) for simulations of tsunami propa-gation in the European part of Istanbul from Yenikapı to Kumkapı extends from 40.9949°N to 41.0050°N and from 28.9520°E to 29.9794°E. The distribution of maximum
water elevations in domains B and C at the end of the 90 min simulation and the tsunami sources PIN and YAN are presented in Fig. 3.
Then, the high-resolution (1 m grid size) single domain simulations are conducted. The water level change at the southern border of Domain D computed from nested simulations for PIN and YAN sources separately are given in Fig. 4. The wave at the border of Domain D from source YAN (red line) has a leading depression charac-teristic; however, the wave coming from source PIN (blue line) has a leading elevation characteristic.
The wave input to domain D (1 m grid size) is simu-lated for a duration of 90 min, and all necessary tsu-nami parameters (mainly maximum water elevations,
Fig. 2 a General view of Istanbul, and b study area within Yenikapı district

Page 5 of 22Cankaya et al. Earth, Planets and Space (2016) 68:133
maximum current speed, maximum flow depth, and maximum fluxes) are computed separately for Yenikapı using NAMI DANCE. Among those parameters, flow depth is one of the major parameter for risk analysis. It is plotted in Fig. 5 as the results of simulations using the PIN and YAN tsunami sources.
As seen in Fig. 5a, maximum flow depth exceeds 6 m near the shoreline east of the Yenikapı Fishery Port; it is represented in purple according to the simulation of the PIN source. Figure 5b shows the distribution of flow depth computed by simulation of the YAN source. In this simulation, the flow depth exceeds 6 m not only near the shore, but also in front of the high historical city wall which prevented water flow and caused accumulation of water volume in front. Hence, higher flow depths are observed in front of the historical city wall.
When the results of simulations of PIN and YAN sources are compared, it is observed that tsunami source YAN causes relatively longer inundation distances and higher flow depths at Yenikapı than tsunami source PIN. Therefore, results of the simulation of the YAN source (Fig. 5b) are reliable for use in the tsunami vulnerability analysis. These results are used as hazard intensity input in the next steps of this study.
Tsunami human vulnerability assessment at Yenikapi regionDatasets used to compute vulnerability at location and evacuation resilienceThere are two datasets available to use in the determina-tion of tsunami human vulnerability at Yenikapı. The first one is the vector dataset of the entire Istanbul region, prepared by the Istanbul Metropolitan Municipality
(IMM), and dates back to 2006 (Fig. 6). This raw dataset is composed of hundreds of points (e.g., utilities, single graves, billboards), polylines (e.g., retaining walls, walk-ing-tracks, scarps), and polygons (e.g., decorative pools, greenhouses, penthouses) representing all available met-ropolitan structures and infrastructure, with their eleva-tions. The second available dataset is a DEM with 5 m resolution, created from aerial photogrammetric tech-niques based on 2006 data, also obtained from IMM (Fig. 7).
In the context of the two available sources, it was decided to produce eight parameters as vulnerability and resilience related layers for MCDA. Two different cat-egories were produced from eight parameter layers. They are (i) the spatial distribution of vulnerability due to dis-tance to shoreline, geology, elevation, and metropolitan use, and (ii) the spatial distribution of resilience based on ease of evacuation because of distance to buildings, slope, distance to road networks, and distance to flat areas. The hierarchical structure used to prepare the tsunami human vulnerability assessment map is given in Fig. 8. It was used to allot weight and rank values to the layers and classes of each thematic map in the AHP method.
Assumptions for vulnerability at location and evacuation resilience assessmentsIn order to make the models more realistic yet sim-ple enough to solve the case, a number of practi-cal assumptions were made throughout the MCDA implementations:
• The earthquake is assumed to be a precursor to a tsu-nami, which warns people to consider the imminent
Table 1 Estimated rupture parameters and initial wave amplitudes for tsunami sources PIN and YAN (Ayca 2012)
Fault Type Longitude (ED_50)
Latitude (ED_50)
Depth from sea bot-tom
Strike Dip Rake Length Width Vertical dis-placements
Initial wave amplitude
Degree Degree m, GL- Degree Degree Degree m m m Max (m) Min (m)
PIN Normal 29.12942 40.75691 744 108.15 70 270.00 8753 17.027 5.00 1.05 −2.57
29.06928 40.78610 740 123.15 70 270.00 6024 17.027 5.00 0.94 −2.41
28.99465 40.81653 779 118.85 70 270.00 7148 17.027 5.00 0.98 −2.47
28.90432 40.87251 1210 129.90 70 270.00 9834 17.027 5.00 0.92 −2.36
YAN Oblique-normal
29.47103 40.72115 1978 257.96 70 195.00 7058 17.027 5.00 0.49 −1.56
29.38946 40.7075 1960 261.14 70 195.00 6873 17.027 5.00 0.6 −1.65
29.30920 40.69751 1823 260.98 70 195.00 10.952 17.027 5.00 0.92 −2.35
Normal 29.18143 40.68121 1681 262.35 70 270.00 4448 17.027 5.00 0.52 −1.55
29.12936 40.6755 1557 273.96 70 270.00 4562 17027 5.00 1.03 −2.51
29.07551 40.67791 1252 283.78 70 270.00 10.021 17.027 5.00 0.53 −1.79
28.96007 40.69843 1219 294.84 70 270.00 3154 17.027 5.00 0.56 −1.77
28.92602 40.71005 1178 284.90 70 270.00 14.043 17.027 5.00 0.78 −2.15

Page 6 of 22Cankaya et al. Earth, Planets and Space (2016) 68:133
arrival of a tsunami (with enough time to move to safer locations).
• Buildings are considered rigid and undamaged by tsunamis.
• It is assumed that vertical evacuation is possible in every building, and the number of floors are greater than one, except prefabricated buildings.
• Day and night populations are assumed to be constant. • It is supposed that tsunami waves arrive at the same
time at all locations on the Yenikapı shoreline in the study area (an approximately 2 km segment of the Yenikapı shoreline).
• The duration of inundation is governed by the period of the tsunami wave.
• According to the results of simulations using a criti-cal scenario in a deterministic approach, the period of tsunami waves is estimated to be approximately 10–15 min. In the vulnerability analysis, the duration of the tsunami inundation is sufficiently long.
Vulnerability analysis at locationThe tsunami vulnerability at location in Yenikapı is assessed by integration of metropolitan use, geology, elevation and distance from shoreline layers. These lay-ers are produced from their raw data and combined in
Fig. 3 The tsunami source and distribution of maximum water elevations computed at the end of 90 min simulations by NAMI DANCE for tsunami sources PIN (left) and YAN (right). a The tsunami sources. b The distribution of maximum water elevations at Domain B. c The distribution of maxi-mum water elevations in Domain C
Fig. 4 Time histories of water level change at the southern border of Domain D computed from nested simulations for sources PIN and YAN

Page 7 of 22Cankaya et al. Earth, Planets and Space (2016) 68:133
the previously decided MCDA framework. The input data and their relevant parameter maps/layers are as follows:
a) Metropolitan use layerAll the attributes of metropolitan use vector data are ana-lyzed and grouped into meaningful units by gathering
Fig. 5 Inundation (flow depth) maps at Yenikapı coastal site considering the earthquake sources a PIN and b YAN
Fig. 6 The view of the vector data for Yenikapı obtained from IMM

Page 8 of 22Cankaya et al. Earth, Planets and Space (2016) 68:133
Fig. 7 Digital elevation model (DEM) of Yenikapı with 5 m resolution
Fig. 8 The hierarchical structure used in the preparation of the vulnerability maps

Page 9 of 22Cankaya et al. Earth, Planets and Space (2016) 68:133
similar metropolitan use polygons. Here, 23 descriptive units are aggregated in an attribute table, which includes all buildings and structures, grouped into five main met-ropolitan use groups against tsunami vulnerability. These are extremely important places, such as prefabricated buildings, gas stations, electricity transformers, pedestrian underpasses, the İDO-Istanbul Sea-bus Terminal (the glass-wall building), the entrance to the Eurasia (Avrasya) Undersea Highway Tunnel, ruins, assembly areas (e.g., reli-gious facilities, sports facilities, schools, wedding halls), flat areas (e.g., asphalt roads, suburban railways, parking spaces, green fields, and medians), cultural heritage sites (e.g., stationary city walls, demolished city walls, histori-cal places/buildings), and buildings (e.g., factories, small-scaled production centers, buildings under-construction, residential areas/private homes, commercial buildings).
The type or usage of each building is also considered separately while categorizing built-up environments and their relationship to vulnerability. In the ranking process, the possibly high occupancy of locations such as assembly areas is also taken into account in estimat-ing the vulnerability score of the selected area. Accord-ing to observations from the site visit, there are very few wooden buildings located near the suburban railway, and there are five prefabricated buildings located behind the glass-wall building. This is why it is not feasible to clas-sify the buildings according to their construction mate-rials or to their resistivity to waves, as in previous TVA studies. The map of metropolitan use is presented in Fig. 9a, where red, blue, green, purple, and yellow rep-resent extremely important places, assembly areas, cul-tural heritage sites, flat areas, and buildings, respectively. The critical areas are prefabricated buildings, gas sta-tions, electricity transformers, pedestrian underpasses, the glass-wall building and the entrance to the Eurasia Undersea Highway Tunnel, and historical ruins.
b) Geology layerTsunamis are mostly generated by earthquakes at inter-plate subduction areas. Once the stability of geological units is altered by lateral or vertical forces, unwanted slope instabilities, ground deformation, and liquefac-tion may occur. Furthermore, the geotechnical proper-ties influencing local site conditions, and thus earthquake ground motion, may influence building damage and sta-bility after stronger earthquakes, and thus building resis-tivity to waves in case of high energetic tsunami waves.
Geological units in the study area are classified accord-ing to their lithologies and ages. There are two formations older than the Quaternary: the Carboniferous Trakya and Miocene Çukurçeşme formations outcropping around Yenikapı. Furthermore, around the Yenikapı port, in addition to valley-filling alluviums, part of the sea has
been filled with anthropogenic Quaternary fill (Fig. 10). The geology layer is created by grouping the formations according to their behavior during earthquakes. Their geotechnical behaviors during an earthquake have been intensively studied in various IMM studies, yielding the result that the Carboniferous Trakya formation is favora-ble, while the Miocene Güngören Formation possesses different geotechnical problems during an earthquake. On the other hand, all natural or anthropogenic uncon-solidated deposits in the Quaternary alluvium are classi-fied as unfavorable ground (Fig. 9b).
c) Elevation (DEM) layerWhen a tsunami reaches land, standing on higher ground will keep coastal buildings, structures and infrastructures safe, compared with being at low elevation near the shore. Not only elevation, but also the distance from the shore-line is also used in the numerical computation of inun-dation parameters. These are the two basic vulnerability parameters of inundation that should have to be taken into account, regardless of the type of marine-induced hazard.
The natural terrain elevation dataset was produced by aerial photogrammetric techniques in 2006 by IMM with a 5 m pixel size. The pixel size is reduced to 1 m by resa-mpling the DEM in order to make it coherent with the building (metropolitan) topography that was used to cal-culate the numerical tsunami models. Based on regional tsunami records and previous expertise, the elevation layer is divided into four classes: elevations lesser than 3 m, 3–5 m, 5–8 m and elevations higher than 8 m. The generated parameter layer is shown in Fig. 9c.
d) Distance from shoreline layerIn case of any tsunami threat, it would be good to be away from the shoreline. Structures near the shoreline would be in danger. Independent of the resistivity of the build-ings and/or structures depending on material type, prox-imity to the shore increases the probability of being close to or within inundation, which would affect vulnerability negatively. Hence, distance from shoreline is taken as a parameter to determine vulnerability (Çankaya 2015).
This layer is calculated as the nearest perpendicular distance of each 1 m raster cell from the shoreline vector (Fig. 9d). The computed continuous raster is then divided into five classes: distances less than 50 m, 50–100 m, 100–200 m, 200–300 m and distances greater than 400 m.
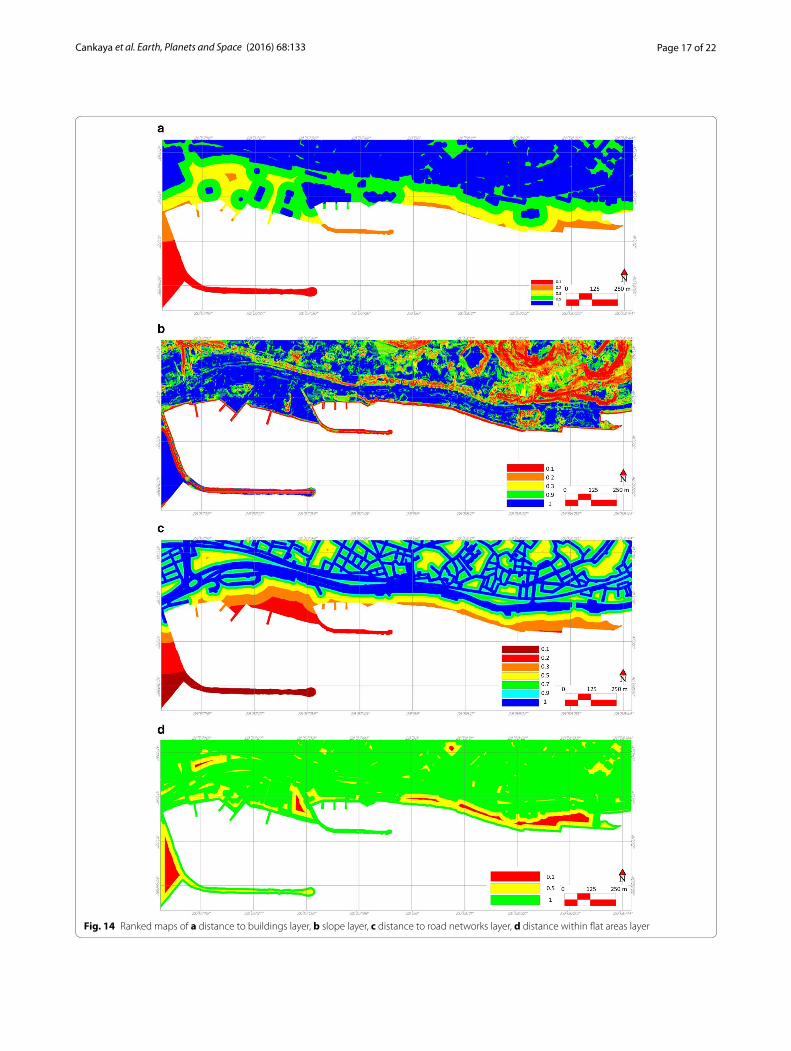
Evacuation resilience analysis at Yenikapı regionRecently, research has indicated that a key concept in the assessment of tsunami events is resilience. As previously introduced, there are four layers in this group: distance to buildings, slope, distance to road networks, and distance within flat area layers. The MCDA framework is created
Page 10 of 22Cankaya et al. Earth, Planets and Space (2016) 68:133
Fig. 9 Parameter maps of vulnerability at location: a parameter map of metropolitan use layer: extremely important places (red), assembly areas (blue), cultural heritage sites (green), flat areas (purple), buildings (yellow); b Parameter map of geology layer; c The elevation DEM layer; d Parameter map of distance from shoreline layer

Page 11 of 22Cankaya et al. Earth, Planets and Space (2016) 68:133
to calculate the resilience score for evacuation of places that may be exposed to tsunamis (Fig. 8).
a) Slope layerSlope is an important parameter for tsunami evacu-ation, as it directly affects the speed at which pedes-trians can escape (Graehl and Dengler 2008). When a tsunami propagates inland, gentle slopes in the coastal region will make evacuation easier. The land slope layer is calculated from the resampled high-resolution (1 m) DEM (Fig. 11a). The continuous raster slope layer is then re-classified into five classes: slopes less than 2°, 2°–4°, 4°–6°, 6°–10°, and slopes steeper than 10°.
b) Distance within flat areas layerAlthough open areas are safer locations during an earth-quake, lack of shelter and absence of vertical evacuation make open areas susceptible to tsunamis. Hence, the
distance within an open area limits the evacuation poten-tial (Çankaya 2015). For producing this layer, the metro-politan use layer is used as input to select flat areas from available attribute tables. Parking lots and other open spaces (including green fields and public squares) are selected, and the nearest perpendicular distances within these units are calculated (Fig. 11b). Distances within flat areas layer are divided into three classes: nearer than 10 m, 10–30 m, and farther 30 m.
c) Distance to buildings layerThe number of the floors in a building should be con-sidered in calculating evacuation resilience of residents. However, when buildings are low and evacuation in the vertical direction is not possible, injury and death will be inevitable (Dominey-Howes and Papathoma 2007).
It is accepted that where vertical evacuation is possible, residents are able to evacuate from the tsunami disaster
Fig. 10 The geological map at 1/40,000 scale (Istanbul Metropolitan Municipality 2015) and detailed geological map of the study area presented in inset. Extracted from Istanbul Metropolitan Municipality (2015)

Page 12 of 22Cankaya et al. Earth, Planets and Space (2016) 68:133
Fig. 11 Parameter maps of evacuation resilience: a The parameter map of slope layer, b the parameter map of distance within flat areas layer, c the parameter map of distance to buildings layer, d the parameter map of distance to road networks layer
Page 13 of 22Cankaya et al. Earth, Planets and Space (2016) 68:133
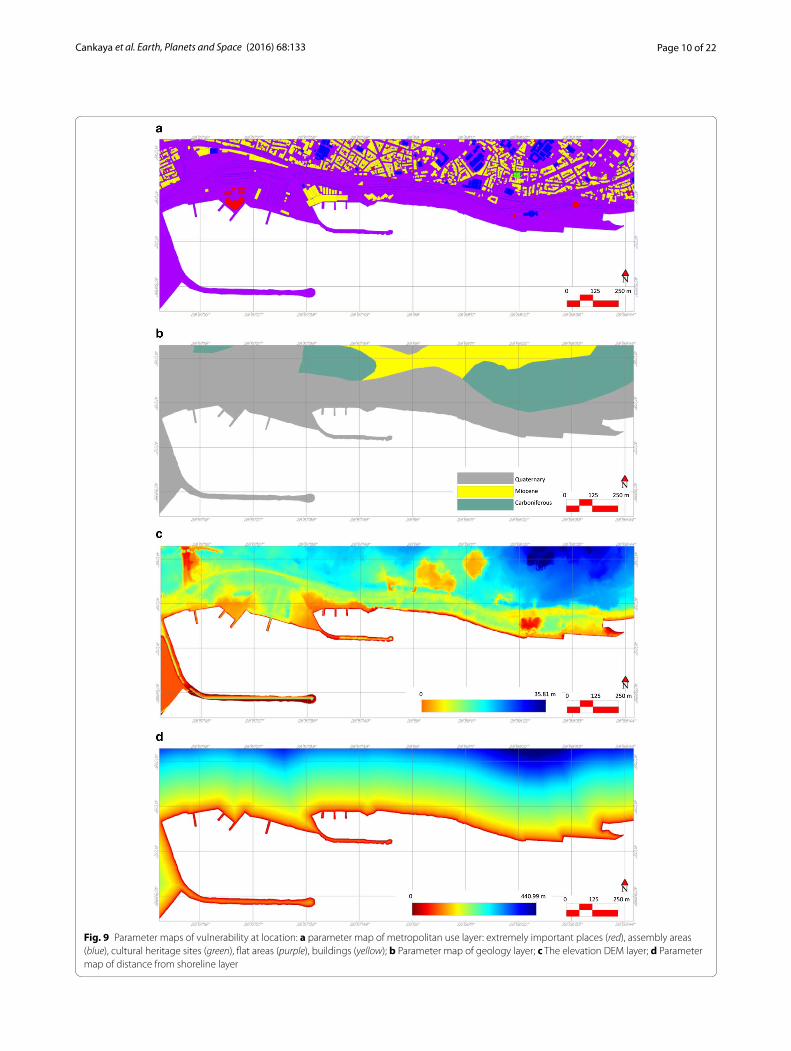
easily (Mas et al. 2014), thus preventing risk of injury and death. All types of buildings in the attribute table of the met-ropolitan use layer are integrated to generate the parameter layer for buildings. The nearest perpendicular distances to the building polygons from any location on the map are cal-culated for every 1 m pixel (Fig. 11c). The distance to the buildings layer is divided into five classes: less than 10 m, 10–50 m, 50–100 m, 100–250 m, and greater than 250 m.
d) Distance to road networksThe location of residents in the area during a tsunami is critical. In most cases, there is a warning and alert system at locations that have been exposed to tsunamis. Evacua-tion signs and routes produced by local officials are avail-able in such places. Tsunami evacuation routes/roads guides coastal residents to safer locations in case of natu-ral disasters such as earthquakes and tsunamis. Evacua-tion signs are placed along routes to mark the direction inland or to higher elevations. If the coastal area does not have any evacuation routes, the main roads should be considered for escape when a tsunami approaches inland. In tsunami-flooded flat areas, it is very difficult to reach safer places on high ground and away from the shoreline.
The metropolitan use layer is used to select suburban railways and asphalt roads as potential escape corridors. The nearest perpendicular distances to these corridors are calculated, and distances to the road network layer are presented in Fig. 11d. The distances to the road net-work layer are then classified into five classes: less than 5 m, 5–10 m, 10–20 m, 20–50 m, 50–100 m, 100–250 m, and greater than 250 m.
Creating AHP framework and final map production for vulnerability at location and evacuation resilience scoresThe generated parameter maps are used in the MCDA process to calculate the vulnerability at location and evacuation resilience maps. AHP provides a basis to compare decision-making alternatives in a mathemati-cal structure. The relative vulnerabilities of eight layers in two groups are identified comparatively and separately according to expert opinion, considering the intensi-ties of the weight values on Saaty’s rating scale (Table 2). While assigning weight values to each layer, pairwise comparisons are performed for each group (Fig. 12). The rank values within each layer are given by experts accord-ing to their appropriate tsunami vulnerability conditions.
The weight values for vulnerability at location are com-puted, and the consistency ratio is estimated to be less than 0.10 with the value of 0.0255 by AHP calculations. Like-wise, the same procedure is applied for evacuation resil-ience, and the consistency ratio is estimated to be 0.0843, which is less than 0.10; therefore, it is compatible for use in
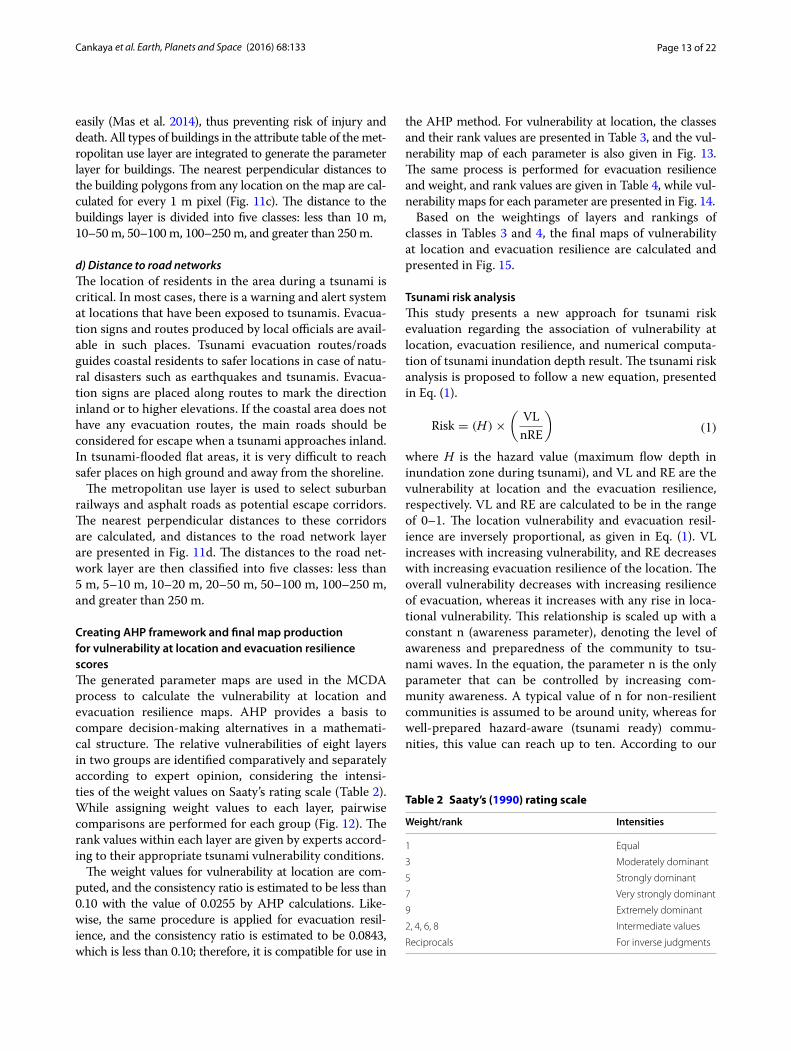
the AHP method. For vulnerability at location, the classes and their rank values are presented in Table 3, and the vul-nerability map of each parameter is also given in Fig. 13. The same process is performed for evacuation resilience and weight, and rank values are given in Table 4, while vul-nerability maps for each parameter are presented in Fig. 14.
Based on the weightings of layers and rankings of classes in Tables 3 and 4, the final maps of vulnerability at location and evacuation resilience are calculated and presented in Fig. 15.
Tsunami risk analysisThis study presents a new approach for tsunami risk evaluation regarding the association of vulnerability at location, evacuation resilience, and numerical computa-tion of tsunami inundation depth result. The tsunami risk analysis is proposed to follow a new equation, presented in Eq. (1).
where H is the hazard value (maximum flow depth in inundation zone during tsunami), and VL and RE are the vulnerability at location and the evacuation resilience, respectively. VL and RE are calculated to be in the range of 0–1. The location vulnerability and evacuation resil-ience are inversely proportional, as given in Eq. (1). VL increases with increasing vulnerability, and RE decreases with increasing evacuation resilience of the location. The overall vulnerability decreases with increasing resilience of evacuation, whereas it increases with any rise in loca-tional vulnerability. This relationship is scaled up with a constant n (awareness parameter), denoting the level of awareness and preparedness of the community to tsu-nami waves. In the equation, the parameter n is the only parameter that can be controlled by increasing com-munity awareness. A typical value of n for non-resilient communities is assumed to be around unity, whereas for well-prepared hazard-aware (tsunami ready) commu-nities, this value can reach up to ten. According to our
(1)Risk = (H)×
(
VL
nRE
)
Table 2 Saaty’s (1990) rating scale
Weight/rank Intensities
1 Equal
3 Moderately dominant
5 Strongly dominant
7 Very strongly dominant
9 Extremely dominant
2, 4, 6, 8 Intermediate values
Reciprocals For inverse judgments

Page 14 of 22Cankaya et al. Earth, Planets and Space (2016) 68:133
experience comparing the awareness and preparedness of communities, in this study we use n = 3 for Istanbul. When H = 0 at any point in the study area, the value of tsunami risk will be zero. This means tsunami waves will not reach that location on land. In any other case (when H > 0), the relative risk can be calculated at locations where there is a flow depth in inundation zone. The final
maps representing the relative risk at each location in Yenikapı are generated using Eq. (1) and are presented in Fig. 16.
Results and discussionA new approach to tsunami risk analysis via preparation of vulnerability and evacuation resilience maps for the
Fig. 12 The pairwise comparison matrices and computed weight values for vulnerability at location and evacuation resilience
Table 3 The computed weight and rank values of vulnerability at location
Layers Weight Classes Ranking Rank (standardized) Weight × rank
Distance from shoreline 0.4833 <50 1 0.1 0.04833
50–100 2 0.2 0.09666
100–200 3 0.3 0.14499
200–300 6 0.6 0.28998
300–400 9 0.9 0.43497
≥400 10 1 0.48330
Geology 0.2917 Quaternary 1 1 0.02917
Miocene 3 0.3 0.08751
Carboniferous 10 0.1 0.29170
Elevation 0.1208 <3 1 0.1 0.01208
3–5 5 0.5 0.06040
5–8 8 0.8 0.09664
≥8 10 1 0.12080
Metropolitan use 0.1042 Extremely important places 1 0.1 0.01042
Assembly areas 2 0.2 0.02084
Cultural heritage 3 0.3 0.03126
Flat areas 4 0.4 0.04168
Buildings 10 1 0.10420
Page 15 of 22Cankaya et al. Earth, Planets and Space (2016) 68:133
Fig. 13 Ranked maps of a distance from shoreline layer, b geology layer, c elevation layer, d metropolitan use layer

Page 16 of 22Cankaya et al. Earth, Planets and Space (2016) 68:133
Yenikapı coastal region, combining tsunami numerical modeling and GIS-based MCDA, is presented.
The maximum flow depths and inundated area based on simulations of the PIN and YAN tsunami sources are obtained, and the inundation maps are plotted. The inundation maps produced by simulation of these two tsunami sources are compared. According to the gener-ated inundation maps, the tsunami source YAN is found more critical than the tsunami source PIN, since it causes greater flow depth and longer inundation distance.
The map of vulnerability at location is derived by com-bining the parameter layers using MCDA methods in a GIS environment. The map of vulnerability at location map is produced by evaluating four parameters simulta-neously in a single process. The most effective parameter layer is observed as the distance from shoreline with a weight of 0.4833, which is the most dominant parameter compared to the other parameter layers. In Fig. 17, dark red represents the more vulnerable places. According to the results in Fig. 17a, the safest areas are defined as the locations that are at least 10 m from the shoreline or near any building. Vertical evacuation is possible in the major-ity of buildings in Yenikapı. The prefabricated buildings located behind the glass-wall building are single-story structures, and are not resistant enough to tsunami
waves. As also seen in Fig. 17a, there is a color tone dif-ference between the glass wall building and the prefab-ricated buildings. This is because, although both are grouped in extremely important places, with the effect of other parameters, the glass-wall building is dark red, and the prefabricated buildings are red.
The map of evacuation resilience is given in Fig. 17b. The buildings are obviously the most resilient places, since it is assumed they allow vertical evacuation. In contrast, the breakwaters are the least resilient places because of their proximity to the sea and escape routes. The more resilient places, including buildings, structures, road networks, and flat areas are colored blue. The less resilient areas for evacuation are places near the shore, west of the Yenikapı Fishery Port. The reason for this is the existence of fish restaurants, which are assumed to be rigid and not easily damaged. Likewise, depending on the evacuation resilience map, the glass-wall building is represented in blue as a safer place because it allows to vertical evacuation, thus its locational vulnerability is decreased. When the study area is visited, it is noted that the buildings mostly consist of more than one story in the Yenikapı region. The dominant effect of the building layer with the weight of 0.5808 is seen in the evacuation resil-ience map.
Table 4 The computed weight and rank values of evacuation resilience
Layers Weight Classes Ranking Rank (standardized) Weight × rank
Distance to buildings 0.5808 <10 10 0.1 0.58080
10–50 9 0.2 0.52272
50–100 3 0.3 0.17424
100–250 2 0.6 0.11616
≥250 1 0.9 0.05808
Slope 0.1830 <2 10 1 0.18300
2–4 7 0.7 0.12810
4–6 4 0.4 0.07320
6–10 2 0.2 0.03660
≥10 1 0.1 0.01830
Distance to road networks 0.1647 <5 10 1 0.16470
5–10 9 0.9 0.14823
10–20 7 0.7 0.11529
20–50 5 0.5 0.08235
50–100 3 0.3 0.04941
100–250 2 0.2 0.03294
≥250 1 0.1 0.01647
Distance within flat areas 0.0716 <10 10 1 0.07160
10–30 5 0.5 0.03580
≥30 1 0.1 0.00716
Page 17 of 22Cankaya et al. Earth, Planets and Space (2016) 68:133
Fig. 14 Ranked maps of a distance to buildings layer, b slope layer, c distance to road networks layer, d distance within flat areas layer

Page 18 of 22Cankaya et al. Earth, Planets and Space (2016) 68:133
The vulnerability and evacuation resilience maps are combined for two critical tsunami sources, PIN and YAN, separately. For these two sources, the risk maps are pro-duced using proposed Eq. (1). The vulnerability and evac-uation resilience are relatively defined for each pixel in the study boundary. The values of vulnerability and evac-uation resilience maps are in the range of 0–1. In the risk maps, blue represents the relatively safer places, whereas the more hazardous places are depicted in red. White pixels represent the value of zero because of no tsunami effect (in other words, flow depth is equal to zero). Tsu-nami risk increases from the blue to red-colored areas. According to the colors in the maps, the less hazardous places near shoreline are the İDO-Istanbul Seabus Termi-nal (ignoring the construction material), the restaurants behind the Yenikapı Fishery port, and the wedding hall located west of the study area, near the shore. The rela-tive vulnerability east of the Fishery Yenikapı port is at a maximum because of the gates of the ancient city walls. A small part of the meeting area west of the study area is seen an important place because of tsunami impact. The
entire meeting area must be considered in tsunami risk analyses, and the necessary precautions should be taken accordingly before facing a tsunami disaster.
In this study, the main road in the study area runs par-allel to the coastline, which is not convenient for evacu-ation when a tsunami occurs. The places assigned as extremely important places (the prefabricated build-ings, the glass wall building, the entrance to the Eurasia Undersea Highway Tunnel, ruins, the entrance to pedes-trian underpasses, gas stations, electricity transformers) are more vulnerable considering vulnerability at location and evacuation resilience. Some car underpasses on the main road in Yenikapı would cause penetration of water inland, which would probably make evacuation more difficult.
The snapshot methodology of this study is summarized in three steps. The first step covers the tsunami numeri-cal modeling and production of tsunami inundation maps which provides the Hazard intensity value H. In the second step, the GIS-based MCDA method is used to produce the necessary parameters, to determine the
Fig. 15 The calculated maps of vulnerability at location (a) and evacuation resilience (b)

Page 19 of 22Cankaya et al. Earth, Planets and Space (2016) 68:133
weight/rank values, and to produce the final vulnerability at location and evacuation resilience maps by combin-ing related parameters. The third step is to produce and evaluate risk in the selected study area, Yenikapı, using the new proposed Eq. (1) (Fig. 18).
ConclusionIn this study, a new approach is applied to define tsunami human vulnerability parameters, and a new model for high-resolution tsunami risk analysis based on tsunami numerical modeling and GIS-based MCDA is proposed.
According to results obtained from the above sum-marized studies the main concluding remarks are listed below.
1. There is tsunami potential in the Sea of Marmara, and tsunami risk analysis, including detailed vulner-ability, hazard, and risk analysis are necessary. A new approach is presented and tested with the case study for the Yenikapı region in Istanbul.
2. Determination of the tsunami sources affecting the study area is one of the main requirements of tsu-
nami numerical modeling. These sources must be analyzed and compared to determine the critical deterministic tsunami scenarios for the study area. A valid and verified numerical model is necessary for detailed computation of tsunami parameters (such as inundation, maximum positive amplitudes, flow depths, and maximum currents) near shore and over land. The inundation map, including the flow depth (depth of overland tsunami flow), must be calcu-lated.
3. High-resolution bathymetry, topography, and vector data of metropolitan use are the main requirements for the proposed, detailed and proper vulnerability, resilience, hazard, and risk analyses.
4. A relationship for tsunami risk analysis is proposed (Eq. 1) considering hazard intensity, vulnerability of location, evacuation resilience, and the community’s degree of tsunami preparedness.
5. The flow depth in Yenikapı exceeds 6 m near the shore, and between the historical city walls behind the Yenikapı Fishery port and the shoreline, because of the accumulation of water volume. The inundation
Fig. 16 The risk maps derived from the proposed Eq. (1): a for Prince’s Islands normal (PIN) fault and b Yalova normal (YAN) fault

Page 20 of 22Cankaya et al. Earth, Planets and Space (2016) 68:133
distance reaches 200 m inland, depending on the YAN source simulations by tsunami numerical modeling.
6. Vulnerability and evacuation resilience mapping are conducted, and inundation is assessed using GIS-based MCDA. The AHP method is used to assign weight values to parameter layers and rank values to the classes. Four parameter layers (distance from shoreline, geology, elevation, metropolitan use) are prepared and used to produce the locational vulner-ability map. Four other parameter layers (distance to buildings, slope, distance to road network, and dis-tance within flat areas) are prepared and used to pro-duce the evacuation resilience map. The weight/rank values for these parameters are revealed using the AHP method, and combined accordingly to produce vulnerability at location and evacuation resilience maps for the Yenikapı region. In the calculation of the vulnerability score at location, the distance from the shoreline layer is the most influential layer depending on its weight value (0.4833), whereas the least influ-
ential layer is the metropolitan use layer based on its weight value (0.1042). The most effective parameter for evacuation resilience is found to be the distance to buildings layer with the value of 0.5808, whereas the least effective is the distance within flat areas layer with the value of 0.0716.
7. Two tsunami risk maps are generated by combin-ing the results of tsunami numerical models of two different sources, and GIS-based MCDA method results (vulnerability map and evacuation resil-ience map) in the new proposed tsunami risk map Eq. (1). For the Yenikapı region, the tsunami source YAN is selected as the most critical source, since the results of the simulations for YAN give higher flow depths and longer inundation distances. Therefore, the risk map obtained by combining the results of YAN source simulations, vulnerability at location, and the evacuation resilience is presented to be considered in the tsunami disaster mitigation system.
Fig. 17 Comparison of locational vulnerability map (a) and evacuation resilience map (b)

Page 21 of 22Cankaya et al. Earth, Planets and Space (2016) 68:133
Authors’ contributionsZCC compiled the data and carried out MeTHuVA procedure. She also made tsunami numerical simulations for Yenikapi and prepared M.Sc. thesis which was the main starting document of this paper. MLS developed MeTHuVA procedure, supervised M.Sc. thesis, and assessed the quality of the compiled data. ACY, developed the tsunami numerical model with AZ, commented on development of MeTHuVA, co-supervised M.Sc. thesis, monitored the simulations and checked the quality of outputs and the figures of simulation outputs. CK implemented MCDA procedure, and compiled the data. AZ devel-oped the tsunami numerical code NAMI DANCE with ACY, and developed necessary modules in teh code to output required tsunami parameters for the paper. BA made tsunami numerical simulations from the source to Yenikapi and reviewed the processed (mainly bathymetry) data and applied to the numerical model. All authors read and approved the final manuscript.
Author details1 Geological Engineering Department, Middle East Technical University, Ankara, Turkey. 2 Civil Engineering Department, Middle East Technical Univer-sity, Ankara, Turkey. 3 R&D Branch, Verisis Co., Ankara, Turkey. 4 Special Research Bureau for Automation of Marine Researches, Russian Academy of Sciences, 693013 Yuzhno-Sakhalinsk, Russia. 5 Nizhny Novgorod State Technical Univer-sity, 24 Minin Street, Nizhny Novgorod, Russia.
AcknowledgementsThis study was partly supported by a Japan–Turkey Joint Research Project of JICA on earthquakes and tsunamis in the Marmara region by MARDim SATREPS; EC project ASTARTE—Assessment, Strategy And Risk Reduction for Tsunamis in Europe-FP7-ENV2013 6.4-3, Grant 603839; UDAP-Ç-12-14 project
granted by Disaster Emergency Management Presidency of Turkey (AFAD), the RAPSODI (CONCERT_Dis-021) project in the framework of CONCERT-Japan, Research and Innovation Joint Call for connecting and cooperating European Research and Technology Development with Japan and TUBITAK 113M556 and 108Y227 Projects. The authors also thank Duygu Tufekci, Rachid Omira, and the anonymous reviewers for their valuable and constructive comments.
Received: 28 December 2015 Accepted: 6 July 2016
ReferencesAlexander D (2000) Confronting catastrophe: new perspectives on natural
disasters. Terra Publishing, New York, p 282Altınok Y, Alpar B, Özer N, Aykurt H (2011) Revision of the tsunami catalogue
affecting Turkish coasts and surrounding regions. Nat Hazards Earth Syst Sci 11(2):273–291
Atillah A, El Hadani D, Moudni H, Renou C, Lesne O, Mangin A, Rouffi F (2011) Tsunami vulnerability and damage assessment in the coastal area of Rabat and Sale, Morocco. Nat Hazards Syst Sci 11:3397–3414
Ayca A (2012) Development of a web GIS-based tsunami inundation mapping service: a case study for Marmara Sea Region. M.S. Thesis METU, Depart-ment of Civil Engineering, Ankara, Turkey
Aytöre B (2015) Assessment of tsunami resilience of ports by high resolution numerical modeling: a case study for Haydarpasa port in the sea of Mar-mara. M.Sc. thesis, METU Department of Civil Engineering, Ankara, Turkey
Fig. 18 Snapshot of proposed method and stages: a hazard intensity, tsunami inundation map for both PIN and YAN tsunami sources, b MeTHuVA results, vulnerability at location and evacuation resilience maps, c tsunami risk maps

Page 22 of 22Cankaya et al. Earth, Planets and Space (2016) 68:133
Aytöre B, Çankaya ZC, Yalçıner AC, Süzen ML, Zaytsev A (2014) High-resolution data processing and tsunami assessment and applications to ports in the Sea of Marmara. In: METSZ, international workshop on mega earthquakes and tsunamis in subduction zones: forecasting approaches and implica-tions for hazard assessment, 6–8 Oct 2014, Rhodes, Greece
Aytöre B, Yalçıner AC, Zaytsev A, Çankaya ZC, Süzen ML (2015) Assessment of tsunami resilience of Haydarpasa port. In: Marmara sea by high-resolution numerical modeling, (this issue)
Benchekroun S, Omira R, Baptista MA, El Mouraouah A, Brahim AI, Toto EA (2015) Tsunami impact and vulnerability in the harbour area of Tangier, Morocco. Geomat Nat Hazards Risk 6(8):718–740
Çankaya ZC (2015) High-resolution tsunami vulnerability assessment by GIS-based multi-criteria decision making analysis at Yenikapı, Istanbul. M.Sc. Thesis, METU, Department of Geological Engineering, Ankara, Turkey
Cartwright JHE, Nakamura H (2008) Tsunami: a history of the term and of scientific understanding of the phenomenon in Japanese and Western culture. Notes Rec R Soc 62(2):151–166
Cheung KF, Phadke AC, Wei Y, Rojas R, Douyere Y, Martino CD, Houston SH, Liu P, Lynett PJ, Dodd N, Liao S, Nakazaki E (2003) Modelling of storm induced coastal flooding for emergency management. Ocean Eng 30(1353–1386):2
Dall’Osso F, Gonella M, Gabbianelli G, Withycombe G, Dominey-Howes D (2009a) Assessing the vulnerability of buildings to tsunami in Sydney. NHESS 9:2015–2026
Dall’Osso F, Gonella M, Gabbianelli G, Withycombe G, Dominey-Howes D (2009b) A revised (PTVA) model for assessing the vulnerability of build-ings to tsunami. NHESS 9(5):1557–1565
Dominey-Howes D, Papathoma M (2007) Validating a tsunami vulnerability assessment model (the PTVA Model) using field data from the 2004 Indian Ocean tsunami. Nat Hazards 40(1):113–136
Eckert S, Jelinek R, Zeug G, Krausmann E (2012) Remote sensing-based assess-ment of tsunami vulnerability and risk in Alexandria, Egypt. Appl Geogr 32:714–723
Fischer T, Alvarez M, Dela Llera J, Riddell R (2002) An integrated model for earthquake risk assessment of buildings. Eng Struct 24:979–998
Gambolati G, Teatini P, Gonella M (2002) GIS simulations of the inundation risk in the coastal lowlands of the northern Adriatic Sea. Math Comput. Model 35:963–972
Ghobarah A, Saatcioglu M, Nistor I (2006) The impact of the 26 December 2004 earthquake and tsunami on structures and infrastructure. Eng Struct 28(2):312–326
Graehl NA, Dengler L (2008) Using a GIS to model tsunami evacuation times for the community of Fairhaven, California. In: AGU Fall Meet Abstracts, vol 1. p 1324
Hebert H, Schindele F, Altınok Y, Alpar B, Gazioglu C (2005) Tsunami hazard in the Marmara Sea (Turkey): a numerical approach to discuss active fault-ing and impact on the Istanbul coastal areas. Mar Geol 215:23–43
IMM (2015) Geological Map. http://www.ibb.gov.tr/tr-TR/SubSites/Deprem-Site/Documents/EK2_Jeoloji_Haritasi_1440x910_25000_300DPI.pdf. Accessed Sep 2014
Ismail H, Abd Wahab AK, Mohd Amin MF, Mohd Yunus MZ, Jaffar Sidek F, Esfandier BJ (2012) A 3-tier tsunami vulnerability assessment technique for the north-west coast of Peninsular Malaysia. Nat Hazards 63:549–573
Jenkins L (2000) Selecting scenarios for environmental disaster planning. Eur J Oper Res 121:275–286
Koshimura S, Oie T, Yanagisawa H, Imamura F (2009a) Developing fragility curves for tsunami damage estimation using numerical model and post-tsunami data from Banda Aceh, Indonesia. Coast Eng J 51:243
Koshimura S, Namegaya Y, Yanagisawa H (2009b) Tsunami fragility: a new measure to assess tsunami damage. J Disaster Res 4(6):479–488
Leone F, Lavigneb F, Parisc R, Denaina JC, Vineta F (2011) A spatial analysis of the December 26th, 2004 tsunami-induced damages: lessons learned for a better risk assessment integrating buildings vulnerability. Appl Geogr 31(1):363–375
Mas E, Adriano B, Koshimura S, Imamura F, Kuroiwa JH, Yamazaki F, Zavala C, Estrada M (2014) Identifying evacuees’ demand of tsunami shelters using agent based simulation, in tsunami events and lessons learned: environmental and societal significance, Chapter 19. In: Kontar YA et al (eds) Advances in natural and technological hazards research 35, vol 35. Springer Science + Business Media, Dordrecht, pp 347–358
Murthy M, Usha T, Pari Y, Reddy N (2011) Tsunami vulnerability assessment of Cuddalore using numerical model and GIS. Mar Geod 34(1):16–28
NAMI DANCE (2015) Tsunami numerical modeling NAMI DANCE manual. http://namidance.ce.metu.edu.tr/pdf/NAMIDANCE-version-5-9-manual.pdf
Omira R, Baptista MA, Miranda JM, Toto E, Catita C, Catalao J (2010) 2010, Tsunami vulnerability assessment of Casablanca Morocco using numerical modelling and GIS tools. Nat Hazards 54:75–95. doi:10.1007/s11069-009-9454-4
OYO-IMM (2008) Project report on simulation and vulnerability analysis of Tsunamis affecting the Istanbul Coasts. Istanbul: OYO Int. Co. (Japan) for Istanbul Metropolitan Municipality (IMM)
Özdemir KK (2014) Database development for tsunami information system. M.Sc. Thesis, METU Department of Civil Engineering, Ankara, Turkey
Papathoma M, Dominey-Howes D, Zong Y, Smith D (2003) Assessing tsunami vulnerability, an example from Heraklion, Crete. Nat Hazards Earth Syst Sci 3:377–389
Pendleton EA, Barras JA, Williams SJ, Twichell DC (2010) Coastal vulnerability assessment of the northern gulf of Mexico to sea-level rise and coastal change. In: US geological survey open-file report 2010–1146
Reese S, Cousins WJ, Power WL, Palmer NG, Tejakusuma IG, Nugrahadi S (2007) Tsunami vulnerability of buildings and people in South Java—field observations after the July 2006 Java tsunami. Nat Hazards Earth Syst Sci 7:573–589
Saaty TL (1990) How to make a decision: the analytic hierarchy process. Eur J Oper Res 48:9–26
Santos A, Tavares AO, Emidio A (2014) Comparative tsunami vulnerability assessment of an urban area: an analysis of Setúbal city, Portugal. Appl Geogr 55:19–29
Sinaga TPT, Nugroho A, Lee YW, Yongcheol S (2011) GIS mapping of tsunami vulnerability: case study of the Jembrana regency in Bali, Indonesia. KSCE J Civil Eng 15(3):537–543
Smith AD, Taymaz T, Oktay F, Yüce H, Alpar B, Başaran H, Jackson JA, Kara S, Şimşek M (1995) High-resolution seismic profiling in the sea of Marmara (Northwest Turkey): late quaternary sedimentation and sea-level changes. Geol Soc Am Bull 107:923–936
Suppasri A, Koshimura S, Imai K, Mas E, Gokon H, Muhari A, Imamura F (2012a) Field survey and damage characteristic of the 2011 Tohoku tsunami in Miyagi prefecture. Coast Eng J 54:1250005
Suppasri A, Mas E, Koshimura S, Imai K, Harada K, Imamura F (2012b) Develop-ing tsunami fragility curves from the surveyed data of the 2011 Great East Japan tsunami in Sendai and Ishinomaki Plains. Coast Eng J 54:1250008
Suppasri A, Mas E, Koshimura S, Charvet I, Gunasekera R, Imai K, Kukutaro Y, Abe Y, Imamura F (2013) Building damage characteristics based on surveyed data and fragility curves of the 2011 Great East Japan tsunami. Nat Hazards 66:319–341
Tarbotton C, Dominey-Howes D, Goff JR, Papathoma-Kohle M, Dall’Osso F, Turner IL (2012) GIS-based techniques for assessing the vulnerability of buildings to tsunami: current approaches and future steps. Geol Soc Lond Spec Publ 361(1):115–125
Taubenböck H, Post J, Roth A, Zosseder K, Strunz G, Dech S (2008) A concep-tual vulnerability and risk framework as outline to identify capabilities of remote sensing. Nat Hazards Earth Syst Sci 8:409–420
Tüfekci S (1995) An integrated emergency management decision support system for hurricane emergencies. Saf Sci 20:39–48
Usha T, Murthy MVR, Reddy NT, Mishra P (2012) Tsunami vulnerability in urban areas using numerical model and GIS. Nat Hazards 60(2012):135–147
Valencia N, Gardi A, Gauraz A, Leone F, Guillande R (2011) New tsunami damage functions developed in the framework of SCHEMA project: application to European-Mediterranean coasts. Nat Hazards Earth Syst Sci 11:2835–2846
Wisner B, Blaikie P, Cannon T, Davis I (2004) At risk: natural hazards, people’s vulnerability and disasters. Routledge, 2nd edn. p 284
Wood N (2009) Tsunami exposure estimation with land-cover data: oregon and the Cascadia subduction zone. Appl Geogr 29:158–170
Yalciner AC, Alpar B, Altınok Y, Özbay İ, Imamura F (2002) Tsunamis in the Sea of Marmara: historical documents for the past, models for the future. Mar Geol 190:445–463
Yaltırak C, Alpar B, Sakınç M, Yüce H (2000) Origin of the Strait of Canakkale (Dardanelles): regional tectonics and the Mediterranean–Marmara incur-sion. Mar Geol 164:139–156 (with erratum 167, 189–190)
Recommended