A Shared Visionfor the
Survey of California VegetationThe Center for Geographical Studies |
EndorsementsAudubon California – National Audubon SocietyBureau of Land ManagementCalifornia Energy CommissionCalifornia Coastal CommissionCalifornia Department of Water ResourcesCalifornia Environmental Protection AgencyCalifornia GIS CouncilCalifornia Invasive Plant CouncilCalifornia Native Plant SocietyCalifornia OaksCalifornia State ParksCalifornia Department of TransportationCalifornia Wildlife FoundationDefenders of WildlifeEcological Society of AmericaEsriFederal Geographic Data Committee
Geographical Information Center, California State University, ChicoInformation Center for the Environment, University of California, DavisNatureServePacific Gas and Electric CompanyPacific States Marine Fisheries CommissionSmith River AllianceSonoma County Agricultural Preservation and Open Space DistrictSouthern California Coastal Water Research ProjectU.S. Fish and Wildlife ServiceU.S. Geological SurveyU.S. National Vegetation ClassificationThe Wildlands ConservancyWildlife Conservation Board, State of CaliforniaWestern Regional Partnership
A Shared Vision for the
Survey of California Vegetation
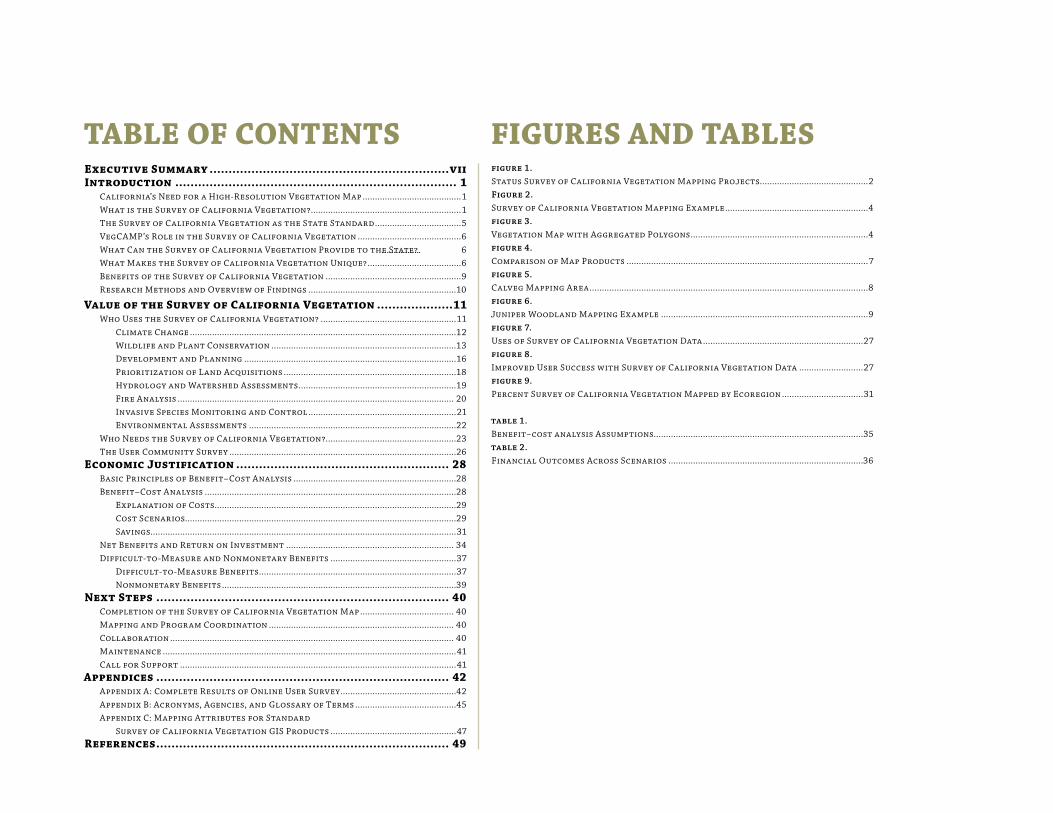
TABLE OF CONTENTS FIGURES AND TABLESExecutive Summary ...............................................................viiIntroduction .......................................................................... 1 California’s Need for a High-Resolution Vegetation Map ����������������������������������������1 What is the Survey of California Vegetation? �������������������������������������������������������������1 The Survey of California Vegetation as the State Standard �����������������������������������5 VegCAMP’s Role in the Survey of California Vegetation ������������������������������������������6 What Can the Survey of California Vegetation Provide to the State? 6 What Makes the Survey of California Vegetation Unique? ��������������������������������������6 Benefits of the Survey of California Vegetation �������������������������������������������������������9 Research Methods and Overview of Findings ������������������������������������������������������������10
Value of the Survey of California Vegetation ....................11 Who Uses the Survey of California Vegetation? �������������������������������������������������������11
Climate Change ������������������������������������������������������������������������������������������������������������12 Wildlife and Plant Conservation ���������������������������������������������������������������������������13 Development and Planning ��������������������������������������������������������������������������������������16 Prioritization of Land Acquisitions ����������������������������������������������������������������������18 Hydrology and Watershed Assessments ����������������������������������������������������������������19 Fire Analysis ���������������������������������������������������������������������������������������������������������������� 20 Invasive Species Monitoring and Control ������������������������������������������������������������21 Environmental Assessments ������������������������������������������������������������������������������������22
Who Needs the Survey of California Vegetation? �����������������������������������������������������23 The User Community Survey ��������������������������������������������������������������������������������������������26Economic Justification ........................................................ 28 Basic Principles of Benefit–Cost Analysis ������������������������������������������������������������������28 Benefit–Cost Analysis ������������������������������������������������������������������������������������������������������28
Explanation of Costs ��������������������������������������������������������������������������������������������������29 Cost Scenarios��������������������������������������������������������������������������������������������������������������29 Savings����������������������������������������������������������������������������������������������������������������������������31
Net Benefits and Return on Investment �������������������������������������������������������������������� 34 Difficult-to-Measure and Nonmonetary Benefits ���������������������������������������������������37
Difficult-to-Measure Benefits ��������������������������������������������������������������������������������37 Nonmonetary Benefits �����������������������������������������������������������������������������������������������39
Next Steps ............................................................................. 40 Completion of the Survey of California Vegetation Map �������������������������������������� 40 Mapping and Program Coordination ��������������������������������������������������������������������������� 40 Collaboration ������������������������������������������������������������������������������������������������������������������� 40 Maintenance �����������������������������������������������������������������������������������������������������������������������41 Call for Support ����������������������������������������������������������������������������������������������������������������41Appendices ............................................................................. 42 Appendix A: Complete Results of Online User Survey �����������������������������������������������42 Appendix B: Acronyms, Agencies, and Glossary of Terms �����������������������������������������45 Appendix C: Mapping Attributes for Standard Survey of California Vegetation GIS Products ���������������������������������������������������47References ............................................................................. 49
figure 1. Status Survey of California Vegetation Mapping Projects��������������������������������������������2 Figure 2. Survey of California Vegetation Mapping Example ����������������������������������������������������������4 figure 3. Vegetation Map with Aggregated Polygons ������������������������������������������������������������������������4 figure 4. Comparison of Map Products ��������������������������������������������������������������������������������������������������7 figure 5. Calveg Mapping Area �����������������������������������������������������������������������������������������������������������������8 figure 6. Juniper Woodland Mapping Example ������������������������������������������������������������������������������������9 figure 7. Uses of Survey of California Vegetation Data �����������������������������������������������������������������27 figure 8. Improved User Success with Survey of California Vegetation Data ��������������������������27 figure 9. Percent Survey of California Vegetation Mapped by Ecoregion ���������������������������������31
table 1. Benefit–cost analysis Assumptions�������������������������������������������������������������������������������������35 table 2. Financial Outcomes Across Scenarios �������������������������������������������������������������������������������36
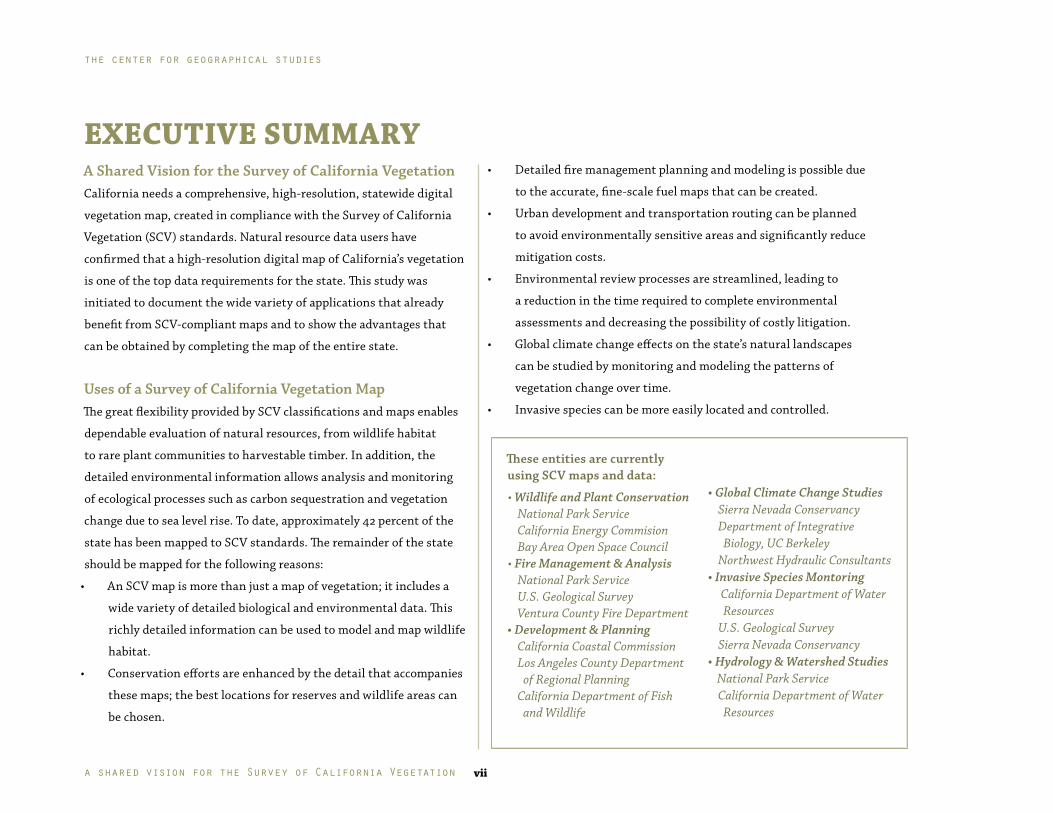
EXECUTIVE SUMMARYA Shared Vision for the Survey of California VegetationCalifornia needs a comprehensive, high-resolution, statewide digital
vegetation map, created in compliance with the Survey of California
Vegetation (SCV) standards� Natural resource data users have
confirmed that a high-resolution digital map of California’s vegetation
is one of the top data requirements for the state� This study was
initiated to document the wide variety of applications that already
benefit from SCV-compliant maps and to show the advantages that
can be obtained by completing the map of the entire state�
Uses of a Survey of California Vegetation MapThe great flexibility provided by SCV classifications and maps enables
dependable evaluation of natural resources, from wildlife habitat
to rare plant communities to harvestable timber� In addition, the
detailed environmental information allows analysis and monitoring
of ecological processes such as carbon sequestration and vegetation
change due to sea level rise� To date, approximately 42 percent of the
state has been mapped to SCV standards� The remainder of the state
should be mapped for the following reasons:
• An SCV map is more than just a map of vegetation; it includes a
wide variety of detailed biological and environmental data� This
richly detailed information can be used to model and map wildlife
habitat�
• Conservation efforts are enhanced by the detail that accompanies
these maps; the best locations for reserves and wildlife areas can
be chosen�
• Detailed fire management planning and modeling is possible due
to the accurate, fine-scale fuel maps that can be created�
• Urban development and transportation routing can be planned
to avoid environmentally sensitive areas and significantly reduce
mitigation costs�
• Environmental review processes are streamlined, leading to
a reduction in the time required to complete environmental
assessments and decreasing the possibility of costly litigation�
• Global climate change effects on the state’s natural landscapes
can be studied by monitoring and modeling the patterns of
vegetation change over time�
• Invasive species can be more easily located and controlled�
These entities are currently using SCV maps and data:
• Wildlife and Plant ConservationNational Park ServiceCalifornia Energy CommisionBay Area Open Space Council
• Fire Management & Analysis National Park ServiceU.S. Geological SurveyVentura County Fire Department
• Development & PlanningCalifornia Coastal CommissionLos Angeles County Department
of Regional PlanningCalifornia Department of Fish
and Wildlife
• Global Climate Change Studies Sierra Nevada ConservancyDepartment of Integrative
Biology, UC BerkeleyNorthwest Hydraulic Consultants
• Invasive Species Montoring California Department of Water
ResourcesU.S. Geological SurveySierra Nevada Conservancy
• Hydrology & Watershed Studies National Park ServiceCalifornia Department of Water
Resources
the center for geographical studies
a shared vision for the Survey of California Vegetation vii
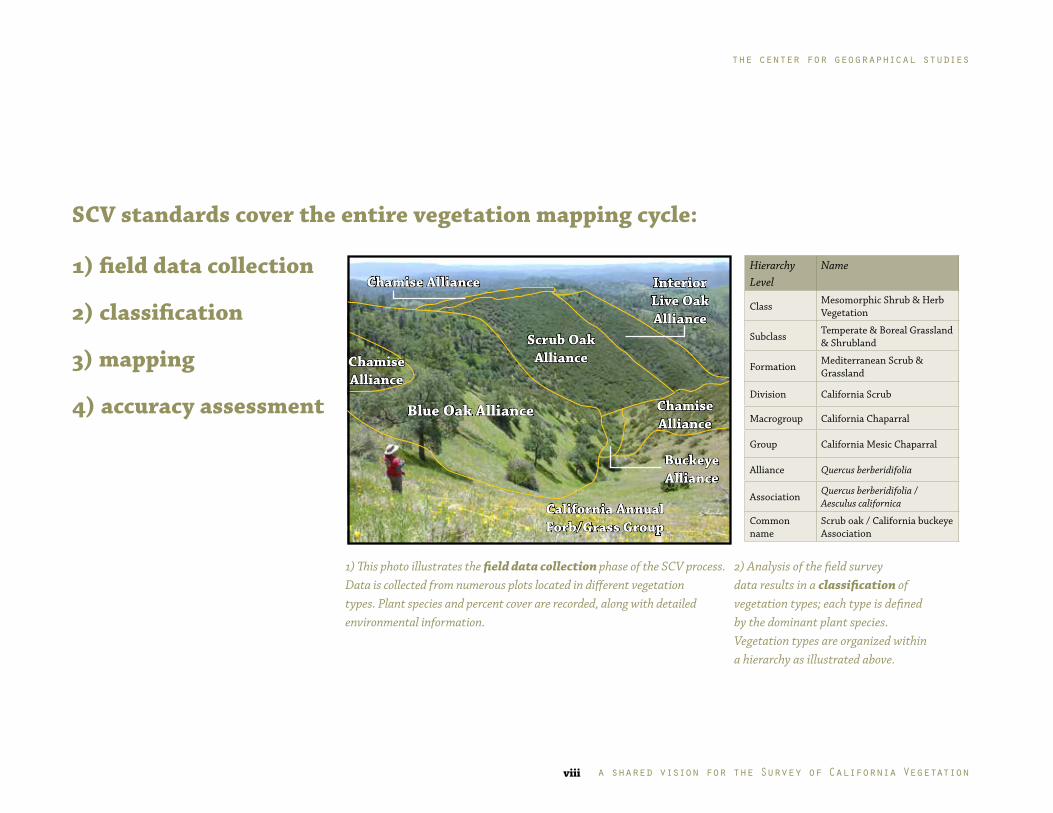
SCV standards cover the entire vegetation mapping cycle:
Hierarchy Level
Name
ClassMesomorphic Shrub & Herb Vegetation
SubclassTemperate & Boreal Grassland & Shrubland
FormationMediterranean Scrub & Grassland
Division California Scrub
Macrogroup California Chaparral
Group California Mesic Chaparral
Alliance Quercus berberidifolia
AssociationQuercus berberidifolia / Aesculus californica
Common name
Scrub oak / California buckeye Association
2) Analysis of the field survey data results in a classification of vegetation types; each type is defined by the dominant plant species. Vegetation types are organized within a hierarchy as illustrated above.
1) This photo illustrates the field data collection phase of the SCV process. Data is collected from numerous plots located in different vegetation types. Plant species and percent cover are recorded, along with detailed environmental information.
1) field data collection
2) classification
3) mapping
4) accuracy assessment
a shared vision for the Survey of California Vegetation
the center for geographical studies
viii
Interior Live OakAlliance
Scrub OakAlliance
Buckeye Alliance
California Annual Forb/Grass Group
Blue Oak Alliance
Chamise Alliance
Chamise Alliance
Chamise Alliance
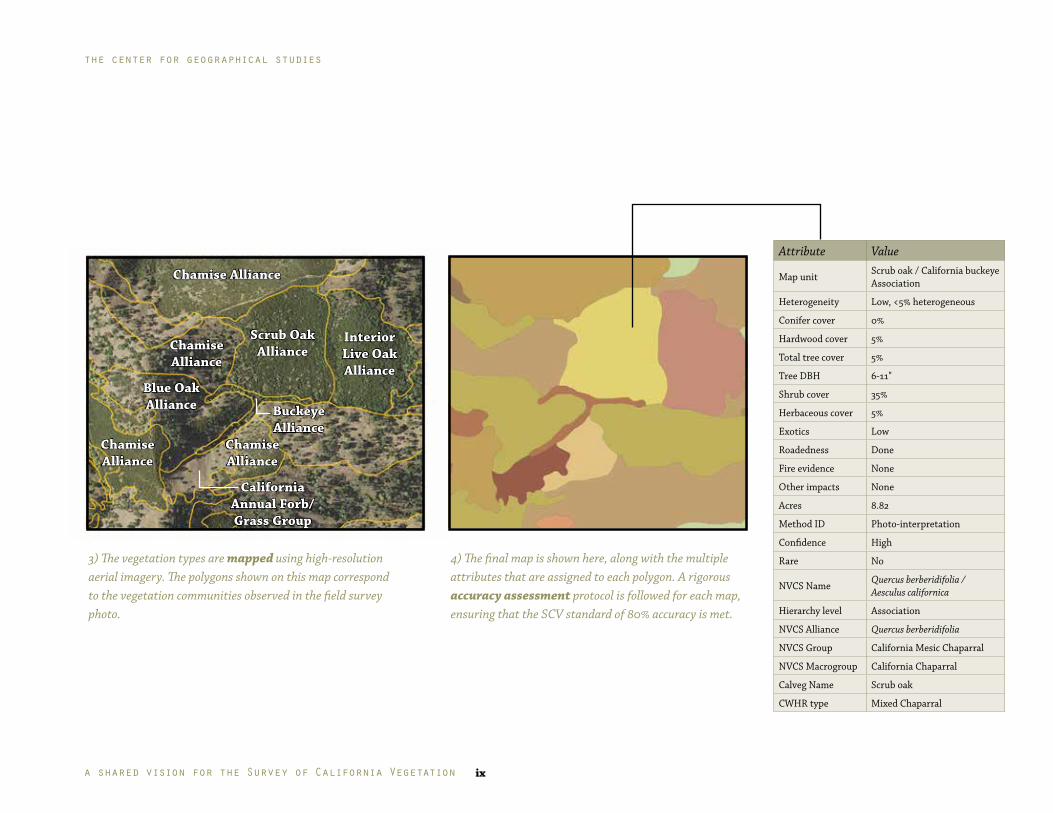
3) The vegetation types are mapped using high-resolution aerial imagery. The polygons shown on this map correspond to the vegetation communities observed in the field survey photo.
4) The final map is shown here, along with the multiple attributes that are assigned to each polygon. A rigorous accuracy assessment protocol is followed for each map, ensuring that the SCV standard of 80% accuracy is met.
Attribute Value
Map unitScrub oak / California buckeye Association
Heterogeneity Low, <5% heterogeneous
Conifer cover 0%
Hardwood cover 5%
Total tree cover 5%
Tree DBH 6-11"
Shrub cover 35%
Herbaceous cover 5%
Exotics Low
Roadedness Done
Fire evidence None
Other impacts None
Acres 8�82
Method ID Photo-interpretation
Confidence High
Rare No
NVCS NameQuercus berberidifolia / Aesculus californica
Hierarchy level Association
NVCS Alliance Quercus berberidifolia
NVCS Group California Mesic Chaparral
NVCS Macrogroup California Chaparral
Calveg Name Scrub oak
CWHR type Mixed Chaparral
the center for geographical studies
a shared vision for the Survey of California Vegetation ix
Chamise Alliance
Chamise Alliance
Blue Oak Alliance
Scrub OakAlliance
Chamise Alliance
InteriorLive OakAlliance
Buckeye Alliance
California Annual Forb/Grass Group
Chamise Alliance
Completing the Statewide MapThis document presents a detailed benefit–cost analysis to justify the
completion of the SCV map of California� Case studies of the many
current uses of SCV-compliant maps and data are presented, along
with the results of a survey of map users throughout the state� The
analysis concludes that there is significant demand for a statewide,
high-resolution, SCV-compliant map of California, and projects
a return on investment from 15% to over 550% under a variety of
different scenarios� A large and diverse group of scientists, public
agencies, and private firms will experience many map-related benefits�
Production of a completed SCV-compliant vegetation map of
California by 2020 is a well-justified goal� This very important goal
can only be achieved with the support of the diverse organizations
and agencies that will benefit most from the high resolution, proven
accuracy, and detailed data that comprise this map�
What is the Survey of California Vegetation?The Survey of California Vegetation (SCV) is a framework that sets
the standards for vegetation surveying, classification, and mapping
in California� The SCV standards were developed by the California
Department of Fish and Wildlife and the California Native Plant
Society in partnership with the Federal Geographic Data Committee’s
Vegetation Subcommittee� The SCV complies with the National
Vegetation Classification Standard and supports the national
classification through regular updates� This means that vegetation maps
produced for California can be joined seamlessly with maps of adjoining
states, and that analysis of vegetation and habitats within the state and
throughout the region will use a common language�
a shared vision for the Survey of California Vegetation
the center for geographical studies
x
California’s Need for a High-Resolution Vegetation MapThe completion of a statewide, high-resolution vegetation map is
crucial for effectively managing California’s natural resources and for
fostering conservation of those resources; without it, the government
entities tasked with these responsibilities cannot operate efficiently�
Over the past two decades, the demand for a detailed vegetation map
of California has been established among government agencies and
councils, researchers, and experts in various fields� Through a series
of statewide data forums conducted for the California Geospatial
Framework Data Plan (Baker et al�, 2006), California state and local
agency Geographic Information System (GIS) users have identified
a statewide, high-resolution digital vegetation map as one of their
top framework data requirements� In fact, of the top 11 geospatial
framework data needs identified by these users, vegetation mapping
addresses all or a portion of four�
A statewide map is in demand because vegetation is often considered
the single best surrogate for habitat and ecosystems, and as such, it
addresses several statewide and local needs� According to the Data
Plan, a vegetation map consistent across all types of land ownership
is deemed critical for assessing current conditions, monitoring
long-term changes, and determining land management options�
Although other statewide vegetation maps currently exist and are
often sufficient for multi-region or statewide broad-spectrum uses,
they are inadequate for numerous other applications as discussed in
this report�
INTRODUCTIONThis report describes the Survey of California Vegetation, a
framework for standardized vegetation classification and mapping
in the state� It presents data on the utility of the SCV for natural
resource management and many other applications, and provides
a benefit–cost analysis demonstrating that cost savings and better
decision making can be achieved by completion of a statewide map�
To date, 42 percent of the state has been mapped to the standards
set in the SCV (Figure 1), but additional funding is needed to
complete the task for the rest of California�
What is the Survey of California Vegetation?The Survey of California Vegetation (SCV) is a framework that sets
the standards for vegetation surveying, classification, and mapping
in California�
• The SCV survey standards provide protocols for the collection
of detailed vegetation data, including plant species and percent
cover, structure (such as the height and diameter of dominant
trees), and environmental information (such as slope, aspect,
and soil texture)�
• The SCV classification standards conform to the National
Vegetation Classification System (NVCS) and international
standards, and categorize species into a hierarchy; for instance
the “Californian Broadleaf Forest and Woodland Group”
contains the “Blue Oak Alliance” which contains the “Blue Oak–
Valley Oak Association�” (See the sidebar on Page 3)
a shared vision for the Survey of California Vegetation 1
the center for geographical studies
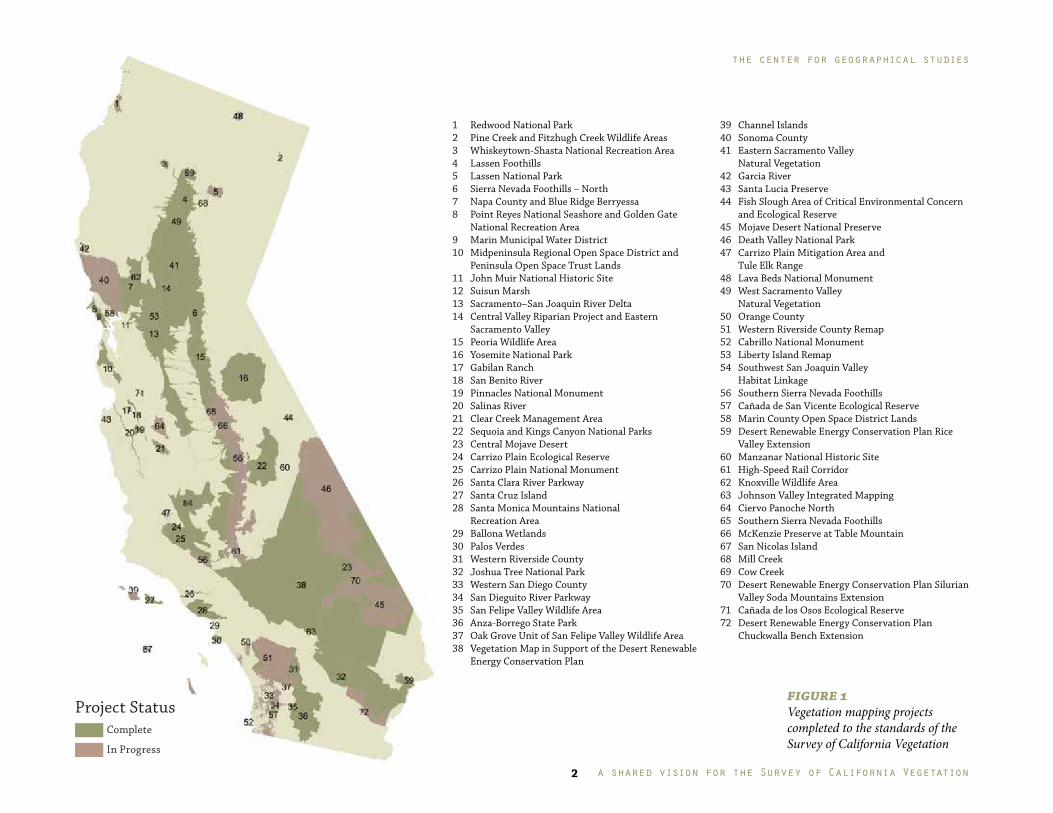
figure 1 Vegetation mapping projects completed to the standards of theSurvey of California Vegetation
1 Redwood National Park2 Pine Creek and Fitzhugh Creek Wildlife Areas3 Whiskeytown-Shasta National Recreation Area4 Lassen Foothills5 Lassen National Park6 Sierra Nevada Foothills – North7 Napa County and Blue Ridge Berryessa8 Point Reyes National Seashore and Golden Gate
National Recreation Area9 Marin Municipal Water District10 Midpeninsula Regional Open Space District and
Peninsula Open Space Trust Lands11 John Muir National Historic Site12 Suisun Marsh13 Sacramento–San Joaquin River Delta14 Central Valley Riparian Project and Eastern
Sacramento Valley15 Peoria Wildlife Area16 Yosemite National Park17 Gabilan Ranch 18 San Benito River 19 Pinnacles National Monument20 Salinas River 21 Clear Creek Management Area22 Sequoia and Kings Canyon National Parks23 Central Mojave Desert 24 Carrizo Plain Ecological Reserve25 Carrizo Plain National Monument26 Santa Clara River Parkway 27 Santa Cruz Island 28 Santa Monica Mountains National
Recreation Area29 Ballona Wetlands 30 Palos Verdes31 Western Riverside County32 Joshua Tree National Park33 Western San Diego County34 San Dieguito River Parkway 35 San Felipe Valley Wildlife Area36 Anza-Borrego State Park37 Oak Grove Unit of San Felipe Valley Wildlife Area38 Vegetation Map in Support of the Desert Renewable
Energy Conservation Plan
39 Channel Islands 40 Sonoma County 41 Eastern Sacramento Valley
Natural Vegetation42 Garcia River 43 Santa Lucia Preserve 44 Fish Slough Area of Critical Environmental Concern
and Ecological Reserve45 Mojave Desert National Preserve 46 Death Valley National Park47 Carrizo Plain Mitigation Area and
Tule Elk Range48 Lava Beds National Monument 49 West Sacramento Valley
Natural Vegetation50 Orange County 51 Western Riverside County Remap 52 Cabrillo National Monument53 Liberty Island Remap54 Southwest San Joaquin Valley
Habitat Linkage56 Southern Sierra Nevada Foothills 57 Cañada de San Vicente Ecological Reserve58 Marin County Open Space District Lands59 Desert Renewable Energy Conservation Plan Rice
Valley Extension60 Manzanar National Historic Site61 High-Speed Rail Corridor 62 Knoxville Wildlife Area63 Johnson Valley Integrated Mapping 64 Ciervo Panoche North 65 Southern Sierra Nevada Foothills 66 McKenzie Preserve at Table Mountain 67 San Nicolas Island68 Mill Creek 69 Cow Creek 70 Desert Renewable Energy Conservation Plan Silurian
Valley Soda Mountains Extension 71 Cañada de los Osos Ecological Reserve72 Desert Renewable Energy Conservation Plan
Chuckwalla Bench Extension
figure 1 Vegetation mapping projects completed to the standards of theSurvey of California Vegetation
Complete
Project Status
In Progress
36 Anza-Borrego SP37 Oak Grove (DFG)38 Vegetation Map in Support of the DRECP39 Channel Islands40 Sonoma County41 Eastern Sacramento Valley Natural Vegetation42 Garcia River43 Santa Lucia Preserve44 Fish Slough45 Mojave Desert National Preserve46 Death Valley NP47 Carrizo CDFW Extension48 Lava Beds NM49 West Sacramento Valley Natural Vegetation50 Orange County51 Western Riverside County remap52 Cabrillo NM53 Liberty Island Remap54 SW San Joaquin Valley Habitat Linkage56 Southern Sierra Nevada Foothills 57 Canada de San Vicente58 Marin County Open Space District59 Vegetation for the DRECP Rice Valley extension60 Manzanar NHS61 Hi-speed Rail Corridor Habitat62 Knoxville WLA (CDFW)63 Johnson Valley Integrated Mapping64 Ciervo Panoche North65 Southern Sierra Nevada Foothills - northern module66 McKenzie Preserve at Table Mountain67 San Nicolas Island 68 Mill Creek69 Cow Creek70 Vegetation for the DRECP Silurian Valley Soda Mtns. extension71 Canada de los Osos ER (CDFW)72 Vegetation for the DRECP Chuckwalla Bench extension
1 Redwood NP2 Pine and Fitzhugh Creeks WLAs (DFG)3 Whiskeytown-Shasta NRA4 Lassen foothills5 Lassen NP6 Sierra Nevada Foothills-North7 Napa County and Blue Ridge Berryessa8 Pt. Reyes and Golden Gate NRA9 Marin Municipal Water District10 Midpeninsula Regional Open Space District- Peninsula Open Space Trust11 John Muir NHS12 Suisun Marsh13 Sacramento-San Joaquin River Delta14 Central Valley Riparian Project and Eastern Sacramento Valley-Alliance Level15 Peoria WLA (BOR)16 Yosemite NP17 Gablian Ranch18 San Benito River19 Pinnacles NM20 Salinas River21 Clear Creek Managment Area22 Sequoia and Kings Canyon NP23 Central Mojave Desert24 Carrizo Plain ER (CDFW)25 Carrizo Plain NM (BLM)26 Santa Clara River Parkway27 Santa Cruz Island28 Santa Monica Mountains NRA29 Ballona Wetlands30 Palos Verdes31 Western Riverside County32 Joshua Tree NP33 Western San Diego Co.34 San Dieguito River Parkway35 San Felipe WLA (DFG)
vegetation mapping feasibility study |
the center for geographical studies
2figure 1 Vegetation mapping projects completed to the standards of theSurvey of California Vegetation
Complete
Project Status
In Progress
36 Anza-Borrego SP37 Oak Grove (DFG)38 Vegetation Map in Support of the DRECP39 Channel Islands40 Sonoma County41 Eastern Sacramento Valley Natural Vegetation42 Garcia River43 Santa Lucia Preserve44 Fish Slough45 Mojave Desert National Preserve46 Death Valley NP47 Carrizo CDFW Extension48 Lava Beds NM49 West Sacramento Valley Natural Vegetation50 Orange County51 Western Riverside County remap52 Cabrillo NM53 Liberty Island Remap54 SW San Joaquin Valley Habitat Linkage56 Southern Sierra Nevada Foothills 57 Canada de San Vicente58 Marin County Open Space District59 Vegetation for the DRECP Rice Valley extension60 Manzanar NHS61 Hi-speed Rail Corridor Habitat62 Knoxville WLA (CDFW)63 Johnson Valley Integrated Mapping64 Ciervo Panoche North65 Southern Sierra Nevada Foothills - northern module66 McKenzie Preserve at Table Mountain67 San Nicolas Island 68 Mill Creek69 Cow Creek70 Vegetation for the DRECP Silurian Valley Soda Mtns. extension71 Canada de los Osos ER (CDFW)72 Vegetation for the DRECP Chuckwalla Bench extension
1 Redwood NP2 Pine and Fitzhugh Creeks WLAs (DFG)3 Whiskeytown-Shasta NRA4 Lassen foothills5 Lassen NP6 Sierra Nevada Foothills-North7 Napa County and Blue Ridge Berryessa8 Pt. Reyes and Golden Gate NRA9 Marin Municipal Water District10 Midpeninsula Regional Open Space District- Peninsula Open Space Trust11 John Muir NHS12 Suisun Marsh13 Sacramento-San Joaquin River Delta14 Central Valley Riparian Project and Eastern Sacramento Valley-Alliance Level15 Peoria WLA (BOR)16 Yosemite NP17 Gablian Ranch18 San Benito River19 Pinnacles NM20 Salinas River21 Clear Creek Managment Area22 Sequoia and Kings Canyon NP23 Central Mojave Desert24 Carrizo Plain ER (CDFW)25 Carrizo Plain NM (BLM)26 Santa Clara River Parkway27 Santa Cruz Island28 Santa Monica Mountains NRA29 Ballona Wetlands30 Palos Verdes31 Western Riverside County32 Joshua Tree NP33 Western San Diego Co.34 San Dieguito River Parkway35 San Felipe WLA (DFG)
vegetation mapping feasibility study |
the center for geographical studies
2
a shared vision for the Survey of California Vegetation
the center for geographical studies
2
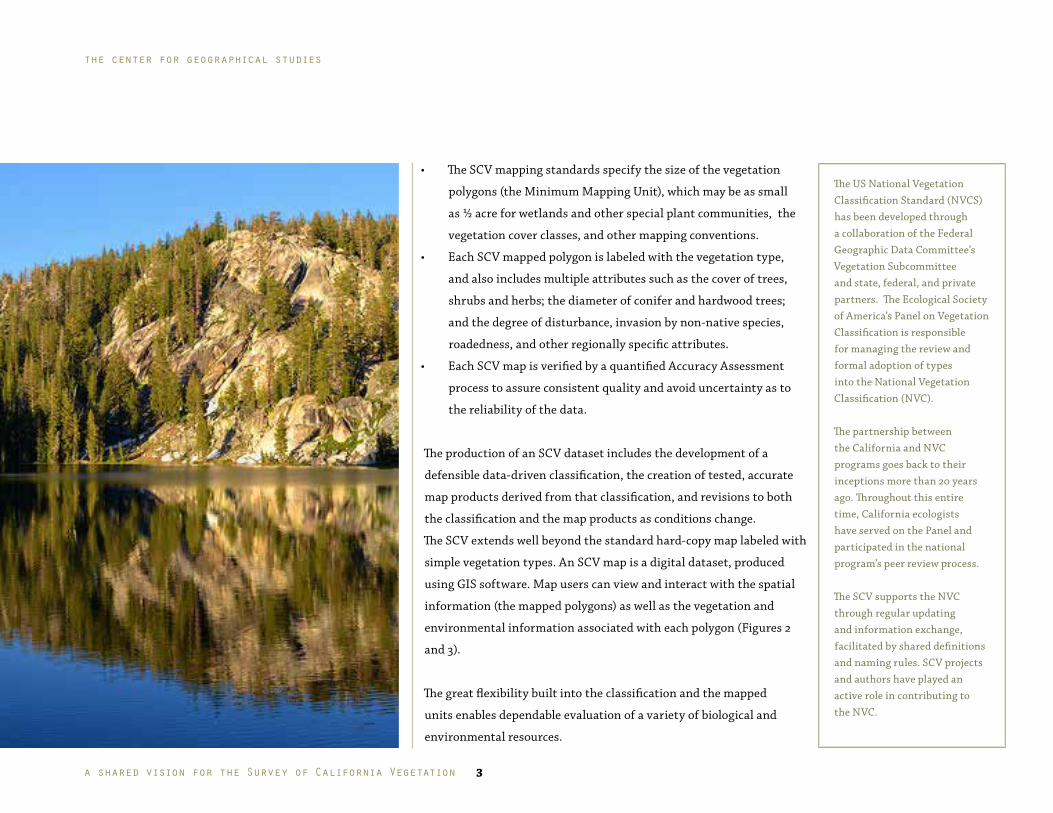
• The SCV mapping standards specify the size of the vegetation
polygons (the Minimum Mapping Unit), which may be as small
as ½ acre for wetlands and other special plant communities, the
vegetation cover classes, and other mapping conventions�
• Each SCV mapped polygon is labeled with the vegetation type,
and also includes multiple attributes such as the cover of trees,
shrubs and herbs; the diameter of conifer and hardwood trees;
and the degree of disturbance, invasion by non-native species,
roadedness, and other regionally specific attributes�
• Each SCV map is verified by a quantified Accuracy Assessment
process to assure consistent quality and avoid uncertainty as to
the reliability of the data�
The production of an SCV dataset includes the development of a
defensible data-driven classification, the creation of tested, accurate
map products derived from that classification, and revisions to both
the classification and the map products as conditions change�
The SCV extends well beyond the standard hard-copy map labeled with
simple vegetation types� An SCV map is a digital dataset, produced
using GIS software� Map users can view and interact with the spatial
information (the mapped polygons) as well as the vegetation and
environmental information associated with each polygon (Figures 2
and 3)�
The great flexibility built into the classification and the mapped
units enables dependable evaluation of a variety of biological and
environmental resources�
The US National Vegetation Classification Standard (NVCS) has been developed through a collaboration of the Federal Geographic Data Committee’s Vegetation Subcommittee and state, federal, and private partners� The Ecological Society of America’s Panel on Vegetation Classification is responsible for managing the review and formal adoption of types into the National Vegetation Classification (NVC)�
The partnership between the California and NVC programs goes back to their inceptions more than 20 years ago� Throughout this entire time, California ecologists have served on the Panel and participated in the national program’s peer review process�
The SCV supports the NVC through regular updating and information exchange, facilitated by shared definitions and naming rules� SCV projects and authors have played an active role in contributing to the NVC�
a shared vision for the Survey of California Vegetation 3
the center for geographical studies
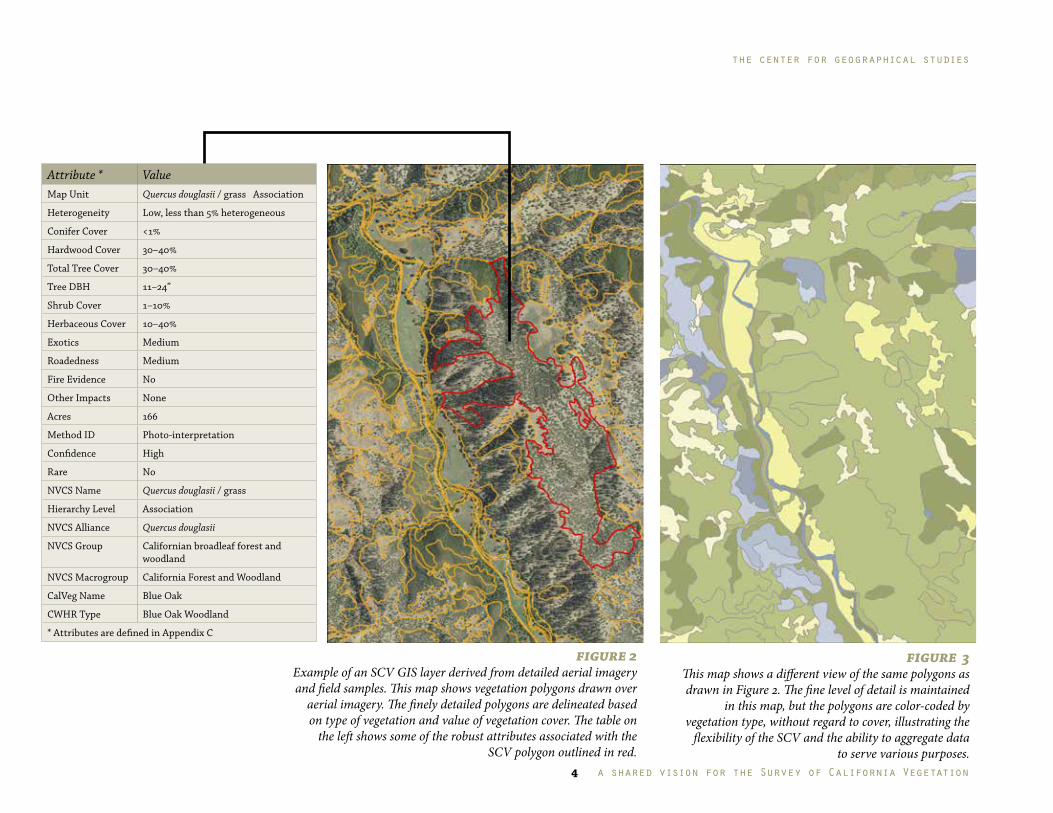
figure 3 This map shows a different view of the same polygons as drawn in Figure 2. The fine level of detail is maintained
in this map, but the polygons are color-coded by vegetation type, without regard to cover, illustrating the
flexibility of the SCV and the ability to aggregate data to serve various purposes.
Attribute * ValueMap Unit Quercus douglasii / grass Association
Heterogeneity Low, less than 5% heterogeneous
Conifer Cover <1%
Hardwood Cover 30–40%
Total Tree Cover 30–40%
Tree DBH 11–24”
Shrub Cover 1–10%
Herbaceous Cover 10–40%
Exotics Medium
Roadedness Medium
Fire Evidence No
Other Impacts None
Acres 166
Method ID Photo-interpretation
Confidence High
Rare No
NVCS Name Quercus douglasii / grass
Hierarchy Level Association
NVCS Alliance Quercus douglasii
NVCS Group Californian broadleaf forest and woodland
NVCS Macrogroup California Forest and Woodland
CalVeg Name Blue Oak
CWHR Type Blue Oak Woodland
* Attributes are defined in Appendix C
figure 2 Example of an SCV GIS layer derived from detailed aerial imagery and field samples. This map shows vegetation polygons drawn over
aerial imagery. The finely detailed polygons are delineated based on type of vegetation and value of vegetation cover. The table on
the left shows some of the robust attributes associated with the SCV polygon outlined in red.
a shared vision for the Survey of California Vegetation
the center for geographical studies
4
The Survey of California Vegetation as the State StandardIn 2000, the Memorandum of Understanding for Cooperative
Vegetation and Habitat Mapping and Classification (MOU) identified
shortcomings in existing vegetation GIS datasets and established
the need to develop mapping standards, integrate existing data into
those standards, and initiate a coordinated regional mapping project
(California Biodiversity Council, 2000)� This MOU was developed by
representatives from five state agencies, seven federal agencies, four
universities, and one non-govenmental organization� In response
to the MOU, the California Department of Fish and Wildlife’s
Vegetation Classification and Mapping Program (VegCAMP) and the
Vegetation Program of the California Native Plant Society (CNPS)
began development of the vegetation survey protocols, classification
and mapping standards, and accuracy assessment processes that
would later comprise the Survey of California Vegetation framework�
In 2007, state legislation identified the California Department
of Fish and Wildlife (CDFW), in consultation with interested
stakeholders, as the lead agency to develop vegetation mapping and
classification standards for California, and called for the mapping
standards to be consistent with those developed by the Federal
Geographic Data Committee� It further stipulated that CDFW
should devise “mechanisms for integrating new map products
that meet the standard into a cohesive database with the intent
of eventually completing statewide coverage” (Senate Bill No� 85,
Chaptered 2007 as Section 1940 of the Fish and Game Code)�
The SCV incorporates all of the elements mandated by the MOU
and Senate Bill No� 85� The current state vegetation classification
is embodied in The Manual of California Vegetation (Sawyer et al�,
2009), and data collection protocols, mapping standards, and accuracy
assessment procedures are documented and available to all vegetation
mappers through VegCAMP�
The Memorandum of Understanding for Cooperative Vegetation and Habitat Mapping and Classification was developed by representatives from these entities:
• California Department of Forestry and Fire Protection
• California Department of Fish and Wildlife
• California Department of Pesticide Regulation
• California Department of Water Resources
• California Department of Transportation
• United States Forest Service
• Bureau of Land Management
• United States Geological Survey
• United States Fish and Wildlife Service
• National Park Service
• United States Bureau of Reclamation
• Natural Resources Conservation Service
• University of California, Davis
• University of California, Riverside
• California State University, San Diego
• California State University, Humboldt
• California Native Plant Society
a shared vision for the Survey of California Vegetation 5
the center for geographical studies
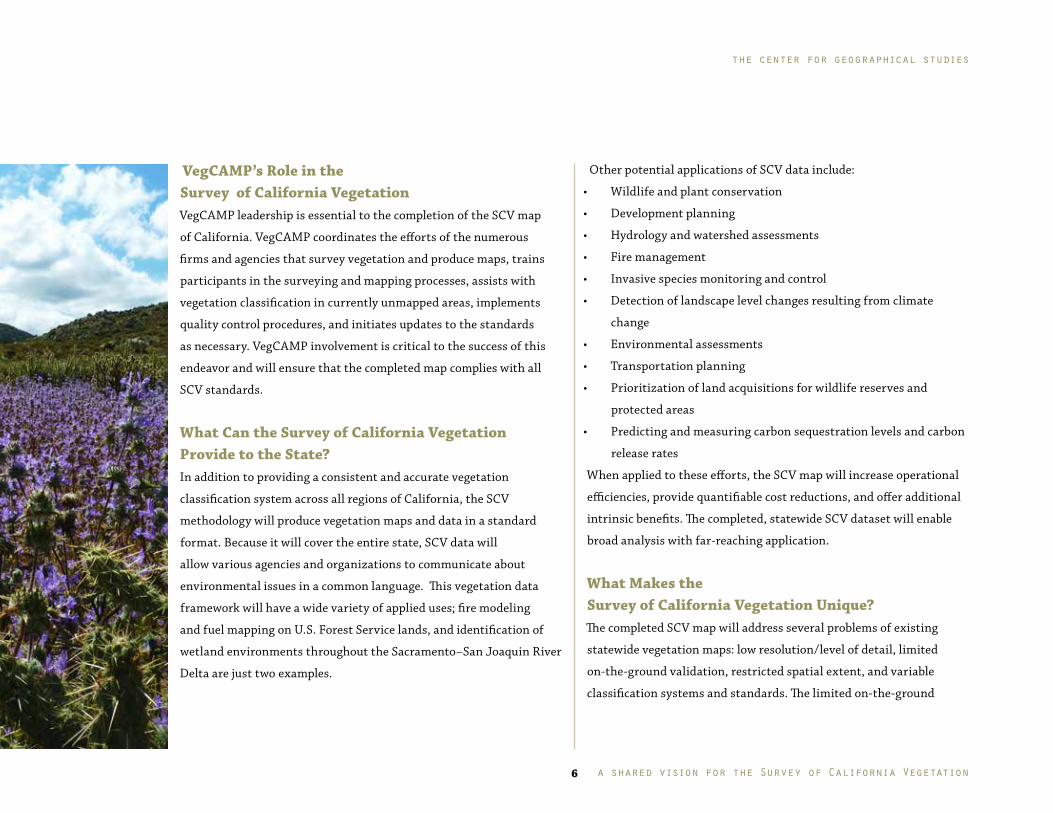
VegCAMP’s Role in the Survey of California VegetationVegCAMP leadership is essential to the completion of the SCV map
of California� VegCAMP coordinates the efforts of the numerous
firms and agencies that survey vegetation and produce maps, trains
participants in the surveying and mapping processes, assists with
vegetation classification in currently unmapped areas, implements
quality control procedures, and initiates updates to the standards
as necessary� VegCAMP involvement is critical to the success of this
endeavor and will ensure that the completed map complies with all
SCV standards�
What Can the Survey of California Vegetation Provide to the State?In addition to providing a consistent and accurate vegetation
classification system across all regions of California, the SCV
methodology will produce vegetation maps and data in a standard
format� Because it will cover the entire state, SCV data will
allow various agencies and organizations to communicate about
environmental issues in a common language� This vegetation data
framework will have a wide variety of applied uses; fire modeling
and fuel mapping on U�S� Forest Service lands, and identification of
wetland environments throughout the Sacramento–San Joaquin River
Delta are just two examples�
Other potential applications of SCV data include:
• Wildlife and plant conservation
• Development planning
• Hydrology and watershed assessments
• Fire management
• Invasive species monitoring and control
• Detection of landscape level changes resulting from climate
change
• Environmental assessments
• Transportation planning
• Prioritization of land acquisitions for wildlife reserves and
protected areas
• Predicting and measuring carbon sequestration levels and carbon
release rates
When applied to these efforts, the SCV map will increase operational
efficiencies, provide quantifiable cost reductions, and offer additional
intrinsic benefits� The completed, statewide SCV dataset will enable
broad analysis with far-reaching application�
What Makes the Survey of California Vegetation Unique?The completed SCV map will address several problems of existing
statewide vegetation maps: low resolution/level of detail, limited
on-the-ground validation, restricted spatial extent, and variable
classification systems and standards� The limited on-the-ground
a shared vision for the Survey of California Vegetation
the center for geographical studies
6
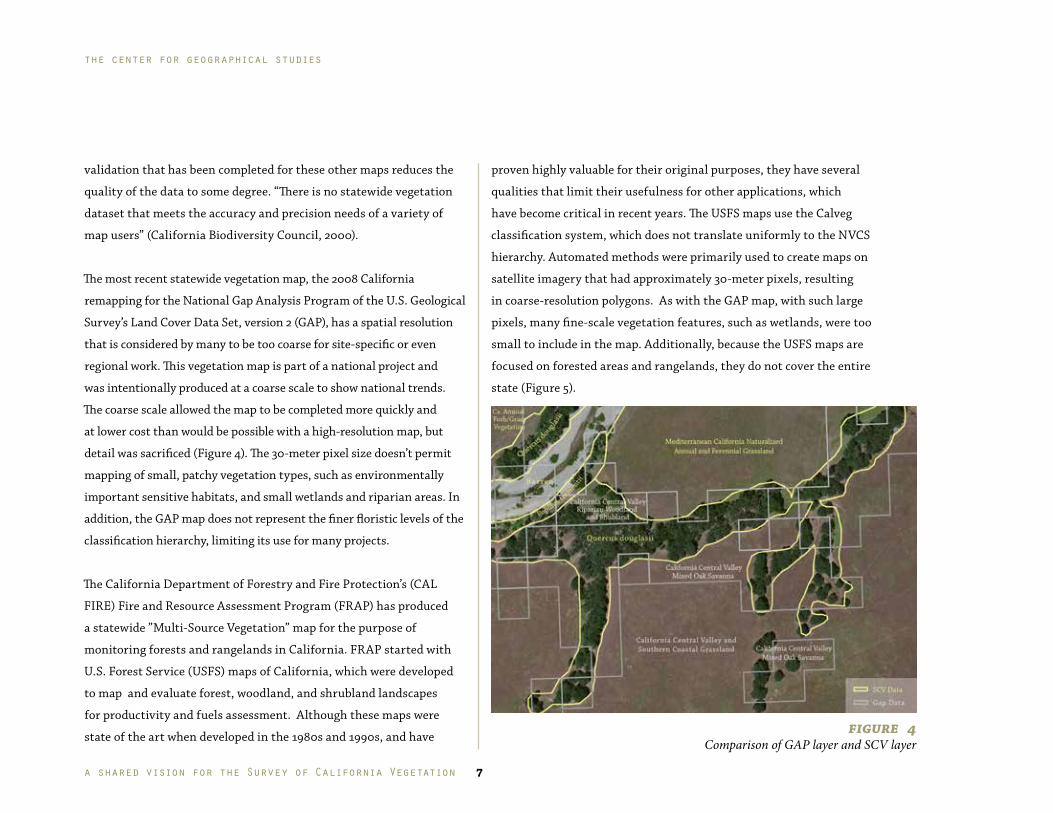
figure 4 Comparison of GAP layer and SCV layer
validation that has been completed for these other maps reduces the
quality of the data to some degree� “There is no statewide vegetation
dataset that meets the accuracy and precision needs of a variety of
map users” (California Biodiversity Council, 2000)�
The most recent statewide vegetation map, the 2008 California
remapping for the National Gap Analysis Program of the U�S� Geological
Survey’s Land Cover Data Set, version 2 (GAP), has a spatial resolution
that is considered by many to be too coarse for site-specific or even
regional work� This vegetation map is part of a national project and
was intentionally produced at a coarse scale to show national trends�
The coarse scale allowed the map to be completed more quickly and
at lower cost than would be possible with a high-resolution map, but
detail was sacrificed (Figure 4)� The 30-meter pixel size doesn’t permit
mapping of small, patchy vegetation types, such as environmentally
important sensitive habitats, and small wetlands and riparian areas� In
addition, the GAP map does not represent the finer floristic levels of the
classification hierarchy, limiting its use for many projects�
The California Department of Forestry and Fire Protection’s (CAL
FIRE) Fire and Resource Assessment Program (FRAP) has produced
a statewide ”Multi-Source Vegetation” map for the purpose of
monitoring forests and rangelands in California� FRAP started with
U�S� Forest Service (USFS) maps of California, which were developed
to map and evaluate forest, woodland, and shrubland landscapes
for productivity and fuels assessment� Although these maps were
state of the art when developed in the 1980s and 1990s, and have
proven highly valuable for their original purposes, they have several
qualities that limit their usefulness for other applications, which
have become critical in recent years� The USFS maps use the Calveg
classification system, which does not translate uniformly to the NVCS
hierarchy� Automated methods were primarily used to create maps on
satellite imagery that had approximately 30-meter pixels, resulting
in coarse-resolution polygons� As with the GAP map, with such large
pixels, many fine-scale vegetation features, such as wetlands, were too
small to include in the map� Additionally, because the USFS maps are
focused on forested areas and rangelands, they do not cover the entire
state (Figure 5)�
a shared vision for the Survey of California Vegetation 7
the center for geographical studies
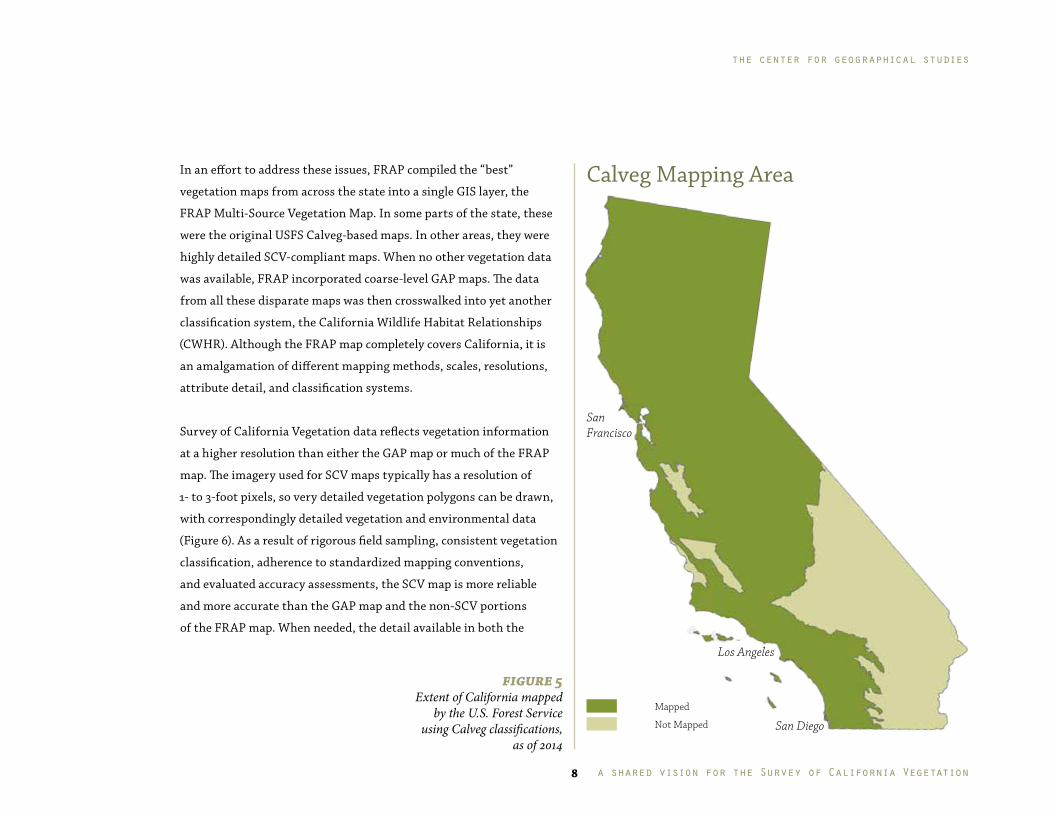
Calveg Mapping Area
San Francisco
Los Angeles
San Diego
Mapped
Not Mapped
figure 5Extent of California mapped
by the U.S. Forest Serviceusing Calveg classifications,
as of 2014
In an effort to address these issues, FRAP compiled the “best”
vegetation maps from across the state into a single GIS layer, the
FRAP Multi-Source Vegetation Map� In some parts of the state, these
were the original USFS Calveg-based maps� In other areas, they were
highly detailed SCV-compliant maps� When no other vegetation data
was available, FRAP incorporated coarse-level GAP maps� The data
from all these disparate maps was then crosswalked into yet another
classification system, the California Wildlife Habitat Relationships
(CWHR)� Although the FRAP map completely covers California, it is
an amalgamation of different mapping methods, scales, resolutions,
attribute detail, and classification systems�
Survey of California Vegetation data reflects vegetation information
at a higher resolution than either the GAP map or much of the FRAP
map� The imagery used for SCV maps typically has a resolution of
1- to 3-foot pixels, so very detailed vegetation polygons can be drawn,
with correspondingly detailed vegetation and environmental data
(Figure 6)� As a result of rigorous field sampling, consistent vegetation
classification, adherence to standardized mapping conventions,
and evaluated accuracy assessments, the SCV map is more reliable
and more accurate than the GAP map and the non-SCV portions
of the FRAP map� When needed, the detail available in both the
a shared vision for the Survey of California Vegetation
the center for geographical studies
8
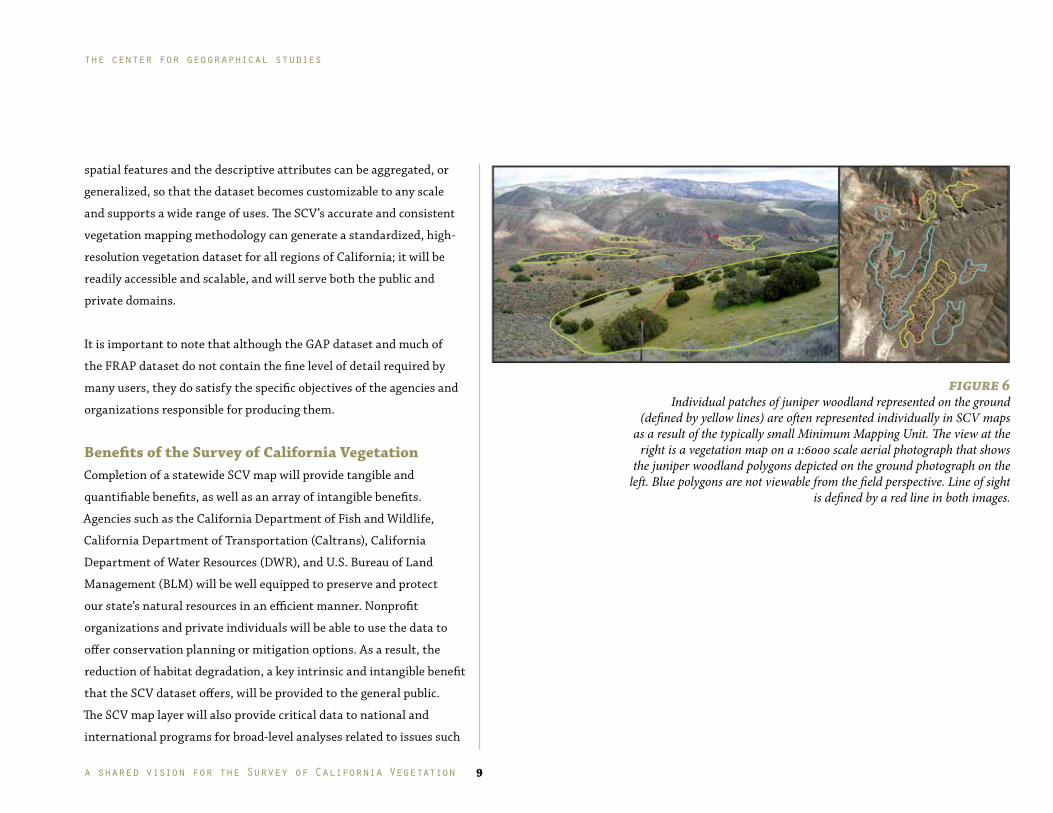
figure 6Individual patches of juniper woodland represented on the ground
(defined by yellow lines) are often represented individually in SCV maps as a result of the typically small Minimum Mapping Unit. The view at the
right is a vegetation map on a 1:6000 scale aerial photograph that shows the juniper woodland polygons depicted on the ground photograph on the
left. Blue polygons are not viewable from the field perspective. Line of sight is defined by a red line in both images.
spatial features and the descriptive attributes can be aggregated, or
generalized, so that the dataset becomes customizable to any scale
and supports a wide range of uses� The SCV’s accurate and consistent
vegetation mapping methodology can generate a standardized, high-
resolution vegetation dataset for all regions of California; it will be
readily accessible and scalable, and will serve both the public and
private domains�
It is important to note that although the GAP dataset and much of
the FRAP dataset do not contain the fine level of detail required by
many users, they do satisfy the specific objectives of the agencies and
organizations responsible for producing them�
Benefits of the Survey of California VegetationCompletion of a statewide SCV map will provide tangible and
quantifiable benefits, as well as an array of intangible benefits�
Agencies such as the California Department of Fish and Wildlife,
California Department of Transportation (Caltrans), California
Department of Water Resources (DWR), and U�S� Bureau of Land
Management (BLM) will be well equipped to preserve and protect
our state’s natural resources in an efficient manner� Nonprofit
organizations and private individuals will be able to use the data to
offer conservation planning or mitigation options� As a result, the
reduction of habitat degradation, a key intrinsic and intangible benefit
that the SCV dataset offers, will be provided to the general public�
The SCV map layer will also provide critical data to national and
international programs for broad-level analyses related to issues such
a shared vision for the Survey of California Vegetation 9
the center for geographical studies
researchers documented case studies illustrating applications of such
data and the subsequent efficiencies and cost savings� Results strongly
support the fact that a statewide SCV dataset will save time and
resources, and allow users to achieve results they might not otherwise
have been able to achieve with coarser-scale or outdated maps�
Analysis of the collected research provided a synthesis of tangible
and intangible returns on investment (ROI)� Tangible returns include
both quantitative and qualitative benefits� Quantitative benefits
were identified via the analysis of time and cost savings, and the
development of ROI models�
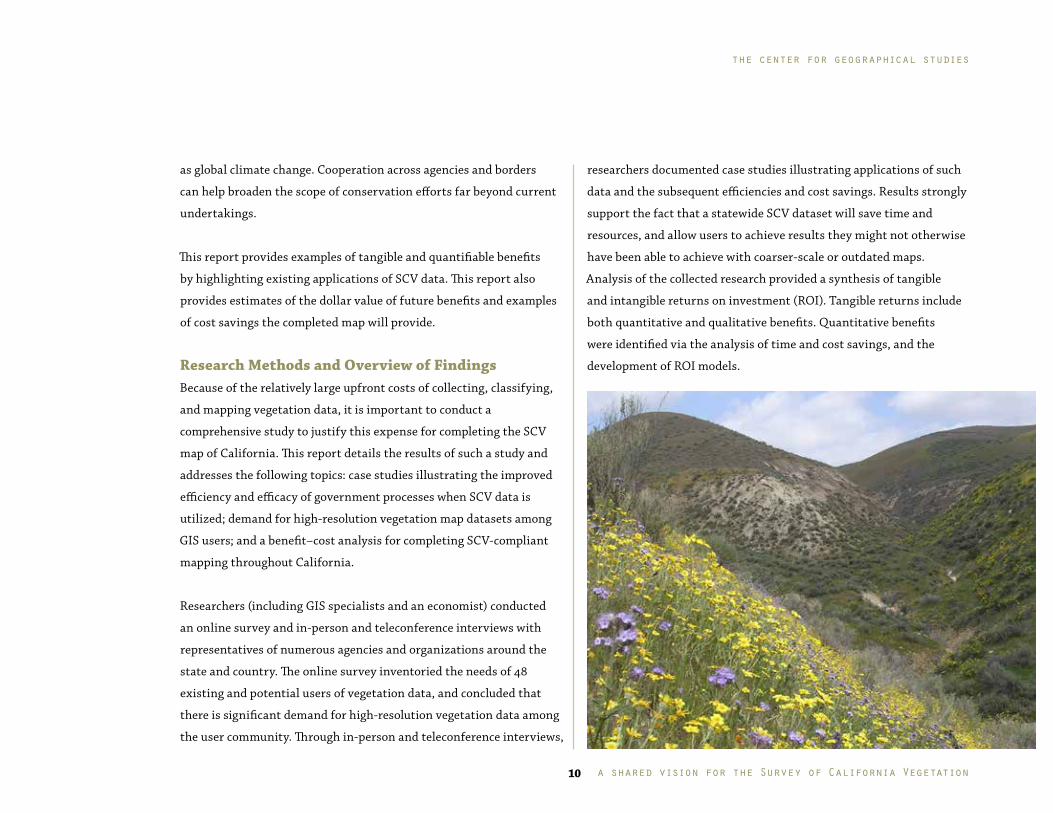
as global climate change� Cooperation across agencies and borders
can help broaden the scope of conservation efforts far beyond current
undertakings�
This report provides examples of tangible and quantifiable benefits
by highlighting existing applications of SCV data� This report also
provides estimates of the dollar value of future benefits and examples
of cost savings the completed map will provide�
Research Methods and Overview of FindingsBecause of the relatively large upfront costs of collecting, classifying,
and mapping vegetation data, it is important to conduct a
comprehensive study to justify this expense for completing the SCV
map of California� This report details the results of such a study and
addresses the following topics: case studies illustrating the improved
efficiency and efficacy of government processes when SCV data is
utilized; demand for high-resolution vegetation map datasets among
GIS users; and a benefit–cost analysis for completing SCV-compliant
mapping throughout California�
Researchers (including GIS specialists and an economist) conducted
an online survey and in-person and teleconference interviews with
representatives of numerous agencies and organizations around the
state and country� The online survey inventoried the needs of 48
existing and potential users of vegetation data, and concluded that
there is significant demand for high-resolution vegetation data among
the user community� Through in-person and teleconference interviews,
a shared vision for the Survey of California Vegetation
the center for geographical studies
10
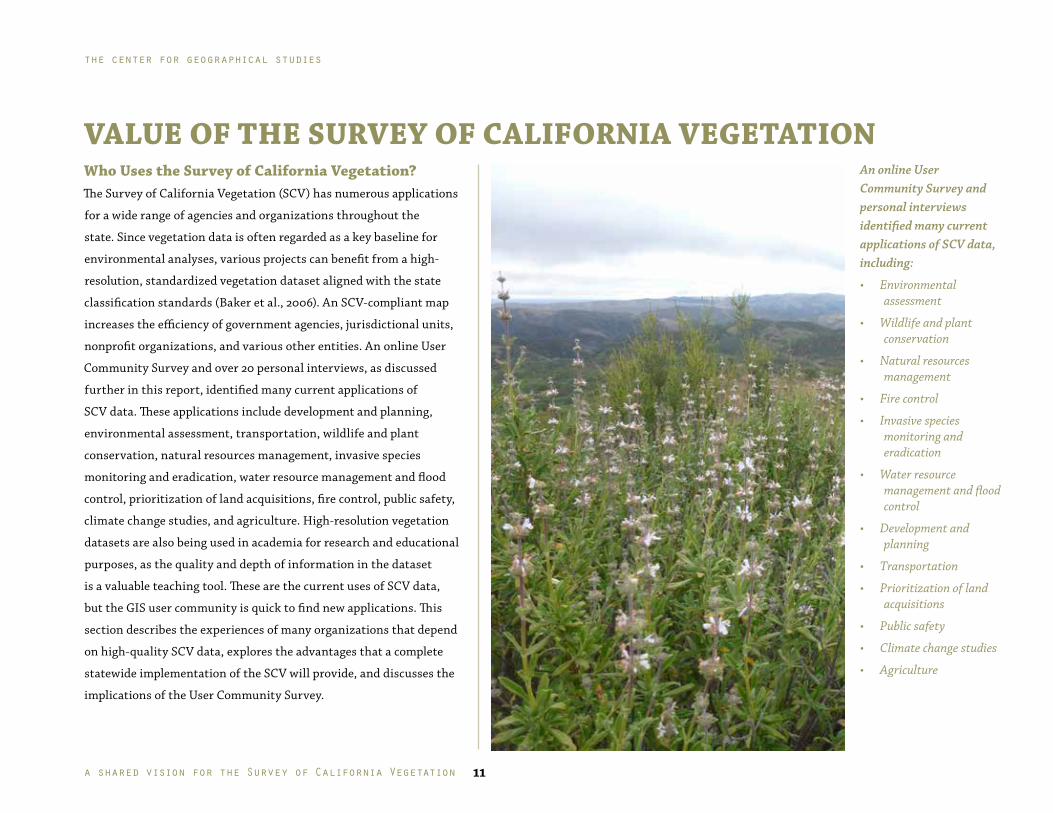
Who Uses the Survey of California Vegetation?The Survey of California Vegetation (SCV) has numerous applications
for a wide range of agencies and organizations throughout the
state� Since vegetation data is often regarded as a key baseline for
environmental analyses, various projects can benefit from a high-
resolution, standardized vegetation dataset aligned with the state
classification standards (Baker et al�, 2006)� An SCV-compliant map
increases the efficiency of government agencies, jurisdictional units,
nonprofit organizations, and various other entities� An online User
Community Survey and over 20 personal interviews, as discussed
further in this report, identified many current applications of
SCV data� These applications include development and planning,
environmental assessment, transportation, wildlife and plant
conservation, natural resources management, invasive species
monitoring and eradication, water resource management and flood
control, prioritization of land acquisitions, fire control, public safety,
climate change studies, and agriculture� High-resolution vegetation
datasets are also being used in academia for research and educational
purposes, as the quality and depth of information in the dataset
is a valuable teaching tool� These are the current uses of SCV data,
but the GIS user community is quick to find new applications� This
section describes the experiences of many organizations that depend
on high-quality SCV data, explores the advantages that a complete
statewide implementation of the SCV will provide, and discusses the
implications of the User Community Survey�
VALUE OF THE SURVEY OF CALIFORNIA VEGETATIONAn online User Community Survey and personal interviews identified many current applications of SCV data, including:
• Environmental assessment
• Wildlife and plant conservation
• Natural resources management
• Fire control
• Invasive species monitoring and eradication
• Water resource management and flood control
• Development and planning
• Transportation
• Prioritization of land acquisitions
• Public safety
• Climate change studies
• Agriculture
a shared vision for the Survey of California Vegetation 11
the center for geographical studies
Climate ChangeHigh-resolution vegetation data can be used as a monitoring tool to
detect landscape-level alterations due to climate change� SCV datasets
detect details in species composition in both the mapping and the field
sampling, enabling more precise tracking of change than is possible
with more generalized maps or field data� The detailed information
in an SCV dataset can also be used to help model potential changes in
vegetation as the climate changes, thus helping to predict how wildlife
might migrate as a result�
Sonoma County Agricultural Preservation and Open Space DistrictThe Sonoma County Agricultural Preservation and Open Space District
has begun creating an SCV dataset of the region as part of its climate
change and adaptation project initiatives� This dataset will assist with
tasks such as predicting and measuring carbon sequestration rates,
and generating carbon sequestration and greenhouse gas emission
assessments under different land use scenarios� According to Tom
Robinson, the Conservation Planner for the district, fine-scale land
cover data is critical for developing an informed climate change
adaption plan (Tom Robinson, personal communication, November 13,
2013)�
Sierra Nevada Conservancy; Department of Integrative Biology at University of California, BerkeleyThe Sierra Nevada Conservancy is planning to conduct a study using
fine-scale vegetation data as a baseline for a climate change adaptation
interface� According to researchers, high-resolution vegetation
data allows the user to better measure changes in community at the
association level� David Ackerly, Professor and Researcher at the
Department of Integrative Biology at UC Berkeley, indicates that
high-resolution data is useful for analyzing the possible outcomes of
climate change in a landscape with varying topographic features� It
helps project how vegetation will move when variables such as slope
and aspect are changed� For example, vegetation data can allow a
researcher to answer questions such as “will a vegetation species
move from one side of the hill to another?” In short, high-resolution
data allows more detailed climate analyses to be conducted than
low-resolution data (David Ackerly, personal communication, March
4, 2014)�
Northwest Hydraulic ConsultantsHigh-resolution vegetation data can be used to predict potential
flood impacts due to sea level rise� Northwest Hydraulic Consultants
used SCV data to conduct a Federal Emergency Management Agency
(FEMA) Coastal Flood Hazard survey� According to the GIS manager of
this company, it was necessary to know vegetation type and coverage
at a detailed level for this study� The SCV dataset was a vital source of
information for some of the analyses pertaining to this project (Dawn
Lasprugato, personal communication, September 16, 2013)�
CLIM
ATE
CHA
NG
E
a shared vision for the Survey of California Vegetation
the center for geographical studies
12
Wildlife and Plant ConservationHigh-resolution vegetation data is a valuable tool for natural resources
management, improving the decision-making process regarding
conservation issues� The use of a high-resolution vegetation dataset
can enhance and inform various conservation projects, including
population dynamics studies, species distribution modeling, reserve
design decisions, genetic sampling, and prioritization of conservation
efforts�
California Energy CommissionDetailed vegetation data serves as a resource to inform wildlife
reserve design� Such data is used extensively in the Desert Renewable
Energy Conservation Plan (DRECP), a multi-agency program
developed through a collaborative effort between the California
Energy Commission, California Department of Fish and Wildlife,
U�S� Bureau of Land Management, and U�S� Fish and Wildlife Service,
and managed by the California Energy Commission� The program’s
purpose is to provide effective protection and conservation of desert
ecosystems while allowing the appropriate development of renewable
energy projects� Prior to the 2013 completion of an SCV dataset for
the Mohave Desert region, an adequately detailed vegetation layer
for this area did not exist; DRECP management had to base many
of its decisions upon coarse-resolution, generalized geospatial data�
This data was heavily criticized by independent science advisors, who
predicted that the plan was likely to fail unless a high-resolution
vegetation dataset could be utilized� Their report made the following
recommendation: “Invest in completing a seamless, up-to-date, high-
resolution, hierarchical vegetation (or land-cover) map as soon as
possible to support conservation planning, renewable energy facility
siting, and conservation analyses� The lack of a comprehensive and
dependable land-cover base map—which is an essential data layer for
spatially explicit models, maps, and analyses—is a key information
gap faced by the plan� This hinders the ability to reasonably
predict the plan’s effects on target species and communities and to
locate appropriate conservation and mitigation actions” (DRECP
Independent Science Advisors, 2010)� The newly created, high-
resolution vegetation dataset has enhanced the plan by enabling
DRECP to identify locally rare plant locations and sensitive wildlife
habitats, and to consider rare vegetation types in reserve design (Misa
Milliron, personal communication, October 11, 2013)�
National Park ServiceAccording to the National Park Service staff at the Santa Monica
Mountains National Recreation Area, high-resolution vegetation data
is useful for determining potential collection locations for genetic
sampling of uncommon and rare species� The data is used to create
predictive maps of species distributions, allowing the biologists to
narrow their searches when conducting field work� Additionally, this
high-resolution data is a critical component of their inventory and
monitoring program for various plant and wildlife species in the
park (John Tiszler, Denise Kamradt, Tony Valois, and Martha Witter,
personal communication, September 16, 2013)�
WILD
LIFE AN
D PLA
NT CO
NSER
VATIO
N
a shared vision for the Survey of California Vegetation 13
the center for geographical studies
California Department of Fish and Wildlife One key aspect of conserving viable wildlife populations is
maintaining connections between patches of habitat, which are
commonly fragmented by human development, roads, and various
forms of land conversion� The CDFW Data and Technology Division
used SCV data to better understand habitat connectivity across the
Northern Sierra Nevada Foothills ecoregion� They identified 30 focal
species, such as bobcat, black bear, and mountain lion, which were
representative of the wildlife in the study region� Then they identified
“landscape blocks” in the study area, representing protected lands that
provide core habitat areas for the focal species� The purpose of the
study was to model linkages between these landscape blocks� They
used species-specific data in conjunction with SCV data to develop
habitat suitability models for the focal species; the models were
then used to identify core habitat patches for each species� With this
data, they could identify least-cost corridors linking core habitat
patches in the landscape blocks� The habitat corridors and habitat
patches for the 30 focal species were combined to build a linkage that
would permit wildlife movement between each pair of neighboring
landscape blocks� The resulting linkage network identified areas of
high habitat suitability as well as areas of conservation concern such
as barriers to movement and movement bottlenecks� The CDFW Data
and Technology Division believes that this network will be useful
for local and regional land use planning, land use decision making,
and conservation and habitat acquisition planning for state and
local governments and conservation organizations (Melanie Gogol-
Prokurat, personal communication, May 29, 2014)�
Bay Area Open Space Council; Creekside Center for Earth ObservationAnother advantage of high-resolution vegetation data is its ability to
detect encroachment of certain plant species into new areas� Analysis
of coarse vegetation data is incapable of detecting such encroachment,
as it only captures general vegetation types� According to the Bay Area
Open Space Council and the Creekside Center for Earth Observation,
a fine-scale vegetation map can provide a solid indicator of the
progression of vegetation species within a community over time
(Stu Weiss and Ryan Branciforte, personal communication, November
13, 2013)�
AECOMPopulation dynamics studies and species distribution modeling are
commonly employed conservation techniques, both of which are
enhanced by a high-resolution vegetation dataset� High-resolution
vegetation data is used to estimate the populations of animal species
that occur only in specific vegetation types or in habitats dominated
by certain plant species� For example, AECOM uses an SCV dataset
to estimate population densities of the federally listed endangered
Arroyo Toad and the threatened California Gnatcatcher, both of which
occur in a specific type of sage scrub habitat� The detailed vegetation
data allows the biologists to determine the locations and extents of
these habitat patches, thereby enabling them to estimate population
densities for the toad and gnatcatcher (Jonathan Dunn and Tom
Oberbauer, personal communication, November 18, 2013)�
WIL
DLI
FE A
ND
PLA
NT
CON
SER
VAT
ION
a shared vision for the Survey of California Vegetation
the center for geographical studies
14
DudekThe highly detailed classifications and the spatial accuracy of high-
resolution vegetation data can enhance species distribution modeling�
The biological consulting firm Dudek uses SCV data to create species
distribution models that predict species occurrence over landscapes�
These models are more accurate than models created from coarse-
resolution data, resulting in more robust analyses (Wendy Worthey
and Mike Howard, personal communication, April 3, 2014)�
Conservation Biology InstituteThe Conservation Biology Institute is a nonprofit organization
that provides scientific expertise in support of the conservation
and recovery of biological diversity� The institute uses SCV data to
correlate vegetation types with rare animal species in San Diego
County� Additionally, the organization uses SCV data to create an
adaptive management strategy for endemic species (Patricia Gordon-
Reedy, personal communication, November 4, 2013)�
WILD
LIFE AN
D PLA
NT CO
NSER
VATIO
N
a shared vision for the Survey of California Vegetation 15
the center for geographical studies
Development and PlanningFine-scale vegetation data is often regarded as a baseline for
development and planning processes, which include county and city
planning, infrastructure development, creation of recreation areas,
and renewable energy development� The use of an SCV map can create
efficiencies and facilitate better-informed decisions for such projects
throughout the state�
California Coastal CommissionThe California Coastal Commission uses an SCV dataset to guide policy
for development and to evaluate development proposals in the Santa
Monica Mountains� Sites with Environmentally Sensitive Habitat Area
(ESHA) designations, which are unsuitable for development, can be
identified by reference to the dataset� Commission staff can establish
the locations of potential ESHA parcels prior to going out in the field,
thereby reducing the amount of time spent in the field per project
(Jonna Engel, personal communication, October 7, 2013)�
The use of a detailed vegetation map can also help identify
environmental violations or illegal resource extraction� The California
Coastal Commission uses an SCV dataset to asses the resource
impacts of development violations in the Santa Monica Mountains�
By referring to the dataset, the Coastal Commission can tell which
types of vegetation were removed from specific locations, and provide
evidence that a species existed at a particular location prior to clearing
(Jonna Engel, personal communication, October 7, 2013)�
DEV
ELO
PMEN
T A
ND
PLA
NN
ING
a shared vision for the Survey of California Vegetation
the center for geographical studies
16
Los Angeles County Department of Regional PlanningSCV data helps to identify areas with Significant Environmental
Resource Area designations or where there is a high likelihood of
finding certain rare species� The Los Angeles County Department of
Regional Planning used an SCV dataset to map habitat categories
when it developed the implementation plan for the Santa Monica
Mountains Local Coastal Program� The habitat categories help
determine which regions should be completely protected and which
areas require stringent development standards� Understanding that
habitats are dynamic and can change over time, the Department of
Regional Planning added a provision for updating the habitat maps
on a regular basis (Josh Huntington and Chris Morneau, personal
communication, October 28, 2013)�
National Park ServiceThe National Park Service is an agency that has benefited from the
increased detail of SCV-compliant datasets when creating visual
displays� They have been able to create highly detailed and visually
compelling maps that attest to the value of natural land, when
that land is under consideration for development� The Park Service
also uses these detailed maps in grant proposals when they must
demonstrate the uniqueness of the habitat (John Tiszler et al�,
personal communication, September 16, 2013)�
California Department of Fish and WildlifeAn SCV map provides fundamental information upon which the
CDFW Lands Program management plans are based� “The high-
DEV
ELOPM
ENT A
ND
PLAN
NIN
G
resolution and highly attributed vegetation maps produced for our
department’s lands are used in developing the management plans
that are required for each property, addressing issues such as invasive
species removal, grazing management issues, and fuels management”
(Teresa Le Blanc, personal communication, October 21, 2014)�
a shared vision for the Survey of California Vegetation 17
the center for geographical studies
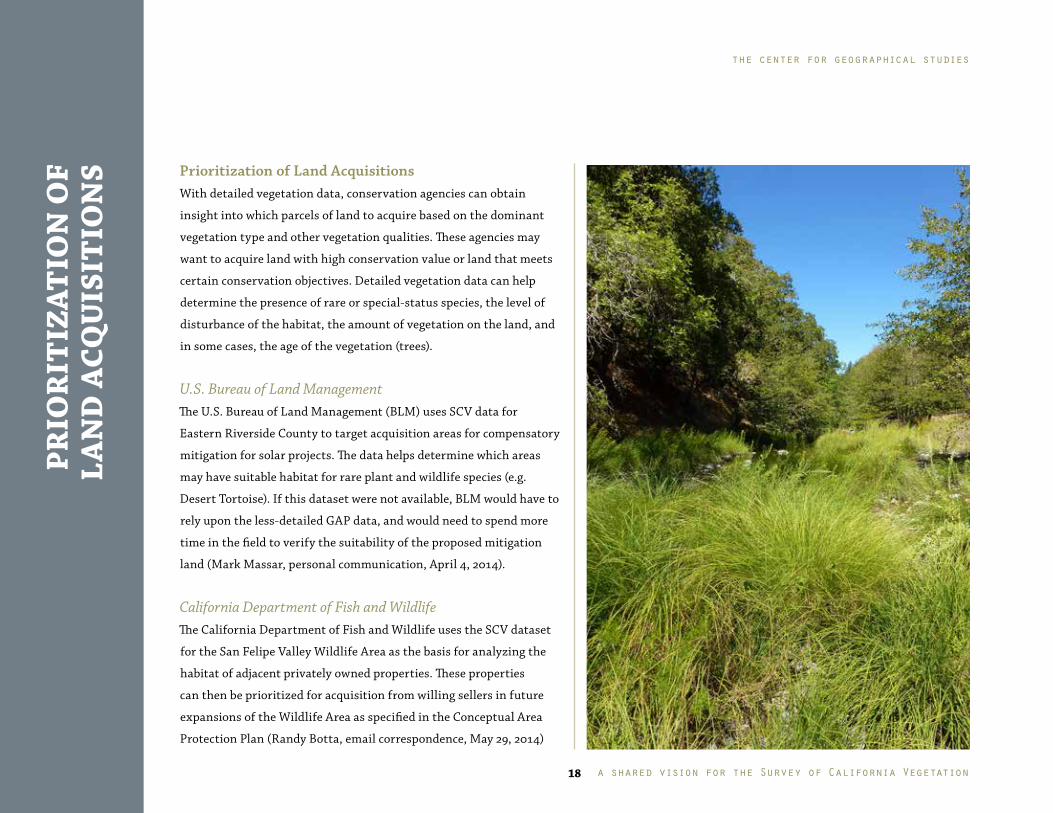
Prioritization of Land AcquisitionsWith detailed vegetation data, conservation agencies can obtain
insight into which parcels of land to acquire based on the dominant
vegetation type and other vegetation qualities� These agencies may
want to acquire land with high conservation value or land that meets
certain conservation objectives� Detailed vegetation data can help
determine the presence of rare or special-status species, the level of
disturbance of the habitat, the amount of vegetation on the land, and
in some cases, the age of the vegetation (trees)�
U.S. Bureau of Land Management The U�S� Bureau of Land Management (BLM) uses SCV data for
Eastern Riverside County to target acquisition areas for compensatory
mitigation for solar projects� The data helps determine which areas
may have suitable habitat for rare plant and wildlife species (e�g�
Desert Tortoise)� If this dataset were not available, BLM would have to
rely upon the less-detailed GAP data, and would need to spend more
time in the field to verify the suitability of the proposed mitigation
land (Mark Massar, personal communication, April 4, 2014)�
California Department of Fish and Wildlife The California Department of Fish and Wildlife uses the SCV dataset
for the San Felipe Valley Wildlife Area as the basis for analyzing the
habitat of adjacent privately owned properties� These properties
can then be prioritized for acquisition from willing sellers in future
expansions of the Wildlife Area as specified in the Conceptual Area
Protection Plan (Randy Botta, email correspondence, May 29, 2014)
PRIO
RIT
IZAT
ION
OF
LAN
D A
CQU
ISIT
ION
S
a shared vision for the Survey of California Vegetation
the center for geographical studies
18
Hydrology and Watershed AssessmentsHigh-resolution vegetation data can be an insightful tool for
conducting hydrology and watershed assessments� Detailed
information on vegetation type, as well as attributes such as
vegetation structure and level of disturbance, can provide knowledge
regarding the quality of the watershed or the potential for watershed
problems to occur�
National Park ServiceThe National Park Service uses an SCV dataset in the Santa
Monica Mountains National Recreation Area to conduct watershed
assessments, which help identify landslide hazards and debris
flows for specific sites (John Tiszler et al�, personal communication,
September 16, 2013)�
Sonoma County Agricultural Preservation and Open Space DistrictAccording to the staff at the Sonoma County Agricultural Preservation
and Open Space District, high-resolution vegetation data provides
good indicators of the quality of water in a watershed� Natural
riparian vegetation contributes large wood for fish habitat, maintains
low water temperature in streams by providing shade, and filters
non-point source pollution from surrounding land before it can
enter the streams� The SCV dataset reveals the presence or absence
of riparian vegetation, demonstrating which areas are providing
ecosystem services and where improvements to the ecosystem can
be made� Additionally, the vegetation data serves as a surrogate for
estimates of biodiversity, and displays the level of disturbance and
human modification to the watershed (Tom Robinson, personal
communication, November 13, 2013)�
California Department of Water ResourcesSetback levees are commonly installed for flood control along the
Sacramento River and other rivers in the Central Valley� These levees
are constructed at a set distance from the river channel in order to
allow the river to occupy a portion of its original floodplain� The
California Department of Water Resources (DWR) uses SCV data
when determining where to install setback levees� According to DWR,
the agricultural subtypes in the vegetation dataset are very useful in
isolating different agriculture types such as orchards, alfalfa fields
and vineyards (Stefan Lorenzato, personal communication,
September 24, 2013)�
HYD
RO
LOG
Y AN
D W
ATER
SHED
A
SSESSMEN
TS
a shared vision for the Survey of California Vegetation 19
the center for geographical studies
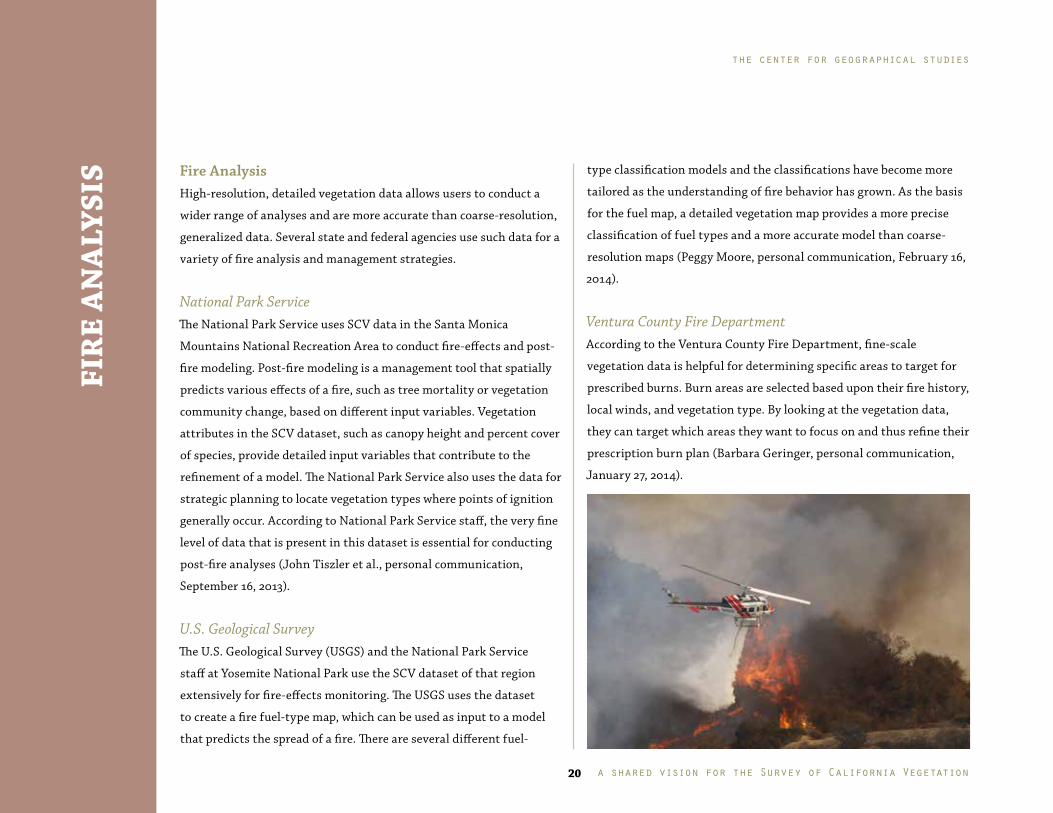
Fire AnalysisHigh-resolution, detailed vegetation data allows users to conduct a
wider range of analyses and are more accurate than coarse-resolution,
generalized data� Several state and federal agencies use such data for a
variety of fire analysis and management strategies�
National Park ServiceThe National Park Service uses SCV data in the Santa Monica
Mountains National Recreation Area to conduct fire-effects and post-
fire modeling� Post-fire modeling is a management tool that spatially
predicts various effects of a fire, such as tree mortality or vegetation
community change, based on different input variables� Vegetation
attributes in the SCV dataset, such as canopy height and percent cover
of species, provide detailed input variables that contribute to the
refinement of a model� The National Park Service also uses the data for
strategic planning to locate vegetation types where points of ignition
generally occur� According to National Park Service staff, the very fine
level of data that is present in this dataset is essential for conducting
post-fire analyses (John Tiszler et al�, personal communication,
September 16, 2013)�
U.S. Geological SurveyThe U�S� Geological Survey (USGS) and the National Park Service
staff at Yosemite National Park use the SCV dataset of that region
extensively for fire-effects monitoring� The USGS uses the dataset
to create a fire fuel-type map, which can be used as input to a model
that predicts the spread of a fire� There are several different fuel-
type classification models and the classifications have become more
tailored as the understanding of fire behavior has grown� As the basis
for the fuel map, a detailed vegetation map provides a more precise
classification of fuel types and a more accurate model than coarse-
resolution maps (Peggy Moore, personal communication, February 16,
2014)�
Ventura County Fire DepartmentAccording to the Ventura County Fire Department, fine-scale
vegetation data is helpful for determining specific areas to target for
prescribed burns� Burn areas are selected based upon their fire history,
local winds, and vegetation type� By looking at the vegetation data,
they can target which areas they want to focus on and thus refine their
prescription burn plan (Barbara Geringer, personal communication,
January 27, 2014)�
FIR
E A
NA
LYSI
S
a shared vision for the Survey of California Vegetation
the center for geographical studies
20
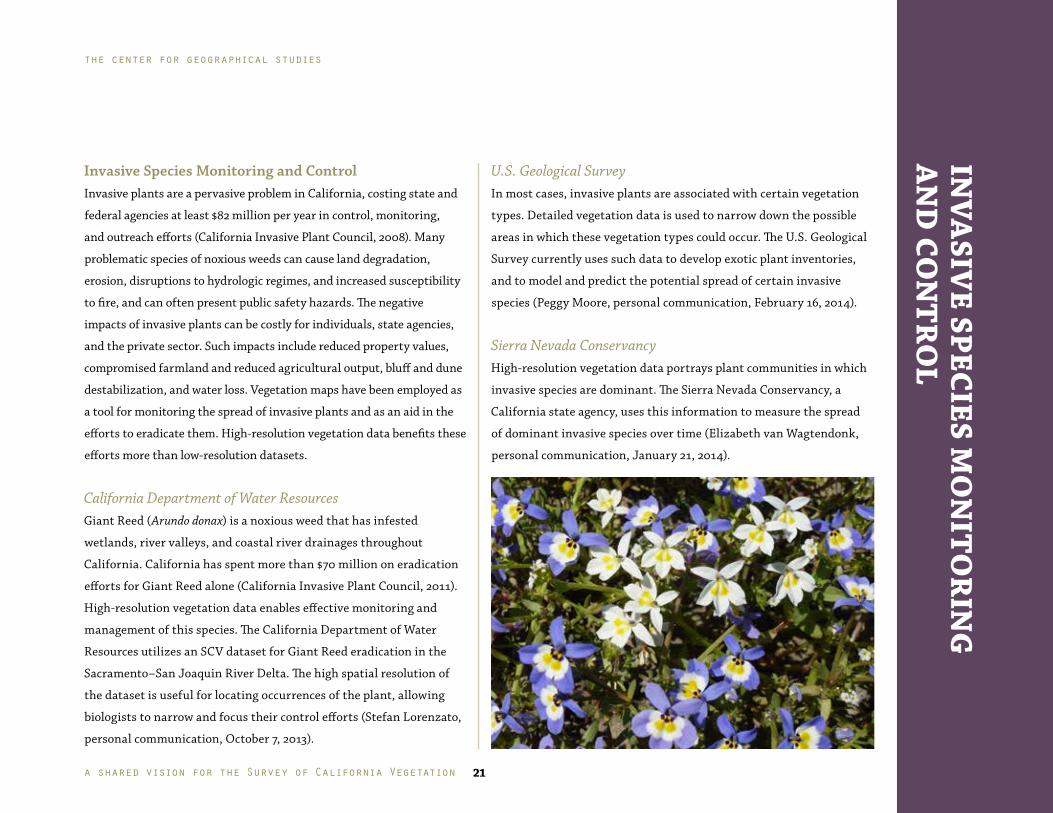
Invasive Species Monitoring and ControlInvasive plants are a pervasive problem in California, costing state and
federal agencies at least $82 million per year in control, monitoring,
and outreach efforts (California Invasive Plant Council, 2008)� Many
problematic species of noxious weeds can cause land degradation,
erosion, disruptions to hydrologic regimes, and increased susceptibility
to fire, and can often present public safety hazards� The negative
impacts of invasive plants can be costly for individuals, state agencies,
and the private sector� Such impacts include reduced property values,
compromised farmland and reduced agricultural output, bluff and dune
destabilization, and water loss� Vegetation maps have been employed as
a tool for monitoring the spread of invasive plants and as an aid in the
efforts to eradicate them� High-resolution vegetation data benefits these
efforts more than low-resolution datasets�
California Department of Water ResourcesGiant Reed (Arundo donax) is a noxious weed that has infested
wetlands, river valleys, and coastal river drainages throughout
California� California has spent more than $70 million on eradication
efforts for Giant Reed alone (California Invasive Plant Council, 2011)�
High-resolution vegetation data enables effective monitoring and
management of this species� The California Department of Water
Resources utilizes an SCV dataset for Giant Reed eradication in the
Sacramento–San Joaquin River Delta� The high spatial resolution of
the dataset is useful for locating occurrences of the plant, allowing
biologists to narrow and focus their control efforts (Stefan Lorenzato,
personal communication, October 7, 2013)�
U.S. Geological SurveyIn most cases, invasive plants are associated with certain vegetation
types� Detailed vegetation data is used to narrow down the possible
areas in which these vegetation types could occur� The U�S� Geological
Survey currently uses such data to develop exotic plant inventories,
and to model and predict the potential spread of certain invasive
species (Peggy Moore, personal communication, February 16, 2014)�
Sierra Nevada ConservancyHigh-resolution vegetation data portrays plant communities in which
invasive species are dominant� The Sierra Nevada Conservancy, a
California state agency, uses this information to measure the spread
of dominant invasive species over time (Elizabeth van Wagtendonk,
personal communication, January 21, 2014)�
INVA
SIVE SPECIES M
ON
ITOR
ING
A
ND
CON
TR
OL
a shared vision for the Survey of California Vegetation 21
the center for geographical studies
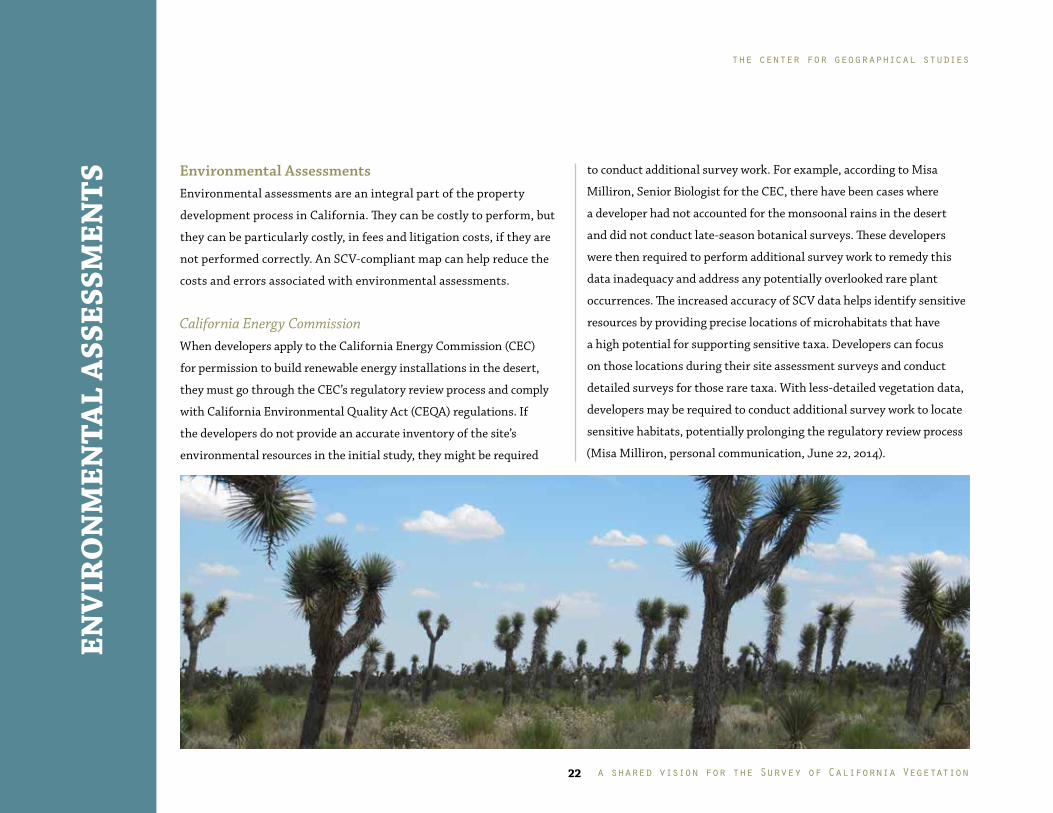
Environmental AssessmentsEnvironmental assessments are an integral part of the property
development process in California� They can be costly to perform, but
they can be particularly costly, in fees and litigation costs, if they are
not performed correctly� An SCV-compliant map can help reduce the
costs and errors associated with environmental assessments�
California Energy CommissionWhen developers apply to the California Energy Commission (CEC)
for permission to build renewable energy installations in the desert,
they must go through the CEC’s regulatory review process and comply
with California Environmental Quality Act (CEQA) regulations� If
the developers do not provide an accurate inventory of the site’s
environmental resources in the initial study, they might be required
ENV
IRO
NM
ENTA
L A
SSES
SMEN
TS to conduct additional survey work� For example, according to Misa
Milliron, Senior Biologist for the CEC, there have been cases where
a developer had not accounted for the monsoonal rains in the desert
and did not conduct late-season botanical surveys� These developers
were then required to perform additional survey work to remedy this
data inadequacy and address any potentially overlooked rare plant
occurrences� The increased accuracy of SCV data helps identify sensitive
resources by providing precise locations of microhabitats that have
a high potential for supporting sensitive taxa� Developers can focus
on those locations during their site assessment surveys and conduct
detailed surveys for those rare taxa� With less-detailed vegetation data,
developers may be required to conduct additional survey work to locate
sensitive habitats, potentially prolonging the regulatory review process
(Misa Milliron, personal communication, June 22, 2014)�
a shared vision for the Survey of California Vegetation
the center for geographical studies
22
Who Needs the Survey of California Vegetation?Although a number of users enjoy the benefits of working with SCV
datasets in their regions, this level of detail does not currently extend
to cover the entire state� Consequently, many users have experienced
a reduction in work output or have achieved less accurate results than
would have been possible with high-resolution data� Some users who
lack coverage in their areas were simply precluded from undertaking
certain projects� Based on interviews with frequent users of vegetation
GIS data, the following examples illustrate the demand for a
comprehensive statewide vegetation layer adhering to SCV standards�
Sierra Nevada ConservancyThe Sierra Nevada conservancy works with SCV data in the areas where it
is available� However, the conservancy expressed a need for a fine-scale
vegetation dataset covering the 5,000- to 7,000-foot elevation range of
the Sierra Nevada, where there is a significant amount of fire activity
(Elizabeth van Wagtendonk, personal communication, January 21, 2014)�
Ventura County Fire DepartmentThe Ventura County Fire Department does not have an SCV map
that covers the entire county and would like to acquire more precise
vegetation classification information for use in fire analyses� An
alliance-level classification system, part of an SCV dataset, would
enhance efforts to determine locations for prescribed burns� With
this data, the department would be able to identify locations with
obligate seeders, plants such as ceanothus and manzanita, which have
fire-activated seed banks that germinate and grow rapidly following
a fire� Knowing the locations of obligate seeders would be helpful in
determining target areas for prescribed burns by identifying which
regions have not experienced a recent burn, yet might host a sufficient
seed bank of such species (Barbara Geringer, personal communication,
January 27, 2014)�
American River ConservancySVC data does not cover the full extent of the region in which
the American River Conservancy works� A representative of the
conservancy indicated that the data would be particularly useful for
high-elevation meadows in the Sierra Nevada, where the available
coarse-resolution FRAP data is not sufficient for conservation
planning, parcel acquisition, or assessment of development impacts�
The projects that the conservancy undertakes in this area are very
time consuming because they must interpret satellite imagery to
create a map and cross-reference it with their on-ground knowledge of
the area (Elena DeLacy, personal communication, November 1, 2013)�
Multiple lawsuits regarding CEQA violations occur each year in
California� Fine-scale vegetation datasets may help prevent errors
leading to such lawsuits� For example, El Dorado County is in the
process of re-creating its Oak Woodland Management Plan after
CEQA violations were discovered� According to the American River
Conservancy, the Oak Woodland Management Plan used USFS Calveg
layers to identify “Important Oak Woodland Habitat�” However, this
layer underestimated the extent of the “Important Oak Woodland
Habitat,” since it did not accurately reflect the conditions on the
Many users of non-SCV datasets have experienced a reduction in work output or have achieved less accurate results than would have been possible with high-resolution data.
a shared vision for the Survey of California Vegetation 23
the center for geographical studies

ground� An SCV dataset would contain detailed information
concerning the age and species composition of oak woodlands and
would be more likely to identify areas in need of protection� Thus El
Dorado County would most likely have avoided the costly processes
of litigation and re-implementation of the Management Plan (Elena
DeLacy, personal communication, November 1, 2013)�
Conservation Biology InstituteThe Conservation Biology Institute in San Diego County is collecting
vegetation data for four current projects, as it lacked sufficiently
detailed datasets� The institute expressed a need for more detailed
maps in order to find vegetation correlates for rare species, to conduct
climate change analyses, and to monitor and manage species at the
preserve level� If a dataset meeting these requirements were available,
they would save considerable time and money by eliminating the data
collection and mapping processes (Patricia Gordon-Reedy, personal
communication, November 4, 2013)�
Strategic Growth CouncilMike McCoy, Executive Director of the Strategic Growth Council,
indicated that a comprehensive high-resolution vegetation dataset
would be extremely useful for the development of the proposed high-
speed rail system (the Bakersfield to Palmdale stretch in particular)�
The developers could use the dataset to expedite the site selection
process, eliminating areas that should be avoided and indicating those
that need further examination, thus reducing the number of sites
that need to be physically surveyed� According to the council, the
interagency working group would like to expedite preparation for the
high-speed rail by using a high-quality vegetation map (Mike McCoy,
personal communication, October 24, 2013)�
California Department of TransportationIf available, the California Department of Transportation (Caltrans)
could employ a high-resolution dataset during the scoping process to
calculate impacts from development at different potential work sites�
With such data, they may not have to conduct scoping field studies for
each project or spend time digitizing maps from aerial imagery (Ed
Schefter, personal communication, March 20, 2014)� Caltrans could
utilize SCV data to assist with road alignment projects in order to
avoid sensitive species or habitats, such as vernal pools� Caltrans is
also developing an Environmentally Sensitive Area (ESA) database to
help their workers avoid trampling sensitive species during routine
maintenance� High-resolution vegetation data would be very helpful
in the continued development of this database (Dana York, personal
communication, February 13, 2014)�
AECOMWhile AECOM was creating the SCV-compliant map of San Diego
County, they received several requests from individuals working on
the Regional Transportation Plan, inquiring if the dataset would be
a shared vision for the Survey of California Vegetation
the center for geographical studies
24
available soon� Lacking the dataset, these individuals were forced to
piece together missing project data to produce vegetation information
for the Transportation Plan using inefficient processes and imprecise
assessments (Jonathan Dunn and Tom Oberbauer, personal
communication, November 18, 2013)�
GreenInfo Network; California Invasive Plant CouncilGreenInfo Network believes that a fine-scale vegetation dataset would
be beneficial for invasive species monitoring and management, as it
would allow them to pick out the typical invasive plants associated
with each vegetation alliance (Larry Orman, personal communication,
November 11, 2013)� Similarly, the California Invasive Plant Council
indicated that if higher-resolution data were available statewide, it
would be useful in helping them prioritize habitats for protection
efforts (Dana Morowitz, personal communication, January 9, 2014)�
Information Center of the Environment at University of California, DavisAccording to the Information Center of the Environment at UC Davis,
the fine-scale classification of SCV datasets would be very useful for the
North Coast Mitigation Project on Highway 101� It could be beneficial
for predicting the impact of the development project on the species and
ecosystems in that area� Additionally, it could be valuable for looking
at nitrate contamination in groundwater in riparian areas (Karen
Beardsley and Patrick Huber, personal communication, October 7, 2013)�
California Energy CommissionThe California Energy Commission’s (CEC) Research and Development
division funds species-distribution modeling in various parts of the
state, some of which do not have a high-resolution vegetation dataset
available� According to the senior biologist of the CEC, the quality of
these models would be enhanced by a detailed and comprehensive
vegetation dataset (Misa Milliron, personal communication,
October 11, 2013)�
Agroecology Research Group at University of California, Berkeley
Houston Wilson, a Ph�D� candidate in the Agroecology Research Group
at UC Berkeley, indicated that high-resolution vegetation data would
be helpful for agricultural pest control efforts� Certain pest species,
such as Anagrus wasps, often invade cropland and vineyards adjacent
to natural vegetation, yet have only a few host plant species� High-
resolution data is necessary to determine if these host species are
present in the vicinity of an agricultural plot� Coarse-resolution maps
present only a gross assessment of the natural vegetation types in the
vicinity and do not permit the isolation of single species (Houston
Wilson, personal communication, February 13, 2014)�
a shared vision for the Survey of California Vegetation 25
the center for geographical studies
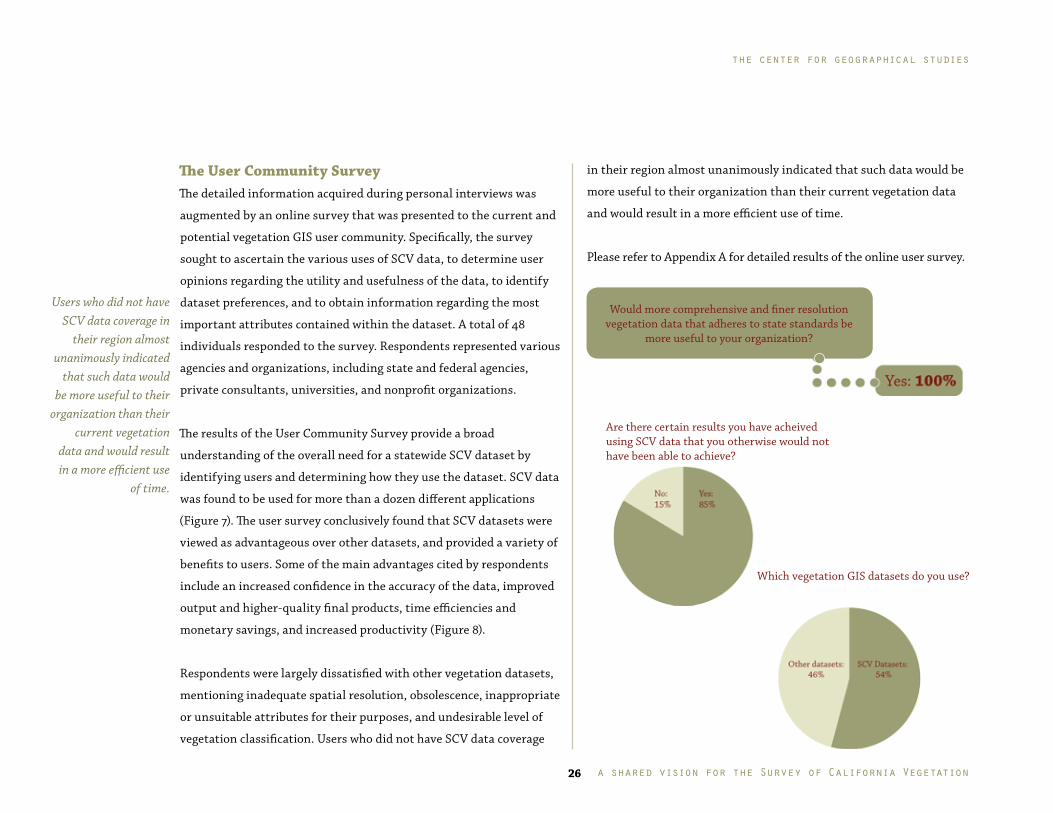
Would more comprehensive and finer resolution vegetation data that adheres to state standards be
more useful to your organization?
Are there certain results you have acheived using SCV data that you otherwise would not have been able to achieve?
Which vegetation GIS datasets do you use?
in their region almost unanimously indicated that such data would be
more useful to their organization than their current vegetation data
and would result in a more efficient use of time�
Please refer to Appendix A for detailed results of the online user survey�
The User Community Survey The detailed information acquired during personal interviews was
augmented by an online survey that was presented to the current and
potential vegetation GIS user community� Specifically, the survey
sought to ascertain the various uses of SCV data, to determine user
opinions regarding the utility and usefulness of the data, to identify
dataset preferences, and to obtain information regarding the most
important attributes contained within the dataset� A total of 48
individuals responded to the survey� Respondents represented various
agencies and organizations, including state and federal agencies,
private consultants, universities, and nonprofit organizations�
The results of the User Community Survey provide a broad
understanding of the overall need for a statewide SCV dataset by
identifying users and determining how they use the dataset� SCV data
was found to be used for more than a dozen different applications
(Figure 7)� The user survey conclusively found that SCV datasets were
viewed as advantageous over other datasets, and provided a variety of
benefits to users� Some of the main advantages cited by respondents
include an increased confidence in the accuracy of the data, improved
output and higher-quality final products, time efficiencies and
monetary savings, and increased productivity (Figure 8)�
Respondents were largely dissatisfied with other vegetation datasets,
mentioning inadequate spatial resolution, obsolescence, inappropriate
or unsuitable attributes for their purposes, and undesirable level of
vegetation classification� Users who did not have SCV data coverage
Users who did not have SCV data coverage in
their region almost unanimously indicated
that such data would be more useful to their
organization than their current vegetation
data and would result in a more efficient use
of time.
a shared vision for the Survey of California Vegetation
the center for geographical studies
26
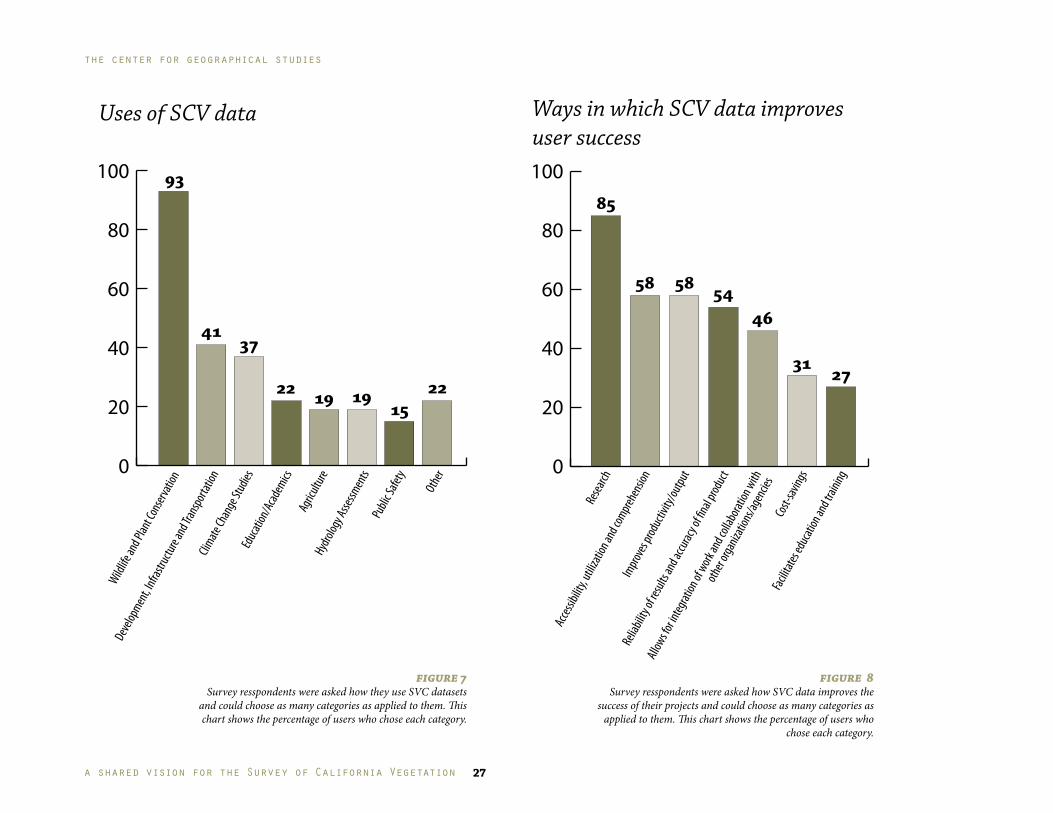
Ways in which SCV data improves user success
Uses of SCV data
figure 8Survey resspondents were asked how SVC data improves the
success of their projects and could choose as many categories as applied to them. This chart shows the percentage of users who
chose each category.
Wildlife
and P
lant C
onser
vatio
n
Deve
lopmen
t, Infr
astruc
ture a
nd Tra
nspo
rtatio
nCli
mate Ch
ange
Stud
iesEd
ucati
on/A
cadem
icsAg
ricult
ureHy
drolog
y Asse
ssmen
tsPu
blic S
afety
Othe
r
Resea
rch
Acces
sibilit
y, utili
zation
and c
ompre
hens
ionIm
prove
s prod
uctiv
ity/ou
tput
Relia
bility
of re
sults
and a
ccurac
y of fi
nal p
roduc
t
Allow
s for in
tegrat
ion of
work
and c
ollab
oratio
n with
other
organ
izatio
ns/ag
encie
sCo
st-sav
ings
Facilit
ates e
ducat
ion an
d trai
ning0
20
40
60
80
100 93
4137
22 19 1915
22
0
20
40
60
80
10085
58 58 5446
31 27
figure 7Survey resspondents were asked how they use SVC datasets
and could choose as many categories as applied to them. This chart shows the percentage of users who chose each category.
a shared vision for the Survey of California Vegetation 27
the center for geographical studies
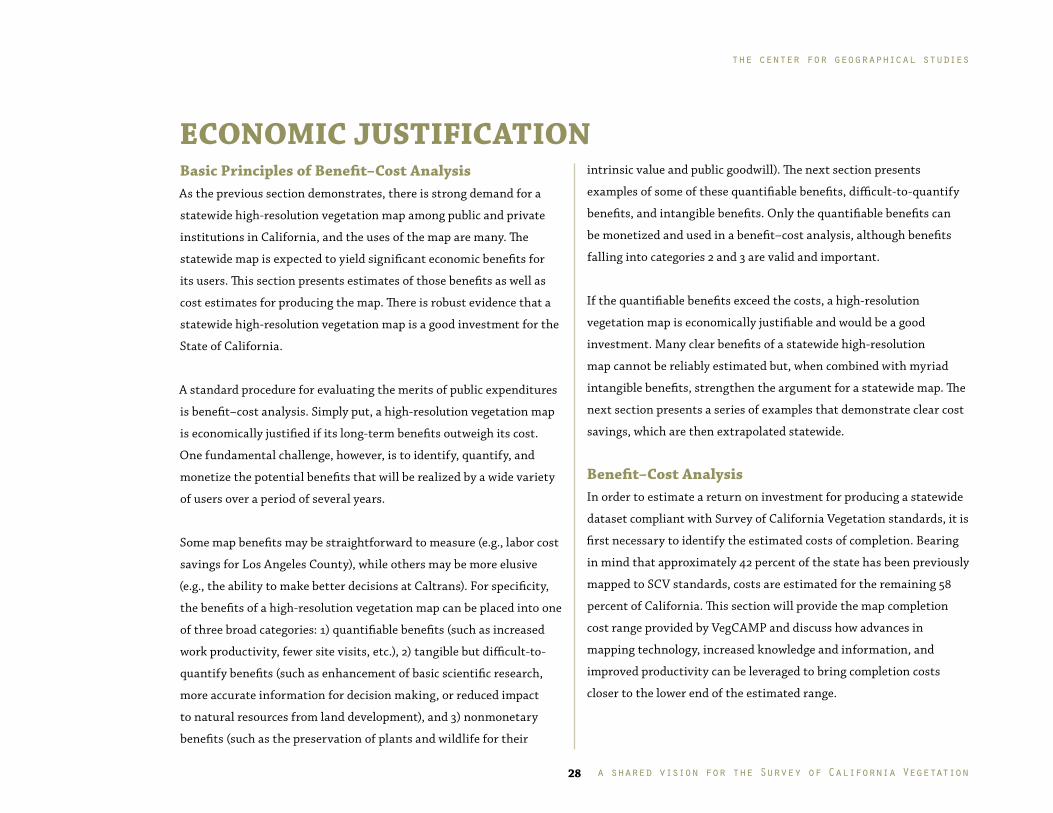
Basic Principles of Benefit–Cost AnalysisAs the previous section demonstrates, there is strong demand for a
statewide high-resolution vegetation map among public and private
institutions in California, and the uses of the map are many� The
statewide map is expected to yield significant economic benefits for
its users� This section presents estimates of those benefits as well as
cost estimates for producing the map� There is robust evidence that a
statewide high-resolution vegetation map is a good investment for the
State of California�
A standard procedure for evaluating the merits of public expenditures
is benefit–cost analysis� Simply put, a high-resolution vegetation map
is economically justified if its long-term benefits outweigh its cost�
One fundamental challenge, however, is to identify, quantify, and
monetize the potential benefits that will be realized by a wide variety
of users over a period of several years�
Some map benefits may be straightforward to measure (e�g�, labor cost
savings for Los Angeles County), while others may be more elusive
(e�g�, the ability to make better decisions at Caltrans)� For specificity,
the benefits of a high-resolution vegetation map can be placed into one
of three broad categories: 1) quantifiable benefits (such as increased
work productivity, fewer site visits, etc�), 2) tangible but difficult-to-
quantify benefits (such as enhancement of basic scientific research,
more accurate information for decision making, or reduced impact
to natural resources from land development), and 3) nonmonetary
benefits (such as the preservation of plants and wildlife for their
intrinsic value and public goodwill)� The next section presents
examples of some of these quantifiable benefits, difficult-to-quantify
benefits, and intangible benefits� Only the quantifiable benefits can
be monetized and used in a benefit–cost analysis, although benefits
falling into categories 2 and 3 are valid and important�
If the quantifiable benefits exceed the costs, a high-resolution
vegetation map is economically justifiable and would be a good
investment� Many clear benefits of a statewide high-resolution
map cannot be reliably estimated but, when combined with myriad
intangible benefits, strengthen the argument for a statewide map� The
next section presents a series of examples that demonstrate clear cost
savings, which are then extrapolated statewide�
Benefit–Cost AnalysisIn order to estimate a return on investment for producing a statewide
dataset compliant with Survey of California Vegetation standards, it is
first necessary to identify the estimated costs of completion� Bearing
in mind that approximately 42 percent of the state has been previously
mapped to SCV standards, costs are estimated for the remaining 58
percent of California� This section will provide the map completion
cost range provided by VegCAMP and discuss how advances in
mapping technology, increased knowledge and information, and
improved productivity can be leveraged to bring completion costs
closer to the lower end of the estimated range�
ECONOMIC JUSTIFICATION
a shared vision for the Survey of California Vegetation
the center for geographical studies
28
Explanation of CostsVegCAMP estimated the range of mapping costs by assessing two
different factors related to the cost of production: 1) the estimated
extent of different vegetation life forms and land use types across
California, and the historical and current per-acre cost of mapping, and
2) incorporation of revised mapping and classification methodologies
that create time and cost efficiencies and increase productivity�
The principle costs of all vegetation mapping projects include field
data collection, vegetation analysis and description development, field
reconnaissance and map production, and assurance of map accuracy
through application of the classification rules� The resulting product is
affected by what is effectively mappable based on the limitations of time,
cost, and the resolution of the imagery and other information sources�
Cost ScenariosThe three scenarios presented below identify the potential range of
costs associated with SCV map completion for the unmapped areas of
the state�Scenario CostLow-Cost $45,000,000Mid-Cost $56,000,000High-Cost $75,000,000
The high-cost scenario to complete the map is based on known current
costs and efficiencies of scale� Economies of scale will help streamline
the completion of the SCV map� It is less costly for one entity to
produce a vegetation map for a geographic region than for multiple
entities to produce several maps that comprise the region� Such cost
savings stem from the sharing of overhead costs and the fact that the
cost per acre decreases when mapping larger areas versus smaller ones�
Economies of scale can best be attained if contracts can be established
with a single mapping firm to produce maps in similar ecoregions� The
amount of time required to complete the additional mapping can also
be reduced by employing qualified vegetation mapping firms that have
approved track records in meeting mapping accuracy standards�
Vegetation classification and mapping projects can take two or more
years to complete using the current piecemeal approach, and accuracy
assessment may take a similar amount of time� Economies of scale and
reductions in map redundancy are quantifiable benefits of producing
a single map� If funding continues for smaller areas on a project-by-
project basis, the costs will be higher than the high-cost scenario�
The mid- and low-cost scenarios assume, to varying degrees,
efficiencies that are being evaluated through recently completed,
ongoing, or proposed projects, in addition to substantial economies
of scale that are likely to fall into place once these refined efficiencies
are implemented� Improved efficiencies are currently being explored
using three basic avenues:
1) Greater reliance on automation
2) Reduced intensity classification and field effort
3) Improvements in technology
a shared vision for the Survey of California Vegetation 29
the center for geographical studies
Automation Automation (computer-modeled decisions on spatial delineation,
typological, and structural attributes) can provide myriad time-saving
benefits when compared to manual mapping on a polygon-by-polygon
basis� For decades, there have been attempts to use computer analysis
to improve upon the manual techniques of aerial photo interpretation
of vegetation� Computer programs have been developed that analyze
information in the spectral signatures of remote imagery and correlate
those signatures with patterns of vegetation as described from field
sampling sites� One of the limiting issues surrounding the application
of automated methods was the lack of high-resolution imagery, but this
imagery has recently become available� The Sonoma County Agricultural
Preservation and Open Space District is beginning a vegetation map of
the one-million-acre county that will rely on automated mapping; this
map will serve as a test case for the entire state�
Reduced Intensity Classification and Field EffortA reduced intensity classification and field effort approach will rely on
existing SCV-compliant datasets to guide mapping efforts in a new
area� The existing dataset will provide a well-developed, field-based
vegetation classification and extensive map Accuracy Assessments
(AAs)� There are two scenarios for the methodology: building on
existing knowledge and seed mapping�
The first scenario relies upon a vegetation classification and AA from
a completed project, so substantial adjacent areas can be mapped
without requiring significant additional data collection and analysis�
More than 20 percent of the land mass has already been classified and
mapped for 13 of the 18 ecoregions defined by Miles and Goudey (1997);
these ecoregions are likely to be candidates for reduced intensity
classification and accuracy assessment� Five of those ecoregions
(Mojave Desert, Southeastern Great Basin, Sierra Nevada Foothills,
Great Valley, Sonoran Desert) are more than 50 percent mapped
already and are expected to need even less intensive classification and
map accuracy efforts (Figure 9)�
The second scenario applies to areas where little data collection or
mapping has been completed� In those places, a representative “seed”
map and classification area will be chosen for each ecoregion in the
map range� The seed areas will be chosen to represent the full range
of ecological settings of a given ecoregion and therefore encompass
the vegetation types in it; they will span the diversity of vegetation in
the map range, but will cover only a portion of the full area� The seed
areas will be sampled, classified, mapped, and tested for accuracy at a
high level� Once the seed areas are completed, the balance of the areas
can be mapped at reduced costs, as in the first scenario� VegCAMP is
currently beginning a pilot study of the seed mapping approach�
Improvements in TechnologyFinally, cost reduction will undoubtedly come from improvements
in technology such as advances in computer hardware and software,
the availability of Unmanned Aircraft Systems (UAS, or drones),
and new remote imagery sensors� VegCAMP is currently studying
the use of UAS with the U�S� Geological Survey to collect very high-
a shared vision for the Survey of California Vegetation
the center for geographical studies
30
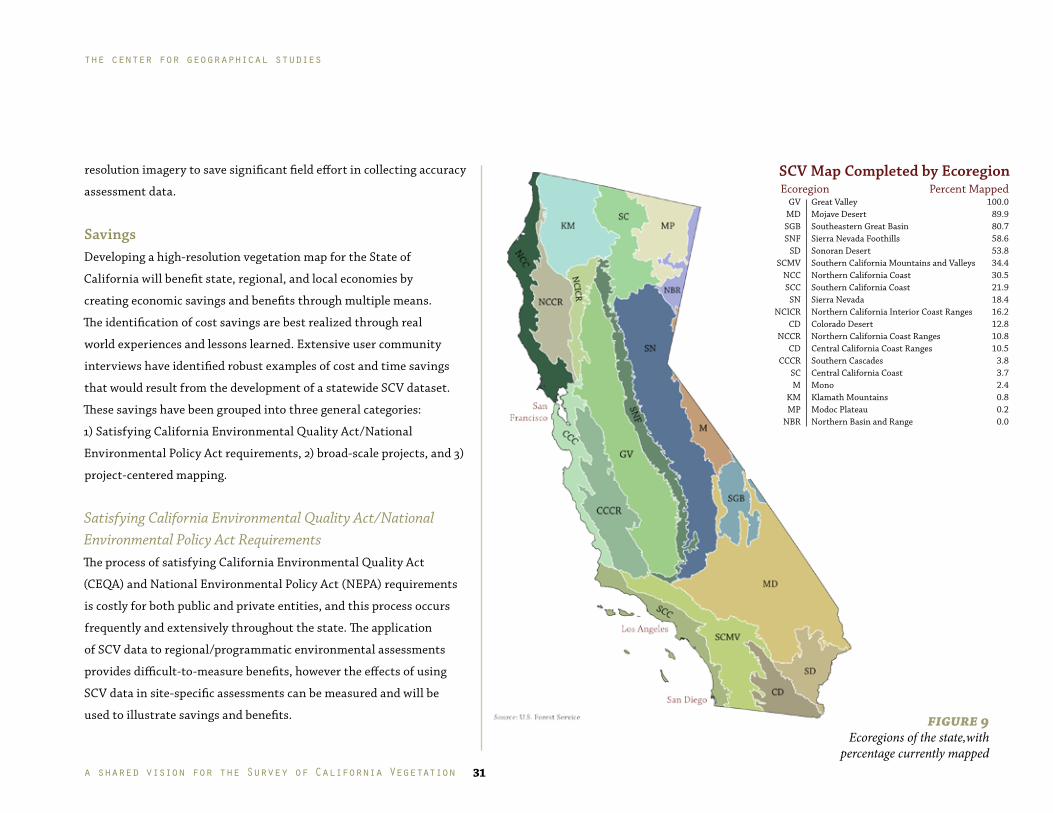
resolution imagery to save significant field effort in collecting accuracy
assessment data�
SavingsDeveloping a high-resolution vegetation map for the State of
California will benefit state, regional, and local economies by
creating economic savings and benefits through multiple means�
The identification of cost savings are best realized through real
world experiences and lessons learned� Extensive user community
interviews have identified robust examples of cost and time savings
that would result from the development of a statewide SCV dataset�
These savings have been grouped into three general categories:
1) Satisfying California Environmental Quality Act/National
Environmental Policy Act requirements, 2) broad-scale projects, and 3)
project-centered mapping�
Satisfying California Environmental Quality Act/National Environmental Policy Act RequirementsThe process of satisfying California Environmental Quality Act
(CEQA) and National Environmental Policy Act (NEPA) requirements
is costly for both public and private entities, and this process occurs
frequently and extensively throughout the state� The application
of SCV data to regional/programmatic environmental assessments
provides difficult-to-measure benefits, however the effects of using
SCV data in site-specific assessments can be measured and will be
used to illustrate savings and benefits�
SCV Map Completed by Ecoregion
figure 9Ecoregions of the state,with
percentage currently mapped
Ecoregion Percent MappedGV Great Valley 100�0
MD Mojave Desert 89�9SGB Southeastern Great Basin 80�7SNF Sierra Nevada Foothills 58�6
SD Sonoran Desert 53�8SCMV Southern California Mountains and Valleys 34�4
NCC Northern California Coast 30�5SCC Southern California Coast 21�9
SN Sierra Nevada 18�4NCICR Northern California Interior Coast Ranges 16�2
CD Colorado Desert 12�8NCCR Northern California Coast Ranges 10�8
CD Central California Coast Ranges 10�5CCCR Southern Cascades 3�8
SC Central California Coast 3�7M Mono 2�4
KM Klamath Mountains 0�8MP Modoc Plateau 0�2
NBR Northern Basin and Range 0�0
a shared vision for the Survey of California Vegetation 31
the center for geographical studies
The CEQA process can be classified into several categories, each
one involving multiple stages, such as the Initial Study and
the development of an Environmental Impact Report (EIR) or
Mitigated Negative Declaration� During the Initial Study stage and
the development of a site-specific EIR, an environmental setting
statement often utilizes a vegetation map to describe a site’s natural
features� When a sufficiently detailed map is not available, public
agency planners or private companies (whoever is responsible for
the EIR) may need to either utilize an in-house biologist/mapping
specialist or hire an environmental consultant to survey the site in
question and produce a map� Communications with environmental
consultants indicated that if a vegetation dataset meeting SCV
standards were available, their time spent on vegetation map
preparation would be reduced�
Jennifer Holton of Streamscape Environmental produces vegetation
maps that clients use for Initial Studies and for potential mitigation
analysis research� She often starts with an existing vegetation map
as a base, uses aerial photo interpretation and ground surveys to
supplement and revise existing information, then edits the vegetation
map as needed� She stated that the availability of a high-resolution
dataset such as an SCV map could reduce time spent on these tasks
by approximately 50 percent� As she works about ten hours per week
editing and creating vegetation datasets, she assumes she would save
about five hours per week� From a client’s viewpoint, if she saved five
hours per week, at $50 per hour, this would result in $250 per week of
savings (Jennifer Holton, personal communication, 2014)�
Jane Valerius of Jane Valerius Environmental Consulting also
confirms that savings of up to 50 percent could be realized with the
availability of an SCV dataset when creating and editing vegetation
maps for use in site-specific EIR projects� Based on a billing rate
of $115 per hour this could save anywhere from $230-$575 per week
for her clients, which are typically small cities and towns, and local
agencies such as Sonoma County Regional Parks (Jane Valerius,
personal communication, 2014)�
At Aspen Environmental Consultants, Scott White confirmed that
they could save approximately 10 percent of the time required to
produce an accurate vegetation map for a site-specific EIR by reducing
the number of on the ground site visits (Scott White, personal
communication, 2014)�
According to AECOM, a biological consulting firm that has assisted
in developing high-resolution vegetation datasets, small cities and
other agencies without an in-house biologist often spend $100,000
on consultant contracts for CEQA-related assessments (Jonathan
Dunn and Tom Oberbauer, personal communication, November 18,
2013)� AECOM suggested that a high-resolution vegetation layer could
eliminate the need for detailed mapping on a project-by-project basis
(Michelle Fehrensen, personal communication, April 3, 2014)�
Over 14,000 projects for which environmental documents (e�g� CEQA
Initial Studies, Mitigated Negative Declarations, EIRs, and joint
CEQA/NEPA Environmental Assessments and Environmental Impact
a shared vision for the Survey of California Vegetation
the center for geographical studies
32
Statements) have been filed during the years 2007 through 2013 have
addressed biological issues, according to the State Clearinghouse
(Christine Rodriguez, personal communication, April 29, 2014)� Many
of these could be addressed more efficiently with fine-scale vegetation
data such as the SCV provides� Of the 2,128 EIRs filed within this
time frame, approximately 64 percent involved biological resources
and would have benefited from SCV data� By reducing the number of
periodic, piecemeal, and often overlapping mapping efforts required
for large-scale environmental review processes, the statewide SCV
map will result in significant savings for cities, counties, and other
government agencies� Addressing this issue will assist in avoiding the
redundant and inefficient use of public and private funds�
Broad-Scale ProjectsThe use of an SCV dataset can provide another significant benefit in
the form of cost savings for broad-scale development and conservation
projects� The state frequently spends a substantial amount of money
in both the planning and permitting/reporting processes during the
course of these projects, and SCV data can help reduce these costs�
Caltrans staff stated that enormous cost savings could be realized by
limiting the time and scope of environmental impact analysis work
required for sensitive large-scale projects such as road placement
and realignment� For example, Caltrans staff can greatly reduce the
amount of time they spend in the field for environmental analysis
by guiding biologists directly toward resources of concern� Caltrans
estimates it would reduce time spent in the field by about 200 hours
per project per year, resulting in a savings of approximately $20,000
per project per year (Dana York, personal communication, 2014)�
Ed Schefter, another Caltrans staff member, estimated that the
research dedicated to the vegetation aspect of a development
project generally accounts for about 10 percent of the project’s
environmentally-related budget� Should the agency have access
to a layer such as the SCV map, they might be 50 percent more
efficient with their analysis, resulting in a 5 percent savings for
environmentally related costs of the project (Ed Schefter, personal
communication, March 20, 2014)�
BLM staff hired Aspen Environmental Group to create a vegetation
map for the Desert Harvest Solar Farm Project, a large solar project
development on approximately 1,200 acres of desert habitat in
Riverside County� Due to the absence of high-resolution, current,
accurate vegetation data, Aspen Environmental had to create the map
from scratch� According to both Scott White at Aspen Environmental
Group and Mark Massar at BLM, the availability of a dataset such as
the SCV could have potentially saved 50 percent of the mapping cost
(Scott White and Mark Massar, personal communication, 2014)� Frank
McMenimen, Project Manager at the BLM Palm Springs office, stated
that the cost of a special or standard biological/plant/wildlife survey
such as this one averages between $1�8 and $2 million, which indicates
that a potential savings of approximately $1 million could have been
realized (Frank McMenimen, personal communication, 2014)�
a shared vision for the Survey of California Vegetation 33
the center for geographical studies
The Desert Renewable Energy Conservation Plan (DRECP) required
the development of a seamless vegetation map covering the extent of
the project� For the first two years of the project, such a map did not
exist, and needed to be stitched together from a variety of disparate,
out-of-date and, in some cases, inaccurate sources with inconsistent
resolutions and differing vegetation classification schemas� Planners
and consultants spent hundreds of hours in discussions and map
development, and expended a significant amount of money piecing
together their best effort at a vegetation map that was eventually
replaced by an SCV dataset�
Project-Centered MappingIn the absence of a completed statewide SCV map, many regions in the
state are left with inaccurate, generalized, and out-of-date vegetation
data� As a result, agencies and organizations are often required to
produce their own vegetation maps on a project-by-project basis�
Often, these vegetation maps do not conform to state standards and
at times they unintentionally overlap in extent, and may cost more to
produce as well�
Jennifer Holton at Streamscape Environmental has worked on
numerous site-specific vegetation mapping projects; within a four-
month period, she worked on over ten vegetation mapping projects
(personal communication, 2014)� Staff at AECOM stated that they
have worked on at least four broad-scale vegetation mapping projects
(Jonathan Dunn, personal communication, 2014), and Scott White at
Aspen Environmental estimates his company completes approximately
ten vegetation mapping projects per year (personal communication,
2014)� Individual map production requires significant oversight,
enforcement of standards, and quality control� Should these estimates
be extrapolated out to consultants and agencies across California, one
can begin to envision the economic effect of the project-by-project
mapping efforts that are occurring�
Net Benefits and Return on InvestmentThe statewide SCV map will produce monetary benefits to
organizations and agencies across California� Benefits are presently
being realized where SCV-compliant maps have been completed, but
the level of current and future benefits is still uncertain� Over time,
state agencies will gain experience with the maps and gather useful
quantitative information, which will help to measure the various
benefits of SCV datasets� Only after a suitable time period has elapsed
will a thorough evaluation of the map’s benefits be possible� Thus, the
monetary value of benefits must be estimated and forecast into the
future using conservative methods and assumptions�
The benefits of the SCV will be widespread, and the estimates
presented here reflect only a partial accounting of expected future
benefits� Only the most easily quantified categories of benefits are
considered� Nevertheless, even under the most conservative scenario,
the quantifiable benefits of completion of the statewide SCV map are
expected to exceed the costs of producing the classification and map�
If the difficult-to-measure and nonmonetary benefits were included,
the SCV’s estimated value would be further strengthened�
Even under the most conservative scenario,
the quantifiable benefits of completion of the statewide SCV
map are expected to exceed the costs
of producing the classification and
map. If the difficult-to-measure and
nonmonetary benefits were included, the
SCV’s estimated value would be further
strengthened.
a shared vision for the Survey of California Vegetation
the center for geographical studies
34
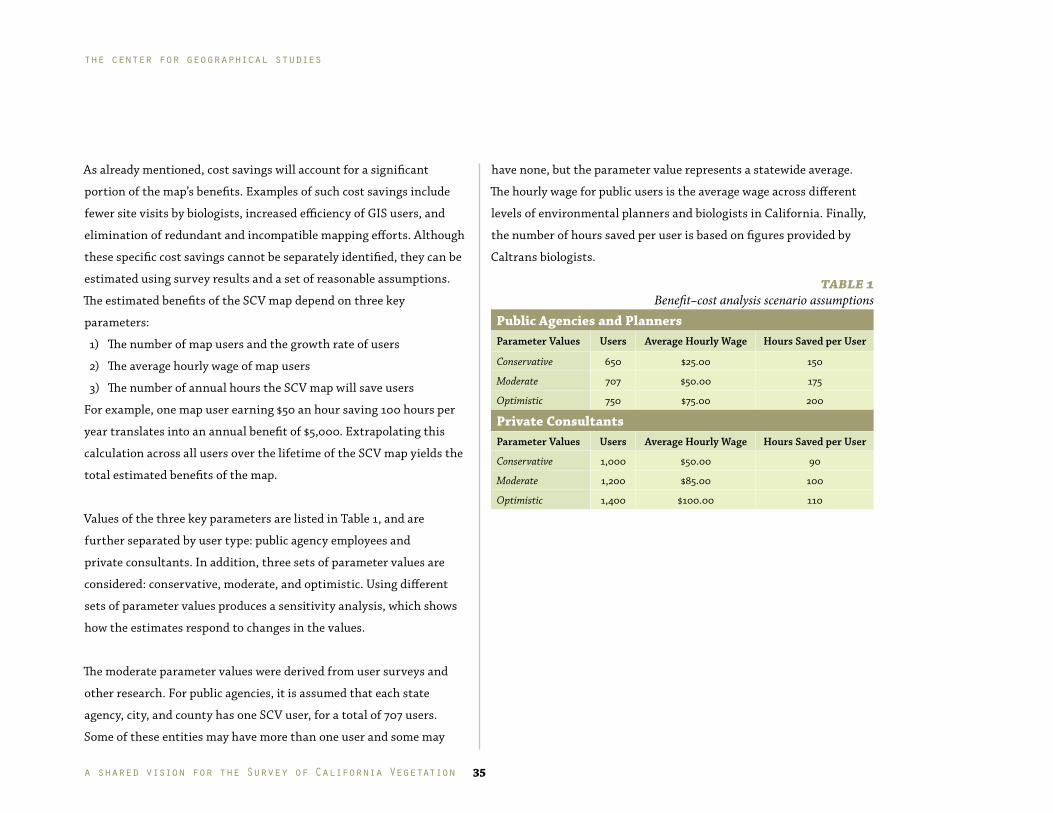
As already mentioned, cost savings will account for a significant
portion of the map’s benefits� Examples of such cost savings include
fewer site visits by biologists, increased efficiency of GIS users, and
elimination of redundant and incompatible mapping efforts� Although
these specific cost savings cannot be separately identified, they can be
estimated using survey results and a set of reasonable assumptions�
The estimated benefits of the SCV map depend on three key
parameters:
1) The number of map users and the growth rate of users
2) The average hourly wage of map users
3) The number of annual hours the SCV map will save users
For example, one map user earning $50 an hour saving 100 hours per
year translates into an annual benefit of $5,000� Extrapolating this
calculation across all users over the lifetime of the SCV map yields the
total estimated benefits of the map�
Values of the three key parameters are listed in Table 1, and are
further separated by user type: public agency employees and
private consultants� In addition, three sets of parameter values are
considered: conservative, moderate, and optimistic� Using different
sets of parameter values produces a sensitivity analysis, which shows
how the estimates respond to changes in the values�
The moderate parameter values were derived from user surveys and
other research� For public agencies, it is assumed that each state
agency, city, and county has one SCV user, for a total of 707 users�
Some of these entities may have more than one user and some may
have none, but the parameter value represents a statewide average�
The hourly wage for public users is the average wage across different
levels of environmental planners and biologists in California� Finally,
the number of hours saved per user is based on figures provided by
Caltrans biologists�
table 1Benefit–cost analysis scenario assumptions
Public Agencies and PlannersParameter Values Users Average Hourly Wage Hours Saved per User
Conservative 650 $25�00 150
Moderate 707 $50�00 175
Optimistic 750 $75�00 200
Private ConsultantsParameter Values Users Average Hourly Wage Hours Saved per User
Conservative 1,000 $50�00 90
Moderate 1,200 $85�00 100
Optimistic 1,400 $100�00 110
a shared vision for the Survey of California Vegetation 35
the center for geographical studies
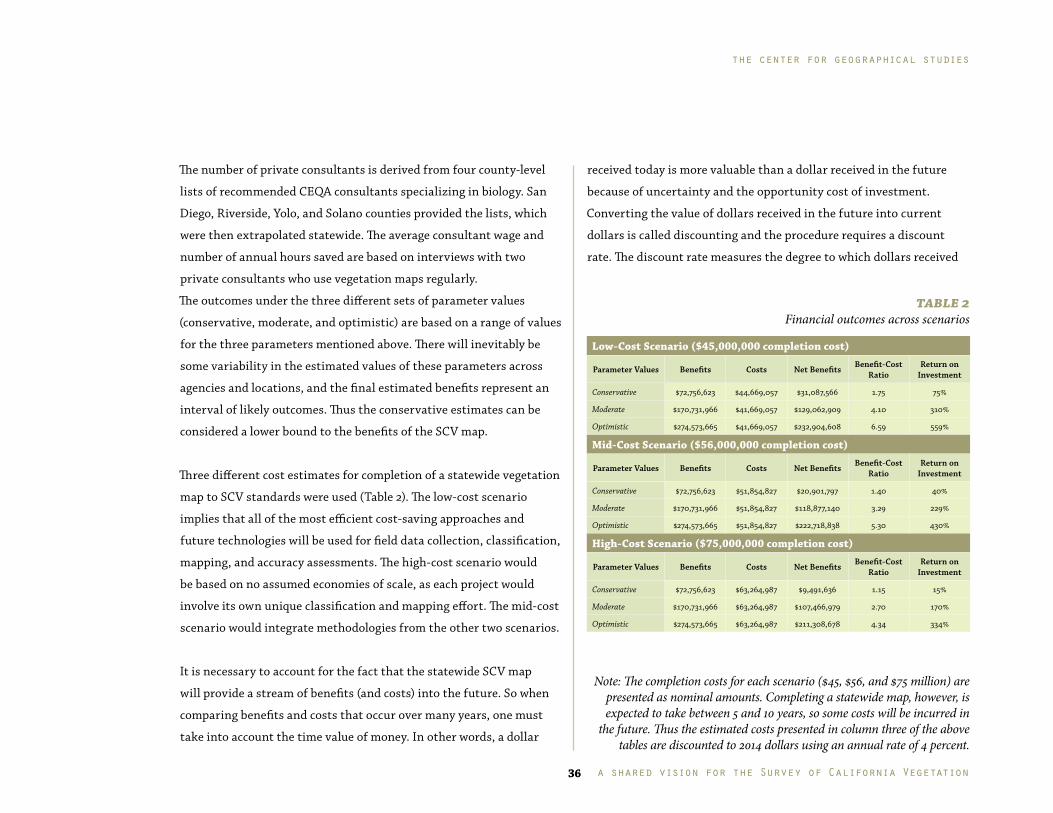
Note: The completion costs for each scenario ($45, $56, and $75 million) are presented as nominal amounts. Completing a statewide map, however, is expected to take between 5 and 10 years, so some costs will be incurred in
the future. Thus the estimated costs presented in column three of the above tables are discounted to 2014 dollars using an annual rate of 4 percent.
The number of private consultants is derived from four county-level
lists of recommended CEQA consultants specializing in biology� San
Diego, Riverside, Yolo, and Solano counties provided the lists, which
were then extrapolated statewide� The average consultant wage and
number of annual hours saved are based on interviews with two
private consultants who use vegetation maps regularly�
The outcomes under the three different sets of parameter values
(conservative, moderate, and optimistic) are based on a range of values
for the three parameters mentioned above� There will inevitably be
some variability in the estimated values of these parameters across
agencies and locations, and the final estimated benefits represent an
interval of likely outcomes� Thus the conservative estimates can be
considered a lower bound to the benefits of the SCV map�
Three different cost estimates for completion of a statewide vegetation
map to SCV standards were used (Table 2)� The low-cost scenario
implies that all of the most efficient cost-saving approaches and
future technologies will be used for field data collection, classification,
mapping, and accuracy assessments� The high-cost scenario would
be based on no assumed economies of scale, as each project would
involve its own unique classification and mapping effort� The mid-cost
scenario would integrate methodologies from the other two scenarios�
It is necessary to account for the fact that the statewide SCV map
will provide a stream of benefits (and costs) into the future� So when
comparing benefits and costs that occur over many years, one must
take into account the time value of money� In other words, a dollar
received today is more valuable than a dollar received in the future
because of uncertainty and the opportunity cost of investment�
Converting the value of dollars received in the future into current
dollars is called discounting and the procedure requires a discount
rate� The discount rate measures the degree to which dollars received
table 2Financial outcomes across scenarios
a shared vision for the Survey of California Vegetation
the center for geographical studies
36
Low-Cost Scenario ($45,000,000 completion cost)
Parameter Values Benefits Costs Net Benefits Benefit-Cost Ratio
Return on Investment
Conservative $72,756,623 $44,669,057 $31,087,566 1�75 75%
Moderate $170,731,966 $41,669,057 $129,062,909 4�10 310%
Optimistic $274,573,665 $41,669,057 $232,904,608 6�59 559%
Mid-Cost Scenario ($56,000,000 completion cost)
Parameter Values Benefits Costs Net Benefits Benefit-Cost Ratio
Return on Investment
Conservative $72,756,623 $51,854,827 $20,901,797 1�40 40%
Moderate $170,731,966 $51,854,827 $118,877,140 3�29 229%
Optimistic $274,573,665 $51,854,827 $222,718,838 5�30 430%
High-Cost Scenario ($75,000,000 completion cost)
Parameter Values Benefits Costs Net Benefits Benefit-Cost Ratio
Return on Investment
Conservative $72,756,623 $63,264,987 $9,491,636 1�15 15%
Moderate $170,731,966 $63,264,987 $107,466,979 2�70 170%
Optimistic $274,573,665 $63,264,987 $211,308,678 4�34 334%
in the future are valued less than those received today and it is usually
expressed as a percent� For this analysis the discount rate is set at an
industry accepted standard of 4 percent� Finally, it is also assumed
that the number of SCV users will grow at a rate of 3 percent annually
and that maintenance costs will increase 2 percent annually�
There are several useful metrics for gauging the desirability of public
projects like the completed SCV map of California� They are: 1) net
benefits, 2) benefit–cost ratio, and 3) return on investment� The three
measures are similar, but not equivalent, and the formulas are listed
below� For simplicity it is assumed that the benefits and costs are
measured in present dollars, i�e� they have been discounted�
Net Benefits = Benefits - Costs
Benefit–Cost Ratio = Benefits / Costs
Return on Investment = ((Benefits - Costs) / Costs) * 100
Table 2 presents the estimates for each of the three cost scenarios�
The cost figures are those described earlier� In each of the cases, the
benefits exceed the cost of producing the map; although under the
conservative scenario, the net benefits are small but still positive�
The moderate scenario, which used parameters based on the user
community survey and other research, shows large returns; the
benefits are more 2�5 times larger than the costs� The moderate
scenario is considered to be the most likely outcome, as the associated
parameter values are most strongly supported by the survey data and
the interview responses� It is important to note that the scenarios
identified below are based on unknown or hard-to-predict factors,
hence the range in outcomes� These are not three different levels of
work that could be funded, but rather an estimate as to potential
returns on investment depending on cost and incorporation of
efficiencies�
These estimates suggest that the benefits related to cost savings are
large and exceed the map creation costs� Including other benefits
that are difficult to quantify will further increase net benefits and
return on investment�
Difficult-to-Measure and Nonmonetary BenefitsSurvey of California Vegetation maps and data provide a variety of
benefits to a wide range of agencies and organizations throughout
the State of California� Some of these benefits, however, are
inherently difficult to measure or are nonmonetary� Although such
benefits cannot be measured in monetary terms, they do represent
real value to the state�
Difficult-to-Measure BenefitsThe statewide SCV map is expected to benefit California by reducing
costs� Some costs, however, are difficult or impractical to measure�
Vegetation map user survey results show that a host of organizations
and agencies throughout the state will benefit from open access to
a comprehensive, high-resolution dataset� Openly accessible data
saves time by allowing organizations to utilize existing information
resources (Transportation Research Board, 2004)� For some projects,
Benefits• Foster collaboration
and communication among agencies and organizations
• Reduce costs associated with consulting services
• Avoid redundant and overlapping mapping efforts
• Reduce errors in project planning and execution
• Reduce or avoid CEQA litigation
• Optimize resource management practices
• More efficiently utilize scarce resources and expedite processes
• Provide more accurate and reliable end products
• Support intrinsic value of California’s wild flora and fauna
a shared vision for the Survey of California Vegetation 37
the center for geographical studies
especially ones that do not involve development, openly accessible
data will eliminate the need to produce a detailed vegetation map�
Since vegetation classification and mapping projects can take two or
more years to complete using the current piecemeal approach, and
subsequent accuracy assessments may take a similar amount of time,
this could reduce the duration of a project by several years�
Collaboration among organization and agencies can be facilitated
by a statewide high-resolution vegetation dataset� For example,
Ventura County will be conducting an Environmentally Sensitive
Habitat designation project in parts of the Santa Monica Mountains�
Because Ventura County will be using SCV data for this area, they
can collaborate with the California Coastal Commission, who
has experience working with the dataset (Jonna Engel, personal
communication, 2013)� Ventura County will realize operational
efficiencies and cost savings that they would not have received without
this data� In addition, many local, regional, and state agencies are
tasked with regional or landscape-level projects, often extending
beyond their jurisdictions� Conserving species and landscapes,
building habitat corridors, evaluating the relative importance of
conservation sites, etc�, all rely upon a seamless and standardized
set of vegetation data (along with other seamless geographical data
such as transportation infrastructure and conserved areas)� SCV
data facilitates coordination among agencies involved in such cross-
jurisdictional projects, and will ultimately result in more efficient use
of funds�
A statewide vegetation dataset can reduce redundant data collection
and mapping, resulting in savings in cost and time (Transportation
Research Board, 2004)� Poor coordination between agencies results
in unnecessary duplication of effort, higher costs, and products that
cannot be readily used by others (California Biodiversity Council,
2000)� Currently, communication between agencies during the
mapping process is limited and public records of past surveys and
mapping products are not readily available� SCV data is centralized
and openly accessible, thereby eliminating unnecessary duplication in
future mapping efforts�
Users of geospatial vegetation data have found that high-quality data
can help reduce mistakes made in project planning and execution�
It is difficult to estimate the cost of mistakes that would have
occurred in the absence of a high-quality vegetation map, but they
can be significant� For example, regulatory agencies may require an
organization to completely reinstate a management plan, relocate
infrastructure, or conduct various mitigation efforts if it finds that
a mistake has been made that impacts the environment� Each year,
approximately 25-30 CEQA-related lawsuits occur in California, often
initiated due to erroneous information in environmental management
plans and EIRs� An agency would incur substantial litigation costs
if taken to court� Including a quantified accuracy assessment (an
element of an SCV-compliant map) in management plans removes the
debate surrounding data quality, and may prevent a CEQA-related
lawsuit� Statewide SCV data will better inform management and
a shared vision for the Survey of California Vegetation
the center for geographical studies
38
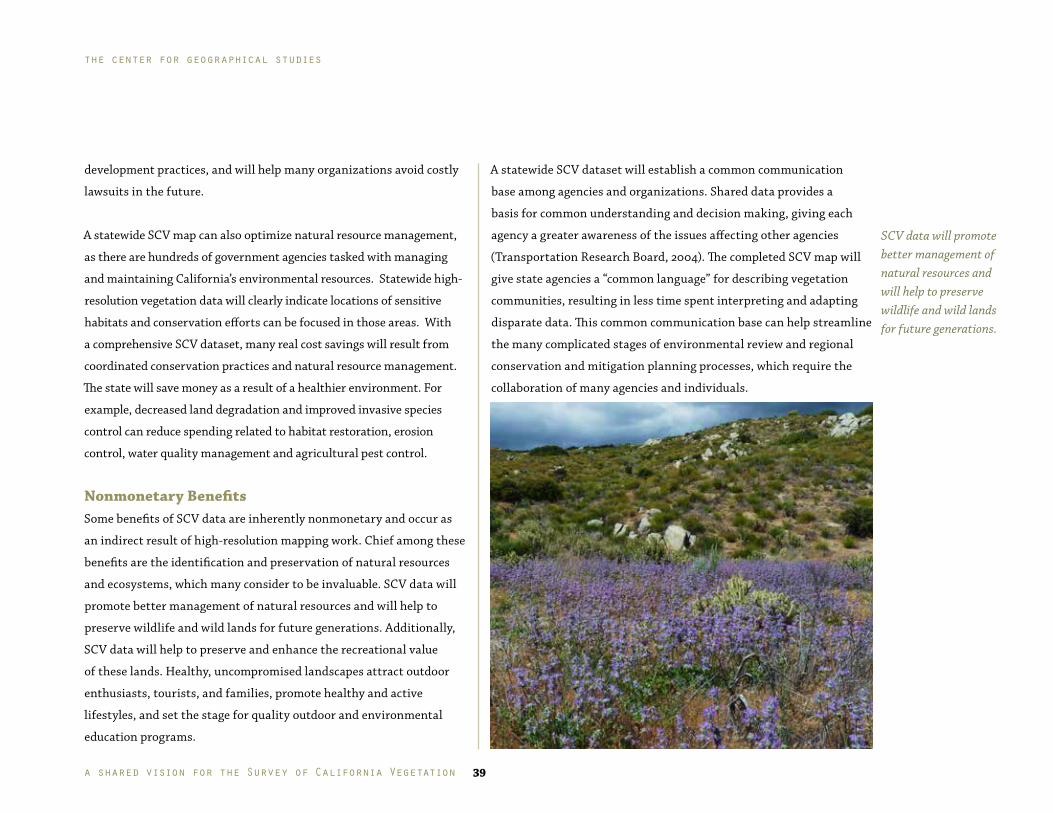
development practices, and will help many organizations avoid costly
lawsuits in the future�
A statewide SCV map can also optimize natural resource management,
as there are hundreds of government agencies tasked with managing
and maintaining California’s environmental resources� Statewide high-
resolution vegetation data will clearly indicate locations of sensitive
habitats and conservation efforts can be focused in those areas� With
a comprehensive SCV dataset, many real cost savings will result from
coordinated conservation practices and natural resource management�
The state will save money as a result of a healthier environment� For
example, decreased land degradation and improved invasive species
control can reduce spending related to habitat restoration, erosion
control, water quality management and agricultural pest control�
Nonmonetary BenefitsSome benefits of SCV data are inherently nonmonetary and occur as
an indirect result of high-resolution mapping work� Chief among these
benefits are the identification and preservation of natural resources
and ecosystems, which many consider to be invaluable� SCV data will
promote better management of natural resources and will help to
preserve wildlife and wild lands for future generations� Additionally,
SCV data will help to preserve and enhance the recreational value
of these lands� Healthy, uncompromised landscapes attract outdoor
enthusiasts, tourists, and families, promote healthy and active
lifestyles, and set the stage for quality outdoor and environmental
education programs�
A statewide SCV dataset will establish a common communication
base among agencies and organizations� Shared data provides a
basis for common understanding and decision making, giving each
agency a greater awareness of the issues affecting other agencies
(Transportation Research Board, 2004)� The completed SCV map will
give state agencies a “common language” for describing vegetation
communities, resulting in less time spent interpreting and adapting
disparate data� This common communication base can help streamline
the many complicated stages of environmental review and regional
conservation and mitigation planning processes, which require the
collaboration of many agencies and individuals�
SCV data will promote better management of natural resources and will help to preserve wildlife and wild lands for future generations.
a shared vision for the Survey of California Vegetation 39
the center for geographical studies
Completion of the Survey of California Vegetation MapDevelopment of a process to expedite the completion of a statewide
Survey of California Vegetation classification and map is a singularly
important goal� The values of the methods and products discussed in
this report can only be fully realized if the entire state is completed at
the same resolution and accuracy� It is also important to develop this
statewide dataset over a relatively short period of time since “currency”
for statewide assessment is quickly changing due to development
pressures and the effects of climate, fire, and other processes�
Based on our research, we emphasize that the rate of vegetation
mapping should increase significantly for two reasons: 1) to serve
the growing needs of vegetation map users, and 2) to ensure that the
mapping already completed in over 42 percent of the state remains
valid and useful� SCV-compliant vegetation mapping began in 1998,
and mapping efficiencies in terms of acres mapped have doubled from
the period 1998–2007 versus the period from 2007 to the present�
This is primarily due to greater funding for projects with a more
ecoregional approach, increasing economies of scale�
Mapping and Program CoordinationThe Vegetation MOU, as discussed previously, recognizes that
completion of a statewide vegetation dataset is best achieved on a
regional basis through interagency cooperative efforts (California
Biodiversity Council, 2000)� Each ecoregion (Figure 9) will be mapped
by experts who are familiar with the vegetation types and land
management entities in that area, with the guidance and support
of the contracting agencies� VegCAMP will provide training and
technical advice, assistance with vegetation classification, and
database stewardship� VegCAMP will also coordinate and oversee all
of the various mapping efforts, ensuring the consistent high quality of
the completed statewide map and data�
CollaborationAlthough the SCV has been identified as the state standard,
VegCAMP recognizes the need for other classification and mapping
methodologies that support the goals of various stakeholders�
VegCAMP is actively translating the SCV methodology to a wide range
of classification systems, and has built a great degree of flexibility into
the dataset� Broader vegetation types as well as crosswalks to other
classification systems are, and can be, built into the data� VegCAMP
acknowledges the advantages of collaboration with other agencies as a
means for reducing costs, increasing efficiency, and leveraging limited
funding� For example, VegCAMP is in discussions with the California
Department of Forestry and Fire Protection (CAL FIRE) to explore a
mechanism for collaboration that considers forestry issues and CAL
FIRE objectives, as well as the numerous other applications for SCV
data that were described in the case studies section� Both agencies
are very interested in pursuing the most efficient and accurate way to
perform regular updates of vegetation data in mountainous, forested
ecosystems in a manner that leverages state funding efficiently and is
useful to all users�
NEXT STEPS
a shared vision for the Survey of California Vegetation
the center for geographical studies
40
MaintenanceOnce the statewide SCV map is complete, periodic update procedures
will need to be established to maintain the currency of the dataset
and to provide the ability to monitor and analyze statewide changes in
vegetation� Discussions with CDFW staff and the SCV user community
indicate that mapped areas may require updates every 10 to 20 years
depending on ecoregion and natural community type, degree of
development, rate and type of ecological change, and other relevant
factors� For certain ecoregions, like much of the desert and higher
mountains, the refresh rate would be reduced to a frequency of no
greater than once every 15 or 20 years, while a few key areas may
require more frequent updates� For example, Suisun Marsh is updated
every three years with funding from DWR�
Additional important features of a sustained SCV program include
outreach, training, revisions to the standards by an update and
review committee, and a centralized clearinghouse for storage and
distribution of data� Once a statewide SCV dataset is produced, map
updates and program maintenance can be conducted at a fraction of
the original mapping cost�
Call for SupportThis paper clearly demonstrates that there is broad demand for high-
quality vegetation mapping� The case studies provide specific examples
of how the use of this data improves organizational efficiency and
decision making in all levels of government, nonprofit organizations,
and the private sector� The number of organizations that have shared
costs with CDFW on mapping projects provides further tangible
evidence of the value of SCV data� In the last seven years, CDFW has
more than doubled its own and Wildlife Conservation Board funds
for the SCV mapping project by securing matching funds from other
state, federal, and local agencies� These agencies valued the fine-scale
vegetation data enough to contribute to the cost of mapping their high-
priority areas�
The benefit–cost analysis shows a very healthy return on investment
for dollars spent� However, it is the intangible value that comes from
improved decision making that is the real payback� The value of
avoiding the costly mitigation of sensitive species that may be necessary
when development sites are chosen using less-precise data is difficult to
quantify, but clearly very high� Species conservation, land use planning,
land acquisition decisions and many other government activities can be
greatly improved by having access to better data� In this light, spending
on high-quality vegetation mapping can be considered an investment in
government efficiency and efficacy, rather than a cost�
The goal is to complete mapping the remaining 58 percent of the state by
2020� In order to realize this goal, continued support from organizations
and agencies that perceive benefits from this endeavor is imperative�
As with any project of this size, funding must be procured in order to
make this vision a reality� We now have the knowledge, experience,
and technology to make such a bold vision possible� The sooner this
important step is taken, the sooner the benefits can start to accrue for
the State of California�
In the last seven years, CDFW has more than doubled its own and Wildlife Conservation Board funds for the SCV mapping project by securing matching funds from other state, federal, and local agencies. These agencies valued the fine-scale vegetation data enough to contribute to the cost of mapping their high-priority areas.
a shared vision for the Survey of California Vegetation 41
the center for geographical studies
Appendix A: Complete Results of Online User SurveyNumber of users surveyed = 48
• 98% of respondents use vegetation geospatial data
• 52% of respondents use SCV datasets, while 46% use other
vegetation geospatial datasets
Note that multiple options could be selected on the following
questions, with the exception of the questions of prioritization�
Respondents Who Use Datasets Other Than SCV:
Twenty-two survey respondents use map datasets other than the SCV�
Fifty-seven percent (57%) work with this data heavily and consistently,
referring to themselves as “power users,” whereas 43% refer to
themselves as casual, occasional users�
There are a variety of map products available for California
vegetation. Of the 22 respondents who use these other products:
• 76% use USFS Calveg
• 62% use USGS GAP land cover
• 48% use Holland
• 43% use CWHR
• 48% use other datasets
The respondents who utilize other datasets use them for the
following purposes:
• 91% – wildlife and plant conservation, endangered species
protection, or conservation planning
• 43% – development, infrastructure, or transportation
• 38% – climate change studies
• 24% – public safety (e�g� fire, backcountry conditions)
• 24% – hydrology assessments
• 10% – education/academics
• 5% – geological purposes
• 5% – agricultural purposes
• 5% – recreation
• 19% – other purposes (environmental assessments and
permitting, vegetation management planning, wildfire
analyses, state mapping projects)
Of the 22 respondents who use other datasets:
• 100% indicate that more comprehensive and finer resolution
vegetation GIS data that follows state standards would be
more useful to their organization
• 91% indicate that higher quality vegetation GIS data would
save them or their organization time
Prioritization of vegetation GIS data characteristics (10 = most
important, 5 = least important):
• Accuracy: 9�29
• Coverage: 9�29
• Vegetation attributes included in the dataset (e�g� percent
cover, tree DBH, presence of rare species): 8�33
• Detailed classification of vegetation: 8�00
• Fine spatial resolution: 7�62
• Data derived from contemporary aerial imagery: 6�94
• Data derived significantly from field reconnaissance: 6�50
• Update/maintenance schedule: 6�43
APPENDICES
a shared vision for the Survey of California Vegetation
the center for geographical studies
42
Additional comments:
• “Easy to use, mobile app for field operations would be great�”
• “[We] would use veg data more frequently and for higher use
(e�g� greater cost/benefit) if it were better quality and higher
resolution� For example, we could use geospatial data to make
automated determinations of the need for field checking if we
had reliable veg data� Project in developed area = no biological
assessment = save $$�”
• “Our area in Northeast California is poorly covered by this data
type [high-resolution]� If better coverage were available, our
usage would be more significant�”
• “Accessibility of plot data is extremely important for my work
and I usually find it difficult to obtain from completed projects
funded by CDFW and CNPS� Names of map entities (alliances
and the like) are 2nd order priorities to me�”
• “The question about me being ‘satisfied’ with other veg data
didn’t seem that relevant� All data have uses, some are
less satisfying than others to use, but when there are no
alternatives I have to use them�”
• “Thanks� I can think of many things, from an applied
conservation research standpoint, to accomplish with this
[SCV] data�”
• “Vegetation mapping is an important part of community
development, mitigation, and preservation� Most local
governments do not have resources ($$) to map vegetation at
fine scales� Additional resources from the state would improve
local decision making greatly�”
Respondents Who Use SCV Datasets:
Twenty-five survey respondents use SCV data� Forty-eight percent
(48%) work with this data frequently and refer to themselves as “power
users,” whereas 52% use the data on an as-needed basis�
SCV datasets are used for many different purposes. Of the 25
respondents who use SCV data:
• 93% use it for wildlife and plant conservation, endangered
species protection, or conservation planning
• 41% use it for development, infrastructure, or transportation
• 37% use it for climate change studies
• 22% use it for education/academics
• 19% use it for agricultural purposes
• 19% use it for hydrology assessments
• 15% use it for public safety (e�g� fire, backcountry conditions)
• 0% use it for geological purposes
• 22% use it for other purposes (connectivity analyses,
developing map services for conservation groups, display/
cartography, FEMA coastal flood hazard studies, regional
planning, identifying impacts due to levee failures)
SCV data improves the success of the users’ organizations/agencies.
The percentage of users citing each dataset advantage is listed
below:
• 85% – facilitates research: makes information more readily
available, current, and reliable
• 58% – ease of accessibility, utilization, and comprehension
• 58% – improves productivity/output
a shared vision for the Survey of California Vegetation 43
the center for geographical studies
• 54% – reliability of results: final product is serviceable and
accurate
• 46% – allows for integration of work/collaboration with other
institutions, agencies, or programs
• 31% – cost-savings
• 27% – facilitates education and training
• 4% – other
• 0% – SCV data does not improve organization’s success
Of the 25 respondents who use SCV data, 89% were satisfied. The
11% who were not satisfied gave the following reasons:
• 67% – does not cover my project’s region/area of interest
• 33% – needs of my project are not accurately contained in the
data
• 33% – other: partially covers project area but needs more
comprehensive coverage
• 0% – hard to interpret/too complicated
Prioritization of vegetation GIS data characteristics (10 = most
important, 5 = least important):
• Accuracy: 8�85
• Coverage: 8�85
• Vegetation attributes included in the dataset (e�g� percent
cover, tree DBH, presence of rare species): 8�70
• Detailed classification of vegetation: 8�54
• Fine spatial resolution: 8�27
• Data derived significantly from field reconnaissance: 7�71
• Data derived from contemporary aerial imagery: 6�40
• Update/maintenance schedule: 6�25
Eighty-five percent (85%) of respondents indicated that there
are certain results they have achieved using SCV data that they
otherwise would not have been able to achieve. Respondent
comments on these results are listed below:
• “Analysis of landscape-scale vegetation pattern for the
Yosemite region”
• “Conservation assessments with high resolution”
• “Desert Renewable Energy Conservation Plan (DRECP)”
• “Seamless standardized data has never existed in the past�”
• “The data was utilized to define areas potentially restorable to
oak woodland in Placer County�”
• “Assessment of regional habitat loss, prioritizing potential
restoration sites”
• “Modeling species distributions in the Mojave Desert”
• “Specific species info”
• “Doing our own field work for veg mapping would be cost-,
time-, and skill-prohibitive, as I work in a fish bio lab�”
• “The presence of a consistent vegetation data layer in areas
where information was previously not available”
• “Info that we used might have been much broader, however using
SCV will allow us to analyze projects on a much finer scale�”
• “Where available, use of more standardized collection protocols
for field data which has a variety of uses (veg assessments for
the San Joaquin River Restoration Program, Delta area, etc�)�”
• “Habitat suitability/quality mapping for endangered riparian
brush rabbit� This work was based primarily on SCV data for
the Delta and Central Valley riparian areas�”
a shared vision for the Survey of California Vegetation
the center for geographical studies
44
• “The finer-scale and more accurate data provided by SCV makes
survey and assessment easier and more fluid�”
• “Yes� I needed to know vegetation type and coverage at a
detailed level� Performing this analysis from aerial imagery
or site visits is time consuming and expensive� SCV is a
vital source of data for some of the analysis that Northwest
Hydraulic Consultants needs to perform�”
• “We looked at different sea level rise scenarios and how land
cover changes may affect wildlife populations�”
• “Results are not actually only achievable using SCV, but
certainly more accurate and fine-scale�”
• “All other detailed veg data is based on raster analytical models and
is significantly less accurate, less precise and less comprehensive�”
Additional comments:
• “While no formal cost-benefit/business case was conducted we
know that some GIS work would have been out of reach (due to
cost) if SCV were not available�”
• “Need ‘one stop shopping’, mosaicked datasets and consistent
resolution data� This type of data keeps all sorts of research
going, which is an economic benefit to the state�”
• “Vegetation data was used in conjunction with soils data provided
by NRCS [Natural Resources Conservation Service]� The work
would not have been possible without both sources of data�”
• “California-style field-based, vector output vegetation/
ecosystem mapping needs to be done for the whole country�
Maybe this is something we’ll lead in just like we led in
environment policy and law�”
Appendix B: Acronyms, Agencies, and Glossary of TermsAcronymsCalveg
Classification and Assessment with Landsat of Visible Ecological
Groupings, a classification system designed by the Pacific Southwest
Region of the U�S� Forest Service to describe and map natural
vegetation in the state� A single statewide map was produced in 1979�
Since then, updates for large areas have been produced to describe the
extent and condition of various land cover types, and the magnitude
and cause of land cover changes�
CEQA
California Environmental Quality Act, a statute that requires state and
local agencies to identify the significant environmental impacts of their
actions and to avoid or mitigate those impacts, if feasible
DRECP
Desert Renewable Energy Conservation Plan, a multi-agency plan with
a goal of providing conservation of desert ecosystems while permitting
development of renewable energy projects in the California deserts
EIR
Environmental Impact Report, a planning document under CEQA that
describes the environmental impacts of a project, determines which
impacts are significant, and describes alternatives to the project and
mitigation measures
a shared vision for the Survey of California Vegetation 45
the center for geographical studies
ESA
Environmentally Sensitive Area, as defined and used by California
Department of Transportation
ESHA
Environmentally Sensitive Habitat Area, as defined under the California
Coastal Act
FRAP
Fire Resource and Assessment Program, a program of the California
Department of Forestry and Fire Protection that assesses the amount
and extent of California’s forests and rangelands, analyzes their
conditions, and identifies alternative management and policy guidelines
GAP
National Gap Analysis Program of the U�S� Geological Survey’s Land
Cover Data Set, version 2� The California Gap land cover mapping project
was completed in December of 2008� The final report can be found here:
http://gap�uidaho�edu/index�php/ca-land-cover�
GIS
Geographic Information System, a system to capture, store, and analyze
spatial information
NEPA
National Environmental Policy Act, a law that requires federal agencies
to consider and disclose the environmental impacts of their proposed
actions and reasonable alternatives to those actions
NVCS
National Vegetation Classification Standard, a set of standards for
classifying existing vegetation cover and its associated information for
the United States (see usnvc�org)
SCV
Survey of California Vegetation, a framework for fine-scale vegetation
classification and digital vegetation map production in California
Agencies and OrganizationsBLM
U�S� Department of Interior Bureau of Land Management
CAL FIRE
California Department of Forestry and Fire Protection
Caltrans
California Department of Transportation
CDFW
California Department of Fish and Wildlife
CEC
California Energy Commission
CNPS
California Native Plant Society
DWR
California Department of Water Resources
USGS
United States Geological Survey
VegCAMP
CDFW’s Vegetation Classification and Mapping Program
a shared vision for the Survey of California Vegetation
the center for geographical studies
46
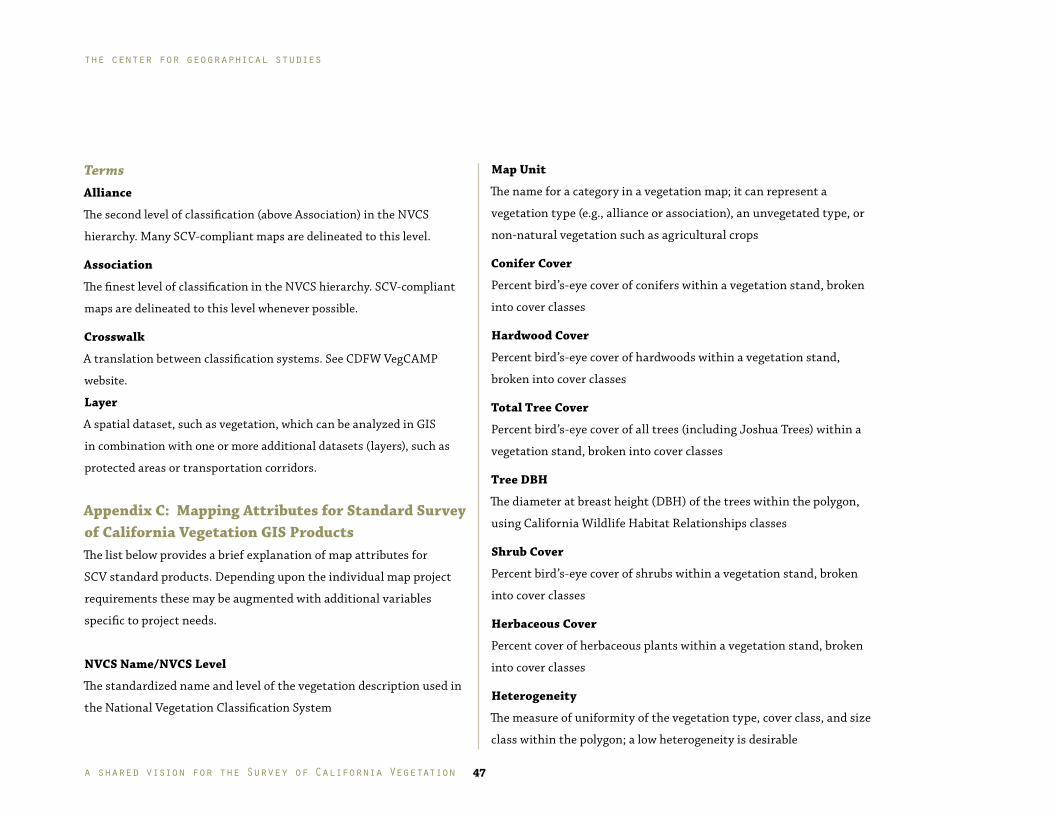
TermsAlliance
The second level of classification (above Association) in the NVCS
hierarchy� Many SCV-compliant maps are delineated to this level�
Association
The finest level of classification in the NVCS hierarchy� SCV-compliant
maps are delineated to this level whenever possible�
Crosswalk
A translation between classification systems� See CDFW VegCAMP
website�
Layer
A spatial dataset, such as vegetation, which can be analyzed in GIS
in combination with one or more additional datasets (layers), such as
protected areas or transportation corridors�
Appendix C: Mapping Attributes for Standard Survey of California Vegetation GIS ProductsThe list below provides a brief explanation of map attributes for
SCV standard products� Depending upon the individual map project
requirements these may be augmented with additional variables
specific to project needs�
NVCS Name/NVCS Level
The standardized name and level of the vegetation description used in
the National Vegetation Classification System
Map Unit
The name for a category in a vegetation map; it can represent a
vegetation type (e�g�, alliance or association), an unvegetated type, or
non-natural vegetation such as agricultural crops
Conifer Cover
Percent bird’s-eye cover of conifers within a vegetation stand, broken
into cover classes
Hardwood Cover
Percent bird’s-eye cover of hardwoods within a vegetation stand,
broken into cover classes
Total Tree Cover
Percent bird’s-eye cover of all trees (including Joshua Trees) within a
vegetation stand, broken into cover classes
Tree DBH
The diameter at breast height (DBH) of the trees within the polygon,
using California Wildlife Habitat Relationships classes
Shrub Cover
Percent bird’s-eye cover of shrubs within a vegetation stand, broken
into cover classes
Herbaceous Cover
Percent cover of herbaceous plants within a vegetation stand, broken
into cover classes
Heterogeneity
The measure of uniformity of the vegetation type, cover class, and size
class within the polygon; a low heterogeneity is desirable
a shared vision for the Survey of California Vegetation 47
the center for geographical studies
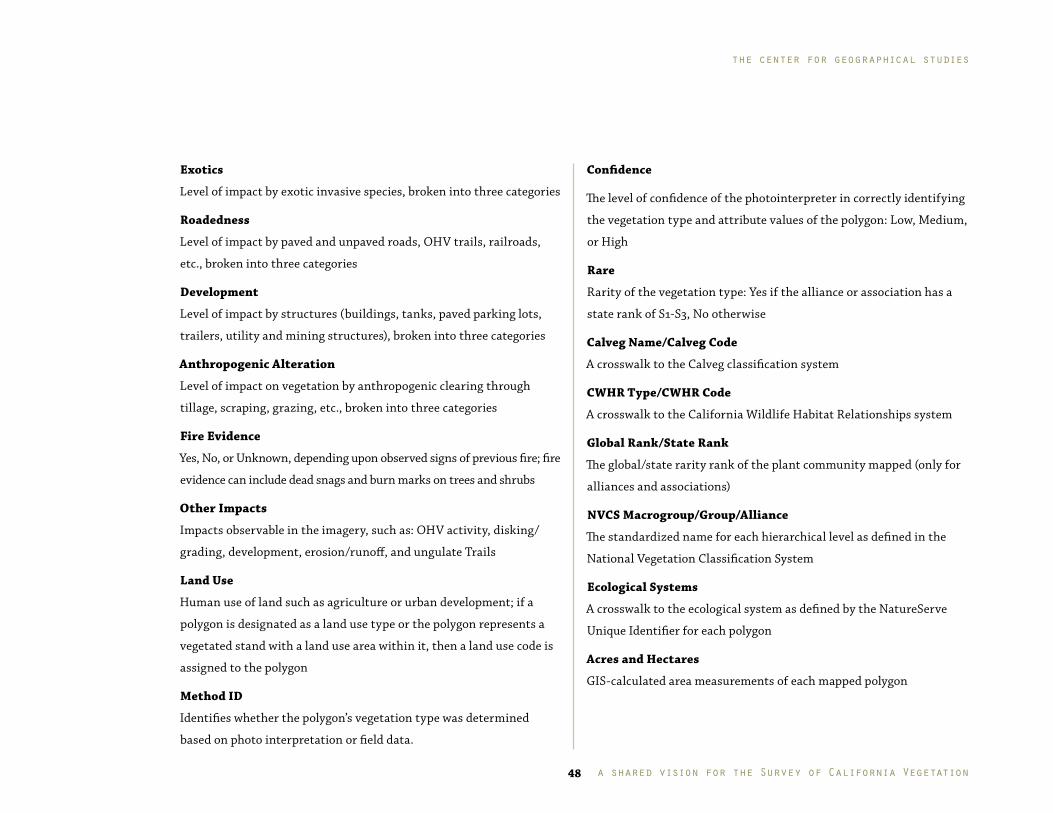
Exotics
Level of impact by exotic invasive species, broken into three categories
Roadedness
Level of impact by paved and unpaved roads, OHV trails, railroads,
etc�, broken into three categories
Development
Level of impact by structures (buildings, tanks, paved parking lots,
trailers, utility and mining structures), broken into three categories
Anthropogenic Alteration
Level of impact on vegetation by anthropogenic clearing through
tillage, scraping, grazing, etc�, broken into three categories
Fire Evidence
Yes, No, or Unknown, depending upon observed signs of previous fire; fire
evidence can include dead snags and burn marks on trees and shrubs
Other Impacts
Impacts observable in the imagery, such as: OHV activity, disking/
grading, development, erosion/runoff, and ungulate Trails
Land Use
Human use of land such as agriculture or urban development; if a
polygon is designated as a land use type or the polygon represents a
vegetated stand with a land use area within it, then a land use code is
assigned to the polygon
Method ID
Identifies whether the polygon’s vegetation type was determined
based on photo interpretation or field data�
Confidence
The level of confidence of the photointerpreter in correctly identifying
the vegetation type and attribute values of the polygon: Low, Medium,
or High
Rare
Rarity of the vegetation type: Yes if the alliance or association has a
state rank of S1-S3, No otherwise
Calveg Name/Calveg Code
A crosswalk to the Calveg classification system
CWHR Type/CWHR Code
A crosswalk to the California Wildlife Habitat Relationships system
Global Rank/State Rank
The global/state rarity rank of the plant community mapped (only for
alliances and associations)
NVCS Macrogroup/Group/Alliance
The standardized name for each hierarchical level as defined in the
National Vegetation Classification System
Ecological Systems
A crosswalk to the ecological system as defined by the NatureServe
Unique Identifier for each polygon
Acres and Hectares
GIS-calculated area measurements of each mapped polygon
a shared vision for the Survey of California Vegetation
the center for geographical studies
48
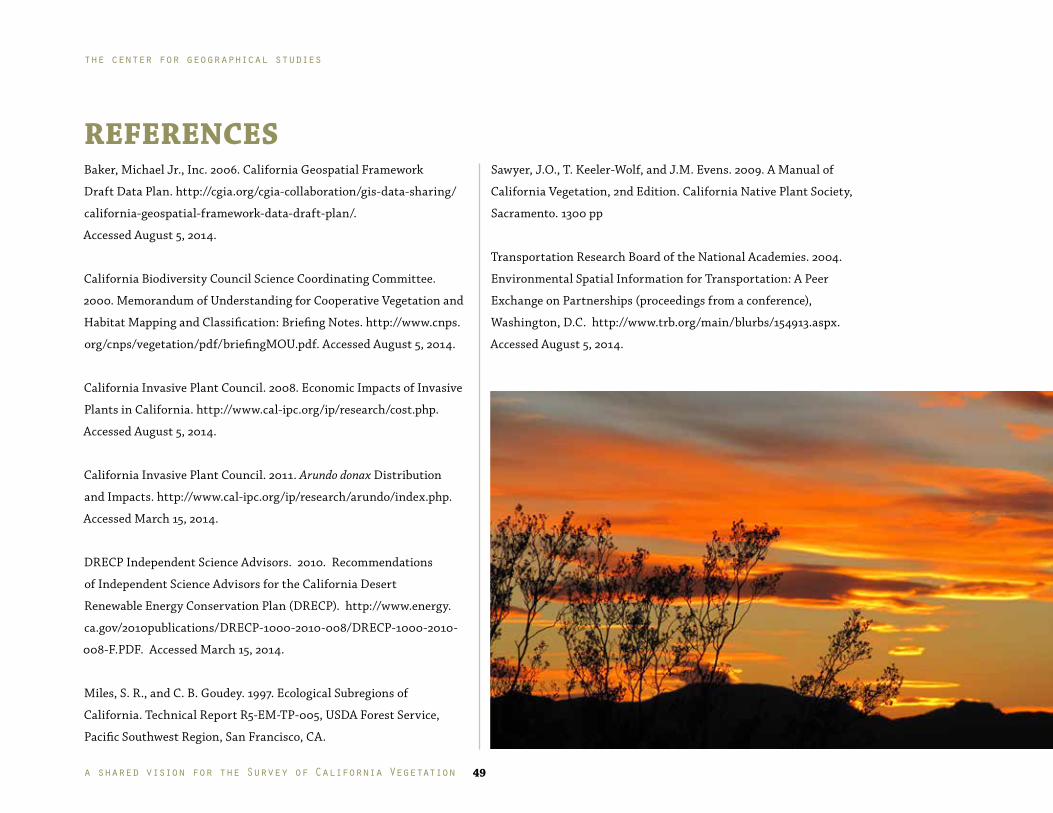
Baker, Michael Jr�, Inc� 2006� California Geospatial Framework
Draft Data Plan� http://cgia�org/cgia-collaboration/gis-data-sharing/
california-geospatial-framework-data-draft-plan/�
Accessed August 5, 2014�
California Biodiversity Council Science Coordinating Committee�
2000� Memorandum of Understanding for Cooperative Vegetation and
Habitat Mapping and Classification: Briefing Notes� http://www�cnps�
org/cnps/vegetation/pdf/briefingMOU�pdf� Accessed August 5, 2014�
California Invasive Plant Council� 2008� Economic Impacts of Invasive
Plants in California� http://www�cal-ipc�org/ip/research/cost�php�
Accessed August 5, 2014�
California Invasive Plant Council� 2011� Arundo donax Distribution
and Impacts� http://www�cal-ipc�org/ip/research/arundo/index�php�
Accessed March 15, 2014�
DRECP Independent Science Advisors� 2010� Recommendations
of Independent Science Advisors for the California Desert
Renewable Energy Conservation Plan (DRECP)� http://www�energy�
ca�gov/2010publications/DRECP-1000-2010-008/DRECP-1000-2010-
008-F�PDF� Accessed March 15, 2014�
Miles, S� R�, and C� B� Goudey� 1997� Ecological Subregions of
California� Technical Report R5-EM-TP-005, USDA Forest Service,
Pacific Southwest Region, San Francisco, CA�
Sawyer, J�O�, T� Keeler-Wolf, and J�M� Evens� 2009� A Manual of
California Vegetation, 2nd Edition� California Native Plant Society,
Sacramento� 1300 pp
Transportation Research Board of the National Academies� 2004�
Environmental Spatial Information for Transportation: A Peer
Exchange on Partnerships (proceedings from a conference),
Washington, D�C� http://www�trb�org/main/blurbs/154913�aspx�
Accessed August 5, 2014�
REFERENCES
a shared vision for the Survey of California Vegetation 49
the center for geographical studies
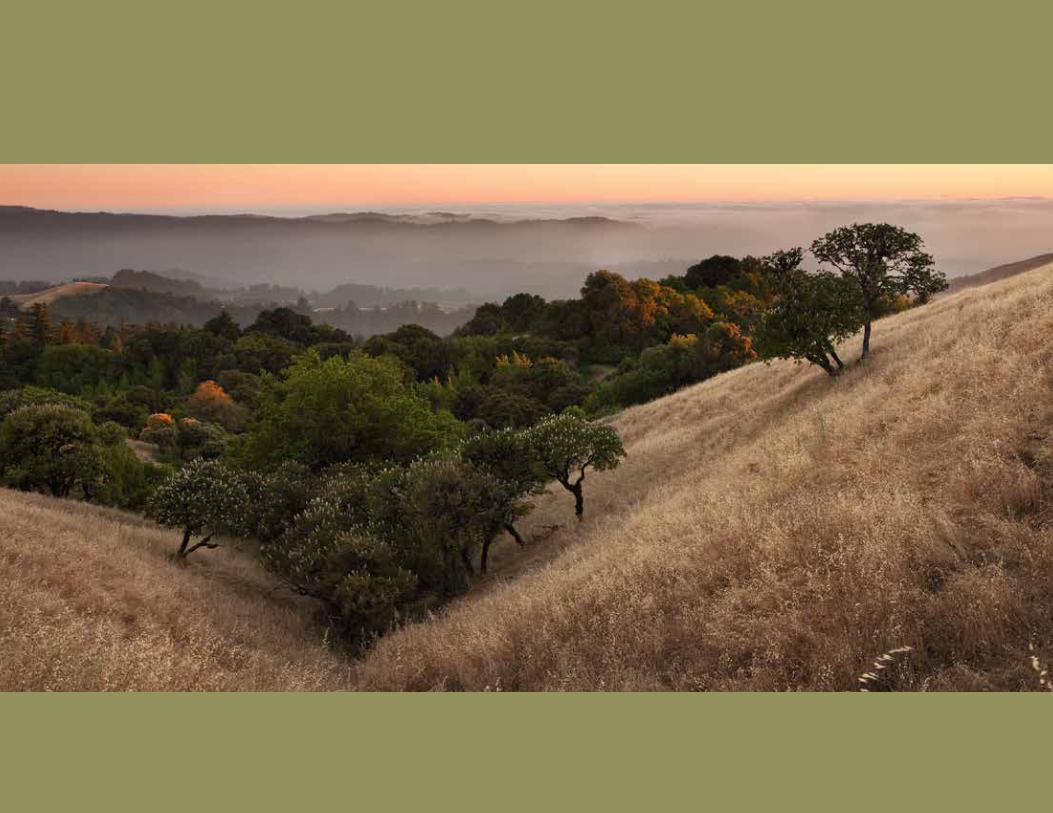
Recommended