
Journal of the Eastern Asia Society for Transportation Studies, Vol.9, 2011
A Study on Motorcycle Rider Characteristic and Behavior in Metro Manila
Francis Aldrine A. UYProfessorSchool of Civil Engineering and Environmental and Sanitary EngineeringMapua Institute of Technology2nd Flr. South Building Mapua Institute of Technology, Muralla Street, Intramuros, Manila, PhilippinesFax: +63-2-527-8456E-mail: [email protected]
Jose Regin F. REGIDORAssociate ProfessorInstitute of Civil EngineeringCollege of EngineeringUniversity of the Philippines, Diliman, Quezon City, PhilippinesFax: +63-2-929-0495E-mail: [email protected]
Abstract: This study presents essential information on motorcycle rider characteristic and behavior resulting from the questionnaire survey for riders and non-riders that was conducted along the top 5 roads in Metro Manila with the most number of recorded motorcycle road crashes in the past 5 years. The questionnaire has eight (8) sections that focus on rider’s
personal details, driving experience and training, riding habit, opinion on road safety, road crash experience, motorcycle preference and anger and aggression test. The results of the rider and non-rider survey were analyzed to yield significant variables influencing motorcycle road crash experience and frequency. A total of 2,000 motorcycle rider participated in the survey and a total of 600 other road users.
Key Words: motorcycle, road crash, behavior, characteristic
1. MOTORCYCLE ROAD CRASHES IN METRO MANILA
The continuous increase in fuel cost and worsening effect of road congestion has influenced the increase in motorcycle registration. The result of this rapid mode shift is the alarming frequency of motorcycle road crashes. Fig 1 presents the trends in gasoline price, motorcycle registration and road crash count.
Figure 1 Trends in motorcycle registration, road crash and gasoline price
In 2007, a study on the impact of the increasing number of motorcycle in Metro Manila was completed by the researcher, Uy et al. (2007). Incidence of motorcycle road crashes based on severity, road type, time, weather condition, collision type, junction type, traffic control, road crash factors and classification of people involved were presented. The study concluded that
1458

Journal of the Eastern Asia Society for Transportation Studies, Vol.9, 2011
there is a rapid increase in motorcycle registration and as a result significant increase in
motorcycle road crashes was reported. The average road crash rate per 10,000 vehicles from
2002 to 2005 was reported to double each year. The increase on motorcycle registration was
reported to be 57% each year. The city with most number of motorcycle road crashes was
Quezon City. The top three roads with the most number of motorcycle road crashes were Real
Street, EDSA and Commonwealth Avenue. In most cases, about 56%, the motorcycle rider is
injured and only 1.5% case when riders are killed. About 20.2% cases reported involved killed
pedestrian. The top human factor that caused road crash was too fast driving followed by
inattentiveness and being too close to other vehicles. Majority of the road crashes happened
along major roads at night time. Motorcycle road crashes frequently happen along straight
roads and at no junction control. The most frequent collision type was side swipe and this is
consistent to too fast riding, inattentiveness and being too close to other vehicles on the road.
In Table 1 below, the statistics on motorcycle registration and crash is related to the total
population of people in Metro Manila from 2002 to 2009.
Table 1 Population, motorcycle registration and crash statistics in Metro Manila
The total motorcycle road crash recorded in Metro Manila Accident Reporting and Analysis
System (MMARAS) from 2005 to 2009 is about 55,169.00. There were about 512 fatal,
27,059 non-fatal and 27,598 damage only road crash type based on severity. A crash is
classified as fatal when there is at least one casualty who died due to the crash. Crash where
there are casualties that are slightly or seriously injured and no death is classified as non-fatal
crash. Road crashes that resulted only to vehicle or road facility or structure damage is
classifies as damage only to property crash. Quezon City has the highest recorded motorcycle
road crash at 14,368 followed by Marikina at 4,525 and Pasig City at 4,465. In terms of
severity most motorcycle road crashes are classified as non fatal and damage only. In Quezon
City there is almost equal number of damage only and non fatal road crashes at 6,315 and
7,904 respectively. The numbers of damage only and non fatal road crashes in most cities are
almost equal. It can be noted that average fatal road crash in each city is about 0.88% of the
sum of damage only and non fatal road crash. Fatal road crashes can also be noted to be
approximately 2% of damage only or non fatal road crashes. MMARAS records confirmed
that motorcycle road crashes mostly involve cars. Car road crash has the most recorded road
1459

Journal of the Eastern Asia Society for Transportation Studies, Vol.9, 2011
crash of the total cases in the last five years. The top road crash factor identified as caused of
road crash is too fast driving. Inattentiveness and bad overtaking are other major road crash
factors that can be related to training and experience of the rider. Motorycles also are
frequently involved in road crashes because of too close manuever through other road user.
Motorycle riders can usually go through between other vehicles and this increase the risk of
road crash involvement. The third top factor is bad turning. The total estimated cost of
motorcycle related road crash in Metro Manila from 2005 to 2009 is estimated to have reached
12.15 Billion Pesos. There has been extensive research effort devoted to improve motorcycle
safety considering the vehicle and traffic flow but the relationship between rider characteristic,
behavior and crash is still not well understood. It is the objective of this study to present a
comprehensive report on motorcycle rider characteristic and behavior and analyze significant
variables influencing road crash experience and frequency.
2. METHODOLOGY
The questionnaire survey was conducted at motorcycle parking areas and gasoline stations
along the top 5 roads with the most number of motorcycle road crashes namely
Commonwealth Avenue, Alabang-Zapote Road, EDSA, Quirino Highway and J.P. Rizal Street.
The survey was conducted between June to November 2010.
Figure 2 Location of top 5 roads with most number of motorcycle road crashes
Table 2 Sample size along each top 5 roads
Rank Road Required
Respondents
Adjusted No.
of
Respondents
(+5%)
Motorcycle
AADT
1st Commonwealth
Avenue 381 400 25,593
2nd Alabang –
Zapote Road 381 400 7,880 (obs.)
3rd EDSA 381 400 35,091
4th Quirino Highway 381 400 14,832 (obs.)
5th J.P. Rizal Street
(Marikina) 381 400 6,368 (obs.)
TOTAL 2000
The location of these roads is shown in Fig 2. The questionnaire has eight (8) sections that
focus on rider’s personal details, driving experience and training, riding habit, opinion on road
1460

Journal of the Eastern Asia Society for Transportation Studies, Vol.9, 2011
safety, road crash experience, motorcycle preference and anger and aggression test. The rider
questionnaire survey was conducted at commercial establishment motorcycle parking spaces
and gasoline’s stations along the top 5 roads. The results of the questionnaire survey were
analyzed to generate and present pertinent information on rider characteristics and behavior of
motorcycle riders. Furthermore, analysis on the significance of variables influencing motorcycle
road crash experience, frequency and severity was undertaken. The non-rider questionnaire
survey was conducted for pedestrians or commuters, car, bus, taxi and jeepney drivers. A total
of 2,000 respondents participated for the rider questionnaire survey and 600 respondents for
non-rider. The acquired information from the accomplished survey forms was encoded in a
spreadsheet to generate a tally sheet where descriptive statistics and significant variables were
derived and analyzed.
3. MOTORYCLE RIDER QUESTIONNAIRE SURVEY RESULT
3.1 Personal Details of Motorcycle Riders
Out of the 2,000 respondents 91% were male and 9% were female. The age distribution of the
respondents is shown in Fig 4. Majority of the respondents are within the age range of 21 to 35
years old (73%). The average age of the respondents is 30 years old. It can also be noted that
there is about 1% of respondents who are below 18 years old.
Pie Chart of Gender
MC Master Database-Statistica 201v*2001c
Gender
Female, 9%
Male, 91%
Female, 9%
Male, 91%
Histogram of Rider's Age
MC Master Database-Statistica 201v*2001c
0% 0%
6%
23%
28%
22%
10%
7%
2%1%
1% 1%
-5 0 5 10 15 20 25 30 35 40 45 50 55 60 65 70 75
Rider's Age
0
100
200
300
400
500
600
No o
f obs
0% 0%
6%
23%
28%
22%
10%
7%
2%1%
1% 1%
Figure 3 Respondents based on gender Figure 4 Age distribution of respondents
In Fig 5 it is shown that most of the respondent went to college (60%) and this was followed
by high school (35%). On livelihood in Fig 6, majority of the riders are employed (74%) with
an average monthly income of PHP 15,530. Histogram of Education Level
35%
60%
3%1% 0%
High School College Masteral Elementary Doctoral
Education Level
0
200
400
600
800
1000
1200
1400
No o
f obs
35%
60%
3%1% 0%
Histogram of Livelihood
74%
19%
7%
Employed Self-Employed Others
Livelihood
0
200
400
600
800
1000
1200
1400
1600
No o
f obs
74%
19%
7%
Figure 5 Respondents level of education Figure 6 Respondents livelihood
1461

Journal of the Eastern Asia Society for Transportation Studies, Vol.9, 2011
Rider’s income and experience is presented in Fig 7 and 8. Majority of the respondent’s
monthly income is between PHP 8,000 to 15,000. Most of the respondents have only one
motorcycle. Majority of the respondents have 3 to 5 years experience in riding.
Histogram of Monthly Income
38%
46%
10%
3%
1% 0% 0% 0% 0% 0% 1%
0 10000 20000 30000 40000 50000 60000 70000 80000 90000 1E5
Monthly Income in Pesos
0
100
200
300
400
500
600
700
800
900
1000
No o
f obs
38%
46%
10%
3%
1% 0% 0% 0% 0% 0% 1%
Histogram of Riding Years Experience
63%
27%
5%3%
1% 1% 0% 0% 0%
5 10 15 20 25 30 35 40 45 50
Riding Years Experience
0
200
400
600
800
1000
1200
1400
No o
f obs
63%
27%
5%3%
1% 1% 0% 0% 0%
Figure 7 Respondents monthly income Figure 8 Respondents riding experience
The type of motorcycle mostly used by the respondents is a learner motorcycle (125cc or
below) at 61% followed by Scooters at 24%. In terms of the make, it is mostly Honda (41%)
and was purchased between years 2006 to 2010. The engine size is mostly 110cc and the
odometer reading is mostly below 20,000 km. Histogram of MC Type
61%
3%
24%
4%5%
1% 1% 1% 0%
Learner
Commuter
Scooter
Trike
Sports
Others
Touring
Custom
Offroad
MC Type
0
200
400
600
800
1000
1200
1400
No o
f obs
61%
3%
24%
4%5%
1% 1% 1% 0%
Histogram of Engine Size (cc)
95%
4%1%
0 150 300
Engine Size (cc)
0
200
400
600
800
1000
1200
1400
1600
1800
2000
No o
f obs
95%
4%1%
Figure 9 Motorcycle type distribution Figure 10 Motorcycle engine size
Histogram of MC Make
0%0%0% 0% 0%0%
41%
7%
4%
0% 0%
3%
8%
0%1% 0%0%
18%
1% 0%0% 1%
16%
0%
110 R
US
I
AS
IA S
TA
R
BLA
ZE
BR
AV
O
BR
FA
VO
FU
RY
HO
ND
A
KA
WA
SA
KI
KA
WA
ZA
KI
KE
MC
O
ME
C
MO
TO
RS
TA
R
OT
HE
RS
RA
LA
L
RU
SI
SH
OG
UN
R
SK
Y60
SU
ZU
KI
SY
M
X1 Y
AM
AH
A
XR
M
XY
M
YA
MA
HA
YU
RO
X
MC Make
0
100
200
300
400
500
600
700
800
900
No o
f obs
0%0%0% 0% 0%0%
41%
7%
4%
0% 0%
3%
8%
0%1% 0%0%
18%
1% 0%0% 1%
16%
0%
Histogram of Odometer Rdg.
33%
23%
11%
9%
4%
2%1% 1% 1%
0%
13%
0 10000 20000 30000 40000 50000 60000 70000 80000 90000 1E5
Odometer Rdg.
0
100
200
300
400
500
600
700
No o
f obs
33%
23%
11%
9%
4%
2%1% 1% 1%
0%
13%
Figure 11 Motorcycle make distribution Figure 12 Motorcycle odometer reading
1 USD = 43.58 PHP
1462
Journal of the Eastern Asia Society for Transportation Studies, Vol.9, 2011
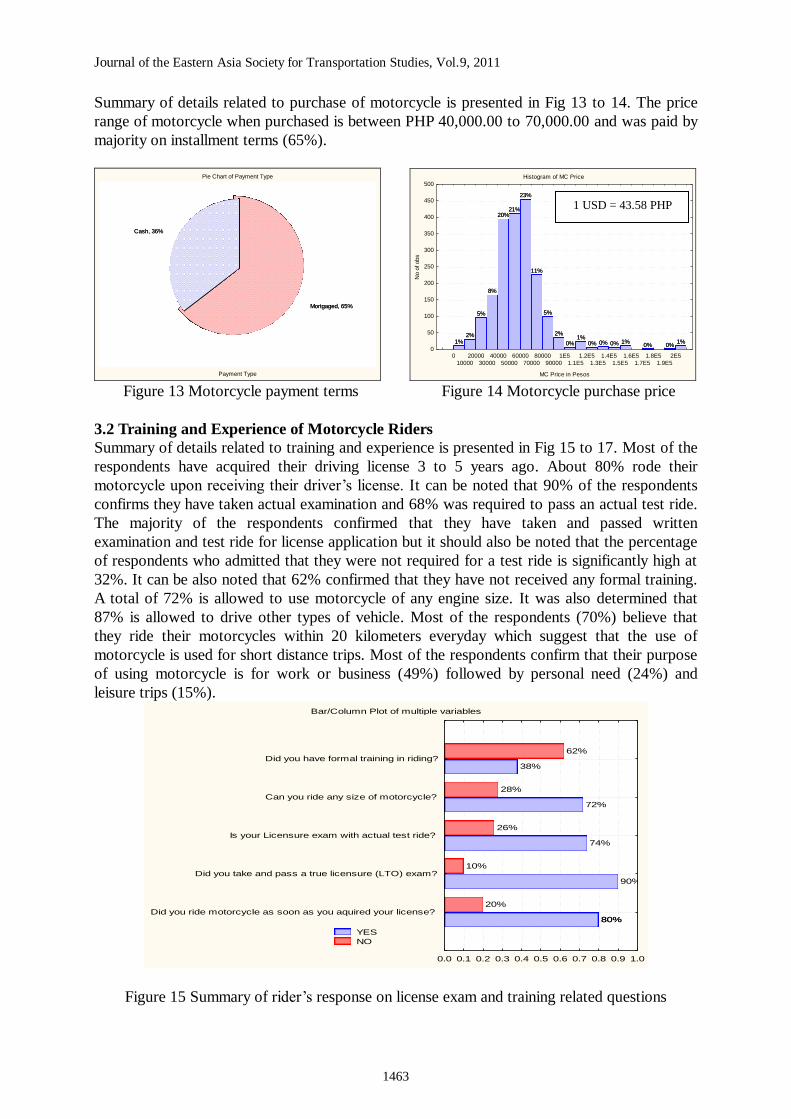
Summary of details related to purchase of motorcycle is presented in Fig 13 to 14. The price
range of motorcycle when purchased is between PHP 40,000.00 to 70,000.00 and was paid by
majority on installment terms (65%).
Pie Chart of Payment Type
Payment Type
Cash, 36%
Mortgaged, 65%
Cash, 36%
Mortgaged, 65%
Histogram of MC Price
1%2%
5%
8%
20%21%
23%
11%
5%
2%
0%1%
0% 0% 0% 1%0% 0%
1%
0
10000
20000
30000
40000
50000
60000
70000
80000
90000
1E5
1.1E5
1.2E5
1.3E5
1.4E5
1.5E5
1.6E5
1.7E5
1.8E5
1.9E5
2E5
MC Price in Pesos
0
50
100
150
200
250
300
350
400
450
500
No o
f obs
1%2%
5%
8%
20%21%
23%
11%
5%
2%
0%1%
0% 0% 0% 1%0% 0%
1%
Figure 13 Motorcycle payment terms Figure 14 Motorcycle purchase price
3.2 Training and Experience of Motorcycle Riders
Summary of details related to training and experience is presented in Fig 15 to 17. Most of the
respondents have acquired their driving license 3 to 5 years ago. About 80% rode their
motorcycle upon receiving their driver’s license. It can be noted that 90% of the respondents
confirms they have taken actual examination and 68% was required to pass an actual test ride.
The majority of the respondents confirmed that they have taken and passed written
examination and test ride for license application but it should also be noted that the percentage
of respondents who admitted that they were not required for a test ride is significantly high at
32%. It can be also noted that 62% confirmed that they have not received any formal training.
A total of 72% is allowed to use motorcycle of any engine size. It was also determined that
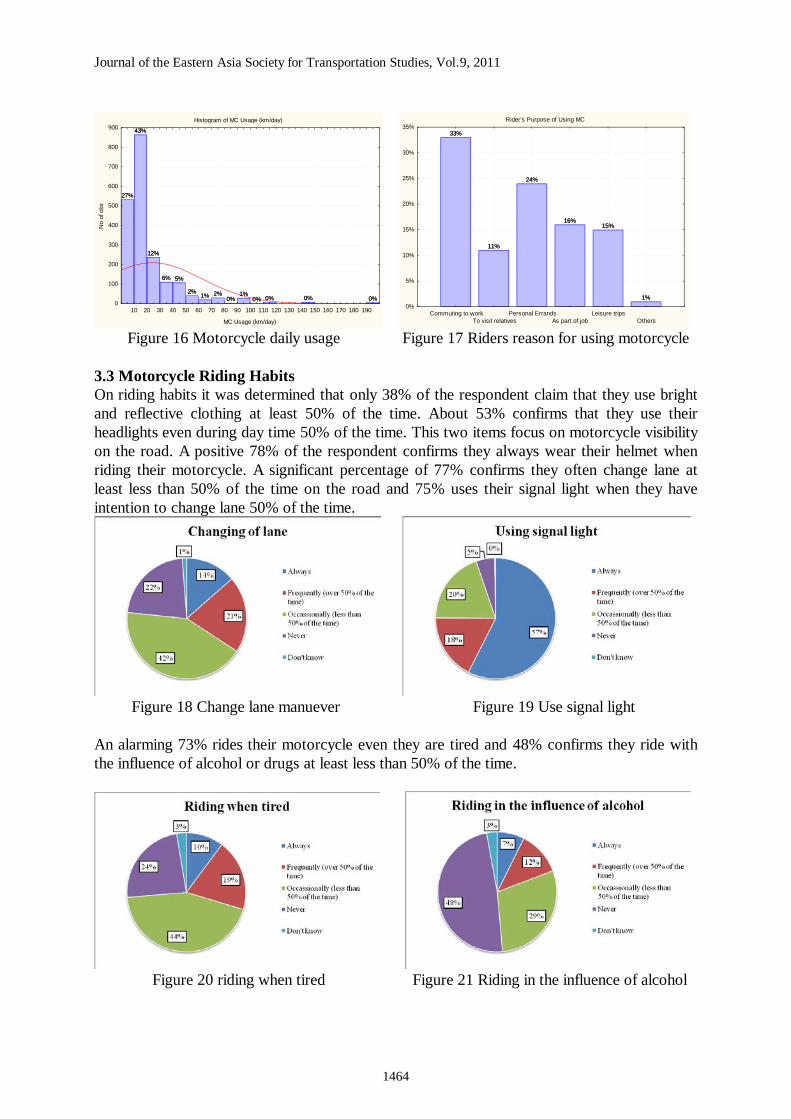
87% is allowed to drive other types of vehicle. Most of the respondents (70%) believe that
they ride their motorcycles within 20 kilometers everyday which suggest that the use of
motorcycle is used for short distance trips. Most of the respondents confirm that their purpose
of using motorcycle is for work or business (49%) followed by personal need (24%) and
leisure trips (15%). Bar/Column Plot of multiple variables
80%
90%
74%
72%
38%
20%
10%
26%
28%
62%
0.0 0.1 0.2 0.3 0.4 0.5 0.6 0.7 0.8 0.9 1.0
Did you ride motorcycle as soon as you aquired your license?
Did you take and pass a true licensure (LTO) exam?
Is your Licensure exam with actual test ride?
Can you ride any size of motorcycle?
Did you have formal training in riding?
80%
YES
NO
Figure 15 Summary of rider’s response on license exam and training related questions
1 USD = 43.58 PHP
1463
Journal of the Eastern Asia Society for Transportation Studies, Vol.9, 2011
Histogram of MC Usage (km/day)
27%
43%
12%
6% 5%
2%1% 2%
0%1%
0% 0% 0% 0%0%
10 20 30 40 50 60 70 80 90 100 110 120 130 140 150 160 170 180 190
MC Usage (km/day)
0
100
200
300
400
500
600
700
800
900
No o
f obs
27%
43%
12%
6% 5%
2%1% 2%
0%1%
0% 0% 0% 0%
Rider's Purpose of Using MC
33%
11%
24%
16%15%
1%
Commuting to work
To visit relatives
Personal Errands
As part of job
Leisure trips
Others
0%
5%
10%
15%
20%
25%
30%
35%33%
11%
24%
16%15%
1%
Figure 16 Motorcycle daily usage Figure 17 Riders reason for using motorcycle
3.3 Motorcycle Riding Habits On riding habits it was determined that only 38% of the respondent claim that they use bright and reflective clothing at least 50% of the time. About 53% confirms that they use their headlights even during day time 50% of the time. This two items focus on motorcycle visibility on the road. A positive 78% of the respondent confirms they always wear their helmet when riding their motorcycle. A significant percentage of 77% confirms they often change lane at least less than 50% of the time on the road and 75% uses their signal light when they have intention to change lane 50% of the time.
Figure 18 Change lane manuever Figure 19 Use signal light
An alarming 73% rides their motorcycle even they are tired and 48% confirms they ride with the influence of alcohol or drugs at least less than 50% of the time.
Figure 20 riding when tired Figure 21 Riding in the influence of alcohol
1464

Journal of the Eastern Asia Society for Transportation Studies, Vol.9, 2011
About 73.80% of the respondents usually go through small spaces between other vehicles on the road and 62% misjudge the speed needed to negotiate bends in the road. 52% overtakes other vehicle on the road that is over the allowed speed limit and usually (71.32%) overtake more than two vehicles.
3.4 Opinion on Road Safety The top 3 most important safety measures for motorcyclist are regular maintenance (15.60%), wearing of helmet and other protection (15.48%) and no riding when in the influence of alcohol (15.37%). The top 3 least important safety measures for motorcyclist are driving when tired (16.12%), prohibit motorcycle along major roads (14.40%) and exclusive lanes for motorcycle (13.91%). On the question of the most likely category of road user to cause road crash with motorcycle rider’s a surprising 44.63% believes it’s also motorcycle riders this was
followed by bus or truck (28.60%) and cars (14.03%). The perceived most frequent road crash type is bad overtaking (31.91%) followed by side-swipe (18.65%) and misjudging bends (13.68%). Majority of the respondent’s (97.67%) use motorcycle helmet. The most frequent helmet colors used are black (33.45%), red (23.88%) and blue (21.75%). Majority of respondents helmet cost between 500 to 1,500 Pesos (52.26%) and 72.89% of the respondents stated that they were offered by the motorcycle supplier a helmet. Majority of the respondents (76%) believes they use standard and good quality helmets. About 24% of the respondents admit they do not use standard helmet and most of them confirms that the cost of helmet is the main reason for this.
3.5 Road crash Experience As shown in Fig 22, a surprising 29% of the respondents admit they have experience motorcycle road crash. In terms of severity there are about 6% fatal, 49% non fatal and 45%damage only. Majority happened at night time but there is only small difference in count and can be considered statistically even.
Accident Experience
YES
NO
29%
71%
0.0
0.1
0.2
0.3
0.4
0.5
0.6
0.7
0.8
29%
71%
Figure 22 Percentage with accident experience Figure 23 Accident based on severity
The weather condition during the accident was usually rainy (46%) and sunny (44%). The location and junction type was frequently at straight sections (52.39%) and intersections (31.39%). Top 3 cause of collision are alone and no collision (45.40%), fallen back rider or things (18.42%) and side-swipe (7.28%). Top 3 human factors that cause road crash are too fast riding (18.81%), out of control (8.65%) and too close riding (8.35%).
3.6 Anger and Aggression Test The anger examination was made using the Deffenbacher Driving Anger Scale (Deffenbacher et al., 1994). The respondents were instructed to imagine that each of the enumerated situations described in the survey instrument was actually happening to them and they were required to rate the amount of anger that would be provoked. The anger assessment tool makes use of a 5
1465

Journal of the Eastern Asia Society for Transportation Studies, Vol.9, 2011
point scale. To determine the anger score, the sum the ratings for the 14 road situations stated
in the survey questionnaire was computed. The highest possible score is 70 points. The
summary of the result is presented in Fig 24 below. The aggression examination was made
using the Aggression Questionnaire of Buss & Perry (1992). Using a 5 point scale, the
respondents were required to indicate how uncharacteristic or characteristic each of the
enumerated statements is describing them. The Aggression scale consists of 4 factors, Physical
Aggression (PA), Verbal Aggression (VA), Anger (A) and Hostility (H). The total score for
Aggression is the sum of the factor scores. The highest possible score is 135 points. The
summary of result is presented in Figure 25 below. One of the aims of the research is to
compare the anger and aggression score of motorcycle riders with other road users. The
summary of results are shown if Fig 24 and 25. It can be noted that using the anger scale test,
results showed that other road users except bus drivers has higher anger score than motorcycle
riders. These results would suggest that given a situation on the road, the other road users will
feel and express anger more rapidly than motorcycle riders. In terms of agression, motorycle
riders average total score is the lowest among considered road users. This result would suggest
that motorcycle riders are exposed to more aggressive road users. The aggression test results
would somehow provide us information on determining the most possible initiator of a road
crash. Bar/Column Plot of Anger Score
Anger Score
41%
41%
38%
31%
37%
33%
0% 5% 10% 15% 20% 25% 30% 35% 40% 45%
Car
Jeepney
Taxi
Bus
Pedestrian
MC Rider (Ave.)
Figure 24 Average score for Driving Anger Scale for all respondents
Bar/Column Plot of Aggression Score
Aggression Score
55%
53%
55%
53%
61%
52%
0% 10% 20% 30% 40% 50% 60% 70%
Car
Jeepney
Taxi
Bus
Pedestrian
MC Rider (Ave.)
Figure 25 Average score for aggression test for all respondents
1466

Journal of the Eastern Asia Society for Transportation Studies, Vol.9, 2011
4. RIDER CHARACTERISTIC AND BEHAVIOR INFLUENCING MOTORCYCLE
ROAD CRASH EXPERIENCE AND FREQUENCY
4.1 Significant Variables Influencing Rider Road Crash Experience
Using the result of the motorcycle rider questionnaire survey the incidence of road crash
experience based on rider characteristic and behaviour was analyzed. Variables derived from
the result of the survey were screened to eliminate insignificant factors. T-test revealed
significant difference in the mean of rider’s age with and without road crash experience. This
suggests that younger riders at age 22 to 37 experience road crash. Figure 26 presents the
histogram of rider’s age and relevant statistical results. Histogram of multiple variables
MC Riders Profile (with vs without crash exp) 94v*1458c
Rider's Age = 1453*5*normal(x, 30.8032, 8.2639)
Rider's Age (w/crash exp) = 547*5*normal(x, 29.4461, 7.5829)
Rider's Age: D = 0.106, p < 0.0100, Lilliefors-p < 0.01;
N = 1453, Mean = 30.8032, StdDv = 8.2639, Max = 64, Min = 3;
SW-W = 0.9489, p = 0.0000
Rider's Age (w/crash exp): D = 0.0813, p < 0.0100, Lilliefors-p < 0.01;
N = 547, Mean = 29.4461, StdDv = 7.5829, Max = 65, Min = 17;
SW-W = 0.9242, p = 0.0000
Rider's Age
Rider's Age (w/crash exp)-5 0 5 10 15 20 25 30 35 40 45 50 55 60 65 70 75
0
50
100
150
200
250
300
350
400
450
No o
f obs
Figure 26 Histogram of rider’s age (with and without crash experience) Histogram of multiple variables
MC Riders Profile (with vs without crash exp) 94v*1458c
Riding Yrs. = 1453*5*expon(x, 0.1804)
Riding Yrs. (w/crash exp) = 547*5*expon(x, 0.1636)
Riding Yrs.: N = 1453, Mean = 5.5437, StdDv = 4.9817, Max = 42, Min = 0.083
Riding Yrs. (w/crash exp): N = 547, Mean = 6.1106, StdDv = 5.6275, Max = 40, Min = 0.417
Riding Yrs.
Riding Yrs. (w/crash exp)-5 0 5 10 15 20 25 30 35 40 45 50
0
200
400
600
800
1000
1200
1400
No o
f obs
Figure 27 Histogram of rider’s experience (with and without crash experience)
The observation on the age range of riders with crash experienced is confirmed by the
MMARAS record. Out of almost ten thousand cases wherein the investigator was able to
include the age of riders involved in the crash the age range of 22 to 37 is confirmed. T-test
result presented confirmed that there is no significant difference between the mean of the
rider’s age with crash experience from the questionnaire survey result and MMARAS age data.
Figure 27 presents the histogram of rider’s experience in years. The mean of experience in
1467
Journal of the Eastern Asia Society for Transportation Studies, Vol.9, 2011
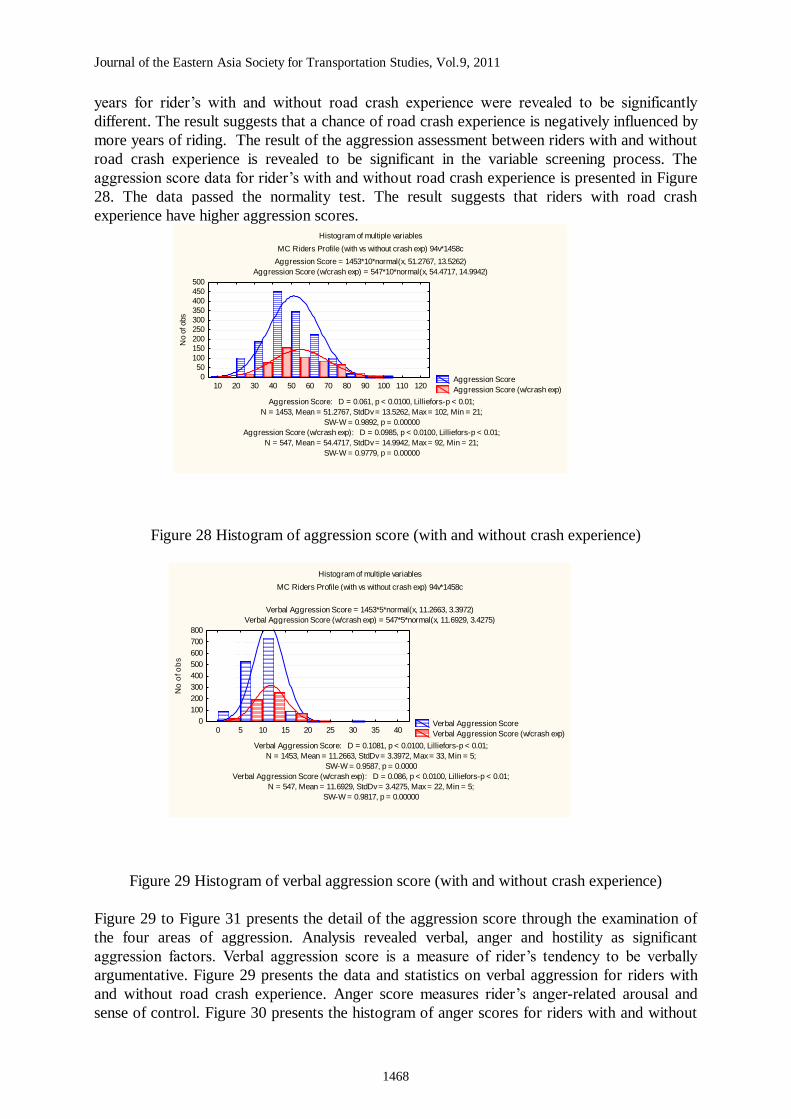
years for rider’s with and without road crash experience were revealed to be significantly
different. The result suggests that a chance of road crash experience is negatively influenced by
more years of riding. The result of the aggression assessment between riders with and without
road crash experience is revealed to be significant in the variable screening process. The
aggression score data for rider’s with and without road crash experience is presented in Figure
28. The data passed the normality test. The result suggests that riders with road crash
experience have higher aggression scores. Histogram of multiple variables
MC Riders Profile (with vs without crash exp) 94v*1458c
Aggression Score = 1453*10*normal(x, 51.2767, 13.5262)
Aggression Score (w/crash exp) = 547*10*normal(x, 54.4717, 14.9942)
Aggression Score: D = 0.061, p < 0.0100, Lilliefors-p < 0.01;
N = 1453, Mean = 51.2767, StdDv = 13.5262, Max = 102, Min = 21;
SW-W = 0.9892, p = 0.00000
Aggression Score (w/crash exp): D = 0.0985, p < 0.0100, Lilliefors-p < 0.01;
N = 547, Mean = 54.4717, StdDv = 14.9942, Max = 92, Min = 21;
SW-W = 0.9779, p = 0.00000
Aggression Score
Aggression Score (w/crash exp)10 20 30 40 50 60 70 80 90 100 110 120
0
50
100
150
200
250
300
350
400
450
500
No o
f obs
Figure 28 Histogram of aggression score (with and without crash experience)
Histogram of multiple variables
MC Riders Profile (with vs without crash exp) 94v*1458c
Verbal Aggression Score = 1453*5*normal(x, 11.2663, 3.3972)
Verbal Aggression Score (w/crash exp) = 547*5*normal(x, 11.6929, 3.4275)
Verbal Aggression Score: D = 0.1081, p < 0.0100, Lilliefors-p < 0.01;
N = 1453, Mean = 11.2663, StdDv = 3.3972, Max = 33, Min = 5;
SW-W = 0.9587, p = 0.0000
Verbal Aggression Score (w/crash exp): D = 0.086, p < 0.0100, Lilliefors-p < 0.01;
N = 547, Mean = 11.6929, StdDv = 3.4275, Max = 22, Min = 5;
SW-W = 0.9817, p = 0.00000
Verbal Aggression Score
Verbal Aggression Score (w/crash exp)0 5 10 15 20 25 30 35 400
100
200
300
400
500
600
700
800
No
of o
bs
Figure 29 Histogram of verbal aggression score (with and without crash experience)
Figure 29 to Figure 31 presents the detail of the aggression score through the examination of
the four areas of aggression. Analysis revealed verbal, anger and hostility as significant
aggression factors. Verbal aggression score is a measure of rider’s tendency to be verbally
argumentative. Figure 29 presents the data and statistics on verbal aggression for riders with
and without road crash experience. Anger score measures rider’s anger-related arousal and
sense of control. Figure 30 presents the histogram of anger scores for riders with and without
1468

Journal of the Eastern Asia Society for Transportation Studies, Vol.9, 2011
crash experience. There is approximately one point difference between the means. Hostility
score is a measure of rider’s feelings of resentment, suspicion and alienation. These feelings
seriously undermine physical and psychological health. Figure 31 presents the histogram of
hostility scores for riders with and without road crash experience. There is an observed 2 point
difference between the means. Histogram of multiple variables
MC Riders Profile (with vs without crash exp) 94v*1458c
Anger Score = 1453*2*normal(x, 9.3021, 3.8977)
Anger Score (w/crash exp) = 547*2*normal(x, 9.8501, 4.3521)
Anger Score: D = 0.0897, p < 0.0100, Lilliefors-p < 0.01;
N = 1453, Mean = 9.3021, StdDv = 3.8977, Max = 23, Min = 1;
SW-W = 0.9847, p = 0.0000
Anger Score (w/crash exp): D = 0.1078, p < 0.0100, Lilliefors-p < 0.01;
N = 547, Mean = 9.8501, StdDv = 4.3521, Max = 25, Min = 1;
SW-W = 0.9728, p = 0.00000
Anger Score
Anger Score (w/crash exp)-2 0 2 4 6 8 10 12 14 16 18 20 22 24 26 28
0
50
100
150
200
250
300
350
400
No o
f obs
Figure 30 Histogram of anger aggression score (with and without crash experience)
Histogram of multiple variables
MC Riders Profile (with vs without crash exp) 94v*1458c
Hostility Score = 1453*5*normal(x, 16.0977, 4.9568)
Hostility Score (w/crash exp) = 547*5*normal(x, 18.1079, 5.1428)
Hostility Score: D = 0.0948, p < 0.0100, Lilliefors-p < 0.01;
N = 1453, Mean = 16.0977, StdDv = 4.9568, Max = 32, Min = 8;
SW-W = 0.9641, p = 0.0000
Hostility Score (w/crash exp): D = 0.0818, p < 0.0100, Lilliefors-p < 0.01;
N = 547, Mean = 18.1079, StdDv = 5.1428, Max = 38, Min = 8;
SW-W = 0.9841, p = 0.00001
Hostility Score
Hostility Score (w/crash exp)0 5 10 15 20 25 30 35 40 45
0
100
200
300
400
500
600
No o
f obs
Figure 31 Histogram of hostility score (with and without crash experience)
4.2 Significant Variables Influencing Rider Road Crash Frequency
The riding habit score derived from the questionnaire survey passed the variable screening
requirement. The riding habit score range is +20 to -20. Positive value denotes good riding
habit and vice versa. It can be noted that roads with more positive riding habit score has lesser
motorcycle road crash count. This is presented in Figure 32 below. Aggression level is
observed to have very large influence on motorcycle road crash count along roads. Figure 33
presents the linear relationship between aggression score and road crash count with correlation
coefficient R of 0.6691. It can be stated that aggression score has a very large effect on road
crash count. Aggressive drivers have the tendency to be easily provoked under various
negative traffic and road conditions. This can be related to the top human factors that caused
1469

Journal of the Eastern Asia Society for Transportation Studies, Vol.9, 2011
road crash that is presented in chapter III. Over speeding and riding too close to other vehicles
can be considered as rider’s response to negative traffic or road conditions. Larger aggression
score corresponds to higher road crash count because of negative responses of riders that
contributes to occurrence of road crash.
Figure 32 Scatter plots & statistics of average riding habit score & crash count
Scatterplot of Road Crash Count against Av e. Anggression
Summary of Video Data-FINAL 96v *7c
Av e. Anggression:Road Crash Count: y = -9273.3676 + 192.277*x;
r = 0.6691, p = 0.2168; r2 = 0.4477
Road Crash Count = -9273.3676+192.277*x; 0.95 Conf .Int.
50 51 52 53 54 55 56
Av e. Anggression
0
200
400
600
800
1000
1200
1400
1600
Ro
ad
Cra
sh C
ou
nt
Figure 33 Scatter plots & statistics of average aggression scores & crash count
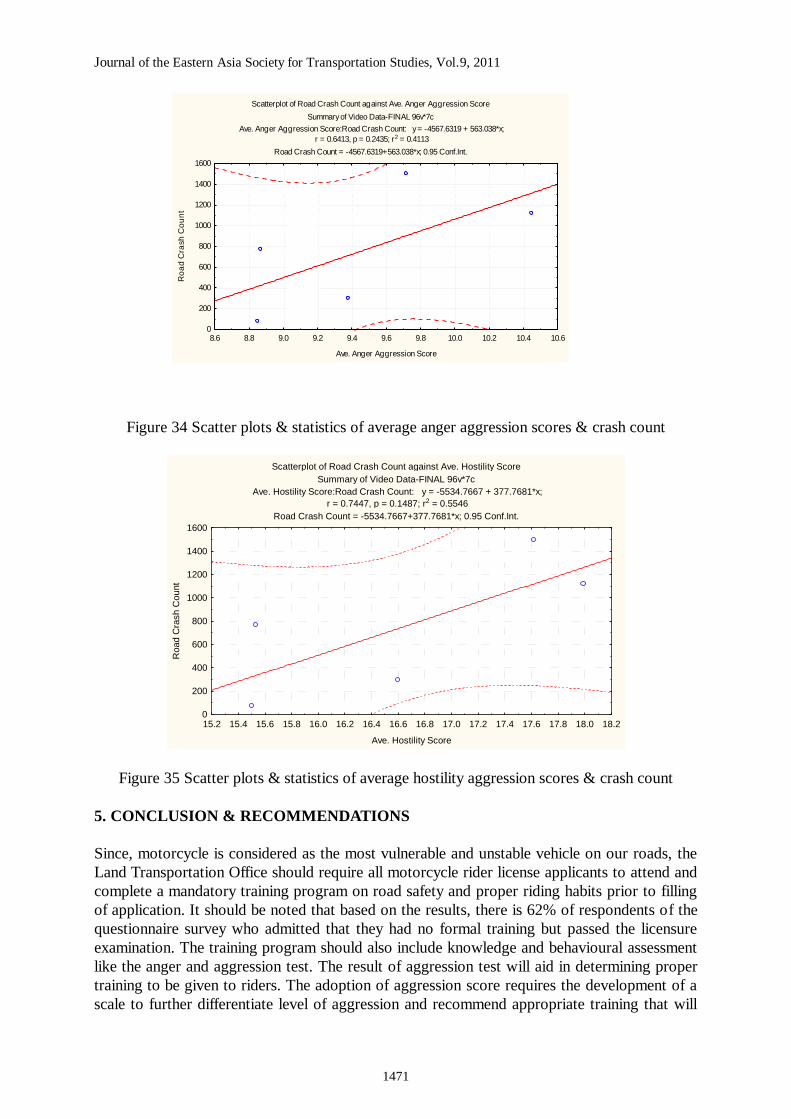
Among the four areas of aggression measure, anger and hostility can be noted to have
large influence on road crash count. The higher anger score corresponds to quicker anger
development resulting to negative responses that contributes to road crash occurrence. Figure
34 and 35 presents a good model on the influence of anger and hostility aggression score with
a coefficient of correlation R of 0.6413 and 0.7447 respectively.
Scatterplot of Ave. Riding Habit against Road Crash Count
Questionnaire-Operation-MMARAS Data-FINAL 105v*24c
Ave. Riding Habit = 3.8747-0.0006*x
Road Crash Count:Ave. Riding Habit: y = 3.8747 - 0.0006*x;
r = -0.5628, p = 0.0362; r2 = 0.3167
0 200 400 600 800 1000 1200 1400 1600
Road Crash Count
2.2
2.4
2.6
2.8
3.0
3.2
3.4
3.6
3.8
4.0
4.2
Ave
. R
idin
g H
ab
it
1470
Journal of the Eastern Asia Society for Transportation Studies, Vol.9, 2011
Scatterplot of Road Crash Count against Ave. Anger Aggression Score
Summary of Video Data-FINAL 96v*7c
Ave. Anger Aggression Score:Road Crash Count: y = -4567.6319 + 563.038*x;
r = 0.6413, p = 0.2435; r2 = 0.4113
Road Crash Count = -4567.6319+563.038*x; 0.95 Conf.Int.
8.6 8.8 9.0 9.2 9.4 9.6 9.8 10.0 10.2 10.4 10.6
Ave. Anger Aggression Score
0
200
400
600
800
1000
1200
1400
1600
Ro
ad
Cra
sh
Co
un
t
Figure 34 Scatter plots & statistics of average anger aggression scores & crash count
Scatterplot of Road Crash Count against Ave. Hostility Score
Summary of Video Data-FINAL 96v*7c
Ave. Hostility Score:Road Crash Count: y = -5534.7667 + 377.7681*x;
r = 0.7447, p = 0.1487; r2 = 0.5546
Road Crash Count = -5534.7667+377.7681*x; 0.95 Conf.Int.
15.2 15.4 15.6 15.8 16.0 16.2 16.4 16.6 16.8 17.0 17.2 17.4 17.6 17.8 18.0 18.2
Ave. Hostility Score
0
200
400
600
800
1000
1200
1400
1600
Ro
ad
Cra
sh
Co
unt
Figure 35 Scatter plots & statistics of average hostility aggression scores & crash count
5. CONCLUSION & RECOMMENDATIONS
Since, motorcycle is considered as the most vulnerable and unstable vehicle on our roads, the
Land Transportation Office should require all motorcycle rider license applicants to attend and
complete a mandatory training program on road safety and proper riding habits prior to filling
of application. It should be noted that based on the results, there is 62% of respondents of the
questionnaire survey who admitted that they had no formal training but passed the licensure
examination. The training program should also include knowledge and behavioural assessment
like the anger and aggression test. The result of aggression test will aid in determining proper
training to be given to riders. The adoption of aggression score requires the development of a
scale to further differentiate level of aggression and recommend appropriate training that will
1471

Journal of the Eastern Asia Society for Transportation Studies, Vol.9, 2011
be required to minimize probability of road crash experience. The riding habit score have
shown significant influence on crash frequency. The developed riding habit assessment tool
adopted in the study as part of the questionnaire may be further enhanced and adopted for rider
licensure examination. Researches that would allow collection of actual blood pressure or heart
beat during drive test should be conducted for a more in-depth analysis and understanding on
rider’s behaviour and its influence to road safety. Rider’s age was found to be significant in
motorcycle crash experience and severity. It is recommended that accident insurance should be
promoted or if possible required. It should also be noted that majority of the respondents used
motorcycle for work or business. Thus, the cost of insurance should be shouldered by the
employer or company. Business that require their employees the use of motorcycle should
ensure that fatigue, stress and exposure is considered and addressed. Further study on this area
may be considered by researchers to determine the implication of motorcycle riding as required
by an individual’s work. Since there is an alarming percentage of a rider who claimed that they
ride even under the influence of alcohol, initiatives should be implemented to address this
problem. Concerned agencies should support laws prohibiting driving under the influence of
alcohol or drugs and work for its immediate approval and enforcement. Amendment on the
helmet law should be done in order to make standard helmet a required protective gear when
purchasing a motorcycle. All motorcycle suppliers should automatically include the purchase of
standard helmet. The cost of standard helmet should be included in the total purchase price or
package. This recommendation is supported by the result of the questionnaire survey wherein
significant number of respondents considered cost as the major reason why they do not use
standard helmet. In our current state, riders have the option not to buy standard helmet
because it is not required during purchase of the motorcycle. Concerned government agencies
and motorcycle associations should promote motorcycle visibility and protection on the road
through various initiatives like trainings and seminars. Reflective or bright clothing should be
promoted among motorcycle riders and the use of signal and head light. Initiatives like the
“Helmet and Headlight ON” (H20) is an excellent example. To further improve motorcycle
visibility, motorcycle manufacturers and suppliers in the Philippines should be required to
design the motorcycle to automatically turn on its head light when engine is on and signal light
during left and right manoeuvres. This specification will significantly improve motorcycle
visibility and avoid motorcycle road crash along narrow and congested roads. The most
significant factors that was found to influence road crash experience are rider’s age, experience
in years and aggression scores. It should be emphasized that the aggression scores significantly
differentiates riders with and without crash experience. The result of analysis concludes that
younger and aggressive riders are most likely to experience road crash. The most significant
factors that influence motorcycle road crash frequency are riding habit score and aggression
scores.
ACKNOWLEDGEMENT
This is to acknowledge the Road Safety Unit of the Metro Manila Development Authority and
the Department of Public Works and Highways for sharing essential data for the completion of
the study. The researcher acknowledges the NCTS-IBS Research program and the Mapua
Institute of Technology for the financial support that was provided for the success of the study.
Lastly, special recognition is given to Shell Philippines, Trinoma parking and SM Southmall
parking administration for accommodating our survey team and providing survey stations for
the study.
1472

Journal of the Eastern Asia Society for Transportation Studies, Vol.9, 2011
REFERENCES
Buss, A.H. and Perry, M. (1992) The Aggression Questionnaire. Journal of Personality and
Social Psychology, 63, 452-459
Clarke, D., Ward, P., Bartle, C., and Truman, W. (2004) In-depth Study of Motorcycle
Accidents. Road Safety Research Report No. 54. UK: DfT Publications
Deffenbacher, J.L., Oetting, E.R., and Lynch, R.S. (1994) Development of a driving Anger
Scale. Psychological Reports, 74, 83-91
Deffenbacher, J.L., Lynch R.S., Filetti L.B., Dahlen E.R., & Oetting E.R. (2003) Anger,
aggression, risky behavior, and crash‐related outcomes in three groups of drivers.
Behavior Research and Therapy, 41, 333‐349
Department of Public Works and Highways, Traffic Accident Recording and Analysis System
(TARAS), 2005-2009.
Haque, Md. Mazharul, Chye, L.B., Chin, H.C. (2009) Effects of Impulsive Sensation
Seeking, Aggression and Risk-Taking Behaviors on the Vulnerability of Motorcyclists.
Proceedings of the Eastern Asia Society for Transportation Studies, Vol.7
Hsu, T.P. (2003) A Comparison Study on Motorcycle Traffic Development in some Asian
Countries – case of Taiwan, Malaysia, and Vietnam. Final Report.
Land Transportation Office, Statistics on Vehicle Registration, 2002-2009.
Metro Manila Development Authority, Metro Manila Accident Reporting and Analysis
System (MMARAS), 2005-2009.
Rutter, D. R and Quine, L. (1996) Age and Experience in Motorcycling Safety. Accident
Analysis & Prevention, 28(1): 15-21
Sigua, R.G. (2009), Motorcycle Involvement in Road Crashes in Metro Manila, Journal of
Eastern Asia Society for Transportation Studies, Vol. 7, 1906-1915.
Uy, F. A.A. et.al (2007), Impact of Increasing Number of Motorcycles on Road Safety in
Metro Manila, Proceedings of the Philippine Institute of Civil Engineers National
Convention 2007.
1473
Recommended


![[Your Unit] MOTORCYCLE RIDER PRE-SEASON BRIEFING](https://img.pdfslide.net/doc/110x75/626beb75c346f4309945c164/your-unit-motorcycle-rider-pre-season-briefing.jpg)

