101
Spotted gully shark (Triakis mega-lopterus, Smith, 1839), is one of five Triakis species and is endemic to southern Africa (Compagno, 1988). Its distribution range extends from northern Namibia (although anec-dotal information indicates that it is caught as far north as Angola) southward around the coast to Coffee Bay in the Eastern Cape Province, South Africa (Compagno, 1988; Com-pagno et al., 2005). It is a shallow water (<50 m) (Compagno et al., 1989 ; Smale and Goosen, 1999), demersal species that is recreation-ally important to shore and ski-boat anglers. With the exception of some information pertaining to its repro-ductive and feeding biology (Smale and Goosen, 1999) there is little information available to guide its management. Given its narrow dis-tribution range and small popula-tion size, it could be vulnerable to overexploitation in a manner similar to its congener, T. semifasciata, that has declined in abundance and is now carefully managed (Smith and Abramson, 1990; Cailliet, 1992). An equivalent analysis is required for T. megalopterus to assess its vulner-ability to fishing pressure.
Age validation, growth, mortality, and demographic modeling of spotted gully shark (Triakis megalopterus) from the southeast coast of South Africa
Anthony J. Booth (contact author)1
Alan J. Foulis1
Malcolm J. Smale2
Email address for contact author: [email protected] 1 Department of Ichthyology and Fisheries Science Rhodes University P.O. Box 94 Grahamstown, 6140, South Africa2 Port Elizabeth Museum P.O. Box 13147 Humewood, 6013, South Africa
and
Department of Zoology Nelson Mandela Metropolitan University P.O. Box 77000 Port Elizabeth, 6013, South Africa
Manuscript submitted 14 May 2010.Manuscript accepted 3 November 2010.Fish. Bull. 109:101–112 (2011).
The views and opinions expressed or implied in this article are those of the author (or authors) and do not necessarily reflect the position of the National Marine Fisheries Service, NOAA.
Abstract—This study documents vali-dation of vertebral band-pair forma-tion in spotted gully shark (Triakis megalopterus) with the use of f luoro-chrome injection and tagging of cap-tive and wild sharks over a 21-year period. Growth and mortality rates of T. megalopterus were also estimated and a demographic analysis of the species was conducted. Of the 23 OTC (oxytetracycline) -marked vertebrae examined (12 from captive and 11 from wild sharks), seven vertebrae (three from captive and four from wild sharks) exhibited chelation of the OTC and f luoresced under ultra-violet light. It was concluded that a single opaque and translucent band pair was deposited annually up to at least 25 years of age, the maximum age recorded. Reader precision was assessed by using an index of aver-age percent error calculated at 5%. No significant differences were found between male and female growth pat-terns (P>0.05), and von Bertalanffy growth model parameters for com-bined sexes were estimated to be L∞=1711.07 mm TL, k=0.11/yr and t0= –2.43 yr (n= 86). Natural mortal-ity was estimated at 0.17/yr. Age at maturity was estimated at 11 years for males and 15 years for females. Results of the demographic analysis showed that the population, in the absence of f ishing mortality, was stable and not significantly different from zero and particularly sensitive to overfishing. At the current age at first capture and natural mortal-ity rate, the fishing mortality rate required to result in negative popu-lation growth was low at F>0.004/yr. Elasticity analysis revealed that juvenile survival was the principal factor in explaining variability in population growth rate.
Demographic modeling has been conducted on many elasmobranch populations when there are insuf-ficient catch, effort, and abundance data available to conduct a full stock assessment (Simpfendorfer, 1998; Romine et al., 2009). Demographic modeling is a popular approach be-cause it provides the best available description of the population being studied given several life history parameters. Demographic modeling therefore provides a compromise between simple life history tables and more detailed stock assess-ment models. Demographic models became popular in the 1990s and are now the most widely used popu-lation models used to assess shark populations (Simpfendorfer, 2005). A fundamental requirement for the application of age-structured demo-graphic models is that ages of sharks are available.
Correctly determining the age of fish, particularly elasmobranchs, is crucial if (unbiased) time-based life history rates such as growth, ma-turity, and mortality are to be esti-mated. Although numerous fish age and growth studies have been under-taken, remarkably few have included
102 Fishery Bulletin 109(1)
validation (Campana, 2001; Cailliet and Goldman, 2004). Campana (2001) defines validation as either the validation of the periodicity of growth increments, or as the validation of the age estimate made by reader(s). In a recent review, Campana (2001) noted that of the 372 papers in which age validation was reported, only 15% of the papers actually incorporated validation of the absolute age of wild fish. Therefore, when conduct-ing an age and growth study it is necessary to specify whether one or both validation goals are met and which validation method is used.
Three methods of validation are typically used. These are edge analysis (also known as marginal increment or zone analysis), carbon dating, and mark-recapture of tagged fish injected with a calcium-chelating fluoresc-ing chemical such as the antibiotic, oxytetracycline hydrochloride (OTC). All of these methods have been used to validate elasmobranch ages (Campana et al., 2002; Smith et al., 2003; Cailliet and Goldman, 2004; Ardizzone et al., 2006; Chen et al., 2007). The most commonly used and most reliable validation method is tagging with OTC (Campana, 2001).
In studies of elasmobranchs by OTC-injection, sharks are measured, injected with OTC, tagged, and released. The date of release is then noted. Once the shark is recaptured, the number of vertebral band pairs distal to the fluorescent mark is compared with the time be-tween release and recapture of the shark. This experi-mental approach can be problematic if recapture rates are low. Validating elasmobranch age estimates can be time consuming because recapture rates are generally low and there is a long period of time between collect-ing a sufficient number of samples and analyzing the vertebrae.
We developed a Leslie matrix-based demographic model to evaluate the ability of T. megalopterus to sus-tain increased levels and patterns of fishing pressure. We also validated the age of T. megalopterus using oxytetracycline to estimate growth and mortality rates, important demographic model parameters.
Materials and methods
General overview
In 1994, a tagging program incorporating researchers and trained volunteer fishermen was initiated at the Port Elizabeth Museum in order to obtain age valida-tion, movement studies, and population dynamics of the spotted gully shark. A total of 402 wild sharks (113 male, 230 female, and 59 of undetermined sex) were tagged, injected with OTC at a dosage of 50 mg/kg (Tanaka, 1990), and released. A total of 53 sharks were recap-tured once, and one shark twice. The date for the first recaptured fish was unfortunately unrecorded, but it was evident that it had been re-injected with OTC from the presence of an additional fluorescing mark in its verte-brae. An additional 12 display sharks were held in the Bayworld Aquarium in Port Elizabeth and injected with
OTC. All 12 display sharks and 11 tagged wild sharks were sacrificed for vertebral analysis.
In addition, a total of 129 spotted gully sharks were collected opportunistically from ski-boat fishermen, fish-ing competitions, and research cruises over a 21-year period (1984–2009) between Cape St Francis and Cof-fee Bay, South Africa. Vertebrae were collected from a subsample of 96 sharks. Total length (TL) and sex were recorded for all these sharks.
Age determination
Between five and eight vertebrae were removed from the trunk region in the vicinity of the first dorsal fin, soaked in 4.5% sodium hypochlorite for 15–45 minutes to remove excess connective tissue, and were either stored in 70–80% ethyl alcohol or frozen (Yudin and Cailliet, 1990). Cleaned vertebrae were embedded in polyester casting resin and sectioned with a diamond-bladed saw along the sagittal plane to a thickness of 0.6 mm (Natanson et al., 2006; Rizzo et al.1), and mounted on glass slides with DPX mountant (Lasec, South Africa).
Band pairs, defined as one optically opaque and one optically translucent band were counted by us-ing a dissecting microscope with transmitted white light (460–490 nm). OTC-injected specimens were also viewed with an Olympus BX60 microscope (Olympus, Johannesburg, South Africa) under ultraviolet trans-mitted light (510–550 nm). Each specimen was aged twice, three weeks apart by a single reader, without prior knowledge of the length or sex of the specimen. Counts were accepted only if both counts were in agree-ment. If the estimated number of bands differed by two or less, the specimen was recounted and the final count was accepted as the agreed upon number; if not, the specimen was discarded. If the third count did not concur with one of the previous two counts, the sample was rejected.
An age-bias plot was used to graphically assess the readings and their associated agreement (Campana, 2001; Natanson et al., 2006). A t-test was conducted on the slope of the age-bias plot (the linear regression of the second against the first age readings) to test the null hypothesis that the slope was equal to one. Com-parisons of reader accuracy for each age were made by using a paired t-test, and a c2-test of symmetry was used to test for systematic bias in the determination of age (Hoenig et al., 1995).
The variability of the within-reader age estimates was estimated with an index of average percent error
1 Rizzo, P., S. Gancitano, C. Badalucco, S. Enajjar, C. Mancusi, A. Mosteiro Cabañelas, B. Saidi, and L. Sion. 2004. Contri-bution to guidelines for age determination of chondrichthyes fish from the Mediterranean Sea (application to selected species). Report of the MedSudMed training course on age determination of selacean fish; 22 November–01 December 2004, Mazara del Vallo, Italy, 22 p. [Available from FAO-MedSudMed Project ,Mazara del Vallo, Italy
103Booth et al.: Age validation, growth, mortality, and demographic modeling of Triakis megalopterus
(IAPE) (Beamish and Fournier, 1981) with the follow-ing equation:
IAPEN R
X X
Xij i
ij
R
i
N
% ,( ) =−
==
∑∑100 1
11
where N = the number of fish aged; R = the number of readings; Xij = jth vertebral count of the ith fish; and Xi = the final agreed age of fish i.
As with Goosen and Smale (1997), an IAPE calculated to be less than 10% was considered acceptable.
Growth was modeled with the Schnute (1981) growth model. This four-parameter model is general and allows for the estimation of various nested models. The length of a shark at age a, La , is modeled as
L L L Le
ea
a t
t t= + −( ) −
−
− −( )− −( )1 2 1
1
1
1
2 1
β β βα
α
11/
,
β
where t1 = the youngest fish in the sample; t2 = the oldest fish in the sample; L1 = the estimated length of a fish at age t1; L2 = the estimated length of fish at age t2; and a and b are the curvature parameters.
By setting the parameter b to either 1 or –1, the model reduces to either the von Bertalanffy or logistic growth model. Both of these nested models have three estimated parameters. The von Bertalanffy and logistic models are expressed as
L L eak a t= −( )∞
− −( )1 0 and LL
ea k a t=
−( )∞
− −( )1 0
,
where L∞ = the theoretical maximum size; k = the growth coefficient; and t0 = the theoretical age at zero length.
The von Bertalanffy (b=1) and logistic (b=–1) para-meters were calculated with the following equations:
Le L e L
e e
t t t
t t
t t∞ =−−
= + −
α β α β
α α
β2 1
2 1
2 1
1
0 1 2
/
,
11ln and
α
βα
α β α β
β β
e L e L
L LK
t t2 12 1
2 1
−( )−
=, ..
The Schnute growth model was fitted to the com-bined-sex data and the parameters were estimated by nonlinear minimization of a negated normal log-likeli-hood function of the form
− =ln ln ˆ ,Ln2
2σ
where ˆ ˆσ 2 2
1
1= −( )=∑n
L Lia iai
n
is the maximum likelihood esti-mate of the model variance;
Lia and L̂ia are the observed and model predicted lengths of fish i at age a; and
n is the number of observed data.
The most parsimonious model was selected with the lowest Akaike information criterion (Akaike, 1973) of the form
AIC L p= − +( )2 ln ,
where p = the number of model parameters.
A likelihood ratio test was used to test the null hy-potheses that there is no difference in growth param-eters between males and females (Simpfendorfer et al., 2000; Neer et al., 2005; Natanson et al., 2006). Param-eter variability was estimated by using parametric boot-strapping with 1000 iterations and the 95% confidence intervals were estimated from the bootstrap results by using the percentile method (Buckland, 1984).
Age at maturity
Age at maturity, tm, was estimated directly from the von Bertalanffy growth model as
t tk
lLm = − −
∞0
5011ln ,
ψ
where l50y = the length at maturity obtained from Smale
and Goosen (1999); and L∞ , k and t0 are the von Bertalanffy growth model parameters.
Natural mortality
Natural mortality was estimated from the median of Pauly’s (1980), Hoenig’s (1983) and Jensen’s (1996) empirical models of the form
M
L k TPauly =
− − + +( ∞exp . . ln . ln . ln0 0152 0 279 0 6543 0 463 ))
= −( )
=
M t
M k
Hoenig
Jensen
exp . . ln
. ,
max1 44 0 982
1 6
where L∞ and k are the Von Bertalanffy growth model parameters; T = the mean water temperature (estimated
to be 16°C); and tmax = the age of the oldest fish sampled (Hoenig,
1983).
104 Fishery Bulletin 109(1)
Demographic modeling
The demographics of female T. megalopterus was mod-eled with an age-structured matrix model (Caswell, 2001) of the form nt+1=A×nt, where nt is a vector of numbers at age at time t and A is the Leslie projection matrix. In matrix formulation the model is expressed as
N
N
N
N
t
t
t
t t
1 1
2 1
3 1
1
,
,
,
,
+
+
+
+
=
�
max
φφ φ φ φ1 2 3
1
2
1
0 0 0 0
0 0 0 0
0 0 0 00 0 0 0
�
�
t
t
S
S
S
max
max−
×
N
N
N
N
t
t
t
t t
1
2
3
,
,
,
,
�
max
,
where Sa and fa = age-dependent survivals and fecundi-ties, respectively; and
tmax = the maximum age considered in the analysis.
The annual population growth rate (l), stable age distribution (w), and age-specific reproductive value (v) vectors were obtained by solving the equations Aw=lw and v*A=lw, where * is the complex conjugate trans-pose function. In the solutions, l is the common domi-nant eigenvalue and w and v are the corresponding right and left eigenvectors. The reproductive value vec-tor was normalized in relation to the age-1 value.
The conditional intrinsic rate of increase (Gedamke et al., 2007) was calculated as r = lnl, the average age of mothers of newborn individuals in a population with a stable age distribution as T= =w v w v, ' , and the average number of female offspring per female during her lifespan as R rT0=exp( ) .
The sensitivity of l to changes in the demographic parameters provides an indication of which parameter has the largest impact on the population growth rate. Sensitivity can be measured in either relative (as “sen-sitivity”) or absolute terms (as “elasticity”). Both forms of sensitivity were calculated from the individual values of the Leslie matrix, ai,j, the population growth rate, and the left-right eigenvectors as
s
a
v wi j
i j
i j,
, , ,.= ∂
∂= = ′λ
w vvww v
Elasticities, or
∂∂
lnln ,
λai j
were calculated as
ea
si ji j
i j,,
,=λ
such thatei j
ji,∑∑ =1.
Elasticities were summarized by age
E ej i ji
=∑ , ,
fertilities
E e jj
t
1 01
==∑ ,
max
,
juvenile survival
E ei jj
a
i
t
212
50
===∑∑ ,
max
and adult survival
E ei jj a
t
i
t
22 50
===∑∑ ,
maxmax
(Mollet and Cailliet, 2002).
Model implementation
Age-dependent survival was estimated as a function of both age-independent instantaneous natural mortality (M), age-dependent selectivity (ξa), and fully recruited fishing mortality (F), such that Sa=exp(– M–ξaF). A maxi-mum age of tmax=26 was used in the analysis. All param-eters used in the analysis are summarized in Table 1.
Age-dependent fertility was estimated as the number of embryos surviving to age-1 per female in a calendar year, Ea, and was weighted by the proportion of females that were mature at age a, ya, such that fa = S0ya Ea.
Because maturity, selectivity, and number of embryos are length- rather than age-dependent, all age-depen-dent values were calculated from the corresponding lengths predicted from the von Bertalanffy growth model for combined sexes.
Both maturity-at-length, yl, and selection-at-length, ξl, were modeled as logistic ogives as
ψ δψ ψl l l= + − −( )( )( )−1 50
1exp /
andξ δξ ξ
l l l= + − −( )( )( )−1 50
1exp / ,
respectively, where l50y and l50
ξ are the lengths at which shark were 50% mature or at which 50% of sharks were selected by the fishery. The inverse rates of maturation and selection are denoted as dyand dξ, respectively. Because these rates were not available from the litera-ture, they were assumed to be 2% of their corresponding 50% values. These rates were considered reasonable given other maturity and selectivity studies (Booth, unpubl. data). Length at 50% selectivity was estimated as 1326 mm TL, which is the mean length of sharks (n=252) measured from recreational anglers (Smale, unpubl. tag and release data). The number of female embryos per adult female at length l in a calendar year, given a gestational period of 20 months and a sex ratio of 1:1, was calculated as
105Booth et al.: Age validation, growth, mortality, and demographic modeling of Triakis megalopterus
Table 1Fixed parameter values estimated during this study or obtained from Smale and Goosen’s study (1999) that were used in the demographic analysis of Triakis megalopterus. TL=total length.
Parameter Description Value Source
L∞ Theoretical maximum size 1711.07 mm TL This study
k Growth coefficient 0.11 /yr This study
t0 Theoretical age at zero length –2.43 yr This study
M Natural mortality rate 0.14 /yr This study
F Fishing mortality rate 0.yr–1 This study
l50y Length at 50% maturity 1450 mm TL Smale and Goosen (1999)
l50ξ Length at 50% selectivity 1326 mm TL This study
dy Inverse rate of maturity 29 mm TL This study
dξ Inverse rate of selectivity 26 mm TL This study
tmax Maximum age 26 years This study
El Number of female embryos per adult female at length l in a calendar year given a gestational 0 5
2012
0 2 21 74. . .× × −( )l Smale and Goosen (1999) period of 20 months and a sex ratio of 1:1
E ll = × × −( )0 5
2012
0 2 21 74. . .
(Smale and Goosen, 1999). Uncertainty in the model outputs was estimated with
Monte-Carlo simulation (Cortés, 2002). For each simu-lation, i, random lengths were drawn around the pre-dicted von Bertalanffy growth model with an estimat-ed growth model standard deviation of 110 such that Li
a=La+ep, and ep ~ N(0,1102). These length estimates were used to draw random variable for the length-at-maturity as l l ei
50 50,ψ ψ
ψ= + and ey~N(0,162). The standard deviation corresponded to that required to obtain the 1st and 99th percentiles at 1391 mm TL and 1500 mm TL, the lengths at first and 100% maturity reported by Smale and Goosen (1999). Natural mortality was assumed to be log-normally distributed with a coeffi-cient of variation of 20%, such that Mi=Miexp(eM), and eM~N(0,0.22). No adjustments were made for log-normal bias. A total of 1000 simulations were conducted, and standard error and 95% confidence intervals were cal-culated for l, r, T , R0, Ea, E1, E2, and E3 by using the percentile method (Buckland, 1984).
Three-dimensional isopleth plots were constructed to assess the response of the conditional intrinsic rate of population increase parameter, r, to different inputted combinations of fishing mortality and the age at which 50% of sharks were selected.
Results
All aquarium specimens were either moribund or had died in the aquarium and had decreased in length by
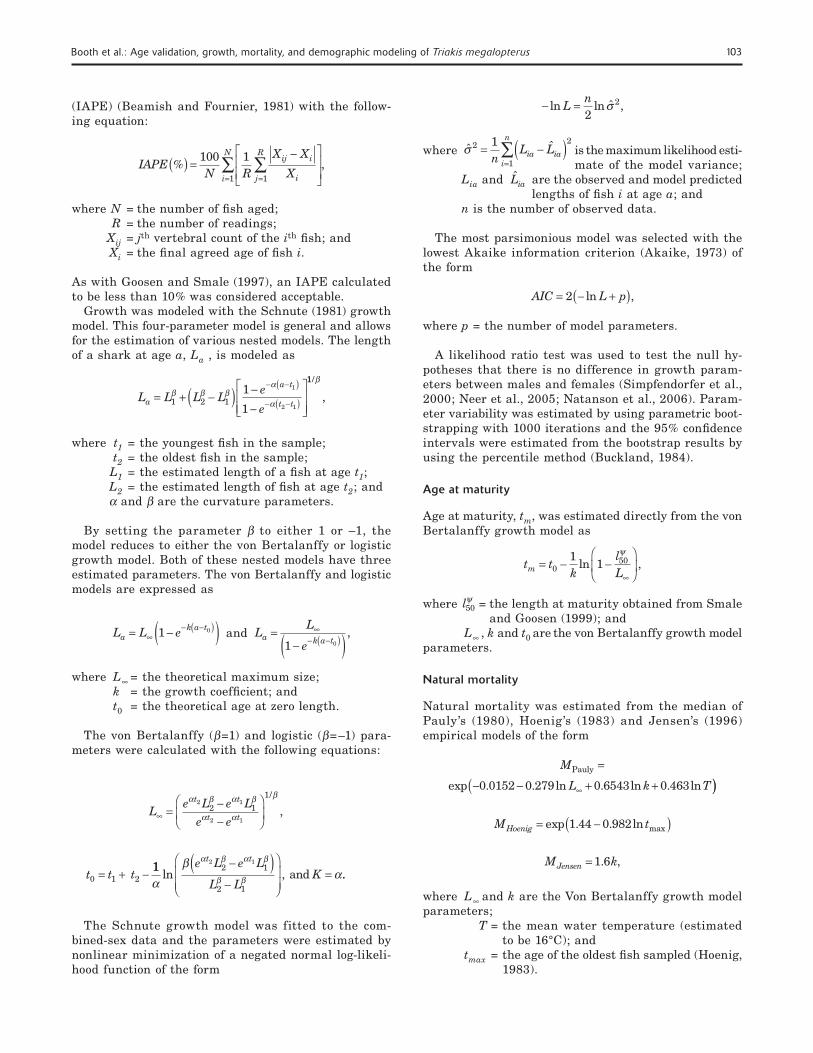
the end of the study. These sharks were not included in the estimation of the growth parameters but were included in the validation aspect of the analysis. The vertebrae from 25 male (1123.2 ±404 mm TL) and 71 female (1258.0 ±397 mm TL) sharks were processed for age estimation. Vertebrae were interpreted without dif-ficulty up to the margin of the corpus calcareum where magnification needed to be increased to accurately inter-pret the remaining band pairs (Fig. 1). No distinctive features were identified in reading the vertebrae of T. megalopterus.
Of the 96 vertebrae examined, 86 were considered suitable for aging. Age estimates ranged from 0+ to 25 years. Of the 15 OTC-injected specimens examined, only seven fluoresced (three captive and four wild speci-mens) under ultraviolet light and confirmed that one vertebral band pair was deposited annually (Table 2; Fig. 1). The maximum validated age was from a shark that was 25 years old. An age-length key is presented in Table 3.
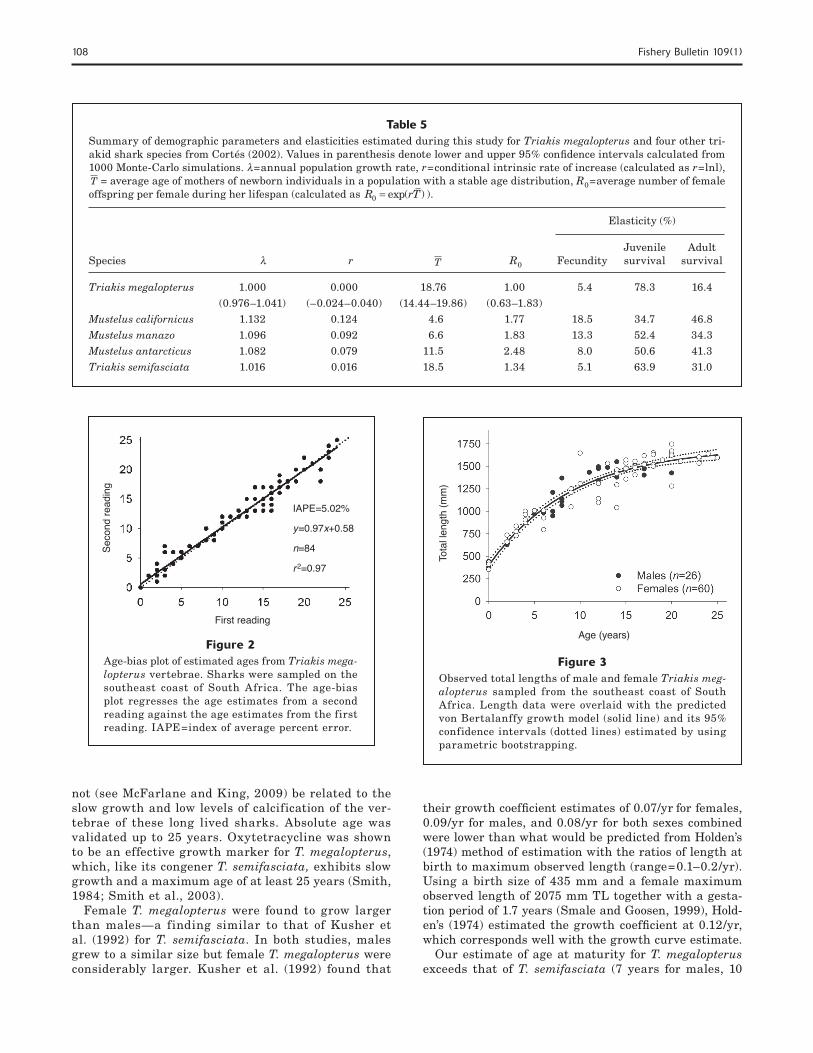
There was no significant difference in the accuracy of age assessments between readings (paired t-test; P>0.05). There was a 45% agreement on all age assess-ments, 80% agreement between age readings within 1 year, and 94% agreement between readings within 2 years. There was a strong positive correlation be-tween the first and second readings (r2=0.97) that was not statistically different from unity (t-test on slopes; P>0.05) (Fig. 2). There was no evidence for systematic age bias between readings (c2-test; P>0.05). Band pair counts were considered to be reasonably precise with an estimated IAPE of 5.02%.
Of the three models assessed, the von Bertalanffy was considered to be the most parsimonious (Schnute:
106 Fishery Bulletin 109(1)
Figure 1A sectioned vertebra of a 14-year-old wild spotted gully shark (Triakis megalopterus) tagged and injected with oxytetracycline hydrochloride seven years before recapture.
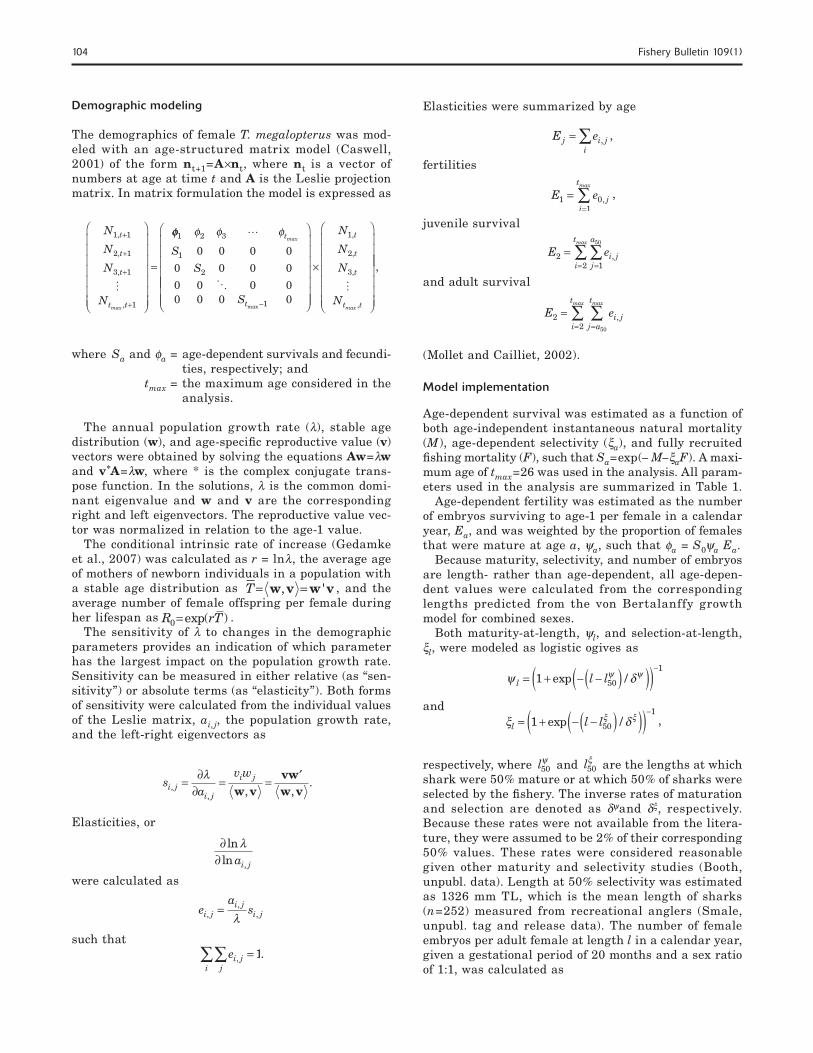
Table 2Sex, capture locations and dates, total lengths (TL), and estimated ages of specimens of Triakis megalopterus tagged and injected with oxytetracycline hydrochloride (OTC) that exhibited fluorescing zones on vertebrae. All specimens were sampled off the southeast coast of South Africa. “Zones distal to OTC”=zones that fluoresced and that were distal to the site of the OTC injection.
Capture → Years Tagging Recapture Zones recapture Tagging Recapture at length length distal TotalGender locations date date liberty (mm TL) (mm TL) to OTC age
Female Bayworld aquarium Feb 1999 Dec 2000 1.8 1700 1580 1 20Female Bayworld aquarium Nov 2001 Jan 2003 1.2 1660 1600 1 25Male Bayworld aquarium Apr 2002 Dec 2002 0.7 1560 1428 1 11Female De Hoop → De Hoop Feb 1996 Feb 1998 2.0 1111 1140 2 12Male De Hoop → De Hoop Sep 1996 May 2003 6.7 1530 1550 7 14Female Algoa Bay → Knysna Mar 1998 Mar 2005 7.0 950 1250 7 14Undetermined De Hoop → De Hoop Sep 2000 May 2003 2.7 1020 1140 3 10
p=4, AIC=906.47; von Bertalanffy: p=3, AIC=904.56; logistic: p=3, AIC=912.89). The logistic model provided the worst fit of all three models considered. Although wild female sharks tended to grow larger and slower than males (Table 4, Fig. 3), there were no significant differences among any of the growth parameters (likeli-hood ratio test, P>0.05). Overall, the growth trajecto-ries of the tagged and recaptured sharks were consist-ent with the predicted von Bertalanffy growth model for combined sexes (Fig. 4).
Age at maturity was calculated to be 10.9 years for males and 15.3 for females from the estimates of size
of maturity for males (1320 mm TL) and females (1450 mm TL) (Smale and Goosen, 1999). Natural mortality was estimated at 0.15/yr, the median of 0.10/yr, 0.16/yr and 0.17/yr, from the Pauly (1980), Hoenig (1983), and Jensen (1996) models, respectively.
Under the assumption of zero fishing mortality, the conditional intrinsic rate of increase parameter, r, was estimated at 0.00%/yr and was not significantly dif-ferent from zero based on the 95% confidence inter-val (P>0.05) (Table 5). The average age of mothers of newborn individuals in the stable-age population was estimated at 18.76 years, and the average number of
107Booth et al.: Age validation, growth, mortality, and demographic modeling of Triakis megalopterus
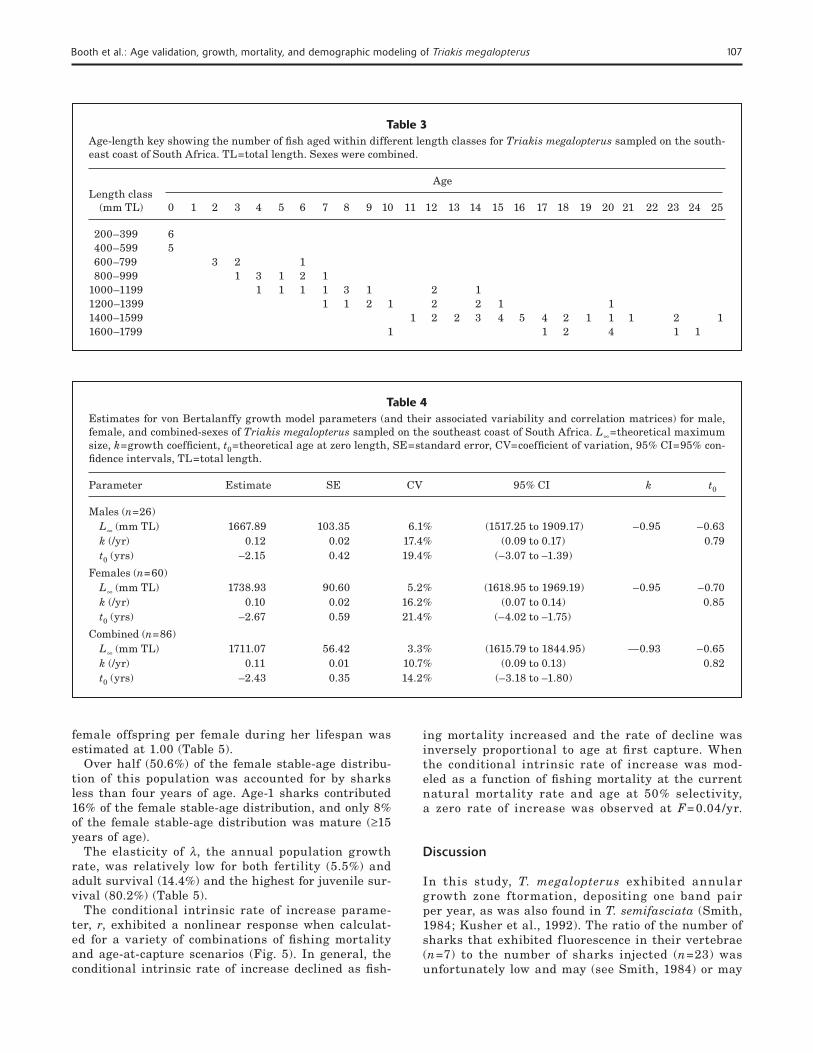
Table 3Age-length key showing the number of fish aged within different length classes for Triakis megalopterus sampled on the south-east coast of South Africa. TL=total length. Sexes were combined.
AgeLength class (mm TL) 0 1 2 3 4 5 6 7 8 9 10 11 12 13 14 15 16 17 18 19 20 21 22 23 24 25
200–399 6 400–599 5 600–799 3 2 1 800–999 1 3 1 2 11000–1199 1 1 1 1 3 1 2 11200–1399 1 1 2 1 2 2 1 11400–1599 1 2 2 3 4 5 4 2 1 1 1 2 11600–1799 1 1 2 4 1 1
Table 4Estimates for von Bertalanffy growth model parameters (and their associated variability and correlation matrices) for male, female, and combined-sexes of Triakis megalopterus sampled on the southeast coast of South Africa. L∞=theoretical maximum size, k=growth coefficient, t0=theoretical age at zero length, SE=standard error, CV=coefficient of variation, 95% CI=95% con-fidence intervals, TL=total length.
Parameter Estimate SE CV 95% CI k t0
Males (n=26) L∞ (mm TL) 1667.89 103.35 6.1% (1517.25 to 1909.17) –0.95 –0.63 k (/yr) 0.12 0.02 17.4% (0.09 to 0.17) 0.79 t0 (yrs) –2.15 0.42 19.4% (–3.07 to –1.39)
Females (n=60) L∞ (mm TL) 1738.93 90.60 5.2% (1618.95 to 1969.19) –0.95 –0.70 k (/yr) 0.10 0.02 16.2% (0.07 to 0.14) 0.85 t0 (yrs) –2.67 0.59 21.4% (–4.02 to –1.75)
Combined (n=86) L∞ (mm TL) 1711.07 56.42 3.3% (1615.79 to 1844.95) —0.93 –0.65 k (/yr) 0.11 0.01 10.7% (0.09 to 0.13) 0.82 t0 (yrs) –2.43 0.35 14.2% (–3.18 to –1.80)
female offspring per female during her lifespan was estimated at 1.00 (Table 5).
Over half (50.6%) of the female stable-age distribu-tion of this population was accounted for by sharks less than four years of age. Age-1 sharks contributed 16% of the female stable-age distribution, and only 8% of the female stable-age distribution was mature (≥15 years of age).
The elasticity of l, the annual population growth rate, was relatively low for both fertility (5.5%) and adult survival (14.4%) and the highest for juvenile sur-vival (80.2%) (Table 5).
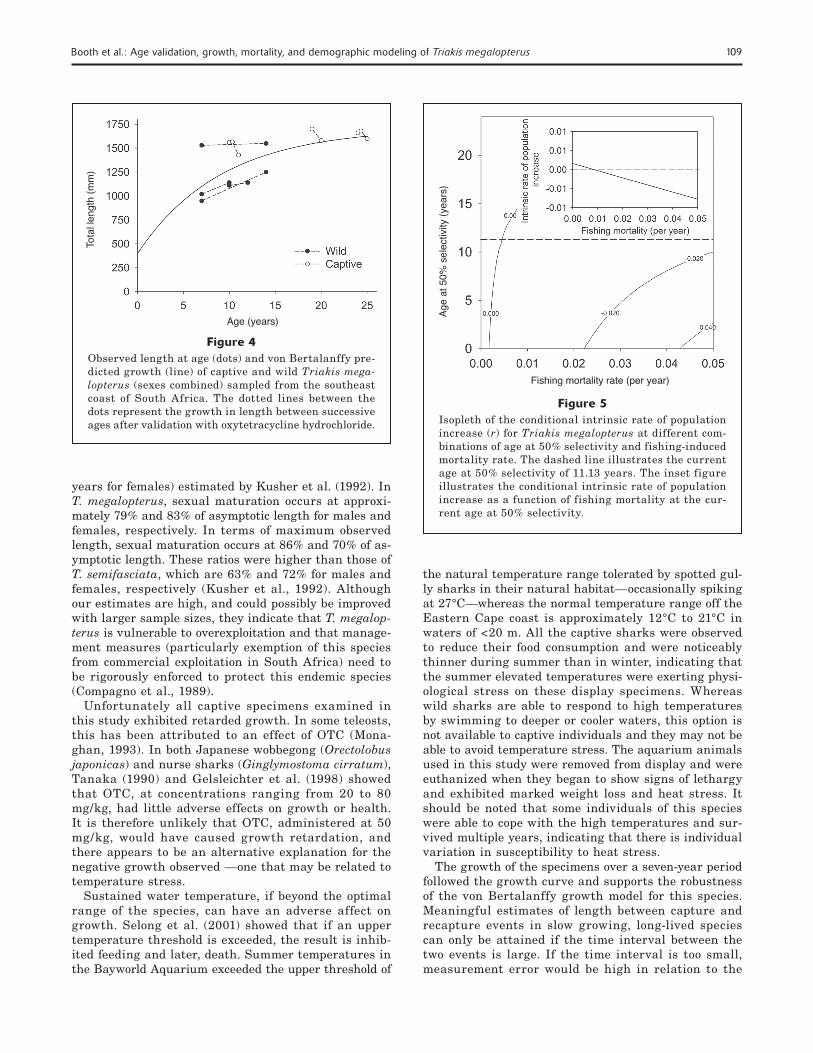
The conditional intrinsic rate of increase parame-ter, r, exhibited a nonlinear response when calculat-ed for a variety of combinations of fishing mortality and age-at-capture scenarios (Fig. 5). In general, the conditional intrinsic rate of increase declined as fish-
ing mortality increased and the rate of decline was inversely proportional to age at first capture. When the conditional intrinsic rate of increase was mod-eled as a function of fishing mortality at the current natural mortality rate and age at 50% selectivity, a zero rate of increase was observed at F= 0.04/yr.
Discussion
In this study, T. megalopterus exhibited annular growth zone ftormation, depositing one band pair per year, as was also found in T. semifasciata (Smith, 1984; Kusher et al., 1992). The ratio of the number of sharks that exhibited f luorescence in their vertebrae (n=7) to the number of sharks injected (n=23) was unfortunately low and may (see Smith, 1984) or may
108 Fishery Bulletin 109(1)
Figure 2Age-bias plot of estimated ages from Triakis mega-lopterus vertebrae. Sharks were sampled on the southeast coast of South Africa. The age-bias plot regresses the age estimates from a second reading against the age estimates from the first reading. IAPE=index of average percent error.
Seco
nd re
adin
g
First reading
IAPE=5.02%
y=0.97x+0.58
n=84
r2=0.97
Table 5Summary of demographic parameters and elasticities estimated during this study for Triakis megalopterus and four other tri-akid shark species from Cortés (2002). Values in parenthesis denote lower and upper 95% confidence intervals calculated from 1000 Monte-Carlo simulations. l=annual population growth rate, r=conditional intrinsic rate of increase (calculated as r=lnl), T = average age of mothers of newborn individuals in a population with a stable age distribution, R0=average number of female offspring per female during her lifespan (calculated as R rT0 = exp( ) ).
Elasticity (%)
Juvenile AdultSpecies l r T R0 Fecundity survival survival
Triakis megalopterus 1.000 0.000 18.76 1.00 5.4 78.3 16.4 (0.976–1.041) (–0.024–0.040) (14.44–19.86) (0.63–1.83) Mustelus californicus 1.132 0.124 4.6 1.77 18.5 34.7 46.8Mustelus manazo 1.096 0.092 6.6 1.83 13.3 52.4 34.3Mustelus antarcticus 1.082 0.079 11.5 2.48 8.0 50.6 41.3Triakis semifasciata 1.016 0.016 18.5 1.34 5.1 63.9 31.0
not (see McFarlane and King, 2009) be related to the slow growth and low levels of calcification of the ver-tebrae of these long lived sharks. Absolute age was validated up to 25 years. Oxytetracycline was shown to be an effective growth marker for T. megalopterus, which, like its congener T. semifasciata, exhibits slow growth and a maximum age of at least 25 years (Smith, 1984; Smith et al., 2003).
Female T. megalopterus were found to grow larger than males—a finding similar to that of Kusher et al. (1992) for T. semifasciata. In both studies, males grew to a similar size but female T. megalopterus were considerably larger. Kusher et al. (1992) found that
their growth coefficient estimates of 0.07/yr for females, 0.09/yr for males, and 0.08/yr for both sexes combined were lower than what would be predicted from Holden’s (1974) method of estimation with the ratios of length at birth to maximum observed length (range=0.1–0.2/yr). Using a birth size of 435 mm and a female maximum observed length of 2075 mm TL together with a gesta-tion period of 1.7 years (Smale and Goosen, 1999), Hold-en’s (1974) estimated the growth coefficient at 0.12/yr, which corresponds well with the growth curve estimate.
Our estimate of age at maturity for T. megalopterus exceeds that of T. semifasciata (7 years for males, 10
Figure 3Observed total lengths of male and female Triakis meg-alopterus sampled from the southeast coast of South Africa. Length data were overlaid with the predicted von Bertalanffy growth model (solid line) and its 95% confidence intervals (dotted lines) estimated by using parametric bootstrapping.
Age (years)
Tota
l len
gth
(mm
)
109Booth et al.: Age validation, growth, mortality, and demographic modeling of Triakis megalopterus
years for females) estimated by Kusher et al. (1992). In T. megalopterus, sexual maturation occurs at approxi-mately 79% and 83% of asymptotic length for males and females, respectively. In terms of maximum observed length, sexual maturation occurs at 86% and 70% of as-ymptotic length. These ratios were higher than those of T. semifasciata, which are 63% and 72% for males and females, respectively (Kusher et al., 1992). Although our estimates are high, and could possibly be improved with larger sample sizes, they indicate that T. megalop-terus is vulnerable to overexploitation and that manage-ment measures (particularly exemption of this species from commercial exploitation in South Africa) need to be rigorously enforced to protect this endemic species (Compagno et al., 1989).
Unfortunately all captive specimens examined in this study exhibited retarded growth. In some teleosts, this has been attributed to an effect of OTC (Mona-ghan, 1993). In both Japanese wobbegong (Orectolobus japonicas) and nurse sharks (Ginglymostoma cirratum), Tanaka (1990) and Gelsleichter et al. (1998) showed that OTC, at concentrations ranging from 20 to 80 mg/kg, had little adverse effects on growth or health. It is therefore unlikely that OTC, administered at 50 mg/kg, would have caused growth retardation, and there appears to be an alternative explanation for the negative growth observed —one that may be related to temperature stress.
Sustained water temperature, if beyond the optimal range of the species, can have an adverse affect on growth. Selong et al. (2001) showed that if an upper temperature threshold is exceeded, the result is inhib-ited feeding and later, death. Summer temperatures in the Bayworld Aquarium exceeded the upper threshold of
the natural temperature range tolerated by spotted gul-ly sharks in their natural habitat—occasionally spiking at 27°C—whereas the normal temperature range off the Eastern Cape coast is approximately 12°C to 21°C in waters of <20 m. All the captive sharks were observed to reduce their food consumption and were noticeably thinner during summer than in winter, indicating that the summer elevated temperatures were exerting physi-ological stress on these display specimens. Whereas wild sharks are able to respond to high temperatures by swimming to deeper or cooler waters, this option is not available to captive individuals and they may not be able to avoid temperature stress. The aquarium animals used in this study were removed from display and were euthanized when they began to show signs of lethargy and exhibited marked weight loss and heat stress. It should be noted that some individuals of this species were able to cope with the high temperatures and sur-vived multiple years, indicating that there is individual variation in susceptibility to heat stress.
The growth of the specimens over a seven-year period followed the growth curve and supports the robustness of the von Bertalanffy growth model for this species. Meaningful estimates of length between capture and recapture events in slow growing, long-lived species can only be attained if the time interval between the two events is large. If the time interval is too small, measurement error would be high in relation to the
Figure 4Observed length at age (dots) and von Bertalanffy pre-dicted growth (line) of captive and wild Triakis mega-lopterus (sexes combined) sampled from the southeast coast of South Africa. The dotted lines between the dots represent the growth in length between successive ages after validation with oxytetracycline hydrochloride.
Age (years)
Tota
l len
gth
(mm
)
Figure 5Isopleth of the conditional intrinsic rate of population increase (r) for Triakis megalopterus at different com-binations of age at 50% selectivity and fishing-induced mortality rate. The dashed line illustrates the current age at 50% selectivity of 11.13 years. The inset figure illustrates the conditional intrinsic rate of population increase as a function of fishing mortality at the cur-rent age at 50% selectivity.
Fishing mortality rate (per year)
Age
at 5
0% s
elec
tivity
(yea
rs)
110 Fishery Bulletin 109(1)
gain in growth, particularly when measuring a robust, lively shark. The impact of this error would therefore be reduced when sampling intervals are years apart and more growth has occurred. Where growth is modest and measuring error occurs, the scope for inaccurate size estimates is greater. For this reason, size estimates of sharks from aquaria may be less reliable because of the relatively short time between measurements. However, this study would best be repeated in aquaria without unseasonably high summer temperatures.
The results from the demographic model indicate that T. megalopterus can sustain very limited fishing pressure, and therefore these results reinforce the bio-logical interpretation of its life history parameters. It has been shown that species that are long lived, have a low rate of natural mortality, and produce few offspring per year cannot sustain high levels of fishing pressure (Holden, 1974; Cailliet, 1992; Simpfendorfer, 2005; Dul-vey and Forrest, 2010). Even small increases in fishing-induced mortality, particularly at the current size of selection will negatively impact the population. At 11 years, sharks are harvested 4 years before the onset of sexual maturity. This age is of concern because the model predicts that an average age of a female shark is around 19 years and it will produce only a single female offspring over her lifetime. Any additional increase in fishing mortality would further decrease the number of adults and possibly contribute to recruitment overfish-ing. There are numerous examples in the literature of overexploitation and even extirpation of populations of chondrichthyans because their life history parameters are not understood and/or taken into consideration in management scenarios (Dulvey and Forrest, 2010).
The life history parameters of Triakis megalopterus were similar to those of its congener, T. semifasciata. Both sharks live to about 25 years of age, have similar natural mortality rates, and produce similar numbers of embryos per annum. As a result, it is not surprising that the demographic model applied to both species shows similar trends. Cailliet (1992) recommended that fishing mortality be reduced to 0.5M, and that the size at capture be increased to prevent a decline in abun-dance. We determined in this study that, at current selection levels, the fishing mortality rate required for a stable population size would be 0.02M. Even if the age at 50% capture were increased significantly to 20 years, T. megalopterus would not be able to sustain even moderate levels of fishing mortality. Any possi-ble increases in fishing mortality should, therefore, be closely monitored.
Triakis megalopterus is legislated as a noncommercial species with zero commercial harvest. This species is, however, targeted by recreational anglers. From per-sonal observations, there has been a steady increase in recreational anglers targeting elasmobranchs because of a reduction in the availability of other favoured tel-eost species. Increased targeted fishing of this shark species could possibly result in higher levels of postre-lease mortality from hooking and handling. Despite its noncommercial status, T. megalopterus is unfortunately
mistaken as Mustelus mustelus in a small, yet develop-ing, inshore shark longline fishery. Even if bycatch rates were to remain constant, the increased catches in this developing fishery would result in obvious increases in mortality from commercial fishing.
Of the triakids that have been demographically mod-eled (Table 5), the Mustelus species appear to be the most resilient to harvesting pressure and have been shown to support sustainable fisheries (Walker, 1992; Chiaramonte, 1998; Francis and Shallard, 1999). The two reef-associated Triakis species have less habitat available and correspondingly smaller population sizes. Given their reduced habitat and life history character-istics, it is not surprising that their populations will decrease with commercial harvesting.
Acknowledgments
This study would not have been possible without the assistance of numerous anglers, and in particular M. Spies, who assisted with tagging with A. Goosen, who initiated the growth study with MJS. C. Attwood and his tagging team are acknowledged for their assistance at De Hoop, and for supplying data and material used in this study. Work at Bird Island was initiated under research permits from the Eastern Cape Department of Economic Affairs, Environment and Tourism, and South African National Parks. Financial support from the National Research Foundation and administration by Bayworld Centre for Research and Education are gratefully acknowledged. K. Goldman and two anony-mous reviewers are thanked for their helpful comments.
Literature cited
Akaike, H. 1973. Information theory as an extension of the maximum
likelihood principle. In Second international symposium on information theory (B. N. Petrov and F. Csaki, eds.), p. 267–281. Akademiai Kiado, Budapest.
Ardizzone, D., G. M. Cailliet, L. J. Natanson, A. H. Andrews, L. A. Kerr, and T. A. Brown.
2006. Application of bomb radiocarbon chronologies to shortfin mako (Isurus oxyrinchus) age validation. Envi-ron. Biol. Fish. 77:355–366.
Beamish, R. J., and D. A. Fournier. 1981. A method for comparing the precision of a set of age
determinations. Can. J. Fish. Aquat. Sci. 38:982–983.Buckland, S. T.
1984. Monte-carlo confidence intervals. Biometrics 40:811–817.
Cailliet, G. M. 1992. Demography of the central California population
of the leopard shark (Triakis semifasciatus). Aust. J. Mar Freshw. Res. 43:183–193.
Cailliet, G. M., and K. J. Goldman. 2004. Age determination and validation in chondrich-
thyan fishes. In Biology of sharks and their relatives (J. C. Carrier, J. A. Musick, and M. R. Heithaus, eds.), p. 399–447. CRC Mar. Biol. Ser., London.
111Booth et al.: Age validation, growth, mortality, and demographic modeling of Triakis megalopterus
Campana, S. E. 2001. Accuracy, precision and quality control in age
determination, including a review of the use and abuse of age validation methods. J. Fish Biol. 59:197– 242.
Campana, S. E., L. J. Natanson, and S. Myklevoll. 2002. Bomb dating and age determination of large pelagic
sharks. Can. J. Fish. Aquat. Sci. 59:450–455.Caswell, H.
2001. Matrix population models: construction, analysis, and interpretation, 722 p. Sinauer, MA.
Chiaramonte, G. E. 1998. Shark fisheries in Argentina. Mar. Freshw. Res.
49:601–609.Chen, W. K., P. C. Chen, K. M. Liu, and S. B. Wang.
2007. Age and growth estimates of the whitespotted bamboo shark, Chiloscyllium plagiosum, in the northern waters of Taiwan. Zool. Stud. 46:92–102.
Compagno, L. J. V. 1988. Sharks of the order Carcharhiniformes, 485 p.
Princeton Univ. Press, Princeton, NJ.Compagno, L. J. V., M. Dando, and S. Fowler.
2005. A field guide to the sharks of the world, 386 p. Collins, London.
Compagno, L. J. V., D. A. Ebert, and M. J. Smale. 1989. Guide to the sharks and rays of southern Africa,
58 p. Struik Publishers, Cape Town. Cortés, E.
2002. Incorporating uncertainty into demographic mod-eling: application to shark populations and their con-servation. Cons. Biol. 16:1048–1062.
Dulvey, N. K., and R. E. Forrest. 2010. Life histories, population dynamics, and extinction
risks in Chondrichthyans. In Sharks and their rela-tives: biodiversity, adaptive physiology and conservation (J. C. Carrier, J. A. Musick, and M. R. Heithaus, eds.), p. 639–679. CRC Press, London.
Francis, M. P., and B. Shallard. 1999. New Zealand shark fishery management. In Case
studies of management of elasmobranch fisheries (R. Shotton, ed.) p. 5l5–579. FAO Fisheries Technical Paper no. 378. FAO, Rome.
Gedamke, T., Hoenig, J., Musick, J. A., and W. D. DuPaul. 2007. Using demographic models to determine intrinsic
rate of increase and sustainable fishing for elasmo-branchs: pitfalls, advances, and applications. N. Am. J. Fish. Manage. 27:605–618.
Gelsleichter, J., E. Cortes, C. A. Manire, R. E. Heuter, and J. A. Musick.
1998. Evaluation of oxytetracycline on growth of cap-tive nurse sharks, Gingymostoma cirratum. Fish. Bull. 96:624–627.
Goosen, A. J, and M. J. Smale. 1997. A preliminary study of age and growth of the
smoothhound shark Mustelus mustelus (Triakidae). S. Afr. J. Mar. Sci. 18:85–91.
Hoenig, J. M. 1983. Empirical use of longevity data to estimate mor-
tality rates. Fish. Bull. 82: 898–903.Hoenig, J. M., M. Morgan, and C. A. Brown.
1995. Analyzing differences between two age determi-nation methods by tests of symmetry. Can. J. Fish. Aquat. Sci. 52:364–368.
Holden, M. J. 1974. Problems in the rational exploitation of elasmo-
branch populations and some suggested solutions. In
Sea fisheries research (F. R. Harden Jones, ed.) p 117–137. Elek Science, London.
Jensen, A. L. 1996. Beverton and Holt life history invariants result from
optimal trade-off of reproduction and survival. Can. J. Fish. Aquat. Sci. 53:820–822.
Kusher, D. I., S. E. Smith, and G. M. Cailliet. 1992. Validated age and growth of the leopard shark,
Triakis semifasciata, from central California. Environ. Biol. Fish. 35:187–203.
McFarlane, G. A., and J. R. King. 2009. Re-evaluating the age determination of spiny dog-
fish using oxytetracycline and fish at liberty up to 20 years. In Biology and management of dogfish sharks (V. F. Gallucci, G. A. McFarlane, and G. G. Bargmann, eds), p. 153–160. Am. Fish. Soc., Bethesda, MD.
Mollet, H. F., and G. M. Cailliet. 2002. Comparative population demography of elasmo-
branches using life history tables, Leslie matrices and stage-based matrix model. Mar. Freshw. Res. 53:503–516.
Monaghan, J. P. 1993. Comparison of calcein and tetracycline as chemi-
cal markers in summer f lounder. Trans. Am. Fish. Soc. 122:298–301.
Natanson, L. J., N. E. Kohler, D. Ardizzone, G. M. Cailliet, S. P. Wintner, and H. F. Mollet.
2006. Validated age and growth estimates for the short-fin mako, Isurus oxyrinchus, in the North Atlantic Ocean. Environ. Biol. Fish. 77:367–383.
Neer, J. A., B. A. Thompson, and J. K. Carlson. 2005. Age and growth of Carcharhinus leucas in the
northern Gulf of Mexico: incorporating variability in size at birth. J. Fish Biol. 67:370–383.
Pauly, D. 1980. On the interrelationships between natural mor-
tality, growth parameters and mean environmental temperature in 175 fish stocks. J. Cons. Int. L’Expl. Mer 39:175–192.
Romine, J. G., Musick, J. A. and G. H. Burgess. 2009. Demographic analyses of the dusky shark, Car-
charhinus obscurus, in the Northwest Atlantic incor-porating hooking mortality estimates and revised reproductive parameters. Environ. Biol. Fish. 84:277–289.
Selong, J. H., T. E. McMahon, A. V. Zale, and F. T. Barrows. 2001. Effect of temperature on growth and survival of
bull trout, with application of an improved method for determining thermal tolerance in fishes. Trans. Am. Fish. Soc. 130:1026–1037.
Schnute, J. 1981. A versatile growth model with statistically stable
parameters. Can. J. Fish. Aquat. Sci. 38:1128–1140.Simpfendorfer, C. A.
1998. Mortality estimates and demographic analysis for the Australian sharpnose shark, Rhizoprionodon tay-lori, from northern Australia. Fish Bull. 97:978–986.
2005. Demographic models: life tables, matrix models and rebound potential. In Management techniques for elasmobranch fisheries (J. A. Musick and R. Bonfil, eds), p. 143–153. FAO Fisheries Technical Paper No. 474, Rome.
Simpfendorfer, C. A., J. Chidlow, R. McAuley, and P. Unsworth. 2000. Age and growth of the whiskery shark, Furgaleus
macki, from southwestern Australia. Environ. Biol. Fish. 58:335–343.
112 Fishery Bulletin 109(1)
Smale, M. J., and A. J. Goosen. 1999. Reproduction and feeding of the spotted gully shark ,
Triakis megalopterus, off the Eastern Cape, South Africa. Fish. Bull. 97:987–998.
Smith, S. E. 1984. Timing of vertebral-band deposition in tetracy-
cline-injected leopard sharks. Trans. Am. Fish. Soc. 113:308–313.
Smith, S. E., and N. J. Abramson. 1990. Leopard shark Triakis semifasciata distribution,
mortality rate, yield, and stock replenishment estimates based on a tagging study in San Francisco Bay. Fish. Bull. 88:371–381.
Smith, S. E., R. A. Mitchell, and D. Fuller. 2003. Age-validation of a leopard shark (Triakis semifas-
ciata) recaptured after 20 years. Fish. Bull. 101:194–198.
Tanaka, S. 1990. Age and growth studies on the calcified structures
of newborn sharks in the laboratory aquaria using tetracycline. In Elasmobranchs as living resources: advances in the biology, ecology, systematics, and the status of the fisheries (H. L. Pratt, S. H. Gruber, and T. Taniuch, eds.), p. 189–202. U.S. Dep. Commer. NOAA Tech. Rep. 90.
Walker, T. I. 1992. Fishery simulation model for sharks applied to
the gummy shark, Mustelus antarcticus Günther, from southern Australian waters. Aust. J. Freshw. Res. 43:195–212.
Yudin, K. G., and G. M. Cailliet. 1990. Age and growth of the gray smoothhound, Mustelus
californicus, and the brown smoothhound, M. henlei, sharks from central California. Copeia 1990:191–204.
Recommended