1
ADDITIONAL POINTS TO ADDRESSPROGRAMME 6 : PROGRAMMES
AND PROJECTSDr W Barnard
Deputy Director General29 October 2013
PROGRAMMES AND PROJECTS
2
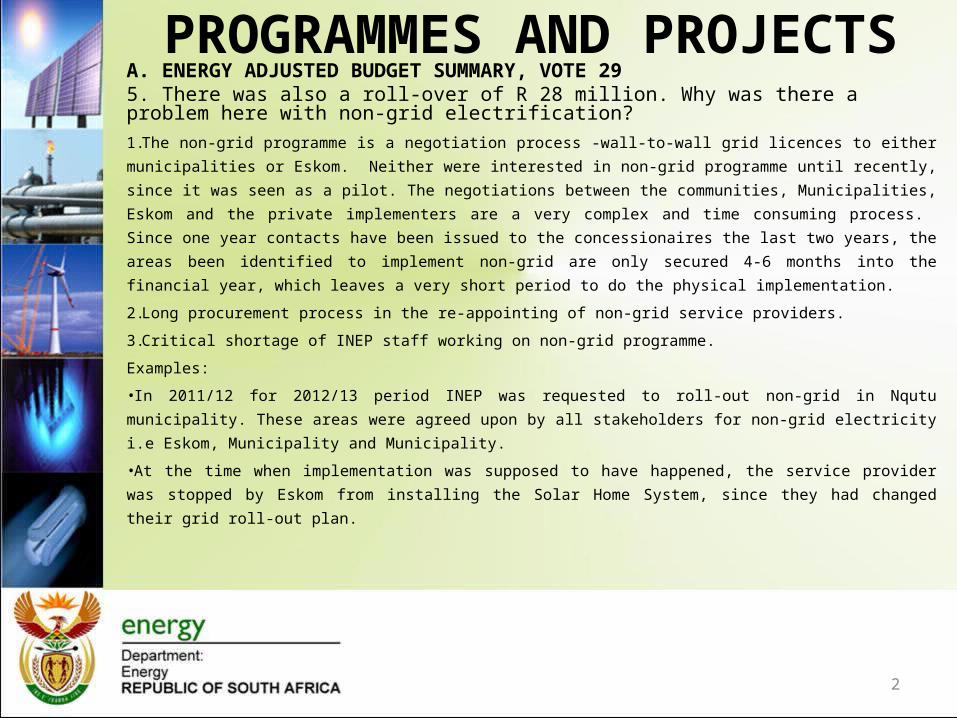
A. ENERGY ADJUSTED BUDGET SUMMARY, VOTE 295. There was also a roll-over of R 28 million. Why was there a problem here with non-grid electrification?
1.The non-grid programme is a negotiation process -wall-to-wall grid licences to either municipalities or
Eskom. Neither were interested in non-grid programme until recently, since it was seen as a pilot. The
negotiations between the communities, Municipalities, Eskom and the private implementers are a very
complex and time consuming process. Since one year contacts have been issued to the
concessionaires the last two years, the areas been identified to implement non-grid are only secured
4-6 months into the financial year, which leaves a very short period to do the physical implementation.
2.Long procurement process in the re-appointing of non-grid service providers.
3.Critical shortage of INEP staff working on non-grid programme.
Examples:
•In 2011/12 for 2012/13 period INEP was requested to roll-out non-grid in Nqutu municipality. These
areas were agreed upon by all stakeholders for non-grid electricity i.e Eskom, Municipality and
Municipality.
•At the time when implementation was supposed to have happened, the service provider was stopped
by Eskom from installing the Solar Home System, since they had changed their grid roll-out plan.
PROGRAMMES AND PROJECTS (cont.)
3
5. There was also a roll-over of R 28 million. Why was there a problem here with non-grid electrification? (cont.)•DOE had to find an alternative area to roll-out the non-grid allocations in order to honour our
contractual obligation with the service provider. Okhahlamba Municipality was interested and the
whole negotiation process had to be started all over again.
•By the time this process was finalised it was near the end of the financial year 2012/13 and the
service provider was only then able to order material which also had some kind of delay to be
delivered.
•The project is continuing well in Okhahlamba and will be completed in January 2014
•An additional challenge was that the contracts of the non-grid service providers expired at the
end of November 2012. The process to extend their contract was only concluded in January
2013, making it difficult to organize themselves to complete some of the connections in time.
•The New Household Electrification strategy was not been approved at the time the non-grid
contacts expired, hence no clear strategy exist regarding the non-grid programme. As a result
the last two years DOE had to go through a procurement process to procure the non-grid service
providers. This process also added to the time delay before the non-grid projects could been roll-
out, since the BAC needed more information in terms of the contract extension, as well as legal
advise on the long history the Department had with the non-grid service providers concerned.
PROGRAMMES AND PROJECTS (cont.)
4
A. ENERGY ADJUSTED BUDGET SUMMARY, VOTE 297.1. The DoE is also to give reasons for underperformance as declared in the “mid-year performance status”. Here focus on
– Electrification and energy programme management
Response•The achievements for Q2 of Programme 6 is as follows:
– 10 quarterly targets been achieved– 5 partially achieved and – 2 not achieved.
•A total of 92 085 connections have already been completed, which is about 21 000 more than has been achieved in Q2 of last year.•Q2 is only the first quarter of the municipal programme.•The first few months is always the ‘slow’ period and the majority of connection are completed in the latter part of Q3 and in Q4.•The performance is a vast improvement on the similar quarter last year, when the Branch was just been established.
PROGRAMMES AND PROJECTS (cont.)
5
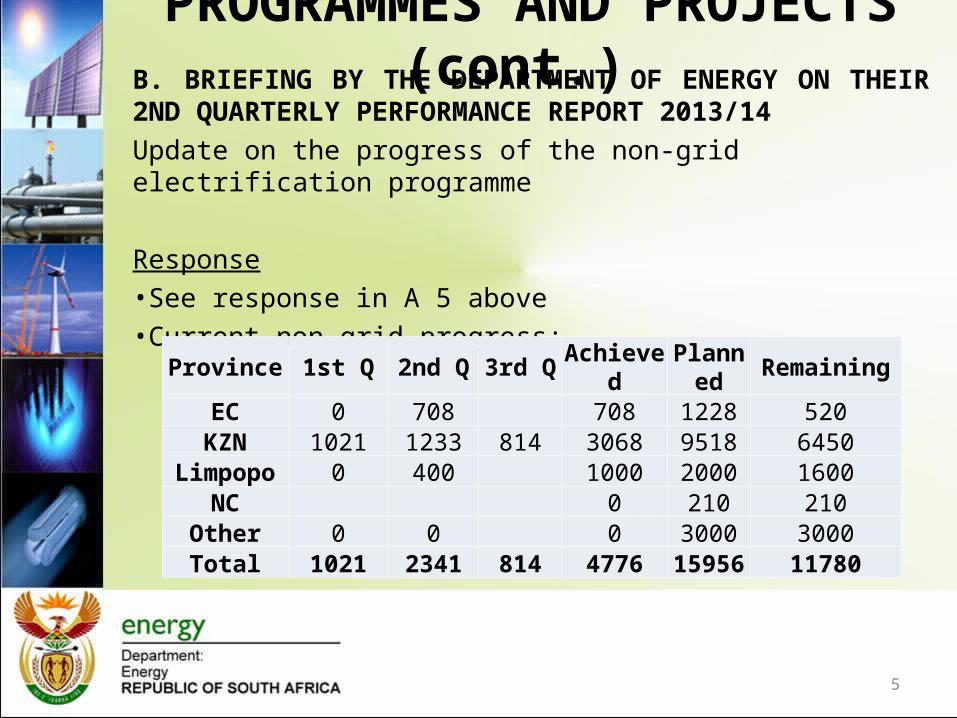
B. BRIEFING BY THE DEPARTMENT OF ENERGY ON THEIR 2ND QUARTERLY PERFORMANCE REPORT 2013/14
Update on the progress of the non-grid electrification programme
Response •See response in A 5 above•Current non-grid progress:
Province 1st Q 2nd Q 3rd Q Achieved Planned RemainingEC 0 708 708 1228 520
KZN 1021 1233 814 3068 9518 6450Limpopo 0 400 1000 2000 1600
NC 0 210 210Other 0 0 0 3000 3000Total 1021 2341 814 4776 15956 11780
PROGRAMMES AND PROJECTS (cont.)
6
B. BRIEFING BY THE DEPARTMENT OF ENERGY ON THEIR 2ND QUARTERLY PERFORMANCE REPORT 2013/14
Under programme 6: Programmes and Projects, the DoE reported that six out of the nine planned targets were not achieved. How is this being addressed in the current financial year to ensure there is no repeat of this situation?
Response•See comments under 7.1 above.•The achievements for Q2 of Programme 6 is as follows:
– 10 quarterly targets been achieved
– 5 partially achieved and – 2 not achieved.
PROGRAMMES AND PROJECTS (cont.)
7
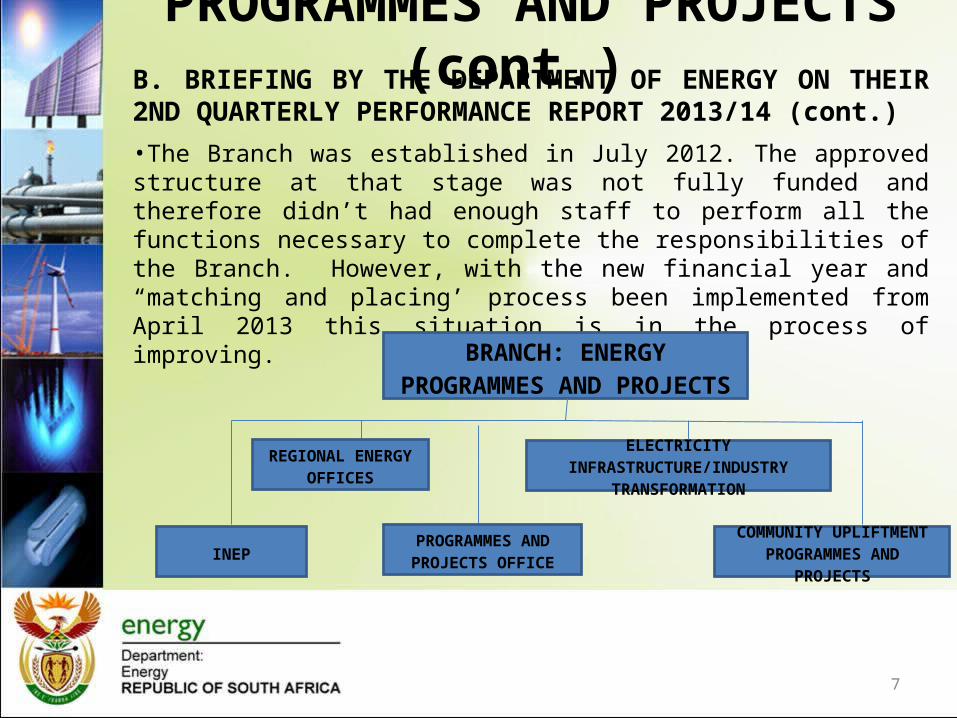
B. BRIEFING BY THE DEPARTMENT OF ENERGY ON THEIR 2ND QUARTERLY PERFORMANCE REPORT 2013/14 (cont.)
•The Branch was established in July 2012. The approved structure at that stage was not fully funded and therefore didn’t had enough staff to perform all the functions necessary to complete the responsibilities of the Branch. However, with the new financial year and “matching and placing’ process been implemented from April 2013 this situation is in the process of improving.
BRANCH: ENERGY PROGRAMMES AND PROJECTS
INEP
REGIONAL ENERGY OFFICES
COMMUNITY UPLIFTMENT PROGRAMMES AND PROJECTS
ELECTRICITY INFRASTRUCTURE/INDUSTRY TRANSFORMATION
PROGRAMMES AND PROJECTS OFFICE
PROGRAMMES AND PROJECTS (cont.)
8
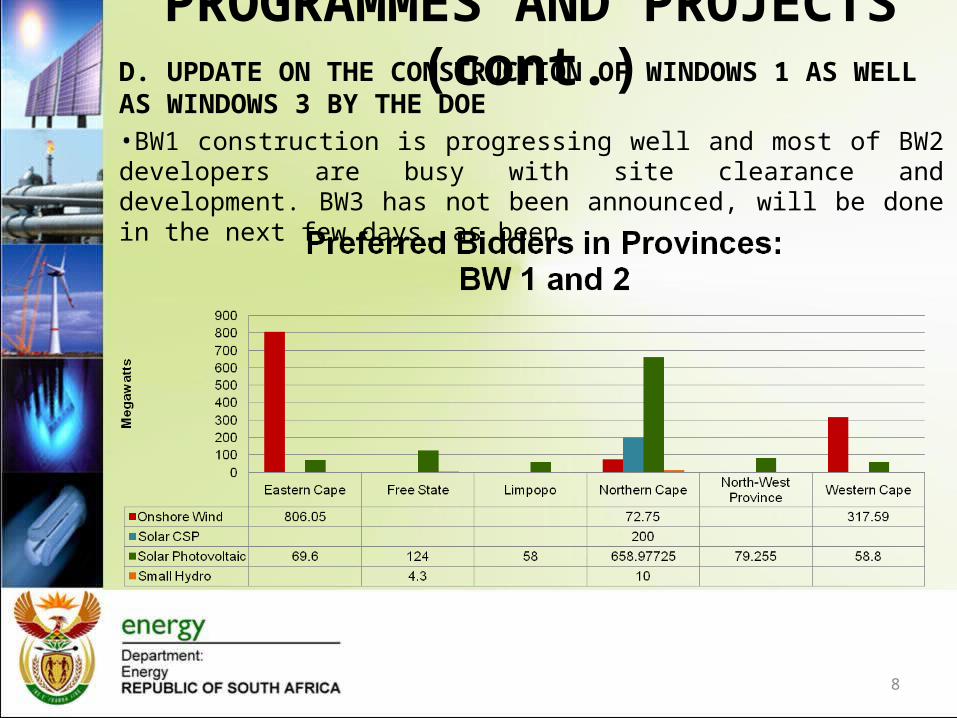
D. UPDATE ON THE CONSTRUCTION OF WINDOWS 1 AS WELL AS WINDOWS 3 BY THE DOE•BW1 construction is progressing well and most of BW2 developers are busy with site clearance and development. BW3 has not been announced, will be done in the next few days. as been
Slide 9
PROGRAMMES AND PROJECTS (cont.)
10
C. BRIEFING ON THE PILOT PROJECT ON ADAM BY THE DOE, SALGA, FFC AND MISA
Response
Briefing on Mini ADAM programme will be made to this Committee on 1 November.
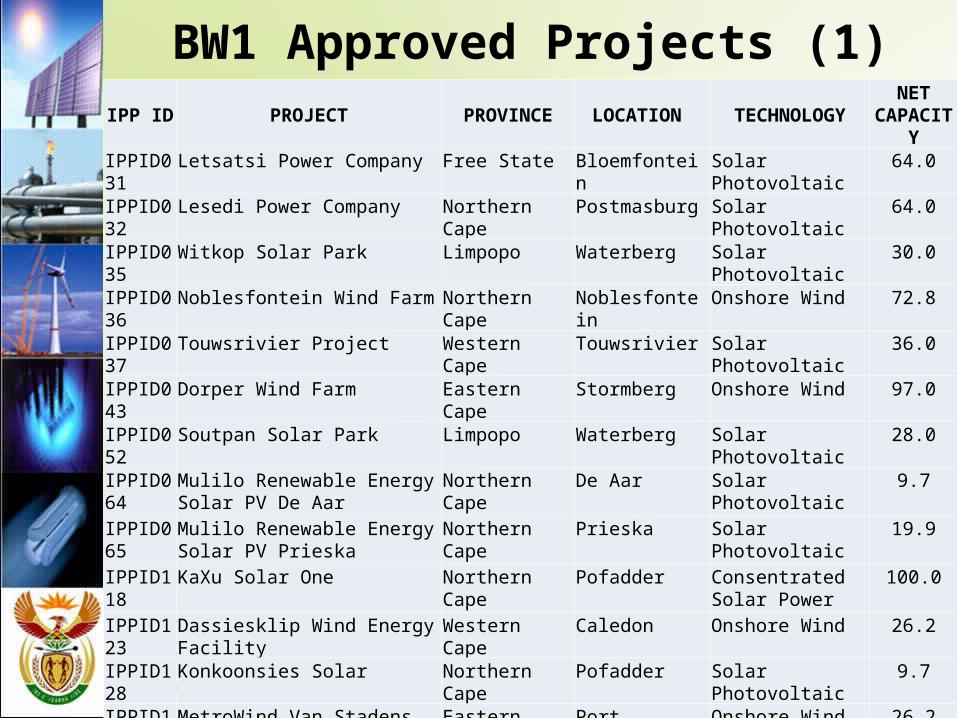
BW1 Approved Projects (1)
Slide 11
IPP ID PROJECT PROVINCE LOCATION TECHNOLOGY NET CAPACITY
IPPID031 Letsatsi Power Company Free State Bloemfontein Solar Photovoltaic 64.0
IPPID032 Lesedi Power Company Northern Cape Postmasburg Solar Photovoltaic 64.0
IPPID035 Witkop Solar Park Limpopo Waterberg Solar Photovoltaic 30.0
IPPID036 Noblesfontein Wind Farm Northern Cape Noblesfontein Onshore Wind 72.8
IPPID037 Touwsrivier Project Western Cape Touwsrivier Solar Photovoltaic 36.0
IPPID043 Dorper Wind Farm Eastern Cape Stormberg Onshore Wind 97.0
IPPID052 Soutpan Solar Park Limpopo Waterberg Solar Photovoltaic 28.0
IPPID064 Mulilo Renewable Energy Solar PV De Aar
Northern Cape De Aar Solar Photovoltaic 9.7
IPPID065 Mulilo Renewable Energy Solar PV Prieska
Northern Cape Prieska Solar Photovoltaic 19.9
IPPID118 KaXu Solar One Northern Cape Pofadder Consentrated Solar Power
100.0
IPPID123 Dassiesklip Wind Energy Facility Western Cape Caledon Onshore Wind 26.2
IPPID128 Konkoonsies Solar Northern Cape Pofadder Solar Photovoltaic 9.7
IPPID138 MetroWind Van Stadens Wind Farm
Eastern Cape Port Elizabeth Onshore Wind 26.2
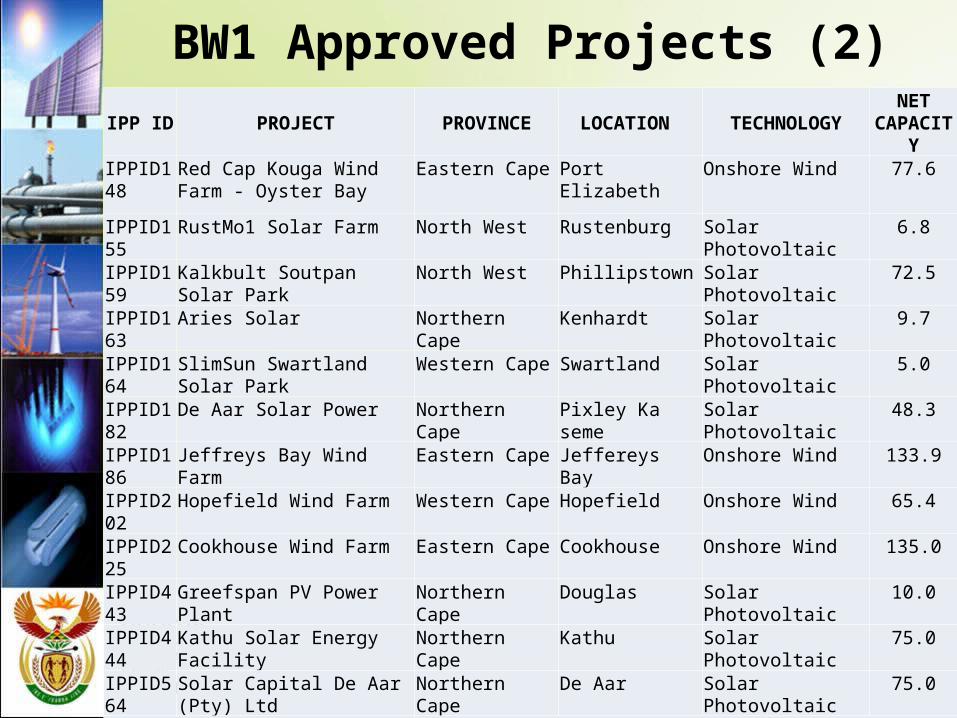
BW1 Approved Projects (2)
Slide 12
IPP ID PROJECT PROVINCE LOCATION TECHNOLOGY NET CAPACITY
IPPID148 Red Cap Kouga Wind Farm - Oyster Bay
Eastern Cape Port Elizabeth Onshore Wind 77.6
IPPID155 RustMo1 Solar Farm North West Rustenburg Solar Photovoltaic 6.8
IPPID159 Kalkbult Soutpan Solar Park North West Phillipstown Solar Photovoltaic 72.5
IPPID163 Aries Solar Northern Cape Kenhardt Solar Photovoltaic 9.7
IPPID164 SlimSun Swartland Solar Park Western Cape Swartland Solar Photovoltaic 5.0
IPPID182 De Aar Solar Power Northern Cape Pixley Ka seme Solar Photovoltaic 48.3
IPPID186 Jeffreys Bay Wind Farm Eastern Cape Jeffereys Bay Onshore Wind 133.9
IPPID202 Hopefield Wind Farm Western Cape Hopefield Onshore Wind 65.4
IPPID225 Cookhouse Wind Farm Eastern Cape Cookhouse Onshore Wind 135.0
IPPID443 Greefspan PV Power Plant Northern Cape Douglas Solar Photovoltaic 10.0
IPPID444 Kathu Solar Energy Facility Northern Cape Kathu Solar Photovoltaic 75.0
IPPID564 Solar Capital De Aar (Pty) Ltd Northern Cape De Aar Solar Photovoltaic 75.0
IPPID572 Droogfontein Solar Power Northern Cape Kimberley Solar Photovoltaic 48.3
IPPID696 Herbert PV Power Plant Northern Cape Douglas Solar Photovoltaic 19.9
IPPID798 Khi Solar One Northern Cape Upington Consentrated Solar Power
50.0
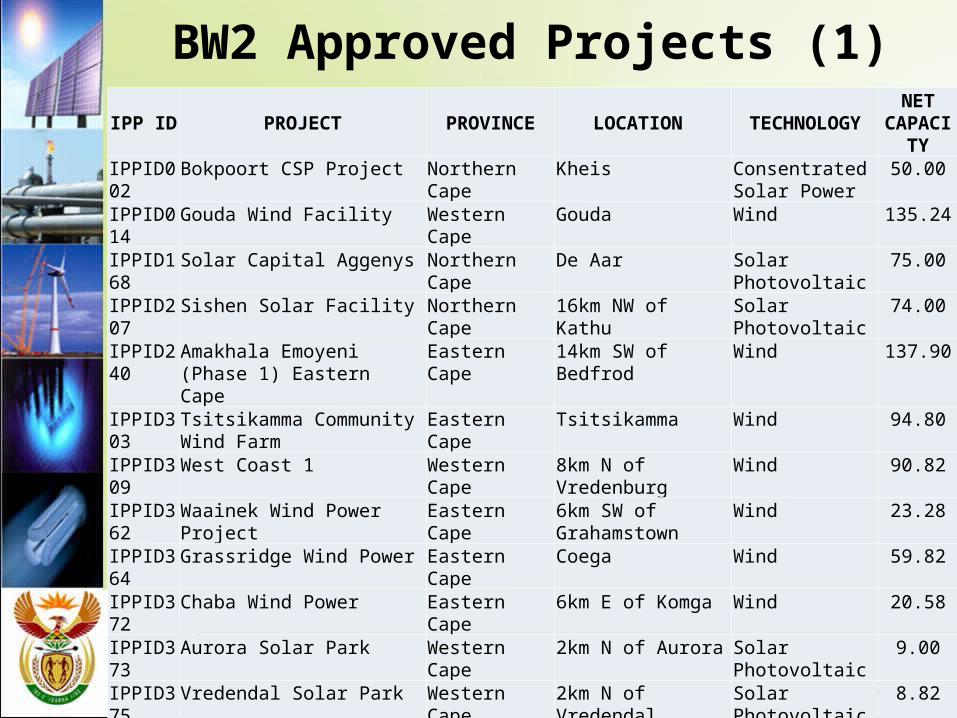
BW2 Approved Projects (1)
Slide 13
IPP ID PROJECT PROVINCE LOCATION TECHNOLOGY NET CAPACITY
IPPID002 Bokpoort CSP Project Northern Cape Kheis Consentrated Solar Power
50.00
IPPID014 Gouda Wind Facility Western Cape Gouda Wind 135.24
IPPID168 Solar Capital Aggenys Northern Cape De Aar Solar Photovoltaic 75.00
IPPID207 Sishen Solar Facility Northern Cape 16km NW of Kathu Solar Photovoltaic 74.00
IPPID240 Amakhala Emoyeni (Phase 1) Eastern Cape
Eastern Cape 14km SW of Bedfrod Wind 137.90
IPPID303 Tsitsikamma Community Wind Farm
Eastern Cape Tsitsikamma Wind 94.80
IPPID309West Coast 1 Western Cape 8km N of Vredenburg Wind 90.82
IPPID362Waainek Wind Power Project Eastern Cape 6km SW of Grahamstown
Wind 23.28
IPPID364 Grassridge Wind Power Eastern Cape Coega Wind 59.82
IPPID372 Chaba Wind Power Eastern Cape 6km E of Komga Wind 20.58
IPPID373 Aurora Solar Park Western Cape 2km N of Aurora Solar Photovoltaic 9.00
IPPID375 Vredendal Solar Park Western Cape 2km N of Vredendal Solar Photovoltaic 8.82
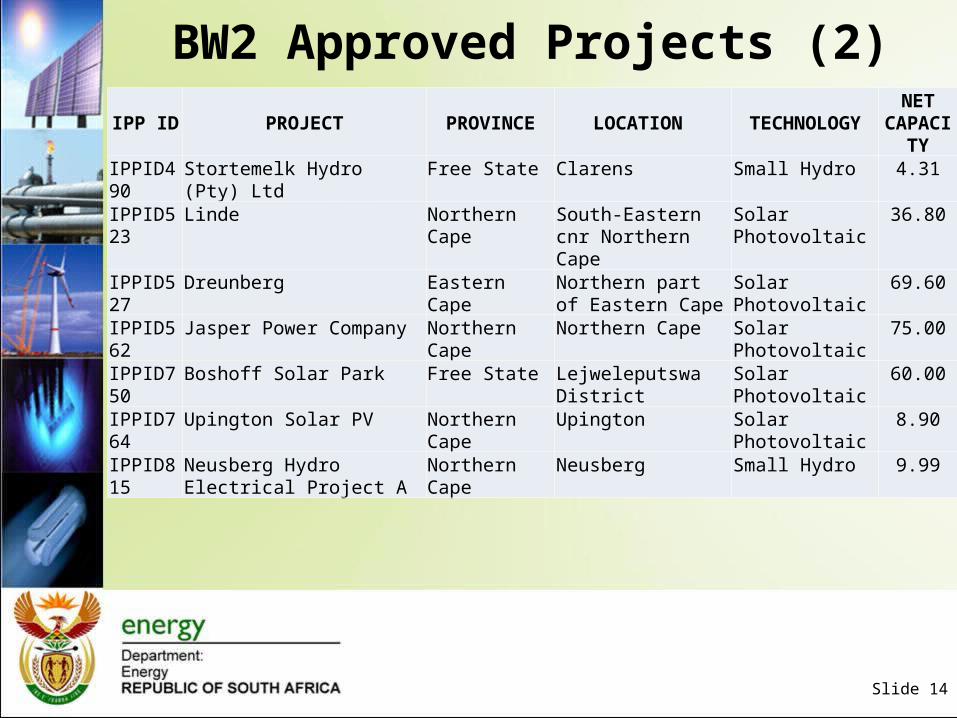
BW2 Approved Projects (2)
Slide 14
IPP ID PROJECT PROVINCE LOCATION TECHNOLOGY NET CAPACITY
IPPID490 Stortemelk Hydro (Pty) Ltd Free State Clarens Small Hydro 4.31
IPPID523 Linde Northern Cape South-Eastern cnr Northern Cape
Solar Photovoltaic 36.80
IPPID527 Dreunberg Eastern Cape Northern part of Eastern Cape
Solar Photovoltaic 69.60
IPPID562 Jasper Power Company Northern Cape Northern Cape Solar Photovoltaic 75.00
IPPID750 Boshoff Solar Park Free State Lejweleputswa District Solar Photovoltaic 60.00
IPPID764 Upington Solar PV Northern Cape Upington Solar Photovoltaic 8.90
IPPID815 Neusberg Hydro Electrical Project A
Northern Cape Neusberg Small Hydro 9.99
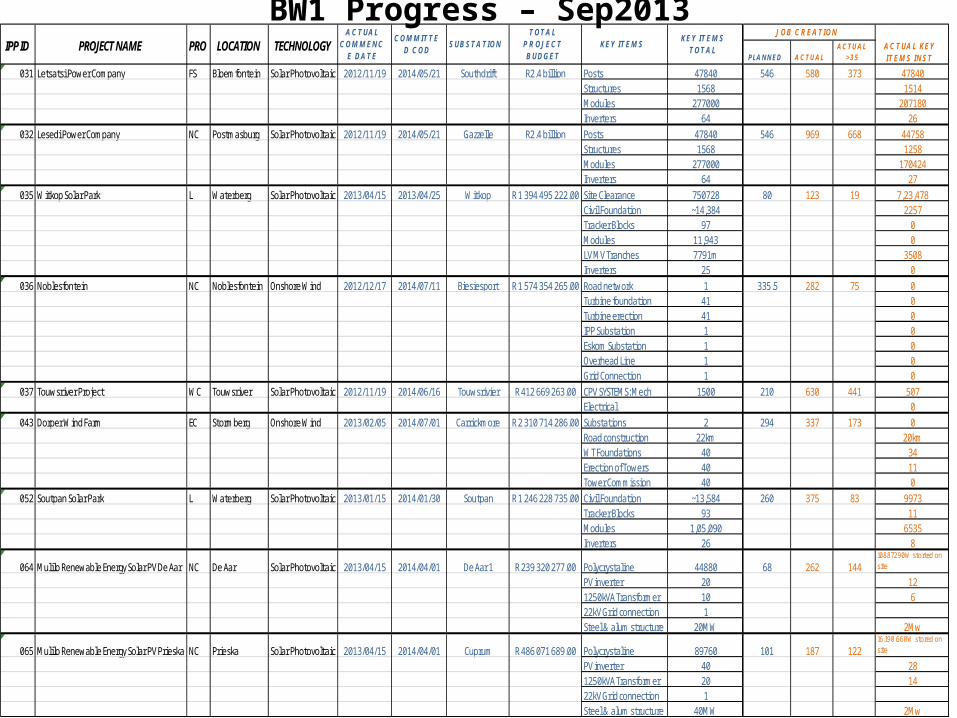
BW1 Progress – Sep2013PLANNED ACTUAL
ACTUAL >35
031 Letsatsi Power Company FS Bloemfontein Solar Photovoltaic 2012/11/19 2014/05/21 Southdrift R2.4 billion Posts 47840 546 580 373 47840Structures 1568 1514Modules 277000 207180Inverters 64 26
032 Lesedi Power Company NC Postmasburg Solar Photovoltaic 2012/11/19 2014/05/21 Gazzelle R2.4 billion Posts 47840 546 969 668 44758Structures 1568 1258Modules 277000 170424Inverters 64 27
035 Witkop Solar Park L Waterberg Solar Photovoltaic 2013/04/15 2013/04/25 Witkop R 1 394 495 222.00 Site Clearance 750728 80 123 19 7,23,478Civil Foundation ~14,384 2257Tracker Blocks 97 0Modules 11,943 0LV MV Tranches 7791m 3508Inverters 25 0
036 Noblesfontein NC Noblesfontein Onshore Wind 2012/12/17 2014/07/11 Biesiesport R 1 574 354 265.00 Road network 1 335.5 282 75 0Turbine foundation 41 0Turbine erection 41 0IPP Substation 1 0Eskom Substation 1 0Overhead Line 1 0Grid Connection 1 0
037 Touwsriver Project WC Touwsriver Solar Photovoltaic 2012/11/19 2014/06/16 Touwsrivier R 412 669 263.00 CPV SYSTEMS: Mech 1500 210 630 441 507Electrical 0
043 Dorper Wind Farm EC Stormberg Onshore Wind 2013/02/05 2014/07/01 Carrickmore R 2 310 714 286.00 Substations 2 294 337 173 0Road construction 22km 20kmWT Foundations 40 34Erection of Towers 40 11Tower Commission 40 0
052 Soutpan Solar Park L Waterberg Solar Photovoltaic 2013/01/15 2014/01/30 Soutpan R 1 246 228 735.00 Civil Foundation ~13,584 260 375 83 9973Tracker Blocks 93 11Modules 1,05,090 6535Inverters 26 8
064 Mulilo Renewable Energy Solar PV De Aar NC De Aar Solar Photovoltaic 2013/04/15 2014/04/01 De Aar 1 R 239 320 277.00 Polycrystaline 44880 68 262 14410887290W storted on site
PV inverter 20 121250kVA Transformer 10 622kV Grid connection 1Steel & alum structure 20MW 2Mw
065 Mulilo Renewable Energy Solar PV Prieska NC Prieska Solar Photovoltaic 2013/04/15 2014/04/01 Cuprum R 486 071 689.00 Polycrystaline 89760 101 187 12216.190.660W stored on site
PV inverter 40 281250kVA Transformer 20 1422kV Grid connection 1Steel & alum structure 40MW 2Mw
LOCATIONPRO KEY ITEMS TOTAL
KEY ITEMSSUBSTATIONIPP ID COMMITTED COD
ACTUAL COMMENC
E DATETECHNOLOGYPROJECT NAME
J OB CREATION
ACTUAL KEY ITEMS INST
TOTAL PROJ ECT BUDGET
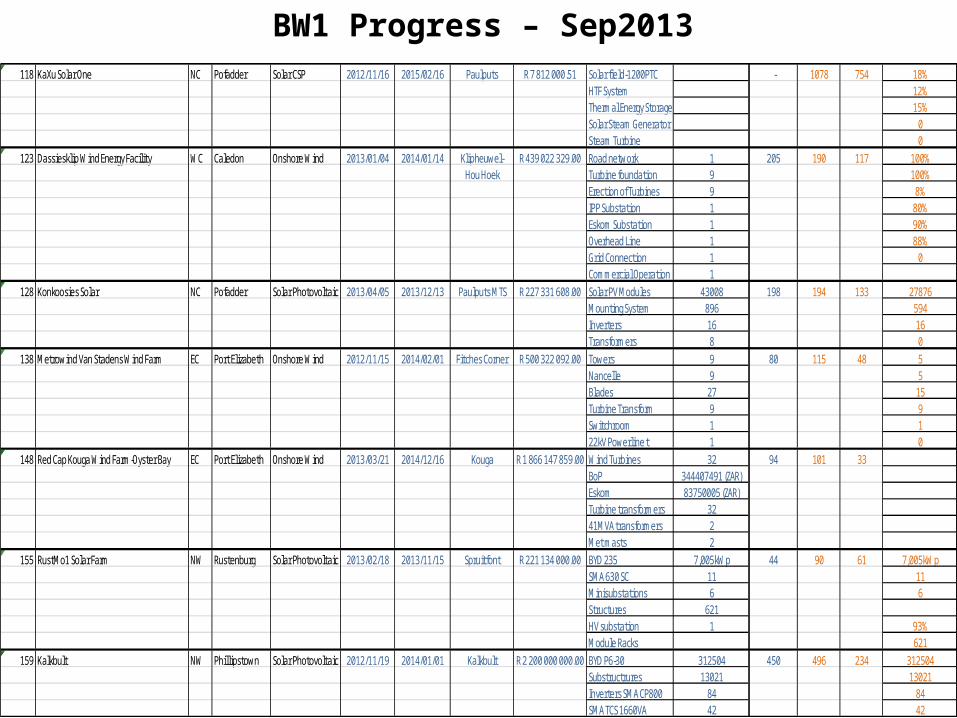
BW1 Progress – Sep2013118 KaXu Solar One NC Pofadder Solar CSP 2012/11/16 2015/02/16 Paulputs R 7 812 000.51 Solar field-1200PTC - 1078 754 18%
HTF System 12%Thermal Energy Storage 15%Solar Steam Generator 0Steam Turbine 0
123 Dassiesklip Wind Energy Facility WC Caledon Onshore Wind 2013/01/04 2014/01/14 Klipheuwel- R 439 022 329.00 Road network 1 205 190 117 100%Hou Hoek Turbine foundation 9 100%
Erection of Turbines 9 8%IPP Substation 1 80%Eskom Substation 1 90%Overhead Line 1 88%Grid Connection 1 0Commercial Operation 1
128 Konkoosies Solar NC Pofadder Solar Photovoltaic 2013/04/05 2013/12/13 Paulputs MTS R 227 331 608.00 Solar PV Modules 43008 198 194 133 27876Mounting System 896 594Inverters 16 16Transformers 8 0
138 Metrowind Van Stadens Wind Farm EC Port Elizabeth Onshore Wind 2012/11/15 2014/02/01 Fitches Corner R 500 322 092.00 Towers 9 80 115 48 5Nancelle 9 5Blades 27 15Turbine Transform 9 9Switchroom 1 122kV Powerline t 1 0
148 Red Cap Kouga Wind Farm-Oyster Bay EC Port Elizabeth Onshore Wind 2013/03/21 2014/12/16 Kouga R 1 866 147 859.00 Wind Turbines 32 94 101 33BoP 344407491 (ZAR)Eskom 83750005 (ZAR)Turbine transformers 3241MVA transformers 2Met masts 2
155 RustMo1 Solar Farm NW Rustenburg Solar Photovoltaic 2013/02/18 2013/11/15 Spruitfont R 221 134 000.00 BYD 235 7,005kWp 44 90 61 7,005kWpSMA 630 SC 11 11Minisubstations 6 6Structures 621HV substation 1 93%Module Racks 621
159 Kalkbult NW Phillipstown Solar Photovoltaic 2012/11/19 2014/01/01 Kalkbult R 2 200 000 000.00 BYD P6-30 312504 450 496 234 312504Substructrures 13021 13021Inverters SMA CP800 84 84SMA TCS 1660VA 42 42
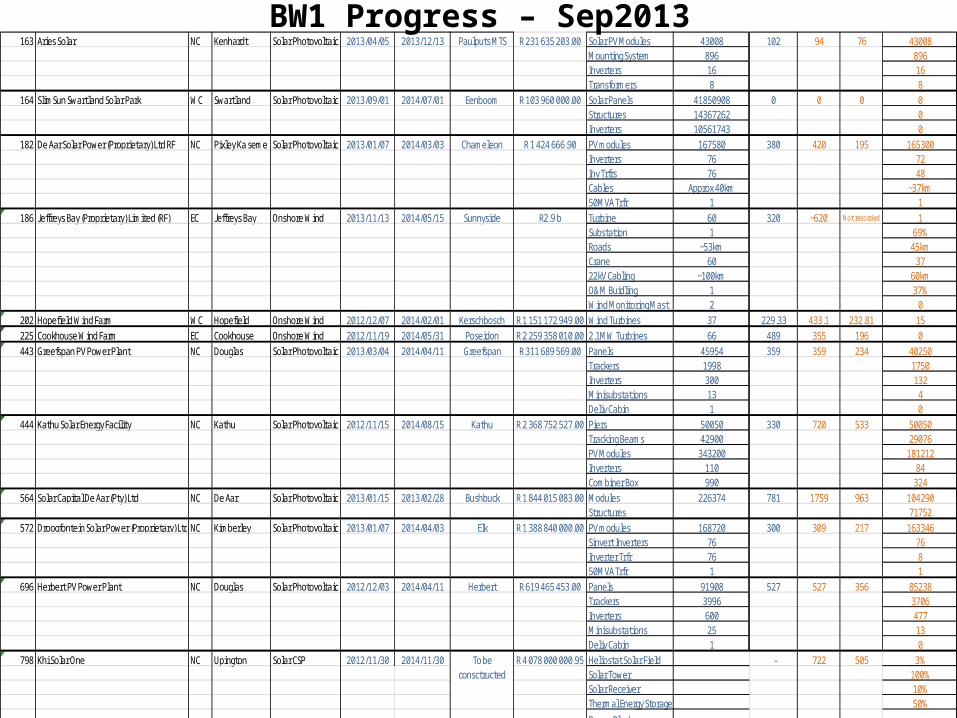
BW1 Progress – Sep2013163 Aries Solar NC Kenhardt Solar Photovoltaic 2013/04/05 2013/12/13 Paulputs MTS R 231 635 203.00 Solar PV Modules 43008 102 94 76 43008
Mounting System 896 896Inverters 16 16Transformers 8 8
164 SlimSun Swartland Solar Park WC Swartland Solar Photovoltaic 2013/09/01 2014/07/01 Eenboom R 103 960 000.00 Solar Panels 41850908 0 0 0 0Structures 14367262 0Inverters 10561743 0
182 De Aar Solar Power (Proprietary) Ltd RF NC Pixley Ka seme Solar Photovoltaic 2013/01/07 2014/03/03 Chameleon R 1 424 666.90 PV modules 167580 380 420 195 165300Inverters 76 72Inv Trfrs 76 48Cables Approx 40km ~37km50MVA Trfr 1 1
186 Jeffreys Bay (Proprietary) Limited (RF) EC Jeffreys Bay Onshore Wind 2013/11/13 2014/05/15 Sunnyside R2.9 b Turbine 60 320 ~620 Not recorded 1Substation 1 69%Roads ~53km 45kmCrane 60 3722kV Cabling ~100km 60kmO&M Buidling 1 37%Wind Monitoring Mast 2 0
202 Hopefield Wind Farm WC Hopefield Onshore Wind 2012/12/07 2014/02/01 Kerschbosch R 1 151 172 949.00 Wind Turbines 37 229.33 433.1 232.81 15225 Cookhouse Wind Farm EC Cookhouse Onshore Wind 2012/11/19 2014/05/31 Poseidon R 2 259 358 010.00 2.1MW Turbines 66 489 355 196 0443 Greefspan PV Power Plant NC Douglas Solar Photovoltaic 2013/03/04 2014/04/11 Greefspan R 311 689 569.00 Panels 45954 359 359 234 40250
Trackers 1998 1750Inverters 300 132Minisubstations 13 4Deliv Cabin 1 0
444 Kathu Solar Energy Facility NC Kathu Solar Photovoltaic 2012/11/15 2014/08/15 Kathu R 2 368 752 527.00 Piers 50050 330 720 533 50050Tracking Beams 42900 29076PV Modules 343200 181212Inverters 110 84Combiner Box 990 324
564 Solar Capital De Aar (Pty) Ltd NC De Aar Solar Photovoltaic 2013/01/15 2013/02/28 Bushbuck R 1 844 015 083.00 Modules 226374 781 1759 963 104290Structures 71752
572 Droogfontein Solar Power (Proprietary) Ltd (RF)NC Kimberley Solar Photovoltaic 2013/01/07 2014/04/03 Elk R 1 388 840 000.00 PV modules 168720 300 309 217 163346Sinvert Inverters 76 76Inverter Trfr 76 850MVA Trfr 1 1
696 Herbert PV Power Plant NC Douglas Solar Photovoltaic 2012/12/03 2014/04/11 Herbert R 619 465 453.00 Panels 91908 527 527 356 85238Trackers 3996 3706Inverters 600 477Minisubstations 25 13Deliv Cabin 1 0
798 Khi Solar One NC Upington Solar CSP 2012/11/30 2014/11/30 R 4 078 000 000.95 Heliostat Solar Field - 722 505 3%Solar Tower 100%Solar Receiver 10%Thermal Energy Storage 50%
Power Block
To be consctructed
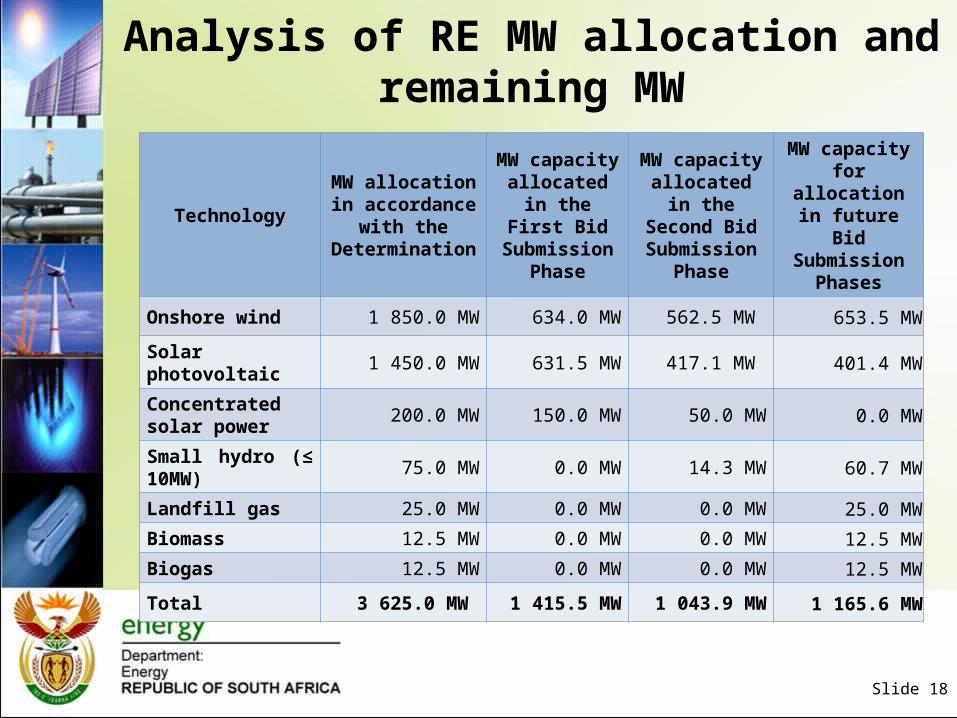
Analysis of RE MW allocation and remaining MW
Slide 18
TechnologyMW allocation in accordance with
the Determination
MW capacity allocated in the
First Bid Submission
Phase
MW capacity allocated in the
Second Bid Submission
Phase
MW capacity for allocation in
future Bid Submission
Phases
Onshore wind 1 850.0 MW 634.0 MW 562.5 MW 653.5 MW
Solar photovoltaic 1 450.0 MW 631.5 MW 417.1 MW 401.4 MW
Concentrated solar power 200.0 MW 150.0 MW 50.0 MW 0.0 MW
Small hydro (≤ 10MW) 75.0 MW 0.0 MW 14.3 MW 60.7 MW
Landfill gas 25.0 MW 0.0 MW 0.0 MW 25.0 MW
Biomass 12.5 MW 0.0 MW 0.0 MW 12.5 MW
Biogas 12.5 MW 0.0 MW 0.0 MW 12.5 MW
Total 3 625.0 MW 1 415.5 MW 1 043.9 MW 1 165.6 MW
BW1 Community Issues
Slide 19
• There seems to have been inadequate consultation with some local municipalities regarding the bidding process, bidding criteria and the scope of the IPP projects.
• There are challenges in managing expectations of local municipalities and communities. IPPs have to implement relevant SED/ED programs in the communities. More awareness/education at municipal/community level is required.
• The SED programmes to start during operation phase, not construction phase.• There is a need for an engagement and communication between different
government departments and municipalities to clarify roles. Communications from national to province to municipal are lacking.
• The biggest challenge the project managers are facing is the non-responsiveness from responsible municipal departments in certain municipalities.
• Some IPPs have alleged incidences of destructive and inappropriate interference at the local government level, which may hinder project completion.
• Emergency response infrastructure and resources appear inadequate in most far-flung municipalities.
• There is at times an impasse on hiring of labour between the municipality and the developers. The labour broker issue, if not handled properly could be problematic.
• Labour rates sometimes differ for different disciplines in the same area resulting in discontent among workers, which could lead to unwanted industrial action.
BW1 Community Recommendations
Slide 20
• The IPPs should ensure that they engage municipalities and most specifically the LED officials.
• IPPs should try as far and possible to ensure that SED is sustainable (as opposed to being a tick box exercise to achieve a target) in the locality of their project and that expectations are sufficiently managed.
• IPPs need to ensure that through their processes they source as much as possible locally and more specifically in the locale of the project. This should not only be limited to labour but also services that are necessary for project development and maintenance.
• IPPs must ensure that local people are part of skills development and there is a skills transfer process to enable locals to participate in the process rather than bringing in all skilled workers from outside South Africa.
• Clearer guidelines with respect to local content and local content targets. Should also consider the introduction of more specific local content targets related to the local manufacturing of components, particularly associated with solar PV, solar CSP and wind technologies.
• Future bid closure dates should be non-negotiable, as this will provide certainty to foreign and domestic investors, and continuity of renewable energy investments. The certainty so provided will also allow supplier industries to adjust their plans accordingly, as well as facilitate the promotion of localisation and skills development.
Localisation vs. Local Content
Slide 21
• It should be noted that Window 1 and 2 reflect fairly low thresholds for local content based on what the DOE deemed to be achievable during the first phase of the renewable energy construction programme . Thresholds reflect the minimum local content achievable, whilst the targets provide the upper band of what the DOE determined to be achievable.
• Local content as stipulated by the dti should not be confused with localisation. The dti defines local content as “The local content of a product…,is the tender price less the value of imported content, expressed as a percentage.”
• Local content therefore includes services such as consultations and transportation, and is based on percentage of total spend. In many large projects the civil works and rest of plant comprise of a significant percentage of total cost, and thus can be easily used to meet any local content thresholds. This is evident in the Solar and Wind REIPP projects where local content thresholds have been largely met by the civil and rest of plant costs. The impact on local manufacturers of solar and wind components has therefore been limited.
• Localisation however is focused on the development of domestic production capacity and capabilities in order to assemble/produce parts, components and/or finished goods. Not with respect to the local area where the development is taking place.
Local Content Thresholds
Slide 22
Technology
Window 1 Window 2 Window 3
Current
ThresholdTarget
Current
ThresholdTarget
Current
ThresholdTarget
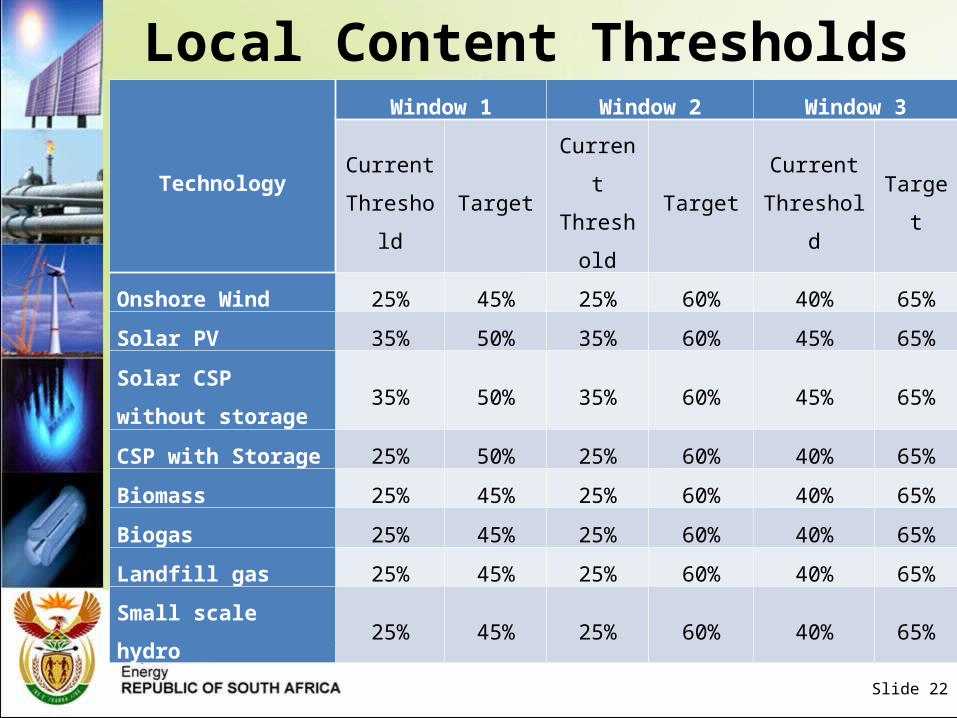
Onshore Wind 25% 45% 25% 60% 40% 65%
Solar PV 35% 50% 35% 60% 45% 65%
Solar CSP without
storage35% 50% 35% 60% 45% 65%
CSP with Storage 25% 50% 25% 60% 40% 65%
Biomass 25% 45% 25% 60% 40% 65%
Biogas 25% 45% 25% 60% 40% 65%
Landfill gas 25% 45% 25% 60% 40% 65%
Small scale hydro 25% 45% 25% 60% 40% 65%
Slide 23
Environmental Impact Assessment - it is the responsibility of the Bidders to conduct Environmental Impact Assessment and the approval thereafter. However, as the department we look at the conditions attached to such Environmental Approval and the impact of such conditions to the RE project. There were number of conditions noted, but did not warrant any concern especially in relation to the preferred bidders. However, it should be noted that as the department we do not have sight of EIA related to Eskom's portion of the projects (building or transmission or distribution connection lines).
Eskom – Is involved in the final evaluation process with regards to grid constrains. No bidders are appointed if there is capacity constrains on the grid, Eskom is required to give confirmation before the appointment. For BW1 the Eskom interconnectivity projects are on track. In the majority of cases the developers are constructing their own sub-stations, but under Eskom’s supervision and standards.
Update on BW 1, BW2 & BW3
What Areas in BW 2& BW3 were improved?
Slide 24
• It is not possible to address in detail at this stage the improvements from BW2 to BW3, but between BW1 and BW2 there already has been improvements with regards to the following:• The IPPs had to provide their Economic Development (ED) plans as
part of their bid submission in BW1. However, in BW2, we have allowed the IPPs to submit their ED plans after Financial Close. These plans also then need to be updated yearly in order to take into account any changes within the community.
• An increase in local content from BW1 to BW2 to BW3• Lessons learnt from site visits for BW1 in dealing with the
community, has helped BW2 approach their communities differently and with more foresight.
• In general for BW3, the prices and the ED offering are much better compared to BW1 and BW2.
Slide 25
Slide 26
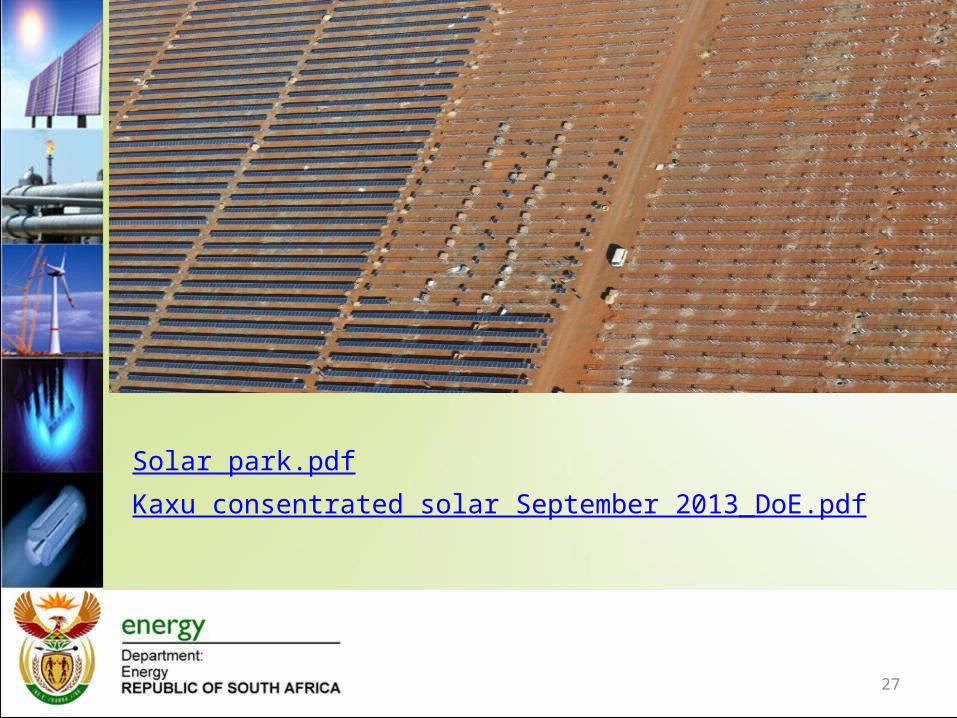
27
Solar park.pdf
Kaxu consentrated solar September 2013_DoE.pdf
Thank you
28
PROGRAMMES AND PROJECTS (cont.)
29
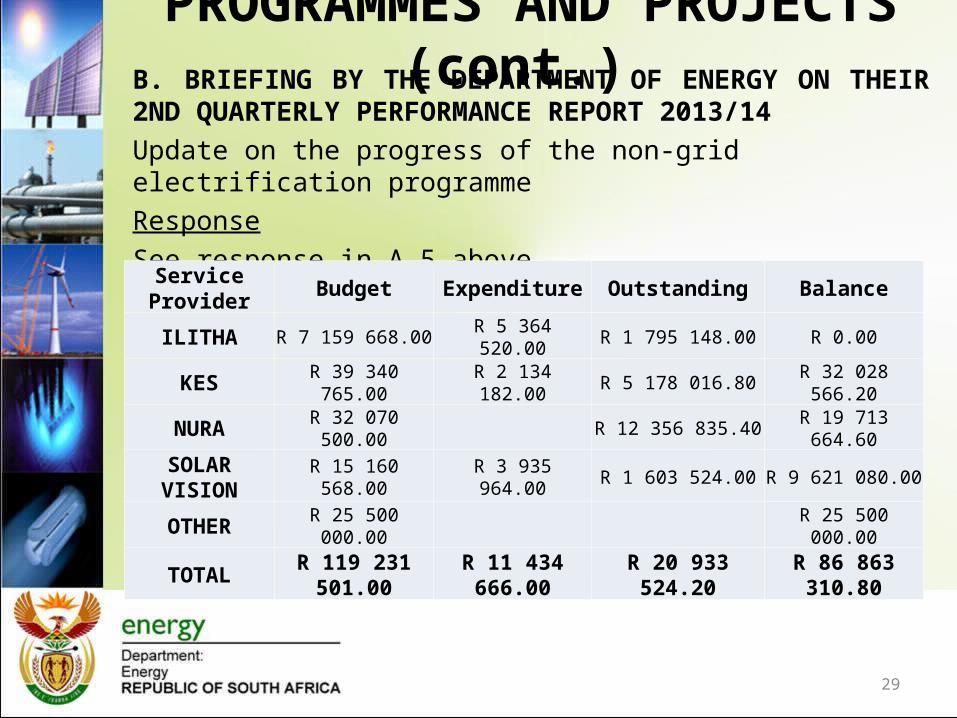
B. BRIEFING BY THE DEPARTMENT OF ENERGY ON THEIR 2ND QUARTERLY PERFORMANCE REPORT 2013/14
Update on the progress of the non-grid electrification programme
Response
See response in A 5 above
Service Provider Budget Expenditure Outstanding Balance
ILITHA R 7 159 668.00 R 5 364 520.00 R 1 795 148.00 R 0.00
KES R 39 340 765.00 R 2 134 182.00 R 5 178 016.80 R 32 028 566.20
NURA R 32 070 500.00 R 12 356 835.40 R 19 713 664.60
SOLAR VISION R 15 160 568.00 R 3 935 964.00 R 1 603 524.00 R 9 621 080.00
OTHER R 25 500 000.00 R 25 500 000.00
TOTAL R 119 231 501.00 R 11 434 666.00 R 20 933 524.20 R 86 863 310.80
Recommended