Advanced System Monitoring
with Nagios, PNP4Nagios and NConf
Josh Malone Systems Administrator
National Radio Astronomy Observatory Charlottesville, VA

is great
It checks your servers
It tells you when there are problems

Services keep expanding…
But…

We work in larger teams
We all want to work on things at the same time

We all want to work on things at the same time
Management demands data

You need the right tools

We Need to Engineer a Monitoring Solution That
Goes to 11!

The Right Addons• PNP4Nagios
• Graph the data from your service checks• https://github.com/lingej/pnp4nagios • https://docs.pnp4nagios.org/pnp-0.6/
6

The Right Addons• PNP4Nagios
• Graph the data from your service checks• https://github.com/lingej/pnp4nagios • https://docs.pnp4nagios.org/pnp-0.6/
6

The Right Addons• PNP4Nagios
• Graph the data from your service checks• https://github.com/lingej/pnp4nagios • https://docs.pnp4nagios.org/pnp-0.6/
6

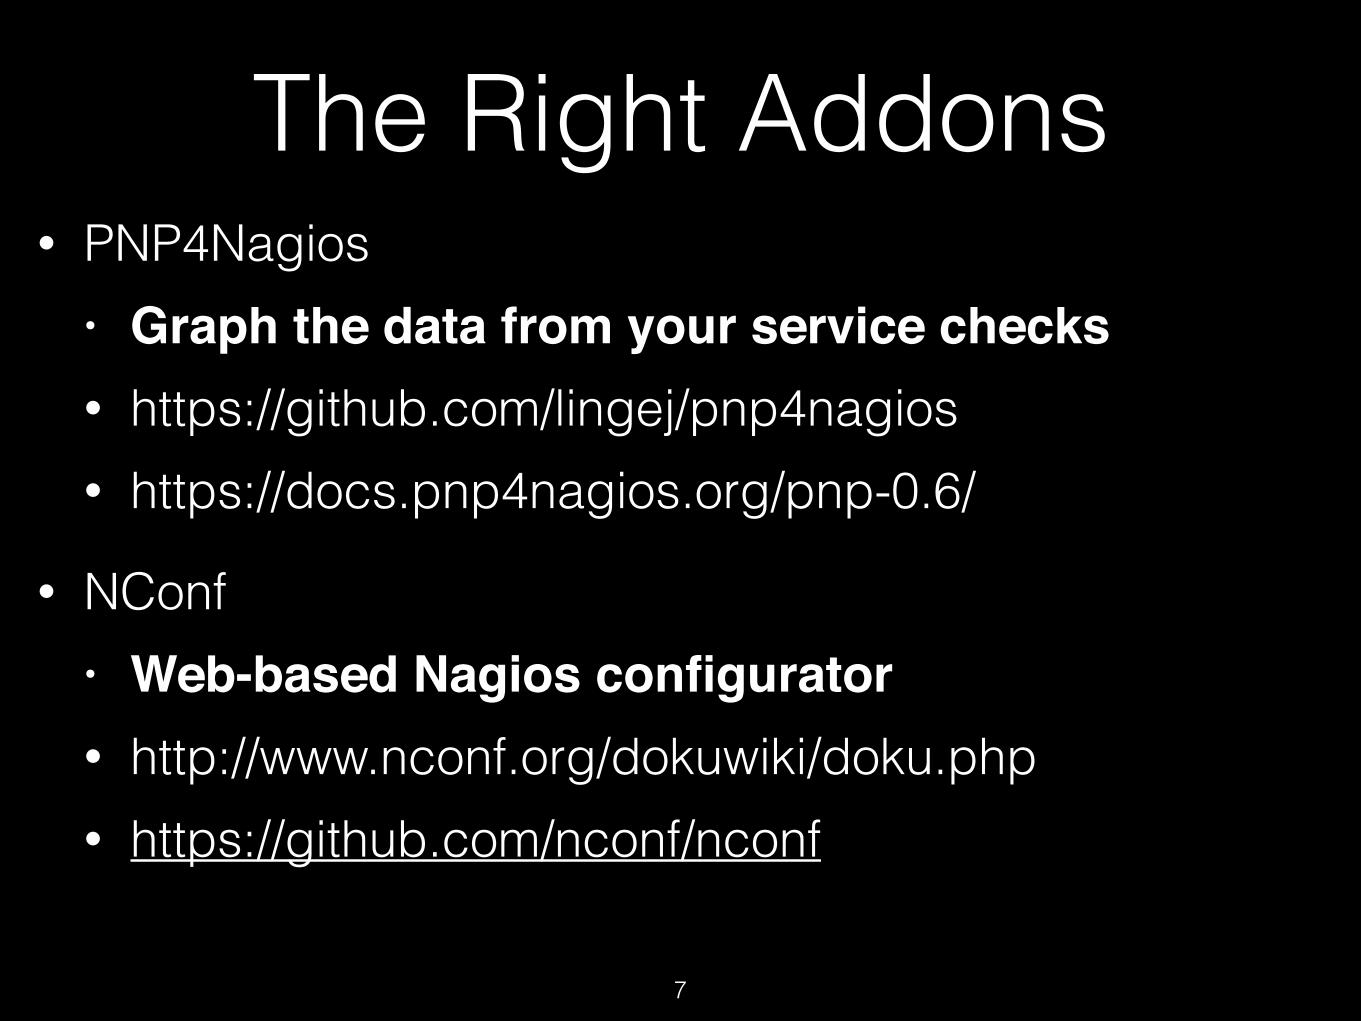
The Right Addons• PNP4Nagios
• Graph the data from your service checks• https://github.com/lingej/pnp4nagios • https://docs.pnp4nagios.org/pnp-0.6/
• NConf • Web-based Nagios configurator• http://www.nconf.org/dokuwiki/doku.php • https://github.com/nconf/nconf
7
The Right Addons• PNP4Nagios
• Graph the data from your service checks• https://github.com/lingej/pnp4nagios • https://docs.pnp4nagios.org/pnp-0.6/
• NConf • Web-based Nagios configurator• http://www.nconf.org/dokuwiki/doku.php • https://github.com/nconf/nconf
7
The Right Addons• PNP4Nagios
• Graph the data from your service checks• https://github.com/lingej/pnp4nagios • https://docs.pnp4nagios.org/pnp-0.6/
• NConf • Web-based Nagios configurator• http://www.nconf.org/dokuwiki/doku.php • https://github.com/nconf/nconf
7

The Right Plugins• Online plugin repositories
• Nagios Exchange • Icinga Exchange • Monitoring Plugins
• But…. if you want something done write • Write it yourself! • …and write it RIGHT!
8

PNP4NagiosPerformance Data + Graphing

Nagios Performance Data• Check plugins can optionally return “performance
data” (‘perfdata’)
• Perfdata is just any metric associated with a check • Response time (seconds, ms) • Web page size (bytes, kb) • Network throughput (bits/sec, kB/sec, mb/s) • Room temperature (F, C)
10

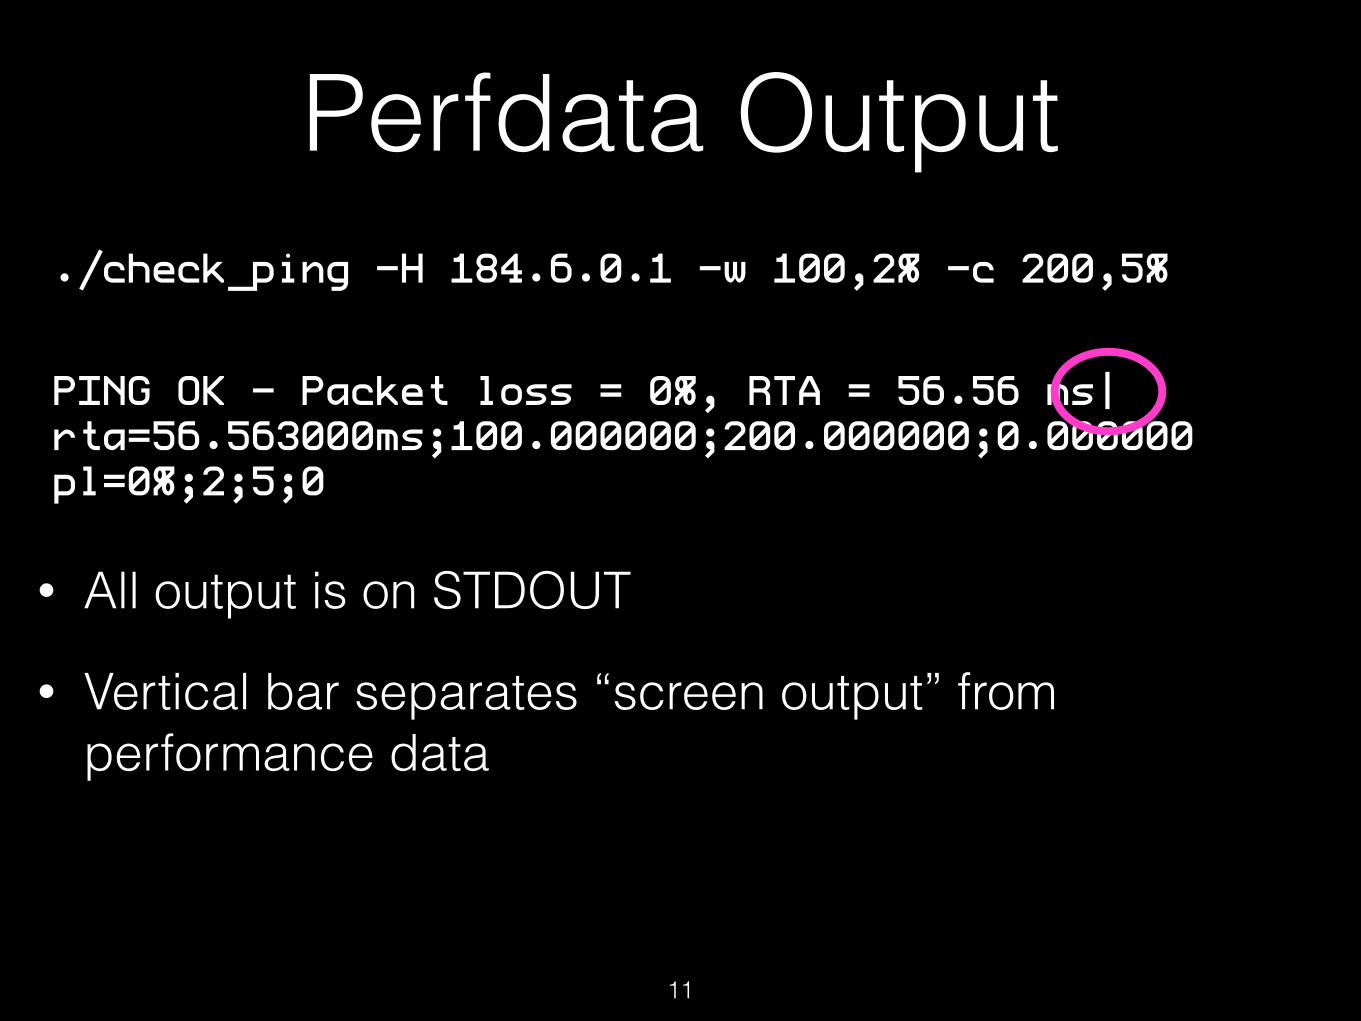
Perfdata Output
• All output is on STDOUT
11
./check_ping -H 184.6.0.1 -w 100,2% -c 200,5%
PING OK - Packet loss = 0%, RTA = 56.56 ms|rta=56.563000ms;100.000000;200.000000;0.000000 pl=0%;2;5;0
Perfdata Output
• All output is on STDOUT
• Vertical bar separates “screen output” from performance data
11
./check_ping -H 184.6.0.1 -w 100,2% -c 200,5%
PING OK - Packet loss = 0%, RTA = 56.56 ms|rta=56.563000ms;100.000000;200.000000;0.000000 pl=0%;2;5;0

12

Support By Plugins• Not all plugins report performance data
• Some plugins require a command-line flag to activate perfdata output
• Some plugins output things that could be perfdata but they do it in the screen output • Wrap these plugins in a script to parse screen
output and reformat it as proper perfdata
13

Performance Data Handling• Nagios does not natively do much with performance
data
• Perfdata must be passed to an add-on for it to be useful
• Nagios comes with sample commands for processing perfdata • process-host-perfdata
• process-service-perfdata
14

Getting Perfdata into PNP• misccommands.cfg - redefine perdata commands define command {
command_name process-service-perfdata
command_line /usr/localł/nagios/libexec/process_perfdata.pl
}
define command {
command_name process-host-perfdata
command_line /usr/localł/nagios/libexec/process_perfdata.pl -d HOSTPERFDATA
}
15

Understanding RRDs• RRD is a “Round Robin Database”
• Data in an RRD is stored as sets of averages • 1 minute, 5 min, 15 min, 1hr, 6 hr, 12 hr, etc. • File never grows, but resolution is lost with time • Maximum time to hold data is set when the RRD is
created (number of slots for each time ‘bin’) • PNP4Nagios holds enough data for 4 years by
default
16
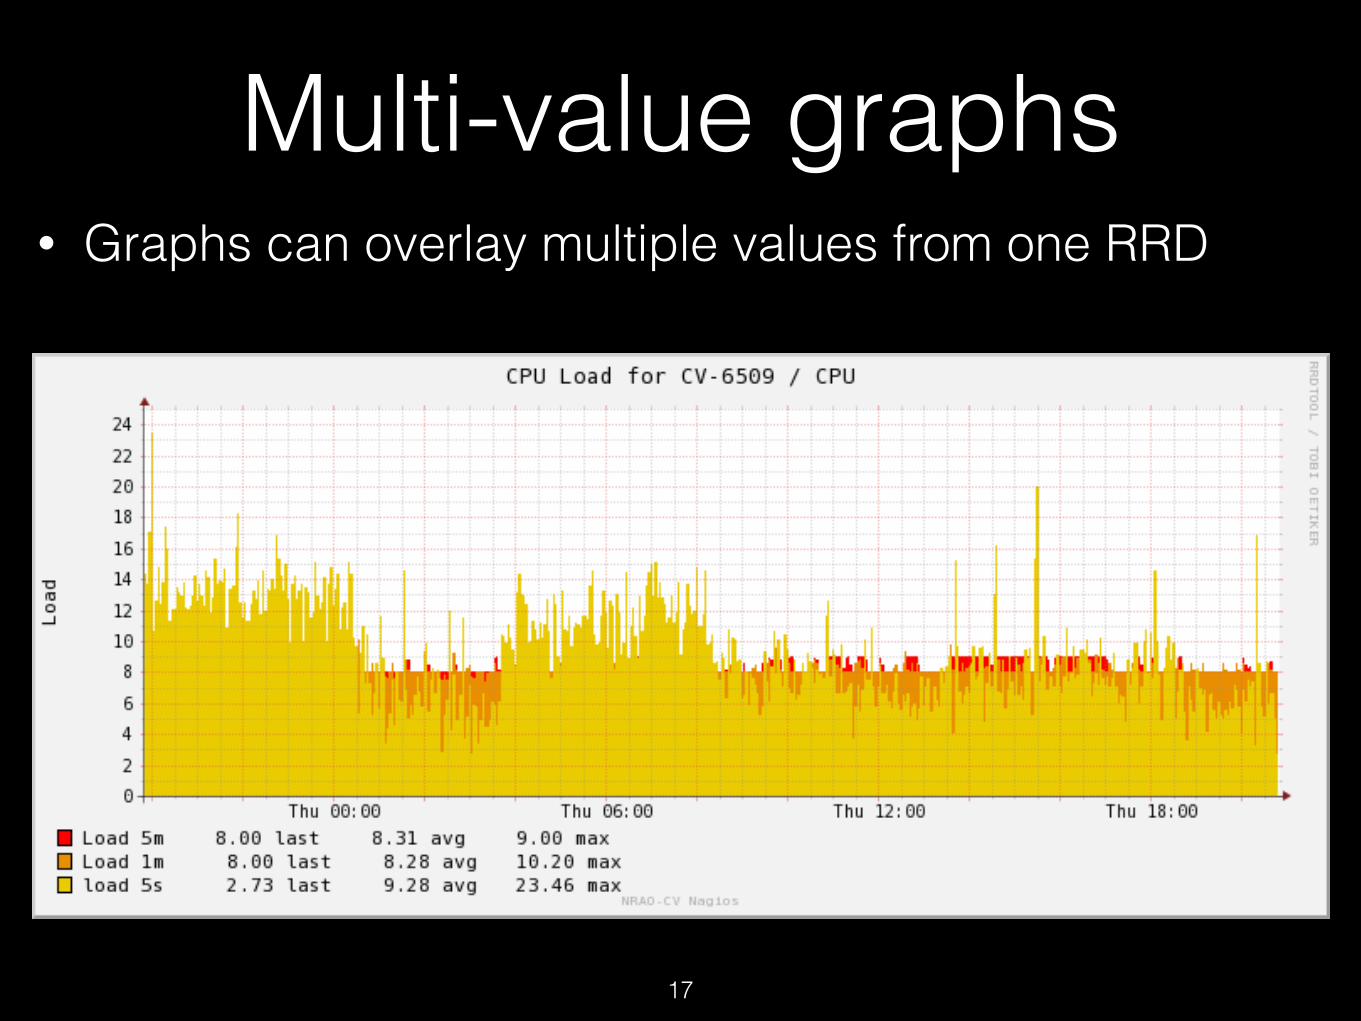
Multi-value graphs• Graphs can overlay multiple values from one RRD
17

Multi-value graphs• Graphs can overlay multiple values from one RRD
18
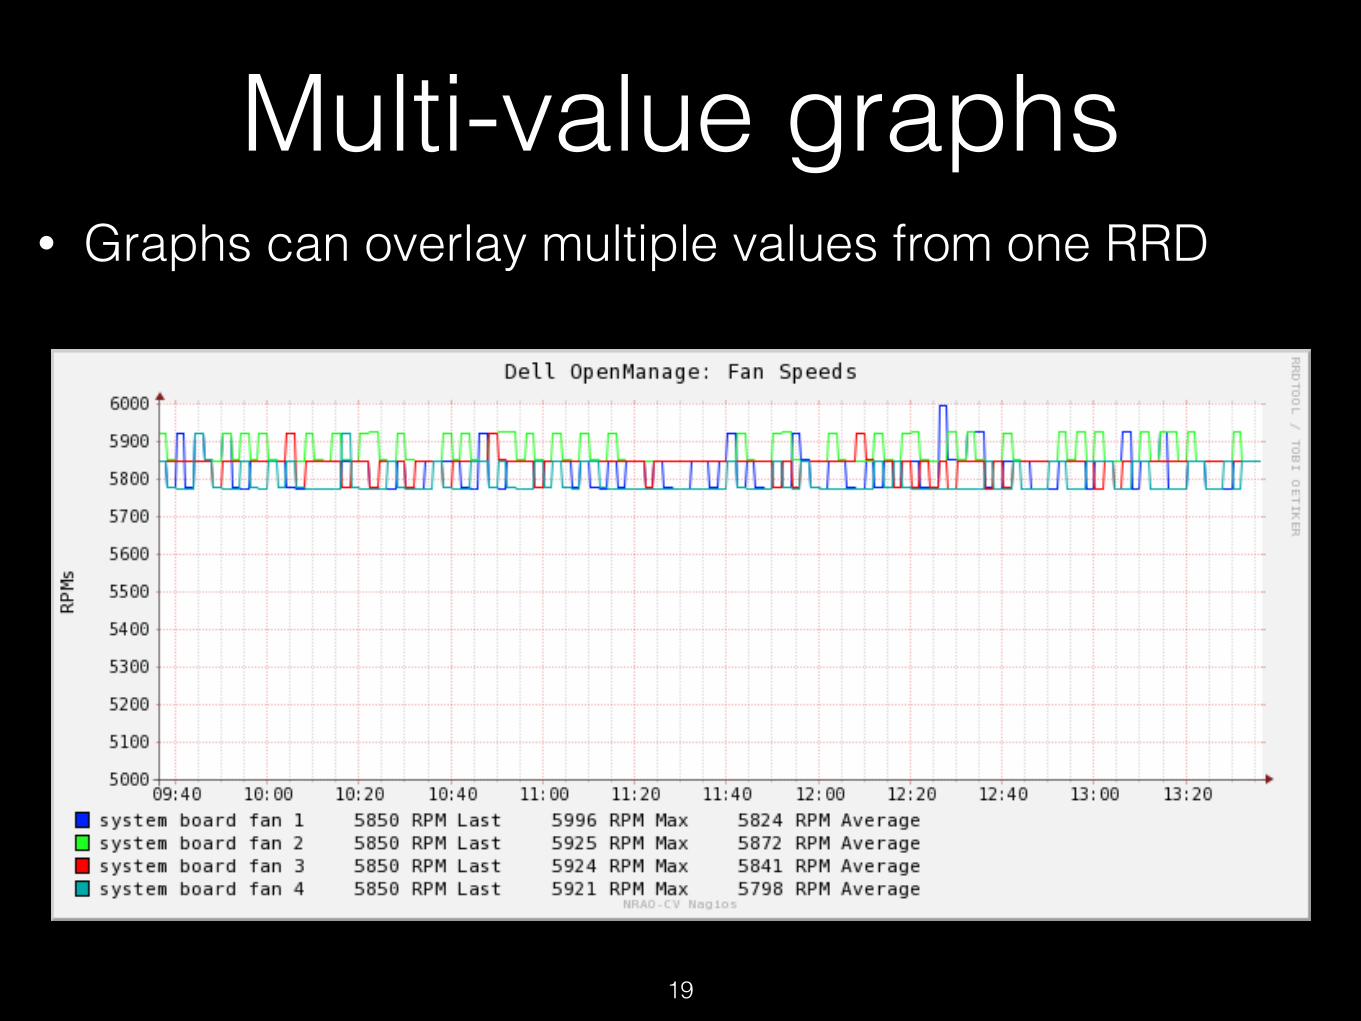
Multi-value graphs• Graphs can overlay multiple values from one RRD
19

Perfdata Processing ModesSynchronous
• The PNP processor is invoked after each and every service check
• RRDs are updated immediately after each service check
• Number of perl execs can cause high load
Bulk mode
• Perfdata is accumulated in a flat file after each service check
• PNP processor is called every 30 seconds and handles all data from file
• Reduced PNP load
20
Easy Not as Easy
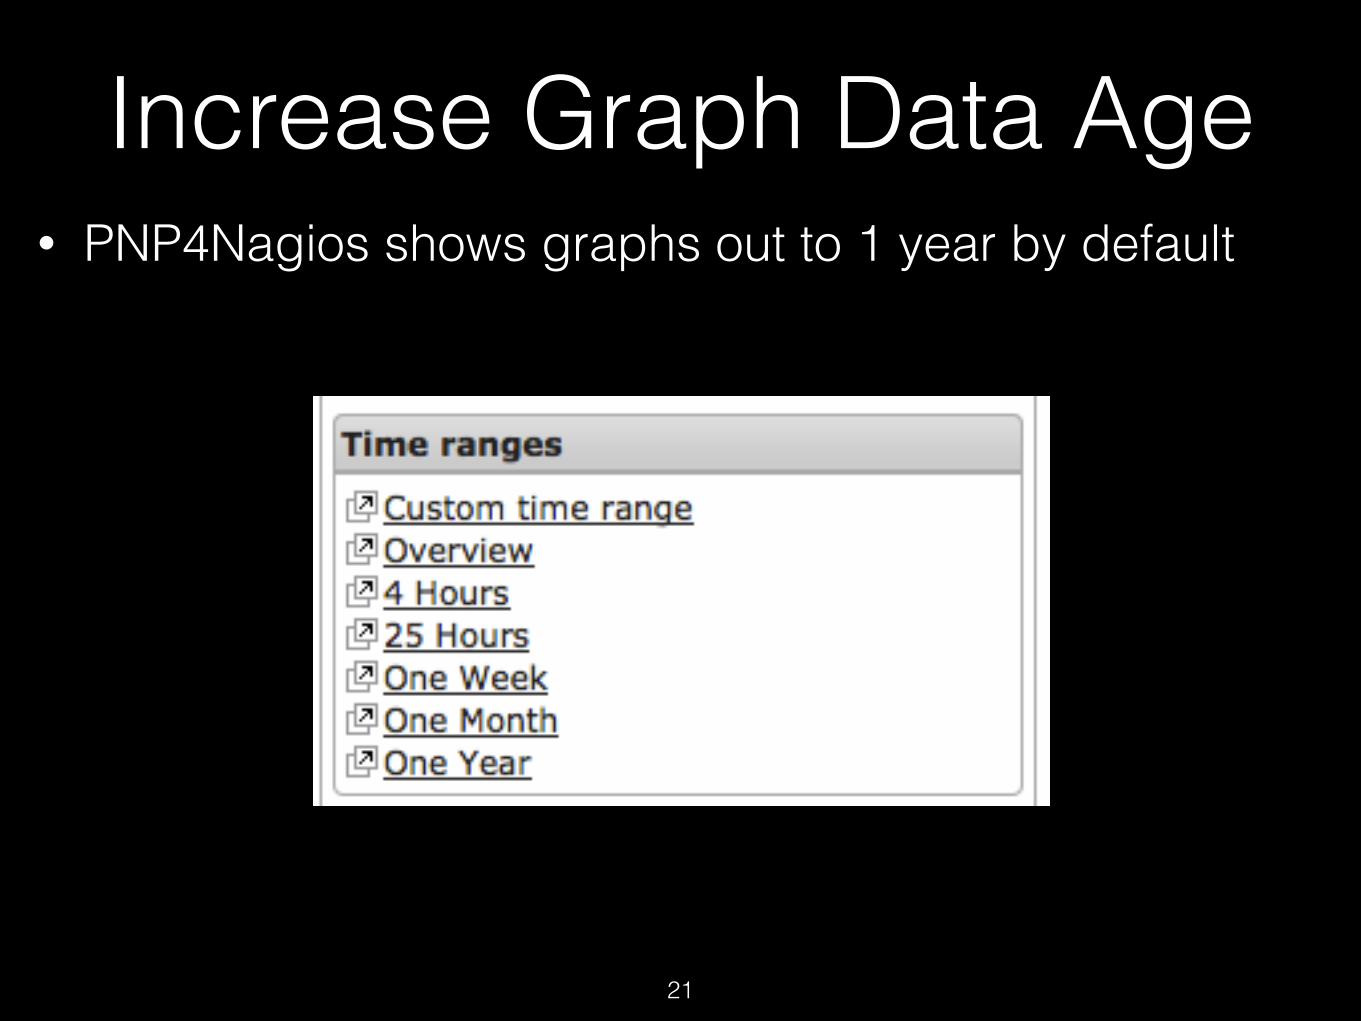
Increase Graph Data Age• PNP4Nagios shows graphs out to 1 year by default
21
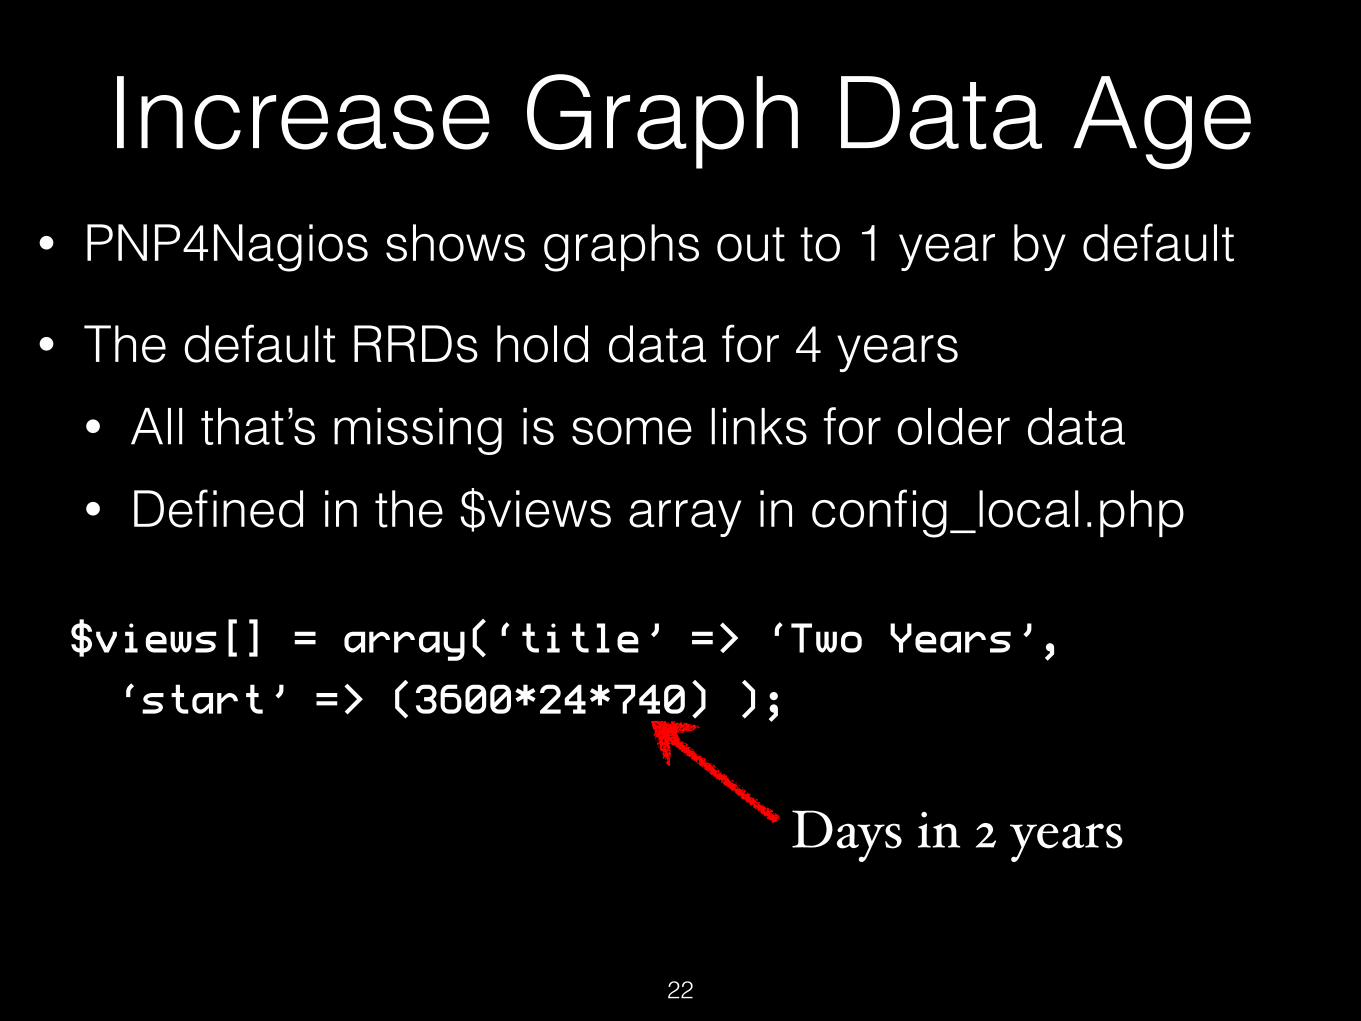
Increase Graph Data Age• PNP4Nagios shows graphs out to 1 year by default
• The default RRDs hold data for 4 years • All that’s missing is some links for older data • Defined in the $views array in config_local.php
$views[] = array(‘title’ => ‘Two Years’,
‘start’ => (3600*24*740) );
22
Days in 2 years
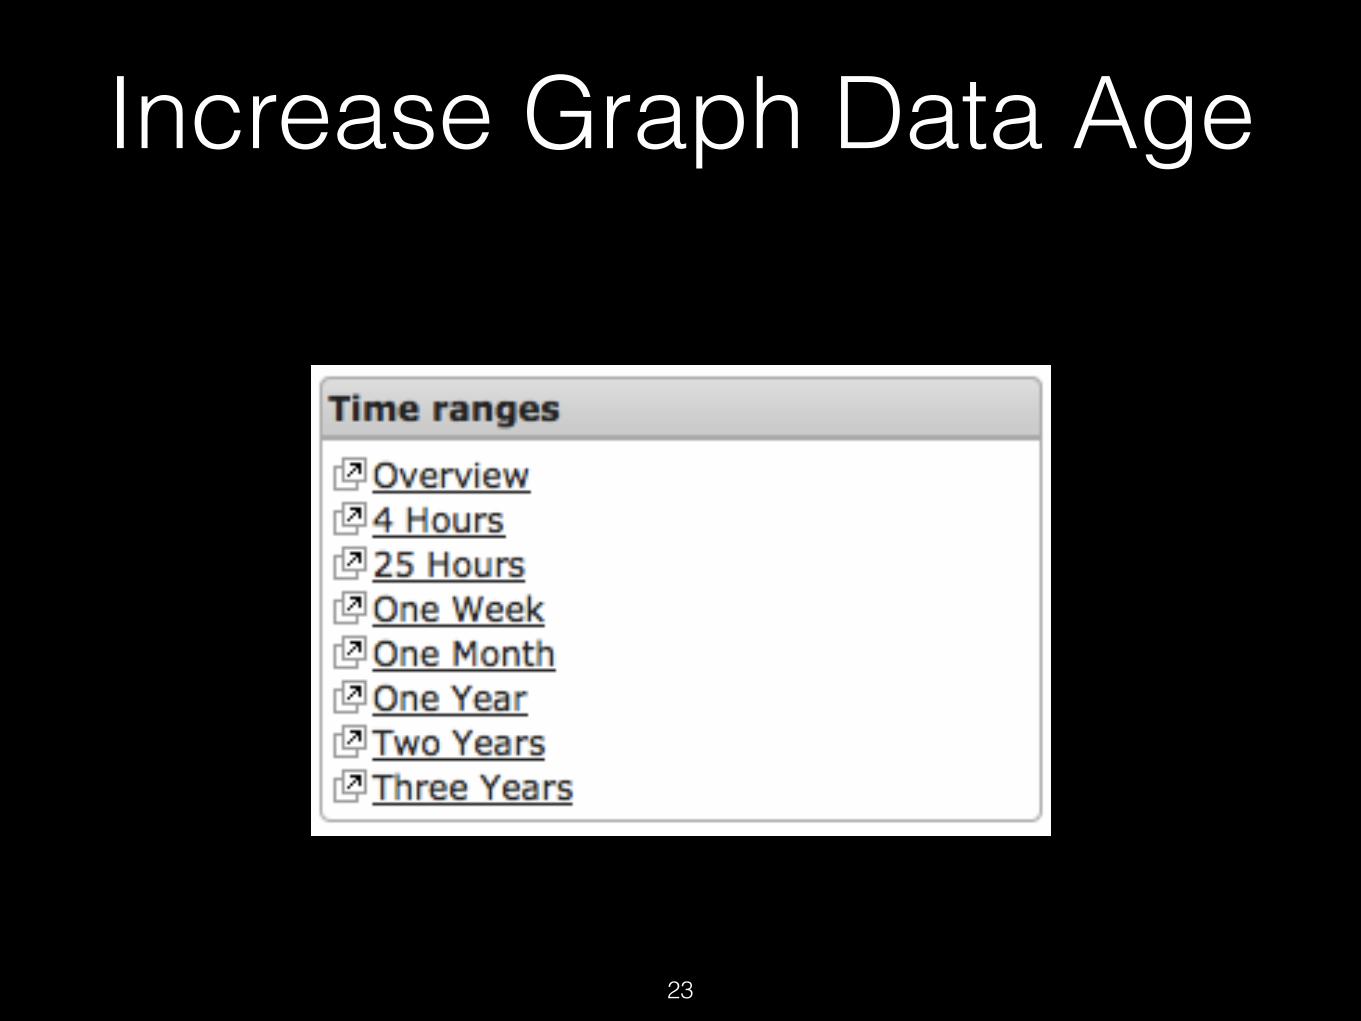
Increase Graph Data Age
23

Using PNP4Nagios

PNP4Nagios Overview
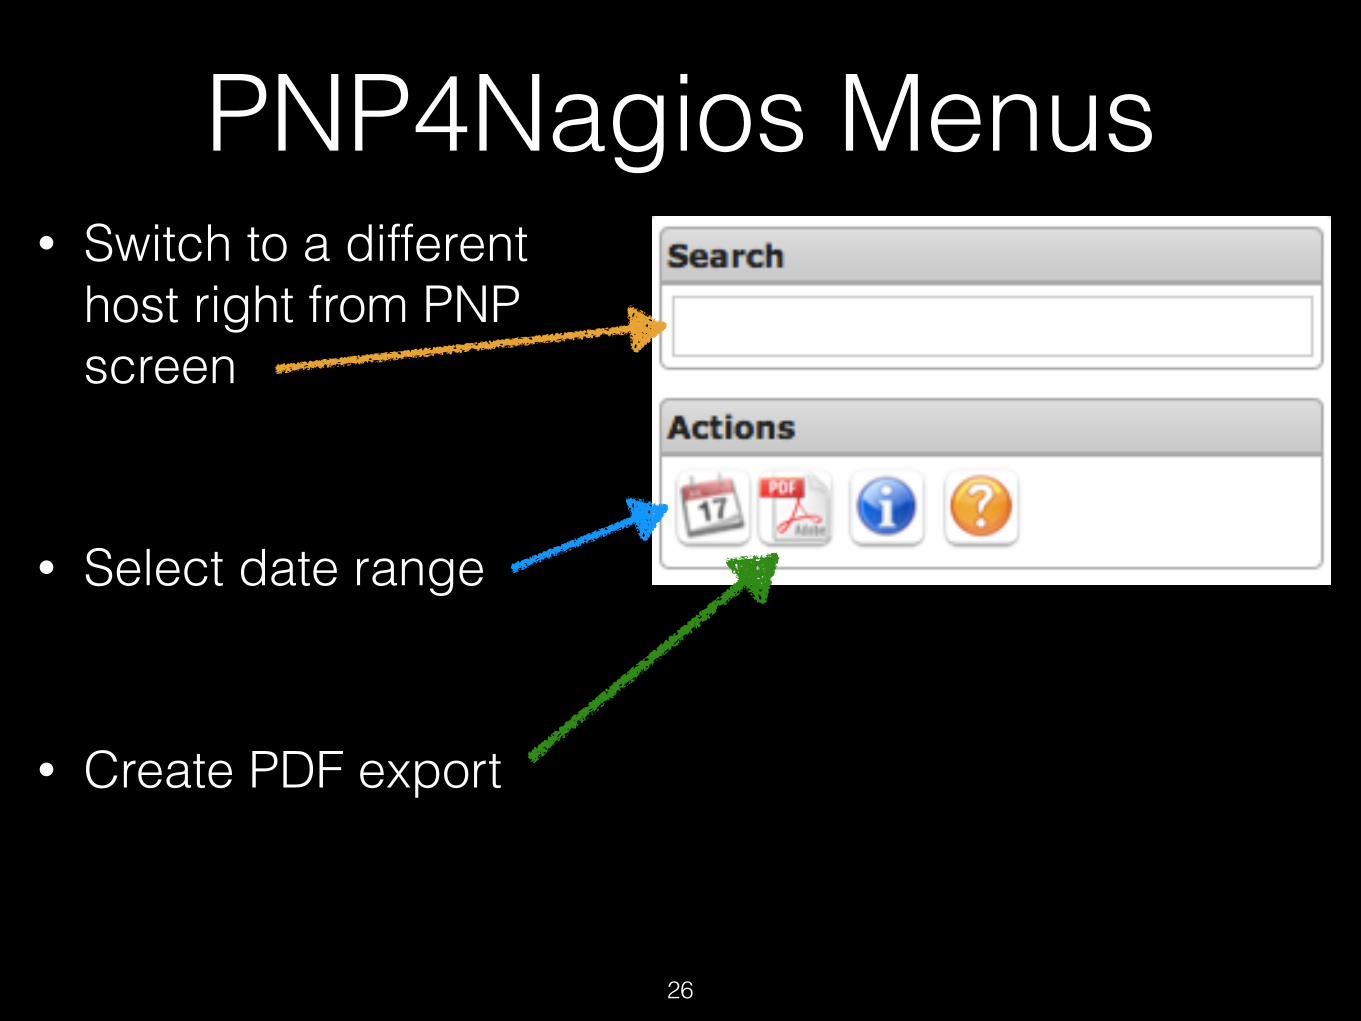
PNP4Nagios Menus• Switch to a different
host right from PNP screen
• Select date range
• Create PDF export
26

Using the Basket• Basket can be used to combine graphs from multiple
hosts into a single page
• Use in combination with PDF export to generate printable/mailable summaries for others • Management, vendors, etc
27

Using the Basket

Templates• Templates define how the perfdata is displayed
• PNP4Nagios looks for a template with the same name as the check command • Falls back to a default if not found
• Define how to present values from the RRDs
• Written in PHP so you can do any kind of processing you like (scaling, coloring, etc.)
29
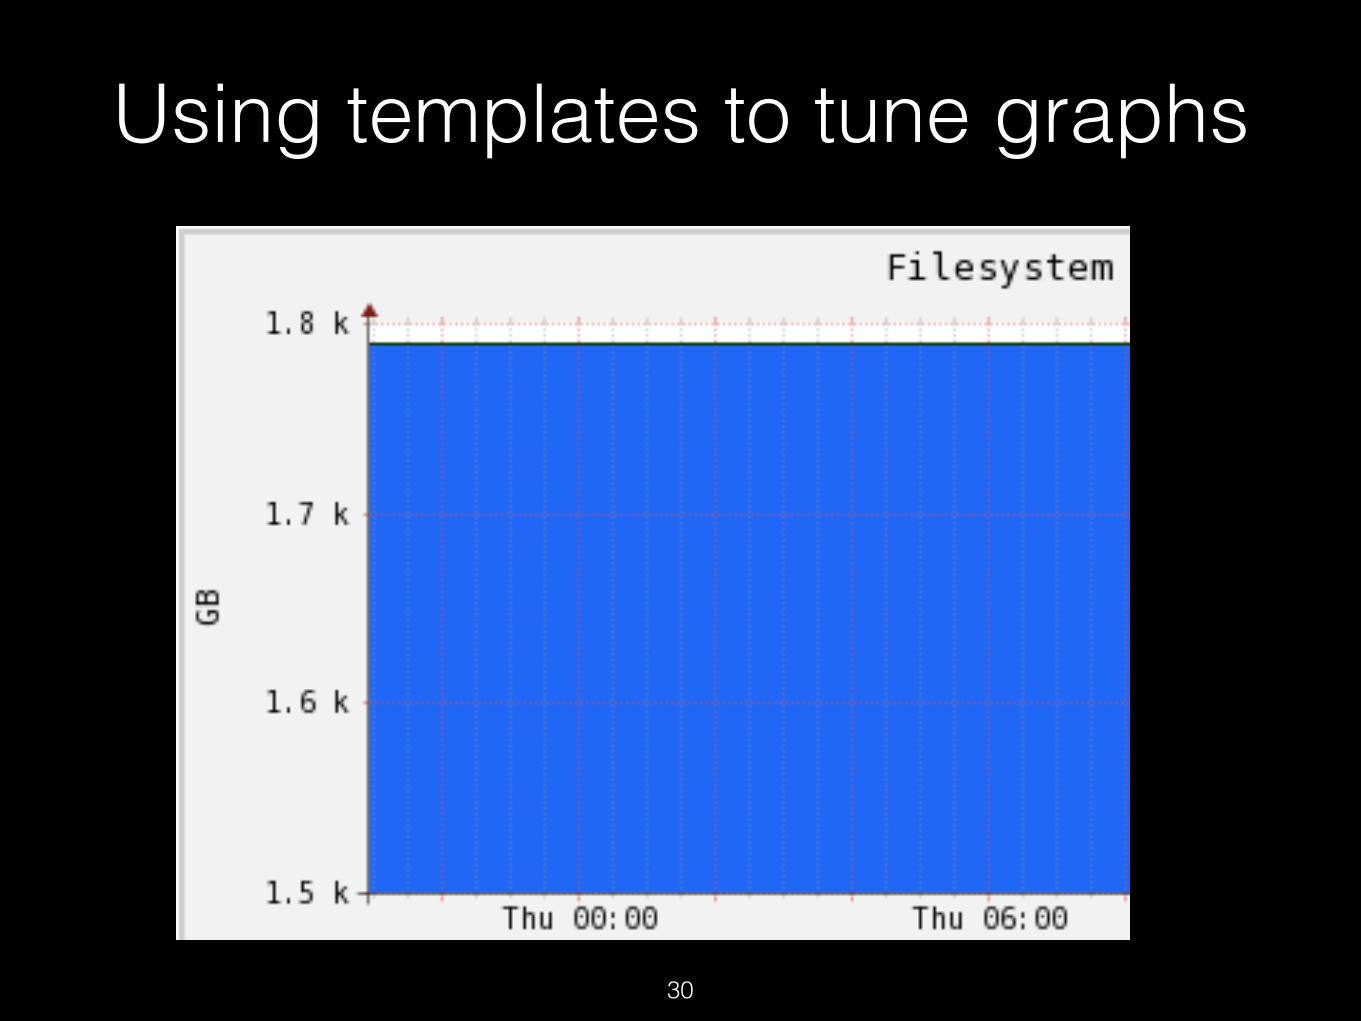
Using templates to tune graphs
30

Using templates to tune graphs• Define command line options to rrdtool
• $opt[$key] = “-X 0 --height 200 --vertical-label ‘foo’ --title ‘Graph Title’ “
• Tells rrgraph not to power-scale the Y axis, sets Y axis label and graph title and makes graphs taller
• Divide a value by 1024 and call the result ‘gb’ • $def[$key] .= “CDEF:gb=var1,1024,/ “;
• Converts MB to GB
30
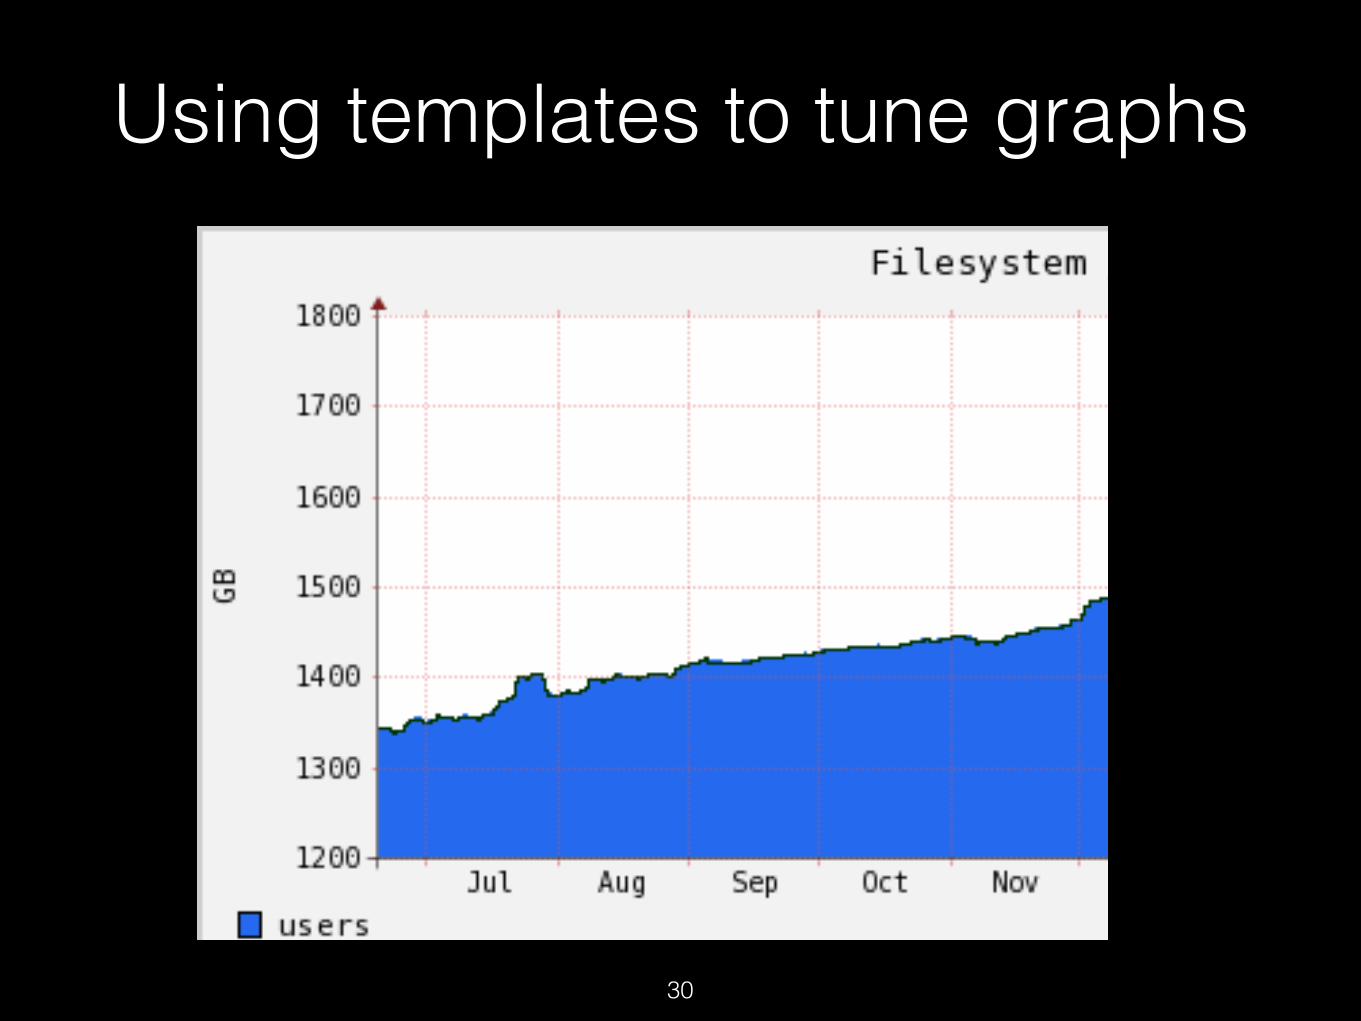
Using templates to tune graphs
30

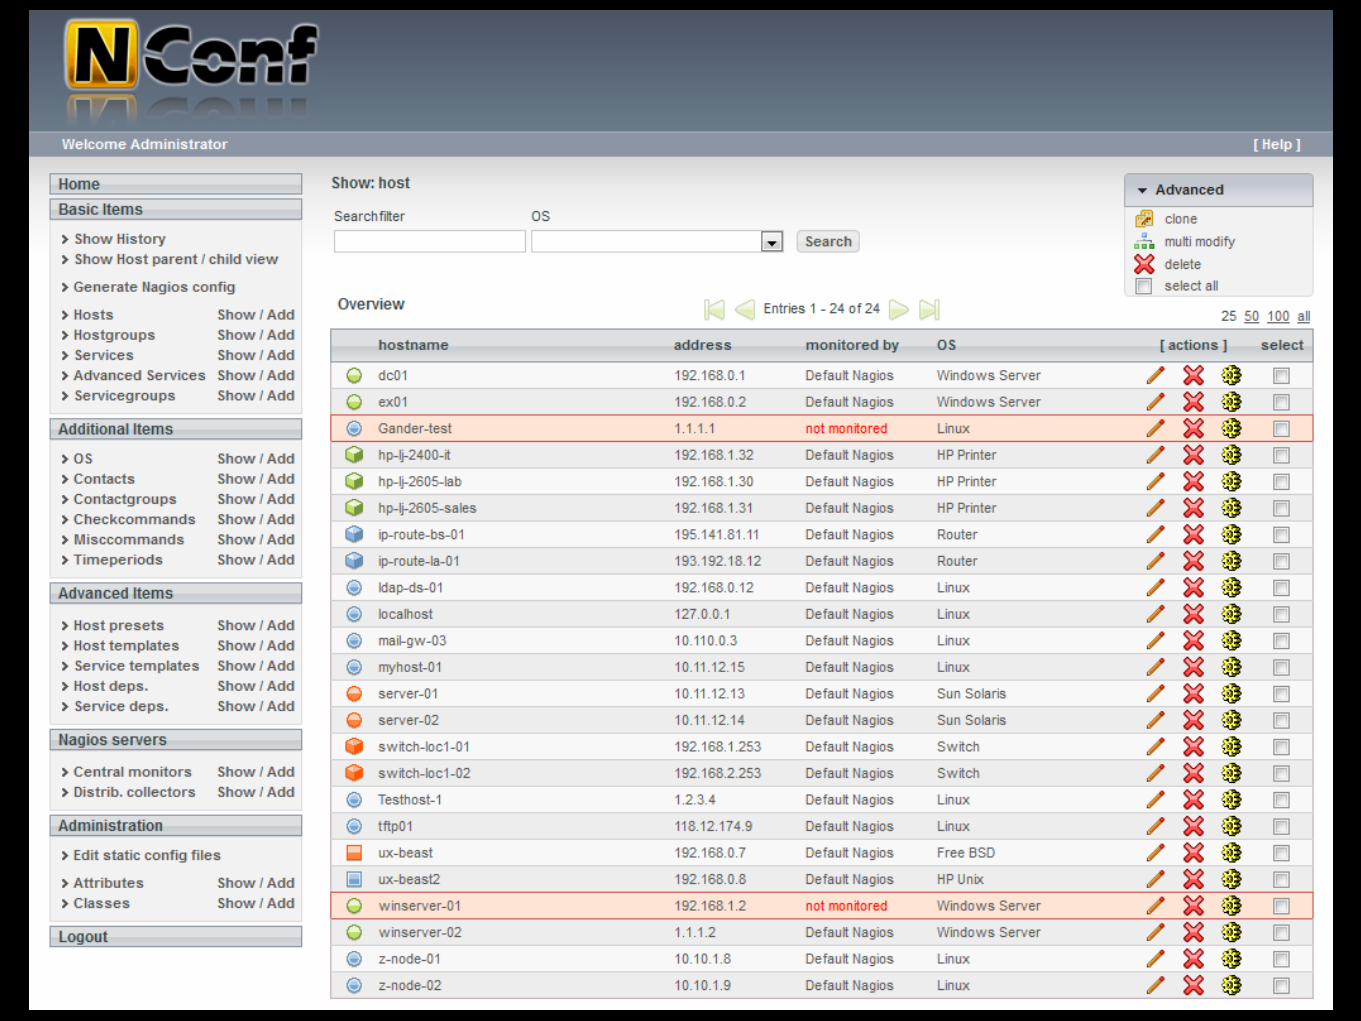
NConfWeb-based GUI configurator

32

33

NConf• Web-based GUI configurator for Nagios
• Stores config objects in MySQL database
• Generates Nagios config files from DB for deployment to Nagios servers
• Deployment is scriptable (SCP, rsync, etc.) • NConf need not run on the Nagios server itself
34
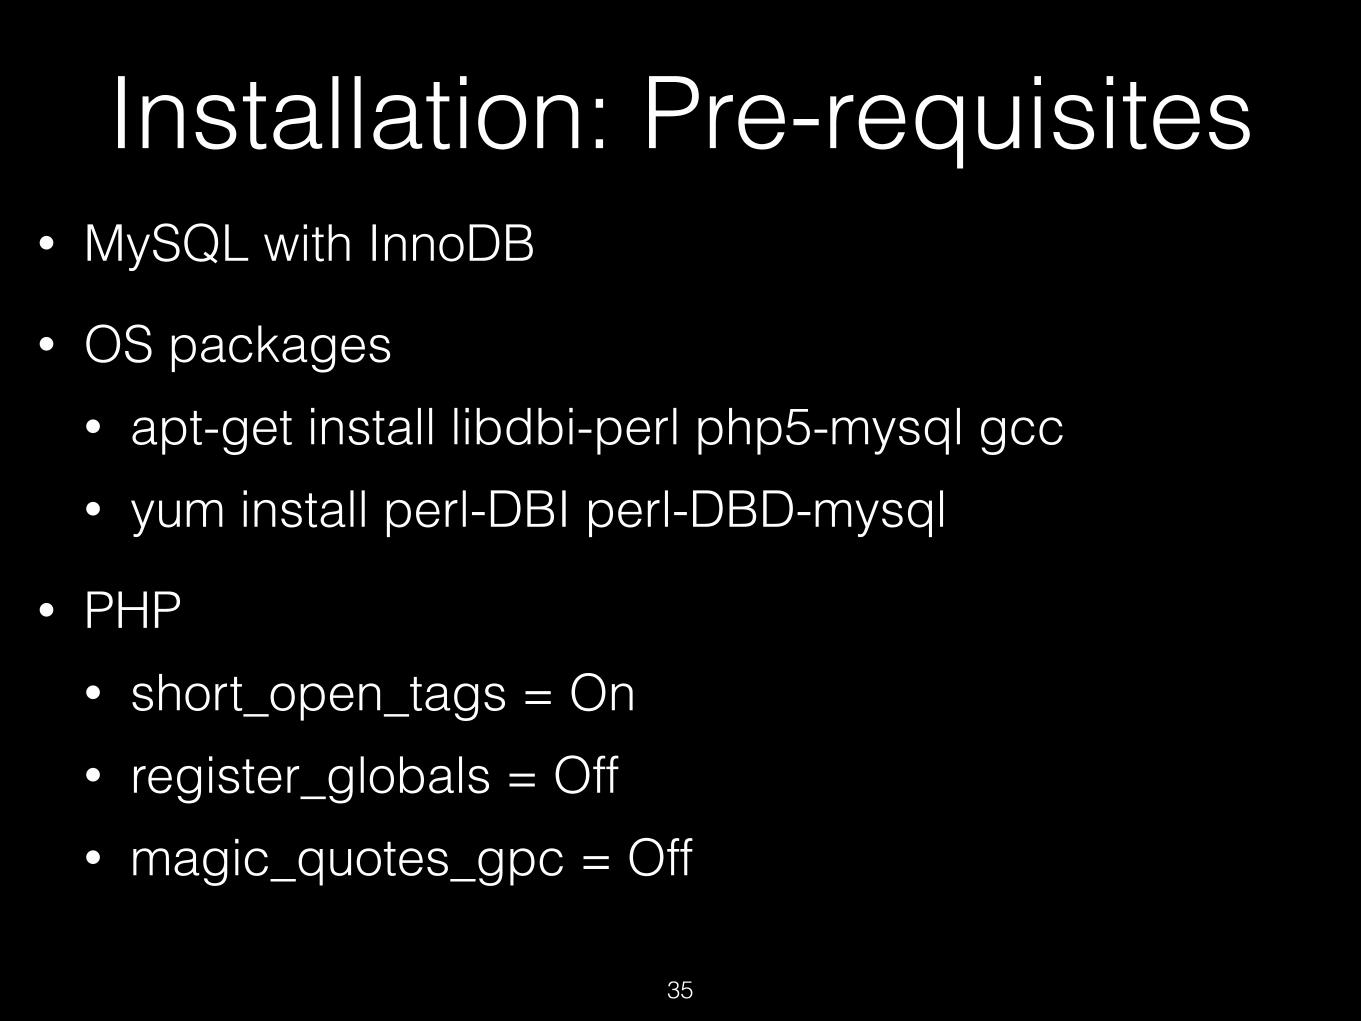
Installation: Pre-requisites• MySQL with InnoDB
• OS packages • apt-get install libdbi-perl php5-mysql gcc • yum install perl-DBI perl-DBD-mysql
• PHP • short_open_tags = On • register_globals = Off • magic_quotes_gpc = Off
35

Install• Un-tar files into web server document area
• config/mysql.php for database server/user/pass
• config/authentication.php - AD, sql, file or basic auth
• config/deployment.ini - How to deploy conf files to Nagios instance
36

Local Deployment[local deployment]
type = local
source_file = /etc/nconf/output/NagiosConfig.tgz
target_file = /etc/nagios
action = extract
reload_command = “sudo /etc/init.d/nagios reload”
37
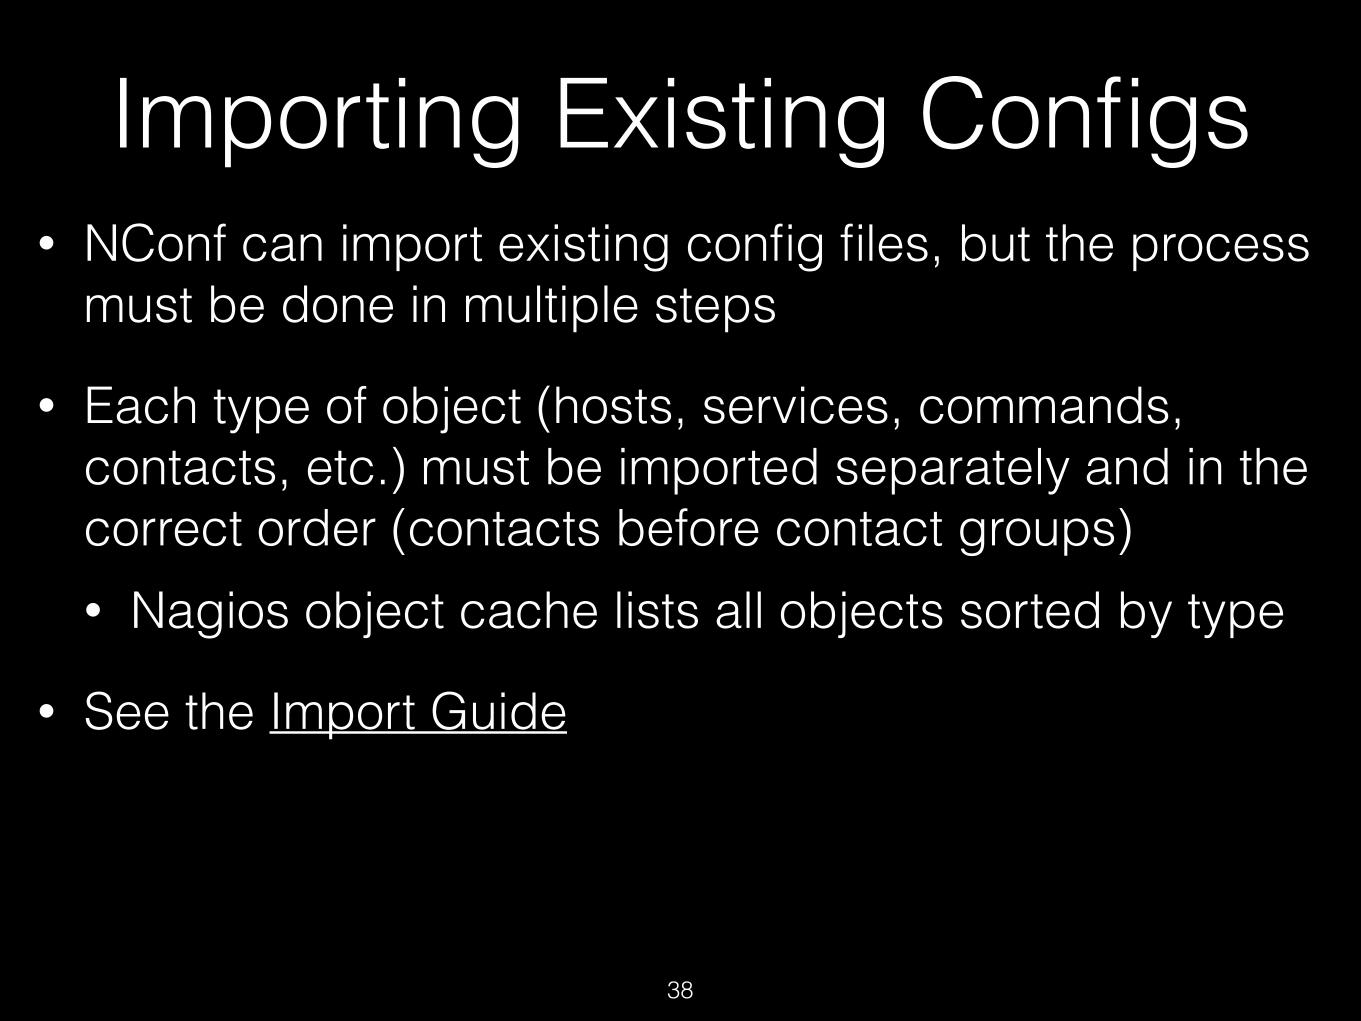
Importing Existing Configs• NConf can import existing config files, but the process
must be done in multiple steps
• Each type of object (hosts, services, commands, contacts, etc.) must be imported separately and in the correct order (contacts before contact groups) • Nagios object cache lists all objects sorted by type
• See the Import Guide
38

Extending the Schema• Some Nagios configuration attributes aren’t supported
by NConf out of the box
• Luckily, the configuration schema/data model used by NConf is extensible
• Administration • Attributes
• Add
•
39
Back up your database before changing the schema!

Extending the Schema
39
Back up your database before changing the schema!

Extending the Schema
40
contactsContacts
hostassign-many
contact
People to notify about this host

Extending the Schema
41

Check Plug-Ins

Must-have plugins• check_openmanage - Monitor Dell servers with OMSA
43

Must-have plugins• check_openmanage - Monitor Dell servers with OMSA
43
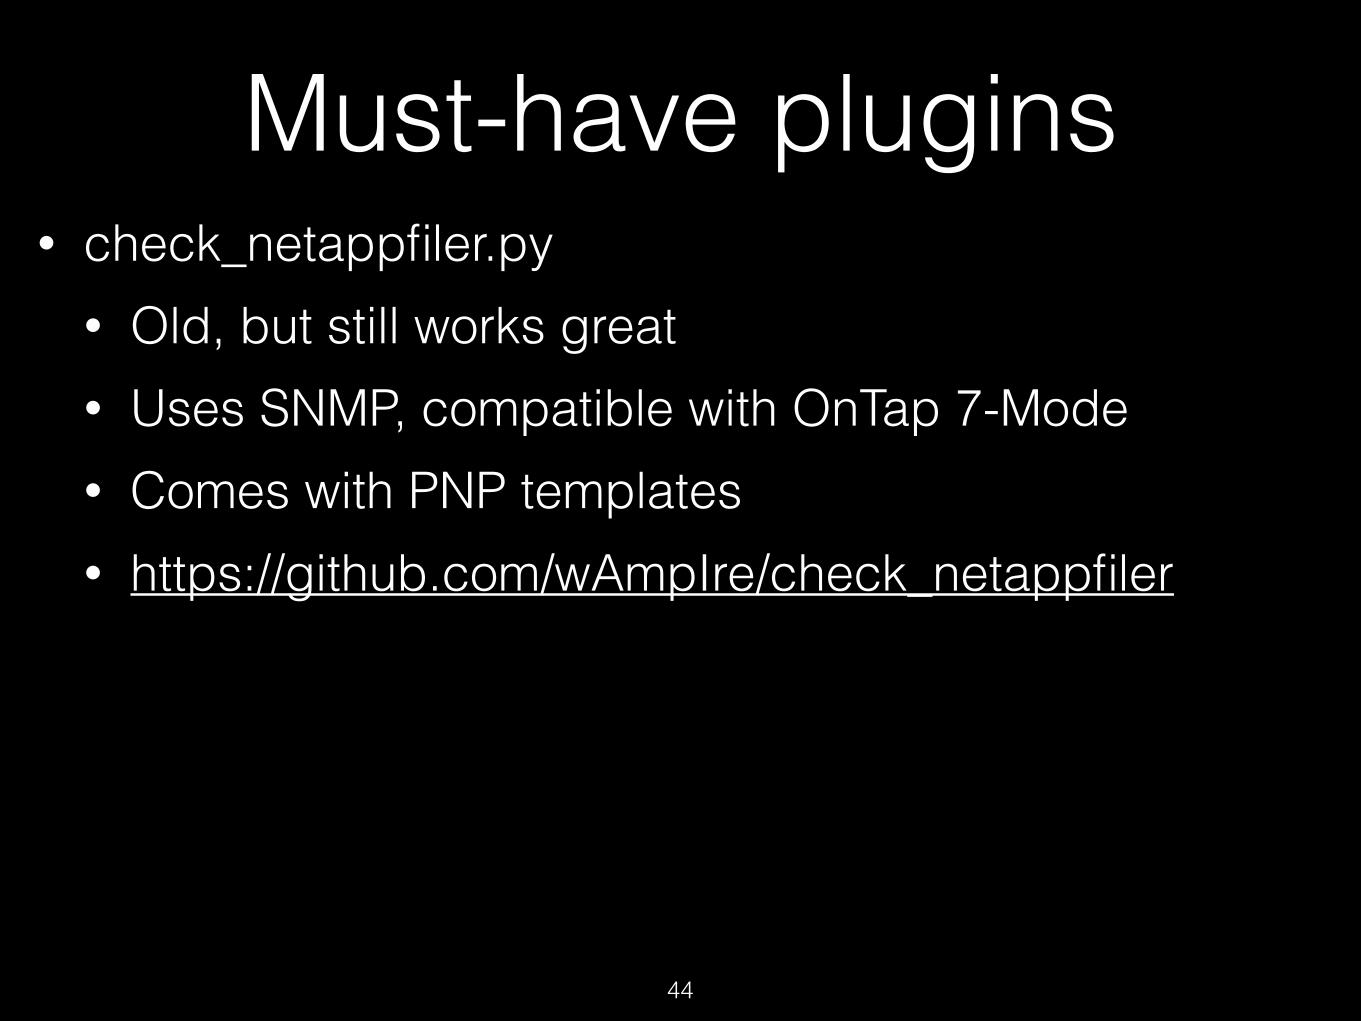
Must-have plugins• check_netappfiler.py
• Old, but still works great • Uses SNMP, compatible with OnTap 7-Mode • Comes with PNP templates • https://github.com/wAmpIre/check_netappfiler
44

Must-have plugins
45

Must-have plugins• check_logfiles
• https://github.com/lausser/check_logfiles • Scans logfiles for patterns indicating Warning,
Critical or OK states • Handles rotated logfiles • Detects recovery strings as well • Can use external config files for complex checks
46

Must-have plugins• check-cisco.pl
• Cisco router / switch CPU, PSU, temp • https://github.com/ranl/monitor-utils
• Synology status (check_snmp_synology) • Check health, RAID, disk temps, storage • Available on Nagios exchange
47

Writing Check Plug-insHave no fear - Write exactly the plugin you need

Custom Plugins• Nagios can monitor anything you can write a script to
check
• Simple API
• You can write plugins in ANY language you choose! • bash, python, tcl, expect • perl (Nagios has embedded perl interpreter for
speed) • C, C++
49

Plugin API• Exit code determines check state
• 0 - OK • 1 - Warning • 2 - Critical • 3 - Unknown
• Stdout is for human-readable notices; ignored by Nagios
• Perfdata written on stdout, after vertical bar
• Multiple lines allowed - up to 4 kB
• http://nagios.sourceforge.net/docs/3_0/pluginapi.html
50
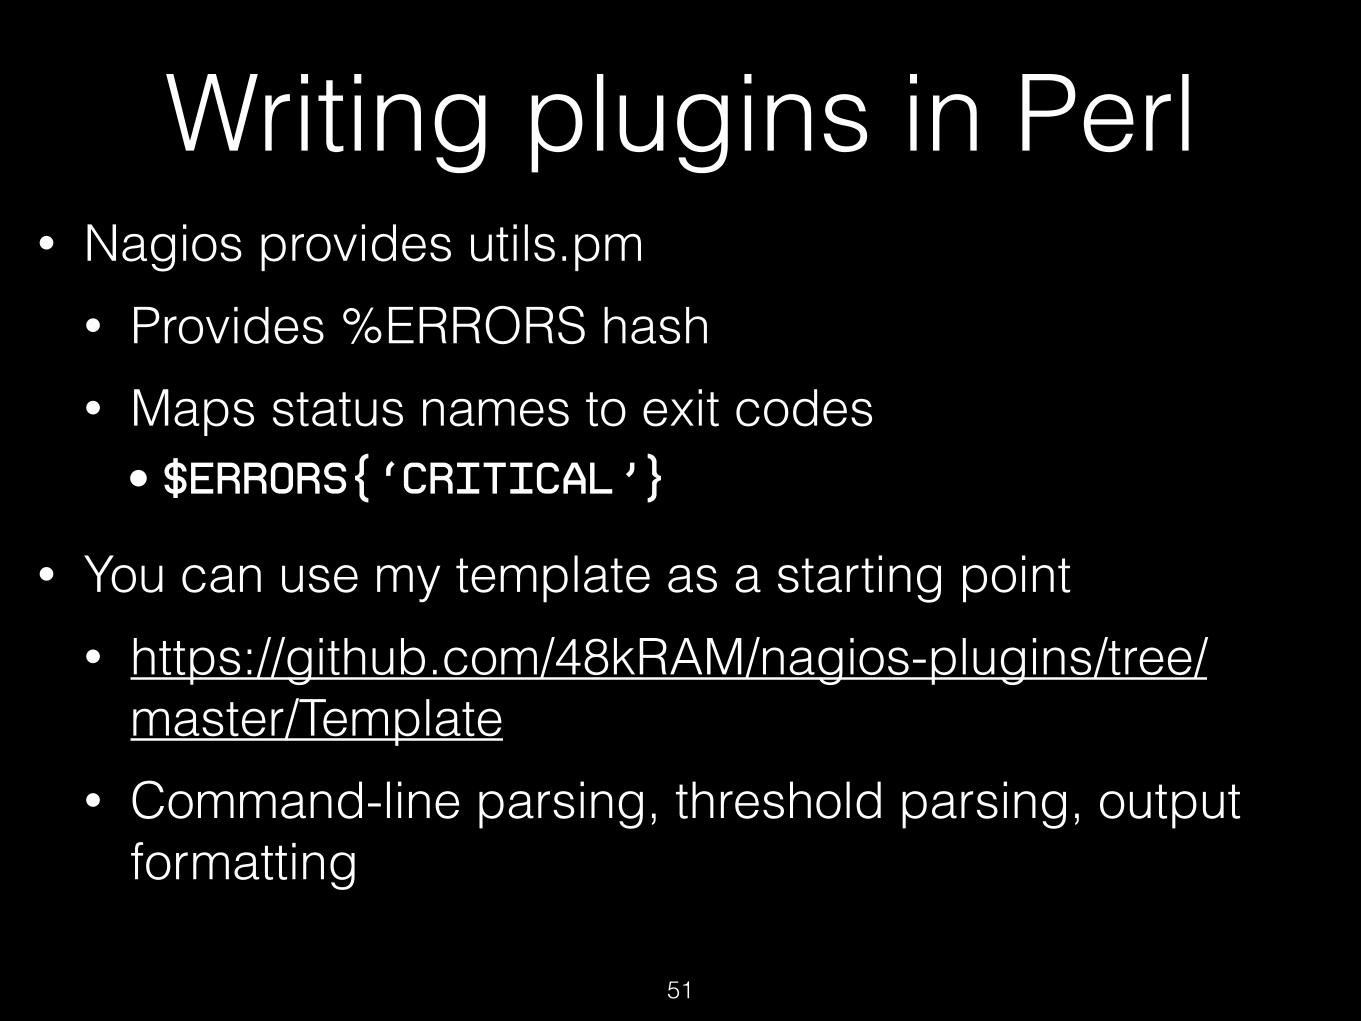
Writing plugins in Perl• Nagios provides utils.pm
• Provides %ERRORS hash • Maps status names to exit codes
• $ERRORS{‘CRITICAL’}
• You can use my template as a starting point • https://github.com/48kRAM/nagios-plugins/tree/
master/Template • Command-line parsing, threshold parsing, output
formatting
51
Writing Good Plugins• Keep default output short and to the point
• Suitable for SMS messages, pagers, etc. • Easy to parse in a time-critical situation • Remember: Nagios should help you fix the problem!
• Call external binaries by their full path • Make it configurable on the cmdline or at the top of
the script in a variable
52

Writing Good Plugins• Watch out for long runtimes or hung processes
• Perl: Use alarm (standard function) • Bash/Sh: Use timeout (coreutils)
• Avoid temp files in case your disk is full, out of file handles, etc.
• Validate your cmdline arguments • Is it legal for warn to be higher than crit? • Are numeric arguments really numeric?
53
Writing Safe Plugins• Nagios’s embedded Perl (ePN) requires special care
• Plugins must work under “use strict”
• Perl should be run with ‘-w’
• Close all opened files (ePN never exits)
• Initialize all variables before using them (ePN caches)
• Don’t use global variables in subroutines
54

When to Use ‘Unknown’• “Unknown” is a special exit status in Nagios for when
an error occurred in the plugin itself. • Missing Perl module or client binary, etc. • Also illegal command line options
• Do not use “Unknown” to indicate that the service is in an unknown state, hostname unknown, etc. • Use Warning or Critical for this state because the
service is not “Ok”!
55

Minimal Nagios Check Plugin#!/usr/bin/perl -w
# Check runtime on APC Symmetra UPS
use Net::SNMP qw (ticks_to_time);
use lib qw ( . /usr/lib/nagios/libexec );
use utils qw(%ERRORS);
use Getopt::Long qw(:config no_ignore_case);
GetOptions( “H|host=s” => \$host,
“C|community=s” => \$community, “w|warning=s” => \$warn,
“c|critical=s” => \$crit ) or print_help();
if( $warn <= $crit ) {
printf(“Error: Warning must be > critical!\n”);
exit $ERRORS{‘UNKNOWN’};
}
56

Minimal Nagios Check Plugin$runtimeOID=”.1.3.6.1.4.1.318.1.1.1.2.2.3.0”;
($s, $error) = Net::SNMP->session(
-hostname => $host, -community => $community,
-timeout => 10, -version => 1,
-translate => [ -timeticks => 0x0 ]
) or do { print “SNMP Error: $error; exit $ERRORS{‘UNKNOWN’}; };
$res = $s->get_request( -varbindlist => [$runtimeOID] );
# Check for errors in request here - omitted
$runMinutes=$res->{$runtimeOID}/100/60;
57

Minimal Nagios Check Plugin# Begin plugin logic
$status=”OK”;
if ($runMinutes <= $warn) { $status=“WARNING”; }
if ($runMinutes <= $crit) { $status=“CRITICAL”; }
$screenout=sprintf(“%s: %d minutes runtime”,
$status, $runMinutes);
$perfData=sprintf(“runtime=%dminutes;%d;%d”,
$runMinutes, $warn, $crit );
print “$screenout|$perfData\n”;
exit $ERRORS{$status};
58

Minimal Nagios Check Plugin: root@host; ./check_apc_run -H 10.1.63.34 -C public -w 40 -c 20
OK: 64 minutes estimated runtime|runtime=64minutes;40;20
: root@host; echo $?
0
59

One Final Word…

Only You Can Change the Culture of Systems Administration
• No service is truly production-ready until it is • Acceptance-tested • Backed-up • Monitored • Documented
61

Credits• Nagios, the Nagios logo, and Nagios graphics are the servicemarks, trademarks,
or registered trademarks owned by Nagios Enterprises.
• APC and Symmetra are registered trademarks of American Power Conversion Corporation. This project is not affilliated with American Power Conversion Corporation.
• “People” image by netalloy. Public Domain. Courtesy openclipart.org
• Clock images by hypocore. Public Domain. Courtesy openclipart.org
• “Profit Chart Curve” by simpletutorials.net. Public Domain
• “Tools” image by sev. Public Domain. Courtesy openclipart.org
• Some images by unknown authors taken from http://clipart-finder.com/
62
Recommended


![Nagios core vs. nagios xi presentation power point.pptx [diperbaiki]](https://img.pdfslide.net/doc/110x75/58a44c4b1a28ab55068b48bb/nagios-core-vs-nagios-xi-presentation-power-pointpptx-diperbaiki.jpg)