African Development Bank
Volume 1 • Issue 1 • November 2011
s e r i e s
A f r i c a Eme rg i ng I s sues
Volume 1 • Issue 1 • November 2011
s e r i e s
A f r i c a Eme rg i ng I s sues

A f r i c a E m e r g i n g I s s u e s Volume 1 Issue 1 November 2011
s e r i e s
A f r i c a n D e v e l o p m e n t B a n k
2
Copyright © 2011 African Development BankAngle des l’avenue du Ghana et des ruesPierre de Coubertin et Hédi Nouira BP 323 -1002 TUNIS Belvédère (Tunisia) Tel.: +216 71 333 511 Fax: +216 71 351 933 E-mail: [email protected]
Rights and Permissions
All rights reserved.
The text and data in this publication may be reproduced as long as thesource is cited. Reproduction for commercial purposes is forbidden.
The findings, interpretations, and conclusions expressed in the Bank’spublications are entirely those of the author(s) and do not necessarilyrepresent the view of the African Development Bank, its Board ofDirectors, or the countries they represent.
Foreword
Over the last one year, a series of events – ranging from the Arab Spring
to the European debt crisis and growing food insecurity, particularly in
the Horn of Africa – have focused attention on the fragility of the global
economic system. An awareness of risk, and risk management, is
increasingly viewed as a prerequisite for sustainable and inclusive
growth. Indeed, inaction on these and other long-term risks such as
climate change could not only derail the long-term sustainability of global
economies but also weaken their capacity to meet future challenges.
This maiden edition of the Emerging Issues Series contains three
articles: “Africa’s Performance and Mid-term Prospects”; “The Impact
of the US Credit Rating Downgrade and European Debt Crisis on
Africa”; and “Managing Food Price Volatility for Improved Food Security
in Africa.” The first article notes that while Africa is expected to continue
on its recovery path, there are a number of internal and external factors
which could adversely affect its performance. A key internal factor is the
risk of disruption from social unrest. External risks include possible
contagion from the uncertain global economic environment, as well as
high fuel and food prices. On the other hand, increased engagement
by African countries with China and India could help to cushion adverse
effects from a downturn in OECD countries.
The second article emphasizes that trade is the main transmission
channel through which Africa is likely to be affected by the current global
economic uncertainty. Recession in OECD countries would lower
Africa’s exports and trade revenues. Other factors include higher costs
of finance, shrinking fiscal space which can compromise fiscal, social
and political stability and lower financial flows.
The third article notes that over the past five years we have entered into
a new era of persistent food price volatility, especially for rice, wheat,
maize and soybeans. The current famine in the Horn of Africa
demonstrates Africa’s acute vulnerability to this development. Food
price volatility threatens not just the long-term welfare of African
households, but also macroeconomic instability and increased political
and social unrest. African countries have applied a variety of strategies
to tackling food price volatility, but with limited success. The more
promising strategies include developing and using new risk
management instruments; developing early warning mechanisms and
contingency plans; supporting the provision of timely and accurate
information on stock holdings and market prices, to guide market
interventions; and improving local supply by addressing barriers across
the entire value chain.
A f r i c a E m e r g i n g I s s u e sVolume 1 Issue 1 November 2011
s e r i e s
A f r i c a n D e v e l o p m e n t B a n k
3
Prof. Mthuli NcubeChief Economist & Vice-President
African Development Bank

A f r i c a E m e r g i n g I s s u e s
s e r i e s
A f r i c a n D e v e l o p m e n t B a n k
4

Africa’s Performance & Mid-term Prospects
A f r i c a E m e r g i n g I s s u e sVolume 1 Issue 1 November 2011
s e r i e s
A f r i c a n D e v e l o p m e n t B a n k
5

A f r i c a E m e r g i n g I s s u e s Volume 1 Issue 1 November 2011
s e r i e s
A f r i c a n D e v e l o p m e n t B a n k
6
A f r i c a E m e r g i n g I s s u e sVolume 1 Issue 1 November 2011
s e r i e s
A f r i c a n D e v e l o p m e n t B a n k
7
1 Introduction
1.1 While the continent is expected to continue on its path of recovery
from 3.7% of real GDP growth in 2011 to 5.8% in 2012, there are a
number of internal and external factors which could adversely affect its
performance. Prominent among the internal factor is the risk of
disruption arising from social unrests as seen in North Africa and in other
parts of the continent. External challenges include the uncertain
developments in OECD countries because of high sovereign debt which
could lead to a global slowdown. Moreover, high fuel and food prices
would damage the external accounts of most African countries, in
particular non-resource rich ones.
1.2 In the face of such internal and external risks, African countries
will face the difficult task of maintaining or restoring political, economic,
and social stability, promoting inclusive development, with in all likelihood
fewer resources. One opportunity is the increased engagement of
African countries with China and India whose growth can help cushion
adverse effects arising from a downturn in OECD countries.
1.3 This brief provides Africa’s recent economic performance and
mid-term outlook and is organized as follows: Section 2 presents
macroeconomic prospects, Section 3 highlights the major risks that
have the potential to derail growth in the mid-term and the last section
provides the key messages.
7
6
5
4
3
2
1
02000 2001 2002 2003 2004 2005 2006 2007 2008 2009 2010 2011 2012
3.7
4.3
5.75.2
5.65.9
6.2 6.4
5.6
3.1
4.9
3.7
5.8
1.3
1.9
3.32.8
3.23.6
3.94.1
5.3
0.8
2.6
1.4
3.5
Per Capita GDPReal GDP Growth
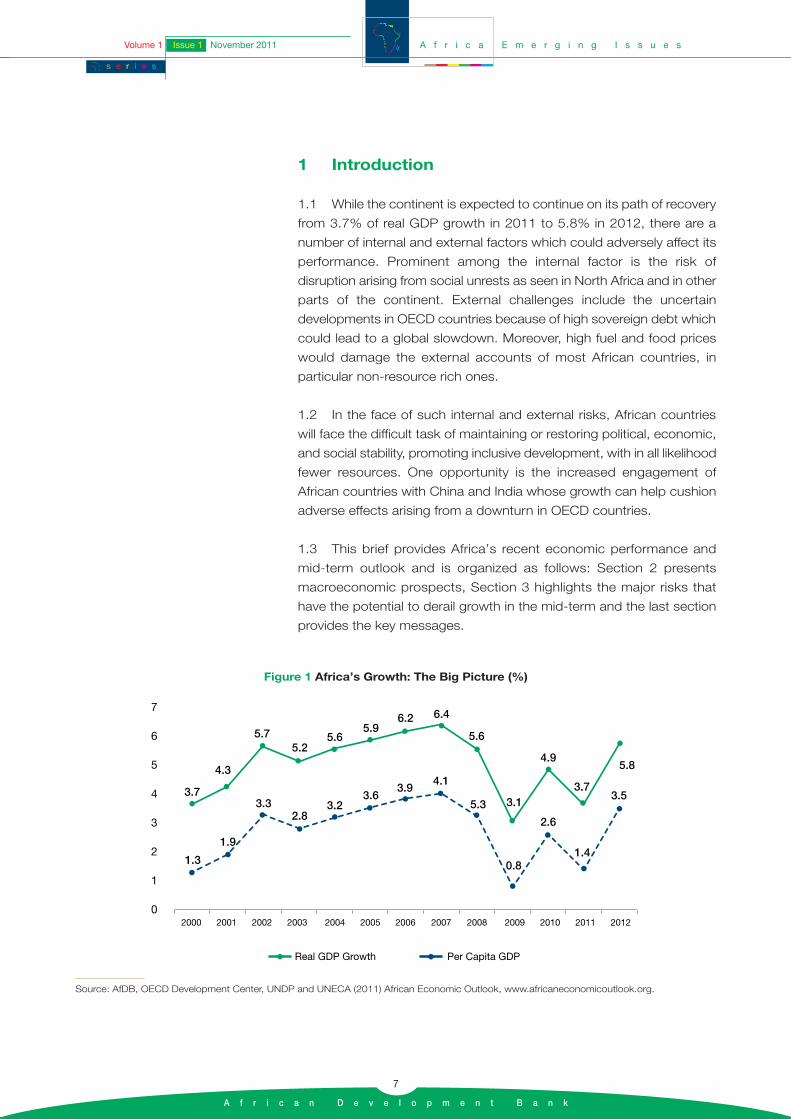
Figure 1 Africa’s Growth: The Big Picture (%)
Source: AfDB, OECD Development Center, UNDP and UNECA (2011) African Economic Outlook, www.africaneconomicoutlook.org.
2 Macroeconomic Prospects in 2011 and 2012
2.1 Real GDP Growth: Prospects remain favourable and in most parts
of Africa growth is expected to accelerate further in 2011 (Figure 1).
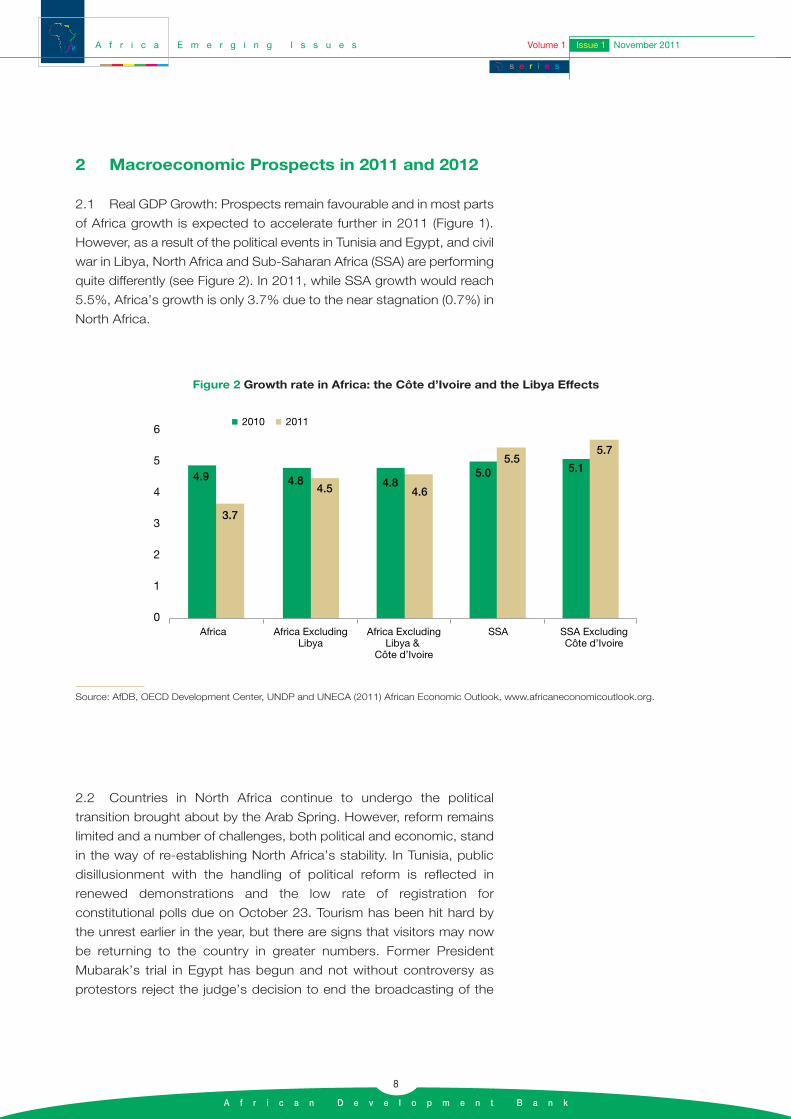
However, as a result of the political events in Tunisia and Egypt, and civil
war in Libya, North Africa and Sub-Saharan Africa (SSA) are performing
quite differently (see Figure 2). In 2011, while SSA growth would reach
5.5%, Africa’s growth is only 3.7% due to the near stagnation (0.7%) in
North Africa.
A f r i c a E m e r g i n g I s s u e s Volume 1 Issue 1 November 2011
s e r i e s
A f r i c a n D e v e l o p m e n t B a n k
8
6
5
4
3
2
1
0
4.9
3.7
4.84.5 4.8
4.6
5.05.5
5.1
5.7
Africa Africa ExcludingLibya
Africa ExcludingLibya &
Côte d’Ivoire
SSA SSA ExcludingCôte d’Ivoire
2010 2011
Figure 2 Growth rate in Africa: the Côte d’Ivoire and the Libya Effects
Source: AfDB, OECD Development Center, UNDP and UNECA (2011) African Economic Outlook, www.africaneconomicoutlook.org.
2.2 Countries in North Africa continue to undergo the political
transition brought about by the Arab Spring. However, reform remains
limited and a number of challenges, both political and economic, stand
in the way of re-establishing North Africa’s stability. In Tunisia, public
disillusionment with the handling of political reform is reflected in
renewed demonstrations and the low rate of registration for
constitutional polls due on October 23. Tourism has been hit hard by
the unrest earlier in the year, but there are signs that visitors may now
be returning to the country in greater numbers. Former President
Mubarak’s trial in Egypt has begun and not without controversy as
protestors reject the judge’s decision to end the broadcasting of the
proceedings. The resignation of Egypt’s Finance Minister is the latest in
a series of events ensuring economic policy there remains unsettled.
His replacement is expected to adopt a tougher policy on deficit
reduction and Egypt may slow down the pace of its privatisation
programme. In Libya, the chief of former rebels arrived in Tripoli on
September 10, 2011 and took charge of the interim government
replacing the ousted regime of Col Gaddafi. Libya's transitional leaders
battling to take Muammar Gaddafi's home town of Sirte fear regime
loyalists have taken more than 300 people prisoner to use as human
shields.
2.3. The political situation has stabilized in Côte d’Ivoire and economic
recovery is expected in 2012 with a real GDP growth rate around 6%.
The new justice minister has counselled that all parties are responsible
for failing to resolve the political impasse peacefully and for the
subsequent loss of life. The country is currently on the path of stability
following the establishment of a Truth and Reconciliation Commission
to heal the wounds inflicted by more than four months of continuous
fighting.
2.4 Under the assumption that the situation in the troubled countries
would stabilize, Africa’s growth is expected to pick up to the order of
5.8% in 2012, regaining the growth path attained prior to the global
crisis.
2.5 High commodity and agricultural export prices are expected to be
main growth drivers in 2011. In addition, strong domestic consumer
demand as well as good macroeconomic policies and management are
expected to boost real growth.
2.6 External Position: Trade and current accounts have improved in
resource-rich countries due to high commodity prices and rising export
volumes. At the same time, high oil and food import bills are contributing
to a worsening of external balances in resource-poor countries and
threatening food security. On average, while oil exporting countries are
expected to run current account surplus to the tune of 2.2% of GDP in
2011, oil importing countries are expected to run into a deficit of 4.2%
of GDP. In addition, the soaring gold price benefits Africa’s main gold
producers such as South Africa, Ghana, Zimbabwe, Tanzania, Guinea
and Mali. Africa accounts for around 30% of global gold production. On
a year-to-year basis, the price of gold has increased by 45% in August
2011 as compared to the level in August 2010.The price of gold has
continued its steep rise during 2011 partly driven by global demand to
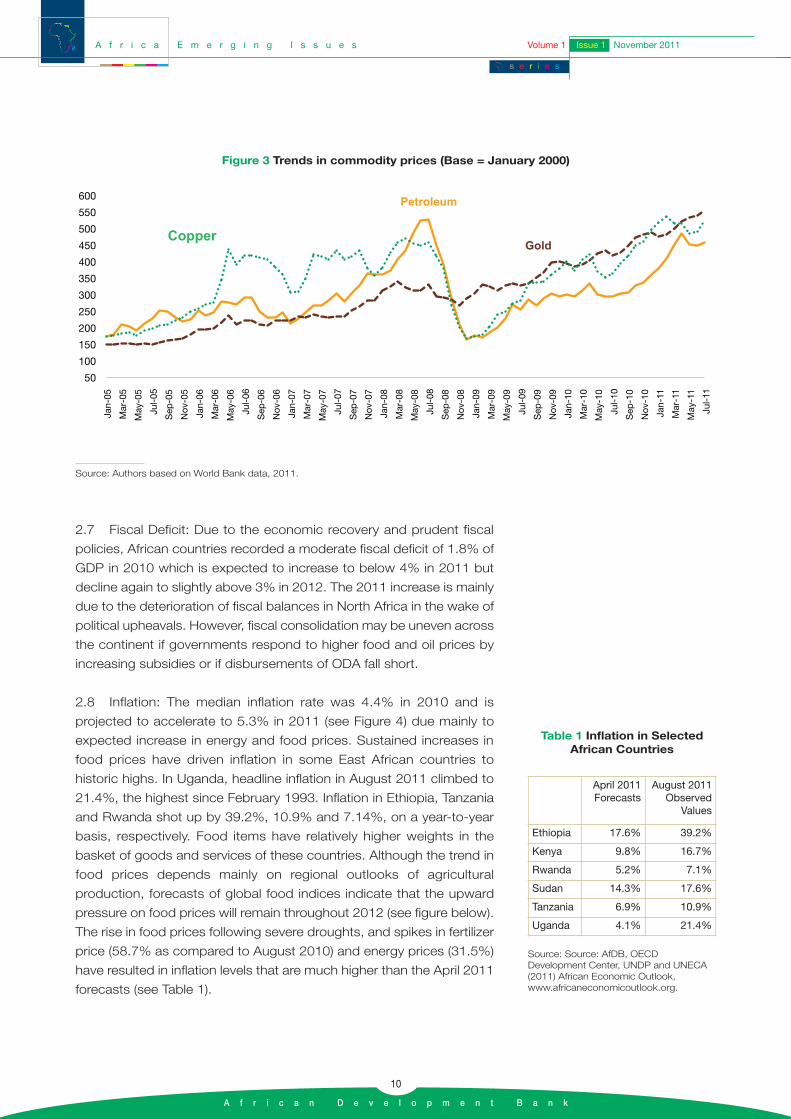
hedge against financial market and exchange rate risks (see Figure 3).
A f r i c a E m e r g i n g I s s u e sVolume 1 Issue 1 November 2011
s e r i e s
A f r i c a n D e v e l o p m e n t B a n k
9
2.7 Fiscal Deficit: Due to the economic recovery and prudent fiscal
policies, African countries recorded a moderate fiscal deficit of 1.8% of
GDP in 2010 which is expected to increase to below 4% in 2011 but
decline again to slightly above 3% in 2012. The 2011 increase is mainly
due to the deterioration of fiscal balances in North Africa in the wake of
political upheavals. However, fiscal consolidation may be uneven across
the continent if governments respond to higher food and oil prices by
increasing subsidies or if disbursements of ODA fall short.
2.8 Inflation: The median inflation rate was 4.4% in 2010 and is
projected to accelerate to 5.3% in 2011 (see Figure 4) due mainly to
expected increase in energy and food prices. Sustained increases in
food prices have driven inflation in some East African countries to
historic highs. In Uganda, headline inflation in August 2011 climbed to
21.4%, the highest since February 1993. Inflation in Ethiopia, Tanzania
and Rwanda shot up by 39.2%, 10.9% and 7.14%, on a year-to-year
basis, respectively. Food items have relatively higher weights in the
basket of goods and services of these countries. Although the trend in
food prices depends mainly on regional outlooks of agricultural
production, forecasts of global food indices indicate that the upward
pressure on food prices will remain throughout 2012 (see figure below).
The rise in food prices following severe droughts, and spikes in fertilizer
price (58.7% as compared to August 2010) and energy prices (31.5%)
have resulted in inflation levels that are much higher than the April 2011
forecasts (see Table 1).
A f r i c a E m e r g i n g I s s u e s Volume 1 Issue 1 November 2011
s e r i e s
A f r i c a n D e v e l o p m e n t B a n k
10
Figure 3 Trends in commodity prices (Base = January 2000)
Source: Authors based on World Bank data, 2011.
April 2011 Forecasts
August 2011Observed
Values
Ethiopia 17.6% 39.2%
Kenya 9.8% 16.7%
Rwanda 5.2% 7.1%
Sudan 14.3% 17.6%
Tanzania 6.9% 10.9%
Uganda 4.1% 21.4%
Table 1 Inflation in SelectedAfrican Countries
Source: Source: AfDB, OECDDevelopment Center, UNDP and UNECA(2011) African Economic Outlook,www.africaneconomicoutlook.org.

2.9 Economic expansion is expected to be stronger in resource-rich
countries that could benefit from the revival in demand for primary
commodities. Angola, Nigeria, Botswana, Zambia and Ghana are
expected to enjoy a robust economic expansion with GDP growth of
above 7% in 2011. Partly driven by new oil production, Ghana is a star
A f r i c a E m e r g i n g I s s u e sVolume 1 Issue 1 November 2011
s e r i e s
A f r i c a n D e v e l o p m e n t B a n k
11
2001 2002 2003 2004 2005 2006 2007 2008 2009 2010 2011 2012
12
10
8
6
4
2
5.4
3.4
5.6
4.2
6.45.7
6.9
10.5
7.2
4.45.3 5.4
Median Inflation
Figure 4 Median Inflation in Africa (%)
Source: AfDB, OECD Development Center, UNDP and UNECA (2011) African Economic Outlook, www.africaneconomicoutlook.org.
320
280
240
200
160
120
January
2006
July
2006
January
2007
July
2007
January
2008
July
2008
January
2009
July
2009
January
2010
July
2010
January
2011
July
2011
January
2012
July
2012
Forecast
Figure 5 Trend and Forecast of Food Price Index
Source: AfDB forecast based on WB Food Price Index.
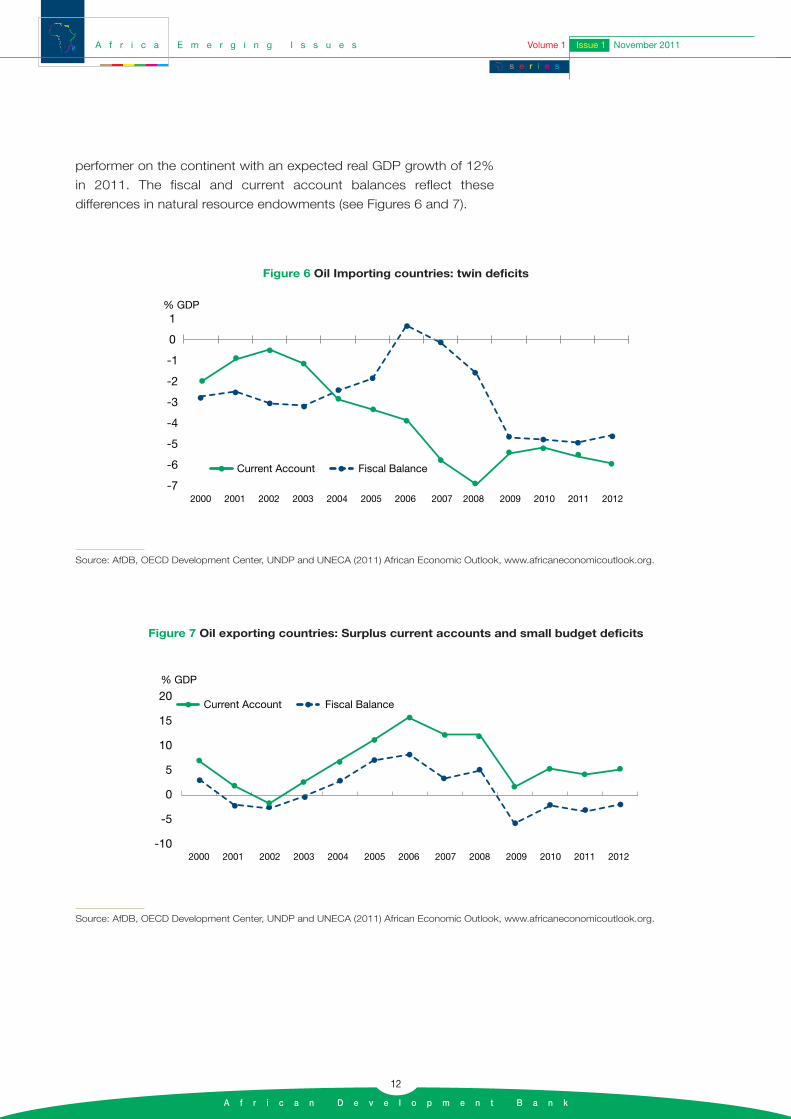
performer on the continent with an expected real GDP growth of 12%
in 2011. The fiscal and current account balances reflect these
differences in natural resource endowments (see Figures 6 and 7).
A f r i c a E m e r g i n g I s s u e s Volume 1 Issue 1 November 2011
s e r i e s
A f r i c a n D e v e l o p m e n t B a n k
12
Fiscal BalanceCurrent Account
1
0
-1
-2
-3
-4
-5
-6
-72000 2001 2002 2003 2004 2005 2006 2007 2008 2009 2010 2011 2012
% GDP
Figure 6 Oil Importing countries: twin deficits
Source: AfDB, OECD Development Center, UNDP and UNECA (2011) African Economic Outlook, www.africaneconomicoutlook.org.
Fiscal BalanceCurrent Account
2000 2001 2002 2003 2004 2005 2006 2007 2008 2009 2010 2011 2012
20
15
10
5
0
-5
-10
% GDP
Figure 7 Oil exporting countries: Surplus current accounts and small budget deficits
Source: AfDB, OECD Development Center, UNDP and UNECA (2011) African Economic Outlook, www.africaneconomicoutlook.org.
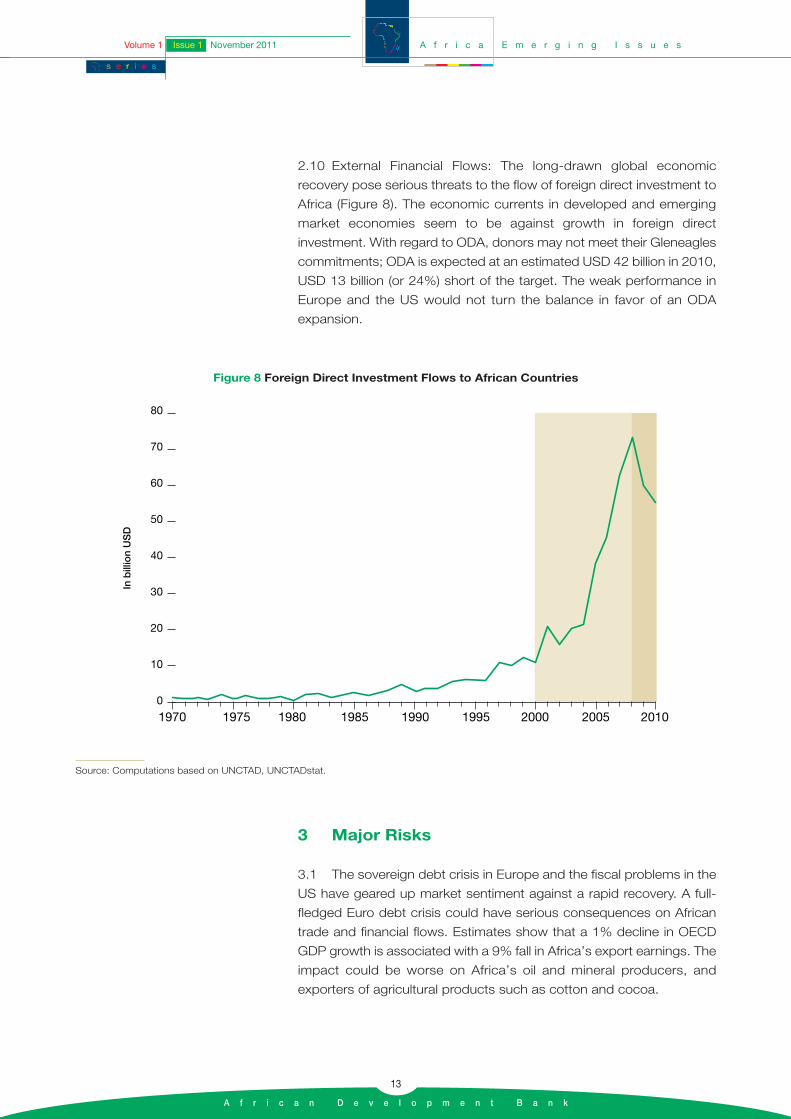
2.10 External Financial Flows: The long-drawn global economic
recovery pose serious threats to the flow of foreign direct investment to
Africa (Figure 8). The economic currents in developed and emerging
market economies seem to be against growth in foreign direct
investment. With regard to ODA, donors may not meet their Gleneagles
commitments; ODA is expected at an estimated USD 42 billion in 2010,
USD 13 billion (or 24%) short of the target. The weak performance in
Europe and the US would not turn the balance in favor of an ODA
expansion.
A f r i c a E m e r g i n g I s s u e sVolume 1 Issue 1 November 2011
s e r i e s
A f r i c a n D e v e l o p m e n t B a n k
13
80
70
60
50
40
30
20
10
0
1970 1975 1980 1985 1990 1995 2000 2005 2010
In b
illio
n U
SD
Figure 8 Foreign Direct Investment Flows to African Countries
Source: Computations based on UNCTAD, UNCTADstat.
3 Major Risks
3.1 The sovereign debt crisis in Europe and the fiscal problems in the
US have geared up market sentiment against a rapid recovery. A full-
fledged Euro debt crisis could have serious consequences on African
trade and financial flows. Estimates show that a 1% decline in OECD
GDP growth is associated with a 9% fall in Africa’s export earnings. The
impact could be worse on Africa’s oil and mineral producers, and
exporters of agricultural products such as cotton and cocoa.
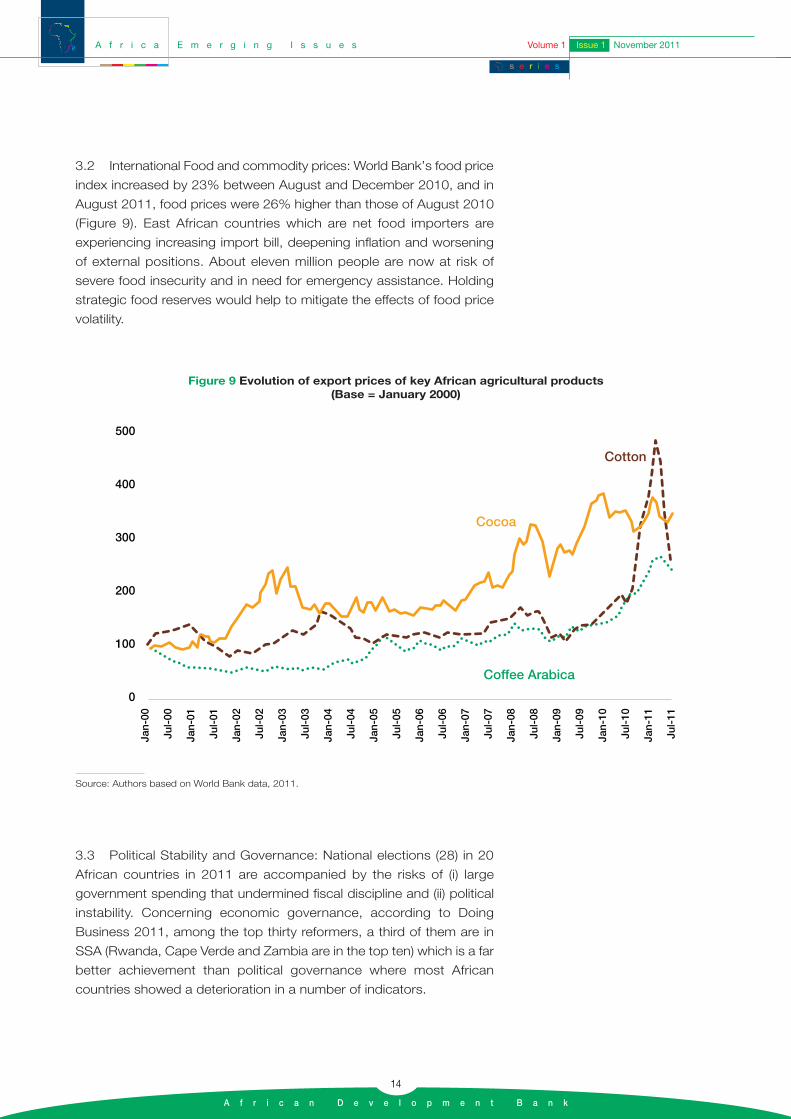
3.2 International Food and commodity prices: World Bank’s food price
index increased by 23% between August and December 2010, and in
August 2011, food prices were 26% higher than those of August 2010
(Figure 9). East African countries which are net food importers are
experiencing increasing import bill, deepening inflation and worsening
of external positions. About eleven million people are now at risk of
severe food insecurity and in need for emergency assistance. Holding
strategic food reserves would help to mitigate the effects of food price
volatility.
A f r i c a E m e r g i n g I s s u e s Volume 1 Issue 1 November 2011
s e r i e s
A f r i c a n D e v e l o p m e n t B a n k
14
Jan-
00
Jul-
00
Jan-
01
Jul-
01
Jan-
02
Jul-
02
Jan-
03
Jul-
03
Jan-
04
Jul-
04
Jan-
05
Jul-
05
Jan-
06
Jul-
06
Jan-
07
Jul-
07
Jan-
08
Jul-
08
Jan-
09
Jul-
09
Jan-
10
Jul-
10
Jan-
11
Jul-
11
500
400
300
200
100
0
Cocoa
Cotton
Coffee Arabica
Figure 9 Evolution of export prices of key African agricultural products (Base = January 2000)
Source: Authors based on World Bank data, 2011.
3.3 Political Stability and Governance: National elections (28) in 20
African countries in 2011 are accompanied by the risks of (i) large
government spending that undermined fiscal discipline and (ii) political
instability. Concerning economic governance, according to Doing
Business 2011, among the top thirty reformers, a third of them are in
SSA (Rwanda, Cape Verde and Zambia are in the top ten) which is a far
better achievement than political governance where most African
countries showed a deterioration in a number of indicators.
3.4 Other important challenges: Africa continues to face important
challenges such as infrastructure deficit, private sector promotion,
domestic resource mobilization, economic diversification and adaptation
to climate change. However, the recent unrest that swept many
countries has highlighted the dangers of chronic unemployment, poverty
and high inequality. Despite good economic performance and prudent
macroeconomic policies, Tunisia’s Revolution has been triggered by
high regional disparities, high level of youth graduate unemployment and
conspicuous and predatory corruption. It proved that economic growth
should be inclusive to sustain social and political stability. Given Africa’s
rapidly growing population, the demographic pressure on labor markets
will continue to generate more unrest and social instability.
Improvements are needed both on the supply and demand side of labor
markets. Relatively high inequality in Africa reflects that growth benefits
a small part of the population and the benefits of the poor are limited.
A f r i c a E m e r g i n g I s s u e sVolume 1 Issue 1 November 2011
s e r i e s
A f r i c a n D e v e l o p m e n t B a n k
15

A f r i c a E m e r g i n g I s s u e s
s e r i e s
A f r i c a n D e v e l o p m e n t B a n k
16
A f r i c a E m e r g i n g I s s u e sVolume 1 Issue 1 September 2011
s e r i e s
A f r i c a n D e v e l o p m e n t B a n k
17
This brief was prepared by Vinaye Ancharaz, Principal Research
Economist, supervised by Abebe Shimeles (Manager, EDRE2) and
Désiré Vencatachellum (Director, EDRE) under the overall guidance of
Prof. Mthuli Ncube, Chief Economist & Vice President, ECON.
The impact of the US credit rating downgrade and European debt crisis on Africa

A f r i c a E m e r g i n g I s s u e s Volume 1 Issue 1 November 2011
s e r i e s
A f r i c a n D e v e l o p m e n t B a n k
18

1 Introduction
The world economy once again is in turmoil due to sovereign debt crisis
in the United States (US) and Europe. The US credit downgrade came at
a critical time for the world as it may have the effect of gearing up market
sentiment against a rapid recovery. Stock markets plunged on news of
the downgrade, but recovered shortly afterwards and remain highly
volatile. Furthermore, European banks remain highly exposed to the
European sovereign debt. For example, if Spain fails to meet its debt
payments and needs to restructure its debt, European banks’ losses
would sky-rocket to €1.1 trillion, or 62% of their total bank capital. Some
American banks face the same level of exposure. For instance, JP Morgan
holds close to USD 15 billion of total exposure to Greece, Ireland, Italy,
Portugal and Spain. In this context, analysts reviewed downward both the
Eurozone and US 2011 gross domestic production (GDP) growth
forecasts. The International Monetary Fund’s latest World Economic
Outlook (released on September 20) slashed a whole point off the US
GDP growth forecast for 2011 relative to its June projections. The US
economy is now expected to end the year with an anemic 1.5% growth.
The euro area, with a forecast growth of 1.6% for the year (down from the
June forecast of 2%), will not do any better, and prospects will only
marginally improve in 2012. Similarly, the Economist Intelligence Unit (EIU)
lowered its euro zone growth forecast from 2% to 1.7% in August 2011.
We estimate that a 1% drop in GDP growth in the Organization for
Economic Cooperation and Development (OECD) countries will translate
into close to half a percentage point change in Africa’s growth. If the
2008/09 global crisis is any guide, the most important dimension of the
impact on Africa will be through significant reductions in Africa’s trade with
OECD countries. Our estimates show that a 1% drop in growth in GDP of
OECD countries results in a 10% reduction in Africa’s export earnings and
2.5% reduction in its imports.
The adverse effect of the 2008/2009 crisis would have been bigger had
it not been for the increased resilience of African economies. This is due
to better economic governance, and the rise of emerging economies,
which helped the continent reduce its dependency on its traditional
partners. However, unlike the 2008/2009 financial crises, the current
sovereign debt crisis may also affect the pace of growth in emerging
economies such as China, which could in turn have adverse effects on
Africa’s growth.
On the other hand, for African countries there is a silver lining to the
current crisis. Investor’s appetite for bonds issued by triple-A rated
A f r i c a E m e r g i n g I s s u e sVolume 1 Issue 1 November 2011
s e r i e s
A f r i c a n D e v e l o p m e n t B a n k
19
agencies from Africa has increased considerably recently. Even sovereign
bond issues by African countries like Ghana, Nigeria, Gabon and Senegal
have enjoyed success. For example, spreads on a new issue of 10-year
bonds by the Government of Senegal in May 2011 narrowed by over
100bp in the secondary market within two weeks of the launch,
confirming strong investor interest in such bonds.
The rest of this brief analyzes the potential impacts of the debt crisis in
US and Europe on Africa’s growth prospects and identifies the different
possible channels.
2 Channels of transmission of a debt crisis in US and Europe on Africa
Slower growth in OECD countries will affect African economies mainly
through five channels: trade, liquidity, sovereign risk, foreign direct
investment (FDI) and remittances, and volatility of portfolio flows, stock
markets and exchange rates.
2.1 Trade
Slower economic growth in OECD countries will result in lower demand for
Africa’s exports. This constitutes the most important transmission channel
through which African economies will be impacted. Indeed, Africa’s trade
contracted by 20.6% in the midst of the 2009 financial crisis. The decline
was larger for exports (-29%) than for imports (-11.7%), and varied across
countries and regions according to (i) the level of export concentration
(market access) and (ii) the degree of export market diversification. The
least diversified regions were most severely hit by the crisis.
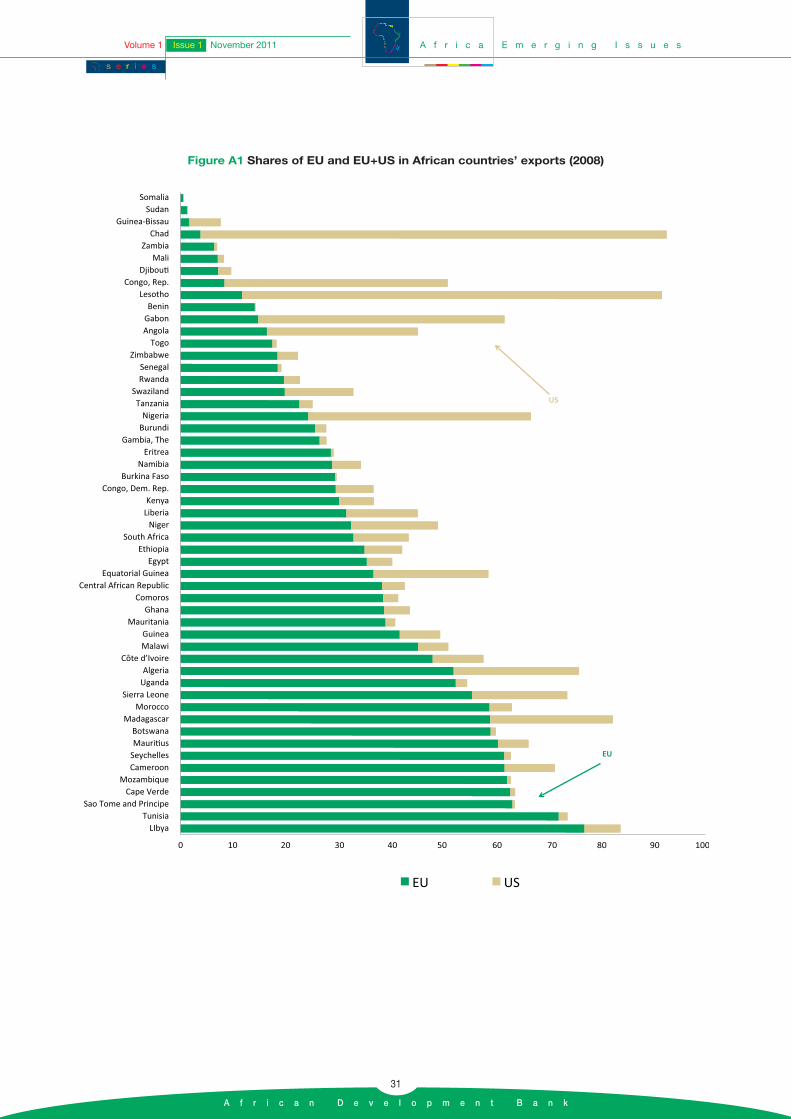
Africa remains the least diversified region in terms of market access. Fifteen
African countries send half or more of their exports to Europe (Figure A1).
These include the small and vulnerable island economies of Sao Tome and
Principe, Cape Verde, Mauritius, Seychelles and Comoros, which,
additionally, are highly dependent on European tourists, as well as oil
exporters like Libya, and more diversified economies like Tunisia. These
countries are therefore most exposed to the trade risks that a deepening
crisis in Europe might entail. In addition, the US is the main market for oil
exports from Chad, Gabon, Angola and Nigeria, and for Lesotho’s
garments, which makes these countries particularly vulnerable to a fall in
US demand. Regionally, North Africa is the most dependent on European
export markets, with the European Union (EU) taking in 58% of the region’s
exports in 2008 (Table 1). The CFA Franc zone countries, with 36.4% of
Recent analysis shows that shareprices of companies that derivemost of their revenues fromemerging markets declinedsignificantly following the debt crisislooming in the US and Europe. Thebelief that emerging economieswould lead the world economy intorecovery is becoming increasinglyuncertain (Bloomberg, 1 September2011).
A f r i c a E m e r g i n g I s s u e s Volume 1 Issue 1 November 2011
s e r i e s
A f r i c a n D e v e l o p m e n t B a n k
20

their exports destined for Europe, come next on the vulnerability scale,
followed by the wider West Africa region.
The CFA Franc zone countries, with 36.4% of their exports destined forEurope, come next on the vulnerability scale, followed by the wider WestAfrica region.
Many African countries export a few primary products that are vulnerableto price volatility often in a pro-cyclical manner. The debt crises and slowerrecovery in the world economy triggered a decline in the prices of somekey export commodities. The price of Brent crude, which has been on adownward path since mid-July 2011, continued to fall in the two weeksfollowing the US credit downgrade and, subsequently, poor second-quartergrowth results from Germany (Figure 1). The prices of copper and of silverare also falling, and need to be closely watched. On the other hand, theprice of gold is on the rise as market agents turn to a safer haven at a timeof great uncertainty.
A f r i c a E m e r g i n g I s s u e sVolume 1 Issue 1 November 2011
s e r i e s
A f r i c a n D e v e l o p m e n t B a n k
21
Source: Authors’ calculation based on UN COMTRADE and UNCTADStat.Notes: A higher value for the concentration indices means a higher degree of concentration.*The export destination concentration index for the CFA Franc Zone refers to the year 2008 since more recent data is not available.
% of total exports to EU (2008)
Export Destination Concen-tration Index (avg. 2008-2010)
Export Concentration Index (avg. 2008-2010)
North Africa 58.1 36.1 45.0CFA Franc Zone* 36.4 36.4 23.4West Africa 28.5 39.0 58.6Southern Africa 27.1 48.9 14.1Central Africa 26.9 56.0 83.4East Africa 17.3 39.4 13.6Africa 40.1 42.2 42.1
Table 1 Regional Indicators of Trade Risk
Figure 1 Trends in commodity prices (Base=January 2000)
Source: Authors’ calculation based on World Bank (2011).
The downward pressure on some commodity prices, if it persists, will
entail mixed fortunes for African economies. Major oil-exporting
countries are likely to see a significant contraction of domestic economic
activity as a result of these price shocks; mineral and metal exporters
like Zambia, Zimbabwe, Mauritania and Guinea would be the next most
affected group. On the other hand, Africa’s gold exporters (Ghana and
South Africa) may gain from the rising price of the precious metal but
this gain is likely to be offset – at least partly – by declining prices of iron
ore (for South Africa) and oil (for Ghana).
The price of cotton has been falling since March 2011 (Figure 2) and,
more recently the price of cocoa too has started falling on the back of
bumper harvests in the West African producers of this commodity. This
region is one of the least diversified of Africa (see Table 1), which
exposes it to high trade risk. If the euro zone debt crisis accentuates
the decline in these agricultural commodity prices, most of the West
Africa region will experience significant loss of export revenue, and
slower growth.
2.2 Tight liquidity
The contagion effect of the European debt crisis on the African banking
sector depends on the extent to which African banks are integrated into
the European banking system. The presence of European banks is
strong in some African countries, such as, Mozambique, Madagascar,
Botswana, Ghana, Cameroon, Rwanda, Zambia and Tanzania, where
these banks represent over half of total bank assets (Figure A2, in
annex). Angola, Uganda and several other countries also exhibit high
levels of foreign banks’ dominance. All these countries are particularly
vulnerable to a tightening of credit markets that could follow on the
European debt crisis.
Even if the current debt crisis did not degenerate into an economic crisis
of much bigger proportions, the cumulative effects of yet another
financial turmoil – this time caused by banks’ losses on assets
(government bonds) that they had long perceived as a safe haven – will
surely increase risk aversion and raise the cost of trade finance, just as
in the 2008-09 financial crisis. Box 1 provides an illustration of the
experience of Cocobod in Ghana during the 2008/09 crises.
2.3 Sovereign risk
Sovereign risks to African countries could arise from three potential
sources: (i) contraction in official development assistance (ODA) flows
Box 1 The impact of the 2008-2009 financial crisison trade finance: the case of Cocobod
Cocobod is a state-run Ghanaianmarketing board which oversees thecultivation, evaluation,transportation, and export of cocoa.Each year the export of Ghana’scocoa production is financed usinga receivables-backed, short termtrade finance facility. In fact, aheadof every crop year in Ghana,Cocobod, a first-class borrower,raises syndicated loans throughinternational financers in Europe forcocoa purchases. Although itsuccessful raised funds from theinternational market throughout theyears, this was seriously constrainedduring the financial crisis 2008-2009. Five commercial banksdeclined to participate in thesyndication. Its borrowing cost shotup by Libor plus 250 basis points,compared to Libor plus 45 basispoints in the previous year. Althoughthe borrowing cost has declinedsince then, the latest transactionclosed at Libor plus 90 basis points.
A f r i c a E m e r g i n g I s s u e s Volume 1 Issue 1 November 2011
s e r i e s
A f r i c a n D e v e l o p m e n t B a n k
22

from Europe, (ii) decline in trade-related tax revenues for African
governments, and (iii) higher cost of borrowing on the global credit
market.
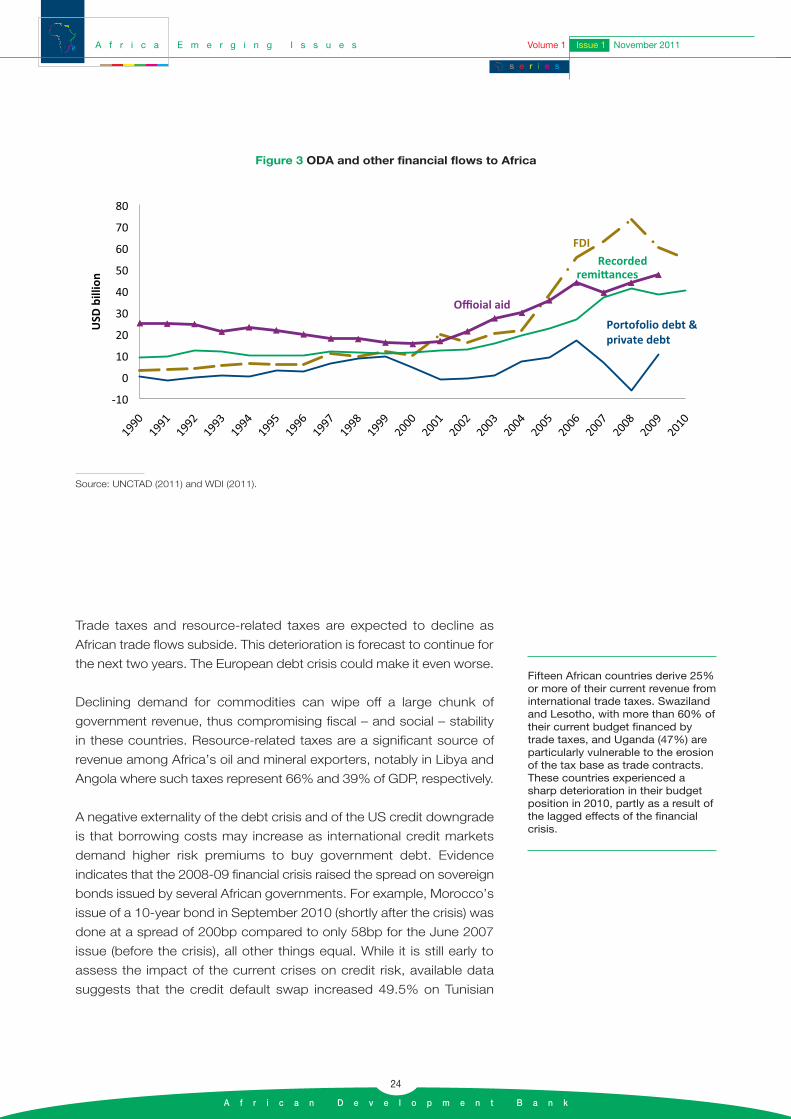
ODA flows to Africa from OECD countries are expected to face serious
setback due to the looming debt crises. Net ODA flows to Africa did
not decline during the 2008-09 financial crises (Figure 3). This arose
because Development Assistance Committee (DAC) aid disbursements
were buttressed by timely intervention of development finance
institutions, including the African Development Bank.
However, the context in which the current crisis is unfolding is different.
Fiscal austerity in much of Europe, is likely to translate into cuts in
development assistance by the EU as a whole. The US may also cut
aid as it tackles its growing budget deficit and national debt, and as
attention turns to more pressing domestic issues with elections next
year. African countries that rely heavily on aid from the OECD may face
significant cut in the flow of aid.
28 countries (over half of Africa)drew 50% or more of their ODAflows from the EU and US in 2009.Poor countries that depend to alesser extent on aid from EU and USbut for which aid represents asignificant share of their GDP – forexample, Liberia (over 100% ofGDP), Burundi (44.5%), Sierra Leone(25%), Mozambique (21%), Malawi(20.2%), and Rwanda (19%) – alsorun significant risks.
A f r i c a E m e r g i n g I s s u e sVolume 1 Issue 1 November 2011
s e r i e s
A f r i c a n D e v e l o p m e n t B a n k
23
0
100
200
300
400
500
Jan-
00
Jul-
00
Jan-
01
Jul-
01
Jan-
02
Jul-
02
Jan-
03
Jul-
03
Jan-
04
Jul-
04
Jan-
05
Jul-
05
Jan-
06
Jul-
06
Jan-
07
Jul-
07
Jan-
08
Jul-
08
Jan-
09
Jul-
09
Jan-
10
Jul-
10
Jan-
11
Jul-
11
Coffee Arabica
Cotton
Cocoa
Figure 2 Export prices of key African agricultural products
Source: Authors’ calculation based on World Bank (2011).
Trade taxes and resource-related taxes are expected to decline as
African trade flows subside. This deterioration is forecast to continue for
the next two years. The European debt crisis could make it even worse.
Declining demand for commodities can wipe off a large chunk of
government revenue, thus compromising fiscal – and social – stability
in these countries. Resource-related taxes are a significant source of
revenue among Africa’s oil and mineral exporters, notably in Libya and
Angola where such taxes represent 66% and 39% of GDP, respectively.
A negative externality of the debt crisis and of the US credit downgrade
is that borrowing costs may increase as international credit markets
demand higher risk premiums to buy government debt. Evidence
indicates that the 2008-09 financial crisis raised the spread on sovereign
bonds issued by several African governments. For example, Morocco’s
issue of a 10-year bond in September 2010 (shortly after the crisis) was
done at a spread of 200bp compared to only 58bp for the June 2007
issue (before the crisis), all other things equal. While it is still early to
assess the impact of the current crises on credit risk, available data
suggests that the credit default swap increased 49.5% on Tunisian
Fifteen African countries derive 25%or more of their current revenue frominternational trade taxes. Swazilandand Lesotho, with more than 60% oftheir current budget financed bytrade taxes, and Uganda (47%) areparticularly vulnerable to the erosionof the tax base as trade contracts.These countries experienced asharp deterioration in their budgetposition in 2010, partly as a result ofthe lagged effects of the financialcrisis.
A f r i c a E m e r g i n g I s s u e s Volume 1 Issue 1 November 2011
s e r i e s
A f r i c a n D e v e l o p m e n t B a n k
24
Figure 3 ODA and other financial flows to Africa
Source: UNCTAD (2011) and WDI (2011).
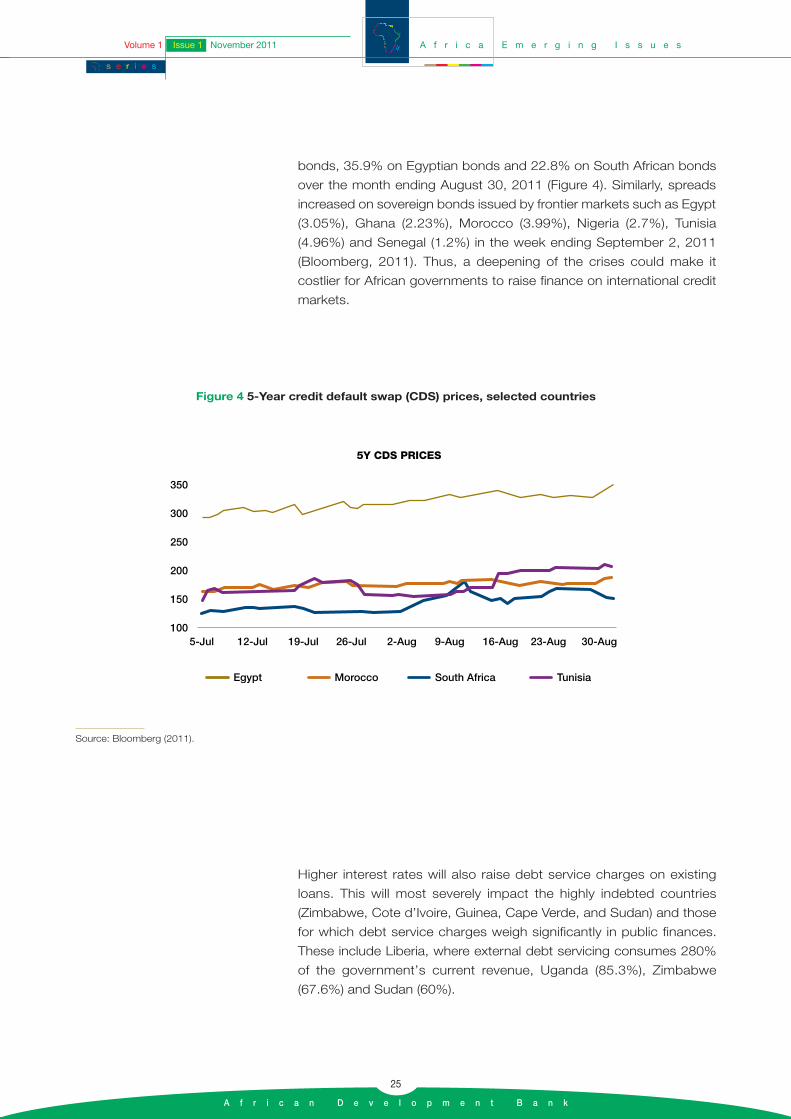
bonds, 35.9% on Egyptian bonds and 22.8% on South African bonds
over the month ending August 30, 2011 (Figure 4). Similarly, spreads
increased on sovereign bonds issued by frontier markets such as Egypt
(3.05%), Ghana (2.23%), Morocco (3.99%), Nigeria (2.7%), Tunisia
(4.96%) and Senegal (1.2%) in the week ending September 2, 2011
(Bloomberg, 2011). Thus, a deepening of the crises could make it
costlier for African governments to raise finance on international credit
markets.
A f r i c a E m e r g i n g I s s u e sVolume 1 Issue 1 November 2011
s e r i e s
A f r i c a n D e v e l o p m e n t B a n k
25
350
300
250
200
150
1005-Jul 12-Jul 19-Jul 26-Jul 2-Aug 9-Aug 16-Aug 23-Aug 30-Aug
Egypt Morocco South Africa Tunisia
5Y CDS PRICES
Figure 4 5-Year credit default swap (CDS) prices, selected countries
Source: Bloomberg (2011).
Higher interest rates will also raise debt service charges on existing
loans. This will most severely impact the highly indebted countries
(Zimbabwe, Cote d’Ivoire, Guinea, Cape Verde, and Sudan) and those
for which debt service charges weigh significantly in public finances.
These include Liberia, where external debt servicing consumes 280%
of the government’s current revenue, Uganda (85.3%), Zimbabwe
(67.6%) and Sudan (60%).
2.4 FDI and Remittances
FDI flows, which peaked at USD 73.4 billion in 2008, have declined two
years in a row to USD 55 billion in 2010 (Figure 3) due largely to sluggish
economic growth in developed economies. The uncertainty and loss of
confidence generated by the downgrade of the US credit rating, growing
doubts about economic recovery in the US, and deterioration of the
debt crisis in the euro zone will surely sustain the downward trend in
FDI flows to Africa this year – and possibly the next – as it happened
following the 2008-09 financial crisis. The downturn expected might be
dampened by the emerging trend among investors being bullish about
bonds issued by agencies based in Africa.
Africa’s biggest recipients of FDI are likely also to be the biggest losers.
North Africa took away 35% of FDI to Africa during 2005-2009 while
Angola, Congo, Nigeria and South Africa – all rich in natural resources
– together accounted for another 45%. These countries – and especially
North African countries like Tunisia, Egypt and Libya that are yet to
recover from political crisis – are naturally the most exposed to any
decline in FDI flows. China and Africa’s other emerging partners could
help cushion the shortfall in FDI from Europe. However, the evidence
from the 2008-09 financial crises is not very encouraging. FDI flows to
Africa in the aggregate declined 37% in 2009.
Remittances have progressively increased since 2000, reaching USD
40 billion (2.6% of GDP) in 2010, and they proved resilient to the 2008-
09 financial crisis, but this may not continue. Significantly, France, US,
UK, Spain and Italy (in that order) figure among the top 10 destinations
for African emigrants. A deepening of the debt crisis could therefore lead
to a reduction in remittance flows to Africa, the magnitude of which is
hard to predict. As usual, the countries that depend most on
remittances will be most severely affected. These include Senegal,
Sudan, Kenya, Nigeria, Morocco, and Tunisia, for which remittances
represented over 5% of GDP in 2009.
2.5 Portfolio flows, stock market and exchange
rate volatility
The US credit downgrade and the debt crisis have caused a significant
degree of stock market volatility across Europe and beyond, the effects
of which are difficult to separate. African stock markets have not been
spared. Due to their higher level of integration with the global economy,
South Africa, Nigeria and Egypt saw their stock market plunging by 6.9%,
5.5% and 10.6%, respectively in the first three days of trading following
Since the beginning of August 2011,foreign investors have sold as muchas R 5.9 billion of South Africanstocks. Although R 4.7 billion worthof bonds were bought during thesame period, this was done athigher risk premium, which showsthat the effects of the crisis are real.
A f r i c a E m e r g i n g I s s u e s Volume 1 Issue 1 November 2011
s e r i e s
A f r i c a n D e v e l o p m e n t B a n k
26
the US credit downgrade. During the 2008/2009 crises stock markets in
Nigeria, Egypt and South Africa plunged more than 50%, which is a stark
reminder of the sensitivity of African stock markets to external shocks.
Many frontier markets in Africa witnessed a sharp reversal in portfolio
flows during the financial crisis when portfolio investment to Africa fell
from USD 6.9 billion in 2007 to negative USD 6.2 billion in 2008. The
adverse shock of a sudden drop in capital inflows can be particularly
severe for African countries, such as South Africa, which rely on such
inflows in order to finance their current account deficits.
Sharp fluctuations of the euro have eroded the earnings for important
sectors in Africa. In Kenya’s horticulture sector, for example, growth
estimates for earnings during this year were reviewed downward to 8%
from an initial 15%. This has put further pressure on Kenya’s weakening
currency (Reuters, 2011). Similar pressure on African national currencies
has been observed elsewhere.
3 Conclusion
The debt crisis unfolding in the US and Europe has a significant and far
reaching consequence on the economies of most countries in Africa
through more than one channel. On the whole trade risk appears to be
the single most important determinant of the magnitude of the economic
impact on African countries. Hence, countries that export primarily to
Europe and are specialized in a few products whose prices are subject
to pro-cyclical fluctuations are most vulnerable to the European debt
crisis. Among these countries are Africa’s oil and minerals producers,
and exporters of agricultural products like cotton and cocoa.
If the 2008-09 financial crises served any lesson, however, we expect
African economies to be better prepared to face the current crisis.
Expansionary demand management policies could help cushion the
adverse impacts on jobs and growth. Unfortunately, most African
governments will have little room for maneuver if sources of public
finance such as ODA and trade taxes dry up. Development finance
institutions will therefore have an important role to play in supporting
government budgets during the crisis. On the other hand, Africa’s
emerging partners, by helping to sustain commodity export volumes,
can actually help minimize the impact of the crisis on the most vulnerable
economies.
The African Development Bank is closely monitoring the unfolding
events as it did in the past to help alleviate adverse impacts on regional
The horticulture sector in Kenya,whose growth estimates forearnings during this year werereviewed downward to 8% from an initial 15%. This has put furtherpressure on Kenya’s weakeningcurrency (Reuters, 2011). Similarpressure on African nationalcurrencies has been observedelsewhere.
Uncertain market conditions aregenerating unstable movements incurrency market that would increaserisk premium for investors. The riskpremium on South Africa’s four-yearbonds have increased to 6.13percentage points from 5.11percentage points on Jan. 5, 2011.
A f r i c a E m e r g i n g I s s u e sVolume 1 Issue 1 November 2011
s e r i e s
A f r i c a n D e v e l o p m e n t B a n k
27
member countries. During the 2008/09 crises the Bank put in place a
successful Trade Finance Initiative, with an initial endowment of USD
500 million, and contributed a similar amount to the Global Trade
Liquidity Program (GTLP). The African Development Bank is currently
developing an African Trade Finance Risk Sharing Facility (ATFRSF),
which involves a risk sharing arrangement between the Bank and a
confirming bank to facilitate trade flows in Africa. The Bank will assume
a higher share of risk to promote trade in strategic areas such as fragile
states, longer tenors and intra-African trade. The Bank will also continue
to deploy quick disbursement instruments in order to meet the urgent
financing demands of its regional member countries during any future
crisis.
A f r i c a E m e r g i n g I s s u e s Volume 1 Issue 1 November 2011
s e r i e s
A f r i c a n D e v e l o p m e n t B a n k
28
References
Bloomberg, 1 September 2011. “BRICs No Cure for Global Economic
Growth”.
Reuters, 5th August, 2011. Kenya cuts 2011 horticulture earnings
growth forecast.
Claessens, S., N. Van Horen, T. Gurcanlar and J. Mercado. 2008.
“Foreign Bank Presence in Developing Countries 1995-2006: Data and
Trends”, unpublished manuscript.
UNCTAD.2010. The World Investment Report 2010. Investing in a low-
carbon economy. 20th anniversary edition. United Nation. New York and
Geneva.
UNCTAD.2010. UNCTAD HANDBOOK OF STATISTICS 2010. United
Nation. New York and Geneva.
UNComtrade. 2010. United Nations Commodity Trade Statistics
Database. Source: http://comtrade.un.org/db/.
World Bank.2011. World Development Indicators. Source:
http://data.worldbank.org/data-catalog/world-development-indicators.
A f r i c a E m e r g i n g I s s u e sVolume 1 Issue 1 November 2011
s e r i e s
A f r i c a n D e v e l o p m e n t B a n k
29

a n n e x e s
A f r i c a n D e v e l o p m e n t B a n k
31
s A f r i c a E m e r g i n g I s s u e sVolume 1 Issue 1 November 2011
s e r i e s
EU US
EU
US
SomaliaSudan
Guinea-BissauChad
ZambiaMali
Djibou Congo, Rep.
LesothoBeninGabonAngolaTogo
ZimbabweSenegalRwanda
SwazilandTanzaniaNigeriaBurundi
Gambia, TheEritrea
NamibiaBurkina Faso
Congo, Dem. Rep.KenyaLiberiaNiger
South AfricaEthiopiaEgypt
Equatorial GuineaCentral African Republic
ComorosGhana
MauritaniaGuineaMalawi
Côte d’IvoireAlgeriaUganda
Sierra LeoneMorocco
MadagascarBotswanaMauri usSeychellesCameroon
MozambiqueCape Verde
Sao Tome and PrincipeTunisiaLIbya
0 10 20 30 40 50 60 70 80 90 100
Figure A1 Shares of EU and EU+US in African countries’ exports (2008)

A f r i c a E m e r g i n g I s s u e s Volume 1 Issue 1 November 2011
s e r i e s
A f r i c a n D e v e l o p m e n t B a n k
32
Figure A2 Foreign banks’ dominance in Africa in 2005
Note: A South bank is a foreign bank incorporated in a developing or emerging country. Non-South Banks are all other banks. Source: Authors’ calculation based on Claessens et al. (2008).
% non-South in total % other foreign in total
South Africa
Mauritania
Malawi
Seychelles
Niger
Namibia
Mauri us
Mali
Nigeria
Swaziland
Algeria
Egypt
Benin
Morocco
Sudan
Tunisia
Côte d’Ivoire
DRC
Burkina Faso
Burundi
Kenya
Zimbabwe
Senegal
Uganda
Angola
Tanzania
Zambia
Rwanda
Cameroon
Ghana
Botswana
Madagascar
Mozambique
0 10 20 30 40 5O 60 70 80 90 100
A f r i c a E m e r g i n g I s s u e sVolume 1 Issue 1 November 2011
s e r i e s
A f r i c a n D e v e l o p m e n t B a n k
33

A f r i c a E m e r g i n g I s s u e s
s e r i e s
A f r i c a n D e v e l o p m e n t B a n k
34
A f r i c a E m e r g i n g I s s u e sVolume 1 Issue 1 September 2011
s e r i e s
A f r i c a n D e v e l o p m e n t B a n k
35
This brief was prepared by Thouraya Triki, Principal Research
Economist, EDRE.1 and Adeleke Oluwole Salami, Research
Economist, EDRE.2 and supervised by Désiré Vencatachellum,
Director, EDRE and John Anyanwu, Lead Economist,
under the overall guidance of the Prof. Mthuli Ncube, Chief Economist
& Vice President, ECON.
Managing Food Price Volatility for Improved Food Security in Africa

A f r i c a E m e r g i n g I s s u e s Volume 1 Issue 1 November 2011
s e r i e s
A f r i c a n D e v e l o p m e n t B a n k
36
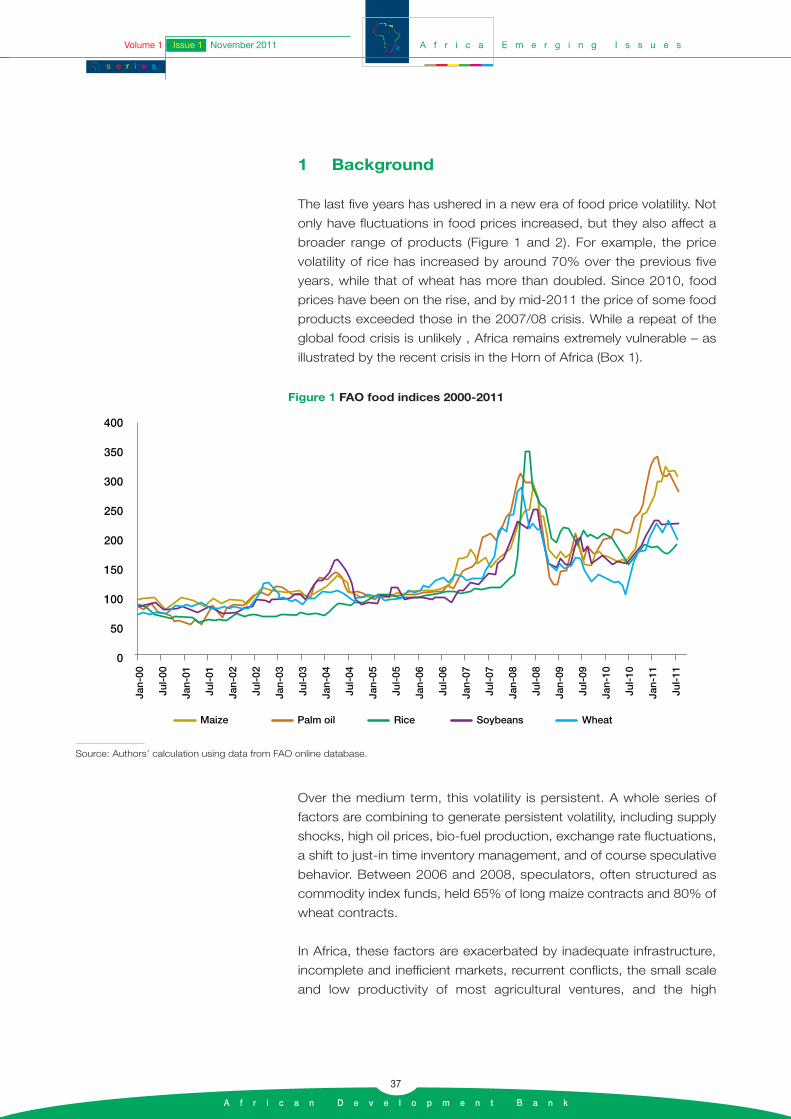
1 Background
The last five years has ushered in a new era of food price volatility. Not
only have fluctuations in food prices increased, but they also affect a
broader range of products (Figure 1 and 2). For example, the price
volatility of rice has increased by around 70% over the previous five
years, while that of wheat has more than doubled. Since 2010, food
prices have been on the rise, and by mid-2011 the price of some food
products exceeded those in the 2007/08 crisis. While a repeat of the
global food crisis is unlikely , Africa remains extremely vulnerable – as
illustrated by the recent crisis in the Horn of Africa (Box 1).
Over the medium term, this volatility is persistent. A whole series of
factors are combining to generate persistent volatility, including supply
shocks, high oil prices, bio-fuel production, exchange rate fluctuations,
a shift to just-in time inventory management, and of course speculative
behavior. Between 2006 and 2008, speculators, often structured as
commodity index funds, held 65% of long maize contracts and 80% of
wheat contracts.
In Africa, these factors are exacerbated by inadequate infrastructure,
incomplete and inefficient markets, recurrent conflicts, the small scale
and low productivity of most agricultural ventures, and the high
A f r i c a E m e r g i n g I s s u e sVolume 1 Issue 1 November 2011
s e r i e s
A f r i c a n D e v e l o p m e n t B a n k
37
400
350
300
250
200
150
100
50
0
Jan-
00
Jul-
00
Jan-
01
Jul-
01
Jan-
02
Jul-
02
Jan-
03
Jul-
03
Jan-
04
Jul-
04
Jan-
05
Jul-
05
Jan-
06
Jul-
06
Jan-
07
Jul-
07
Jan-
08
Jul-
08
Jan-
09
Jul-
09
Jan-
10
Jul-
10
Jan-
11
Jul-
11
Maize Palm oil Rice Soybeans Wheat
Figure 1 FAO food indices 2000-2011
Source: Authors’ calculation using data from FAO online database.
vulnerability to climate change. The continent’s modest 2% annual
growth in food output, compared to population growth of 2.4%, and
shift in consumption habits also compound the issue.
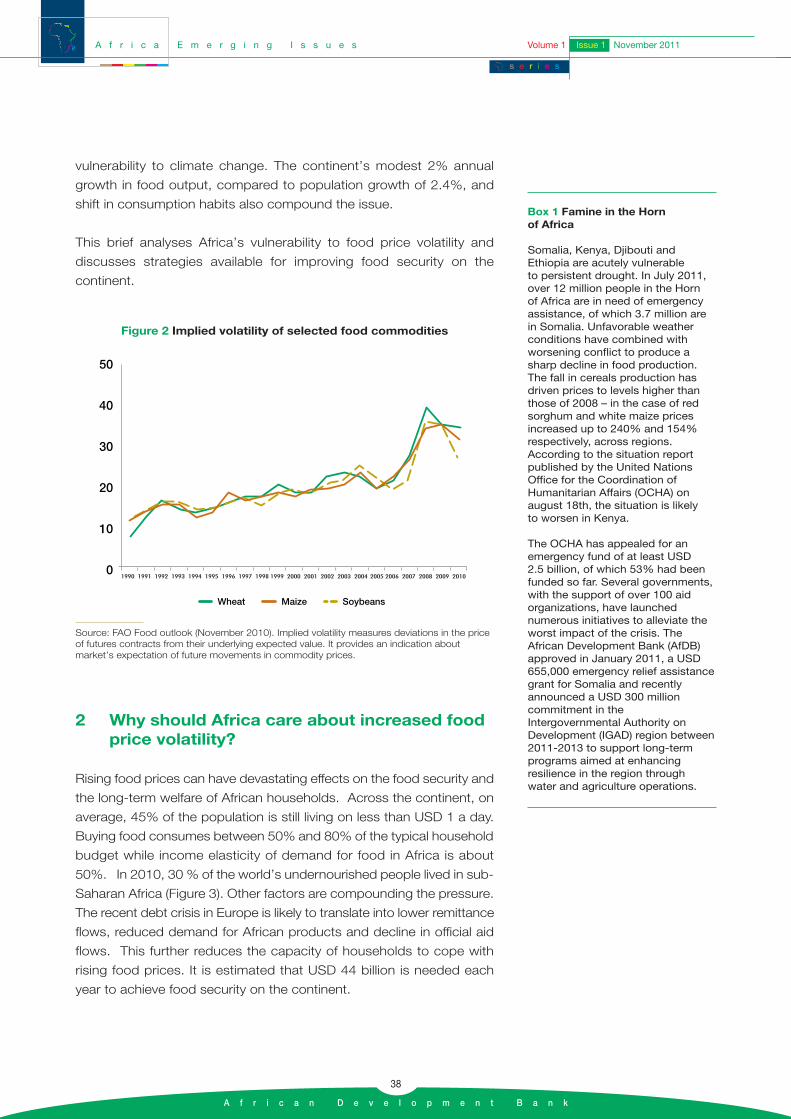
This brief analyses Africa’s vulnerability to food price volatility and
discusses strategies available for improving food security on the
continent.
2 Why should Africa care about increased food price volatility?
Rising food prices can have devastating effects on the food security and
the long-term welfare of African households. Across the continent, on
average, 45% of the population is still living on less than USD 1 a day.
Buying food consumes between 50% and 80% of the typical household
budget while income elasticity of demand for food in Africa is about
50%. In 2010, 30 % of the world’s undernourished people lived in sub-
Saharan Africa (Figure 3). Other factors are compounding the pressure.
The recent debt crisis in Europe is likely to translate into lower remittance
flows, reduced demand for African products and decline in official aid
flows. This further reduces the capacity of households to cope with
rising food prices. It is estimated that USD 44 billion is needed each
year to achieve food security on the continent.
Box 1 Famine in the Horn of Africa
Somalia, Kenya, Djibouti andEthiopia are acutely vulnerable to persistent drought. In July 2011,over 12 million people in the Horn of Africa are in need of emergencyassistance, of which 3.7 million arein Somalia. Unfavorable weatherconditions have combined withworsening conflict to produce asharp decline in food production.The fall in cereals production hasdriven prices to levels higher thanthose of 2008 – in the case of redsorghum and white maize pricesincreased up to 240% and 154%respectively, across regions.According to the situation reportpublished by the United NationsOffice for the Coordination ofHumanitarian Affairs (OCHA) onaugust 18th, the situation is likely to worsen in Kenya.
The OCHA has appealed for anemergency fund of at least USD 2.5 billion, of which 53% had beenfunded so far. Several governments,with the support of over 100 aidorganizations, have launchednumerous initiatives to alleviate theworst impact of the crisis. TheAfrican Development Bank (AfDB)approved in January 2011, a USD655,000 emergency relief assistancegrant for Somalia and recentlyannounced a USD 300 millioncommitment in theIntergovernmental Authority onDevelopment (IGAD) region between2011-2013 to support long-termprograms aimed at enhancingresilience in the region throughwater and agriculture operations.
A f r i c a E m e r g i n g I s s u e s Volume 1 Issue 1 November 2011
s e r i e s
A f r i c a n D e v e l o p m e n t B a n k
38
1990 1991 1992 1993 1994 1995 1996 1997 1998 1999 2000 2001 2002 2003 2004 2005 2006 2007 2008 2009 2010
50
40
30
20
10
0
Wheat Maize Soybeans
Figure 2 Implied volatility of selected food commodities
Source: FAO Food outlook (November 2010). Implied volatility measures deviations in the priceof futures contracts from their underlying expected value. It provides an indication aboutmarket’s expectation of future movements in commodity prices.
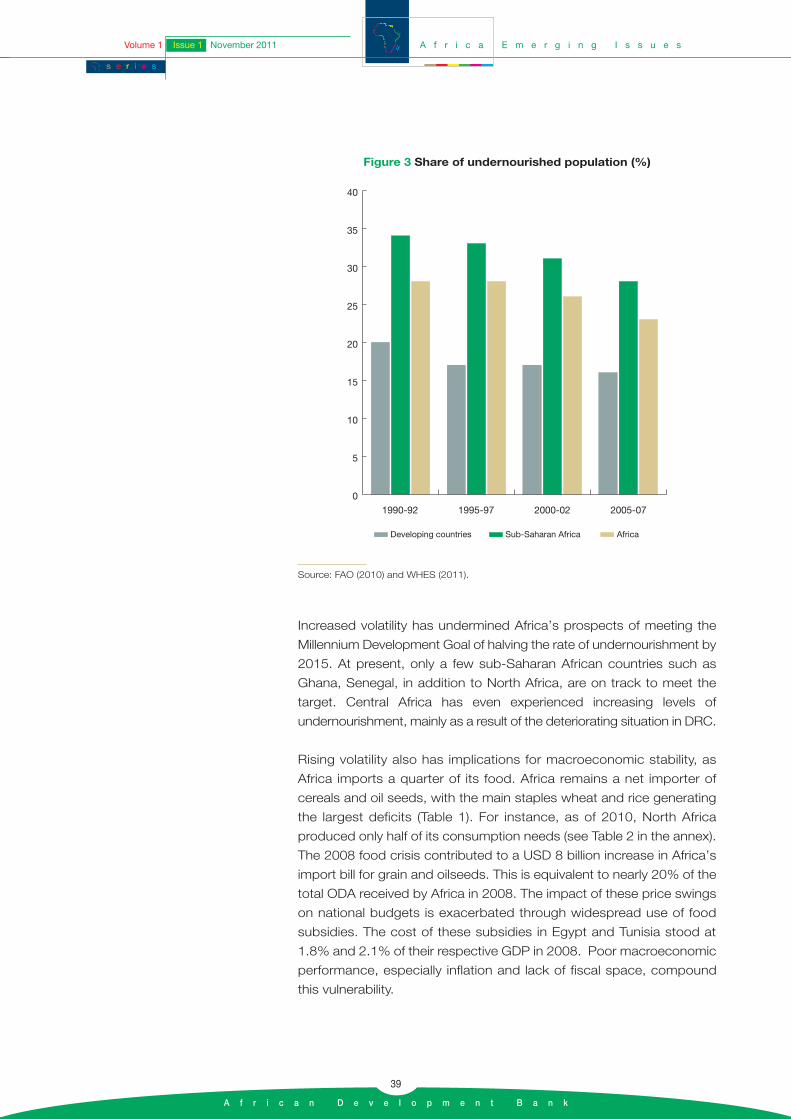
Increased volatility has undermined Africa’s prospects of meeting the
Millennium Development Goal of halving the rate of undernourishment by
2015. At present, only a few sub-Saharan African countries such as
Ghana, Senegal, in addition to North Africa, are on track to meet the
target. Central Africa has even experienced increasing levels of
undernourishment, mainly as a result of the deteriorating situation in DRC.
Rising volatility also has implications for macroeconomic stability, as
Africa imports a quarter of its food. Africa remains a net importer of
cereals and oil seeds, with the main staples wheat and rice generating
the largest deficits (Table 1). For instance, as of 2010, North Africa
produced only half of its consumption needs (see Table 2 in the annex).
The 2008 food crisis contributed to a USD 8 billion increase in Africa’s
import bill for grain and oilseeds. This is equivalent to nearly 20% of the
total ODA received by Africa in 2008. The impact of these price swings
on national budgets is exacerbated through widespread use of food
subsidies. The cost of these subsidies in Egypt and Tunisia stood at
1.8% and 2.1% of their respective GDP in 2008. Poor macroeconomic
performance, especially inflation and lack of fiscal space, compound
this vulnerability.
A f r i c a E m e r g i n g I s s u e sVolume 1 Issue 1 November 2011
s e r i e s
A f r i c a n D e v e l o p m e n t B a n k
39
Figure 3 Share of undernourished population (%)
0
5
10
15
20
25
30
35
40
1990-92 1995-97 2000-02 2005-07
Developing countries Sub-Saharan Africa Africa
Source: FAO (2010) and WHES (2011).

Food price volatility is not just an economic problem – it is also a serious
political challenge. As rising food prices push people further into poverty
and hunger, desperation could trigger widespread political unrest,
threatening the stability and even the viability of political systems across
Africa. There is already evidence that high food prices have let to rioting
by people with little to lose. African countries without strong traditions
of democracy are likely to find it very difficult to manage these tensions.
A f r i c a E m e r g i n g I s s u e s Volume 1 Issue 1 November 2011
s e r i e s
A f r i c a n D e v e l o p m e n t B a n k
40
Table 1 Africa’s simplified commodity current account for selected food commodities (2008-2010)
in Billion, USD Year 2008 Year 2009 Year 2010Import Export Import Export Import Export
Grains and oilseeds
Corn 2.65 0.41 2.27 0.53 2.07 0.40
Wheat 10.6 0.11 7.05 0.14 5.83 0.01
Soybean oil/byproducts 3.06 0.13 2.22 0.12 1.73 0.06
Sorghum 0.12 0.03 0.08 0.01 0.06 0.02
Palm oil 2.83 0.22 2.13 0.18 2.39 0.05
Rice 13.3 0.86 10.58 0.88 5.15 0.80
Total grains and oilseeds 32.56 1.76 24.33 1.86 17.22 1.34
Source: Authors’ calculation using data from AfDB Statistics Department and COMTRADE database.
300
280
260
240
220
200
180
160
140
120
100
Fo
od
Pri
ce In
dex
2004 2006 2008 2010 2011
Figure 4 Food prices and social unrest in Africa
Source: Adapted from Lagi et al. (2011). Vertical lines correspond to beginning dates for food riots, while overall death toll are in parentheses.
3 Strategies for managing food price volatility
African countries have applied different strategies to address the
problem of commodity price volatility. Experience suggests that a
combination of policies is likely to be most effective, and that solutions
need to be adapted to the local context. For instance countries that
have the potential to grow crops locally, and those growing very specific
food products (e.g. the Ethiopian Teff) should seek to address structural
inefficiencies in their agricultural policies in order to reduce both
domestic volatility and exposure to international volatility. Conversely,
countries that have no potential to grow locally-needed staples should
seek to reduce exposure to international price volatility since there is
less scope for addressing volatility through local production. Success
also requires measures across all links in the value chain. This section
discusses the range of policy options and strategies available to limit
the impact of food price volatility on food security. Some of these policies
have been recently supported by the G-20 agriculture ministers during
their last meeting in Paris (Box 2).
3.1 Improving domestic food supply
The development of Africa’s agriculture has been plagued by limited
access to finance, low productivity, lack of capacity and vulnerability to
climate change. The most basic strategy for reducing food insecurity is
to address bottlenecks across the entire value chain, to unlock Africa’s
agricultural potential. There is an urgent need for innovative solutions.
For instance, finance could be provided through value chain lending,
private equity funds, and guarantee schemes. Several African countries,
including Zambia, Malawi, Kenya and Tanzania, have introduced input
subsidy programs to support small producers. While Malawi’s
experience is often cited as a success story, Zambia’s program had only
limited effects on food security because of poor targeting and inefficient
use of fertilizers. Similarly, advances in biotechnology could be leveraged
to enhance productivity. Guinea and Mali, for example, have been
successful in improving their staple food crop by introducing new seed
varieties. Achieving food self sufficiency also requires investment in
storage, processing and distribution infrastructure, as well as close
attention to the issue of waste management.
3.2 Enhanced market information
Timely and reliable market information on current and projected
demand, stocks and crop supply could reduce uncertainty and prevent
panic-driven market movements. The Famine Early Warning System
Box 2 Outcome of the G-20agriculture ministers meeting in Paris
The last meeting of the G-20agriculture ministers held last Junein Paris stressed the need for (i)Improved agriculture production andproductivity, (ii) Enhanced marketinformation and transparency, (iii)More efficient international policycoordination, (iv) New and enhancedrisk management tools and (v)Closer monitoring of agriculturalcommodities derivatives markets.The ministerial declaration providedsupport to several existing initiativesand announced the official launch ofnew initiatives including, theInternational Research Initiative forWheat Improvement (IRIWI) tocoordinate research efforts onwheat, the Agricultural MarketInformation System (AMIS) to ensureimproved market data on key crops,the Global Agricultural Geo-Monitoring Initiative to provideAMIS with weather and cropforecasts data, the High level Panelof Experts of the Committee onWorld Food Security (CFS) and theRapid Response Forum to improvepolicy coordination and coherence,and the Agriculture and FoodSecurity Risk Management tool-boxto help stakeholders in the foodindustry assess risks and managethem. The action plan also called fora feasibility study for a targetedemergency humanitarian foodreserves system, more efforts toensure enhanced regulation andsupervision of agricultural financialmarkets and close monitoring of theaction plan commitments.
Source: Ministerial declaration, action planon food price volatility and agriculture.
A f r i c a E m e r g i n g I s s u e sVolume 1 Issue 1 November 2011
s e r i e s
A f r i c a n D e v e l o p m e n t B a n k
41
Network, which currently provides food vulnerability data for 24 African
countries, is an example of this kind of measure. Other proposals along
these lines include the AMIS, an International Food Agency to report on
international stock levels, and an Early Warning System to detect price
abnormalities and shortfalls in demand. While these initiatives are still at
early or concept stage, they hold considerable promise for countering
food price volatility. However, the multiplicity of stakeholders involved in
the food industries and the shortage of information on stock holdings
make their implementation very challenging.
3.3 Risk management instruments
African producers and buyers use commodity derivatives to hedge
against adverse market movements. International markets such as the
Chicago Board of Trade and a small number of African markets (e.g.,
the South African SAFEX and the African Mercantile Exchange in Kenya)
offer derivatives on food commodities. The credit exposure to these
derivatives could be managed through risk-sharing facilities such as the
Global Agricultural Price Risk Management Facility recently launched by
the IFC. This is likely to extend the outreach of hedging products to
market participants in Africa.
At present, African buyers and producers make very limited use of
derivatives to manage food price volatility. This reflects the small scale
of agricultural businesses, lack of capacity, inappropriate market
infrastructure and inefficient regulatory frameworks. An integrated risk
management strategy is therefore needed to address these barriers.
The existence of a well functioning spot market is also necessary for the
success of an African derivatives exchange.
This calls for the establishment of more organized commodities
markets such as the Ethiopia Commodity Exchange (Box 3). Exposure
to food price volatility could also be managed through innovative
financial instruments such as commodity swaps linked to a loan,
weather derivatives and catastrophe bonds. Similarly, innovative
solutions could be used to improve operators’ access to risk
management tools (Box 4).
3.4 Limiting speculation through regulatory reforms
Reduced volatility could be achieved through stricter regulation on
speculation activities. This includes larger margin requirements,
enhanced disclosure for Over the Counter operations and higher delivery
rates on forward contracts. However, stricter regulation should not
Box 3 Ethiopia CommodityExchange (ECX)
Ethiopia Commodity Exchange(ECX) was launched in 2008 to linkall market actors in the foodindustry. Coffee, sesame, maize,wheat and pea beans are listedcommodities on ECX. Currently,ECX contracts involve largely spottrading. Planning is at advancedstage to offer future and forwardcontracts trading. ECX provides asafe and reliable End-to-End systemfor handling, grading, and storingcommodities, matching offers andbids for commodity transactions.ECX offers also warehouse andreceipt services; central depositarytrading, clearing and settlement andmarket data. Remarkably, ECX isusing warehouse proceeds ascollateral for loans, an innovativeway of increasing farmer’s access tocredit. To address the effect offinancial speculation, prices are keptwithin 5% corridor over a ten-dayperiod. As of July 2011 ECX hascovered over 2.4 million smallholderfarmers and facilitated USD 1.4billion in trade value.
Source: Alemu and Meijerin (2010) andECX website.
A f r i c a E m e r g i n g I s s u e s Volume 1 Issue 1 November 2011
s e r i e s
A f r i c a n D e v e l o p m e n t B a n k
42
jeopardize the important price discovery function offered by futures
contracts. Addressing the problem of speculation also requires
international harmonisation in order to avoid regulatory arbitrage.
3.5 Trade facilitation
Lower price volatility could be achieved by more efficient trade links, so
that shortfalls in some countries could be offset by excess production
in others. This could be accomplished by limiting the use of import and
export restrictions. In Africa, most countries already apply low tariffs on
basic foodstuffs. Hence, a global response should rather seek to reduce
the use of export restrictions. Indeed, while export restrictions can help
address short-term volatility, over the longer term they are likely to
translate into higher volatility, since they reduce the incentive to invest
in agriculture and destroy trade links. Trade flows could also be
strengthened by establishing efficient market facilitators. For example,
a Grain Clearing House Arrangement to guarantee contract delivery or
a Food Import Facility to soften the financing constraint might prove
viable options for Africa. However, such facilities are mainly for
responding to emergency situations, rather than managing on-going
price volatility.
3.6 Market stabilisation schemes
Stabilisation schemes have been implemented at various levels (national,
regional and international) and in various forms, including buffer stocks.
International Commodity Agreements (ICAs), for example, were
established to stabilise the international price of selected commodities,
including wheat and cocoa. Most ICAs failed because of the difficulties
with accurately assessing required stock levels and the reference price
for interventions, as well as lack of funding. Experience shows that such
schemes are more suitable for stabilising short-term price variations than
long-term volatility.
4 Policy recommendations
Use and facilitate management of food prices volatility through risk
management instruments. This would require measures to develop
African derivatives markets, and improve access to international
markets where this is not a viable option. Given the small scale of most
African economies, a regional or continent-wide initiative might be
more suitable. The African Development Bank could take the lead in
creating an African fund for food stability to support interventions on
Box 4 Using mobile technology to improve smallholder insurancecoverage
In 2010, Safaricom partnered withUAP, a Kenyan insurance providerand the Syngenta Foundation forSustainable Agriculture, a Swiss-based NGO to offer the KilimoSalama “safe farming” contract inKenya, a micro-insurance productagainst excessive weather events.Farmers can buy insurance inexchange of a 5% surcharge ontheir inputs purchases bought fromparticipating agro-dealers. Thedealers use a camera phone to scana special code that registersimmediately the policy and channelthe payment to UAP throughSafaricom M-Pesa service. Theprogram uses solar-poweredweather stations to channelinformation about weatherconditions to UAP. When extremeweather conditions such as drought,excessive or insufficient rain arerecorded, all farmers registeredwithin affected regions receivepayouts via M-Pesa. Over 11,000farmers were covered by theprogram in 2010. In 2011, UAPlaunched the Kilimo Salama plusproduct to cover the value of farmharvest rather than the value of thefarm input as done under the KilimoSalama contract.
Source: UAP Kenya and SyngentaFoundation websites.
A f r i c a E m e r g i n g I s s u e sVolume 1 Issue 1 November 2011
s e r i e s
A f r i c a n D e v e l o p m e n t B a n k
43

derivatives markets during periods of high volatility, and to build virtual
food reserves aimed at reducing disruptions in supply and price
spikes. The fund could also offer advisory services to help countries
mainstream risk management into their agriculture development
policies and build capacity in this area. Access to insurance products
should also be fostered. This could be achieved by allowing low-
income countries to tap into concessional funds to buy weather
insurance, or by offering risk-sharing facilities to manage the underlying
credit risk.
Develop early warning mechanisms and contingency plans for Africa. A
recent report jointly published by leading institutions involved in food
issues concluded that “policy responses were mainly ad hoc in nature,
that some decisions were taken hastily, and that measures were
somewhat inconsistent and largely uncoordinated at international level”.
Development Finance Institutions and African countries should develop
a contingency plan for Africa, identifying early warning mechanisms,
defining the roles and responsibilities of different institutions, and setting
out actions to be taken under different scenarios. Coordination should
be through a single unit to ensure policy coherence.
Support provision of timely and accurate information on stock holdings
and market prices, to guide market interventions. This includes
additional support for the Agricultural Market Information System
initiative, including capacity building programs and development of
public-private partnerships. Improve local supply by addressing barriers
across the entire value chain. This calls for innovative sources of finance,
capacity building programs, risk management tools, enhancing
resilience to climate change and leveraging advances in agricultural
biotechnology to improve productivity and yield. Where domestic
markets are too small, regional initiatives may offer the best option.
A f r i c a E m e r g i n g I s s u e s Volume 1 Issue 1 November 2011
s e r i e s
A f r i c a n D e v e l o p m e n t B a n k
44
References
Abebe, S., 2011, Welfare analysis using data from the International
Comparison Program for Africa, African Develoment Review (forthcoming).
Albers, R., and Peeters, Marga, 2011, Food and Energy prices,
government subsidies and fiscal balances in south Mediterranean
countries, European Commission, Economic papers 437, February 2011.
Alemu D. and Meijerink, G., 2010, The Ethiopian Commodity Exchange
(ECX) An overview, Development Cooperation, Ministry of Foreign Affairs,
Wageningen UR, Ethiopia Pulses, Oilseeds and Spices Processors
Exporters Association.
FAO, 2010, The State of food insecurity in the world: Addressing food
insecurity in protracted crises, available at http://www.fao.org/docrep/013/
i1683e/i1683e.pdf.
Torero, M., 2011, Alternative mechanisms to reduce food price volatility
and price spikes, Science review #21, Foresight project on global food and
farming futures.
Triki, T. and Affes, Y, Managing commodity price volatility in Africa, AfDB
Africa Economic Brief, Vol.2, Iss.3, August 2011.
UNDP, 2010, Assessing Progress in Africa Toward the Millennium Develop -
ment Goals, available at http://www.undp.org/africa/mdg2010.shtml.
WHES (2011), 2011 World Hunger and Poverty Facts and Statistics, World
Hunger Education Service (WHES), available at http://www.worldhunger.
org/articles/Learn/world%20hunger%20facts%202002.htm.
A f r i c a E m e r g i n g I s s u e sVolume 1 Issue 1 November 2011
s e r i e s
A f r i c a n D e v e l o p m e n t B a n k
45

a n n e x e s

A f r i c a n D e v e l o p m e n t B a n k
47
s A f r i c a E m e r g i n g I s s u e sVolume 1 Issue 1 September 2011
s e r i e s
Table 2 Cereal balance (values in Thousand Tons) 2010/2011
Source: Authors’ calculation using data FAO GIEWS 2011. Cereal balance is defined as domestic production minus domestic food and non-foodconsumption.
1 FAO (2010).2 Abebe (2011).3 UNDP (2010).4 Albers and Marga (2011).5 Lagi, Bertrand and Yam (2011). 6 Triki and Affes (2011). 7 Commodity Swap linked to a Loan is a loan structured such that repayments (increase) decrease when the market price moves
up (down). Weather Derivative is a financial contract that offers protection against poor harvests triggered by adverse weatherconditions. The contract is triggered by predefined levels of rainfall, snow, or temperature. Weather index insurance providessimilar coverage against natural hazards. Catastrophe bonds are fixed income instruments where principal is forgiven if a set ofadverse pre-defined events such as natural disasters are observed. The issuer will use the foregone principal to fund emergencyrelief.
8 (Torrero, 2011).
Regions
Thousand tons
East Africa 36,672 1,232 1,227 1,051 38,080 35,506 6,778 42,284 (5,612)
Central Africa 6,571 391 16 332 6,646 6,668 1,161 7,829 (1,258)
North Africa 37,444 71,080 (33,636)
Southern Africa 31,520 3,739 729 3,692 32,296 23,177 9,399 32,576 (1,056)
West Africa 51,829 1,790 271 2,540 51,350 47,518 12,766 60,284 (8,455)
Africa 164,036 7,152 2,243 7,615 128,372 112,869 30,104 214,053 (50,017)
Cereal Production
Cereal Imports
(contracted
or delivered)
Possible Stock
Draw Down
Cereal Exports
Cereal Availability
Consumption
(Food)
Consumption
(Non-Food)
Requirements
Cereal Balance
A f r i c a E m e r g i n g I s s u e s Volume 1 Issue 1 November 2011
s e r i e s
A f r i c a n D e v e l o p m e n t B a n k
48
s e r i e s
www.afdb.org
© 201
1 - AfDB - Layou
t, ERCU/YAL
Recommended