An Instructional Design and Development Research Study with an Interdisciplinary
Instructional Design (IdID) Team in Geotechnical Engineering
by
Arthur Ornelas, Jr.
A Dissertation Presented in Partial Fulfillment
of the Requirements for the Degree
Doctor of Philosophy
Approved December 2014 by the
Graduate Supervisory Committee:
Wilhelmina Savenye, Chair
Gary Bitter
Robert Atkinson
Sandra Houston
ARIZONA STATE UNIVERSITY
May 2015
i
ABSTRACT
The purpose of this instructional design and development study was to describe,
evaluate and improve the instructional design process and the work of interdisciplinary
design teams. A National Science Foundation (NSF) funded, Transforming
Undergraduate Education in Science (TUES) project was the foundation for this study.
The project developed new curriculum materials to teach learning content in unsaturated
soils in undergraduate geotechnical engineering classes, a subset of the civil engineering.
The study describes the instructional design (ID) processes employed by the team
members as they assess the need, develop the materials, disseminate the learning unit,
and evaluate its effectiveness, along with the impact the instructional design process
played in the success of the learning materials with regard to student achievement and
faculty and student attitudes. Learning data were collected from undergraduate
geotechnical engineering classes from eight partner universities across the country and
Puerto Rico over three phases of implementation. Data were collected from students and
faculty that included pretest/posttest scores and attitudinal survey questions. The findings
indicated a significant growth in the learning with the students of the faculty who were
provided all learning materials. The findings also indicated an overall faculty and student
satisfaction with the instructional materials. Observational and anecdotal data were also
collected in the form of team meeting notes, personal observations, interviews and design
logs. Findings of these data indicated a preference with working on an interdisciplinary
instructional design team. All these data assisted in the analysis of the ID process,
providing a basis for descriptive and inferential data used to provide suggestions for
improving the ID process and the work of interdisciplinary instructional design teams.
ii
DEDICATION
First, my wife, Monica, who has been my rock through this entire endeavor. I
could not have done this without you. To my daughter, Allliandra, who served as a strong
person of support. To my mom, Rosa, and dad, Arturo, who have encouraged me my
entire life. To my brothers, Paul, Richard and Lorenzo and my sisters, Rose, Gracie and
Cynthia whose belief in me never wavered.
iii
ACKNOWLEDGMENTS
To my committee chair, Dr. Wilhelmina Savenye, whose tutelage was critical to
the fruition of this difficult task. Your encouragement and critique of my writing and
research made me better at both. Dr. Sandra Houston’s belief in me was encouraging and
made my journey more fruitful. My awareness that Dr. Robert Atkinson would be critical
of any statistical analysis helped me grow in that area. Dr. Gary Bitter’s expertise as a
writer and researcher, along with his critiquing skills made me a better, more accurate
writer and researcher. Dr. Claudia Zapata, who was not on my committee, was helpful in
her input, guidance and encouragement. As my wife mentioned at my proposal defense, I
always felt like all of you were on my side.
To my colleagues through all of this, Kent, Caroline, BC, Quincy, John S., Helen,
Javier, Carrie, Eddy R., Ana and Angela B., thank you for your support and guidance.
Your individual and combined intellect and experience were both inspiring, and at times,
intimidating, but it forced me to improve on and harness my own, and for that and
everything, I am grateful.
iv
TABLE OF CONTENTS
Page
LIST OF TABLES ......................................................................................................................... xi
LIST OF FIGURES .................................................................................................................... xiii
CHAPTER
1 INTRODUCTION ................................................................................................................ 1
The Need for Teaching Unsaturated Soil Mechanics in Engineering ................................ 2
The Unsaturated Soils Undergraduate Engineering Curriculum Project and the Proposed
Study ..................................................................................................................................... 3
Instructional Design (ID) ..................................................................................................... 5
Instructional Design Guidelines ............................................................................. 6
Instructional Design Teams ................................................................................... 8
Interdisciplinary Instructional Design (IdID) Teams ............................................ 9
Instructional Design and Instructional Design Research .................................................. 12
Types of Research in Instructional Design .......................................................... 12
Design and Development Research ..................................................................... 15
Design and Development Research on the Unsaturated Soils Undergraduate Engineering
Curriculum Development Project ...................................................................................... 16
Formative Evaluation of the Unsaturated Soil Mechanics Curriculum Materials ... 17
Investigation of Effective Practices for IdID Teams in STEM, as Exemplified in
the Unsaturated Soils Curriculum Project ......................................................................... 19
Study Purpose ..................................................................................................................... 21
Research Questions ............................................................................................................ 22
v
CHAPTER Page
2 METHOD ....................................................................................................................... 23
Design and Participants ...................................................................................................... 23
Participants ......................................................................................................................... 24
The IdID Team Members ..................................................................................... 24
Engineering Faculty at the Partner Universities .................................................. 24
Undergraduate Civil Engineering Students ......................................................... 25
Materials ............................................................................................................................. 26
The Unsaturated Soils Instructional Materials .................................................... 26
Data Sources - Archival Data ............................................................................................ 30
Overview of Learning Measures.......................................................................... 31
Phase 1: Baseline .................................................................................................. 31
Phase 2: One Learning Module ........................................................................... 33
Phase 3: the Entire Instructional Unit .................................................................. 33
Procedures .......................................................................................................................... 34
Research Question 1 ............................................................................................. 36
Research Question 2 ............................................................................................. 37
Measures ............................................................................................................................. 37
Student Baseline, Pretest/Posttest Knowledge Measure ..................................... 37
Student Attitude Survey ....................................................................................... 39
Faculty Attitude Survey and Interviews .............................................................. 39
IdID Team Interview and Follow-Up Questions................................................. 39
Design Log, and IdID Team Meeting Notes ....................................................... 40
vi
CHAPTER Page
Data Analysis...................................................................................................................... 40
3 RESULTS ....................................................................................................................... 42
Phase 1: Baseline Student Achievement and Perception of Difficulty with No
Instruction; Summer and Spring 2012 ............................................................................... 45
Baseline Learning/Achievement Results on the 9-Question Learning Quiz for
Phase 1; Summer and Fall .................................................................................................. 45
Student’s Perception of Difficulty on the 9-Question Quiz for Phase 1; Summer
and Fall 2012 ...................................................................................................................... 47
Phase 2: Student Achievement and Attitude with One Module of Instruction and Faculty
Attitudes; Spring 2013 ....................................................................................................... 48
Learning/Achievement Results on the 9-Question Learning Quiz for Phase 2;
Spring and Summer 2013 ................................................................................................... 48
Student’s Perception of Difficulty Results on the 9-Question Learning Quiz for
Phase 2; Spring and Summer 2013 .................................................................................... 51
Student Attitudinal Results for Phase 2; Spring and Summer 2013 ................... 52
Faculty Attitudinal Results for Phase 2; Spring and Summer 2013 ................... 56
Phase 3: Student Achievement and Attitudes and Faculty Attitudes with Complete Unit
of Instruction Distribution; Fall 2013 ................................................................................ 61
Learning/Achievement Results on the 9-Question Learning Quiz for Phase 3;
Fall 2013 ............................................................................................................................. 61
Summary of Results ............................................................................................. 65
vii
CHAPTER Page
Student’s Perception of Difficulty Results on the 9-Question Learning Quiz for
Phase 3; Fall 2013 .............................................................................................................. 66
Student Attitudinal Results for Phase 3; Fall 2013 ............................................. 69
Faculty Attitudinal Results for Phase 3; Fall 2013.............................................. 74
Results of Data from Team Surveys, Interviews, Notes and Design Logs…… .............. 81
Design Team Interview Results ........................................................................... 81
What Was the Most Frustrating Thing You Found When Working with
Others OUTSIDE OF Your Area of Focus? ..................................................................... 82
What Was the Most Frustrating Thing You Found When Working with
Others WITHIN Your Area of Focus? .............................................................................. 83
What Would You Consider the Most Rewarding Part of Working with
Someone Outside of Your Area of Focus? ........................................................................ 83
What New IDEAS or STRATEGIES Did You Learn That You Felt
Were the MOST HELPFUL? ............................................................................................ 83
What New TOOLS Did You Learn That You Felt Were the MOST
HELPFUL? ......................................................................................................................... 83
What New IDEAS or STRATEGIES Did You Learn That You Felt
Were the MOST FRUSTRATING? .................................................................................. 84
What New TOOLS Did You Learn That You Felt Were the MOST
FRUSTRATING? .............................................................................................................. 84
In Hindsight, What Do You Feel We Could Have Done Differently? .. 84
Results of Team Follow-Up Interview Responses ............................................................ 85
viii
CHAPTER Page
Summary of the Design Log and Team Meeting Notes ................................................... 88
4 DISCUSSION ..................................................................................................................... 92
Research Question 1 ........................................................................................................... 92
Phase 1: Summary of Findings and Discussion of Results ............................................. 93
Phase 1 Summary of Student Achievement Findings and Discussion ............... 94
Phase 1 Summary of Students’ Perceptions of Difficulty Findings and
Discussion ........................................................................................................................... 94
Phase 2: Summary of Findings and Discussion of Results ............................................. 95
Phase 2 Summary of Student Achievement Findings and Discussion ............... 95
Phase 2 Summary of Students’ Perceptions of Difficulty Findings and
Discussion ........................................................................................................................... 96
Phase 2 Summary of Student Attitude Findings and Discussion ....................... 96
Phase 2 Summary of Faculty Attitude Findings and Discussion ........................ 98
Phase 3: Summary of Findings and Discussion of Results ............................................ 100
Phase 3 Summary of Student Achievement Findings and Discussion ............. 100
Phase 3 Summary of Students’ Perceptions of Difficulty Findings and
Discussion ......................................................................................................................... 101
Phase 3 Summary of Student Attitudes Findings and Discussion .................... 102
Phase 3 Summary of Faculty Attitudes Findings and Discussion .................... 104
Comparisons Across Phases of Implementation ............................................................. 108
Across-Phase Student Achievement Findings and Discussion ......................... 108
Comparison of Students’ Perceptions of Difficulty Across Phases .................. 112
ix
CHAPTER Page
Comparison of Student and Faculty Attitudes Findings and Discussion ......... 112
Research Question 2 ......................................................................................................... 113
Team Interviews and Surveys; Team Meeting Notes and Design Log .......................... 114
IdID Team Interview Findings and Discussion ................................................. 115
IdID Post-Interview Follow-Up Questions Findings and Discussion .............. 116
Design Log and IdID Team Meeting Notes Findings and Discussion ............. 117
Recommendations for IdID .............................................................................................. 118
Get Rolling Early On ......................................................................................... 119
Have Instructional Designers Provide Guidance .............................................. 119
Have Subject Matter Experts Provide Guidance ............................................... 121
Making the “Implicit Explicit” .......................................................................... 121
Overcoming the Challenge to Change Curriculum ........................................... 122
The Paradox of Learning New Material and Technology ................................ 123
Working With Those within Versus Outside of Your Area of Focus .............. 123
Considering the 21st Century Learner ............................................................... 124
Challenges, Discussions, Decisions and Best Methods of the IdID Process… ............. 125
Decisions That Helped the IdID Process ........................................................... 126
Decisions That Hindered the IdID Process ....................................................... 126
Best Methods for IdID ....................................................................................... 127
Conclusion ........................................................................................................................ 128
Strengths of the Design Study ............................................................................ 128
Weaknesses of the Design Study ....................................................................... 128
x
CHAPTER Page
Strengths of the Design project .......................................................................... 129
Weaknesses of the Design project ..................................................................... 129
Implications ...................................................................................................................... 129
Implications of Instructional Design ................................................................. 129
Implications of Iinterdisciplinary Instructional Design (IdID) ......................... 130
Implications for Instructional Design in Engineering ....................................... 130
Limitations ........................................................................................................................ 131
Future Research ................................................................................................................ 132
Suggestions for Academia ................................................................................. 133
Summary ......................................................................................................................... 134
REFERENCES ........................................................................................................................... 135
APPENDIX
A PRE STUDENT CONSENT LETTER AND TEST ................................................... 141
B POST STUDENT CONSENT LETTER, TEST AND SURVEY .............................. 145
C FACULTY CONSENT LETTER AND SURVEY ..................................................... 152
D FACULTY CONSENT LETTER AND INTERVIEW SCRIPT ............................... 159
E IdID TEAM CONSENT LETTER AND INTERVIEW SCRIPT .............................. 165
F IdID TEAM FOLLOW-UP INTERVIEW SURVEY ................................................. 168
xi
LIST OF TABLES
Table Page
1. Phases of the Study by Implementation Level and Data Collected......................... 44
2. Baseline Scores on the Learning Quiz for Phase 1 .................................................. 46
3. Student Responses to Question 10, Perception of Difficulty in Phase 1 ................. 47
4. Means, Standard Deviations and Paired Samples t-test Results for Phase 2 .......... 50
5. Student Perception of Difficulty Results for Phase 2 .............................................. 52
6. Student Responses on Likert-Type scale Attitude Questions for Phase 2 .............. 53
7. Student Responses to Question 3 on the Posttest for Phase 2 ................................. 54
8. Student Responses to Question 4 on the Posttest for Phase 2 ................................. 55
9. Student Responses to Question 5 on the Posttest for Phase 2 ................................. 56
10. Means and Standard Deviations for Faculty Attitudinal Questions for Phase 2 ..... 57
11. Responses from the Participating Faculty Survey to the Open-Ended Questions for
Phase 2 ....................................................................................................................... 59
12. Responses from the One Participating Faculty Member to the Likert-Type scale
Questions; Phase 2 .................................................................................................... 60
13. Responses from the One Participating Faculty Member to the Open-Ended
Questions; Phase 2 .................................................................................................... 61
14. Means, Standard Deviations and Paired Samples t-test Results on Individual Test
Questions for Phase 3 ................................................................................................ 64
15. Summary of Means and SDs for Student Scores Based on Phases of
Implementation ......................................................................................................... 66
16. Student Response Rates to Question 10 in Phase 3 ................................................. 67
xii
Table Page
17. One-way Analysis of the Variance on Student’s Perception of Difficulty Across
Phases 1, 2 and 3 ....................................................................................................... 69
18. Response Rates and Percentages for Student Attitudinal Questions for Phase 3. .. 70
19. Student Responses to Question 3 on the Posttest for Phase 3 ................................. 72
20. Student Responses to Question 4 on the Posttest for Phase 3 ................................. 73
21. Student Responses to Question 5 on the Posttest for Phase 3 ................................. 74
22. Means and Standard Deviations for Faculty Attitudinal Questions for Phase 3… . 76
23. Responses on the Faculty Survey to the Open-Ended Questions for Phase 3……. 77
24. Responses on the Faculty Survey to the Open-Ended Questions for Phase 3 ........ 77
25. Faculty Interview Responses to Open-Ended Questions for Phase 3 ..................... 78
26. Faculty Interview Responses to the Yes/No Questions for Phase 3 ........................ 79
27. Faculty Responses to Open-Ended Interview Questions for Phase 3 ..................... 80
28. IdID Team Interview Responses to the Likert-Type Scale Questions .................... 82
29. IdID Team Follow-up Interview Responses to the Likert-Type Scale Questions .. 87
30. IdID Team Follow-up Survey Responses to the “Additional Comments” Field .... 88
31. IdID Team Meeting Notes and Researcher Design Log Themes and Frequencies 91
32. Summary of Suggestions for the IdID Process ...................................................... 133
xiii
LIST OF FIGURES
Figure Page
1. Non-Integrated Multidisciplinary Collaboration Model .................................... 10
2. Interdisciplinary Collaboration Model ................................................................ 11
3. Unsaturated Soils Presentation Poster................................................................. 12
4. Instructional Design Research Process Model ................................................... 16
5. Stress State Variables PowerPoint Sample Slides .............................................. 27
6. Soil-Water Characteristic Curve PowerPoint Sample Slides ............................. 28
7. Axis Translation PowerPoint Sample Slides ....................................................... 29
8. Unsaturated Soils Presentation Poster................................................................. 33
9. Unsaturated Soils Data Collection Timeline ...................................................... 36
10. Summary of Data Collection and Analysis ........................................................ 38
11. Sand Castle Example Slide ............................................................................... 107
1
CHAPTER 1
INTRODUCTION
Engineering education and engineering technology education encompass a broad
field of learning curricula from electrical to mechanical to civil engineering. The
American Society of Engineering Educators, or ASEE (2013), a not-for-profit society of
engineering educators and learning institutions founded in 1893 dedicated to the
advancement of engineering and engineering technology education, states a mission that:
promotes excellence in instruction, research, public service and practice;
exercises worldwide leadership;
fosters the technological education of society; and
provides quality products and services to its members. (ASEE, 2013)
Civil engineering, as a subset of engineering, deals primarily with the design and
upkeep of public works, such as bridges and roads, energy and water systems, and public
facilities, including airports, seaports and railroads (American Society of Civil Engineers,
1996). Civil engineering education includes subtopics in structural, environmental,
hydraulic and geotechnical engineering.
Geotechnical engineering, as a subset of civil engineering, deals primarily with
earth material such as soil and rock and how they react to and interact with environmental
factors and outside forces. For instance, a major concern in geotechnical engineering is
how soil reacts to the pressure applied to it when a structure such as a building, bridge or
road is constructed on it. Soil reacts in different ways, dependent upon its make-up. Some
soils are considered unstable and thus construction on them is discouraged (Houston,
Zapata & Savenye, 2010).
2
The Need for Teaching Unsaturated Soil Mechanics in Engineering Education
In civil engineering education, techniques for building on saturated soils has
traditionally been the focus of the undergraduate curriculum, while unsaturated soil
mechanics is a topic that is both important, yet historically under-represented (Houston,
Zapata & Savenye, 2010). However, a shift in geotechnical research towards unsaturated
soils is underway (Houston, Zapata & Savenye, 2010). Unsaturated soils involve three
phases; soil, water and air. By contrast, saturated soils only have two phases, soil and
water. Saturated soils are weaker by nature, as noted by Dr. Chris Lawrence, who’s
description of soil that, in most cases, “wetter is weaker, dryer is stronger” supports this
premise (C. Lawrence, personal communication, October 17, 2013.) As it stands, the
primary focus of content, literature and guidelines in geotechnical engineering, or soil
mechanics, is on saturated soils (Fredlund, 2006).
Construction on unsaturated soils is the preferred, and subsequently, the most
often used scenario, and guidelines for building on unsaturated soils are more cost-
effective (Houston, Zapata & Savenye, 2010). However, most unsaturated soil content is
reserved for graduate level classes, and even then, this topic is only broached in a few
U.S. Institutions (Houston, Zapata & Savenye, 2010). Although there was an increase of
8 percent in engineering masters degrees conferred from 2010 to 2011 (Gandel, 2013),
the number of masters degrees awarded in the United States is still substantially lower
than bachelor degrees. Yoder (2012) reported that the number of masters degrees
awarded in 2011 was 46,940; however, by that same account, 83,001 bachelor degrees
were conferred in engineering. The amount of masters degrees awarded has steadily
increased, from 31,089 in 2002 to 46,940 in 2011, resulting in about a 34% increase.
3
However, in that same time period bachelor degrees awarded in engineering also
continued an upward trend, going from 66,781 to 83,001, resulting in a 19% increase.
The amount of masters degrees awarded has increased at a greater rate than bachelor
degrees, thus closing the gap between them. Still, in 2011, masters degrees awarded
accounted for roughly 58% less than the amount of bachelor’s degrees conferred in 2011
(Yoder, 2012). Considering there is a large percentage of undergraduate civil engineering
students who do not go on to graduate school, it would only make sense that this material,
at a minimum, be introduced at the undergraduate level.
The Unsaturated Soils Undergraduate Engineering Curriculum Project and the
Proposed Study
In 2010, a project was funded by the National Science Foundation (NSF) through
its Transforming Undergraduate Education in Science (TUES) initiative to develop, pilot
test, disseminate and, ultimately, institutionalize lecture and laboratory materials in basic
principles of unsaturated soil mechanics for use in the undergraduate curriculum
(Houston, Zapata & Savenye, 2010). The goals of the project were to help solve problems
with expansive and collapsible soils that exist in the geo-hazard environment, provide
students with information that will better serve them in their professional careers, train
students who can recognize and solve problems and provide better guidelines that have
environmental, monetary and safety implications (Houston, Zapata & Savenye, 2010).
The curriculum materials that were developed followed effective principles of
instructional design (ID) (see Dick, Carey & Carey, 2009; Gagne, 1985) in order to yield
high quality instruction. The researcher was one of the instructional designers on this
project.
4
This study was implemented in conjunction with this NSF-funded project, as an
additional unfunded study. The researcher and the interdisciplinary instructional design
team conducted a needs assessment and baseline data collection in the summer and fall of
2012, pilot tested one lecture module of the curriculum project created using the ID
process in the spring and summer of 2013, and pilot tested the entire unit of learning in
the fall of 2013. This research study investigated both the aspects of the effectiveness of
the curriculum design project, and data aimed at improving the instructional design
processes on Science, Technology, Engineering and Math (STEM) projects in the
interdisciplinary instructional design team field.
The project was developed to fill what many experts feel is a void in the
geotechnical engineering curriculum, unsaturated soil mechanics (Fredlund, 2006;
Houston, Zapata & Savenye, 2010). The interdisciplinary instructional design team
developed a learning unit that included two different lecture modules on stress state
variables, the soil-water characteristic curve (SWCC) and a pre-laboratory lecture module
on axis translation (Fredlund & Rahardjo, 1993). Ramirez, Houston and Zapata also
developed two learning labs with lab manuals that covered how to use and successfully
analyze results when testing soils using either the Tempe cell or the oedometer-type
pressure plate device. A video that covers the steps involved in using the Tempe cell
device was also developed by two members of the team, Eddy Ramirez and the
researcher, and uploaded to YouTube.
Although the project was what drove the study, the student learning and
attitudinal data, the faculty attitudinal data that were collected from the summer and fall
semesters of 2012 and spring, summer and fall semesters of 2013, the interdisciplinary
5
instructional design team meeting notes and the instructional design log were critical to
the study’s success. The partners assisting on the project (professors of record in the
geotechnical engineering classes) and the interdisciplinary instructional design, or IdID
(Ornelas, 2014), team were interviewed using interview protocols (Appendices D and E,
respectively) and these data aided the extension of quantitative data collected to answer
research questions one and two. Other data collected included an IdID team post-
interview survey (Appendix F), notes from meetings with the team, observations of
engineering lectures attended by the researcher and the materials in all prototype stages
developed during the instructional design process.
Instructional Design (ID)
The design, development, implementation and evaluation of instructional
materials can have different terms associated with it, but it is generally referred to as
instructional design and development, (Smith & Ragan, 1999), instructional design
(Smith & Ragan, 1999) or simply design. For the purpose of clarity, instructional design
or ID will be the nomenclature used in this study. Reiser (2001) provides a definition of
instructional design as a field that:
“…encompasses the analysis of learning and performance problems, and the
design, development, implementation, evaluation and management of
instructional and non-instructional processes and resources intended to improve
learning and performance in a variety of settings, particularly educational
institutions and the workplace.” (p. 53)
Early on, ID included five categories: 1) design, 2) development, 3) utilization, 4)
management and 5) evaluation (Reiser, 2001). Reiser’s (2001) definition, however, goes
further in pointing out the concepts in performance technology and the analysis of
problems that may exist.
6
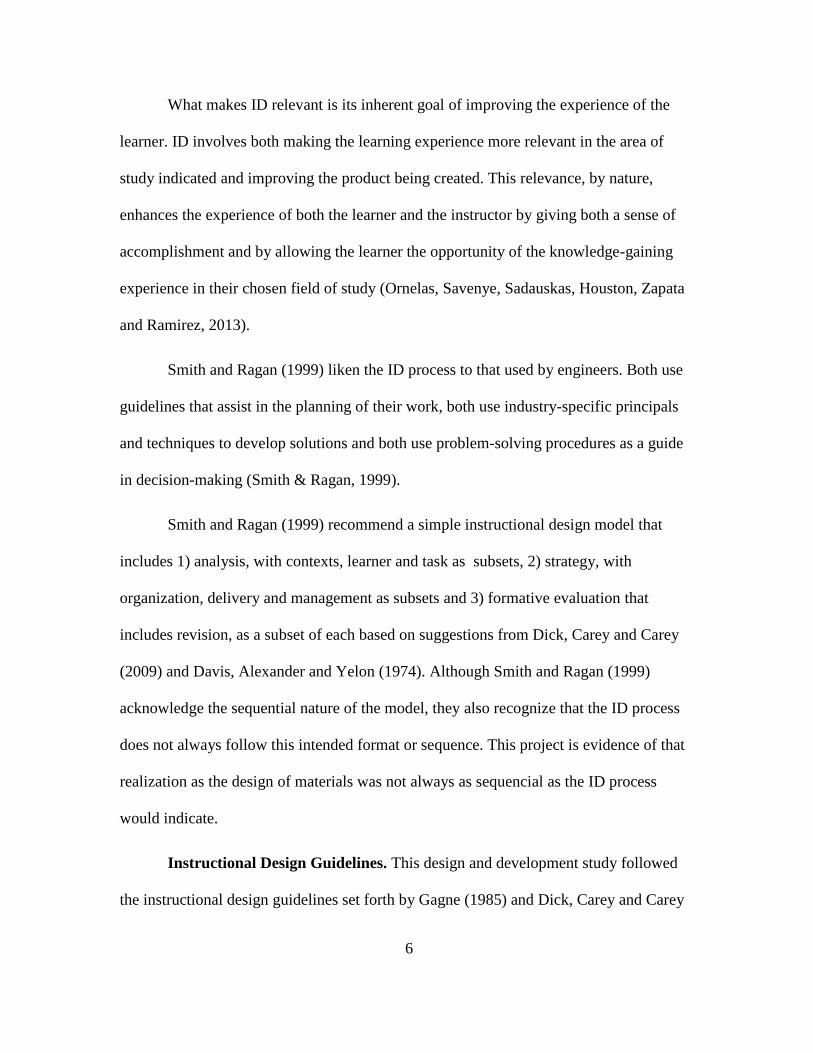
What makes ID relevant is its inherent goal of improving the experience of the
learner. ID involves both making the learning experience more relevant in the area of
study indicated and improving the product being created. This relevance, by nature,
enhances the experience of both the learner and the instructor by giving both a sense of
accomplishment and by allowing the learner the opportunity of the knowledge-gaining
experience in their chosen field of study (Ornelas, Savenye, Sadauskas, Houston, Zapata
and Ramirez, 2013).
Smith and Ragan (1999) liken the ID process to that used by engineers. Both use
guidelines that assist in the planning of their work, both use industry-specific principals
and techniques to develop solutions and both use problem-solving procedures as a guide
in decision-making (Smith & Ragan, 1999).
Smith and Ragan (1999) recommend a simple instructional design model that
includes 1) analysis, with contexts, learner and task as subsets, 2) strategy, with
organization, delivery and management as subsets and 3) formative evaluation that
includes revision, as a subset of each based on suggestions from Dick, Carey and Carey
(2009) and Davis, Alexander and Yelon (1974). Although Smith and Ragan (1999)
acknowledge the sequential nature of the model, they also recognize that the ID process
does not always follow this intended format or sequence. This project is evidence of that
realization as the design of materials was not always as sequencial as the ID process
would indicate.
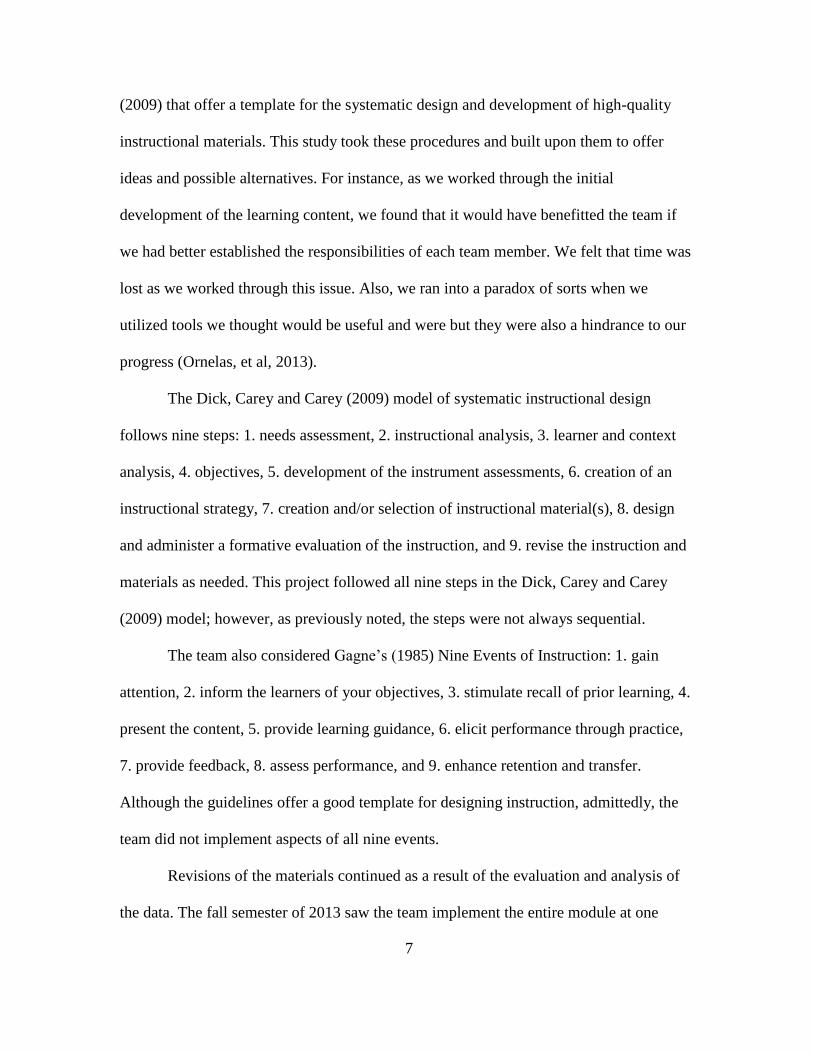
Instructional Design Guidelines. This design and development study followed
the instructional design guidelines set forth by Gagne (1985) and Dick, Carey and Carey
7
(2009) that offer a template for the systematic design and development of high-quality
instructional materials. This study took these procedures and built upon them to offer
ideas and possible alternatives. For instance, as we worked through the initial
development of the learning content, we found that it would have benefitted the team if
we had better established the responsibilities of each team member. We felt that time was
lost as we worked through this issue. Also, we ran into a paradox of sorts when we
utilized tools we thought would be useful and were but they were also a hindrance to our
progress (Ornelas, et al, 2013).
The Dick, Carey and Carey (2009) model of systematic instructional design
follows nine steps: 1. needs assessment, 2. instructional analysis, 3. learner and context
analysis, 4. objectives, 5. development of the instrument assessments, 6. creation of an
instructional strategy, 7. creation and/or selection of instructional material(s), 8. design
and administer a formative evaluation of the instruction, and 9. revise the instruction and
materials as needed. This project followed all nine steps in the Dick, Carey and Carey
(2009) model; however, as previously noted, the steps were not always sequential.
The team also considered Gagne’s (1985) Nine Events of Instruction: 1. gain
attention, 2. inform the learners of your objectives, 3. stimulate recall of prior learning, 4.
present the content, 5. provide learning guidance, 6. elicit performance through practice,
7. provide feedback, 8. assess performance, and 9. enhance retention and transfer.
Although the guidelines offer a good template for designing instruction, admittedly, the
team did not implement aspects of all nine events.
Revisions of the materials continued as a result of the evaluation and analysis of
the data. The fall semester of 2013 saw the team implement the entire module at one
8
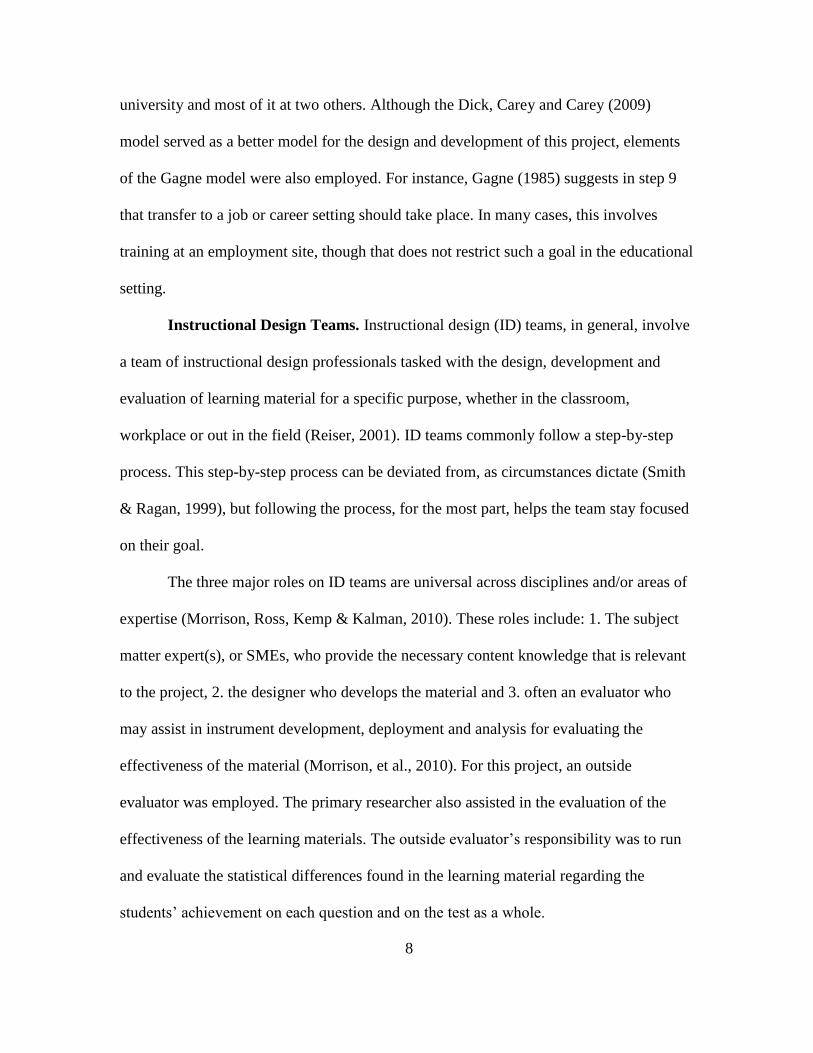
university and most of it at two others. Although the Dick, Carey and Carey (2009)
model served as a better model for the design and development of this project, elements
of the Gagne model were also employed. For instance, Gagne (1985) suggests in step 9
that transfer to a job or career setting should take place. In many cases, this involves
training at an employment site, though that does not restrict such a goal in the educational
setting.
Instructional Design Teams. Instructional design (ID) teams, in general, involve
a team of instructional design professionals tasked with the design, development and
evaluation of learning material for a specific purpose, whether in the classroom,
workplace or out in the field (Reiser, 2001). ID teams commonly follow a step-by-step
process. This step-by-step process can be deviated from, as circumstances dictate (Smith
& Ragan, 1999), but following the process, for the most part, helps the team stay focused
on their goal.
The three major roles on ID teams are universal across disciplines and/or areas of
expertise (Morrison, Ross, Kemp & Kalman, 2010). These roles include: 1. The subject
matter expert(s), or SMEs, who provide the necessary content knowledge that is relevant
to the project, 2. the designer who develops the material and 3. often an evaluator who
may assist in instrument development, deployment and analysis for evaluating the
effectiveness of the material (Morrison, et al., 2010). For this project, an outside
evaluator was employed. The primary researcher also assisted in the evaluation of the
effectiveness of the learning materials. The outside evaluator’s responsibility was to run
and evaluate the statistical differences found in the learning material regarding the
students’ achievement on each question and on the test as a whole.
9
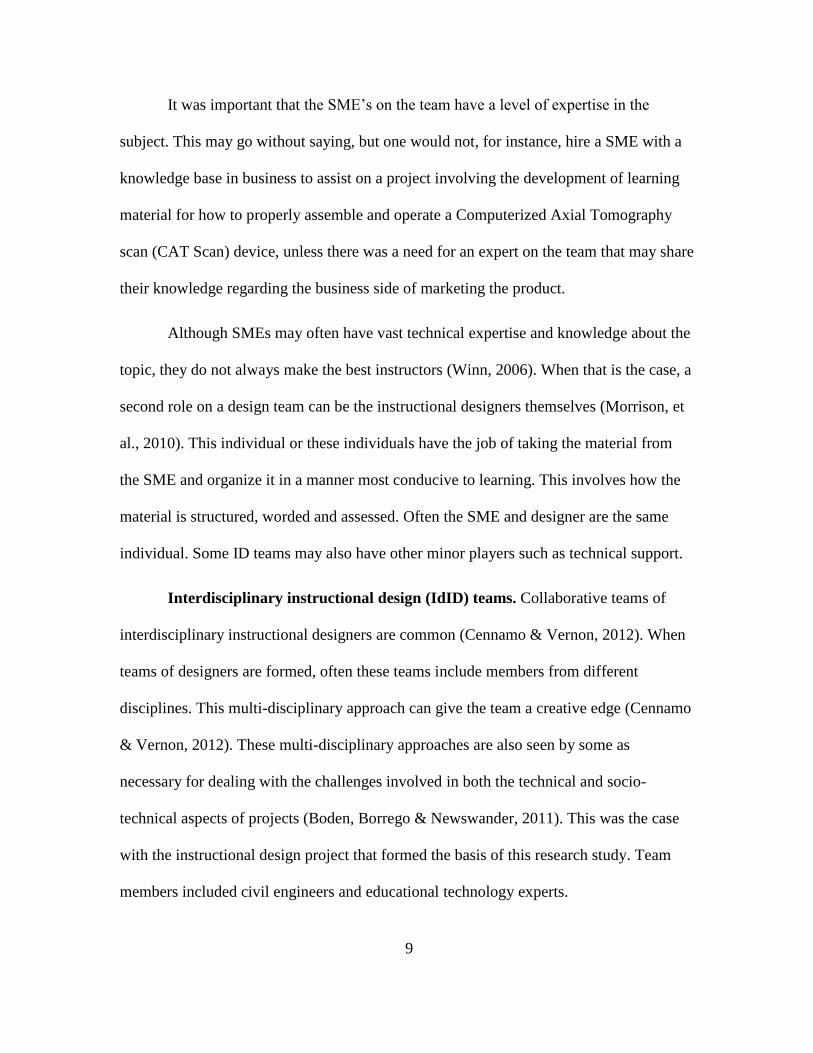
It was important that the SME’s on the team have a level of expertise in the
subject. This may go without saying, but one would not, for instance, hire a SME with a
knowledge base in business to assist on a project involving the development of learning
material for how to properly assemble and operate a Computerized Axial Tomography
scan (CAT Scan) device, unless there was a need for an expert on the team that may share
their knowledge regarding the business side of marketing the product.
Although SMEs may often have vast technical expertise and knowledge about the
topic, they do not always make the best instructors (Winn, 2006). When that is the case, a
second role on a design team can be the instructional designers themselves (Morrison, et
al., 2010). This individual or these individuals have the job of taking the material from
the SME and organize it in a manner most conducive to learning. This involves how the
material is structured, worded and assessed. Often the SME and designer are the same
individual. Some ID teams may also have other minor players such as technical support.
Interdisciplinary instructional design (IdID) teams. Collaborative teams of
interdisciplinary instructional designers are common (Cennamo & Vernon, 2012). When
teams of designers are formed, often these teams include members from different
disciplines. This multi-disciplinary approach can give the team a creative edge (Cennamo
& Vernon, 2012). These multi-disciplinary approaches are also seen by some as
necessary for dealing with the challenges involved in both the technical and socio-
technical aspects of projects (Boden, Borrego & Newswander, 2011). This was the case
with the instructional design project that formed the basis of this research study. Team
members included civil engineers and educational technology experts.
10
The terminology for defining such a team in the field of instructional design can
vary to include such terms as collaborative design (Kwon, Wardrip & Gomez, 2014),
cross-disciplinary, trans-disciplinary, multi-disciplinary (Borrego & Newswander, 2008),
and interdisciplinary (Borrego & Newswander, 2008; Drezek, Olsen & Borrego, 2008).
The difference lies the team approach, thus making it necessary to provide some
distinction between them. For instance, in the multi-disciplinary setting it is generally the
case that everyone contributes to the project through his or her own strengths. A “you do
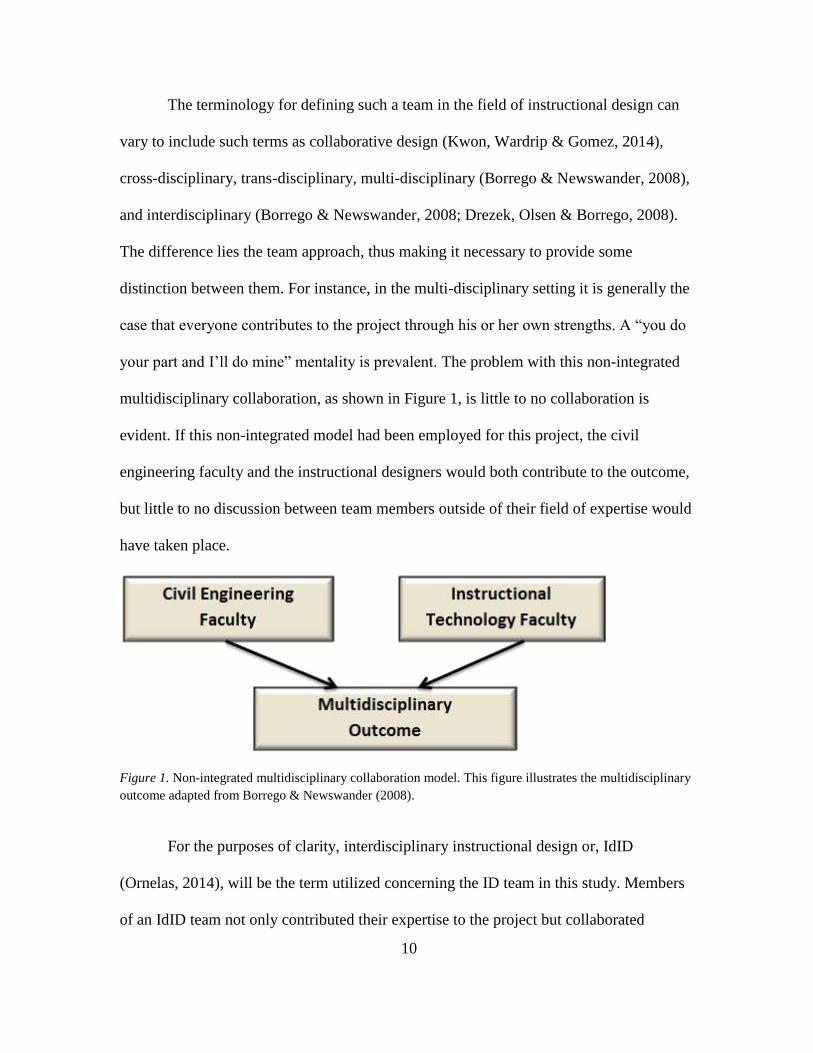
your part and I’ll do mine” mentality is prevalent. The problem with this non-integrated
multidisciplinary collaboration, as shown in Figure 1, is little to no collaboration is
evident. If this non-integrated model had been employed for this project, the civil
engineering faculty and the instructional designers would both contribute to the outcome,
but little to no discussion between team members outside of their field of expertise would
have taken place.
Figure 1. Non-integrated multidisciplinary collaboration model. This figure illustrates the multidisciplinary
outcome adapted from Borrego & Newswander (2008).
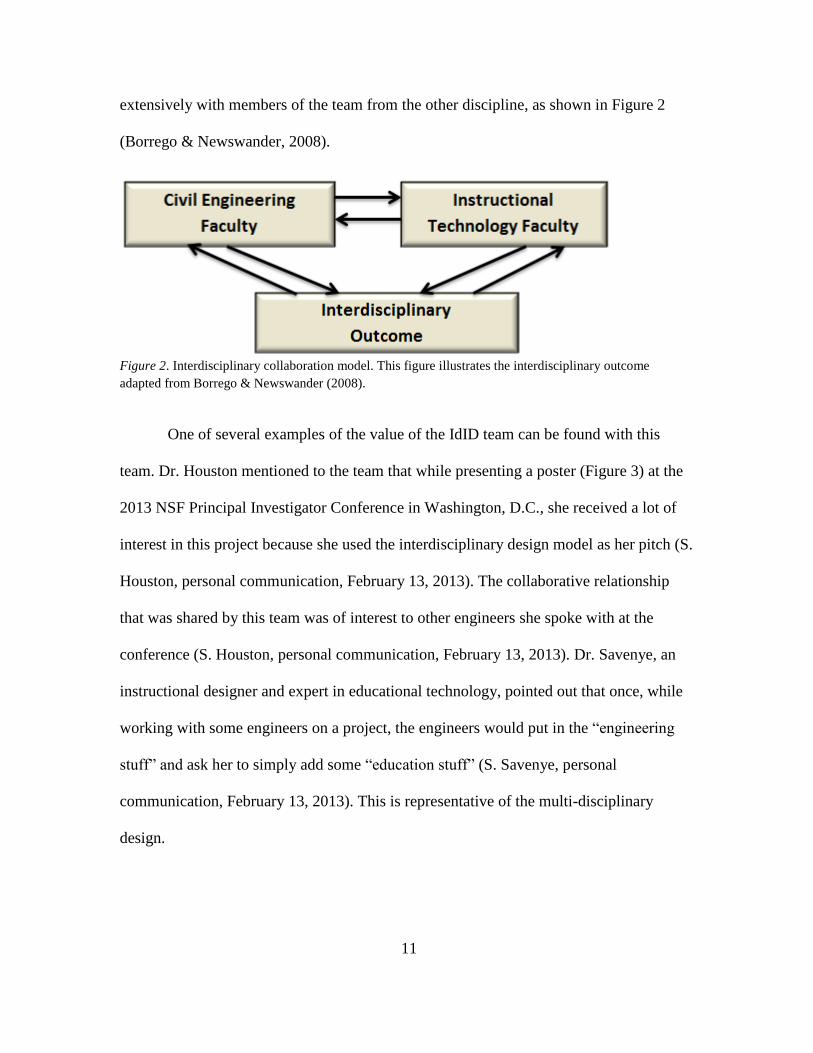
For the purposes of clarity, interdisciplinary instructional design or, IdID
(Ornelas, 2014), will be the term utilized concerning the ID team in this study. Members
of an IdID team not only contributed their expertise to the project but collaborated
11
extensively with members of the team from the other discipline, as shown in Figure 2
(Borrego & Newswander, 2008).
Figure 2. Interdisciplinary collaboration model. This figure illustrates the interdisciplinary outcome
adapted from Borrego & Newswander (2008).
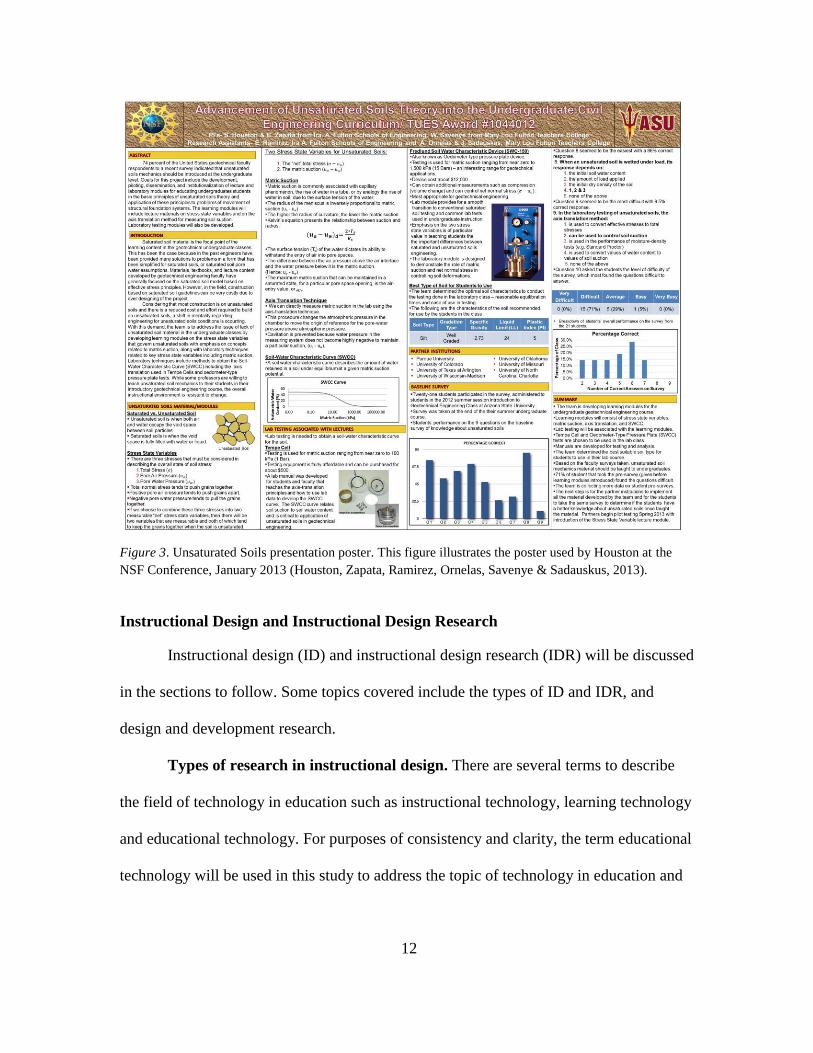
One of several examples of the value of the IdID team can be found with this
team. Dr. Houston mentioned to the team that while presenting a poster (Figure 3) at the
2013 NSF Principal Investigator Conference in Washington, D.C., she received a lot of
interest in this project because she used the interdisciplinary design model as her pitch (S.
Houston, personal communication, February 13, 2013). The collaborative relationship
that was shared by this team was of interest to other engineers she spoke with at the
conference (S. Houston, personal communication, February 13, 2013). Dr. Savenye, an
instructional designer and expert in educational technology, pointed out that once, while
working with some engineers on a project, the engineers would put in the “engineering
stuff” and ask her to simply add some “education stuff” (S. Savenye, personal
communication, February 13, 2013). This is representative of the multi-disciplinary
design.
12
Figure 3. Unsaturated Soils presentation poster. This figure illustrates the poster used by Houston at the
NSF Conference, January 2013 (Houston, Zapata, Ramirez, Ornelas, Savenye & Sadauskus, 2013).
Instructional Design and Instructional Design Research
Instructional design (ID) and instructional design research (IDR) will be discussed
in the sections to follow. Some topics covered include the types of ID and IDR, and
design and development research.
Types of research in instructional design. There are several terms to describe
the field of technology in education such as instructional technology, learning technology
and educational technology. For purposes of consistency and clarity, the term educational
technology will be used in this study to address the topic of technology in education and
13
any subsets of it, including instructional design. Design-based research and design and
development research will also be discussed.
In educational or instructional technology, educational design research (EDR)
(Plomp & Nieveen, 2013), design-based research (Barab & Squire, 2004), design and
development research (Richey & Klein, 2009) and design research (Van den Akker,
1999) are four terms that are often used, sometimes interchangeably. Although some
professionals may fail to see a difference, differences do exist.
Design-based research looks at the design process to include the series of
approaches, (not just a single approach) that are required to produce new theories,
artifacts and practices in the field (Barab & Squire, 2004). Educational design research
(EDR) looks to address the problems in design and find solutions through the analyzing
of studies (Plomp & Nieveen, 2013). Design and development (D&D) research looks to
improve the instructional product developed by the design team and the process of design
through the empirical process (Richey & Klein, 2009).
This study fell under the design and development (D&D) umbrella in that it
looked to improve both the product, the geotechnical engineering curriculum through the
addition of unsaturated soils learning materials, and the process of design through an
empirical study. This does not mean, however, that traits of the other two methodologies
were not prevalent in this study. As with any good study, there needs to be a level of
openness to other ideas that will improve the study and the field as a whole.
Plomp and Nieveen (2007) point out that EDR was first introduced to examine the
process of adjusting the design context as different iterations of the product were tested.
This experimentation would allow the researchers to test theory and generate a product in
14
a naturalistic context (Barab & Squire, 2004). Reeves (2000) advocates design research
that focuses on developing the ideal solution to a given problem, keeping in mind the
context of the problem.
Historically, design and research were two distinct activities (Oh & Reeves,
2010). Design was relegated to yielding “craft-based practice” (Oh & Reeves, 2010, p.
263) while the researcher’s responsibilities reflected on theoretical principles based in
science (Oh & Reeves, 2010). More recent discussions, however, in educational design
research (EDR) have design and research as “inseparable and synergistically interact[ive]
to improve practice and generate refined design principles and theories” (Oh & Reeves,
2010, p. 264). EDR can also provide a how-to-do handbook of sorts with the intention of
addressing problems in education (Plomp & Nieveen, 2013).
Towne and Shavelson (2002) offer guiding principles for scientific research.
Plomp and Nieveen (2007) suggest that the design researcher follow these guidelines as
well. The guidelines offered by Towne and Shavelson (2002) include:
posing questions to be investigated
linking research to relevant theory
using direct question-guided investigative methods
using a chain of reasoning that’s direct and lucid
simplifying and duplicating throughout multiple studies, and
offering your research to others for professional critique
This ID team generally employed the approaches and methods of design and
development research as it aimed to improve both the curriculum materials and the field
of instructional design. As mentioned earlier, this team was interdisciplinary and,
considering that, adds relevance and interest to its following of systematic instructional
15
design processes, considering that some members of the team were not well-versed in the
formal design process.
Design and development research. Richey (1997) and Richey and Klein (2009)
note that instructional design and technology (IDT) research has been, and is currently
being, conducted, but that the levels that would advance the base knowledge in the field
are insufficient. There is a general consensus among the archival research that six
components make up the field; 1. learning, 2. context, 3. sequence, 4. strategy, 5. delivery
and 6. the designer (Richey & Klein, 2009). However, Richey and Klein (2009), promote
more research to improve the field. This study was designed to contribute to the
advancement of the field in both theory and practice. Richey and Klein go on to advocate
IDT as a science and “as a science it should be bound by understandings built upon
replicated empirical research” (2009, p. 2).
Although this study primarily followed the design and development approach of
Richey and Klein (2009), it also had traits of other design research approaches. Plomp &
Nieveen (2007) point out The Design-Based Research Collective’s (2003; 5) argument
“that educational research is often divorced from the problems and issues of everyday
practice” (p. 1). This study evaluated the learning material in the real-world settings of
multiple university classrooms. The material was developed, implemented and revised as
dictated by the data collected from stakeholders; in this case the faculty teaching and the
students learning the materials.
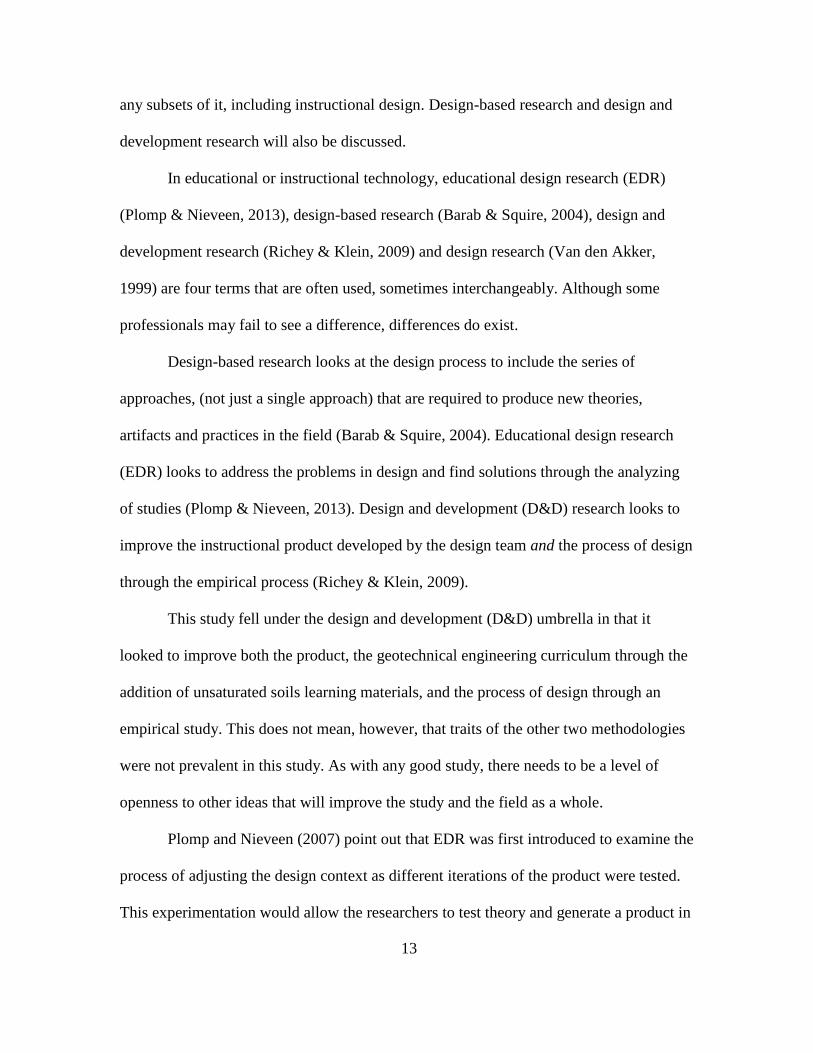
Reeves (2000) and other experts in the instructional design process arena offer the
following approach to research as illustrated in Figure 4:
16
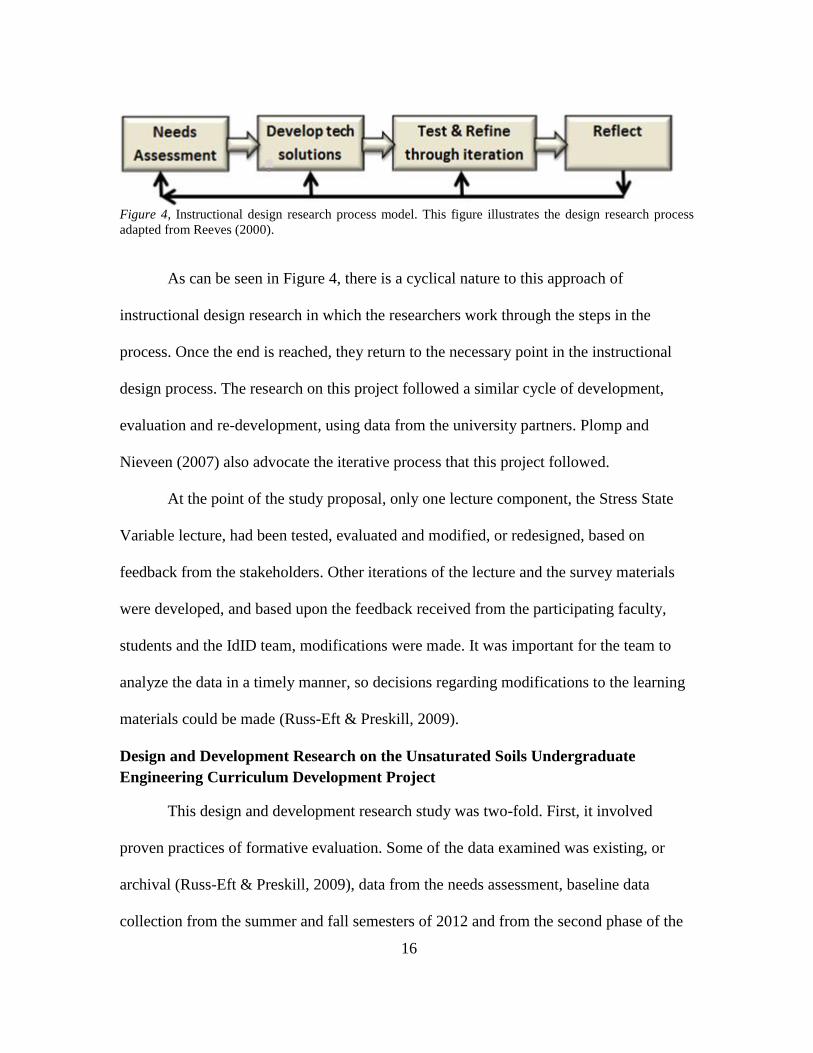
Figure 4, Instructional design research process model. This figure illustrates the design research process
adapted from Reeves (2000).
As can be seen in Figure 4, there is a cyclical nature to this approach of
instructional design research in which the researchers work through the steps in the
process. Once the end is reached, they return to the necessary point in the instructional
design process. The research on this project followed a similar cycle of development,
evaluation and re-development, using data from the university partners. Plomp and
Nieveen (2007) also advocate the iterative process that this project followed.
At the point of the study proposal, only one lecture component, the Stress State
Variable lecture, had been tested, evaluated and modified, or redesigned, based on
feedback from the stakeholders. Other iterations of the lecture and the survey materials
were developed, and based upon the feedback received from the participating faculty,
students and the IdID team, modifications were made. It was important for the team to
analyze the data in a timely manner, so decisions regarding modifications to the learning
materials could be made (Russ-Eft & Preskill, 2009).
Design and Development Research on the Unsaturated Soils Undergraduate
Engineering Curriculum Development Project
This design and development research study was two-fold. First, it involved
proven practices of formative evaluation. Some of the data examined was existing, or
archival (Russ-Eft & Preskill, 2009), data from the needs assessment, baseline data
collection from the summer and fall semesters of 2012 and from the second phase of the
17
project, or the development and pilot testing of the first module from the spring and
summer semesters of 2013. The third phase of the formative evaluation was the fall
semester of 2013, with the participating partners having received the complete curriculum
in August of 2013, along with the measurement instruments. This study examined all the
archival (Russ-Eft & Preskill, 2009) data from earlier phases of the project and the data
collected in the fall and spring of 2013 and 2014, respectively. All evaluation data were
covered under the project’s approved and exempt Institutional Review Board (IRB)
application. Additional data collected in the form of faculty and design team surveys,
interviews and post-interview follow-up questions (for the IdID team only) were covered
under a separate IRB application initiated by the researcher.
The second aspect of the study was not a part of the initial NSF/TUES proposal. It
was an in-depth examination of the practices of the IdID team on this STEM project. The
goal of this facet of the study was to develop a set of guidelines for more effective
practices in interdisciplinary design teamwork.
Formative evaluation of the unsaturated soil mechanics curriculum
materials. On the instructional design side, this study described and examined the
development, implementation and evaluation of instructional material (Richey & Klein,
2009) in geotechnical engineering consisting of components on the state of stress in soils
and the soil-water characteristic curve (SWCC), along with a pre-laboratory component
on axis translation (Fredlund & Rahardjo, 1993) and laboratory activities using the
Tempe cell device and the oedometer-type pressure plate device. Houston, Zapata and
Savenye (2010) proposed that since most infrastructures are built on unsaturated soils
more content on unsaturated soil mechanics should be included in the undergraduate civil
18
engineering curriculum. More discussion on the implications of the introduction of this
material to the undergraduate curriculum will follow.
In order to assess the learning and attitudinal effects of infusing new material into
existing curriculum, this study evaluated the material by following the both sides of the
coin mentality set forth by Russ-Eft and Preskill (2009) of a 21st Century quantitative use
of “scientifically based research practices and accountability” and “creative qualitative
data” (p. 42). This study followed the tenets of a research practice, while also collecting
data that added to the intellectual base of the field. These data provided insight into
knowledge gained and the attitudes of the students towards the learning material along
with the ease of use and overall usefulness of the learning material for the participating
faculty. Feedback was collected from both the faculty teaching as well as students
learning this material. These data provided a useful tool in the evaluation and continued
development of the learning material as it went through several iterations, with a similar
goal of any newly designed instructional material (Dick, Carey & Carey, 2009; Gagne,
1985) and with improving upon the design process through design and development
research (Richey & Klein, 2009).
The research methodology utilized in this design and development study was
more holistic in its approach, where no isolated variables were emphasized (Plomp &
Nieveen, 2007). The NSF/TUES unsaturated soils project utilized some aspects of a
typical quasi-experimental study, including a pretest/posttest design in which random
selection was not used, looking for statistically significant learning gains from pretest to
posttest, but the research on the instructional design process for NSF/TUES project did
19
not. The primary focus of this study was on the instructional design process and the
holistic approach from its inception to its conclusion.
Plomp and Nieveen (2007) point out the challenges in design research “to capture
and make explicit the implicit decisions associated with the design process” (p 19). It was
the intent of this research study on instructional design to make explicit the implicit, that
is, to offer guidelines that will assist an interdisciplinary instructional design team before,
during and after the process is complete.
Investigation of effective practices for IdID teams in STEM, as exemplified in
the unsaturated soils curriculum project. The second part of this study dealt with the
investigation of effective practices in interdisciplinary instructional design (IdID) teams.
This IdID team included members from civil engineering and educational technology.
The study followed the IdID team as it developed material for the undergraduate civil
engineering curriculum. The civil engineers on the team served as subject matter experts
(SMEs) while the educational technology team helped develop, disseminate and evaluate
the learning content. The process used by the team was evaluated and suggestions for
how to develop a better learning module that would increase the students’ and
instructors’ experience (Ornelas, et al., 2013) will be offered.
The IdID team offers unique opportunities to learn from professionals who are in
the same general field, in this case higher education, but very different disciplines;
education and engineering. These interactions gave team members the chance to learn
general concepts outside their own fields of expertise; however a paradox of sorts can
occur (Boden, Borrego & Newswander, 2011). This paradox occurred when a team
member tried to learn material, but in doing so may have come to the realization that the
20
material in question was not necessary to the overall goal of the project, or that the
material learned may have caused even more confusion, instead of clarifying the content.
This lead to the problem of “the more you learn the less you know” for some members of
the team and the researcher. Learning is learning and thus when learning occurs, one feels
a sense of accomplishment. However, frustration can set in when the learning that is
occurring cannot enhance the development of the project being created. While the
opportunity to learn from others was present, there was also the aforementioned potential
for frustration with said learning.
The National Science Foundation (2002), in their solicitation code PD-05-1340
for engineering funding in their Engineering Education Program (EEP), subscribes to the
premise that grant proposals with a multidisciplinary team that include engineers as well
as experts outside the field of engineering are more likely to produce a successful grant
proposal. That is not to say that successful grant proposals may not be comprised of only
one discipline, only that the likelihood of success increases when a proposal is
multidisciplinary. In its discovery initiative, the NSF states it “will emphasize
investigations that cross disciplinary boundaries and require a systems approach to
address complex problems” (2006, p. 6).
A higher success rate in grant proposal funding, however, does not guarantee that
professionals in academia will always embrace the use of interdisciplinary teams. Other
issues, such as those related to structural and political frameworks and the “academic
reward system” (Boden & Borrego, 2011, p. 47) in departments and institutions of higher
learning, may also be obstacles to interdisciplinary team collaboration. From the
structural standpoint, faculty members are faced with more specialization within their
21
fields (Boden & Borrego, 2011). Academic departments are set up to reward the
accomplishments of the individual over that of the team, thus individual work can take
precedence over team work (Boden & Borrego, 2011).
Study Purpose
Unsaturated soils material can be found at the graduate level of geotechnical
engineering curriculum at various institutions (Houston, Zapata & Savenye, 2010).
However, when it comes to the undergraduate curriculum, there is a gap in the
dissemination of unsaturated soil content (Fredlund, 2006). A recent survey of civil
engineering faculty found that 71% of those surveyed felt there was a lack of unsaturated
soils mechanics material in the undergraduate curriculum (Houston, Zapata, & Savenye,
2010).
This study was designed to investigate optimum design processes for developing
unsaturated soils content that can be seamlessly infused into existing undergraduate
geotechnical engineering curriculum at various universities. The learning unit had two
content modules, the state of stress in soils and the soil-water characteristic curve, a pre-
lab lecture on axis translation (Fredlund & Rahardjo, 1993) and two laboratory content
modules; the Tempe cell and the oedometer-type pressure plate. An effective and
efficient ID process was crucial to the success of this project as the team was under time
constraints to get this completed. Organization and collaboration were also vital as the
team worked with other universities. Several faculty indicated that they would prefer to
get the materials ahead of time in order to review them prior to the beginning of the
semester, or at least, prior to the implementation of the material into their course
materials. This only added to the team’s sense of urgency.
22
This research study observed and evaluated the instructional design (ID) process
from the needs assessment, to the development of the design team through the design,
implementation and evaluation of instructional materials. This study produced intellectual
material, adding to the knowledge base of the field of design and development research
and interdisciplinary design team research, where the literature on interdisciplinary ID
teams is currently limited.
Research Questions
1. What are the learning and attitudinal effects of a new instructional unit on
unsaturated soils in geotechnical engineering developed using systematic
processes of design and development?
2. When working with interdisciplinary instructional design teams, what are the
challenges, discussions and decisions made that both assist and hinder the team’s
progress? What are the best methods for overcoming the challenges designers
face when working with professionals outside of their areas of expertise?
23
-CHAPTER 2
METHOD
Design and Participants
This study employed some features of a quasi-experimental design to investigate
the success of the curriculum project and aspects of the instructional design and
development process (Richey & Klein 2009). Quantitative and qualitative data were
collected. Quantitative data included learning gains in student knowledge, utilizing a
pretest to posttest design with a phase that included a portion of the learning material, and
a phase that included most or the entire learning unit along with student and faculty
responses to Likert-type scale attitude survey questions. Qualitative data comprised of
student and faculty open-ended responses to attitude questions, interview data of faculty,
IdID team member interviews and post-interview follow up questions of the IdID team
were utilized. Qualitative data in the form of observation notes, meeting notes, a design
log and the archival materials developed were also utilized.
The researcher’s participation in the study was multi-faceted, serving as
instructional designer, researcher and evaluator. As a member of the team, the researcher
helped develop and evaluate the learning and measurement materials. As a researcher, the
researcher evaluated the design and development process from the standpoint of the
interdisciplinary instructional design team to add to the base knowledge of the field.
Additional tasks of the researcher included the completion of a second IRB application
initiated to collect additional data in the IdID process.
24
Participants
Participants included the interdisciplinary instructional design (IdID) team
members, the participating faculty and their graduate research assistants and the
undergraduate civil engineering students at the participating universities.
The IdID team members. The IdID team consisted of members of the Ira A.
Fulton Schools of Engineering at Arizona State University, including Dr. Sandra
Houston, principle investigator, Dr. Claudia Zapata, co-principal investigator, and
research assistant, Eddy Ramirez, all who served as the subject matter experts. Members
from the Mary Lou Fulton Teachers College at Arizona State University who also
contributed to this team included Dr. Wilhelmina Savenye, co-principal investigator, and
research assistants, Arthur Ornelas and Allen Corral. Members no longer with the team
but who contributed to some of the learning materials were engineering research
assistant, Robert Jarrett and educational technology research assistant, John Sadauskus.
Engineering faculty at the partner universities. Faculty members and their
graduate research assistants who participated in this study taught at the eight partner
universities, from throughout the United States and the Caribbean. One to three faculty
members and graduate research assistants participated from each institution, as different
instructors taught different semesters. Faculty and graduate assistant participation varied
as some assisted in the Phase 1 baseline survey administration, some in the Phase 2 one-
module implementation and others in the Phase 3 implementation of the entire learning
unit. They entered this study with a wide range of teaching experience.
25
Partner universities involved in the project at various levels of participation included:
Arizona State University – Tempe
The University of Colorado – Boulder
The University of Oklahoma – Norman
Purdue University
The University of Missouri – Columbia
The University of Wisconsin – Madison
The University of Puerto Rico
The University of Texas – Arlington
As the team proceeded through the instructional design project, participating
faculty changed, thus effecting faculty assistance in the study. Class availability was
another factor in regards to participation. Some partner universities only offered the
geotechnical engineering course one semester per academic year.
Full summaries of the participating faculty and students are included in the
“Results” section. An example of participating faculty and institutions for the spring 2013
Pretest/Posttest on stress state variables component are listed below, along with the
number of students from whom the team received data. Faculty from whom a completed
faculty survey was collected are indicated in parentheses:
Institution 1; Instructor 1 – (49 Pre and 49 post; 42 matched) (faculty survey)
Institution 2; Instructor 7 – (faculty survey)
Institution 4; Instructor 10 – (35 pre and 34 post; 22 matched)
Institution 6; Instructor 9 – (24 pre and 38 post; 6 matched) (faculty survey)
Institution 7; Instructor 11 – (16 pre and 16 post; 9 matched)
Undergraduate civil engineering students. The students involved in this study
were all undergraduate engineering majors. Most students were specializing in civil
engineering with a few variations. The geotechnical engineering courses this study used
are a required part of most students’ courses of study at their respective universities. The
geotechnical engineering courses were upper division classes, thus most students were in
26
at least their second year of college, though most were more than likely in their third or
fourth year. Most of the students ranged in age from about 19 to 25 years, however there
were also more mature students in the respective programs. Most students in the study
were civil engineering majors further along in a civil engineering program of study, so it
was reasonable to infer that these students had a fair understanding of basic civil
engineering concepts.
Materials
Materials used in this study included a 9-question survey or test of student
knowledge in basic unsaturated soils material, as determined by the subject matter
experts on the team along with team-created instructional materials in unsaturated soils.
Other materials utilized included the student attitudinal survey, faculty surveys, faculty
interview scripts, IdID team interview scripts and post-interview IdID team questions.
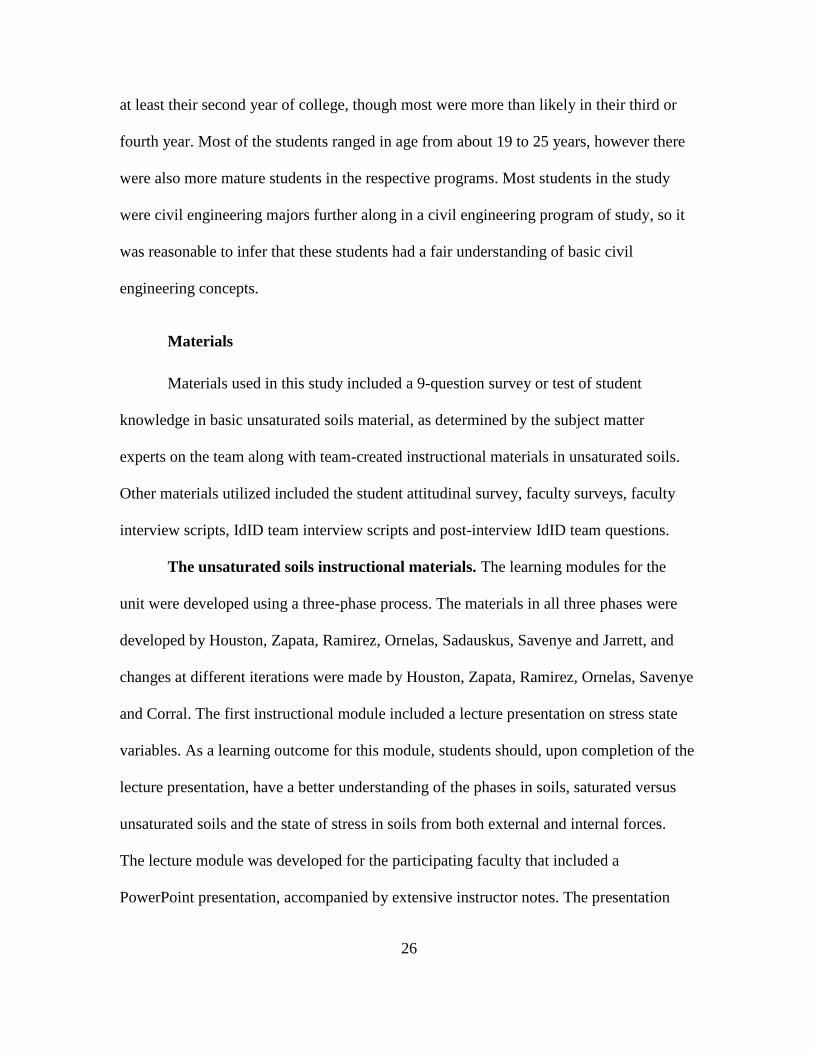
The unsaturated soils instructional materials. The learning modules for the
unit were developed using a three-phase process. The materials in all three phases were
developed by Houston, Zapata, Ramirez, Ornelas, Sadauskus, Savenye and Jarrett, and
changes at different iterations were made by Houston, Zapata, Ramirez, Ornelas, Savenye
and Corral. The first instructional module included a lecture presentation on stress state
variables. As a learning outcome for this module, students should, upon completion of the
lecture presentation, have a better understanding of the phases in soils, saturated versus
unsaturated soils and the state of stress in soils from both external and internal forces.
The lecture module was developed for the participating faculty that included a
PowerPoint presentation, accompanied by extensive instructor notes. The presentation
27
was e-mailed to the partners in both a PowerPoint and PDF formats. This instructional
module was delivered to the participating faculty prior to the spring semester of 2013.
Figure 5 shows four of the slides from the presentation on stress state variables.
Figure 5. Stress state variables PowerPoint sample slides. This figure illustrates four slides (2, 14, 38 & 56)
from the stress state variables PowerPoint created by the team (Houston, Zapata, Sadauskus, Ornelas,
Savenye, Ramirez, 2013; used with permission).
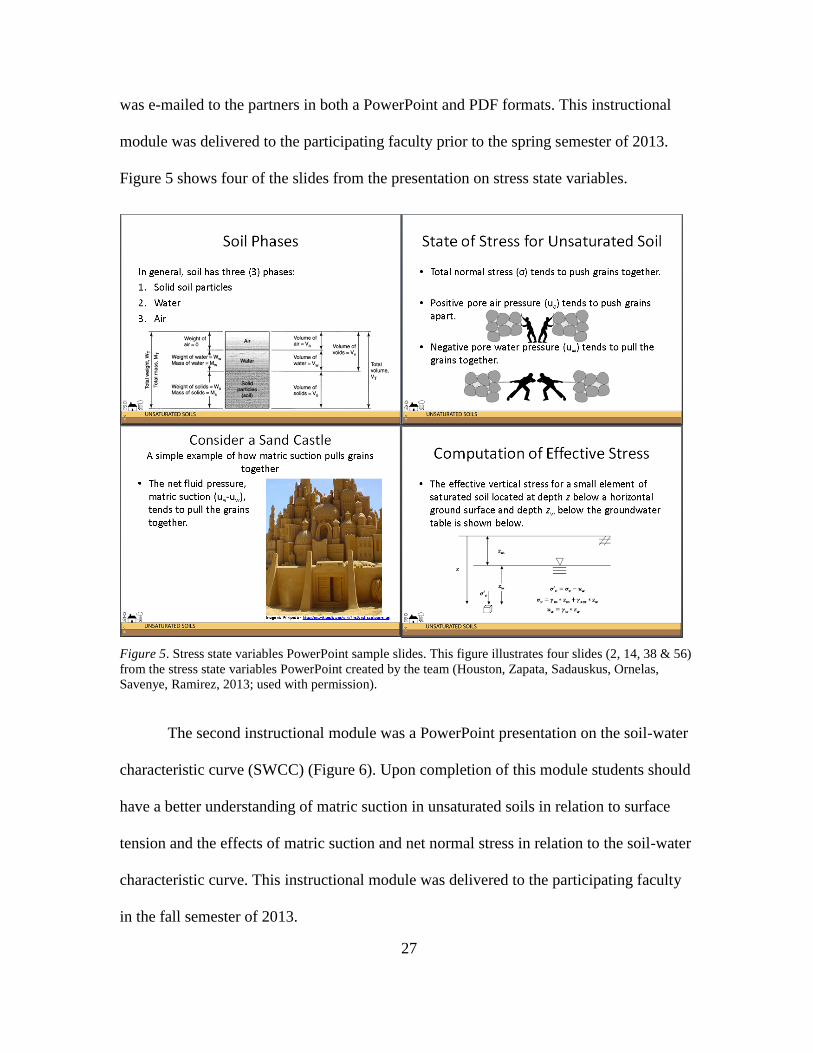
The second instructional module was a PowerPoint presentation on the soil-water
characteristic curve (SWCC) (Figure 6). Upon completion of this module students should
have a better understanding of matric suction in unsaturated soils in relation to surface
tension and the effects of matric suction and net normal stress in relation to the soil-water
characteristic curve. This instructional module was delivered to the participating faculty
in the fall semester of 2013.
28
Figure 6. Soil-water characteristic curve PowerPoint sample slides. This figure illustrates four slides (3, 11,
31 & 33) on the soil-water characteristic curve created by the team (Houston, Zapata, Ornelas, Sadauskus,
Savenye, Ramirez, 2013; used with permission).
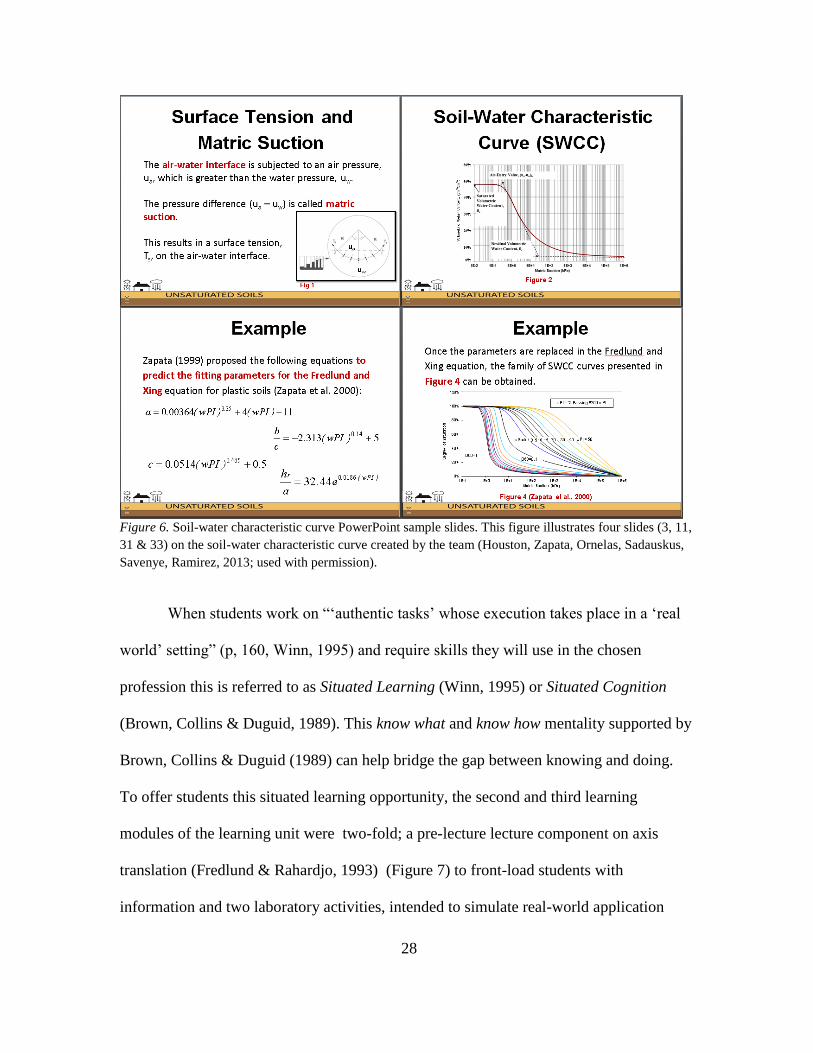
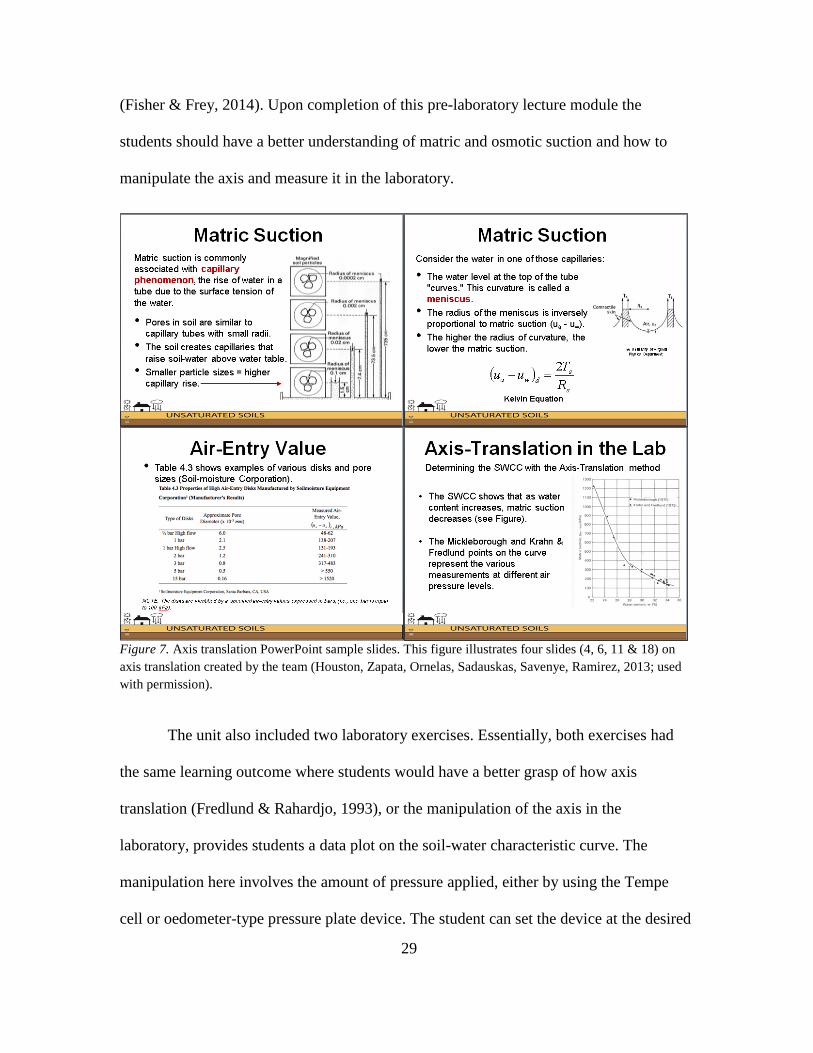
When students work on “‘authentic tasks’ whose execution takes place in a ‘real
world’ setting” (p, 160, Winn, 1995) and require skills they will use in the chosen
profession this is referred to as Situated Learning (Winn, 1995) or Situated Cognition
(Brown, Collins & Duguid, 1989). This know what and know how mentality supported by
Brown, Collins & Duguid (1989) can help bridge the gap between knowing and doing.
To offer students this situated learning opportunity, the second and third learning
modules of the learning unit were two-fold; a pre-lecture lecture component on axis
translation (Fredlund & Rahardjo, 1993) (Figure 7) to front-load students with
information and two laboratory activities, intended to simulate real-world application
29
(Fisher & Frey, 2014). Upon completion of this pre-laboratory lecture module the
students should have a better understanding of matric and osmotic suction and how to
manipulate the axis and measure it in the laboratory.
Figure 7. Axis translation PowerPoint sample slides. This figure illustrates four slides (4, 6, 11 & 18) on
axis translation created by the team (Houston, Zapata, Ornelas, Sadauskas, Savenye, Ramirez, 2013; used
with permission).
The unit also included two laboratory exercises. Essentially, both exercises had
the same learning outcome where students would have a better grasp of how axis
translation (Fredlund & Rahardjo, 1993), or the manipulation of the axis in the
laboratory, provides students a data plot on the soil-water characteristic curve. The
manipulation here involves the amount of pressure applied, either by using the Tempe
cell or oedometer-type pressure plate device. The student can set the device at the desired
30
or required pressure. Laboratory exercises for both devices were developed as a simple
matter of pragmatics. Some institutions may have access to only one type of the device,
thus the team felt developing material for both would be ideal.
In an environment where faculty can be resistant to change (Bareil, 2013; Lane
2007), flexibility (Nikolova & Collis, 1998) and usability of the learning content was a
concern of the team. Two laboratory presentations along with procedural manuals were
developed for both the Tempe cell device and the Fredlund SWC-150 or oedometer-type
pressure plate device which would allow for flexibility in regards to the availability of
laboratory material at each institution. Although the oedometer-type pressure plate device
provides more data, both devices give enough data for the students to complete the team-
created exercise on plotting the soil-water characteristic curve (SWCC). However, the
Tempe cell device is more cost-effective than the oedometer-type pressure plate. Most of
the partner institutions had the oedometer-type pressure plate equipment to conduct this
learning module; however, some did not have an inadequate amount of devices to
conduct this learning module with an entire class. Thus offering the Tempe cell learning
material was much more cost effective and most of the partners would have the necessary
amount of Tempe cell devices to successfully complete this laboratory activity.
Data Sources - Archival Data
Data sources used and analyzed in this study included student scores at the three
phases of implementation, student attitudinal data, faculty attitudinal data, IdID team
attitudinal data and observational data in the form of meeting notes, a design log and
observational notes.
31
Overview of learning measures. The content knowledge measure used for the
baseline data of the summer and fall semesters of 2012, the pretest/posttest of the spring
and summer 2013 semesters and the pretest/posttest of the fall 2013 semester were all the
same. The measure included nine content knowledge questions that were determined by
the SMEs to be basic unsaturated soil mechanics knowledge. The instructional designers
also assisted in the development of the content knowledge measures. A baseline using
the nine-question survey or test was administered in the summer and fall semesters of
2012, during learning content development. This no-implementation phase was run to
assess what undergraduate civil engineering students know about unsaturated soils upon
completion of a “typical” geotechnical engineering class.
Additional data were collected in the spring of 2013 using the same 9-question
quiz. These data were collected from five universities. In this quasi-experimental design,
the students were given the pretest followed by the prototype instructional lecture on
stress state variables. Students then completed the posttest, followed by a student attitude
survey.
It should be noted that the knowledge quiz covered content to be taught in the
entire unit of instruction. Thus, only a few items, about 4, measured content taught in the
first module on stress state variables.
Phase 1: Baseline. Russ-Eft and Preskill (2009) suggest if archival data is
available, it should be utilized. Archival data in this study included data collected in the
summer of 2012 when the team conducted the first baseline survey of students’
knowledge on what Houston, Zapata and Jarrett felt were basic concepts of unsaturated
32
soils (Appendix A). The test of nine questions was given to the Civil and Environmental
Engineering (CEE) 351: Geotechnical Engineering class, which is a required course for
civil engineering majors, in the summer of 2012. The professor of record was Dr. Chris
Lawrence at Arizona State University. The purpose of the baseline survey was to test
students’ basic knowledge of unsaturated soils at the end of a typical geotechnical
engineering class. The results from this survey were used in the first technical report to
the NSF in July of 2012.
More baseline data were collected in the fall of 2012:
Institution 1, instructor 3 – (37 Baseline surveys)
Institution 2, instructor 2 (63 Baseline surveys)
Institution 6, instructor 5 – (30 Baseline surveys)
Institution 5, instructor 6 – (78 Baseline surveys)
Institution 8, instructor 13 – (53 Baseline surveys)
Institution 3, instructor 4 – (86 Baseline surveys)
These data were used by Houston in the NSF report summarizing the team’s
progress on the design project. The student pretest1 (Appendix A) was used for additional
data collection in the fall of 2012. The baseline data collected in the summer and fall of
2012 were summarized in a poster (Figure 8) session at the 2013 convention of the
American Society of Engineering Education (ASEE) in Atlanta, Georgia on June 24th
(Ornelas, et al., 2013).
1 Although Appendix A is noted as a “Pretest,” it was used as “Posttest” data in SPSS for the baseline
collection of data because the test was administered after they were taught any material in unsaturated soils
in their regular geotechnical engineering classes.
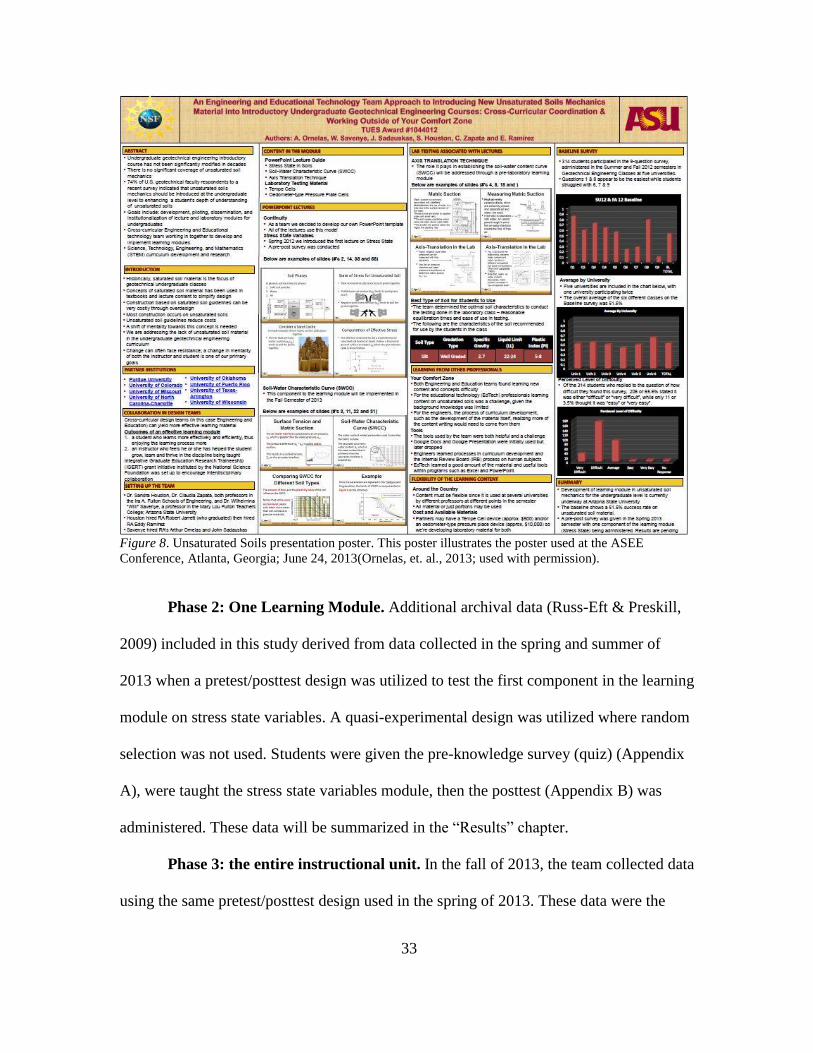
33
Figure 8. Unsaturated Soils presentation poster. This poster illustrates the poster used at the ASEE
Conference, Atlanta, Georgia; June 24, 2013(Ornelas, et. al., 2013; used with permission).
Phase 2: One Learning Module. Additional archival data (Russ-Eft & Preskill,
2009) included in this study derived from data collected in the spring and summer of
2013 when a pretest/posttest design was utilized to test the first component in the learning
module on stress state variables. A quasi-experimental design was utilized where random
selection was not used. Students were given the pre-knowledge survey (quiz) (Appendix
A), were taught the stress state variables module, then the posttest (Appendix B) was
administered. These data will be summarized in the “Results” chapter.
Phase 3: the entire instructional unit. In the fall of 2013, the team collected data
using the same pretest/posttest design used in the spring of 2013. These data were the
34
basis of analysis on the effectiveness of the entire learning unit. Along with the already-
in-place stress state variables material, a second component on the soil-water
characteristic curve was taught. A pre-laboratory lecture on axis translation (Fredlund &
Rahardjo, 1993), followed with a laboratory exercise on either the Tempe cell or the
oedometer-type pressure plate were also introduced in this phase of the project.
The participating faculty administered the pretest, the unit and then the posttest,
which included the student attitude questions. Participating universities for the fall 2013
semester were Arizona State University, the University of Oklahoma and Purdue
University. These participating universities taught most of or the entire learning unit.
Procedures
The procedures used in this design and development study included both a
retrospective review of the data collected from the measures already administered, along
with notes collected from IdID team meetings and personal notes and observations on the
design and development process. Also included were the student learning and attitude
data, and the faculty attitude data in the form of surveys and interviews collected in the
fall of 2013, along with student learning data collected in all the semesters.
In the fall 2013 the team asked the participating faculty to administer the 9-
question quiz as a pretest, teach two content modules, the original one on stress state
variables and a second on the soil-water characteristic curve, then teach the pre-lab
lecture on axis translation (Fredlund & Rahardjo, 1993) followed by a laboratory exercise
on either the Tempe cell device or the oedometer-type pressure plate device, then
administer the same 9-question quiz as a posttest. The posttest also included student
attitudinal questions that were both Likert-type scale and open-ended based.
35
The mixed methods study approach included both quantitative and qualitative
research procedures. Quantitative data from the test for statistically significant growth in
students’ understanding between the fall 2013 third phase and the first two phases of the
project and student, faculty and IdID team responses to Likert-type scale questions were
analyzed. Qualitative data from the open-ended questions on the faculty surveys and
student attitude surveys were also examined. The researcher added a faculty interview
conducted in the fall and summer of 2013 by phone or Skype.
Interviews of the design team members by the researcher were also conducted and
those data were analyzed to check for the attitudes, concerns and suggestions of the team
members. Team members’ suggestions for improvements to the design process on this
particular project and on design projects as a whole were analyzed. The interviews were
both formal and informal and responses to the questions from a semi-structured interview
protocol (Appendix E) and the post-interview survey (Appendix F) were used for
suggestions for future studies on interdisciplinary instructional design and future design
and development projects in both academia and industry.
An IRB application was completed to cover the interview processes with the
faculty and the team members. This IRB submitted by the researcher worked in
conjunction with the IRB that was already in place for the unsaturated soils project.
The design process for this study is summarized in Figure 9. Some data were
archival, with the additional data collected in the fall semester of 2013. The data enabled
the researcher and the design team to determine the knowledge gained by the students
from the project’s learning materials on unsaturated soils. These data were also compared
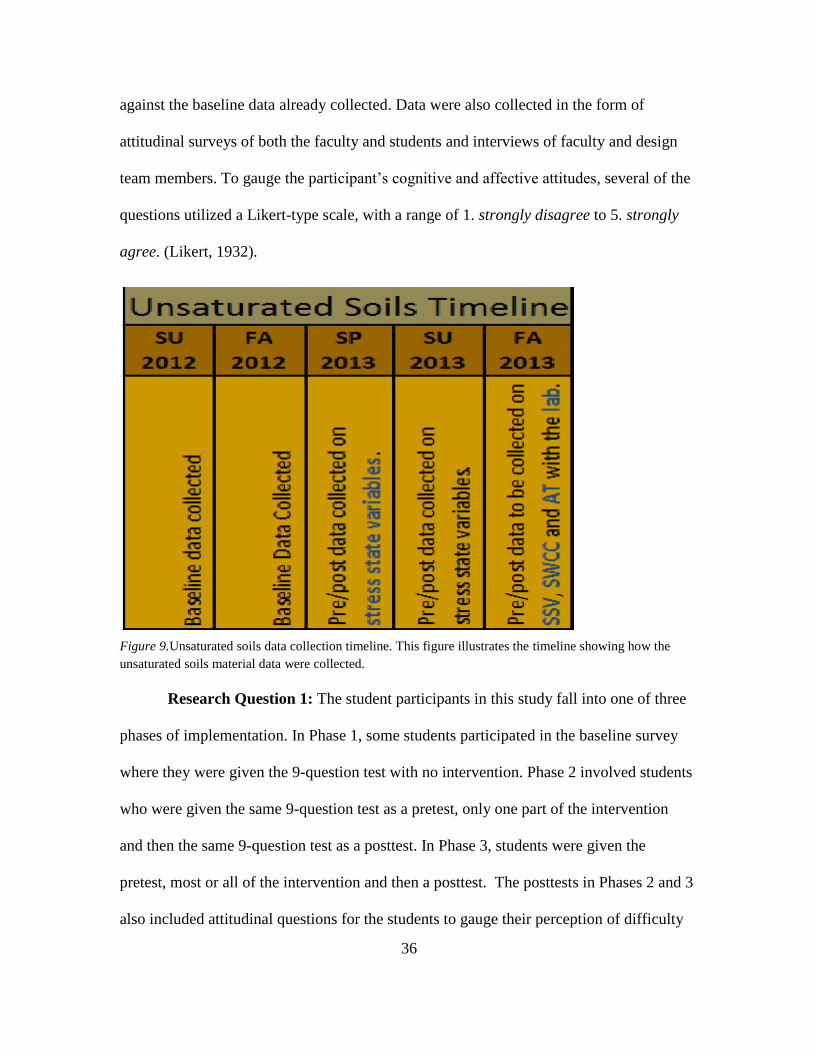
36
against the baseline data already collected. Data were also collected in the form of
attitudinal surveys of both the faculty and students and interviews of faculty and design
team members. To gauge the participant’s cognitive and affective attitudes, several of the
questions utilized a Likert-type scale, with a range of 1. strongly disagree to 5. strongly
agree. (Likert, 1932).
Figure 9.Unsaturated soils data collection timeline. This figure illustrates the timeline showing how the
unsaturated soils material data were collected.
Research Question 1: The student participants in this study fall into one of three
phases of implementation. In Phase 1, some students participated in the baseline survey
where they were given the 9-question test with no intervention. Phase 2 involved students
who were given the same 9-question test as a pretest, only one part of the intervention
and then the same 9-question test as a posttest. In Phase 3, students were given the
pretest, most or all of the intervention and then a posttest. The posttests in Phases 2 and 3
also included attitudinal questions for the students to gauge their perception of difficulty
37
with the test and the usefulness of the learning content in the unit. These data were
analyzed to test the effectiveness of the learning materials on the students and their
attitudes towards the learning materials. Most faculty involved in the project also
completed a faculty survey and were interviewed. The early data were particularly useful
in subsequent iterations of the learning material, which was designed for flexibility across
multiple universities with multiple instructors who use various teaching methods and
cover unsaturated soils material at different points in the semester.
Research Question 2. The interdisciplinary instructional design (IdID) team
members were interviewed by the researcher during the spring 2014 semester. The
additional data collected using the student and faculty surveys also added reflective
information to the team development question. Notes taken from the team meetings also
aided with this data analysis. As part of the note-taking process, the researcher kept an
informal design log with observational notes. The notes taken proved to be valuable data,
aiding in the design of the materials and the reflective process of the team on what was
created.
Measures
Measures used in this study included the 9-question quiz, student attitudinal
questions and faculty surveys and interviews. IdID team interviews and follow-up
questions were also employed.
Student baseline, pretest/posttest knowledge measure. A pretest/posttest
design (Appendices A and B, respectively) was utilized to measure student growth after
they were taught module(s) in the unit (Figure 10). The student pretest (Houston, Zapata,
Ornelas, Sadauskas, Savenye, Jarrett, & Ramirez, 2012) was also administered for the
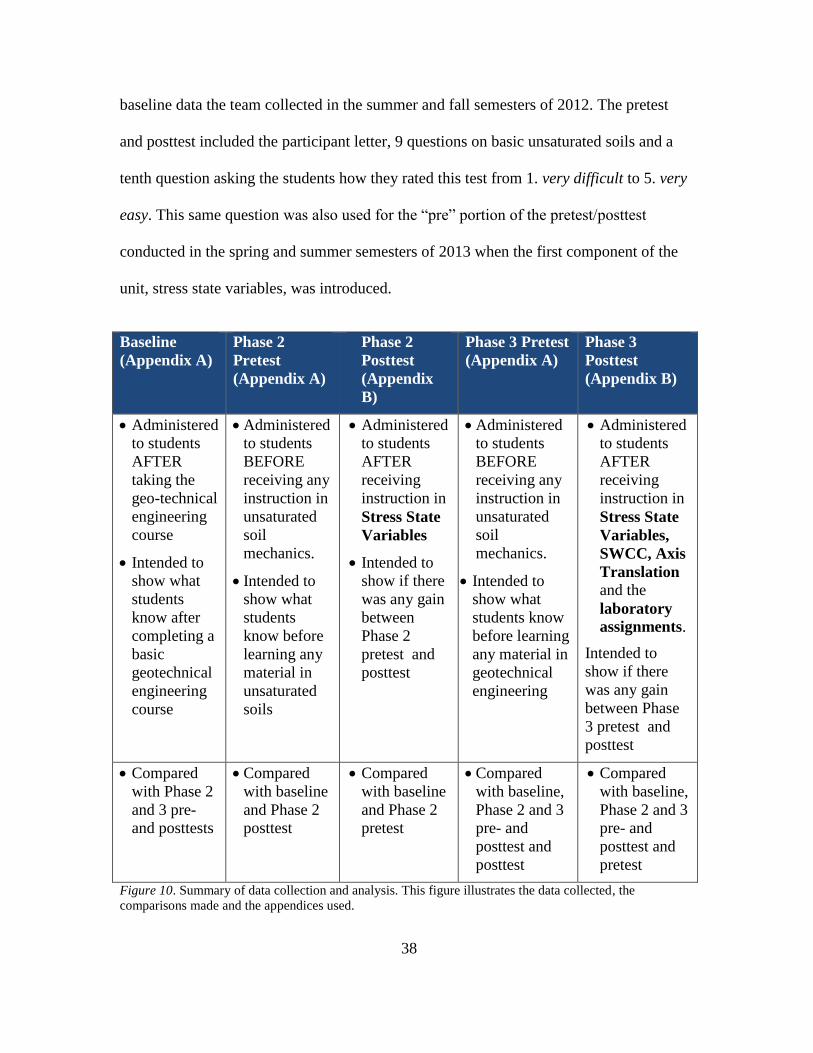
38
baseline data the team collected in the summer and fall semesters of 2012. The pretest
and posttest included the participant letter, 9 questions on basic unsaturated soils and a
tenth question asking the students how they rated this test from 1. very difficult to 5. very
easy. This same question was also used for the “pre” portion of the pretest/posttest
conducted in the spring and summer semesters of 2013 when the first component of the
unit, stress state variables, was introduced.
Baseline
(Appendix A)
Phase 2
Pretest
(Appendix A)
Phase 2
Posttest
(Appendix
B)
Phase 3 Pretest
(Appendix A)
Phase 3
Posttest
(Appendix B)
Administered
to students
AFTER
taking the
geo-technical
engineering
course
Intended to
show what
students
know after
completing a
basic
geotechnical
engineering
course
Administered
to students
BEFORE
receiving any
instruction in
unsaturated
soil
mechanics.
Intended to
show what
students
know before
learning any
material in
unsaturated
soils
Administered
to students
AFTER
receiving
instruction in
Stress State
Variables
Intended to
show if there
was any gain
between
Phase 2
pretest and
posttest
Administered
to students
BEFORE
receiving any
instruction in
unsaturated
soil
mechanics.
Intended to
show what
students know
before learning
any material in
geotechnical
engineering
Administered
to students
AFTER
receiving
instruction in
Stress State
Variables,
SWCC, Axis
Translation
and the
laboratory
assignments.
Intended to
show if there
was any gain
between Phase
3 pretest and
posttest
Compared
with Phase 2
and 3 pre-
and posttests
Compared
with baseline
and Phase 2
posttest
Compared
with baseline
and Phase 2
pretest
Compared
with baseline,
Phase 2 and 3
pre- and
posttest and
posttest
Compared
with baseline,
Phase 2 and 3
pre- and
posttest and
pretest
Figure 10. Summary of data collection and analysis. This figure illustrates the data collected, the
comparisons made and the appendices used.
39
Student attitude survey. The team developed an attitude survey for the students
that was first used with the spring of 2013 student participants, as part of the formative
evaluation of the stress state variables module, the first prototype module. This measure
was used to gauge the students’ attitudes regarding the material that was covered and how
useful they considered it would be for them. This measure was also used in the fall of
2013 to collect attitudinal data regarding all the project modules taught. Students
completed this as the second section to the posttest. It consisted of both Likert-type
(1932) scale and open-ended questions (Savenye, Houston, Zapata, Ornelas, & Ramirez,
2012). (This can be found in second section of the Posttest in Appendix B).
Faculty attitude survey and interviews. In the faculty survey (Appendix C), the
participating faculty and their research assistants were also questioned on the usefulness
of this material in regards to their students’ future and the relevance in implementing this
material in their class (Ornelas, et al., 2013). As with the student survey, the faculty
survey utilized Likert-type scale and open-ended questions.
In addition to the faculty survey, a faculty semi-structured interview protocol
(Appendix D) was utilized to assess the faculty attitudes towards the design process, the
amount of the unsaturated soils materials that were used in their classes, along with their
suggestions on what improvements could be made to the learning materials and the
design process.
IdID team interview and follow-up questions. The IdID team process was also
evaluated using a semi-structured interview protocol (Appendix E) that included closed-
and open-ended questions. These interviews were conducted with the team to determine
the attitudes of the team along with the discussions and decisions the team had and
40
challenges the team faced as they developed and evaluated the materials. This was of
particular interest because, up to the time of this study, some team members had only
worked with professionals in their own discipline. The data were analyzed to check for
patterns using techniques offered by Saldaña (2012) in what the team felt worked well
and issues they faced, as well as the challenges and advantages of working with those
outside of their own discipline. A post-interview follow up questionnaire (Appendix F)
was also administered with the team that consisted of 15 Likert-type scale questions on a
scale from 1. strongly disagree to 5. strongly agree, and one open-ended question. These
data were analyzed based on the 5-point scale with frequencies, means and standard
deviations. The one team member’s response to the open-ended question is noted in the
text of the “Results” chapter.
Design log, and IdID team meeting notes. Discussions, decisions and challenges
were also evaluated by keeping and analyzing team meeting notes and a design log that
included observations of the team as they met and developed the learning material. Other
valuable data that were collected and analyzed derived from e-mails shared by the team
and notes taken in classroom observations of unsaturated soils material implementation
and lab observations in the testing of the learning material.
Data Analysis
Several sources of data were used in this study. Paired-sampled t-tests and
analysis of the variance (ANOVA) tests were conducted with the quantitative data.
Responses to the qualitative interview and open-ended attitude questions were analyzed
for patterns and categories of responses were established using techniques offered by
Saldaña (2012). Similarly, the data in the form of design logs, meeting notes, materials,

41
and class observation notes were also analyzed for patterns. Inferences made regarding
these data were coded and themes were established.
42
CHAPTER 3
RESULTS
Data for this study were collected from the initiation of the interdisciplinary
instructional design (IdID) project in the spring of 2012 through the pilot test of the
unsaturated soils instructional materials in the fall of 2013. Additional data were
collected on the design and development (Richey & Klein, 2009) process. Results of the
data collected will be presented in this chapter by research question, as this study
followed the design of new material as recommended by accepted principles of
instructional design (Dick, Carey & Carey, 2009; Gagne, 1985), and, as will be evident in
this chapter, aided in the success of the project.
Several data sets were collected for research question 1, “What are the learning
and attitudinal effects of a new instructional unit on unsaturated soils in geotechnical
engineering developed using systematic processes of design and development?” Archival
data (Russ-Eft & Preskill, 2009) were collected prior to the defense of the study proposal.
These data include those from Phase 1, the no-instruction baseline on student
achievement on the 9-question quiz (Appendix A) from the summer and fall of 2012, and
Phase 2, the analysis of data on the effectiveness of one learning module, stress state
variables, on student achievement from pretest (Appendix A) to posttest (Appendix B) on
the 9-question quiz, as well as student attitudinal data (Appendix B). These data were
collected in the spring and summer of 2013. Phase 3 data analysis, which included data
collected as part of the post-proposal dissertation study, were conducted in order to
determine the effectiveness when the entire unit on learning was available to participating
faculty; that is student achievement from pretest (Appendix A) to posttest (Appendix B)
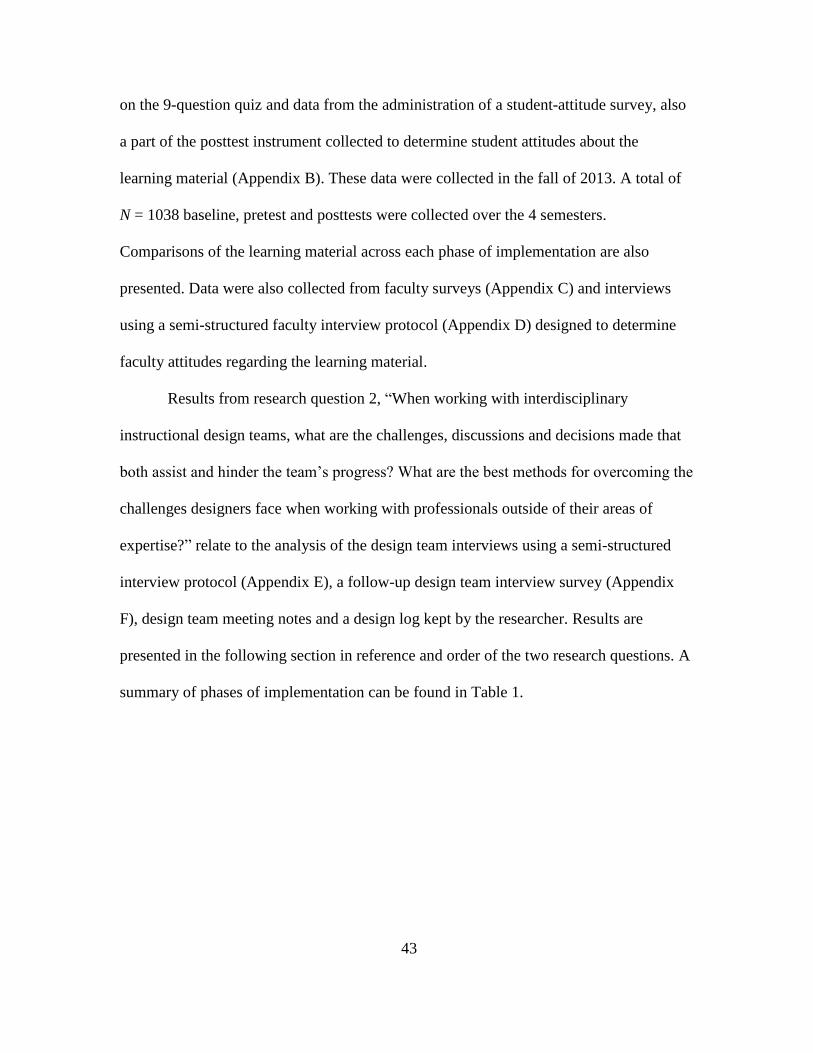
43
on the 9-question quiz and data from the administration of a student-attitude survey, also
a part of the posttest instrument collected to determine student attitudes about the
learning material (Appendix B). These data were collected in the fall of 2013. A total of
N = 1038 baseline, pretest and posttests were collected over the 4 semesters.
Comparisons of the learning material across each phase of implementation are also
presented. Data were also collected from faculty surveys (Appendix C) and interviews
using a semi-structured faculty interview protocol (Appendix D) designed to determine
faculty attitudes regarding the learning material.
Results from research question 2, “When working with interdisciplinary
instructional design teams, what are the challenges, discussions and decisions made that
both assist and hinder the team’s progress? What are the best methods for overcoming the
challenges designers face when working with professionals outside of their areas of
expertise?” relate to the analysis of the design team interviews using a semi-structured
interview protocol (Appendix E), a follow-up design team interview survey (Appendix
F), design team meeting notes and a design log kept by the researcher. Results are
presented in the following section in reference and order of the two research questions. A
summary of phases of implementation can be found in Table 1.
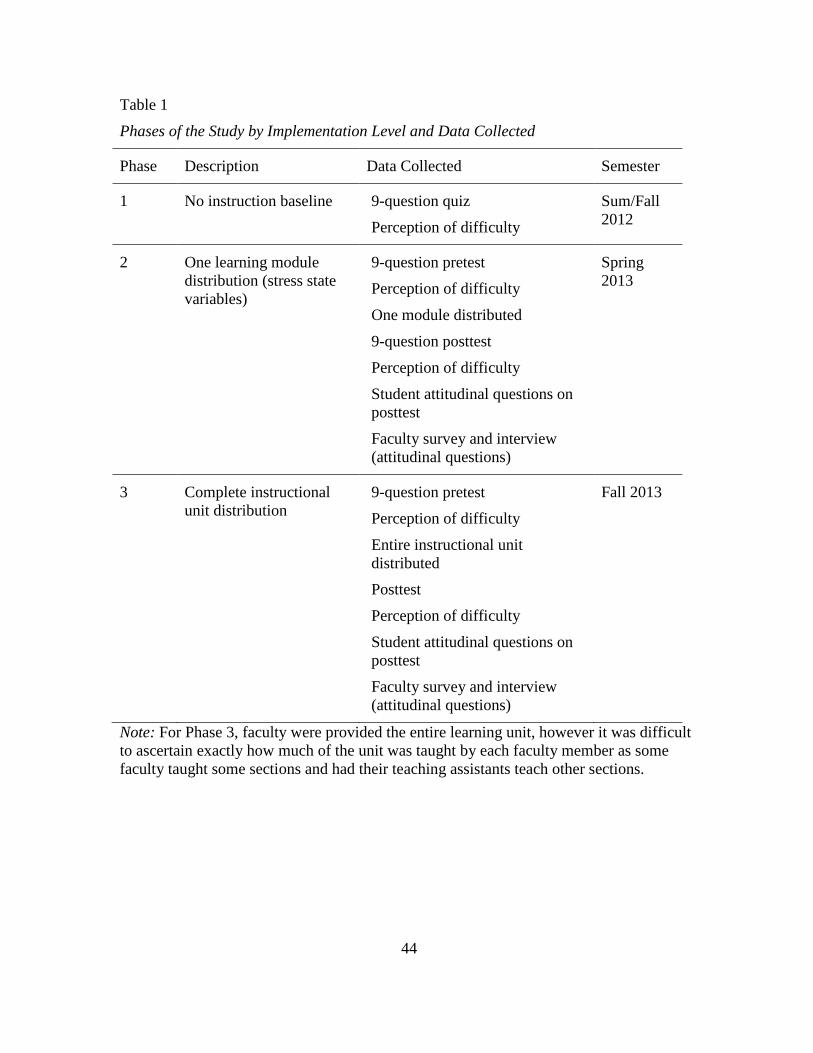
44
Table 1
Phases of the Study by Implementation Level and Data Collected
Phase Description Data Collected Semester
1 No instruction baseline 9-question quiz
Perception of difficulty
Sum/Fall
2012
2 One learning module
distribution (stress state
variables)
9-question pretest
Perception of difficulty
One module distributed
9-question posttest
Perception of difficulty
Student attitudinal questions on
posttest
Faculty survey and interview
(attitudinal questions)
Spring
2013
3 Complete instructional
unit distribution
9-question pretest
Perception of difficulty
Entire instructional unit
distributed
Posttest
Perception of difficulty
Student attitudinal questions on
posttest
Faculty survey and interview
(attitudinal questions)
Fall 2013
Note: For Phase 3, faculty were provided the entire learning unit, however it was difficult
to ascertain exactly how much of the unit was taught by each faculty member as some
faculty taught some sections and had their teaching assistants teach other sections.
45
Phase 1: Baseline Student Achievement and Perception of Difficulty with No
Instruction; Summer and Spring 2012
Results from the Phase 1 baseline with no instruction are presented in this section.
Results include student achievement on the 9-question quiz and the student’s perception
of difficulty on the quiz.
Baseline learning/achievement results on the 9-question learning quiz for
Phase 1; summer and fall 2012. In the summer and fall semesters of 2012, the design
team conducted a baseline of student knowledge to test the comprehension level of an
undergraduate civil engineering student in basic unsaturated soils concepts upon the
completion of a regular, required course in geotechnical engineering. This course
typically has a section with a primary focus on earth materials and their reaction to
outside materials and forces. Students at four universities from across the country and the
Caribbean participated in this phase of the study. Five instructors participated, two from
one university and one twice, in the summer and fall sessions, resulting in the collection
of baseline data from six different undergraduate geotechnical engineering classes.
Student participants (n = 368) were undergraduates and most students were civil
engineering majors with various areas of focus. Descriptive statistics using SPSS were
conducted on the baseline data and the results indicated that of the possible 9 questions,
with a total possible score of 9, students scored an overall mean of 4.79 (SD = 1.57).
Mean scores and standard deviations were also calculated for each question,
independently. Question 9 had the lowest mean of 0.10 (SD = .30) and question 1 with
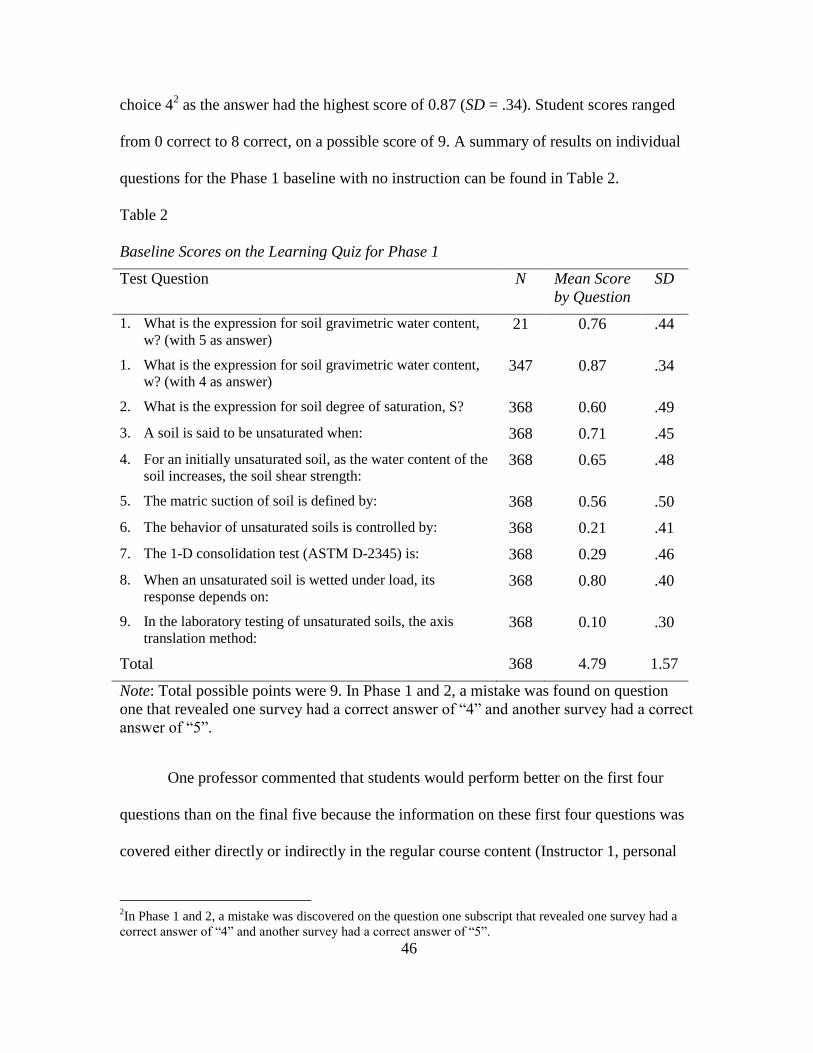
46
choice 42 as the answer had the highest score of 0.87 (SD = .34). Student scores ranged
from 0 correct to 8 correct, on a possible score of 9. A summary of results on individual
questions for the Phase 1 baseline with no instruction can be found in Table 2.
Table 2
Baseline Scores on the Learning Quiz for Phase 1
Test Question N Mean Score
by Question
SD
1. What is the expression for soil gravimetric water content,
w? (with 5 as answer) 21 0.76 .44
1. What is the expression for soil gravimetric water content,
w? (with 4 as answer) 347 0.87 .34
2. What is the expression for soil degree of saturation, S? 368 0.60 .49
3. A soil is said to be unsaturated when: 368 0.71 .45
4. For an initially unsaturated soil, as the water content of the
soil increases, the soil shear strength: 368 0.65 .48
5. The matric suction of soil is defined by: 368 0.56 .50
6. The behavior of unsaturated soils is controlled by: 368 0.21 .41
7. The 1-D consolidation test (ASTM D-2345) is: 368 0.29 .46
8. When an unsaturated soil is wetted under load, its
response depends on: 368 0.80 .40
9. In the laboratory testing of unsaturated soils, the axis
translation method: 368 0.10 .30
Total 368 4.79 1.57
Note: Total possible points were 9. In Phase 1 and 2, a mistake was found on question
one that revealed one survey had a correct answer of “4” and another survey had a correct
answer of “5”.
One professor commented that students would perform better on the first four
questions than on the final five because the information on these first four questions was
covered either directly or indirectly in the regular course content (Instructor 1, personal
2In Phase 1 and 2, a mistake was discovered on the question one subscript that revealed one survey had a
correct answer of “4” and another survey had a correct answer of “5”.
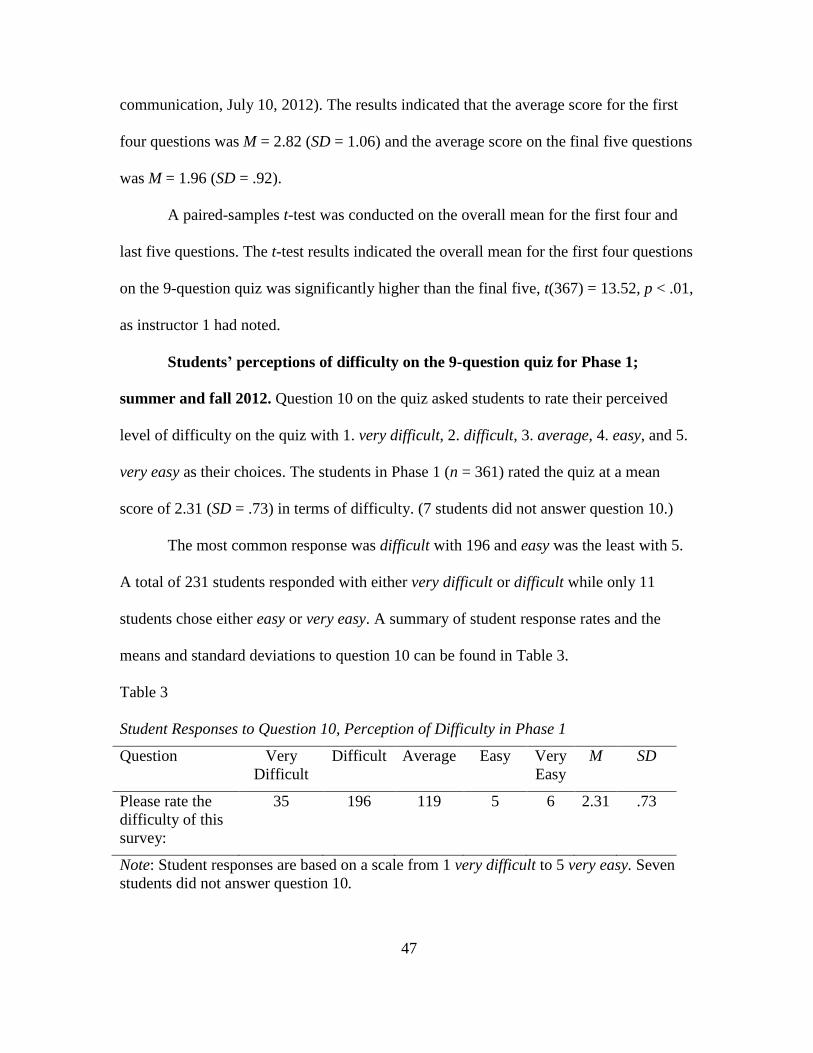
47
communication, July 10, 2012). The results indicated that the average score for the first
four questions was M = 2.82 (SD = 1.06) and the average score on the final five questions
was M = 1.96 (SD = .92).
A paired-samples t-test was conducted on the overall mean for the first four and
last five questions. The t-test results indicated the overall mean for the first four questions
on the 9-question quiz was significantly higher than the final five, t(367) = 13.52, p < .01,
as instructor 1 had noted.
Students’ perceptions of difficulty on the 9-question quiz for Phase 1;
summer and fall 2012. Question 10 on the quiz asked students to rate their perceived
level of difficulty on the quiz with 1. very difficult, 2. difficult, 3. average, 4. easy, and 5.
very easy as their choices. The students in Phase 1 (n = 361) rated the quiz at a mean
score of 2.31 (SD = .73) in terms of difficulty. (7 students did not answer question 10.)
The most common response was difficult with 196 and easy was the least with 5.
A total of 231 students responded with either very difficult or difficult while only 11
students chose either easy or very easy. A summary of student response rates and the
means and standard deviations to question 10 can be found in Table 3.
Table 3
Student Responses to Question 10, Perception of Difficulty in Phase 1
Question Very
Difficult
Difficult Average Easy Very
Easy
M SD
Please rate the
difficulty of this
survey:
35 196 119 5 6 2.31 .73
Note: Student responses are based on a scale from 1 very difficult to 5 very easy. Seven
students did not answer question 10.
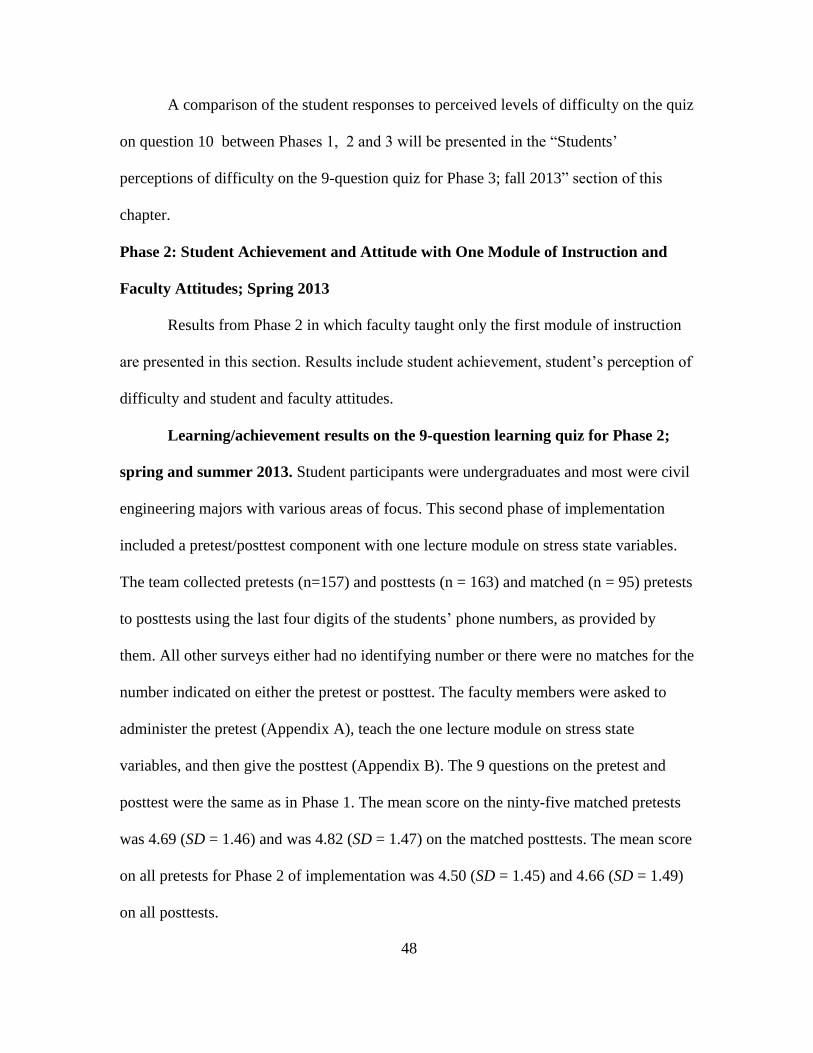
48
A comparison of the student responses to perceived levels of difficulty on the quiz
on question 10 between Phases 1, 2 and 3 will be presented in the “Students’
perceptions of difficulty on the 9-question quiz for Phase 3; fall 2013” section of this
chapter.
Phase 2: Student Achievement and Attitude with One Module of Instruction and
Faculty Attitudes; Spring 2013
Results from Phase 2 in which faculty taught only the first module of instruction
are presented in this section. Results include student achievement, student’s perception of
difficulty and student and faculty attitudes.
Learning/achievement results on the 9-question learning quiz for Phase 2;
spring and summer 2013. Student participants were undergraduates and most were civil
engineering majors with various areas of focus. This second phase of implementation
included a pretest/posttest component with one lecture module on stress state variables.
The team collected pretests (n=157) and posttests (n = 163) and matched (n = 95) pretests
to posttests using the last four digits of the students’ phone numbers, as provided by
them. All other surveys either had no identifying number or there were no matches for the
number indicated on either the pretest or posttest. The faculty members were asked to
administer the pretest (Appendix A), teach the one lecture module on stress state
variables, and then give the posttest (Appendix B). The 9 questions on the pretest and
posttest were the same as in Phase 1. The mean score on the ninty-five matched pretests
was 4.69 (SD = 1.46) and was 4.82 (SD = 1.47) on the matched posttests. The mean score
on all pretests for Phase 2 of implementation was 4.50 (SD = 1.45) and 4.66 (SD = 1.49)
on all posttests.
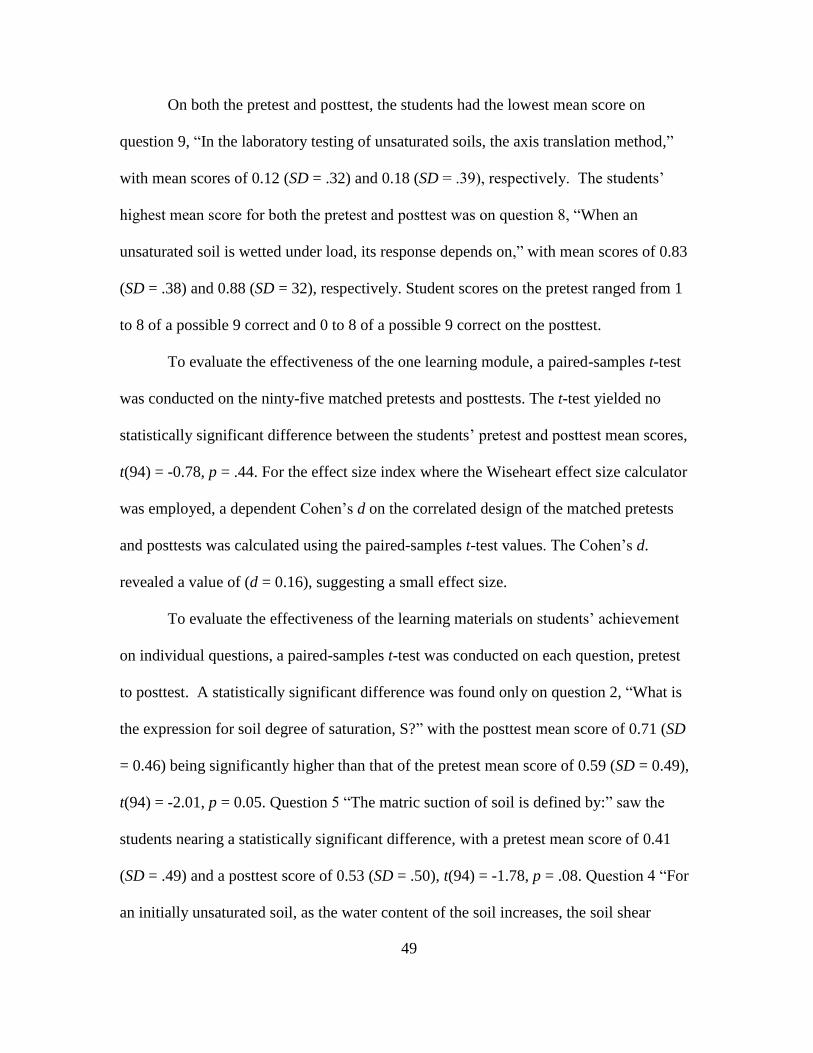
49
On both the pretest and posttest, the students had the lowest mean score on
question 9, “In the laboratory testing of unsaturated soils, the axis translation method,”
with mean scores of 0.12 (SD = .32) and 0.18 (SD = .39), respectively. The students’
highest mean score for both the pretest and posttest was on question 8, “When an
unsaturated soil is wetted under load, its response depends on,” with mean scores of 0.83
(SD = .38) and 0.88 (SD = 32), respectively. Student scores on the pretest ranged from 1
to 8 of a possible 9 correct and 0 to 8 of a possible 9 correct on the posttest.
To evaluate the effectiveness of the one learning module, a paired-samples t-test
was conducted on the ninty-five matched pretests and posttests. The t-test yielded no
statistically significant difference between the students’ pretest and posttest mean scores,
t(94) = -0.78, p = .44. For the effect size index where the Wiseheart effect size calculator
was employed, a dependent Cohen’s d on the correlated design of the matched pretests
and posttests was calculated using the paired-samples t-test values. The Cohen’s d.
revealed a value of (d = 0.16), suggesting a small effect size.
To evaluate the effectiveness of the learning materials on students’ achievement
on individual questions, a paired-samples t-test was conducted on each question, pretest
to posttest. A statistically significant difference was found only on question 2, “What is
the expression for soil degree of saturation, S?” with the posttest mean score of 0.71 (SD
= 0.46) being significantly higher than that of the pretest mean score of 0.59 (SD = 0.49),
t(94) = -2.01, p = 0.05. Question 5 “The matric suction of soil is defined by:” saw the
students nearing a statistically significant difference, with a pretest mean score of 0.41
(SD = .49) and a posttest score of 0.53 (SD = .50), t(94) = -1.78, p = .08. Question 4 “For
an initially unsaturated soil, as the water content of the soil increases, the soil shear
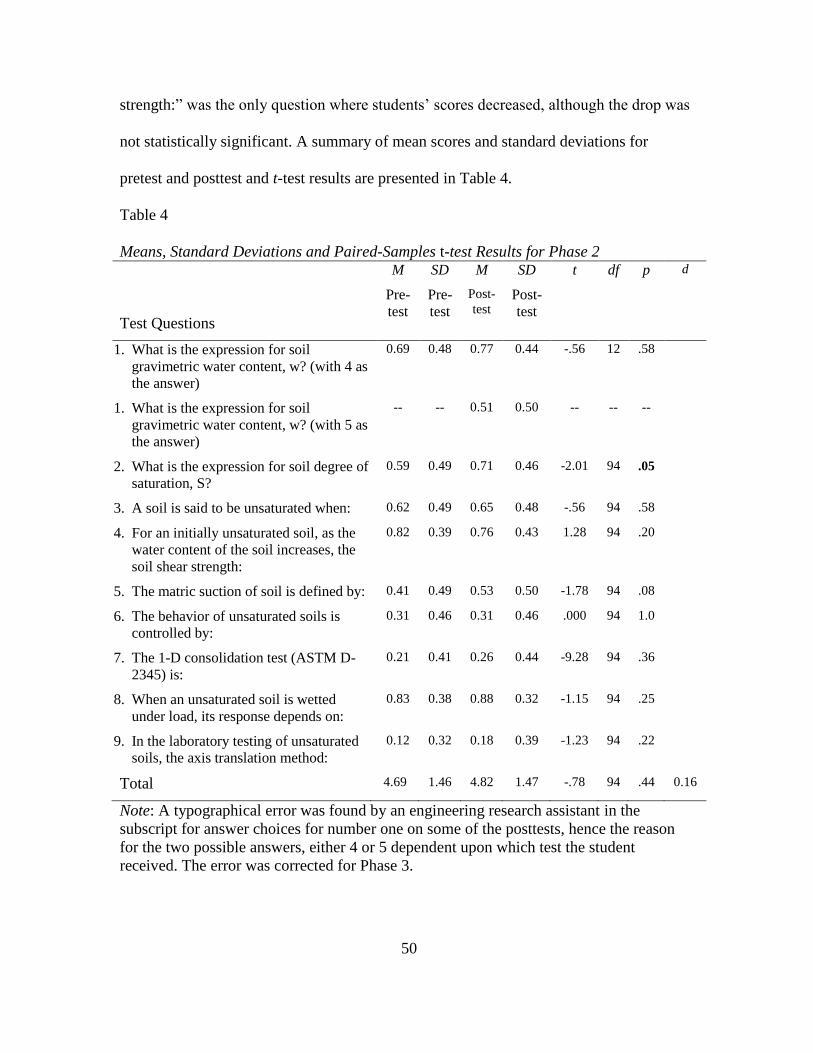
50
strength:” was the only question where students’ scores decreased, although the drop was
not statistically significant. A summary of mean scores and standard deviations for
pretest and posttest and t-test results are presented in Table 4.
Table 4
Means, Standard Deviations and Paired-Samples t-test Results for Phase 2
Test Questions
M
Pre-
test
SD
Pre-
test
M
Post-
test
SD
Post-
test
t df p d
1. What is the expression for soil
gravimetric water content, w? (with 4 as
the answer)
0.69 0.48 0.77 0.44 -.56 12 .58
1. What is the expression for soil
gravimetric water content, w? (with 5 as
the answer)
-- -- 0.51 0.50 -- -- --
2. What is the expression for soil degree of
saturation, S?
0.59 0.49 0.71 0.46 -2.01 94 .05
3. A soil is said to be unsaturated when: 0.62 0.49 0.65 0.48 -.56 94 .58
4. For an initially unsaturated soil, as the
water content of the soil increases, the
soil shear strength:
0.82 0.39 0.76 0.43 1.28 94 .20
5. The matric suction of soil is defined by: 0.41 0.49 0.53 0.50 -1.78 94 .08
6. The behavior of unsaturated soils is
controlled by:
0.31 0.46 0.31 0.46 .000 94 1.0
7. The 1-D consolidation test (ASTM D-
2345) is:
0.21 0.41 0.26 0.44 -9.28 94 .36
8. When an unsaturated soil is wetted
under load, its response depends on:
0.83 0.38 0.88 0.32 -1.15 94 .25
9. In the laboratory testing of unsaturated
soils, the axis translation method:
0.12 0.32 0.18 0.39 -1.23 94 .22
Total 4.69 1.46 4.82 1.47 -.78 94 .44 0.16
Note: A typographical error was found by an engineering research assistant in the
subscript for answer choices for number one on some of the posttests, hence the reason
for the two possible answers, either 4 or 5 dependent upon which test the student
received. The error was corrected for Phase 3.
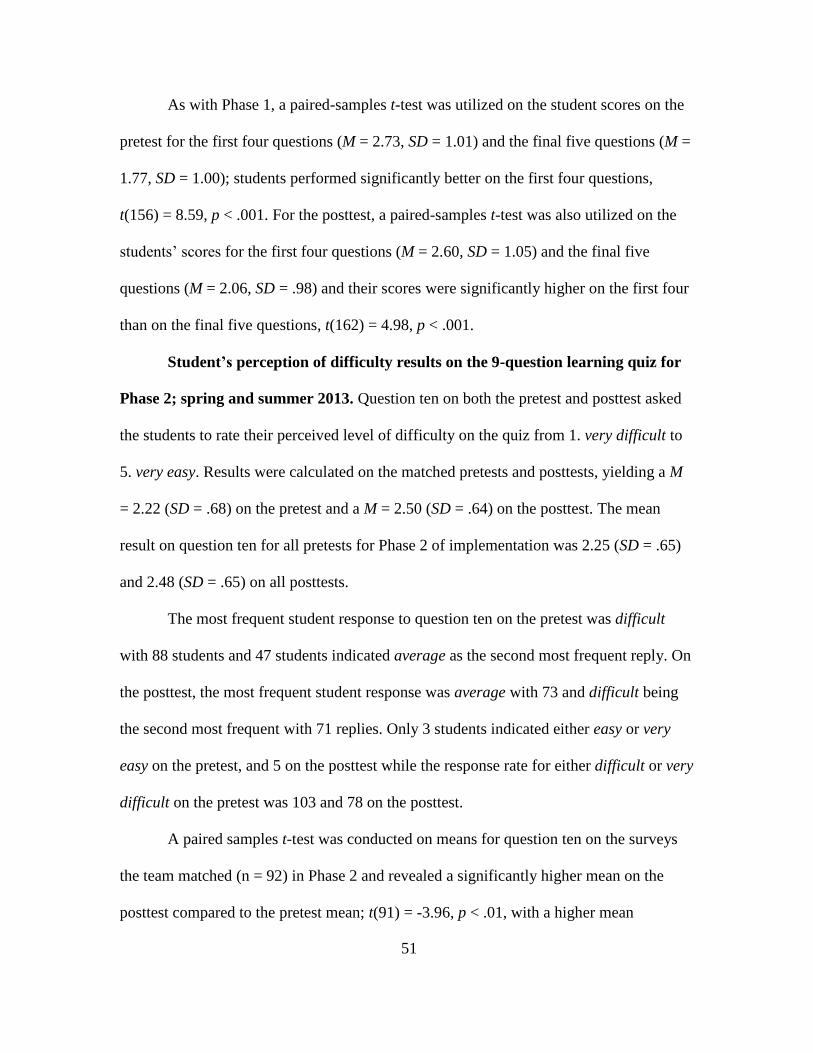
51
As with Phase 1, a paired-samples t-test was utilized on the student scores on the
pretest for the first four questions (M = 2.73, SD = 1.01) and the final five questions (M =
1.77, SD = 1.00); students performed significantly better on the first four questions,
t(156) = 8.59, p < .001. For the posttest, a paired-samples t-test was also utilized on the
students’ scores for the first four questions (M = 2.60, SD = 1.05) and the final five
questions (M = 2.06, SD = .98) and their scores were significantly higher on the first four
than on the final five questions, t(162) = 4.98, p < .001.
Student’s perception of difficulty results on the 9-question learning quiz for
Phase 2; spring and summer 2013. Question ten on both the pretest and posttest asked
the students to rate their perceived level of difficulty on the quiz from 1. very difficult to
5. very easy. Results were calculated on the matched pretests and posttests, yielding a M
= 2.22 (SD = .68) on the pretest and a M = 2.50 (SD = .64) on the posttest. The mean
result on question ten for all pretests for Phase 2 of implementation was 2.25 (SD = .65)
and 2.48 (SD = .65) on all posttests.
The most frequent student response to question ten on the pretest was difficult
with 88 students and 47 students indicated average as the second most frequent reply. On
the posttest, the most frequent student response was average with 73 and difficult being
the second most frequent with 71 replies. Only 3 students indicated either easy or very
easy on the pretest, and 5 on the posttest while the response rate for either difficult or very
difficult on the pretest was 103 and 78 on the posttest.
A paired samples t-test was conducted on means for question ten on the surveys
the team matched (n = 92) in Phase 2 and revealed a significantly higher mean on the
posttest compared to the pretest mean; t(91) = -3.96, p < .01, with a higher mean
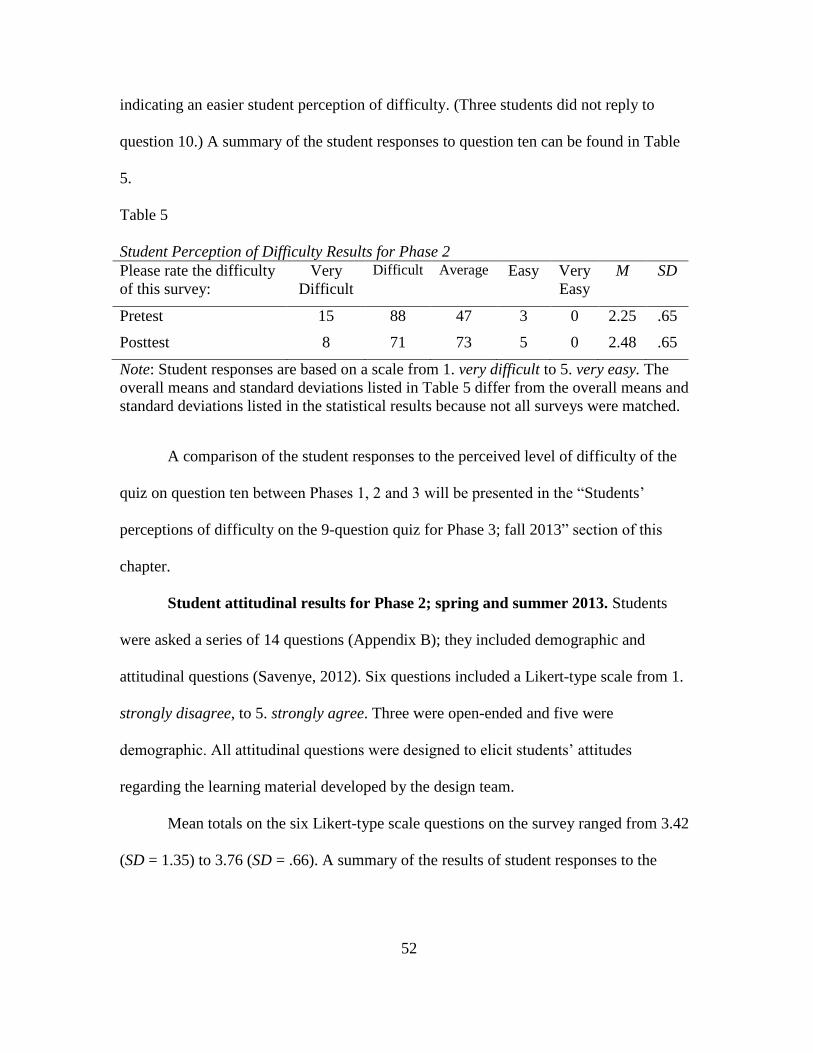
52
indicating an easier student perception of difficulty. (Three students did not reply to
question 10.) A summary of the student responses to question ten can be found in Table
5.
Table 5
Student Perception of Difficulty Results for Phase 2
Please rate the difficulty
of this survey:
Very
Difficult
Difficult Average Easy Very
Easy
M SD
Pretest 15 88 47 3 0 2.25 .65
Posttest 8 71 73 5 0 2.48 .65
Note: Student responses are based on a scale from 1. very difficult to 5. very easy. The
overall means and standard deviations listed in Table 5 differ from the overall means and
standard deviations listed in the statistical results because not all surveys were matched.
A comparison of the student responses to the perceived level of difficulty of the
quiz on question ten between Phases 1, 2 and 3 will be presented in the “Students’
perceptions of difficulty on the 9-question quiz for Phase 3; fall 2013” section of this
chapter.
Student attitudinal results for Phase 2; spring and summer 2013. Students
were asked a series of 14 questions (Appendix B); they included demographic and
attitudinal questions (Savenye, 2012). Six questions included a Likert-type scale from 1.
strongly disagree, to 5. strongly agree. Three were open-ended and five were
demographic. All attitudinal questions were designed to elicit students’ attitudes
regarding the learning material developed by the design team.
Mean totals on the six Likert-type scale questions on the survey ranged from 3.42
(SD = 1.35) to 3.76 (SD = .66). A summary of the results of student responses to the
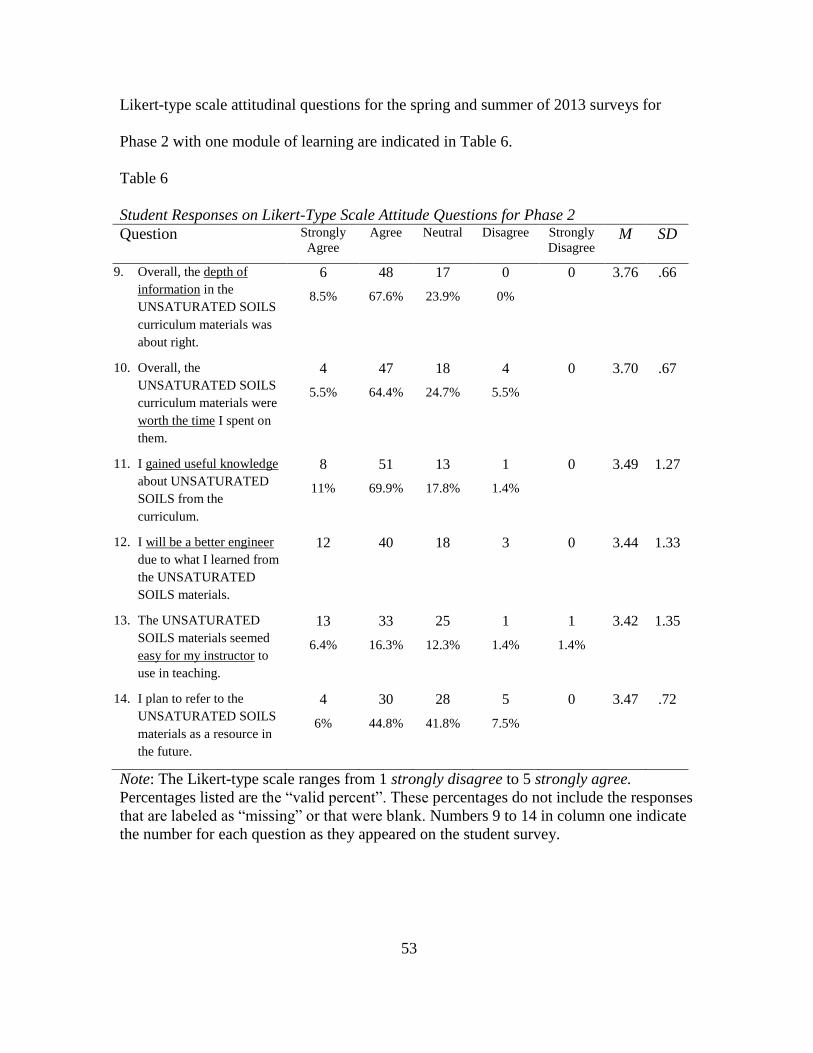
53
Likert-type scale attitudinal questions for the spring and summer of 2013 surveys for
Phase 2 with one module of learning are indicated in Table 6.
Table 6
Student Responses on Likert-Type Scale Attitude Questions for Phase 2
Question Strongly
Agree
Agree Neutral Disagree Strongly
Disagree M SD
9. Overall, the depth of
information in the
UNSATURATED SOILS
curriculum materials was
about right.
6
8.5%
48
67.6%
17
23.9%
0
0%
0
3.76 .66
10. Overall, the
UNSATURATED SOILS
curriculum materials were
worth the time I spent on
them.
4
5.5%
47
64.4%
18
24.7%
4
5.5%
0
3.70 .67
11. I gained useful knowledge
about UNSATURATED
SOILS from the
curriculum.
8
11%
51
69.9%
13
17.8%
1
1.4%
0
3.49 1.27
12. I will be a better engineer
due to what I learned from
the UNSATURATED
SOILS materials.
12 40 18 3 0 3.44 1.33
13. The UNSATURATED
SOILS materials seemed
easy for my instructor to
use in teaching.
13
6.4%
33
16.3%
25
12.3%
1
1.4%
1
1.4%
3.42 1.35
14. I plan to refer to the
UNSATURATED SOILS
materials as a resource in
the future.
4
6%
30
44.8%
28
41.8%
5
7.5%
0
3.47 .72
Note: The Likert-type scale ranges from 1 strongly disagree to 5 strongly agree.
Percentages listed are the “valid percent”. These percentages do not include the responses
that are labeled as “missing” or that were blank. Numbers 9 to 14 in column one indicate
the number for each question as they appeared on the student survey.
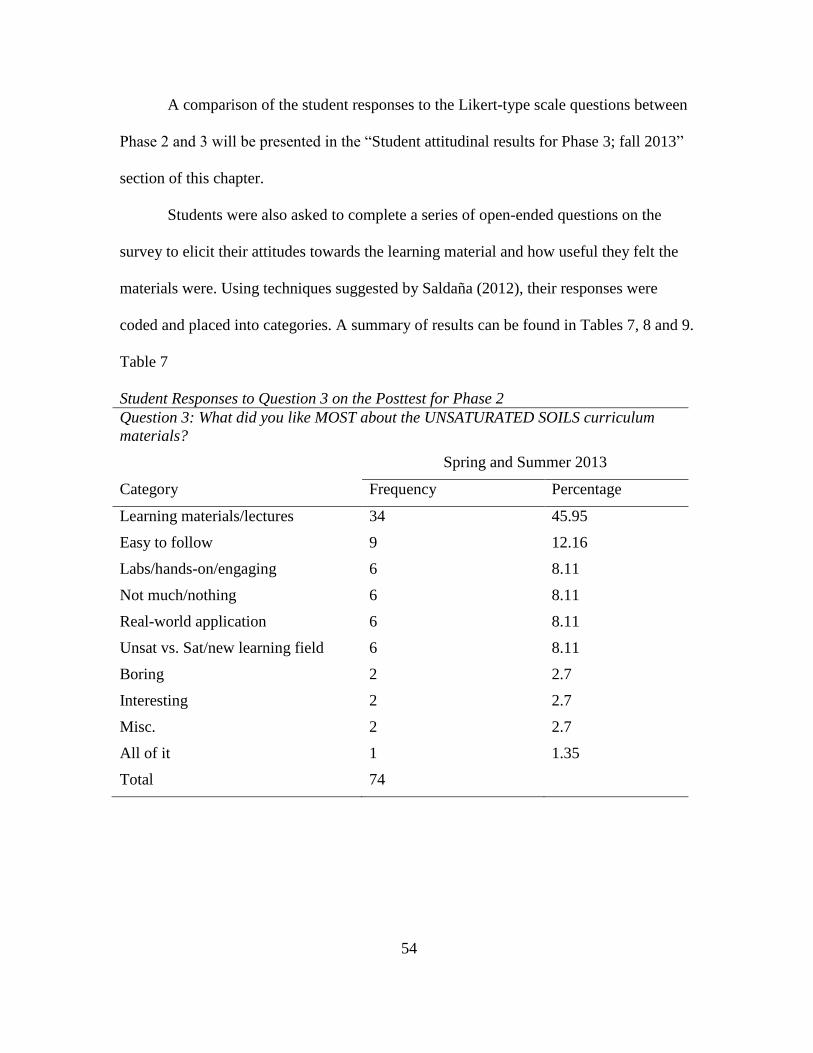
54
A comparison of the student responses to the Likert-type scale questions between
Phase 2 and 3 will be presented in the “Student attitudinal results for Phase 3; fall 2013”
section of this chapter.
Students were also asked to complete a series of open-ended questions on the
survey to elicit their attitudes towards the learning material and how useful they felt the
materials were. Using techniques suggested by Saldaña (2012), their responses were
coded and placed into categories. A summary of results can be found in Tables 7, 8 and 9.
Table 7
Student Responses to Question 3 on the Posttest for Phase 2
Question 3: What did you like MOST about the UNSATURATED SOILS curriculum
materials?
Spring and Summer 2013
Category Frequency Percentage
Learning materials/lectures 34 45.95
Easy to follow 9 12.16
Labs/hands-on/engaging 6 8.11
Not much/nothing 6 8.11
Real-world application 6 8.11
Unsat vs. Sat/new learning field 6 8.11
Boring 2 2.7
Interesting 2 2.7
Misc. 2 2.7
All of it 1 1.35
Total 74
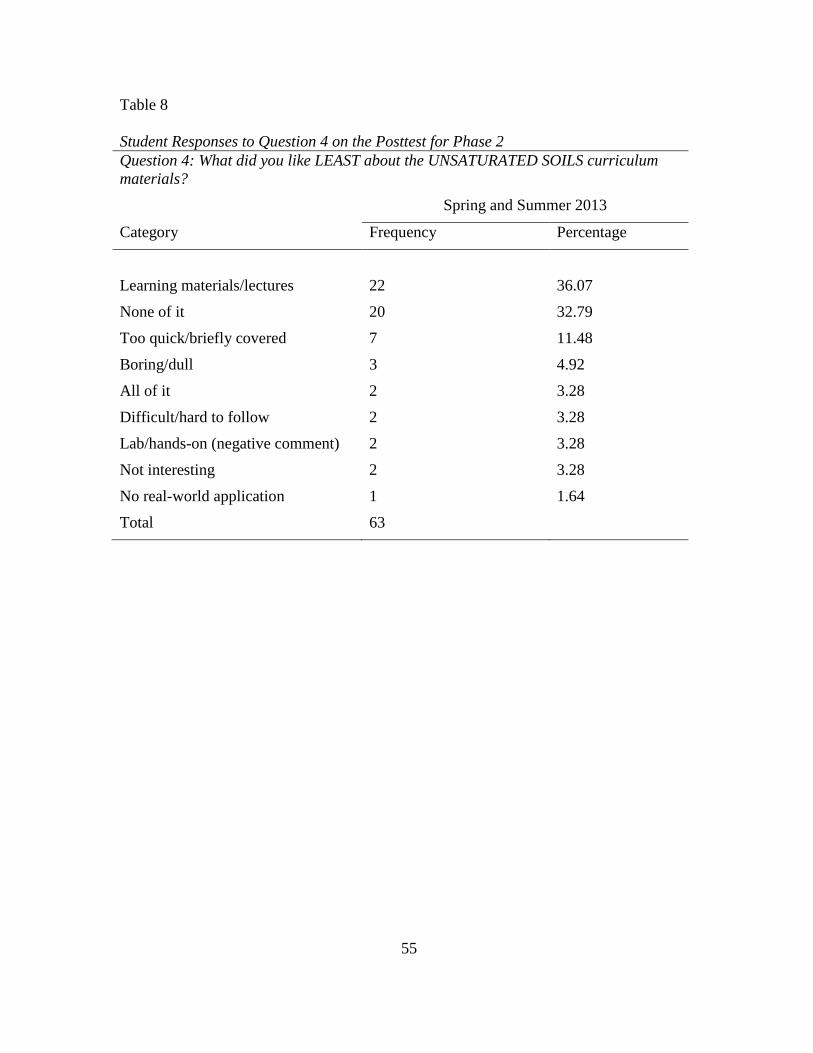
55
Table 8
Student Responses to Question 4 on the Posttest for Phase 2
Question 4: What did you like LEAST about the UNSATURATED SOILS curriculum
materials?
Spring and Summer 2013
Category Frequency Percentage
Learning materials/lectures 22 36.07
None of it 20 32.79
Too quick/briefly covered 7 11.48
Boring/dull 3 4.92
All of it 2 3.28
Difficult/hard to follow 2 3.28
Lab/hands-on (negative comment) 2 3.28
Not interesting 2 3.28
No real-world application 1 1.64
Total 63
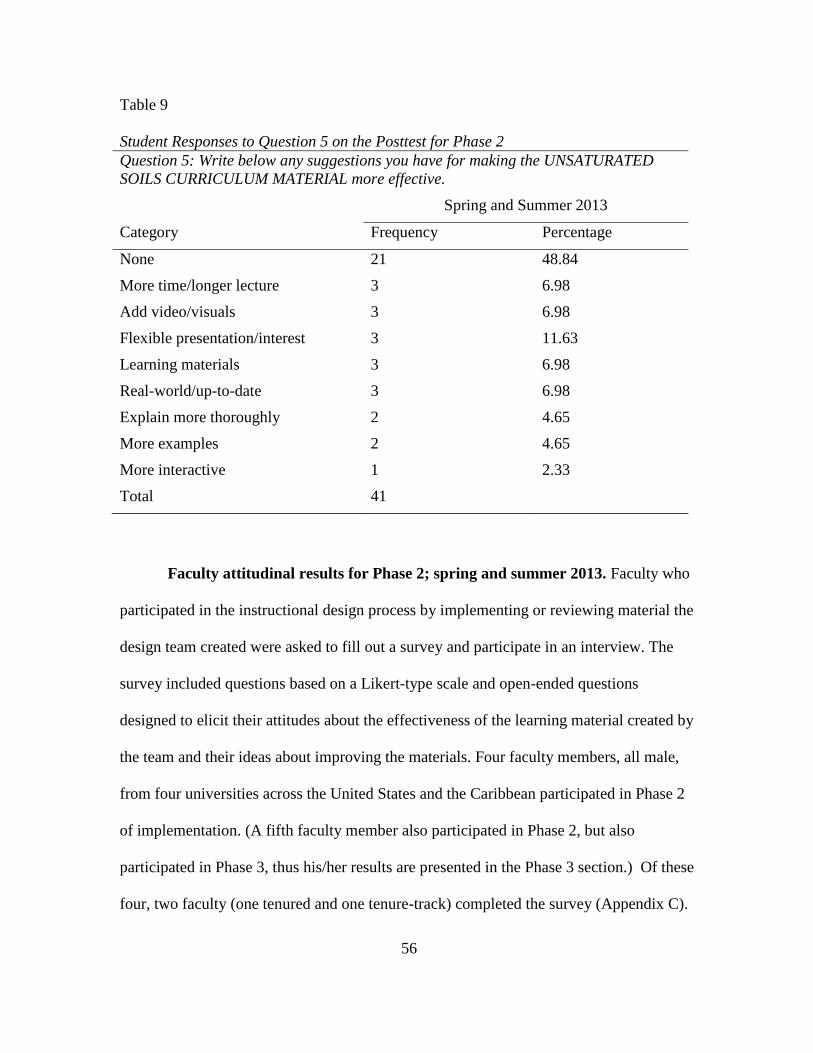
56
Table 9
Student Responses to Question 5 on the Posttest for Phase 2
Question 5: Write below any suggestions you have for making the UNSATURATED
SOILS CURRICULUM MATERIAL more effective.
Spring and Summer 2013
Category Frequency Percentage
None 21 48.84
More time/longer lecture 3 6.98
Add video/visuals 3 6.98
Flexible presentation/interest 3 11.63
Learning materials 3 6.98
Real-world/up-to-date 3 6.98
Explain more thoroughly 2 4.65
More examples 2 4.65
More interactive 1 2.33
Total 41
Faculty attitudinal results for Phase 2; spring and summer 2013. Faculty who
participated in the instructional design process by implementing or reviewing material the
design team created were asked to fill out a survey and participate in an interview. The
survey included questions based on a Likert-type scale and open-ended questions
designed to elicit their attitudes about the effectiveness of the learning material created by
the team and their ideas about improving the materials. Four faculty members, all male,
from four universities across the United States and the Caribbean participated in Phase 2
of implementation. (A fifth faculty member also participated in Phase 2, but also
participated in Phase 3, thus his/her results are presented in the Phase 3 section.) Of these
four, two faculty (one tenured and one tenure-track) completed the survey (Appendix C).
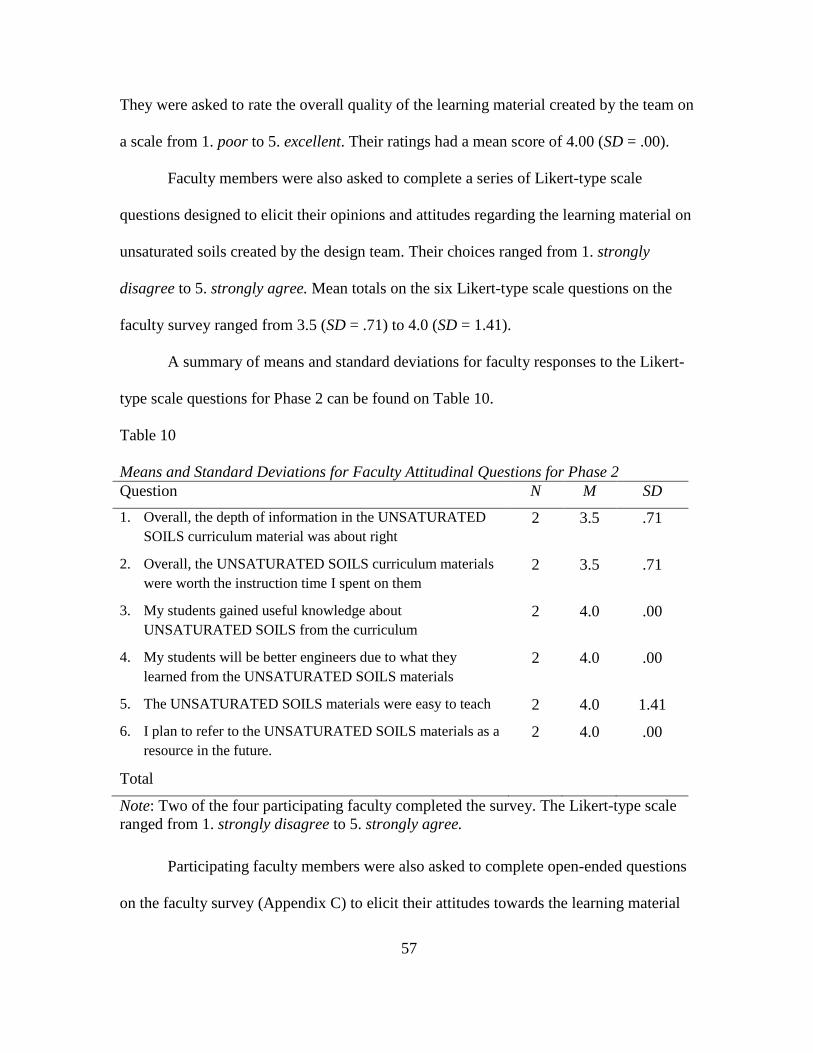
57
They were asked to rate the overall quality of the learning material created by the team on
a scale from 1. poor to 5. excellent. Their ratings had a mean score of 4.00 (SD = .00).
Faculty members were also asked to complete a series of Likert-type scale
questions designed to elicit their opinions and attitudes regarding the learning material on
unsaturated soils created by the design team. Their choices ranged from 1. strongly
disagree to 5. strongly agree. Mean totals on the six Likert-type scale questions on the
faculty survey ranged from 3.5 (SD = .71) to 4.0 (SD = 1.41).
A summary of means and standard deviations for faculty responses to the Likert-
type scale questions for Phase 2 can be found on Table 10.
Table 10
Means and Standard Deviations for Faculty Attitudinal Questions for Phase 2
Question N M SD
1. Overall, the depth of information in the UNSATURATED
SOILS curriculum material was about right
2 3.5 .71
2. Overall, the UNSATURATED SOILS curriculum materials
were worth the instruction time I spent on them
2 3.5 .71
3. My students gained useful knowledge about
UNSATURATED SOILS from the curriculum
2 4.0 .00
4. My students will be better engineers due to what they
learned from the UNSATURATED SOILS materials
2 4.0 .00
5. The UNSATURATED SOILS materials were easy to teach 2 4.0 1.41
6. I plan to refer to the UNSATURATED SOILS materials as a
resource in the future.
2 4.0 .00
Total
Note: Two of the four participating faculty completed the survey. The Likert-type scale
ranged from 1. strongly disagree to 5. strongly agree.
Participating faculty members were also asked to complete open-ended questions
on the faculty survey (Appendix C) to elicit their attitudes towards the learning material

58
and how useful they found it to be. With only two of the four Phase 2 faculty
participating in the survey, their responses were not categorized. Results can be found in
Table 11.
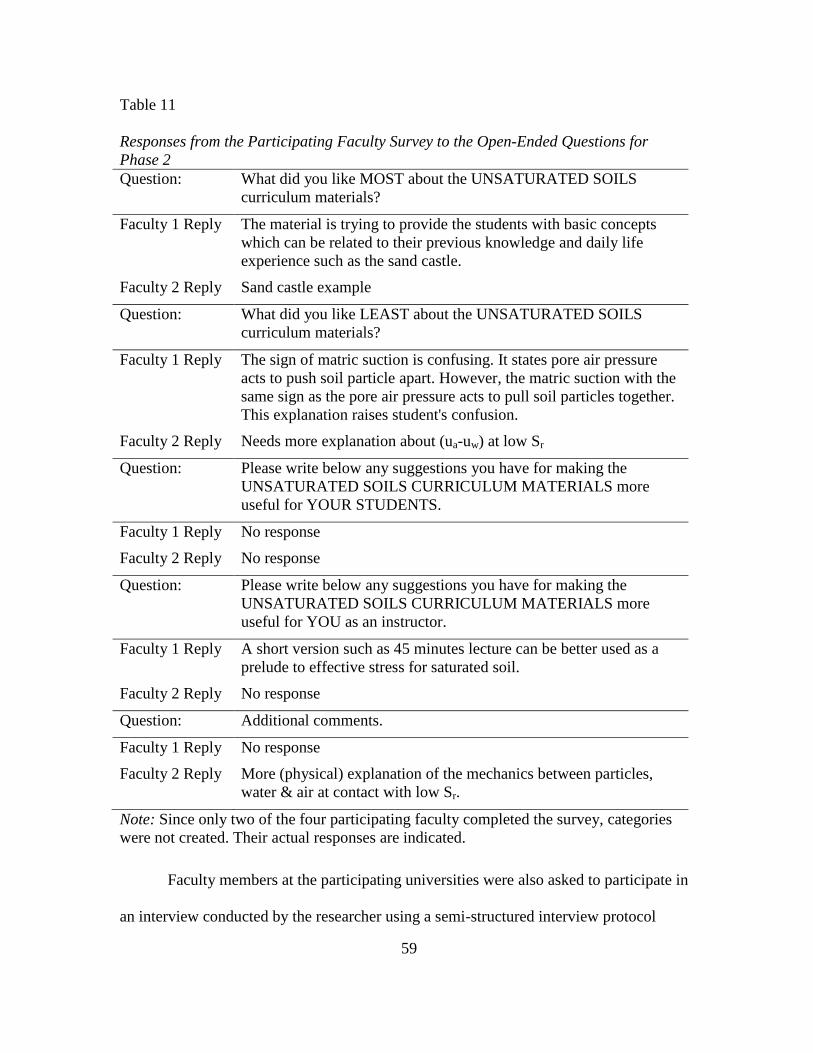
59
Table 11
Responses from the Participating Faculty Survey to the Open-Ended Questions for
Phase 2
Question: What did you like MOST about the UNSATURATED SOILS
curriculum materials?
Faculty 1 Reply The material is trying to provide the students with basic concepts
which can be related to their previous knowledge and daily life
experience such as the sand castle.
Faculty 2 Reply Sand castle example
Question: What did you like LEAST about the UNSATURATED SOILS
curriculum materials?
Faculty 1 Reply The sign of matric suction is confusing. It states pore air pressure
acts to push soil particle apart. However, the matric suction with the
same sign as the pore air pressure acts to pull soil particles together.
This explanation raises student's confusion.
Faculty 2 Reply Needs more explanation about (ua-uw) at low Sr
Question: Please write below any suggestions you have for making the
UNSATURATED SOILS CURRICULUM MATERIALS more
useful for YOUR STUDENTS.
Faculty 1 Reply No response
Faculty 2 Reply No response
Question: Please write below any suggestions you have for making the
UNSATURATED SOILS CURRICULUM MATERIALS more
useful for YOU as an instructor.
Faculty 1 Reply A short version such as 45 minutes lecture can be better used as a
prelude to effective stress for saturated soil.
Faculty 2 Reply No response
Question: Additional comments.
Faculty 1 Reply No response
Faculty 2 Reply More (physical) explanation of the mechanics between particles,
water & air at contact with low Sr.
Note: Since only two of the four participating faculty completed the survey, categories
were not created. Their actual responses are indicated.
Faculty members at the participating universities were also asked to participate in
an interview conducted by the researcher using a semi-structured interview protocol
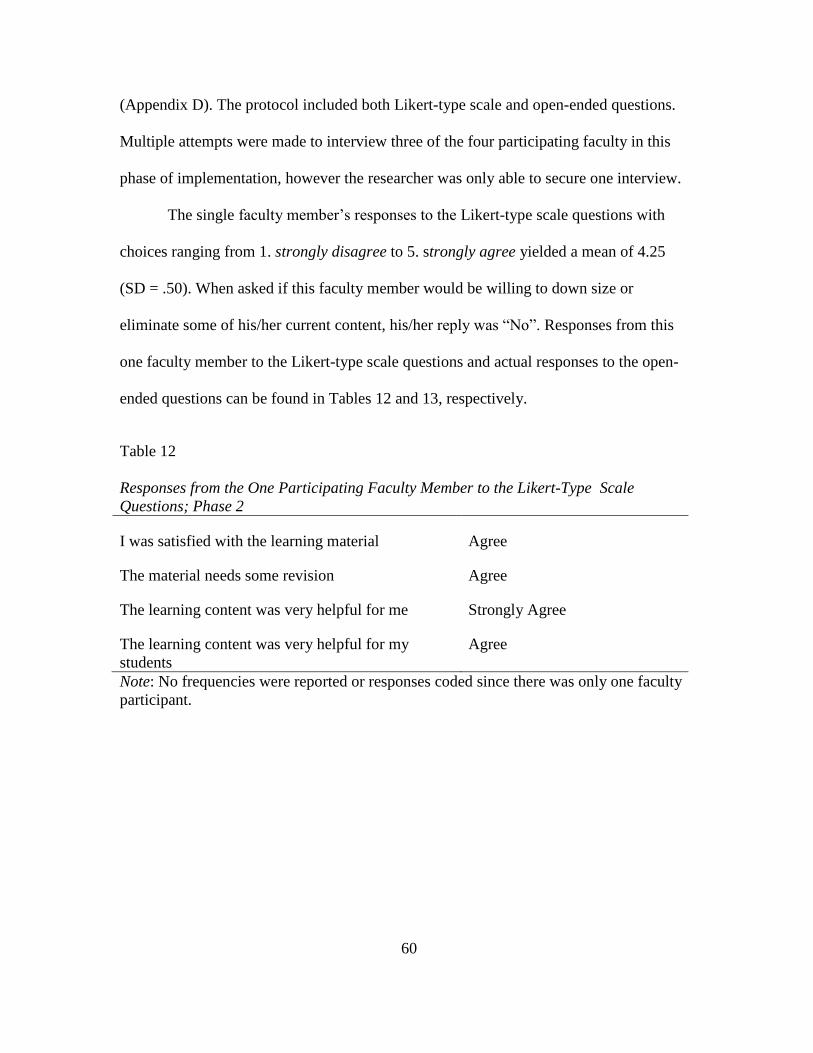
60
(Appendix D). The protocol included both Likert-type scale and open-ended questions.
Multiple attempts were made to interview three of the four participating faculty in this
phase of implementation, however the researcher was only able to secure one interview.
The single faculty member’s responses to the Likert-type scale questions with
choices ranging from 1. strongly disagree to 5. strongly agree yielded a mean of 4.25
(SD = .50). When asked if this faculty member would be willing to down size or
eliminate some of his/her current content, his/her reply was “No”. Responses from this
one faculty member to the Likert-type scale questions and actual responses to the open-
ended questions can be found in Tables 12 and 13, respectively.
Table 12
Responses from the One Participating Faculty Member to the Likert-Type Scale
Questions; Phase 2
I was satisfied with the learning material Agree
The material needs some revision Agree
The learning content was very helpful for me Strongly Agree
The learning content was very helpful for my
students
Agree
Note: No frequencies were reported or responses coded since there was only one faculty
participant.
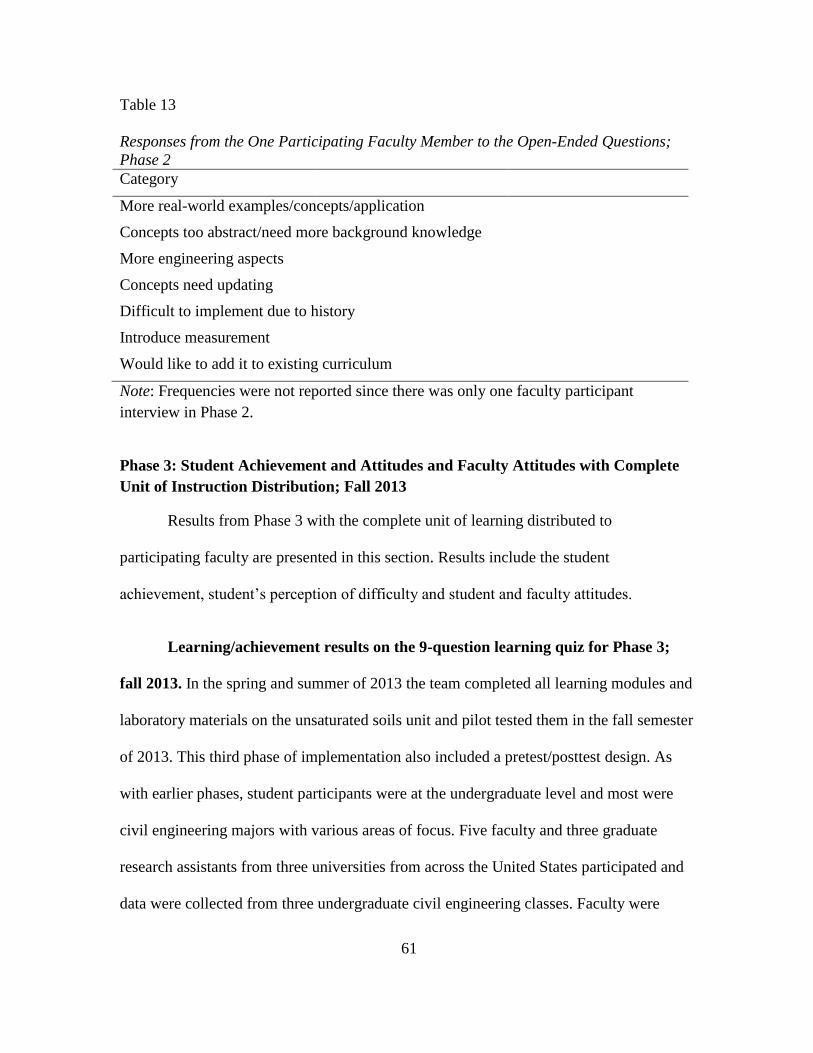
61
Table 13
Responses from the One Participating Faculty Member to the Open-Ended Questions;
Phase 2
Category
More real-world examples/concepts/application
Concepts too abstract/need more background knowledge
More engineering aspects
Concepts need updating
Difficult to implement due to history
Introduce measurement
Would like to add it to existing curriculum
Note: Frequencies were not reported since there was only one faculty participant
interview in Phase 2.
Phase 3: Student Achievement and Attitudes and Faculty Attitudes with Complete
Unit of Instruction Distribution; Fall 2013
Results from Phase 3 with the complete unit of learning distributed to
participating faculty are presented in this section. Results include the student
achievement, student’s perception of difficulty and student and faculty attitudes.
Learning/achievement results on the 9-question learning quiz for Phase 3;
fall 2013. In the spring and summer of 2013 the team completed all learning modules and
laboratory materials on the unsaturated soils unit and pilot tested them in the fall semester
of 2013. This third phase of implementation also included a pretest/posttest design. As
with earlier phases, student participants were at the undergraduate level and most were
civil engineering majors with various areas of focus. Five faculty and three graduate
research assistants from three universities from across the United States participated and
data were collected from three undergraduate civil engineering classes. Faculty were
62
given the opportunity to teach the entire unit, however not all students received the
complete unit of instruction. The team collected the pretest (n = 185) and posttest (n =
165) and matched 112 pretests to posttests using the last four digits of the students’ phone
numbers, as provided by them. All other surveys either had no identifying number or
there were no matches for the number indicated on either the pretest or posttest. (Two
students put their names. They were given an ID number by the researcher and then their
names were deleted from the documents.) The faculty members were asked to administer
the pretest, teach as much of the unit the team provided them as they chose, then give the
posttest. The nine questions on the pretest and posttest were the same as in Phases 1 and
2. The mean score on the matched pretests (n = 112) was 4.65 (SD = 1.31) and 6.03 (SD
= 1.76) on the posttests. The mean on all pretests for Phase 3 of implementation was 4.70
(SD = 1.37) and 5.93 (SD = 1.70) on all posttests.
On the pretests, the students had the lowest score on question 9, “In the laboratory
testing of unsaturated soils, the axis translation method,” of M = 0.14 (SD = .34) and
question 7 on the posttest, “The 1-D consolidation test (ASTM D-2345),” with a score of
M = 0.27 (SD = .44). The students’ highest mean score for both the pretest and posttest
was on question 8, “When an unsaturated soil is wetted under load, its response depends
on,” with a score of M = .86 (SD = .35) and M = .94 (SD = 24), respectively. Student
scores on the pretest ranged from 1 to 8 correct and 1 to 9 on the posttest with a possible
score of 9. As a particular point of interest, Phase 3 was the only phase that had no
students receiving a score of 0 and 5 students recording a perfect score of 9, with all 5
perfect scores on the posttest.
63
To evaluate the effectiveness of most or the entire learning unit, a paired-samples
t-test was conducted, resulting in a statistically significant difference between the student
pretest the posttest mean scores, t(111) = -8.82, p < .05. For the effect size index where
the Wiseheart effect size calculator was employed, a dependent Cohen’s d on the
correlated design of the matched pretests and posttests was calculated using the paired-
sampled t-test values The Cohen’s d revealed a value of (-1.67), suggesting a large effect
size.
To evaluate the effectiveness of most or the entire learning unit on individual
questions, a paired-samples t-test was conducted on each question for the matched (n =
112) pretests and posttests, individually. Statistically significant differences from pretest
to posttest were found on six of the nine questions.
As in Phase 2, a statistically significant difference was found in results on
question 2, “What is the expression for soil degree of saturation, S?” with the posttest
mean score of 0.73 (SD = 0.44) being significantly higher than that of the pretest score of
0.58 (SD = 0.50), t(111) = -3.29, p = .001. Statistically significant learning gains were
made by students on five other questions. Question 5, “The matric suction of soil is
defined by:” had the largest statistically significant learning gains from pretest (M = .41,
SD = 49) to posttest (M = .82, SD = 38), t(111) = -7.73, p < .001. Question 5 was also the
question on which students in Phase 2 scored near statistically significant learning gains.
Question 1, “What is the expression for soil gravimetric water content, w?” had the same
mean score on both the pretest and posttest, 8.84 (SD = 0.37). No questions in this phase
of implementation indicated decreases in scores.
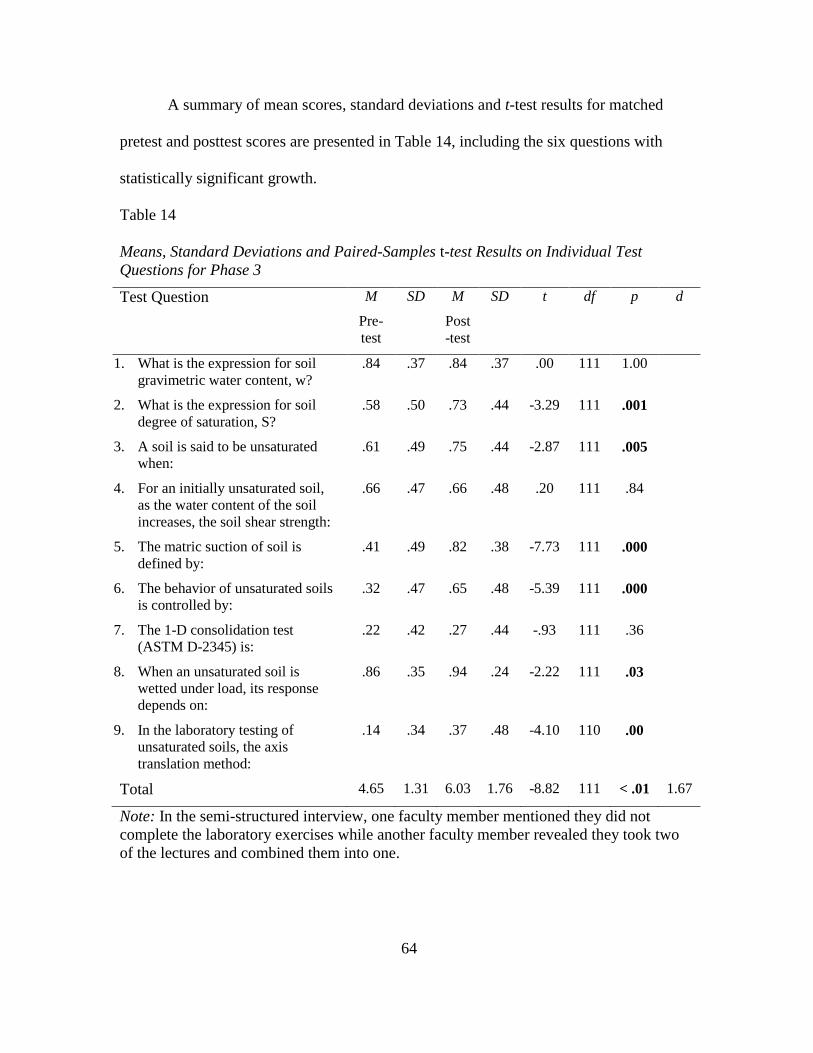
64
A summary of mean scores, standard deviations and t-test results for matched
pretest and posttest scores are presented in Table 14, including the six questions with
statistically significant growth.
Table 14
Means, Standard Deviations and Paired-Samples t-test Results on Individual Test
Questions for Phase 3
Test Question M
Pre-
test
SD M
Post
-test
SD t df p d
1. What is the expression for soil
gravimetric water content, w?
.84 .37 .84 .37 .00 111 1.00
2. What is the expression for soil
degree of saturation, S?
.58 .50 .73 .44 -3.29 111 .001
3. A soil is said to be unsaturated
when:
.61 .49 .75 .44 -2.87 111 .005
4. For an initially unsaturated soil,
as the water content of the soil
increases, the soil shear strength:
.66 .47 .66 .48 .20 111 .84
5. The matric suction of soil is
defined by:
.41 .49 .82 .38 -7.73 111 .000
6. The behavior of unsaturated soils
is controlled by:
.32 .47 .65 .48 -5.39 111 .000
7. The 1-D consolidation test
(ASTM D-2345) is:
.22 .42 .27 .44 -.93 111 .36
8. When an unsaturated soil is
wetted under load, its response
depends on:
.86 .35 .94 .24 -2.22 111 .03
9. In the laboratory testing of
unsaturated soils, the axis
translation method:
.14 .34 .37 .48 -4.10 110 .00
Total 4.65 1.31 6.03 1.76 -8.82 111 < .01 1.67
Note: In the semi-structured interview, one faculty member mentioned they did not
complete the laboratory exercises while another faculty member revealed they took two
of the lectures and combined them into one.
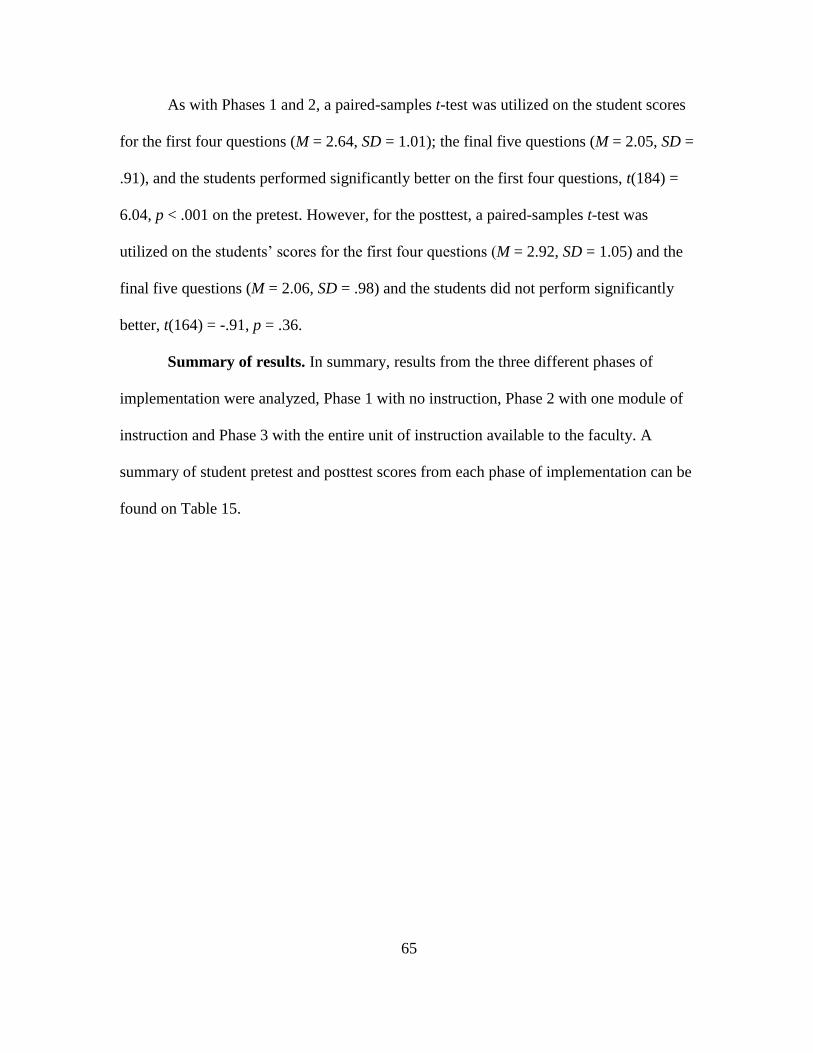
65
As with Phases 1 and 2, a paired-samples t-test was utilized on the student scores
for the first four questions (M = 2.64, SD = 1.01); the final five questions (M = 2.05, SD =
.91), and the students performed significantly better on the first four questions, t(184) =
6.04, p < .001 on the pretest. However, for the posttest, a paired-samples t-test was
utilized on the students’ scores for the first four questions (M = 2.92, SD = 1.05) and the
final five questions (M = 2.06, SD = .98) and the students did not perform significantly
better, t(164) = -.91, p = .36.
Summary of results. In summary, results from the three different phases of
implementation were analyzed, Phase 1 with no instruction, Phase 2 with one module of
instruction and Phase 3 with the entire unit of instruction available to the faculty. A
summary of student pretest and posttest scores from each phase of implementation can be
found on Table 15.
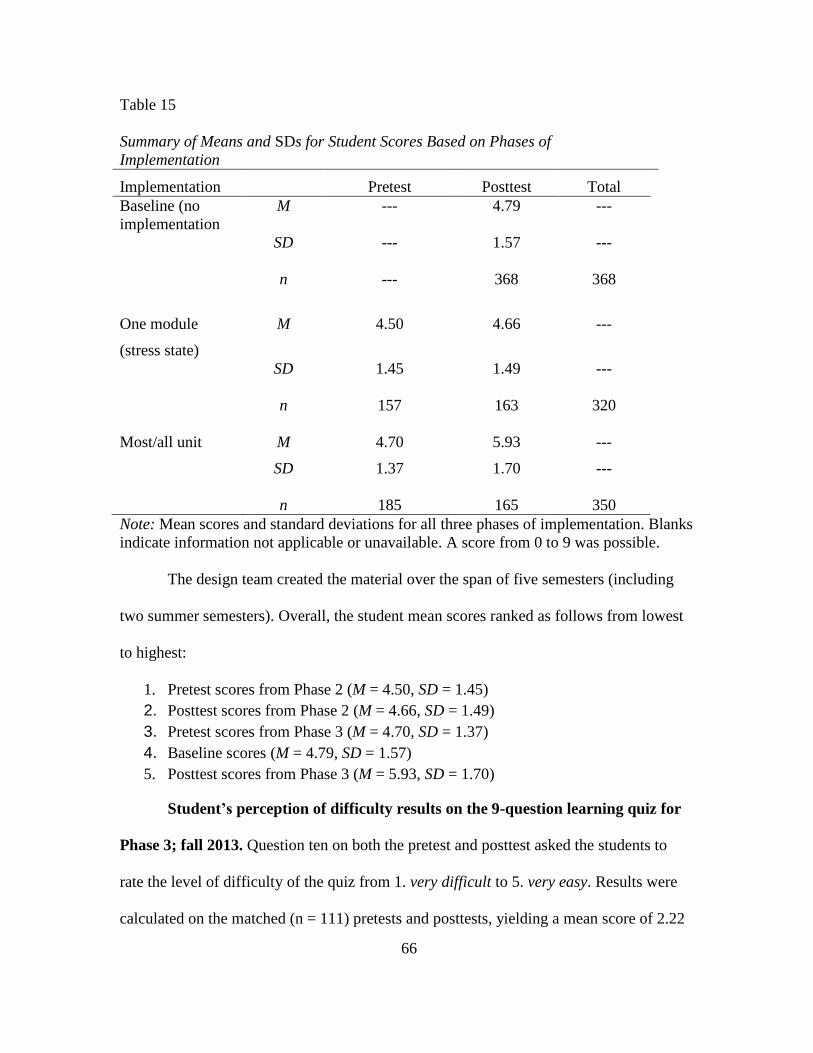
66
Table 15
Summary of Means and SDs for Student Scores Based on Phases of
Implementation
Implementation Pretest Posttest Total
Baseline (no
implementation
M --- 4.79 ---
SD --- 1.57 ---
n --- 368 368
One module
(stress state)
M 4.50 4.66 ---
SD 1.45 1.49 ---
n 157 163 320
Most/all unit M 4.70 5.93 ---
SD 1.37 1.70 ---
n 185 165 350
Note: Mean scores and standard deviations for all three phases of implementation. Blanks
indicate information not applicable or unavailable. A score from 0 to 9 was possible.
The design team created the material over the span of five semesters (including
two summer semesters). Overall, the student mean scores ranked as follows from lowest
to highest:
1. Pretest scores from Phase 2 (M = 4.50, SD = 1.45)
2. Posttest scores from Phase 2 (M = 4.66, SD = 1.49)
3. Pretest scores from Phase 3 (M = 4.70, SD = 1.37)
4. Baseline scores (M = 4.79, SD = 1.57)
5. Posttest scores from Phase 3 (M = 5.93, SD = 1.70)
Student’s perception of difficulty results on the 9-question learning quiz for
Phase 3; fall 2013. Question ten on both the pretest and posttest asked the students to
rate the level of difficulty of the quiz from 1. very difficult to 5. very easy. Results were
calculated on the matched (n = 111) pretests and posttests, yielding a mean score of 2.22
67
(SD = .64) on the pretest and a mean score of 2.71 (SD = .59) on the posttest. (One of the
matched tests had no reply to question ten.) The mean score on question ten for all
pretests for Phase 3 of implementation was 2.22 (SD = .69) and 2.69 (SD = .64) on all
posttests.
The most frequent student response on the pretest was difficult with 108 students
and 51 students indicating average was the second most frequent reply. On the posttest,
the most frequent student response was average with 96 and difficult being the second
most frequent reply with 56. Only 4 students indicated either easy or very easy on the
pretest and 9 on the posttest while the response totals for either difficult or very difficult
on the pretest were 128 and 59 on the posttest. A summary of the students’ responses to
question 10 can be found in Table 16.
Table 16
Student Response Rates to Question 10 in Phase 3
Please rate the
difficulty of this
survey:
Very
Difficult
Difficult Average Easy Very
Easy
M SD
Pretest 20 108 51 2 2 2.22 .69
Posttest 3 56 96 7 2 2.69 .64
Note: Student responses are based on a scale from 1 very difficult to 5 very easy. The
overall means and standard deviations listed in Table 16 differ from the overall means
and standard deviations listed in the statistical results because not all surveys were
matched.
To determine the extent to which the students’ perceptions of difficulty changed
from pretest to posttest, a paired samples t-test on question 10 was conducted on Phase 2
and Phase 3 of implementation. (No statistical test was conducted on Phase 1 since there
were no means of comparison as this group of students only completed a baseline test
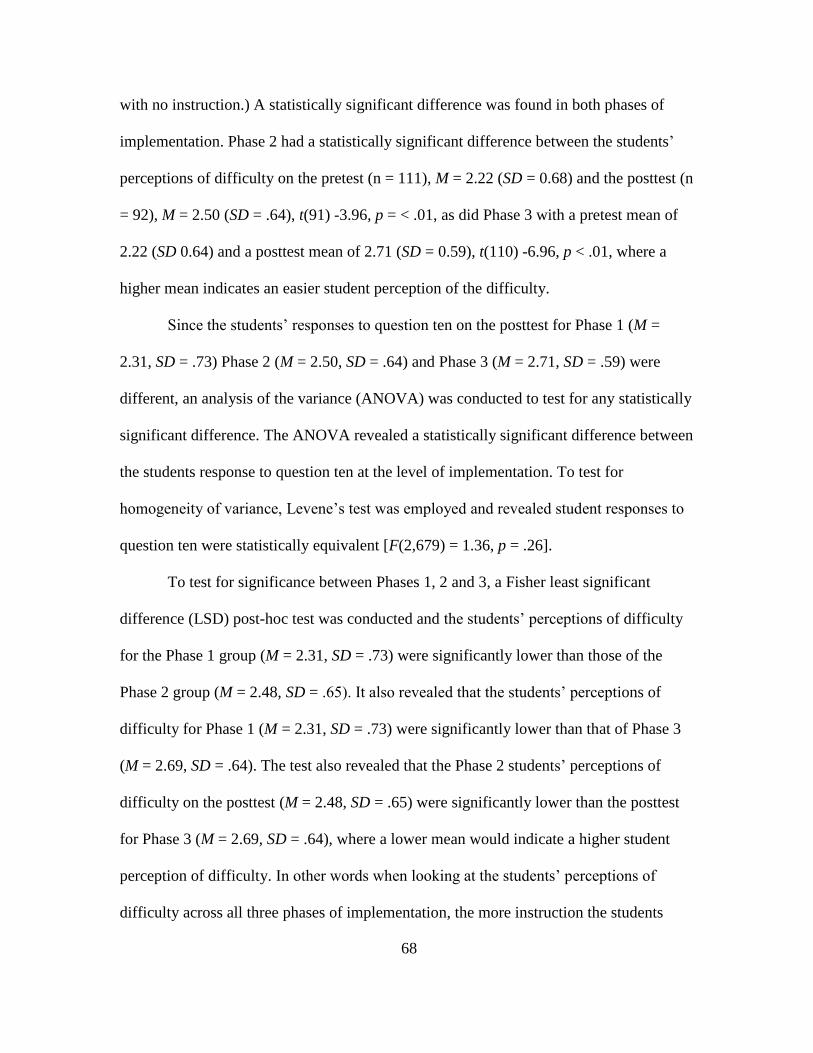
68
with no instruction.) A statistically significant difference was found in both phases of
implementation. Phase 2 had a statistically significant difference between the students’
perceptions of difficulty on the pretest (n = 111), M = 2.22 (SD = 0.68) and the posttest (n
= 92), M = 2.50 (SD = .64), t(91) -3.96, p = < .01, as did Phase 3 with a pretest mean of
2.22 (SD 0.64) and a posttest mean of 2.71 (SD = 0.59), t(110) -6.96, p < .01, where a
higher mean indicates an easier student perception of the difficulty.
Since the students’ responses to question ten on the posttest for Phase 1 (M =
2.31, SD = .73) Phase 2 (M = 2.50, SD = .64) and Phase 3 (M = 2.71, SD = .59) were
different, an analysis of the variance (ANOVA) was conducted to test for any statistically
significant difference. The ANOVA revealed a statistically significant difference between
the students response to question ten at the level of implementation. To test for
homogeneity of variance, Levene’s test was employed and revealed student responses to
question ten were statistically equivalent [F(2,679) = 1.36, p = .26].
To test for significance between Phases 1, 2 and 3, a Fisher least significant
difference (LSD) post-hoc test was conducted and the students’ perceptions of difficulty
for the Phase 1 group (M = 2.31, SD = .73) were significantly lower than those of the
Phase 2 group (M = 2.48, SD = .65). It also revealed that the students’ perceptions of
difficulty for Phase 1 (M = 2.31, SD = .73) were significantly lower than that of Phase 3
(M = 2.69, SD = .64). The test also revealed that the Phase 2 students’ perceptions of
difficulty on the posttest (M = 2.48, SD = .65) were significantly lower than the posttest
for Phase 3 (M = 2.69, SD = .64), where a lower mean would indicate a higher student
perception of difficulty. In other words when looking at the students’ perceptions of
difficulty across all three phases of implementation, the more instruction the students
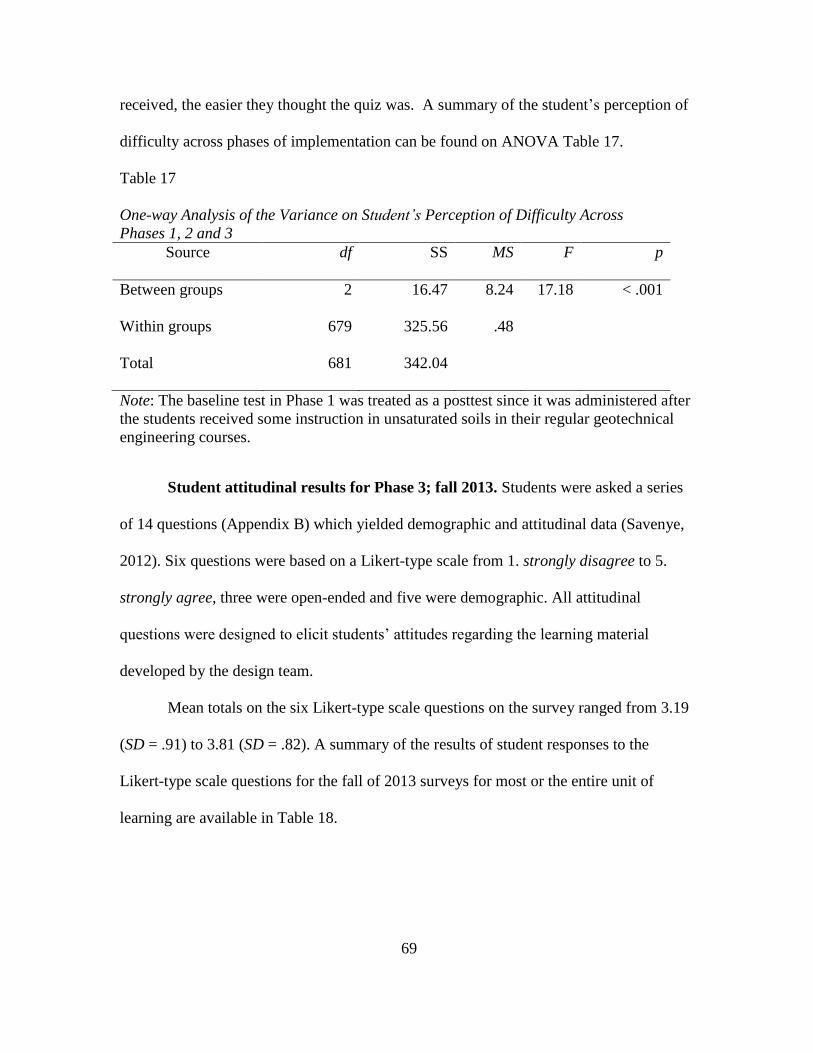
69
received, the easier they thought the quiz was. A summary of the student’s perception of
difficulty across phases of implementation can be found on ANOVA Table 17.
Table 17
One-way Analysis of the Variance on Student’s Perception of Difficulty Across
Phases 1, 2 and 3
Source df SS MS F p
Between groups 2 16.47 8.24 17.18 < .001
Within groups 679 325.56 .48
Total 681 342.04
Note: The baseline test in Phase 1 was treated as a posttest since it was administered after
the students received some instruction in unsaturated soils in their regular geotechnical
engineering courses.
Student attitudinal results for Phase 3; fall 2013. Students were asked a series
of 14 questions (Appendix B) which yielded demographic and attitudinal data (Savenye,
2012). Six questions were based on a Likert-type scale from 1. strongly disagree to 5.
strongly agree, three were open-ended and five were demographic. All attitudinal
questions were designed to elicit students’ attitudes regarding the learning material
developed by the design team.
Mean totals on the six Likert-type scale questions on the survey ranged from 3.19
(SD = .91) to 3.81 (SD = .82). A summary of the results of student responses to the
Likert-type scale questions for the fall of 2013 surveys for most or the entire unit of
learning are available in Table 18.
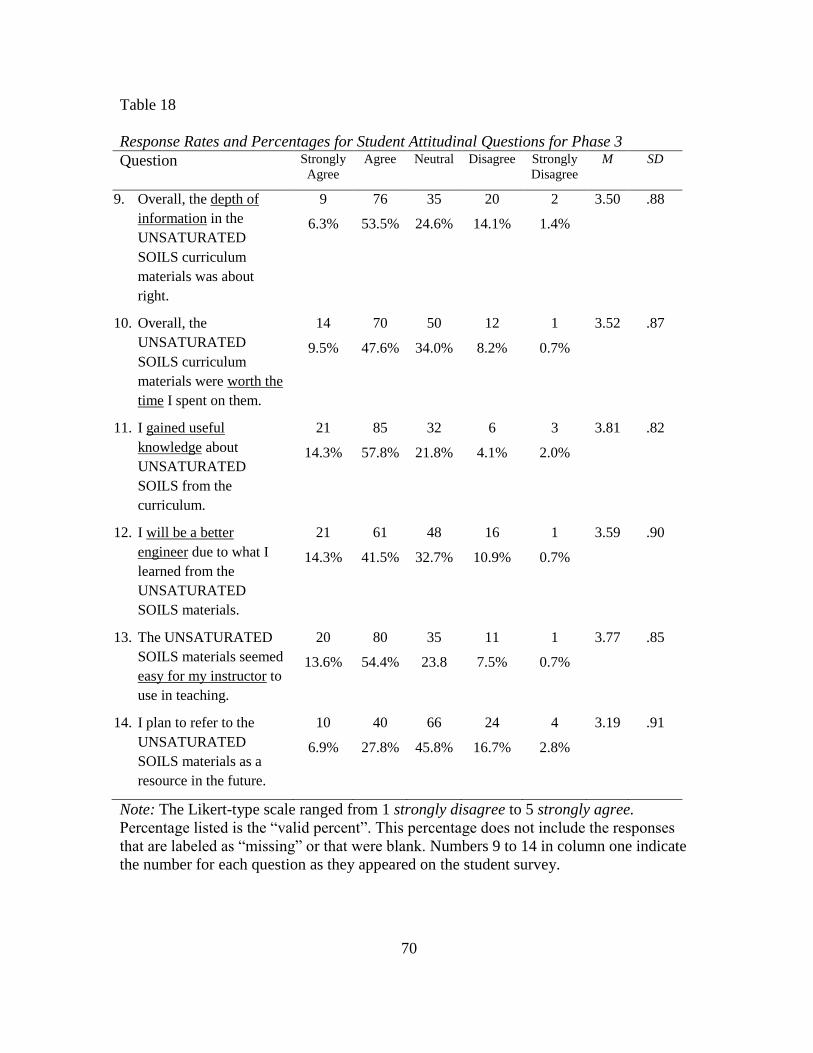
70
Table 18
Response Rates and Percentages for Student Attitudinal Questions for Phase 3
Question Strongly
Agree
Agree Neutral Disagree Strongly
Disagree
M SD
9. Overall, the depth of
information in the
UNSATURATED
SOILS curriculum
materials was about
right.
9
6.3%
76
53.5%
35
24.6%
20
14.1%
2
1.4%
3.50 .88
10. Overall, the
UNSATURATED
SOILS curriculum
materials were worth the
time I spent on them.
14
9.5%
70
47.6%
50
34.0%
12
8.2%
1
0.7%
3.52 .87
11. I gained useful
knowledge about
UNSATURATED
SOILS from the
curriculum.
21
14.3%
85
57.8%
32
21.8%
6
4.1%
3
2.0%
3.81 .82
12. I will be a better
engineer due to what I
learned from the
UNSATURATED
SOILS materials.
21
14.3%
61
41.5%
48
32.7%
16
10.9%
1
0.7%
3.59 .90
13. The UNSATURATED
SOILS materials seemed
easy for my instructor to
use in teaching.
20
13.6%
80
54.4%
35
23.8
11
7.5%
1
0.7%
3.77 .85
14. I plan to refer to the
UNSATURATED
SOILS materials as a
resource in the future.
10
6.9%
40
27.8%
66
45.8%
24
16.7%
4
2.8%
3.19 .91
Note: The Likert-type scale ranged from 1 strongly disagree to 5 strongly agree.
Percentage listed is the “valid percent”. This percentage does not include the responses
that are labeled as “missing” or that were blank. Numbers 9 to 14 in column one indicate
the number for each question as they appeared on the student survey.
71
To test for homogeneity of variance, Levene’s test was employed and revealed
student responses to question 14, [F(1,225) = 1.80, p = .26] were statistically equivalent
but student responses to question 9, [F(1,228) = 16.37, p < .001] , were not statistically
significant. Since the homogeneity of the variance assumption was not met with this part
of the data, a Welch ANOVA F-test was conducted on results on each of the five Likert-
type scale questions the students responded to on the attitudinal posttest questions for
Phases 2 and 3, revealing a statistically significant difference on two of the questions.
Students’ responses to the question, “9. Overall, the depth of information in the
UNSATURATED SOILS curriculum materials was about right” were significantly
higher on Phase 2 (M = 3.76, SD = .66) than Phase 3 (M = 3.50, SD = .88). Students’
responses to the question, “14. I plan to refer to the UNSATURATED SOILS materials
as a resource in the future,” were also significantly higher in the Phase 2 group (M =
3.47, SD = .72) than Phase 3 (M = 3.19, SD = .91), indicating that on both questions, the
students had a significantly higher level of agreement in Phase 2 than students in Phase 3.
The students were also asked to complete three open-ended questions on the
posttest to elicit their attitudes towards the learning material and how useful they felt it
was. Using techniques suggested by Saldaña (2012), their responses were coded and
placed into categories. A summary of results by question can be found in Tables 19, 20
and 21.
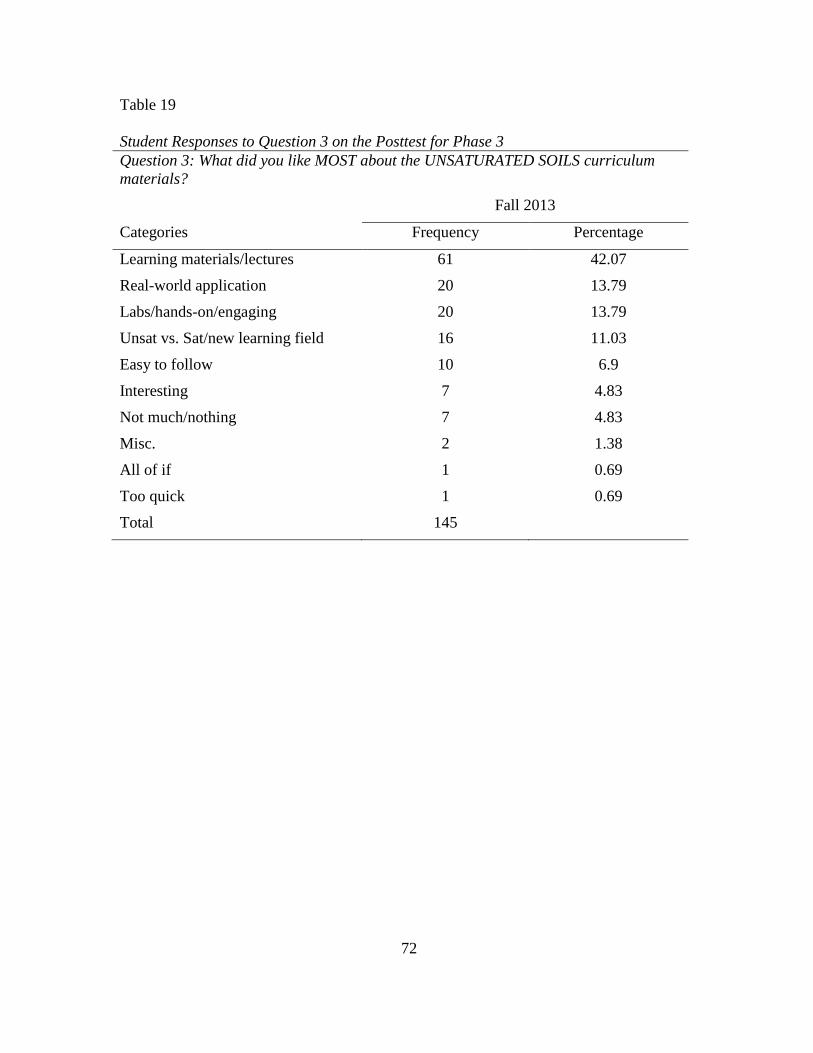
72
Table 19
Student Responses to Question 3 on the Posttest for Phase 3
Question 3: What did you like MOST about the UNSATURATED SOILS curriculum
materials?
Fall 2013
Categories Frequency Percentage
Learning materials/lectures 61 42.07
Real-world application 20 13.79
Labs/hands-on/engaging 20 13.79
Unsat vs. Sat/new learning field 16 11.03
Easy to follow 10 6.9
Interesting 7 4.83
Not much/nothing 7 4.83
Misc. 2 1.38
All of if 1 0.69
Too quick 1 0.69
Total 145
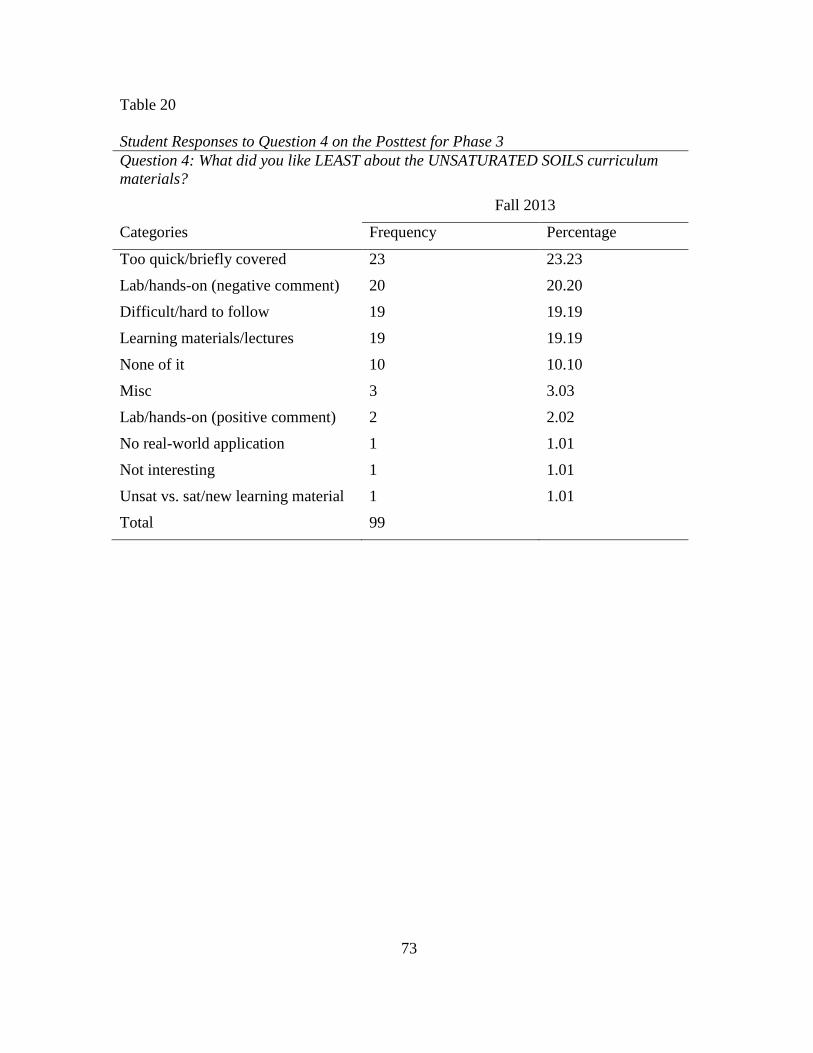
73
Table 20
Student Responses to Question 4 on the Posttest for Phase 3
Question 4: What did you like LEAST about the UNSATURATED SOILS curriculum
materials?
Fall 2013
Categories Frequency Percentage
Too quick/briefly covered 23 23.23
Lab/hands-on (negative comment) 20 20.20
Difficult/hard to follow 19 19.19
Learning materials/lectures 19 19.19
None of it 10 10.10
Misc 3 3.03
Lab/hands-on (positive comment) 2 2.02
No real-world application 1 1.01
Not interesting 1 1.01
Unsat vs. sat/new learning material 1 1.01
Total 99
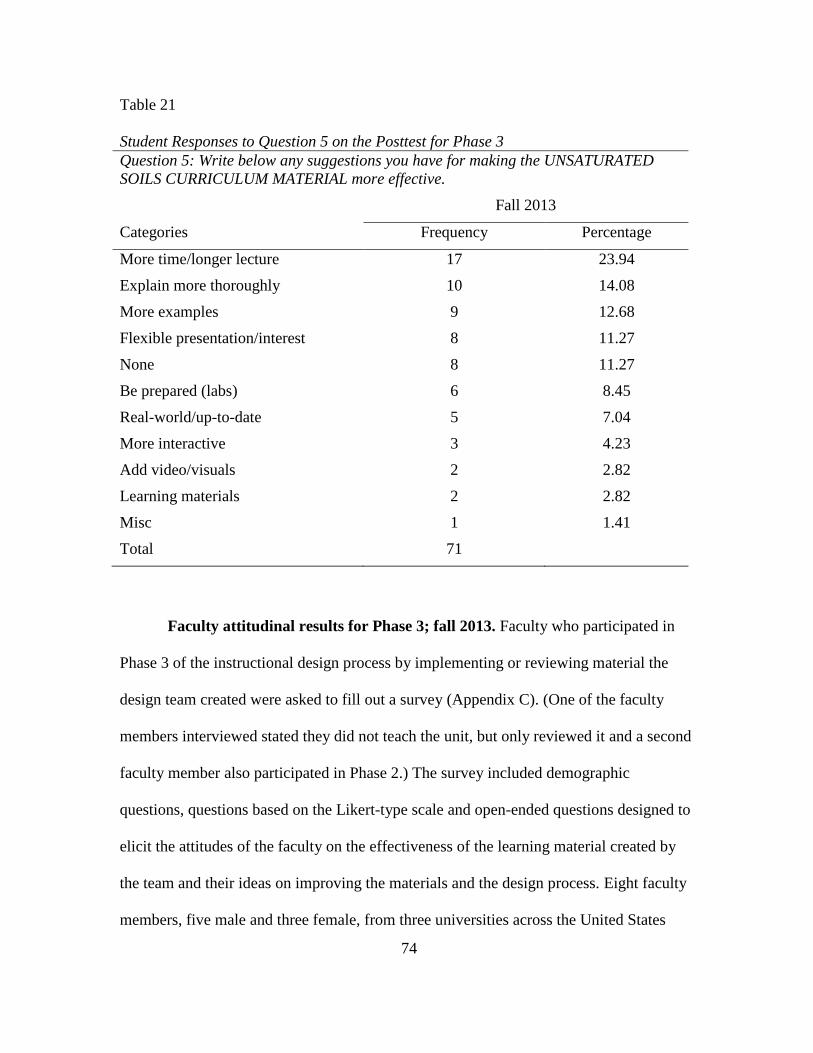
74
Table 21
Student Responses to Question 5 on the Posttest for Phase 3
Question 5: Write below any suggestions you have for making the UNSATURATED
SOILS CURRICULUM MATERIAL more effective.
Fall 2013
Categories Frequency Percentage
More time/longer lecture 17 23.94
Explain more thoroughly 10 14.08
More examples 9 12.68
Flexible presentation/interest 8 11.27
None 8 11.27
Be prepared (labs) 6 8.45
Real-world/up-to-date 5 7.04
More interactive 3 4.23
Add video/visuals 2 2.82
Learning materials 2 2.82
Misc 1 1.41
Total 71
Faculty attitudinal results for Phase 3; fall 2013. Faculty who participated in
Phase 3 of the instructional design process by implementing or reviewing material the
design team created were asked to fill out a survey (Appendix C). (One of the faculty
members interviewed stated they did not teach the unit, but only reviewed it and a second
faculty member also participated in Phase 2.) The survey included demographic
questions, questions based on the Likert-type scale and open-ended questions designed to
elicit the attitudes of the faculty on the effectiveness of the learning material created by
the team and their ideas on improving the materials and the design process. Eight faculty
members, five male and three female, from three universities across the United States
75
participated in Phase 3 of implementation. The standing of the faculty were as follows:
three tenured; one untenured-tenure-track; one non-tenure-track; and three research
assistants. Two were also members of the design team. Of the eight faculty, seven
completed part or all of the survey. They were asked to rate the overall quality of the
learning material created by the team on a scale from 1. poor to 5. excellent. The faculty
(n = 6) rating had a mean score of 4.00 (SD = .63). Two participants did not answer this
question.
As part of the faculty survey, the faculty members were asked to complete a
series of Likert-type scale questions designed to elicit their opinions and attitudes
regarding the learning material on unsaturated soils created by the design team. The scale
included choices from 1. strongly disagree, to 5. strongly agree. Mean totals on the six
Likert-type scale questions on the faculty survey ranged from 3.20 (SD = 1.30) to 4.40
(SD = .55).
The question, “Overall, the UNSATURATED SOILS curriculum materials were
worth the instruction time I spent on them” had the highest mean of 4.33 (SD = 1.52)
Three questions had the lowest mean; “Overall, the depth of information in the
UNSATURATED SOILS curriculum material was about right” (M = 3.50, SD = 1.25)
and “My students will be better engineers due to what they learned from the
UNSATURATED SOILS materials” and “The UNSATURATED SOILS materials were
easy to teach” both had a mean score of 3.50 (SD = 1.38). A summary of means and
standard deviations for faculty responses to the Likert-type scale questions for Phase 3
can be found on Table 22.
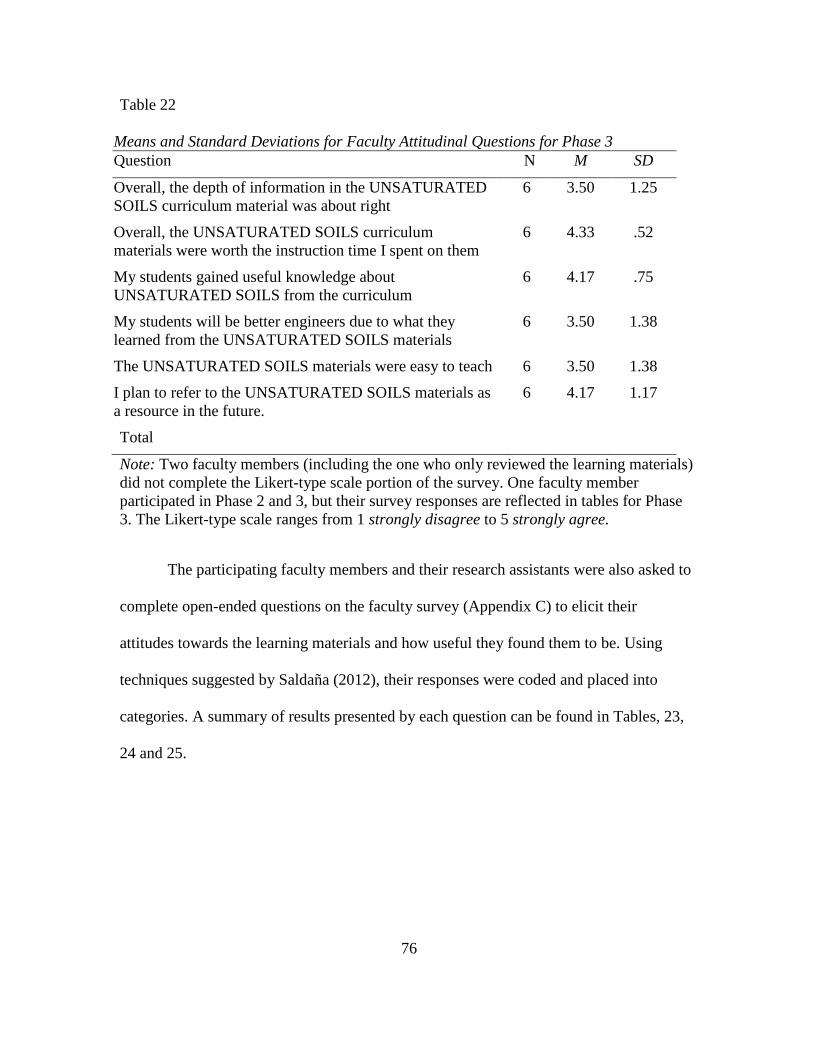
76
Table 22
Means and Standard Deviations for Faculty Attitudinal Questions for Phase 3
Question N M SD
Overall, the depth of information in the UNSATURATED
SOILS curriculum material was about right
6 3.50 1.25
Overall, the UNSATURATED SOILS curriculum
materials were worth the instruction time I spent on them
6 4.33 .52
My students gained useful knowledge about
UNSATURATED SOILS from the curriculum
6 4.17 .75
My students will be better engineers due to what they
learned from the UNSATURATED SOILS materials
6 3.50 1.38
The UNSATURATED SOILS materials were easy to teach 6 3.50 1.38
I plan to refer to the UNSATURATED SOILS materials as
a resource in the future.
6 4.17 1.17
Total
Note: Two faculty members (including the one who only reviewed the learning materials)
did not complete the Likert-type scale portion of the survey. One faculty member
participated in Phase 2 and 3, but their survey responses are reflected in tables for Phase
3. The Likert-type scale ranges from 1 strongly disagree to 5 strongly agree.
The participating faculty members and their research assistants were also asked to
complete open-ended questions on the faculty survey (Appendix C) to elicit their
attitudes towards the learning materials and how useful they found them to be. Using
techniques suggested by Saldaña (2012), their responses were coded and placed into
categories. A summary of results presented by each question can be found in Tables, 23,
24 and 25.
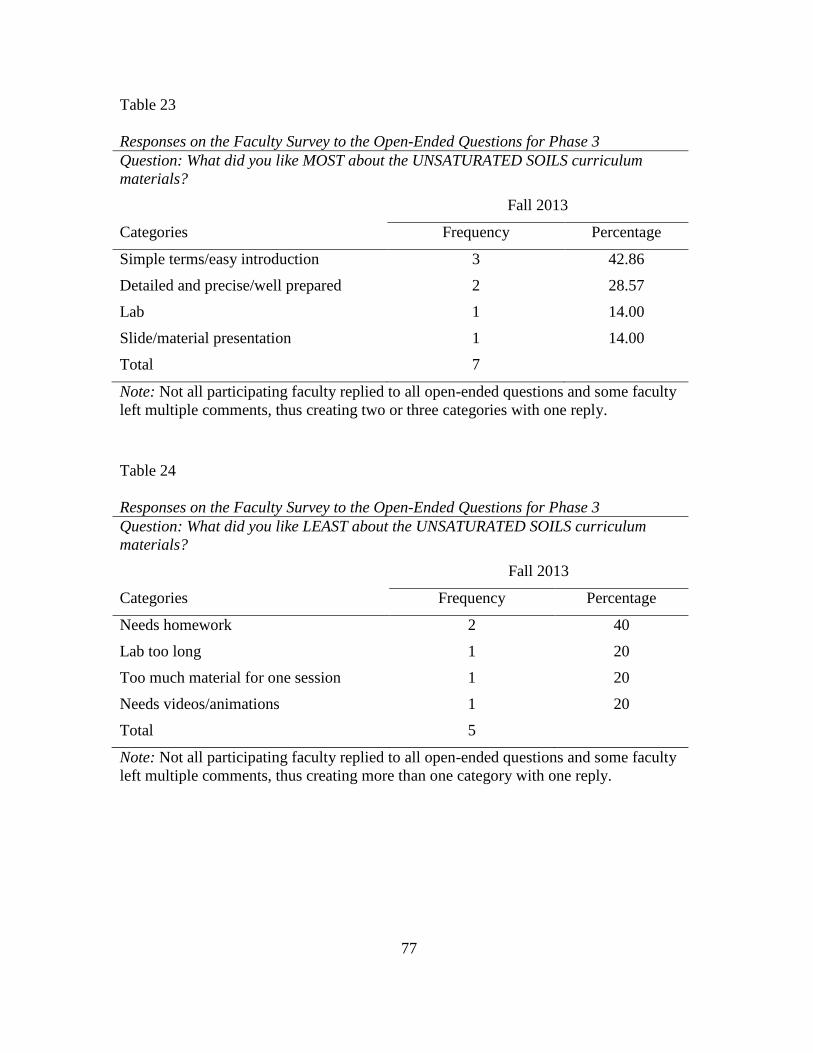
77
Table 23
Responses on the Faculty Survey to the Open-Ended Questions for Phase 3
Question: What did you like MOST about the UNSATURATED SOILS curriculum
materials?
Fall 2013
Categories Frequency Percentage
Simple terms/easy introduction 3 42.86
Detailed and precise/well prepared 2 28.57
Lab 1 14.00
Slide/material presentation 1 14.00
Total 7
Note: Not all participating faculty replied to all open-ended questions and some faculty
left multiple comments, thus creating two or three categories with one reply.
Table 24
Responses on the Faculty Survey to the Open-Ended Questions for Phase 3
Question: What did you like LEAST about the UNSATURATED SOILS curriculum
materials?
Fall 2013
Categories Frequency Percentage
Needs homework 2 40
Lab too long 1 20
Too much material for one session 1 20
Needs videos/animations 1 20
Total 5
Note: Not all participating faculty replied to all open-ended questions and some faculty
left multiple comments, thus creating more than one category with one reply.
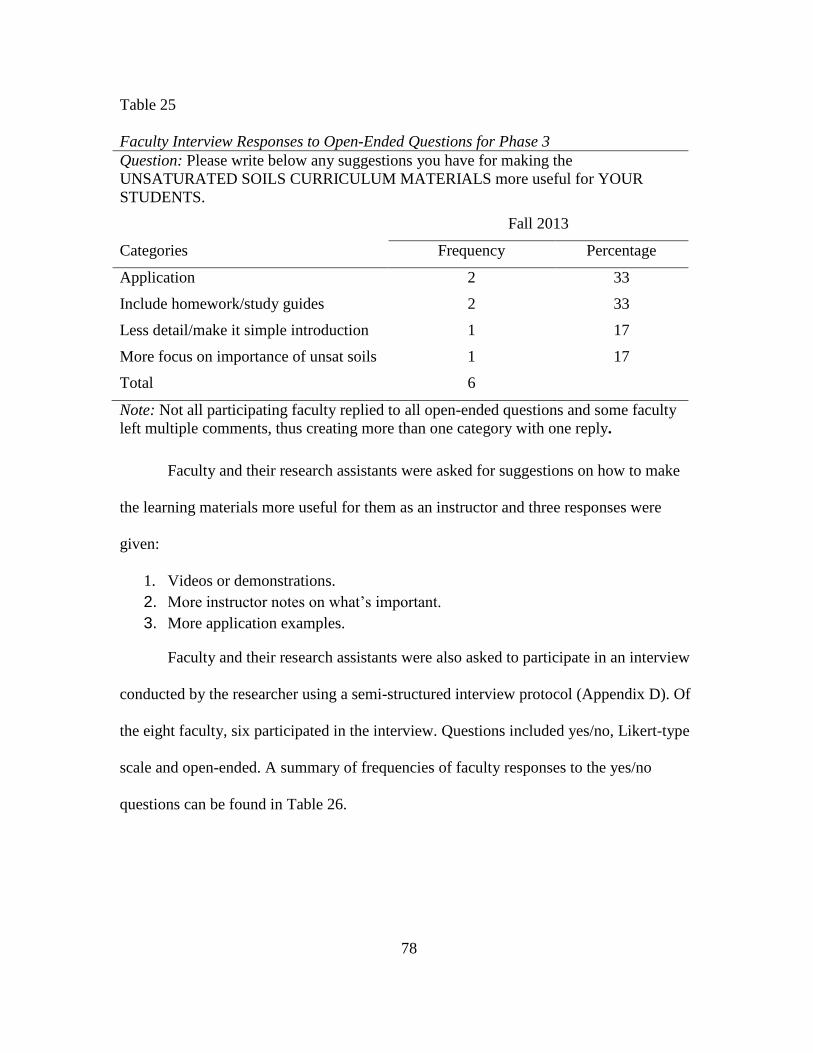
78
Table 25
Faculty Interview Responses to Open-Ended Questions for Phase 3
Question: Please write below any suggestions you have for making the
UNSATURATED SOILS CURRICULUM MATERIALS more useful for YOUR
STUDENTS.
Fall 2013
Categories Frequency Percentage
Application 2 33
Include homework/study guides 2 33
Less detail/make it simple introduction 1 17
More focus on importance of unsat soils 1 17
Total 6
Note: Not all participating faculty replied to all open-ended questions and some faculty
left multiple comments, thus creating more than one category with one reply.
Faculty and their research assistants were asked for suggestions on how to make
the learning materials more useful for them as an instructor and three responses were
given:
1. Videos or demonstrations.
2. More instructor notes on what’s important.
3. More application examples.
Faculty and their research assistants were also asked to participate in an interview
conducted by the researcher using a semi-structured interview protocol (Appendix D). Of
the eight faculty, six participated in the interview. Questions included yes/no, Likert-type
scale and open-ended. A summary of frequencies of faculty responses to the yes/no
questions can be found in Table 26.
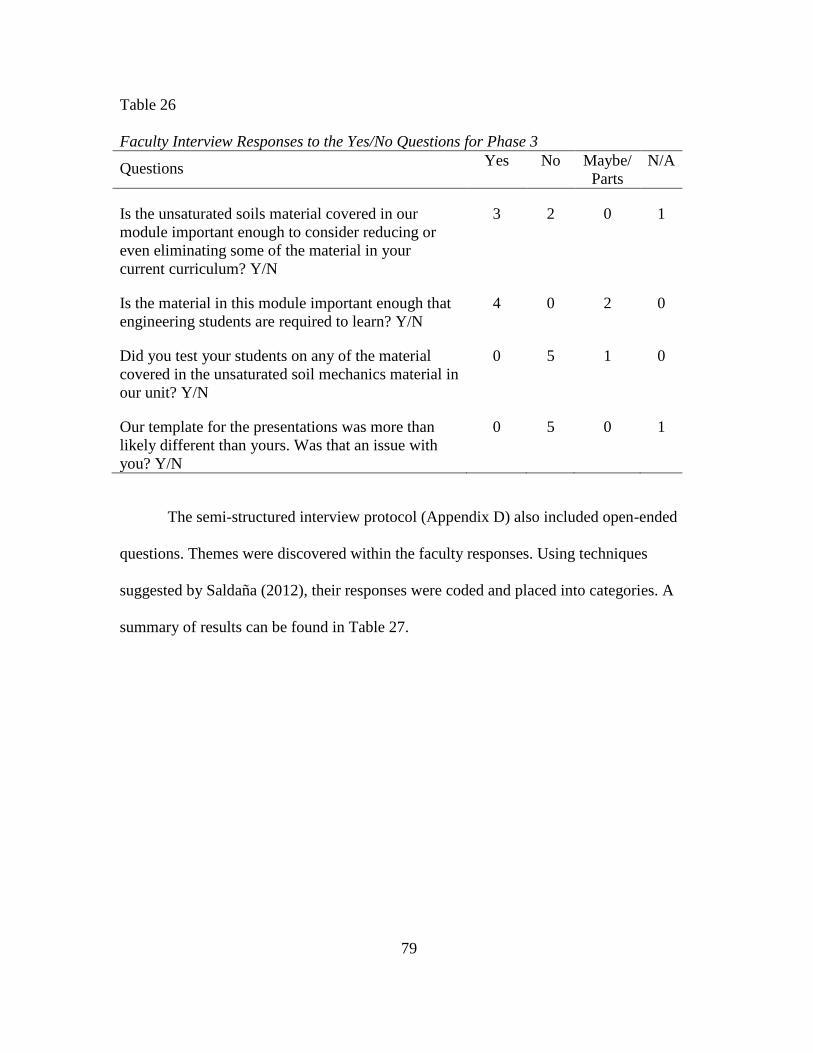
79
Table 26
Faculty Interview Responses to the Yes/No Questions for Phase 3
Questions Yes No Maybe/
Parts
N/A
Is the unsaturated soils material covered in our
module important enough to consider reducing or
even eliminating some of the material in your
current curriculum? Y/N
3 2 0 1
Is the material in this module important enough that
engineering students are required to learn? Y/N
4 0 2 0
Did you test your students on any of the material
covered in the unsaturated soil mechanics material in
our unit? Y/N
0 5 1 0
Our template for the presentations was more than
likely different than yours. Was that an issue with
you? Y/N
0 5 0 1
The semi-structured interview protocol (Appendix D) also included open-ended
questions. Themes were discovered within the faculty responses. Using techniques
suggested by Saldaña (2012), their responses were coded and placed into categories. A
summary of results can be found in Table 27.
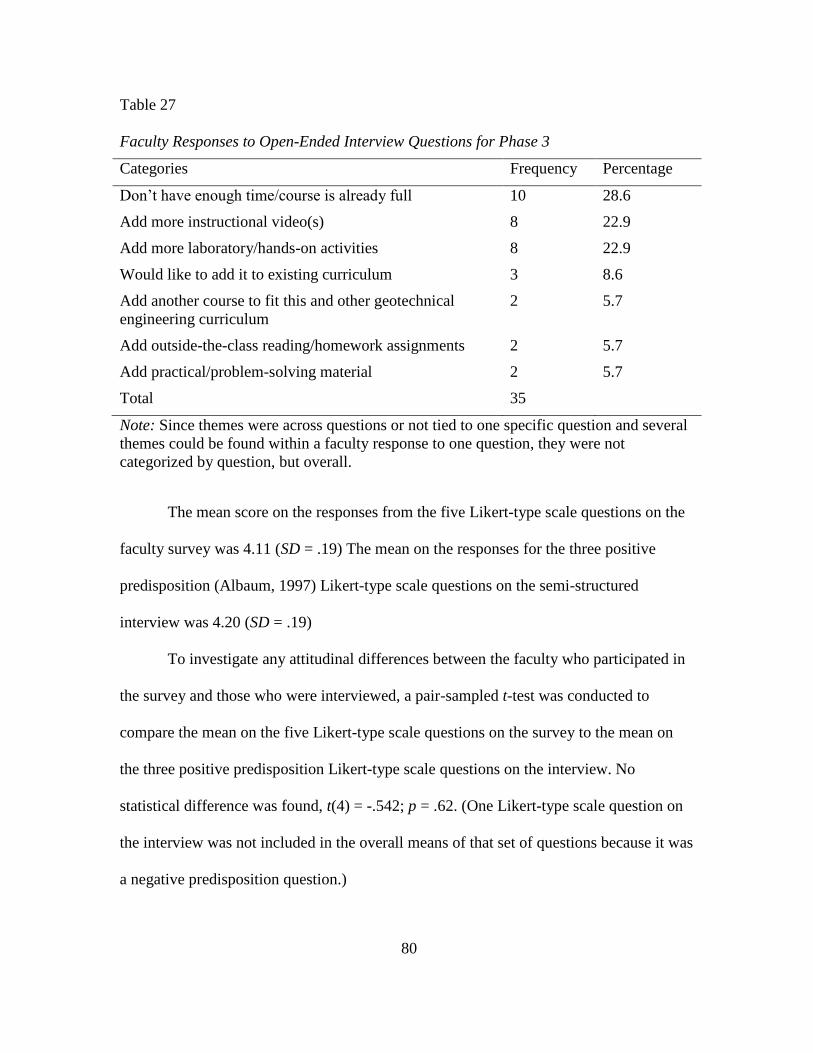
80
Table 27
Faculty Responses to Open-Ended Interview Questions for Phase 3
Categories Frequency Percentage
Don’t have enough time/course is already full 10 28.6
Add more instructional video(s) 8 22.9
Add more laboratory/hands-on activities 8 22.9
Would like to add it to existing curriculum 3 8.6
Add another course to fit this and other geotechnical
engineering curriculum
2 5.7
Add outside-the-class reading/homework assignments 2 5.7
Add practical/problem-solving material 2 5.7
Total 35
Note: Since themes were across questions or not tied to one specific question and several
themes could be found within a faculty response to one question, they were not
categorized by question, but overall.
The mean score on the responses from the five Likert-type scale questions on the
faculty survey was 4.11 (SD = .19) The mean on the responses for the three positive
predisposition (Albaum, 1997) Likert-type scale questions on the semi-structured
interview was 4.20 (SD = .19)
To investigate any attitudinal differences between the faculty who participated in
the survey and those who were interviewed, a pair-sampled t-test was conducted to
compare the mean on the five Likert-type scale questions on the survey to the mean on
the three positive predisposition Likert-type scale questions on the interview. No
statistical difference was found, t(4) = -.542; p = .62. (One Likert-type scale question on
the interview was not included in the overall means of that set of questions because it was
a negative predisposition question.)
81
Results of Data from Team Surveys, Interviews, Notes and Design Logs
Data were collected by the researcher in the form of interviews and a follow-up
survey completed by members of the interdisciplinary instructional design (IdID) team.
The researcher interviewed and was able to secure six of the seven IdID team members’
follow-up surveys. The results of these data are presented in this section.
Design team interview results. The IdID team was asked to participate in an
interview using the semi-structured interview protocol (Appendix E). The interviews
included three members who worked on the project from start to finish, two who started
after the project was underway and one who left the project early. The interview protocol
included four Likert-type scale and eight open-ended questions. The Likert-type scale
questions included choices from 1. strongly disagree to 5. strongly agree.
A summary of the design team members’ responses to the Likert-type scale
questions can be found in Table 28. The table shows the frequency in responses to the
Likert-type scale questions asked during the interview.
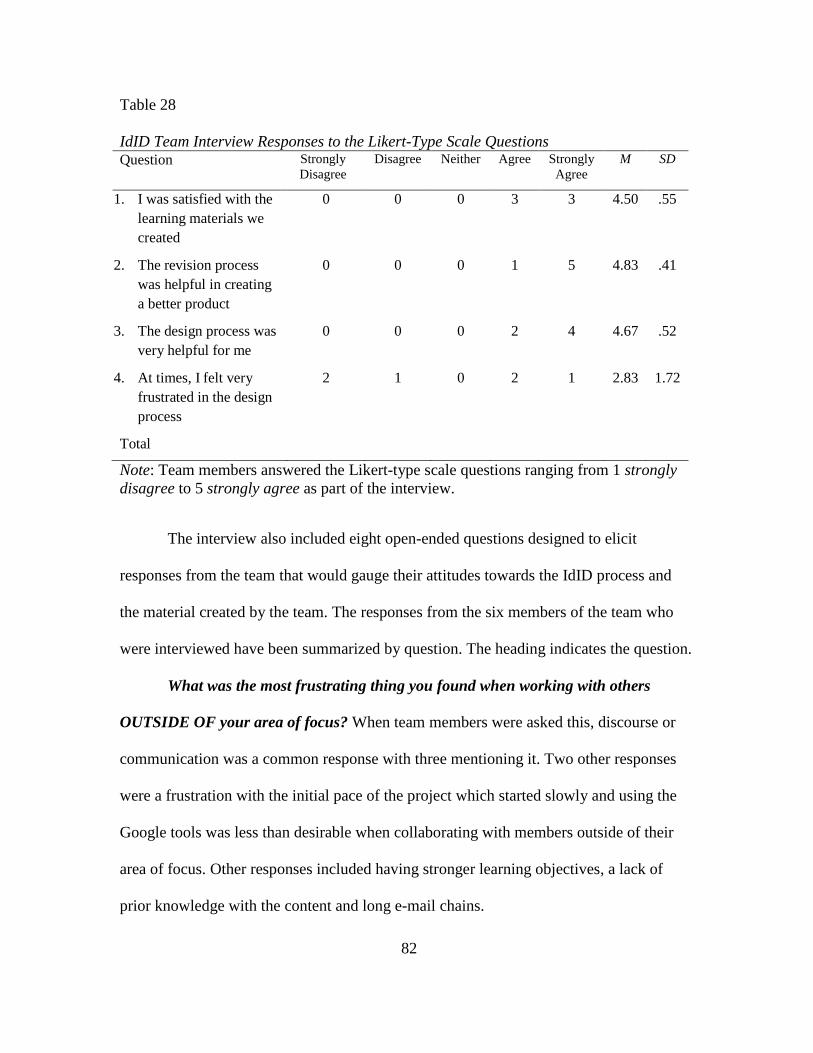
82
Table 28
IdID Team Interview Responses to the Likert-Type Scale Questions
Question Strongly
Disagree
Disagree Neither Agree Strongly
Agree
M SD
1. I was satisfied with the
learning materials we
created
0 0 0 3 3 4.50 .55
2. The revision process
was helpful in creating
a better product
0 0 0 1 5 4.83 .41
3. The design process was
very helpful for me
0 0 0 2 4 4.67 .52
4. At times, I felt very
frustrated in the design
process
2 1 0 2 1 2.83 1.72
Total
Note: Team members answered the Likert-type scale questions ranging from 1 strongly
disagree to 5 strongly agree as part of the interview.
The interview also included eight open-ended questions designed to elicit
responses from the team that would gauge their attitudes towards the IdID process and
the material created by the team. The responses from the six members of the team who
were interviewed have been summarized by question. The heading indicates the question.
What was the most frustrating thing you found when working with others
OUTSIDE OF your area of focus? When team members were asked this, discourse or
communication was a common response with three mentioning it. Two other responses
were a frustration with the initial pace of the project which started slowly and using the
Google tools was less than desirable when collaborating with members outside of their
area of focus. Other responses included having stronger learning objectives, a lack of
prior knowledge with the content and long e-mail chains.
83
What was the most frustrating thing you found when working with others
WITHIN your area of focus? When team members were asked this question, they
appeared to be satisfied with those who were in their own area of expertise, for the most
part. No one theme appeared multiple times. Some themes that were mentioned by a
single team member included the time lag, technical problems with compatibility
between Windows and Macintosh operating systems and minor differences of opinion.
What would you consider the most rewarding part of working with someone
outside of your area of focus? When team members were asked this question, they could
not pick one, and thus several themes arose. Learning new material, ideas or tools was
mentioned most often, with four of the six team members indicating it was rewarding.
Three team members mentioned teaching new materials or ideas, while learning to
communicate better and mutual respect were mentioned by two team members as a
rewarding outcome to the project. Networking, a sense of accomplishment and a sense of
self-realization were also mentioned once each.
What new IDEAS or STRATEGIES did you learn that you felt were the MOST
HELPFUL? When team members were asked this question, there were multiple
responses by team members. Learning new material or skills was mentioned by five of
the six team members. Four team members mentioned a better grasp on teaching. Three
team members recalled developing better communication skills. Other themes mentioned
were having their work recognized in a national publication and applying their skills to
help complete the project.
What new TOOLS did you learn that you felt were the MOST HELPFUL?
When team members were asked this question, Google drive was mentioned by three of
84
the six team members. The only other tool mentioned by multiple team members, two,
was PowerPoint. Other themes mentioned were a better appreciation for limiting
information in presentations and lectures, the value of video, better communication with
non-engineers, learning the lab equipment and changing perspectives by looking at the
material from a student’s point of view.
What new IDEAS or STRATEGIES did you learn that you felt were the MOST
FRUSTRATING? When team members were asked this question, two team members
mentioned how to present the information, with a second being communicating what was
needed. No other themes had multiple responses from multiple team members. Other
themes mentioned were the human subjects training, the time frame, the meticulous
nature of the design process and the content. Two team members referred to the previous
question as their response but also had input to this question.
What new TOOLS did you learn that you felt were the MOST
FRUSTRATING? When team members were asked this question, three of the six team
members indicated Google drive as a tool they felt was frustrating. The lab equipment
was mentioned by three team members. One team member also mentioned that getting
others to embrace the tools was frustrating for them.
In hindsight, what do you feel we could have done differently? When team
members were asked this question, several themes arose. Three themes, better
collaboration, mentioned by two team members, upfront understanding, mentioned by
one team member and more guidance, mentioned by one team member, have similar
connotations because they were mentioned with regard to the development of the material
in the initial stages. Other themes were having the subject matter experts do more of the
85
initial writing and the educational technology professionals learning the material more
quickly.
Results of the Team Follow-up Survey Responses
The six interdisciplinary design team members who were interviewed were also
asked to complete a follow-up survey (Appendix F) to the interview consisting of 15
Likert-type scale questions and one “additional comments” question intended to elicit
their attitudes towards the design process, the IdID team concept and the materials
created by the team. The first three questions were worded with a negative predisposition
(Albaum, 1997). In other words, a higher rating would indicate a more negative attitude.
On the first three questions with the negative predisposition, the team rated the question
regarding the design process as difficult to understand as the lowest. The question the
team rated the highest was the one regarding working with members from another
discipline as “taxing”. The overall response for this question fell between neutral and
agree.
The final twelve questions were worded to have a positive predisposition
(Albaum, 1997), where word phrases such as “do not” or “will not” were not used. In
other words, a higher rating would indicate a more positive attitude towards the question.
For the positive predisposition questions, the team rated all questions between agree and
strongly agree, with the team rating two of the questions at strongly agree. The two
questions rated at strongly agree referenced working with team members from another
discipline as “rewarding” and the IdID process helped make them better professionals.
Three questions were rated the lowest: 1. having a better grasp of the ID process; 2. the
amount of materials in the lecture was sufficient; and 3. the amount of materials in the

86
labs was sufficient. It is important to note that, although the “grasp of the ID process”
was one of the three rated lowest, 3 members did rate this question at strongly agree. A
summary of the Likert-type scale question responses to the follow-up survey is available
on Table 29.
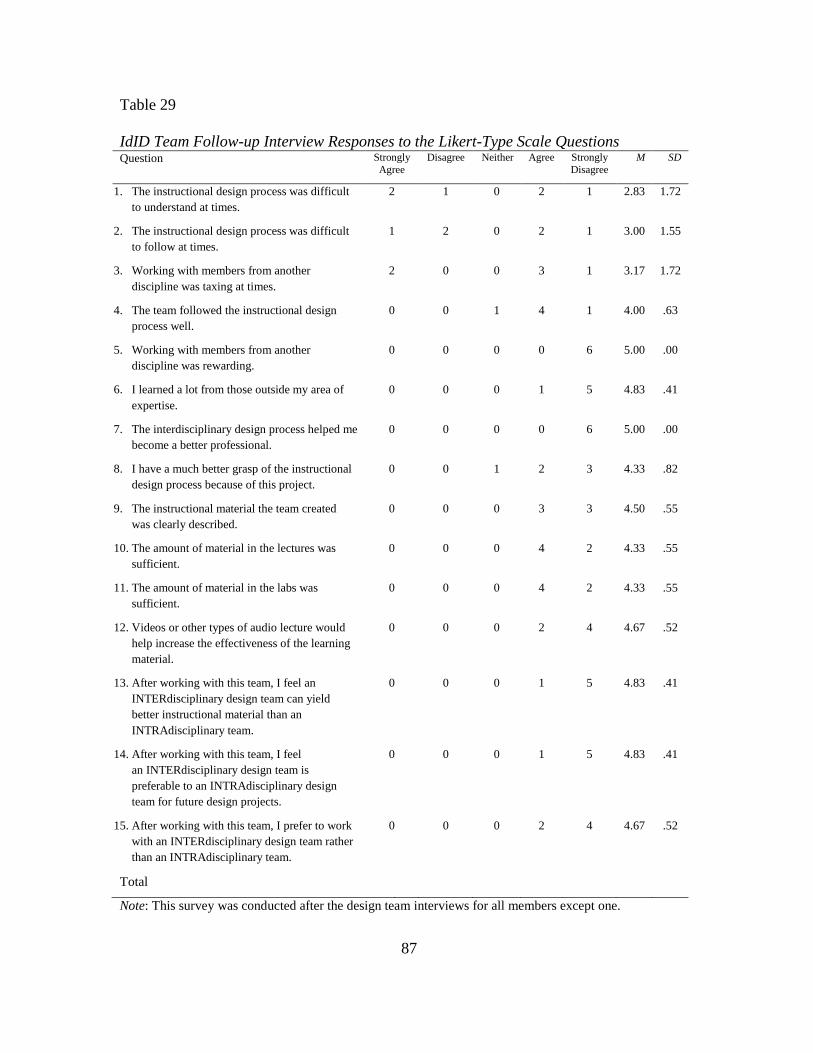
87
Table 29
IdID Team Follow-up Interview Responses to the Likert-Type Scale Questions Question Strongly
Agree
Disagree Neither Agree Strongly
Disagree
M SD
1. The instructional design process was difficult
to understand at times.
2 1 0 2 1 2.83 1.72
2. The instructional design process was difficult
to follow at times.
1 2 0 2 1 3.00 1.55
3. Working with members from another
discipline was taxing at times.
2 0 0 3 1 3.17 1.72
4. The team followed the instructional design
process well.
0 0 1 4 1 4.00 .63
5. Working with members from another
discipline was rewarding.
0 0 0 0 6 5.00 .00
6. I learned a lot from those outside my area of
expertise.
0 0 0 1 5 4.83 .41
7. The interdisciplinary design process helped me
become a better professional.
0 0 0 0 6 5.00 .00
8. I have a much better grasp of the instructional
design process because of this project.
0 0 1 2 3 4.33 .82
9. The instructional material the team created
was clearly described.
0 0 0 3 3 4.50 .55
10. The amount of material in the lectures was
sufficient.
0 0 0 4 2 4.33 .55
11. The amount of material in the labs was
sufficient.
0 0 0 4 2 4.33 .55
12. Videos or other types of audio lecture would
help increase the effectiveness of the learning
material.
0 0 0 2 4 4.67 .52
13. After working with this team, I feel an
INTERdisciplinary design team can yield
better instructional material than an
INTRAdisciplinary team.
0 0 0 1 5 4.83 .41
14. After working with this team, I feel
an INTERdisciplinary design team is
preferable to an INTRAdisciplinary design
team for future design projects.
0 0 0 1 5 4.83 .41
15. After working with this team, I prefer to work
with an INTERdisciplinary design team rather
than an INTRAdisciplinary team.
0 0 0 2 4 4.67 .52
Total
Note: This survey was conducted after the design team interviews for all members except one.
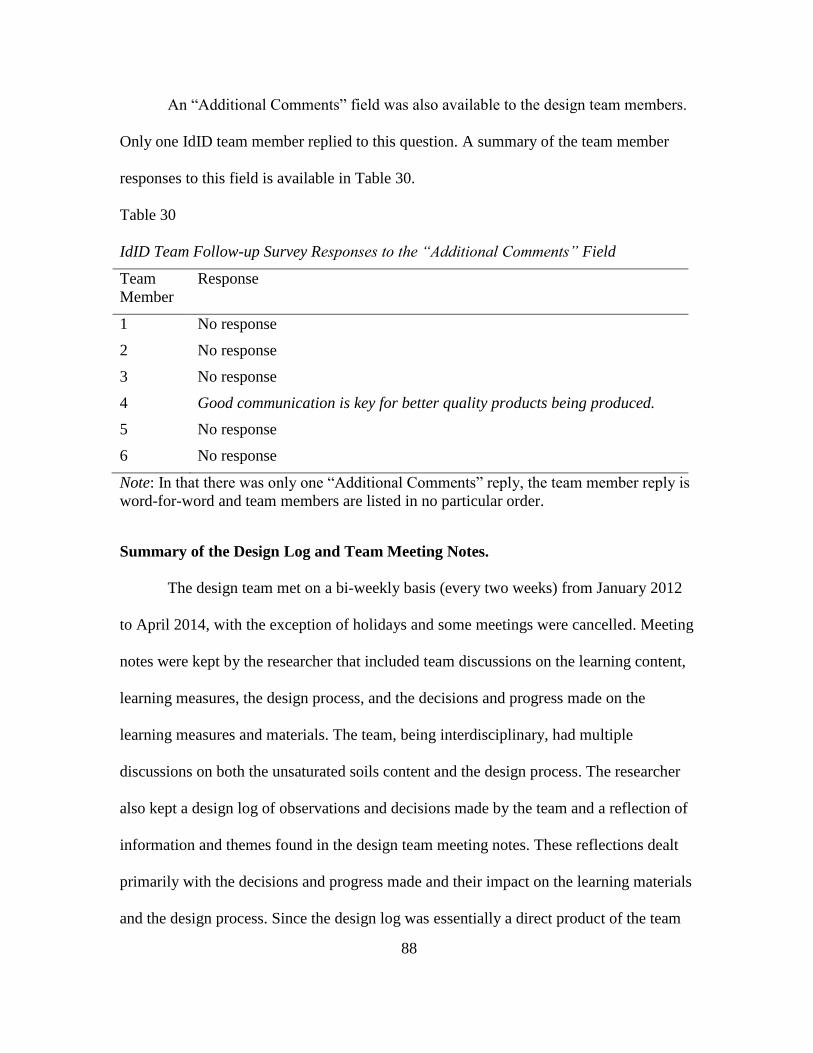
88
An “Additional Comments” field was also available to the design team members.
Only one IdID team member replied to this question. A summary of the team member
responses to this field is available in Table 30.
Table 30
IdID Team Follow-up Survey Responses to the “Additional Comments” Field
Team
Member
Response
1 No response
2 No response
3 No response
4 Good communication is key for better quality products being produced.
5 No response
6 No response
Note: In that there was only one “Additional Comments” reply, the team member reply is
word-for-word and team members are listed in no particular order.
Summary of the Design Log and Team Meeting Notes.
The design team met on a bi-weekly basis (every two weeks) from January 2012
to April 2014, with the exception of holidays and some meetings were cancelled. Meeting
notes were kept by the researcher that included team discussions on the learning content,
learning measures, the design process, and the decisions and progress made on the
learning measures and materials. The team, being interdisciplinary, had multiple
discussions on both the unsaturated soils content and the design process. The researcher
also kept a design log of observations and decisions made by the team and a reflection of
information and themes found in the design team meeting notes. These reflections dealt
primarily with the decisions and progress made and their impact on the learning materials
and the design process. Since the design log was essentially a direct product of the team
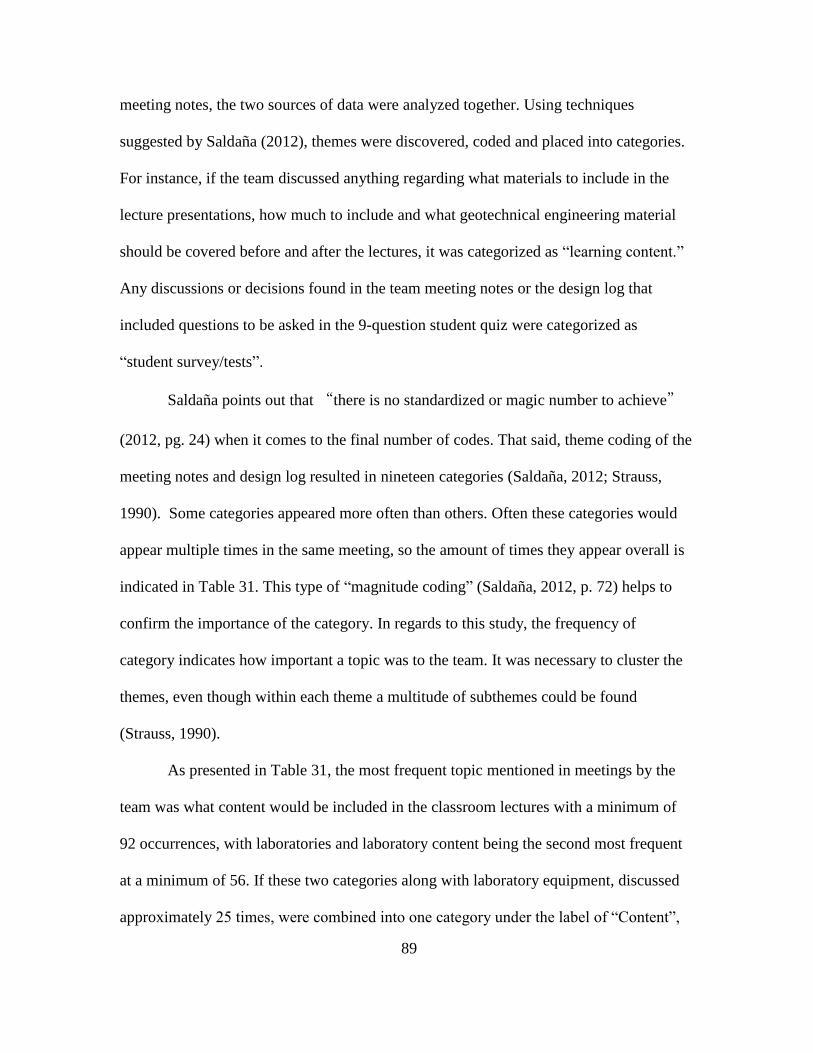
89
meeting notes, the two sources of data were analyzed together. Using techniques
suggested by Saldaña (2012), themes were discovered, coded and placed into categories.
For instance, if the team discussed anything regarding what materials to include in the
lecture presentations, how much to include and what geotechnical engineering material
should be covered before and after the lectures, it was categorized as “learning content.”
Any discussions or decisions found in the team meeting notes or the design log that
included questions to be asked in the 9-question student quiz were categorized as
“student survey/tests”.
Saldaña points out that “there is no standardized or magic number to achieve”
(2012, pg. 24) when it comes to the final number of codes. That said, theme coding of the
meeting notes and design log resulted in nineteen categories (Saldaña, 2012; Strauss,
1990). Some categories appeared more often than others. Often these categories would
appear multiple times in the same meeting, so the amount of times they appear overall is
indicated in Table 31. This type of “magnitude coding” (Saldaña, 2012, p. 72) helps to
confirm the importance of the category. In regards to this study, the frequency of
category indicates how important a topic was to the team. It was necessary to cluster the
themes, even though within each theme a multitude of subthemes could be found
(Strauss, 1990).
As presented in Table 31, the most frequent topic mentioned in meetings by the
team was what content would be included in the classroom lectures with a minimum of
92 occurrences, with laboratories and laboratory content being the second most frequent
at a minimum of 56. If these two categories along with laboratory equipment, discussed
approximately 25 times, were combined into one category under the label of “Content”,

90
then it would have been mentioned a minimum of 173 times. Instructional design was
another important theme but was only mentioned approximately 37 times; the fourth most
common theme. A summary of the IdID team meeting notes and design log themes and
their frequencies of use or the reference to them can be found in Table 31.
91
Table 31
IdID Team Meeting Notes and Researcher Design Log Themes and Frequencies
Category Frequency Percentage
1. Learning content 92 25.27
2. Laboratories and laboratory content 56 15.38
3. Collaboration with faculty and/or partner institutions 45 12.36
4. Instructional design 37 10.16
5. Laboratory equipment required/cost/issues 25 6.87
6. Flexibility of content for ease of infusion by participating
faculty
18 4.95
7. Student survey/tests 18 4.95
8. Use or necessity of including online resources/website
development
15 4.12
9. Faculty survey questions and question types 12 3.30
10. NSF Reports 10 27.47
11. Publications and publication ideas 8 2.20
12. Challenges to change with the implementation of new
learning material
8 2.20
13. BlackBoard and material to be included in the team’s shell 7 19.23
14. Idea sharing/communicating through e-mail 3 0.82
15. Institutional Review Board (IRB) application/process 3 0.82
16. Course Syllabi 3 0.82
17. Subsequent grant proposal as a second phase to this
project
3 0.82
18. Collaborative Institutional Training Initiative (CITI)
certification
2 0.55
19. External evaluators 2 5.55
Total 364
Note: Categories, frequencies and percentages are a summary of the data collected by the
researcher. Some data were misplaced due to the relocation of the researcher.
92
CHAPTER 4
DISCUSSION
This study was initiated with the purpose of investigating the interdisciplinary
instructional design (IdID; Ornelas, 2014) process as it followed the design, development
(Dick, Carey & Carey, 2009; Richey & Klein 2009; Gagne, 1985) and evaluation (Russ-
Eft & Preskill, 2009) of new material for the undergraduate civil engineering curriculum
in geotechnical engineering, a subset of civil engineering. In this chapter, a baseline and
two phases of instructional material implementation and evaluation, student and faculty
attitudinal data, IdID team attitudinal data and data collected on the instructional design
process in the form of team meeting notes and a design log with the IdID team will be
discussed.
Research Question 1
In this section, findings for research question one, “What are the learning and
attitudinal effects of a new instructional unit on unsaturated soils in geotechnical
engineering developed using systematic processes of design and development?” will be
discussed. Findings on student achievement on a 9-question quiz, students’ perceptions of
difficulty and student attitudes will be discussed. This section will also discuss findings
from the faculty surveys and faculty interviews. There were three phases of
implementation, Phase 1, a no-instruction baseline assessment, Phase 2, a pretest/posttest
design with one module taught and Phase 3, a pretest/posttest design where instructors
were provided with the entire unit of instruction, and taught some of it or the entire unit.
The entire unit included a lecture module on stress state variables, a second lecture
module on the soil-water characteristic curve, a pre-laboratory lecture on axis translation
93
(Fredlund & Rahardjo, 1993) and the choice of two laboratory exercises on either the
Tempe cell or oedometer-type pressure plate device.
In this study, the instructional design process utilized by this team yielded an
impact on student learning, as evident from significant growth in students’ scores from
pretest to posttest in Phase 3 and the large effect size (d = .1.67). Instructional design also
played a key role in the professional development of the team members. Team interviews
and surveys revealed that a new and better understanding of the ID process and the ability
to develop better instructional materials was a direct result of the use of a systematic
process of instructional design. A better understanding of how to create instructional
materials, provide direction to students, be concise in directions, as well as a better
appreciation for the skills of the instructional designer were evident in the data collected
from the IdID team. A better product (the instructional materials) was created as a result
of following the instructional design process. Steps along the way may have been skipped
or the team may have deviated from the order of the steps, but steps and guidelines in the
ID process (Dick, Carey & Carey, 2009; Gagne, 1985) nonetheless helped the team to
create instructional materials that were effective.
Phase 1: Summary of Findings and Discussion of Results
In Phase 1 of implementation, research question one relates partially to 1. the 9-
question quiz developed early on in the design process to measure students’
understanding in basic unsaturated soils material and 2. the students’ perceptions of
difficulty of the quiz.
94
Phase 1 summary of student achievement findings and discussion. In Phase 1,
students were given the 9-question quiz towards the end of the semester with no
additional instruction on unsaturated soils beyond what they received in their required
geotechnical engineering classes. Students in Phase 1 scored an average of 53.2%,
indicating that either they received some instruction in unsaturated soils from their
regular geotechnical engineering classes or the students were able to decipher the answers
on about half of the questions on the 9-question quiz. Students performed significantly
better on questions one though four than they did on questions five though nine. This
would indicate that either the first four questions were covered directly or indirectly in
their regular geotechnical engineering classes, as mentioned by one of the professors of
record (instructor 1, personal communication, 2012), the students received instruction on
some or all of the material in questions one through four in their other civil engineering
classes or the answers for the first four questions were easier for the students to decipher
than were the final five.
Phase 1 summary of students’ perceptions of difficulty findings and
discussion. When asked to rate the difficulty of the test on a Likert-type scale from 1.
very difficult to 5. very easy, the students in Phase 1 rated the quiz as being between
difficult and average. This would indicate that there was some perception of difficulty as
a much larger number of students rated it as either very difficult (n = 35) or difficult (n =
196) than did students who rated it as either easy (n = 5) or very easy (n = 6). Considering
the test had only nine questions and only took the students ten to fifteen minutes to
complete, indicates that the test was, in fact, perceptively difficult for the students in
Phase 1.
95
Phase 2: Summary of Findings and Discussion of Results
In Phase 2 of implementation, research question one relates partially to 1. the 9-
question quiz developed to measure students’ understanding in basic unsaturated soils
material and to evaluate the materials’ effectiveness (Russ-Eft & Preskill, 2009), 2. the
students’ perceptions of difficulty of the quiz, and 3. student and 4. faculty attitudes
towards the material developed by the IdID team.
Phase 2 summary of student achievement findings and discussion. In Phase 2
participating faculty were asked to administer the 9-question quiz as a pretest prior to the
instruction of any unsaturated soils material (including what they would normally cover),
teach the one learning module the team had completed and provided to the participating
faculty, and then administer the same 9-question quiz as a posttest. On the matched
pretests, the students scored an average of 52.1%. This would indicate that the students
either received some instruction in unsaturated soils from their instructors prior to taking
the pretest, the students were able to decipher the answers to some of the questions from
materials and skills they picked up in other engineering courses or the pretest had
questions on it that the students could answer without receiving any direct instruction on
unsaturated soils or a combination of two or more of these scenarios. On the matched
posttests, the students scored an average of 53.6% on the posttest after receiving
instruction on the one module the team created. The students did increase their scores
from pretest to posttest, but the increase was not statistically significant. The students did
have a statistically significant increase from pretest to posttest on one of the questions;
question 2. This question was covered in the one module that was taught to the students.
This would indicate that students did learn some material from the one lecture to which
96
they were exposed. This could account for the 1.5% increase from matched pretest to
matched posttest; 52.1% to 53.6%, respectively. However, since it was not statistically
significant and coupled with the small effect size index, the increase could also have been
due to chance. This would indicate that having one learning module was not enough for
the students to achieve statistically significant growth and providing the entire module
would be preferable.
As with Phase 1, students performed significantly better on questions one through
four than on questions five through nine. Since the students in this phase had similar
results on the first four versus the final five questions as the students of Phase 1, this
would indicate that a similar explanation for the difference in student performance based
on the test questions across both phases would suffice.
Phase 2 summary of students’ perceptions of difficulty findings and
discussion. There were a couple of key findings in the students’ perception of difficulty.
First, the students in Phase 2 rated both the pretest and posttest between difficult and
average. This would indicate that there was some perception of difficulty on both tests.
Second, on the matched pretest/posttests, the students’ perceptions of quiz difficulty were
significantly lower on the posttest than on the pretest. In other words, the students’
perceptions of difficulty decreased after taking the posttest. A possible explanation would
be that either they felt it was easier after taking it twice, or felt it was easier because they
received instruction on some of the material on the posttest.
Phase 2 summary of student attitude findings and discussion. In Phase 2 of
implementation, the students rated the materials on average between neutral and agree.
None of the Likert-type scale questions had a rating below neutral. This finding would
97
indicate that on average, the students’ attitudes towards the learning materials were
positive.
Even with the possibility of the neutral-available option being used as a “dumping
ground” (Kulas, Stachowski & Haynes, 2008, p. 252) for students who may have felt
unsure, this option was not a chosen majority on any of the six Likert-type scale
questions, chosen between 17.8% and 45.2%. Kulas, Stachowski & Haynes (2008) point
out that the middle neutral option can be used as this dumping ground, but is still
effective and its use is recommended.
On the Likert-type scale questions, a finding revealed that the students gave the
highest rating to the question regarding the depth of information covered in the learning
module. This would indicate that the students felt the material in the learning module was
sufficient for the purposes intended. One possible explanation could be that the students
did not feel overwhelmed by the learning material since this module was designed to be
covered in approximately one class session.
On the Likert-type scale questions, students gave the lowest rating to the question
regarding the ease of use for their instructor. This would indicate that the students could
sense some struggle by the instructor with the material, either in teaching it or fitting it
into their teaching schedules. Two possible explanations for this could be either the
material was arranged where it was difficult for their instructor to teach or their instructor
was not that familiar with the material. A third explanation could lie with the team not
providing the material early enough to the instructors for them to properly prepare for
instruction, while a fourth explanation could lie with the lack of instruction time within
the semester. With an already full semester of material to cover and/or perhaps an
98
unwillingness to add new material (Cheah, Chen and Ting 2005), the students may have
picked up on the instructors “rush” to get this material covered, thus another explanation
for this question receiving the lowest rating. This explanation could also be supported
with faculty responses in the semi-structured interviews to be discussed further along in
this chapter.
On the open-ended questions, when students were asked what they liked most
about the materials, the most frequent response at about 46% referred to the learning
materials themselves, to one degree or another. When they were asked what they liked
least, again, the learning materials were mentioned most often at about 36%. More replies
for the learning material were indicated for what they liked most than what they liked
least. This would indicate that, although some students did state they did not like the
learning materials, more stated that they did like them, supporting the team’s efforts to
create new learning materials for this target population. The second most frequent reply
at about 33% to what they liked least was none of it. Since this was a negative
predisposition question (Albaum, 1997), a negative reply like “none of it” would indicate
that students did like the learning material, hence, two negatives make a positive. When
students were asked to give suggestions for improving the learning materials, again, the
most common reply was none. This, along with other positive responses to this question,
would indicate that most students approved of the learning materials, in this case, the one
lecture module.
Phase 2 summary of faculty attitude findings and discussion. In Phase 2 of
implementation, the faculty members were asked to complete some questions on a survey
regarding their attitudes towards the learning material. The two faculty who agreed to
99
participate were asked to rate the overall quality of the learning material from 1. poor, to
5. excellent and rated it at a 4. This would indicate that the two participating faculty felt
the material was valuable enough to teach.
The faculty survey also had six Likert-type scale questions where the higher the
rating, the more positively the faculty viewed the materials. The faculty rated the
materials on average between neutral and agree. This would indicate that on average, the
faculty attitudes towards the learning materials were positive, that the learning material
was worth the time they spent on it and that it would benefit their students.
Faculty members were also asked open-ended questions on the survey. Since
there were only two surveys, no coding of the replies was conducted. Both faculty
members replied that the sand castle example was what they liked most. Both replies to
what they liked least were similar in that one mentioned the material was “confusing” and
the second that some material “needs more explanation”. One would have also preferred
a shorter version, perhaps one that took 45 minutes to cover. There was no reply by either
faculty member to the request for suggestions for improvement. The replies from the two
faculty members were generally positive indicating that they felt the material was useful,
worth their time and valuable enough that their students should learn.
For Phase 2 a semi-structured interview was conducted and one faculty member
participated. This faculty member mentioned he/she would like to see more real-world
examples in the learning materials (Fisher & Frey, 2014), provide the students with more
background information and introduce measurement as part of the learning material. This
faculty member did mention that they would like to see this material added to the existing
curriculum in geotechnical courses, but that it just needs some updating.
100
Phase 3: Summary of Findings and Discussion of Results
In Phase 3 of implementation, research question one relates partially to 1. the 9-
question quiz developed to measure students’ understanding in basic unsaturated soils
material and to evaluate the learning materials’ effectiveness (Russ-Eft & Preskill, 2009),
2. the students’ perceptions of difficulty and 3. student and 4. faculty attitudes towards
the material developed by the IdID team.
Phase 3 summary of student achievement findings and discussion. For student
achievement in Phase 3, where the entire unit was available to the faculty members and
most of or the entire unit was taught, several findings are noteworthy of discussion. On
the matched pretests, the students scored an average of 52%. Implications here are similar
to those offered for the pretest findings earlier in this chapter. Since this was a pretest,
answering such a high number correctly may call for a revamping of the questions of
which the students scored consistently high. Students scoring in the 10 to 20% range on
the pretest would be more preferable.
Secondly, on the matched posttests, the students scored an average of 67% on the
posttest after receiving instruction from most of or the entire instructional unit the team
created. The students’ scores were significantly higher on the posttest than the pretest.
The implication here would indicate that since the students were able to show statistically
significant learning gains from pretest to posttest, in contrast to Phase 2 where they did
not; that the students needed most of or the entire unit of instruction to achieve this
statistically significant gain-score on the posttest. Since the ID process was used to create
the learning materials for the students and they showed a statistically significant learning
gains, this supports the relevance of the ID process.
101
Third, students performed significantly better on the pretest for questions one
through four than questions five through nine. This similarity to findings with the pretest
and posttest of Phase 2 would suggest the indications offered in the Phase 2 discussion.
Lastly, for the posttest, students did not perform significantly better on questions
one through four as compared to five through nine. Since these were results from the
posttest on questions one through four versus five through nine, this would indicate that
the students received enough information from most of or the entire unit of instruction to
score at statistically equivalent levels of achievement on these question sets. This is in
contrast to the Baseline, the pretest and posttest of Phase 2 and the pretest of Phase 3.
This would also indicate that material for questions five, six, seven and nine were
covered in the second lecture module, the pre-laboratory lecture and the two laboratory
exercises. Students scored consistently high on question 8 for all levels and tests. This
would suggest that the answer for question 83 was easier for the students to decipher than
most of the other questions on the test.
Phase 3 summary of students’ perceptions of difficulty findings and
discussion. There were four findings worth noting in the students’ perceptions of
difficulty. First, when asked to rate the difficulty of the test from 1. very difficult to 5.
very easy, the students on the Phase 3 pretest rated the quiz between difficult and
average. This would indicate that there was some perception of difficulty. Next, students
also rated the posttest between difficult and average. This would also indicate that there
was some perception of difficulty on the posttest. Third, considering the test had only 9
questions and took the students only ten to fifteen minutes to complete, indicated that this
3 Question 8, with options “1, 2 and 3” and the “none of the above,” will be discussed later on.
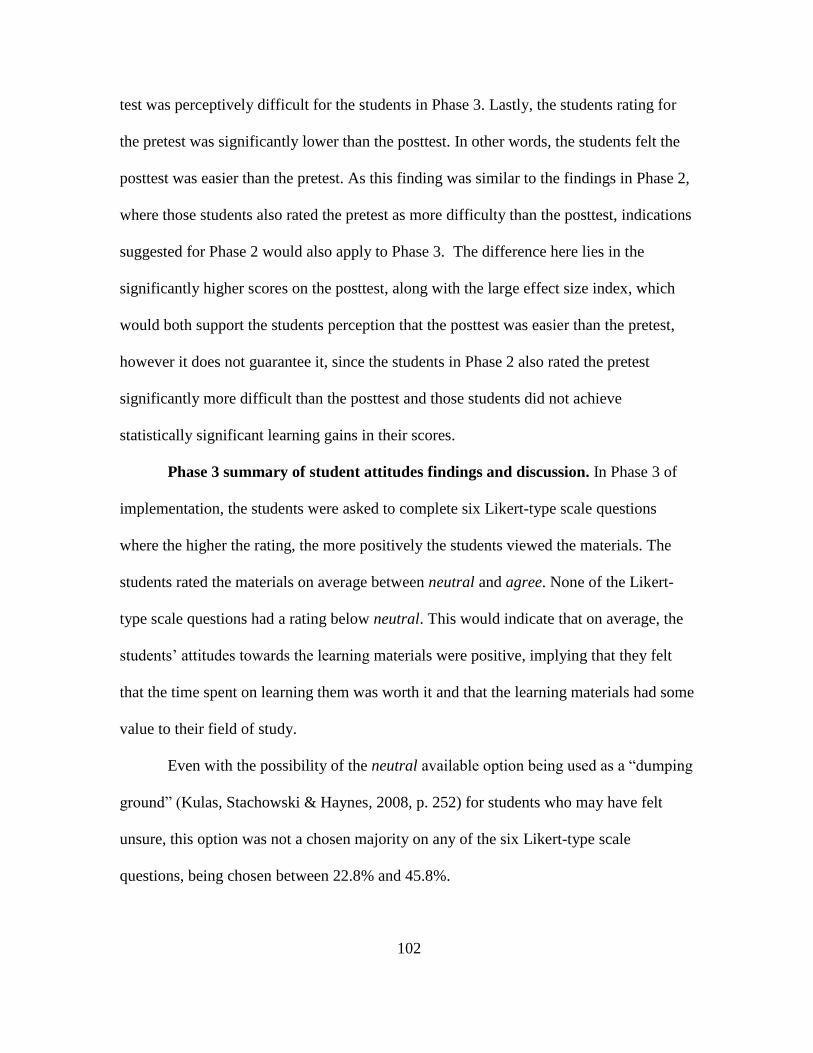
102
test was perceptively difficult for the students in Phase 3. Lastly, the students rating for
the pretest was significantly lower than the posttest. In other words, the students felt the
posttest was easier than the pretest. As this finding was similar to the findings in Phase 2,
where those students also rated the pretest as more difficulty than the posttest, indications
suggested for Phase 2 would also apply to Phase 3. The difference here lies in the
significantly higher scores on the posttest, along with the large effect size index, which
would both support the students perception that the posttest was easier than the pretest,
however it does not guarantee it, since the students in Phase 2 also rated the pretest
significantly more difficult than the posttest and those students did not achieve
statistically significant learning gains in their scores.
Phase 3 summary of student attitudes findings and discussion. In Phase 3 of
implementation, the students were asked to complete six Likert-type scale questions
where the higher the rating, the more positively the students viewed the materials. The
students rated the materials on average between neutral and agree. None of the Likert-
type scale questions had a rating below neutral. This would indicate that on average, the
students’ attitudes towards the learning materials were positive, implying that they felt
that the time spent on learning them was worth it and that the learning materials had some
value to their field of study.
Even with the possibility of the neutral available option being used as a “dumping
ground” (Kulas, Stachowski & Haynes, 2008, p. 252) for students who may have felt
unsure, this option was not a chosen majority on any of the six Likert-type scale
questions, being chosen between 22.8% and 45.8%.
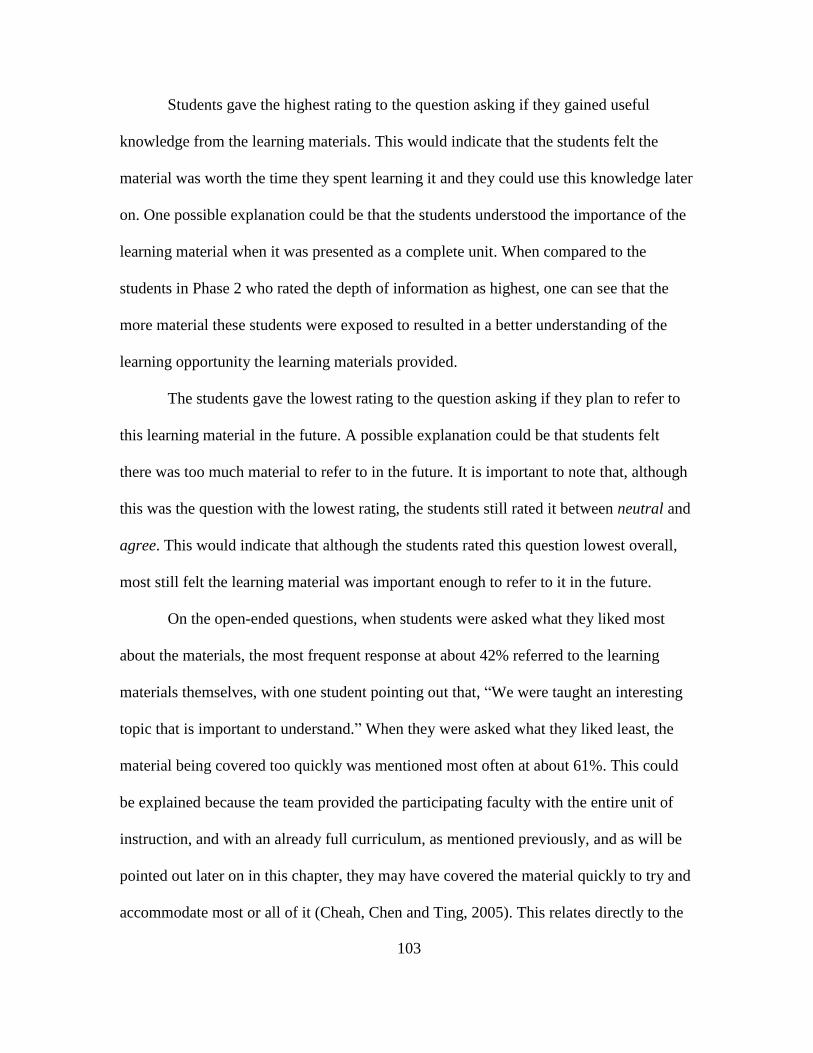
103
Students gave the highest rating to the question asking if they gained useful
knowledge from the learning materials. This would indicate that the students felt the
material was worth the time they spent learning it and they could use this knowledge later
on. One possible explanation could be that the students understood the importance of the
learning material when it was presented as a complete unit. When compared to the
students in Phase 2 who rated the depth of information as highest, one can see that the
more material these students were exposed to resulted in a better understanding of the
learning opportunity the learning materials provided.
The students gave the lowest rating to the question asking if they plan to refer to
this learning material in the future. A possible explanation could be that students felt
there was too much material to refer to in the future. It is important to note that, although
this was the question with the lowest rating, the students still rated it between neutral and
agree. This would indicate that although the students rated this question lowest overall,
most still felt the learning material was important enough to refer to it in the future.
On the open-ended questions, when students were asked what they liked most
about the materials, the most frequent response at about 42% referred to the learning
materials themselves, with one student pointing out that, “We were taught an interesting
topic that is important to understand.” When they were asked what they liked least, the
material being covered too quickly was mentioned most often at about 61%. This could
be explained because the team provided the participating faculty with the entire unit of
instruction, and with an already full curriculum, as mentioned previously, and as will be
pointed out later on in this chapter, they may have covered the material quickly to try and
accommodate most or all of it (Cheah, Chen and Ting, 2005). This relates directly to the
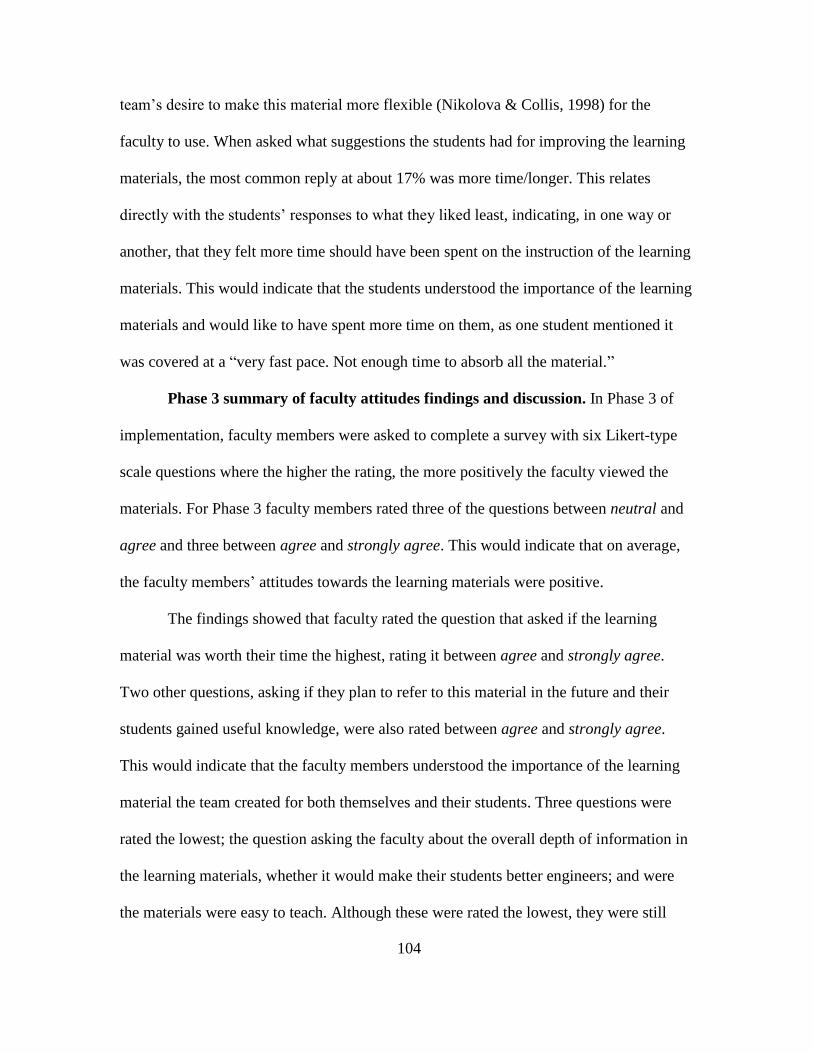
104
team’s desire to make this material more flexible (Nikolova & Collis, 1998) for the
faculty to use. When asked what suggestions the students had for improving the learning
materials, the most common reply at about 17% was more time/longer. This relates
directly with the students’ responses to what they liked least, indicating, in one way or
another, that they felt more time should have been spent on the instruction of the learning
materials. This would indicate that the students understood the importance of the learning
materials and would like to have spent more time on them, as one student mentioned it
was covered at a “very fast pace. Not enough time to absorb all the material.”
Phase 3 summary of faculty attitudes findings and discussion. In Phase 3 of
implementation, faculty members were asked to complete a survey with six Likert-type
scale questions where the higher the rating, the more positively the faculty viewed the
materials. For Phase 3 faculty members rated three of the questions between neutral and
agree and three between agree and strongly agree. This would indicate that on average,
the faculty members’ attitudes towards the learning materials were positive.
The findings showed that faculty rated the question that asked if the learning
material was worth their time the highest, rating it between agree and strongly agree.
Two other questions, asking if they plan to refer to this material in the future and their
students gained useful knowledge, were also rated between agree and strongly agree.
This would indicate that the faculty members understood the importance of the learning
material the team created for both themselves and their students. Three questions were
rated the lowest; the question asking the faculty about the overall depth of information in
the learning materials, whether it would make their students better engineers; and were
the materials were easy to teach. Although these were rated the lowest, they were still
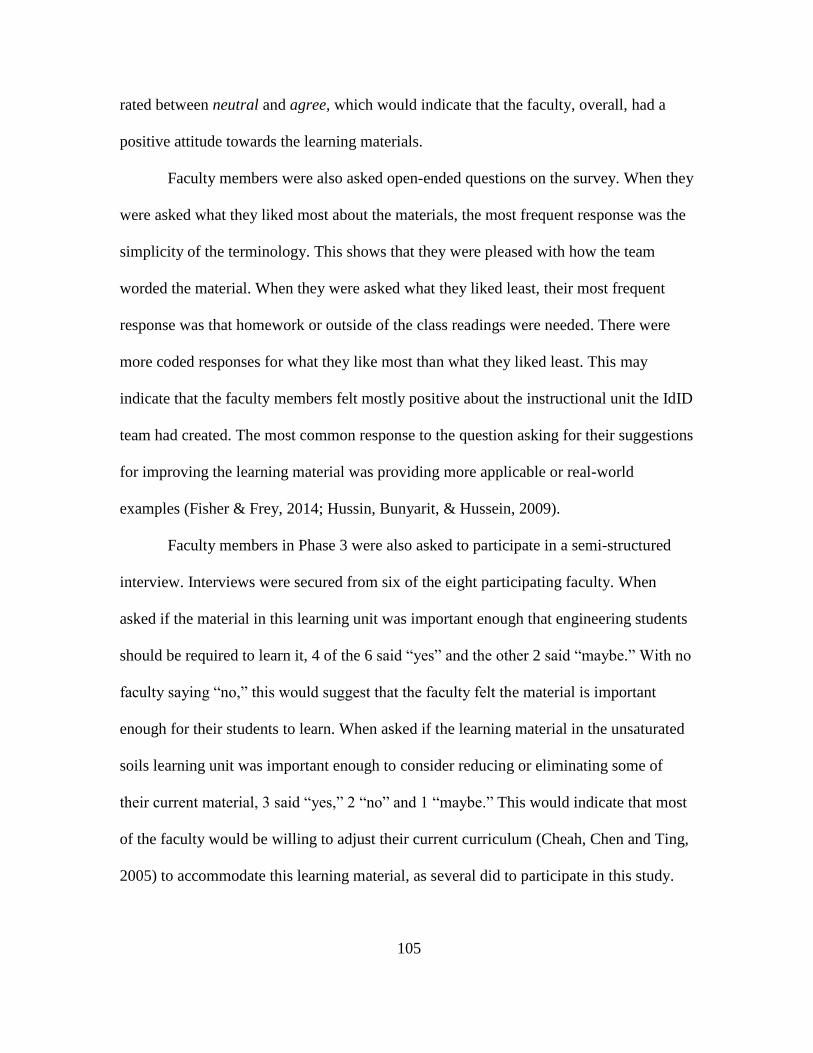
105
rated between neutral and agree, which would indicate that the faculty, overall, had a
positive attitude towards the learning materials.
Faculty members were also asked open-ended questions on the survey. When they
were asked what they liked most about the materials, the most frequent response was the
simplicity of the terminology. This shows that they were pleased with how the team
worded the material. When they were asked what they liked least, their most frequent
response was that homework or outside of the class readings were needed. There were
more coded responses for what they like most than what they liked least. This may
indicate that the faculty members felt mostly positive about the instructional unit the IdID
team had created. The most common response to the question asking for their suggestions
for improving the learning material was providing more applicable or real-world
examples (Fisher & Frey, 2014; Hussin, Bunyarit, & Hussein, 2009).
Faculty members in Phase 3 were also asked to participate in a semi-structured
interview. Interviews were secured from six of the eight participating faculty. When
asked if the material in this learning unit was important enough that engineering students
should be required to learn it, 4 of the 6 said “yes” and the other 2 said “maybe.” With no
faculty saying “no,” this would suggest that the faculty felt the material is important
enough for their students to learn. When asked if the learning material in the unsaturated
soils learning unit was important enough to consider reducing or eliminating some of
their current material, 3 said “yes,” 2 “no” and 1 “maybe.” This would indicate that most
of the faculty would be willing to adjust their current curriculum (Cheah, Chen and Ting,
2005) to accommodate this learning material, as several did to participate in this study.
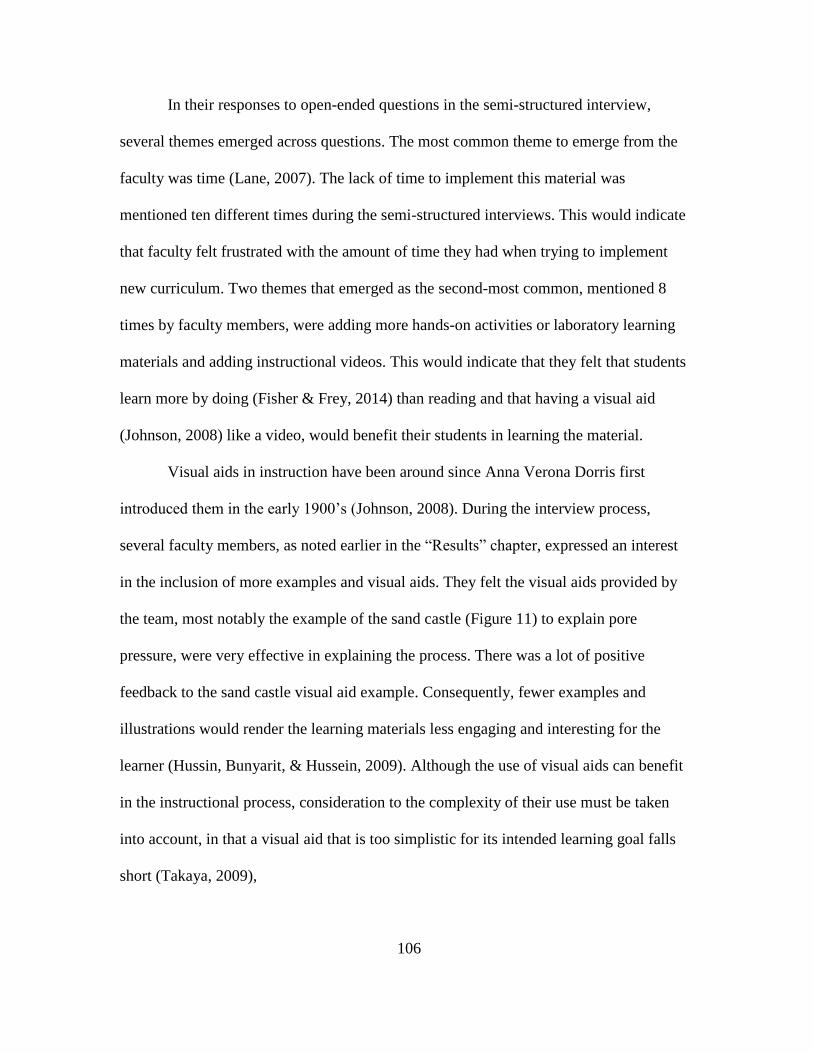
106
In their responses to open-ended questions in the semi-structured interview,
several themes emerged across questions. The most common theme to emerge from the
faculty was time (Lane, 2007). The lack of time to implement this material was
mentioned ten different times during the semi-structured interviews. This would indicate
that faculty felt frustrated with the amount of time they had when trying to implement
new curriculum. Two themes that emerged as the second-most common, mentioned 8
times by faculty members, were adding more hands-on activities or laboratory learning
materials and adding instructional videos. This would indicate that they felt that students
learn more by doing (Fisher & Frey, 2014) than reading and that having a visual aid
(Johnson, 2008) like a video, would benefit their students in learning the material.
Visual aids in instruction have been around since Anna Verona Dorris first
introduced them in the early 1900’s (Johnson, 2008). During the interview process,
several faculty members, as noted earlier in the “Results” chapter, expressed an interest
in the inclusion of more examples and visual aids. They felt the visual aids provided by
the team, most notably the example of the sand castle (Figure 11) to explain pore
pressure, were very effective in explaining the process. There was a lot of positive
feedback to the sand castle visual aid example. Consequently, fewer examples and
illustrations would render the learning materials less engaging and interesting for the
learner (Hussin, Bunyarit, & Hussein, 2009). Although the use of visual aids can benefit
in the instructional process, consideration to the complexity of their use must be taken
into account, in that a visual aid that is too simplistic for its intended learning goal falls
short (Takaya, 2009),
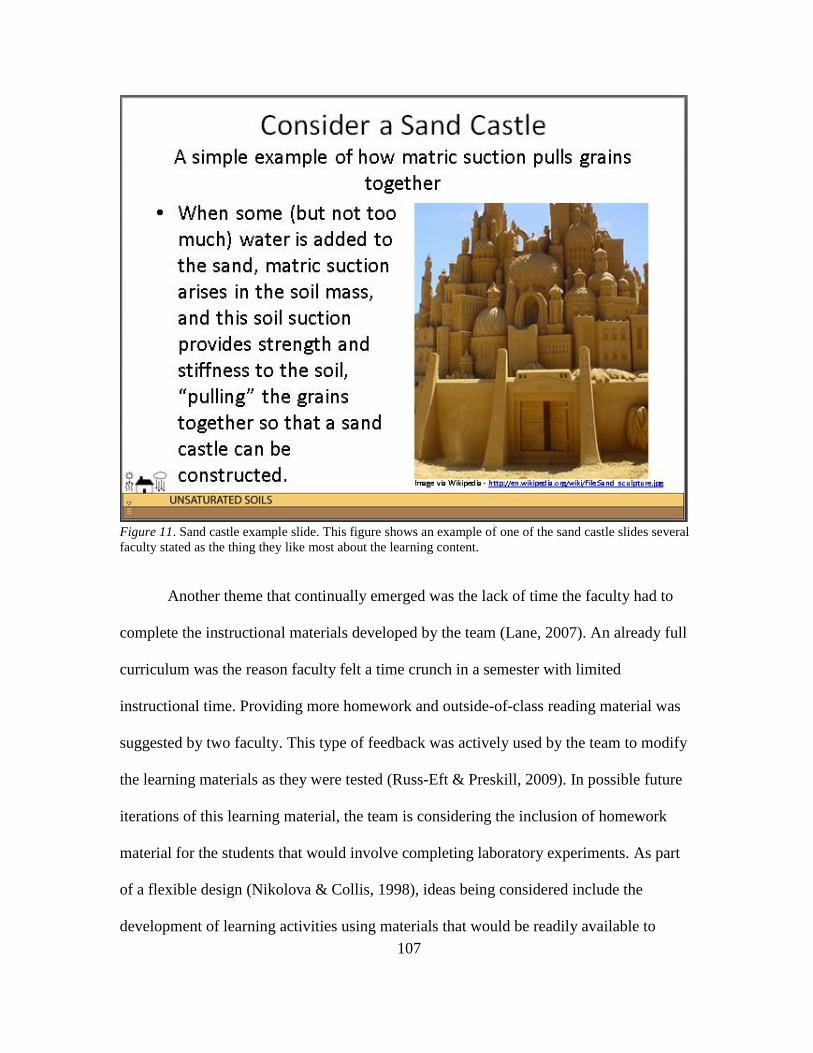
107
Figure 11. Sand castle example slide. This figure shows an example of one of the sand castle slides several
faculty stated as the thing they like most about the learning content.
Another theme that continually emerged was the lack of time the faculty had to
complete the instructional materials developed by the team (Lane, 2007). An already full
curriculum was the reason faculty felt a time crunch in a semester with limited
instructional time. Providing more homework and outside-of-class reading material was
suggested by two faculty. This type of feedback was actively used by the team to modify
the learning materials as they were tested (Russ-Eft & Preskill, 2009). In possible future
iterations of this learning material, the team is considering the inclusion of homework
material for the students that would involve completing laboratory experiments. As part
of a flexible design (Nikolova & Collis, 1998), ideas being considered include the
development of learning activities using materials that would be readily available to
108
students. This would prevent the issue of a student not having access to the more complex
materials that can only be attained at great cost to the student or in a laboratory setting.
As interview scripts were analyzed, one theme that emerged was the challenge to
change (Lane, 2007; Bareil, 2013), or the faculty’s willingness to implement this
material, but a lack of instructional time in an already full curriculum making it difficult
to accomplish. Faculty who were interviewed were enthusiastic about the material created
by the team, but felt that their curriculum was already full. Consequently, many felt they
did not have the time to devote to new material. Cheah, Chen and Ting (2005) suggest a
revamping as opposed to a prolonging of undergraduate and graduate programs of study
in civil engineering. Infusing this material into revamped undergraduate geotechnical
engineering material would be ideal but it would require the often-resisted revamping
where material is added but existing material is either reduced or eliminated (Cheah,
Chen and Ting, 2005). This may prove to be difficult as more universities look to
streamline their programs of study and lower the amount of credits required for
graduation (Severson, 2014).
Comparisons Across Phases of Implementation
In this section a comparison of student achievement will be discussed. This will
include student achievement on the Phase 1 baseline where no instructional material was
used, Phase 2 where one lecture module was provided to the faculty and Phase 3 where
faculty were provided with the entire unit of instructional material.
Across-phase student achievement findings and discussion. Student scores on
the 9-question quiz did fall in order, for the most part. Pretest scores were lower than the
baseline, although not statistically significantly, which makes sense because the students
109
in the baseline received some instruction in unsaturated soils in the regular geotechnical
engineering classes. However, since the differences were not statistically significant, this
could also be due to chance. Faculty in Phases 2 and 3 were asked to administer the
pretest prior to any instruction in unsaturated soils. Pretest scores were also lower than
posttest scores in Phases 2 and 3 where a pretest/posttest design was utilized, although
Phase 2’s difference was not statistically significant. The only inconsistency was the
student scores on Phase 1 were higher than the student posttest scores for Phase 2,
although the difference was not statistically significant. This is noted because the Phase 1
students received no instruction from the team-created lecture module on stress state
variables and Phase 2 did.
There were some learning gains in student scores in Phase 2 of implementation
from pretest to posttest with the implementation of only one module at the four
participating universities, however the learning gains were not statistically significant.
The learning materials were most effective in Phase 3 where the faculty were provided
the entire unit of instruction. Although some faculty chose not to teach the entire unit,
(one of the participating universities combined the two lecture modules and another chose
not to require the laboratory exercise) students showed statistically significant learning
gains in their scores at all three participating universities. This would suggest that the
students needed more instructional content than was provided in Phase 2. One
explanation could be that students needed the entire, or most of the learning content to
have an opportunity to succeed. The connections made between the two lecture modules,
the pre-laboratory lecture and laboratory activities could also explain why students in
Phase 3 performed significantly better on the posttest.
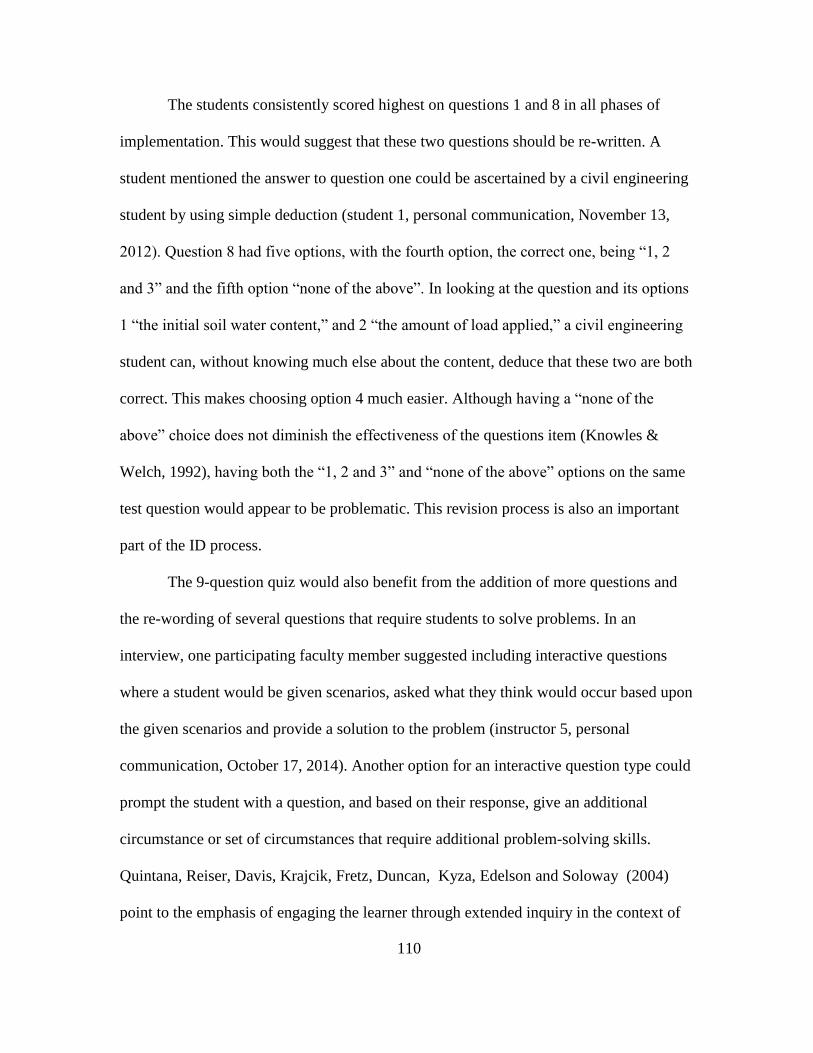
110
The students consistently scored highest on questions 1 and 8 in all phases of
implementation. This would suggest that these two questions should be re-written. A
student mentioned the answer to question one could be ascertained by a civil engineering
student by using simple deduction (student 1, personal communication, November 13,
2012). Question 8 had five options, with the fourth option, the correct one, being “1, 2
and 3” and the fifth option “none of the above”. In looking at the question and its options
1 “the initial soil water content,” and 2 “the amount of load applied,” a civil engineering
student can, without knowing much else about the content, deduce that these two are both
correct. This makes choosing option 4 much easier. Although having a “none of the
above” choice does not diminish the effectiveness of the questions item (Knowles &
Welch, 1992), having both the “1, 2 and 3” and “none of the above” options on the same
test question would appear to be problematic. This revision process is also an important
part of the ID process.
The 9-question quiz would also benefit from the addition of more questions and
the re-wording of several questions that require students to solve problems. In an
interview, one participating faculty member suggested including interactive questions
where a student would be given scenarios, asked what they think would occur based upon
the given scenarios and provide a solution to the problem (instructor 5, personal
communication, October 17, 2014). Another option for an interactive question type could
prompt the student with a question, and based on their response, give an additional
circumstance or set of circumstances that require additional problem-solving skills.
Quintana, Reiser, Davis, Krajcik, Fretz, Duncan, Kyza, Edelson and Soloway (2004)
point to the emphasis of engaging the learner through extended inquiry in the context of
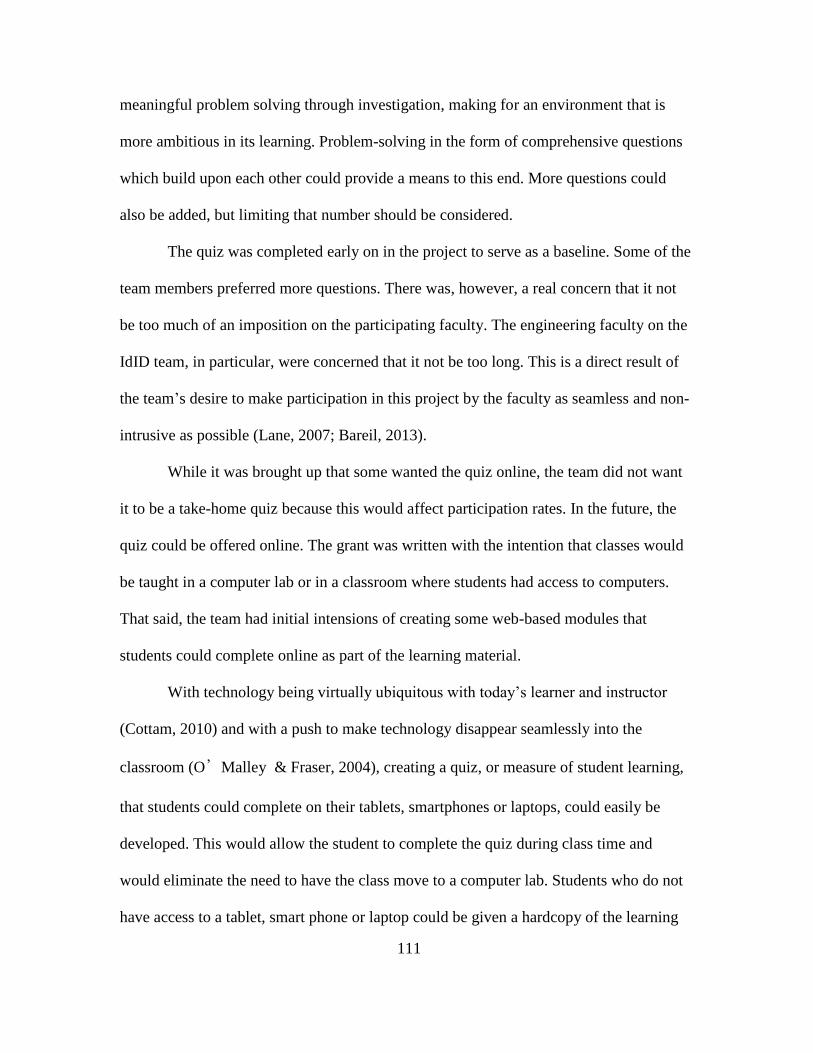
111
meaningful problem solving through investigation, making for an environment that is
more ambitious in its learning. Problem-solving in the form of comprehensive questions
which build upon each other could provide a means to this end. More questions could
also be added, but limiting that number should be considered.
The quiz was completed early on in the project to serve as a baseline. Some of the
team members preferred more questions. There was, however, a real concern that it not
be too much of an imposition on the participating faculty. The engineering faculty on the
IdID team, in particular, were concerned that it not be too long. This is a direct result of
the team’s desire to make participation in this project by the faculty as seamless and non-
intrusive as possible (Lane, 2007; Bareil, 2013).
While it was brought up that some wanted the quiz online, the team did not want
it to be a take-home quiz because this would affect participation rates. In the future, the
quiz could be offered online. The grant was written with the intention that classes would
be taught in a computer lab or in a classroom where students had access to computers.
That said, the team had initial intensions of creating some web-based modules that
students could complete online as part of the learning material.
With technology being virtually ubiquitous with today’s learner and instructor
(Cottam, 2010) and with a push to make technology disappear seamlessly into the
classroom (O’Malley & Fraser, 2004), creating a quiz, or measure of student learning,
that students could complete on their tablets, smartphones or laptops, could easily be
developed. This would allow the student to complete the quiz during class time and
would eliminate the need to have the class move to a computer lab. Students who do not
have access to a tablet, smart phone or laptop could be given a hardcopy of the learning
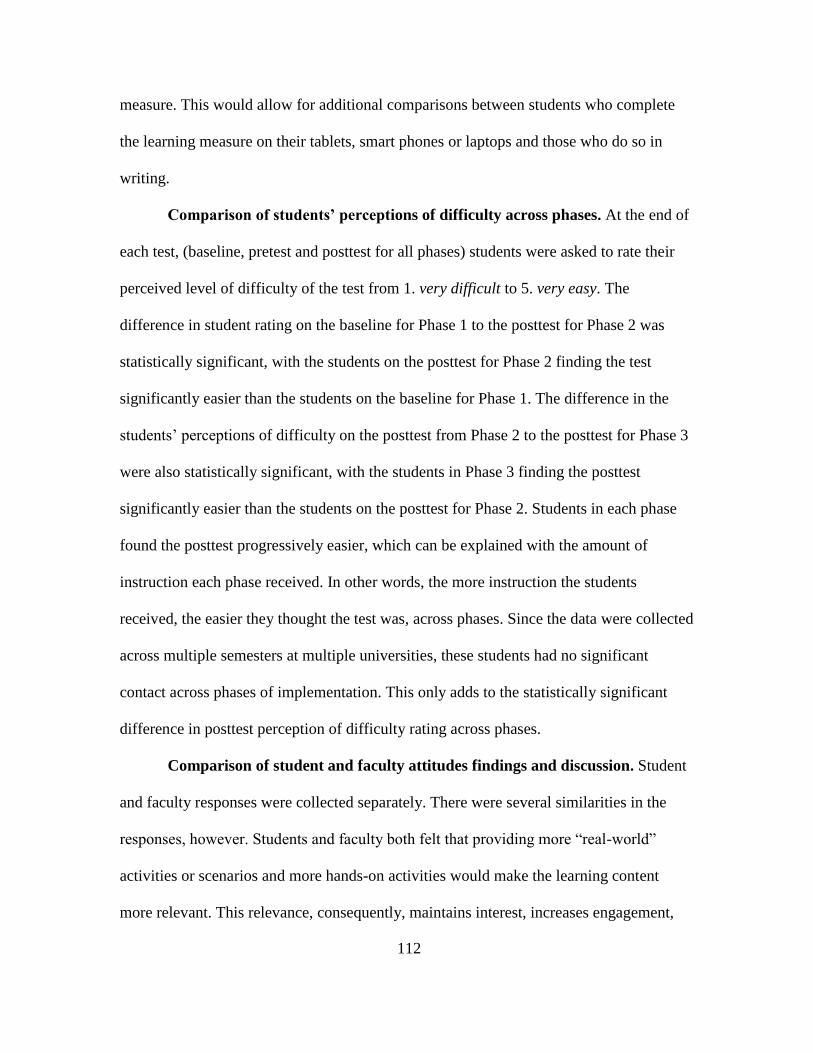
112
measure. This would allow for additional comparisons between students who complete
the learning measure on their tablets, smart phones or laptops and those who do so in
writing.
Comparison of students’ perceptions of difficulty across phases. At the end of
each test, (baseline, pretest and posttest for all phases) students were asked to rate their
perceived level of difficulty of the test from 1. very difficult to 5. very easy. The
difference in student rating on the baseline for Phase 1 to the posttest for Phase 2 was
statistically significant, with the students on the posttest for Phase 2 finding the test
significantly easier than the students on the baseline for Phase 1. The difference in the
students’ perceptions of difficulty on the posttest from Phase 2 to the posttest for Phase 3
were also statistically significant, with the students in Phase 3 finding the posttest
significantly easier than the students on the posttest for Phase 2. Students in each phase
found the posttest progressively easier, which can be explained with the amount of
instruction each phase received. In other words, the more instruction the students
received, the easier they thought the test was, across phases. Since the data were collected
across multiple semesters at multiple universities, these students had no significant
contact across phases of implementation. This only adds to the statistically significant
difference in posttest perception of difficulty rating across phases.
Comparison of student and faculty attitudes findings and discussion. Student
and faculty responses were collected separately. There were several similarities in the
responses, however. Students and faculty both felt that providing more “real-world”
activities or scenarios and more hands-on activities would make the learning content
more relevant. This relevance, consequently, maintains interest, increases engagement,
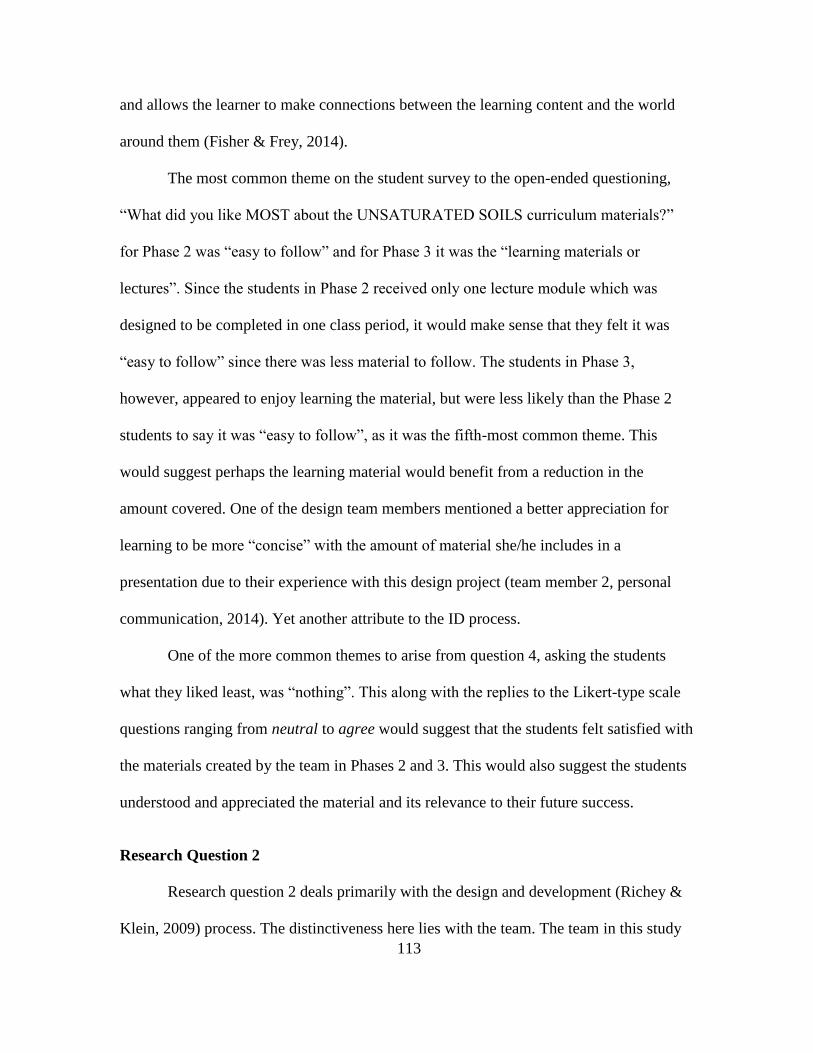
113
and allows the learner to make connections between the learning content and the world
around them (Fisher & Frey, 2014).
The most common theme on the student survey to the open-ended questioning,
“What did you like MOST about the UNSATURATED SOILS curriculum materials?”
for Phase 2 was “easy to follow” and for Phase 3 it was the “learning materials or
lectures”. Since the students in Phase 2 received only one lecture module which was
designed to be completed in one class period, it would make sense that they felt it was
“easy to follow” since there was less material to follow. The students in Phase 3,
however, appeared to enjoy learning the material, but were less likely than the Phase 2
students to say it was “easy to follow”, as it was the fifth-most common theme. This
would suggest perhaps the learning material would benefit from a reduction in the
amount covered. One of the design team members mentioned a better appreciation for
learning to be more “concise” with the amount of material she/he includes in a
presentation due to their experience with this design project (team member 2, personal
communication, 2014). Yet another attribute to the ID process.
One of the more common themes to arise from question 4, asking the students
what they liked least, was “nothing”. This along with the replies to the Likert-type scale
questions ranging from neutral to agree would suggest that the students felt satisfied with
the materials created by the team in Phases 2 and 3. This would also suggest the students
understood and appreciated the material and its relevance to their future success.
Research Question 2
Research question 2 deals primarily with the design and development (Richey &
Klein, 2009) process. The distinctiveness here lies with the team. The team in this study
114
included members of two disciplines, civil engineering and educational technology. This
interdisciplinary (Borrego & Newswander, 2008; Drezek, Olsen & Borrego, 2008)
instructional design (IdID; Ornelas, 2014) team collaborated to develop the learning
material for undergraduate civil engineering students with the added creativity that
having multiple disciplines offers (Cennamo & Vernon, 2012). This collaborative design
(Kwon, Wardrip & Gomez, 2014) yielded a complete instructional unit in unsaturated
soil mechanics.
There has been a major shift in higher education towards interdisciplinary degree
programs looking to explore topics beyond the boundaries of a traditional discipline
(Boden, Borrego & Newswander, 2011). Similarly, it was discovered with this IdID team
that exploring expertise and skills beyond the boundaries of one’s own expertise and
skills and learning from those experiences is a direct result of working with an
interdisciplinary team.
Team Interviews and Surveys; Team Meeting Notes and Design Log
In this section, findings for research question two, “When working with
interdisciplinary instructional design teams, what are the challenges, discussions and
decisions made that both assist and hinder the team’s progress? What are the best
methods for overcoming the challenges designers face when working with professionals
outside of their areas of expertise?” will be discussed. Discussions will include findings
from the IdID team interviews and a post-interview survey conducted by the researcher.
This section will also include discussions of findings from the IdID team meeting notes,
observation notes and a design log, both kept by the researcher.
115
IdID team interview findings and discussion. Six of the seven IdID team
members were interviewed and rated the three positive Likert-type scale questions
between agree and strongly agree, rating the question regarding the revision process as
helpful the highest. This would indicate that the team felt satisfied with the design
process. The team rated the question regarding their satisfaction for the materials created
by the team as the lowest. Although this question was rated as lowest, the team still rated
it between neutral and agree. This would also indicate that the team was satisfied with
the learning materials they created.
The one negative predisposition question (Albaum, 1997) was rated between
disagree and neutral. Since this question was worded with a negative predisposition, the
lower the rating, the more positive the team viewed the topic. This question asked if the
team members felt frustrated with the design process. Since the team’s rating as a whole
fell between disagree and neutral, this would indicate that the team’s frustration with the
ID process was minimal.
The team’s responses to the open-ended questions were categorized and coded by
question. When asked what was most frustrating about working with others outside of
their area of focus, communication was mentioned most often, indicating an improved
communication process should be considered. For example, one member mentioned long
e-mail chains. This was frustrating for some team members because long e-mail chains
were often difficult through which to navigate. This theme also appeared several times in
the design log. Time was lost, some data were missed and ideas from team members may
have been overlooked as a result of this.
116
When asked what the most rewarding part of working with others outside of their
area of focus was, the team’s most frequent response was learning new things from other
professionals outside of their area. There was also a general appreciation for the other’s
professional input into the project. Both would indicate that a new understanding of
another’s expertise and appreciation for the challenges the other faces were something the
team members took away from this experience (Little, Fallon, Dauenhauer, Balzano and
Halquist, 2010). Learning new things was also a common response to the question asking
what new ideas and strategies learned were the most helpful.
It is important to note that the team, in general, felt a little more positively
regarding members of their own area of focus. For instance, when asked what the most
frustrating part of working with those in your area of focus was, responses like “nothing”
or “it was a great experience” were common. This would indicate that there was a slightly
greater level of comfort when working with those who are familiar with their own
strategies, nomenclature and expertise.
IdID post-interview follow-up questions findings and discussion. Discussions
of several findings in the follow-up questions answered by the IdID team are presented in
this section. The team’s responses to the questions were mostly positive. For instance, of
the three negative predisposition questions (Albaum, 1997) asked, the team responded
between disagree and neither on two of them, which would indicate a positive response.
The one negative question the team did reply to between agree and neither asked if
working in the IdID process was “at times, taxing.”
For the 12 positive predisposition questions (Albaum, 1997), the team’s responses
all fell between agree and strongly agree. With the questions having a positive
117
predisposition and the team responding as they did, this would indicate that the team felt
very positively about the ID process, the IdID team and the materials created by the team.
All six team members responded strongly agree to two of the positive predisposition
questions, with both questions referring to the IdID team. Of the final 12 questions to
which the team replied, three questions had five of the six team members replying
strongly agree. The team had a more positive response to the questions on working with
an interdisciplinary team. This would indicate that the team enjoyed and appreciated the
make-up of this interdisciplinary team (Borrego & Newswander, 2008) and the value of
diversity, learning from others outside of your discipline (Little, et al., 2010) and the
creative edge the IdID team offers (Cennamo & Vernon, 2012).
An interesting discussion can be made regarding the team’s only negative
response and the two strongly agree responses. One would think that these two opposing
views would be on different topics, but as it turns out, they were all about the IdID team.
Although the team “strongly agreed” that working with others outside of their field of
expertise was both “rewarding” and made them “better professionals,” it was also, at
times, “taxing.”
Design log and IdID team meeting notes findings and discussion. A discussion
of the themes that emerged from the coding of the IdID team meeting notes and design
log are covered in this section. The most common theme discussed over the course of the
development of the learning materials in unsaturated soils was content. Since it was the
goal of the team to develop new learning materials, it only makes sense that this would be
the most common theme. On that same note, the second most common theme dealt with
the team discussing what materials to include and how to best implement the laboratory
118
exercises. If discussions regarding the development of learning materials (the most
common theme), what materials to include with the laboratory (the second-most common
theme) and laboratory equipment (the fifth-most common theme) were all subsumed
(Saldaña, 2012) under the theme of “Learning Content”, it would account for
approximately 46% of the discussions the team had in its meetings.
Another theme that was very common in meetings and in the design log was
collaboration with other faculty at both Arizona State and the other participating
universities. This finding works in conjunction with the team’s short-term goal of
implementing this new learning material at multiple universities and its long-term goal of
institutionalizing this new learning material. One final theme of importance was the
team’s goal of material flexibility (Nikolova & Collis, 1998). The team, from the
beginning, felt it was important to make this material as flexible and easy to infuse into
existing curriculum as possible. Discussions regarding what not to include in the learning
unit were just as important as those of what to include. There were also several
discussions on when to include materials. In other words, at what point in the semester or
at what point in the learning process would this new learning material “fit best”. Should it
be included before this topic was covered and after that one had been discussed? These
were conversations the team had on a regular basis.
Recommendations for IdID.
This section will discuss recommendations for instructional design and
interdisciplinary instructional design. These recommendations are the result of the review
and analysis of the data collected in this research study. This section will also offer
119
support for long-standing practices and models of instructional design (Dick, Carey and
Carey, 2009; Gagne, 1985).
Get rolling early on. A common theme arose from the design team interviews
that indicated the team would have benefitted from doing a couple of things differently
early on. First, the initial stages of learning material development would have been aided
by the establishment of team roles. A general consensus was found that time was lost in
the initial stages as the team established roles and developed collaborative skills with
members outside of their focus discipline. These skills included learning each other’s
terminology and practices. Secondly, the team members felt a better establishment of
work and responsibilities early on would have increased production. This would have
allowed each member to have a sense of accomplishment early on which may have led to
more productivity further into the project. One member of the team felt a bit “lost” at the
beginning of the process and also felt they were not contributing enough to eventual
success of the team and its goal of developing, testing, revising and eventually
institutionalizing this new learning material (team member 5, personal communication,
May 29, 2014). As the process progressed, this one team member expressed a better
feeling of accomplishment, but having that feeling earlier on may have improved their
productivity (team member 5, personal communication, May 29, 2014).
Have instructional designers provide guidance. To an instructional designer,
terms and phrases such as “learning objectives,” “learner characteristics,” “Bloom’s
taxonomy,” and “changing learner behavior” are familiar nomenclature to these
professionals. They are also aware of instructional system design (ISD) models such as
ADDIE, the Dick, Carey and Carey Systems Approach Model (2009), the Scaffolding
120
Design Framework (Quintana, et al., 2004) and the Backwards Course Design
(Davidovitch, 2013) or Reverse Design in Planning (Berman, 2014). These strategies,
however, may be unfamiliar to professionals outside of the field of instructional design.
The engineers had some familiarity with these ideas in general, but would have benefitted
from a review of some of these ideas in the initial stages of the design project.
For instance, Davidovitch (2013) points out that “constructing courses in a
backward design is based on the premise that teachers must clarify to students
unequivocally what they are expected to learn, do, and understand by the end of the
lecture or course" (pg. 329). This helps to answer the question, “Why are we studying
this?” For the purposes of this design project, using a Backwards Course Design
(Davidovitch, 2013) or Reverse Design in Planning (Berman, 2014) at the beginning
could have given the IdID team more focus moving forward. One IdID team member
pointed out that pushing for a learning objective or learner outcomes should be a priority
in future IdID projects (team member 6, personal communication, June 11, 2014). For
instance, when the students in Phase 2 rated the overall depth of knowledge as the highest
of the six Likert-type scale questions on the student survey, it would have been easier to
measure what “depth of knowledge” was covered if a learning objective had been
included in this and all learning modules. An instructional designer may consider this the
rule, but those outside of the field may not see the value of backwards course design or
learning objectives. On an IdID team where there is an instructional design expert, the
responsibility of the learning objective and providing the non-instructional design experts
guidance through the process falls on them. This is not to say that guidance was not
121
provided by the ID team members, only that there were some things that could have been
done differently.
Have subject matter experts provide guidance. To a civil engineer who
specializes in geotechnical engineering, phrases such as “pore air pressure”, “soil-water
characteristic curve”, “axis translation”, and “kilopascal” are nomenclature familiar to
these professionals. These terms and strategies, however, may be unfamiliar to
professionals outside of the field of civil engineering. The instructional designers on this
project, with a background primarily in education and educational technology, often felt
frustrated with learning material in geotechnical engineering. This frustration stemmed
primarily from a lack of background knowledge in civil and geotechnical engineering.
The civil engineers made valid attempts to teach this material to the non-engineering
members, but without the background knowledge in civil engineering, their efforts were
often a struggle. As the team progressed, however, the educational technology
professionals became more comfortable with the engineering material. A basic civil
engineering “crash course” in layman’s terms could provide the educational technology
professionals some confidence in approaching the more complex material. This would
also apply to any SME who find themselves working with an instructional designer who
is unfamiliar with the content they are helping to develop. Although the responsibility for
learning the basic tenants of the content lies with the instructional designer, the SME also
has a responsibility to help in this process.
Making the “Implicit Explicit.” There were several instances where the implicit
should have been explicit. One example can be found at the start of the process. As
explained earlier, establishing roles and responsibilities can provide the member of the
122
team guidance and a sense of accomplishment, (Ornelas, et al., 2013). Time was spent
establishing these roles and responsibilities. There was a general idea of team
responsibilities, but establishing more explicit roles would have been beneficial (Ornelas,
et al., 2013). One may argue that that is an explicit prerequisite to starting the IdID
process, but what may appear as inherently explicit may not always be.
Overcoming the challenge to change curriculum. Getz, Siegfried and Anderson
(1997) adhere to the premise that innovations that are adapted by an academic institution
help increase productivity, or intangibles such as intrinsic talents and behavioral changes
in the leaner (Gagne, 1985). Even when considering these advantages, resistance to
adding new learning material in academia is still an obstacle (Lane, 2007; Bareil, 2013).
Some of the findings in this study have pointed to this challenge to change. The team was
able to find partners, yet in the early stages, their attempts at introducing the material
were a challenge. Considering one of the team’s goals is the institutionalization of the
materials, these first roadblocks proved to be frustrating. Learning materials in
geotechnical engineering that date back decades, such as guidelines for the single
stress/effective stress concept for saturated soils introduced by Karl von Terzaghi (1936),
are still in use today. Although this material is relevant today, adding new material in
unsaturated soils would benefit the field since these guidelines are more cost effective,
safer and easier to attain (Fredlund, 2006; Houston, Zapata and Savenye, 2010).
Another issue instructional designers face is the mentality of professors,
instructors and teachers at all levels that their curriculum is fine as-is. Lane (2007) points
out academic centers with busy, conservative intellectuals often offer strong resistance to
change. Resistance to change in organizational development is viewed as a hindrance to
123
change in the organization and the number one reason for change failures (Bareil, 2013).
This presents an obstacle to instructional designers and other professionals in the field of
post-secondary education like the civil engineers on this team in their attempts to
improve the undergraduate civil engineering student’s repertoire upon completion of their
program of study. Although their intentions may be valid and other faculty may also see
the value of it, to the point they are enthusiastic, the challenge of changing, or revamping
(Cheah, Chen and Ting 2005) curriculum at levels of learning from the Kindergarten
teacher to doctoral-level learning still exist.
The paradox of learning new material and technology. It was revealed in the
interviews with the IdID team members who were working with those outside of their
area of expertise that the experience was both frustrating and rewarding, paradoxically
enough, often with the same thing. One team member expressed both a sense of reward
and one of frustration in learning new material. It was pointed out that learning new
material in geotechnical engineering offered an opportunity to “sound smart at a party”
(team member 1, personal communication, May 28, 2014), yet learning new material was
also frustrating, given the often steep learning curve. Another team member expressed
both frustration and reward when discussing the process of learning a new tool; Google
drive. It was frustrating because updated drafts didn’t always seem to work but it was
also a rewarding tool to learn because in the early stages it allowed for more
collaboration and it saved work as the team created, collaborated on and edited a
document.
Working with those within versus outside of your area of focus. During the
IdID team interviews, the responses to questions designed to elicit attitudes about
124
working with professionals within their field had a slightly more positive response pitch
than those designed to elicit attitudes when working with professionals outside of their
field. The team, for the most part, had a positive attitude towards each other coupled with
a mutual respect for each other’s talents and academic and professional expertise within
their own field (Borrego & Newswander, 2008), as indicated by their responses to the
follow-up questions conducted after the interviews. It was interesting to note, however
that engineers were slightly more positive when discussing other engineers. This was also
the case with the educational technology professionals.
This study revealed some levels of frustration brought on by working across
disciplines, in contrast with studies like the one conducted by Little, et al. (2010), where
there was a reduction in frustration, due in part to the interdisciplinary process. However,
an increased feeling of success the IdID team in this study felt due in large part to the
interdisciplinary nature of the team should also be noted, similar to the Little, et al.
(2010) study. Similarly, Little, et al. (2010) saw the interdisciplinary process benefit the
participants through simple empathy. A better understanding of each other’s discipline
was another positive outcome of the interdisciplinary collaboration of this team (Borrego
& Newswander, 2008). On this IdID team, one saw how the other conducted business.
Considering the 21st century learner. Morrison, Ross and Kemp (2004) discuss
the importance of analyzing learner characteristics and context in instructional design.
The team did have the students in mind while the learning material was being developed.
However, while analyzing the meeting notes and researcher-kept design log as well as
student feedback, more attention to the learner characteristics and context would benefit
this and future studies. Students wanted more hands-on learning and today’s students
125
display a characteristic comfort with the technology. 21st century learners have smart
phones, tablets and laptops, and are more familiar with technology than even some of
their professors. Cottam (2010) points out “the ubiquity of multimedia language learning
resources online is something that students and instructors have come to expect” (p. 72).
If learners and instructors have come to expect it, then instructional designers should
utilize this with technology-infused learning materials that are learner friendly. Helfrich
(2014) points out schools in her district employ a BYOD, or bring your own device,
policy for their students. This provides for the flexibility (Nikolova & Collis, 1998) the
21st century learner and instructor are looking for. Future studies and instructional design
projects would benefit greatly if more emphasis were placed on hands-on learning and
technology-infused activities that offer this flexibility. Infusing more technology would
go along with the Hussin, Bunyarit, and Hussein (2009) study that discussed the positive
perceptions students have towards e-learning.
At the beginning of any instructional design project, more in-depth analysis of the
learner would greatly benefit the design of the instructional material (Morrison, Ross &
Kemp, 2004). Although the learners in this study displayed the general characteristics of
the undergraduate civil engineering major with one to three years of completed
undergraduate work, these students also displayed characteristics of the 21st century
learner.
Challenges, Discussions, Decisions and Best Methods of the IdID Process.
The second part of research question two asks what the challenges, discussions
and decisions made by the IdID team that help and hinder the process are and what are
126
some of the best methods for overcoming these. This section will discuss the findings in
regard to these topics.
Decisions that helped the IdID process. Several decisions were made during the
development of the learning material that helped the team to progress through the design
process. The team’s decision to use Google drive as a collaborative tool helped the team
to share ideas and begin the development of the learning material. This collaborative tool
helped the team in the early stages of idea sharing and material development. One of the
engineering team members mentioned the usefulness of the tool, going on to say she/he
used this tool in other areas of her/his professional endeavors (team member 4, personal
communication, May 28, 2014). The decision to use PowerPoint also helped with the
design process since all the team members were comfortable with this tool. This comfort
with the tool increased confidence that one was dealing with something of which they
were familiar. PowerPoint also proved to be effective since the participating faculty were
also familiar with this presentation tool.
Decisions that hindered the IdID process. Several decisions were made by the
team that hindered the IdID process. For instance, the team’s decision to use Google
drive as a collaborative tool did slow the process of developing the learning materials.
Ironically enough, this decision served as both and aid and an obstacle to the team. The
tool caused frustration for some team members because, as the development of the
material progressed, the tool at times did not save comments left by team members.
Two of the instructional designers were also slowed by compatibility issues with
the operating systems (OS). During the creation of the first presentation, fonts, text sizes
127
and image placements kept changing because one of the designers used a Macintosh-
based OS while the second used a Windows-based OS.
A third hindrance resulted from the team’s decision as to where the responsibility
lay for the initial writing of the material. As the team progressed through the design
process, it established a better method of creating materials, but the initial process was
slow. In an interview, one team member also pointed to the long e-mail chains the team
often used and how navigating through them was often difficult and frustrating (team
member 1, personal communication, May 28, 2014).
As mentioned earlier in this study, some of the instructional designers felt that the
inclusion of more learning objectives early on would have provided more direction for
the team. As is turns out, having learning objectives would have made the process of
evaluating the materials more effective, as well. Not initiating roles at the beginning also
slowed the IdID process and the development of the material.
Best methods for IdID. Borrego and Newswander (2008) point out that
“successful interdisciplinary research is the result of an open approach to learning and
valuing other disciplinary perspectives” (pg. 124). This also applies to a successful
interdisciplinary team. One “best method” that really helped this team work through
issues and concerns in the IdID process was that of mutual respect. As was revealed in
the team interviews and the post-interview questions, team members felt their opinions
were valued, for the most part. There were occasions when an opinion may have been
overlooked, but overall, there was a respect for the value of each team member and the
strengths they brought to the team. Each member contributed and that feeling of
accomplishment that helped the team move forward (Ornelas, et al., 2013).
128
Conclusion
The goal of this design and development study was to follow the interdisciplinary
instructional design (IdID) process. Strengths and weaknesses in the study and the design
project arose from the feedback received from the students, participating faculty and the
IdID team.
Strengths of the design study. Strengths of this design study include an insight
into what worked and what did not regarding IdID. Observing and analyzing the team’s
makeup worked well. Having both professionals from civil engineering and educational
technology gave the study an added insight into how individuals with different
backgrounds make decisions and collaborate (Borrego & Newswander, 2008; Kwon,
Wardrip & Gomez, 2014; Little, et al., 2010). The members of the team each had valid
input in the learning material, what tools to use and how to successfully implement,
evaluate (Russ-Eft & Preskill, 2009) and revise them. Getting an insight into what roles
past experiences of each team member played in the design process was also invaluable.
The vast and varied background each team member brought to the table and the study’s
participation in that, led to better data results in the field to which this study adds.
Weaknesses of the design study. Although this design study followed the
process of the IdID team from the beginning stages of the design process through the
pilot testing of the learning unit, the researcher had no part in the grant proposal process.
This experience would have been beneficial to this study in that it would have given it a
better insight into a design project from its very beginnings. Another weakness involves
the end of the project. Although this study did follow the process through the pilot testing
129
of the entire module, it did not follow proposed iterations of the learning unit and
subsequent evaluations of said unit.
Strengths of the design project. Strengths in the design project range from the
learning material developed by the team to the effectiveness of the material created.
Students and faculty were pleased with the learning material, for the most part. Feedback
supported what the team had created and both faculty and students felt the material was
important enough to teach and learn, respectively. The evaluation of the learning material
as a whole produced statistically significant learning gains from pretest to posttest, with a
large effect size to support the students’ gains.
Weaknesses of the design project. The design project did have some weaknesses
as well. Although the students in Phase 3 did show statistically significant grow when the
participating faculty had access to the entire learning unit, the overall mean on the 9-
question posttest of 6.03 (SD = 1.76) was not as high as the team would have preferred.
A mean closer to 9 would have been ideal. Also, the design project would benefit from
future tests of its material to confirm its effectiveness and help to improve future
iterations of the learning materials, as only one pilot test of the full learning unit was
conducted for this study.
Implications
Implications for instructional design. This study, like many before it, was a
testament to the instructional design models established by Gagne (1985), Dick, Carey
and Carey (2009), Plomp & Nieveen, (2007), Richey and Klein (2009) and the
importance of these models to the successful creation of instructional materials. One
point of emphasis this study provided was the importance of establishing learning
130
objectives, such as those first introduced by Bloom and Krathwohl (1956) and reinforced
and revised by others like Krathwohl (2002). It goes without saying that student learning
outcomes should be one of the primary focal points of instructional design from
beginning to end.
Implications for interdisciplinary instructional design (IdID). This study
offered an insight to interdisciplinary instructional design (IdID, Ornelas, 2014). As a
team that had experts in the field of education and engineering, they drew from each
other’s strengths. This team truly epitomized the term “interdisciplinary” (Borrego &
Newswander, 2008; Drezek, Olsen & Borrego, 2008) as all members of the team
contributed at an equal level of expertise. No one member on the team had “all the
answers” and the team was stronger because of its diversity. The creative edge (Cennamo
& Vernon, 2012) an interdisciplinary team provides is undeniably advantageous, and it
was evident with this team. Another aspect of the IdID team that is an advantage is NSF’s
willingness to prioritize grant proposals that include the IdID component (National
Science Foundation, 2002).
Implications for instructional design in engineering. The team worked well
together due to the mutual respect all members had for each other (Borrego &
Newswander, 2008). The team felt they were working toward one common goal, and that
was the successful development and testing of new learning materials in unsaturated soils
for undergraduate civil engineering students. In one of the interviews, a team member
pointed out that this team had a uniqueness to it. This uniqueness centered on the added
responsibilities of the research assistants (RAs). This team member pointed out that they
had not worked on a team where the RAs were given these added responsibilities and that
131
the RA’s opinion was valued by the team (team member 6, personal communication,
May 29, 2014). This was a testament to both the mutual respect the team had for each
member (Borrego & Newswander, 2008) and the PI and Co-PIs’ willingness to listen.
Limitations
For Phase 3 of implementation, the participating faculty members were provided
with the entire instructional unit in unsaturated soils, to include the two lecture modules,
the pre-laboratory lecture module and the two laboratory exercises. However, this did not
guarantee that the entire unit would be presented to the students. This turned out to be the
case with two of the three participating institutions. Faculty at one institution did not, for
instance, require their students to complete the laboratory activity. Faculty at another
university took two lecture modules and combined them into one. One of the instructors
had more experience with the material because of his/her involvement in more than one
phase of implementation. This familiarity with the material may have skewed results
somewhat. Although the students, in general, shared the same student demographic,
undergraduate civil engineering majors, their backgrounds and experiences varied
widely. If a duplication of this study is attempted, student demographics that are a little
more similar should be considered.
Another limitation involved the implementation process. The team created the
material with the intent that the participating faculty would give their students the pretest
prior to the instruction of any unsaturated soils material. Although the team requested it,
there was no guarantee that the faculty would do so. Also, the team asked that the
students be given the pretest, then the learning material and the posttest, but there was no
way to guarantee that the time between pretest, learning material and posttest was
132
uniform across the three universities. In future duplications of this study, it would be
advantageous to the outcome of the results if there were more uniformity in the study. For
instance, it would be ideal to include in the grant the funding of a graduate student at each
university with the primary responsibility of coordination with the graduate students at
the other participating universities to better insure the proper implementation of the
material: pretest to learning intervention to posttest with no prior instruction in
unsaturated soils.
Future Research.
As the field of design and development research continues, and more specifically
interdisciplinary instructional design (IdID) research, studies like this one become more
necessary to the overall development of the field. It can be said in all fields of education
that more research is still needed, but this rings particularly true in the field of IdID. More
research is necessary to investigate and refine design processes during the initial stages of
the design of instruction, ideas that carry the team through the project, strategies used to
create, plan, pilot test and evaluate the material and subsequent iterations and evaluation
of the material. Steps should be created that include the most effective way to get an IdID
team through the ID process. A summary of suggestions for the IdID process can be
found in Table 32.
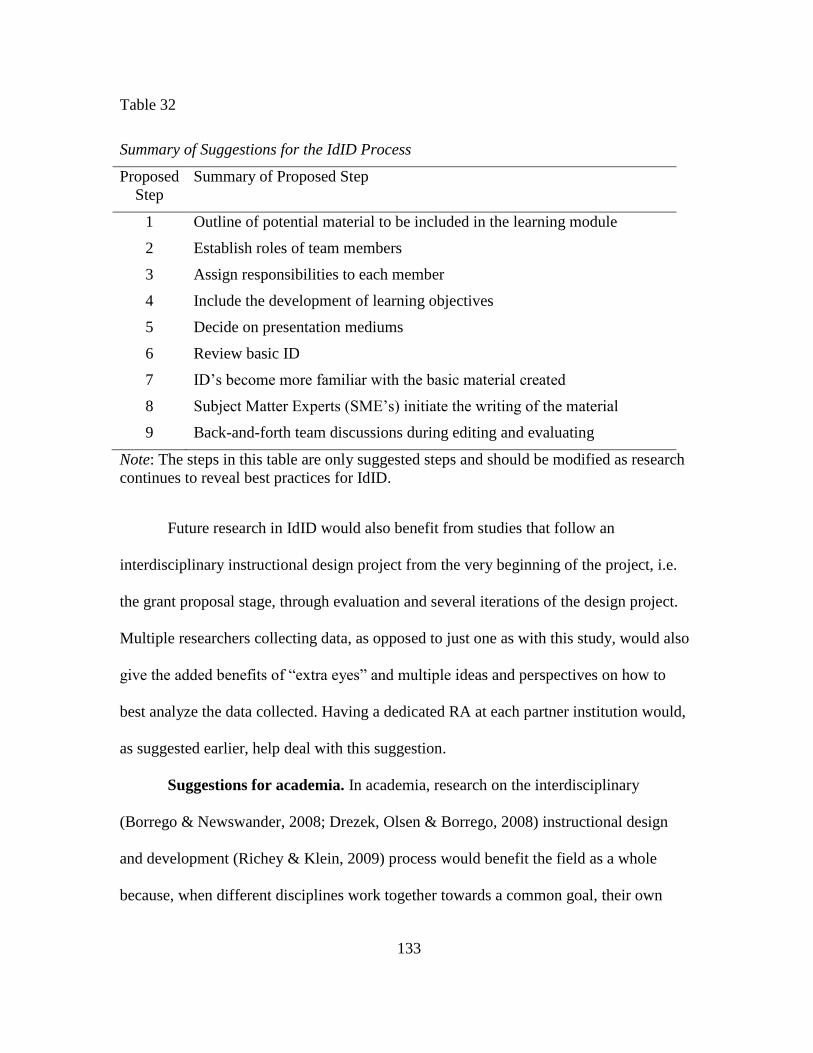
133
Table 32
Summary of Suggestions for the IdID Process
Proposed
Step
Summary of Proposed Step
1 Outline of potential material to be included in the learning module
2 Establish roles of team members
3 Assign responsibilities to each member
4 Include the development of learning objectives
5 Decide on presentation mediums
6 Review basic ID
7 ID’s become more familiar with the basic material created
8 Subject Matter Experts (SME’s) initiate the writing of the material
9 Back-and-forth team discussions during editing and evaluating
Note: The steps in this table are only suggested steps and should be modified as research
continues to reveal best practices for IdID.
Future research in IdID would also benefit from studies that follow an
interdisciplinary instructional design project from the very beginning of the project, i.e.
the grant proposal stage, through evaluation and several iterations of the design project.
Multiple researchers collecting data, as opposed to just one as with this study, would also
give the added benefits of “extra eyes” and multiple ideas and perspectives on how to
best analyze the data collected. Having a dedicated RA at each partner institution would,
as suggested earlier, help deal with this suggestion.
Suggestions for academia. In academia, research on the interdisciplinary
(Borrego & Newswander, 2008; Drezek, Olsen & Borrego, 2008) instructional design
and development (Richey & Klein, 2009) process would benefit the field as a whole
because, when different disciplines work together towards a common goal, their own
134
experiences and expertise add a creative edge (Cennamo & Vernon, 2012) and value to
the project. IdID as a field would benefit from more studies similar to this one because
the research available on IdID is still limited. A search on interdisciplinary instructional
design yields many studies on interdisciplinary programs of study, but few on
interdisciplinary instructional design and IdID teams.
Summary
This study supported the importance of providing students a complete curriculum
of instruction, as was evidenced by the success of students who were given additional
instructional material versus the lack of success by the students who were only provided a
portion of it. It also supported the notions of Cennamo & Vernon (2012) that having
multiple disciplines working on the same team adds value and creativity to the product.
The satisfaction the team felt with the product (Ornelas, et al., 2013) it created also added
to a desire to carry the project on to the next phase of implementation. The team has
already discussed a follow-up grant proposal that would allow for a continuation of the
goal originally stated in the grant proposal for “the development, piloting, dissemination,
and institutionalization of lecture and laboratory modules for educating undergraduate
students in the basic principles of unsaturated soils theory and the demonstration of these
principles to problems of performance of structural foundation systems” (Houston,
Savenye & Zapata, 2010, pg. 1). This study provided an essential insight into the make-
up, workings and value of the instructional design process and interdisciplinary
instructional design teams. Future instructional design teams would benefit from the
diversity and creativity the “interdisciplinary” nature of the IdID team offers.
135
REFERENCES
Albaum, G. (1997). The Likert scale revisited: An alternate version. Market Research
Society. Journal of the Market Research Society, 39(2), 331-348. Retrieved from
http://login.ezproxy1.lib.asu.edu/login?url=http://search.proquest.com/docview/2
14812847?accountid=4485
American Society of Civil Engineers. (1996). What is civil engineering? In American
Society of Civil Engineers. Retrieved. July 2013. From
http://www.asce.org/What-Is-Civil-Engineering-/.
American Society of Engineering Education. (2013) The organization: Who we
are. American Society of Engineering Education. Retrieved July 2013. From
http://www.asee.org/about-us/the-organization.
Barab, S. & Squire, K. (2004). Design-based research: putting a stake in the ground.
Journal of the Learning Sciences 13(1), 1-14.
Bareil, C. (2013). Two Paradigms about Resistance to Change. Organization
Development Journal, 31(3). 59-71.
Berman, A. S. (2014). Reverse Design in Lesson Planning. Teaching Music, 22(1), 60.
Bloom, B. S., & Krathwohl, D. R. (1956). Taxonomy of educational objectives: The
classification of educational goals. Handbook I: Cognitive domain.
Boden, D., & Borrego, M. (2011). Academic departments and related organizational
barriers to interdisciplinary research. Higher Education in Review, 8, 41-64.
Boden, D., Borrego, M., & Newswander, L., K, (2011). Student socialization in
interdisciplinary doctoral education. Higher Education 62 (6), 741-755.
Borrego, M., & Newswander, L., K. (2008). Characteristics of successful cross-
disciplinary engineering education collaboration. Journal of Engineering
Education, 97 (2), 123-134.
Brown, J. S., Collins, A., & Duguid, P. (1989). Situated cognition and the culture of
learning. Educational researcher, 18(1), 32-42.
Cennamo, K. (2014). In Education We All Want to Be Nice: Lessons Learned from a
Multidisciplinary Design Studio. In Design in Educational Technology (pp. 57-
73). Springer International Publishing.
Cheah, C. Y., Chen, P. H., & Ting, S. K. (2005). Globalization challenges, legacies, and
civil engineering curriculum reform. Journal of Professional Issues in
Engineering Education and Practice, 131(2), 105-110.
136
Cottam, M. E. (2010). The Effects of Visual and Textual Annotations on Spanish
Listening Comprehension, Vocabulary Acquisition and Cognitive (Unpublished
doctoral dissertation). Arizona State University, Tempe, AZ.
Davidovitch, N. (2013). Learning-centered teaching and backward course design - from
transferring knowledge to teaching skills. Journal of International Education
Research, 9(4), 329. Retrieved from
http://login.ezproxy1.lib.asu.edu/login?url=http://search.proquest.com/docview/1
442472283?accountid=4485
Davis, R. H., Alexander, L. T., & Yelon, S. L. (1974). Learning system design: An
approach to the improvement of instruction. New York: McGraw-Hill.
Design-Based Research Collective, The. (2003) Design-based research: An emerging
paradigm for educational inquiry. Educational Researcher, 32 (1), 5-8.
Dick, W., Carey, L., & Carey, J. O. (2009). The systematic design of instruction. Upper
Saddle River, NJ: Merrill/Pearson, 2009. Print.
Drezek, K. M., Olsen, D., & Borrego, M. (2008, October). Crossing disciplinary borders:
A new approach to preparing students for interdisciplinary research. In Frontiers
in Education Conference, 2008. FIE 2008. 38th Annual (pp. F4F-1-6). IEEE.
Fisher, D., & Frey, N. (2014). Designing Relevant Learning. Educational Leadership,
72(1), 77-78.
Fredlund, D. G. (2006). Unsaturated soil mechanics in engineering practice. Journal of
geotechnical and geoenvironmental engineering, 132(3), 286-321.
Fredlund, D. G., & Rahardjo, H. (1993). Soil mechanics for unsaturated soils. John
Wiley & Sons.
Gandel, C. "Revamped Engineering Programs Emphasize Real-World Problem
Solving." U.S.News & World Report, 14 Mar. 2013. Web. 24 July 2013.
Gagne, R. M. (1985). The conditions of learning and theory of instruction. Belmont, CA:
Wadsworth Publishing Company.
Getz, M., Siegfried, J. J., & Anderson, K. H. (1997). Adoption of innovations in higher
education. The Quarterly Review of Economics and Finance, 37(3), 605-631.
Helfrich, J. (2014). Creative Spaces: Flexible Environments for the 21st-Century Learner.
Knowledge Quest, 42(5), 76-77.
Houston, S., Zapata, C., & Savenye, W. S., (2010) Advancement of unsaturated soils
theory into the undergraduate civil engineering curriculum, National Science
Foundation Award ID: 1044012, Arizona State University, Tempe, AZ.
137
Houston, S., Zapata, C., Ornelas, A., Sadauskus, J., Savenye, W., Jarrett, R., & Ramirez,
E., (2012). Pre Student Survey. Retrieved from National Science Foundation
Award #1044012.
Houston, S., Zapata, C., Ornelas, A., Sadauskus, J., Savenye, W., Jarrett, R., & Ramirez,
E., (2012). Post Student Survey. Retrieved from National Science Foundation
Award #1044012.
Hussin, H., Bunyarit, F., & Hussein, R. (2009). Instructional design and e-learning:
Examining learners' perspective in Malaysian institutions of higher learning.
Campus-Wide Information Systems, 26(1), 4-19.
Johnson, W. G. (2008). Anna Verona Dorris and the Visual Instruction Movement.
TechTrends, 52 (4), 51.
Knowles, S. L., & Welch, C. A. (1992). A Meta-Analytic Review of Item Discrimination
and Difficulty in Multiple-Choice Items Using" None-Of-The-Above".
Educational and psychological measurement, 52(3), 571-577.
Krathwohl, D. R. (2002). A revision of Bloom's taxonomy: An overview. Theory into
practice, 41(4), 212-218.
Kulas, J. T., Stachowski, A. A., & Haynes, B. A. (2008). Middle response functioning in
Likert-responses to personality items. Journal of Business and Psychology, 22(3),
251-259.
Kwon, S. M., Wardrip, P. S., & Gomez, L. M. (2014). Co-design of interdisciplinary
projects as a mechanism for school capacity growth. Improving Schools, 17(1),
54-71.
Lane, I. F. (2007). Change in higher education: Understanding and responding to
individual and organizational resistance. Journal of Veterinary Medical
Education, 34(2), 85-92.
Likert, Rensis (1932). A technique for the measurement of attitudes. Archives of
Psychology 140: 1–55.
Little, J. J., Fallon, M., Dauenhauer, J., Balzano, B., & Halquist, D. (2010).
Interdisciplinary collaboration: A faculty learning community creates a
comprehensive LibGuide. Reference Services Review, 38(3), 431-444.
Morrison, G. R., Ross, S. M., Kemp, J. E., & Kalman, H. (2010). Designing effective
instruction. John Wiley & Sons.
National Science Foundation. Research Areas FY 2002-2013. Arlington, VA: NSF. Web.
07 Aug. 2013.
138
National Science Foundation (2002). National science foundation investing in America’s
future strategic plan FY 2006-2011. Arlington, VA: NSF
Nikolova, I., & Collis, B. (1998). Flexible learning and design of instruction. British
Journal of Educational Technology, 29(1), 59-72.
O’Malley, C. & Fraser, D. S. (2004). Literature review in learning with tangible
technologies (Report 12). Bristol, England: Nesta Futurelab Series.
Oh, E. & Reeves, T. C. (2010). The implications of the differences between design
research and instructional systems design for educational technology researchers
and practitioners. Educational Media International. 47 (4), 263-275.
Ornelas, A., (2013). Faculty Interview Protocol. Retrieved from National Science
Foundation Award #1044012.
Ornelas, A., (2014). What is Interdisciplinary Instructional Design or IdID? Unpublished
manuscript, Department of Educational Technology, Arizona State University,
Tempe, AZ.
Ornelas, A., Savenye, W., Sadauskas, J. D., Houston, S., Zapata, C., & Ramirez, E.
(2013). An engineering and educational technology team approach to introducing
new unsaturated soil mechanics material into introductory undergraduate
geotechnical engineering courses: Cross-curricular coordination and working
outside of your comfort zone. In Proceedings of the 120th
ASEE Annual
Conference and Exposition, held in Atlanta, GA, June 23 - 26, 2013.
Plomp, T., & Nieveen, N. (2007). An introduction to educational design
research. Educational design research: An introduction. Enschede, the
Netherlands: Netherlands Institute for Curriculum Development.
Plomp, T. & Nieveen, N. (2013). Educational design research. Enschede, the
Netherlands: Netherlands Institute for Curriculum Development.
Quintana, C., Reiser, B. J., Davis, E. A., Krajcik, J., Fretz, E., Duncan, R. G., Kyza, E.,
Edelson, D. and Soloway, E. (2004) A scaffolding design framework for software
to support science inquiry. The Journal of the Learning Sciences, 13 (3), 337-386.
Reeves, T. (2000). Enhancing the worth of instructional technology research through
“design experiments” and other developmental strategies. Retrieved Oct 20,
2006.From http://it.coe.uga.edu/~treeves/AERA2000Reeves.pdf
Reiser, R. A. (2001). A history of instructional design and technology: Part I: A history
of instructional design media. Educational Technology Research and
Development, 49 (1), 58-64.
139
Richey, R. C. (1997). Agenda-Building and Its Implications for Theory Construction in
Instructional Technology. Educational Technology, 37(1), 5-11.
Richey, R. C., & Klein, J. D. (2009). Design and development research: Methods,
strategies, and issues. Routledge.
Russ-Eft, D. F., & Preskill, H. S. (2009). Evaluation in Organizations: A Systematic
Approach to Enhancing Learning, Performance, and Change. New York: Basic.
Print.
Saldaña, J. (2012). The coding manual for qualitative researchers (No. 14). Sage.
Savenye, W., (2012). Unsaturated soils formative evaluation post survey – Instructors.
Retrieved from National Science Foundation Award #1044012.
Savenye, W., Houston, S., Zapata, C., Ornelas, A., Sadauskus, J., Jarrett, R., & Ramirez,
E., (2012). Unsaturated soils follow-up attitude survey – students. Retrieved from
National Science Foundation Award #1044012.
Severson, A. (2014, November 29). Three NMSU regents to vacate positions in
December. Las Cruces Sun-News, pp. A1, A3.
Smith, P. L., & Ragan, T. J. (1999). Instructional design. Upper Saddle River, New
Jersey: Merrill.
Strauss, A. L. (1990). Systematic Coding in Qualitative Research. Bulletin de
Méthodologie Sociologique, 27(1), 52-62.
Takaya, K. (2009). How to Develop Students' Imaginations. Journal Of Educational
Thought, 43(1), 79-86.
Towne, L., & Shavelson, R. J. (Eds.). (2002). Scientific research in education. National
Academies Press.
Winn, G. N. (2006). Design and Development of Train-the-trainer Instruction for Subject
Matter Experts Using Intranet-based Interactive Multimedia (Unpublished
doctoral dissertation). Illinois State University, Normal, IL.
Winn, W. (1995). Instructional Design and Situated Learning: Paradox or Partnership. In
B. B. Seels (Ed.), Instructional Design Fundamentals: A Reconsideration (pp.
159-169). Englewood Cliffs, NJ: Educational Technology Publications.
Wiseheart, Melody. Effect Size Calculator. Melody Wiseheart, 2013. Web. 28 July 2014.

140
Van den Akker, J. (1999). Principles and methods of development research. In J. van den
Akker, R. M. Branch, K. Gustafson. N. Nieveen, & T. Plomp (Eds), Design
approaches and tools in education and training. Boston: Kluwer Academic, 1-14.
Yoder, B. L. (2012). Engineering by the Numbers. American Society for Engineering
Education, Washington, DC. http://www. asee. org/papers-and-
publications/publications/collegeprofiles/2011-profile-engineering-statistics.pdf.

141
APPENDIX A
PRE STUDENT CONSENT LETTER AND TEST
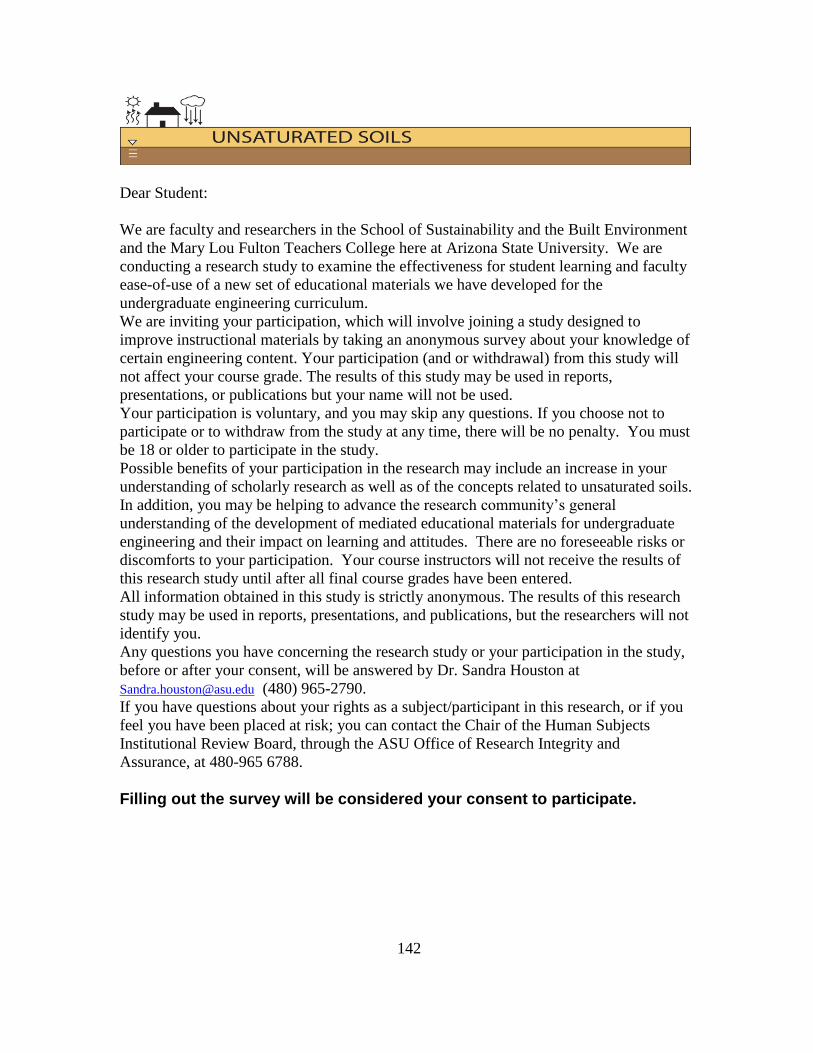
142
Dear Student:
We are faculty and researchers in the School of Sustainability and the Built Environment
and the Mary Lou Fulton Teachers College here at Arizona State University. We are
conducting a research study to examine the effectiveness for student learning and faculty
ease-of-use of a new set of educational materials we have developed for the
undergraduate engineering curriculum.
We are inviting your participation, which will involve joining a study designed to
improve instructional materials by taking an anonymous survey about your knowledge of
certain engineering content. Your participation (and or withdrawal) from this study will
not affect your course grade. The results of this study may be used in reports,
presentations, or publications but your name will not be used.
Your participation is voluntary, and you may skip any questions. If you choose not to
participate or to withdraw from the study at any time, there will be no penalty. You must
be 18 or older to participate in the study.
Possible benefits of your participation in the research may include an increase in your
understanding of scholarly research as well as of the concepts related to unsaturated soils.
In addition, you may be helping to advance the research community’s general
understanding of the development of mediated educational materials for undergraduate
engineering and their impact on learning and attitudes. There are no foreseeable risks or
discomforts to your participation. Your course instructors will not receive the results of
this research study until after all final course grades have been entered.
All information obtained in this study is strictly anonymous. The results of this research
study may be used in reports, presentations, and publications, but the researchers will not
identify you.
Any questions you have concerning the research study or your participation in the study,
before or after your consent, will be answered by Dr. Sandra Houston at
[email protected] (480) 965-2790.
If you have questions about your rights as a subject/participant in this research, or if you
feel you have been placed at risk; you can contact the Chair of the Human Subjects
Institutional Review Board, through the ASU Office of Research Integrity and
Assurance, at 480-965 6788.
Filling out the survey will be considered your consent to participate.
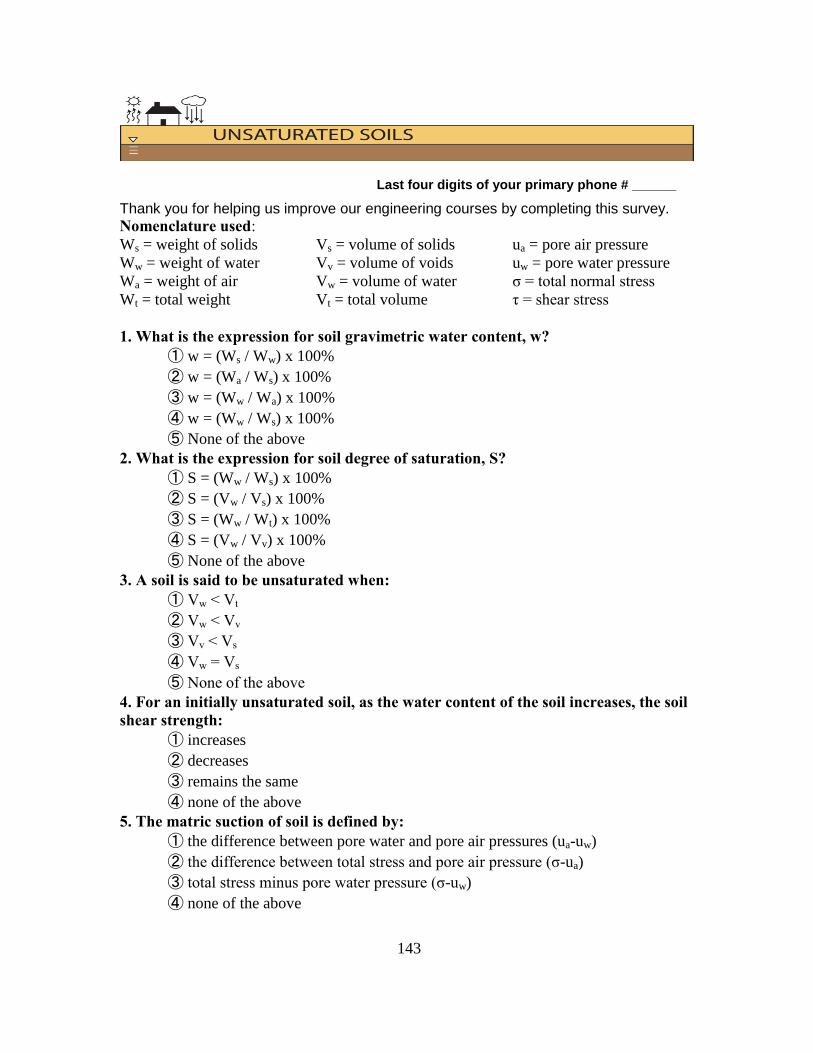
143
Last four digits of your primary phone # ______
Thank you for helping us improve our engineering courses by completing this survey.
Nomenclature used:
Ws = weight of solids Vs = volume of solids ua = pore air pressure
Ww = weight of water Vv = volume of voids uw = pore water pressure
Wa = weight of air Vw = volume of water σ = total normal stress
Wt = total weight Vt = total volume τ = shear stress
1. What is the expression for soil gravimetric water content, w?
➀ w = (Ws / Ww) x 100%
➁ w = (Wa / Ws) x 100%
➂ w = (Ww / Wa) x 100%
➃ w = (Ww / Ws) x 100%
➄ None of the above
2. What is the expression for soil degree of saturation, S?
➀ S = (Ww / Ws) x 100%
➁ S = (Vw / Vs) x 100%
➂ S = (Ww / Wt) x 100%
➃ S = (Vw / Vv) x 100%
➄ None of the above 3. A soil is said to be unsaturated when:
➀ Vw < Vt
➁ Vw < Vv
➂ Vv < Vs
➃ Vw = Vs
➄ None of the above
4. For an initially unsaturated soil, as the water content of the soil increases, the soil
shear strength:
➀ increases
➁ decreases
➂ remains the same
➃ none of the above
5. The matric suction of soil is defined by:
➀ the difference between pore water and pore air pressures (ua-uw)
➁ the difference between total stress and pore air pressure (σ-ua)
➂ total stress minus pore water pressure (σ-uw)
➃ none of the above
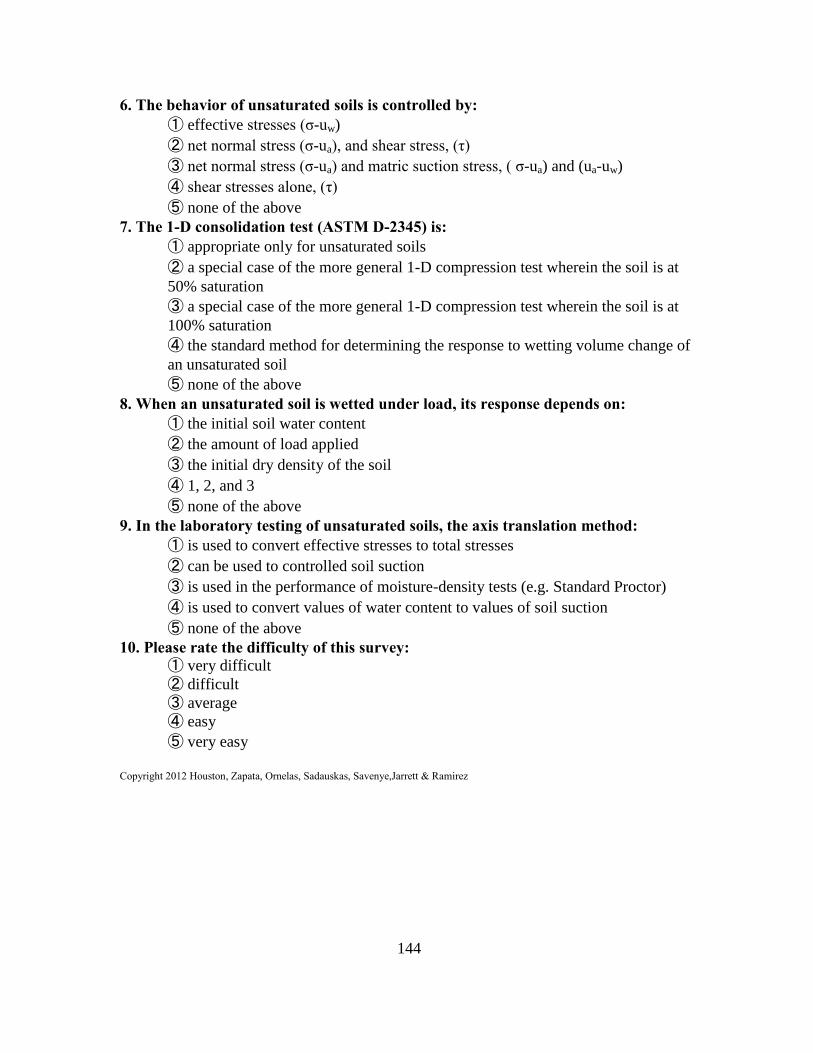
144
6. The behavior of unsaturated soils is controlled by:
➀ effective stresses (σ-uw)
➁ net normal stress (σ-ua), and shear stress, (τ)
➂ net normal stress (σ-ua) and matric suction stress, ( σ-ua) and (ua-uw)
➃ shear stresses alone, (τ)
➄ none of the above
7. The 1-D consolidation test (ASTM D-2345) is:
➀ appropriate only for unsaturated soils
➁ a special case of the more general 1-D compression test wherein the soil is at
50% saturation
➂ a special case of the more general 1-D compression test wherein the soil is at
100% saturation
➃ the standard method for determining the response to wetting volume change of
an unsaturated soil
➄ none of the above 8. When an unsaturated soil is wetted under load, its response depends on:
➀ the initial soil water content
➁ the amount of load applied
➂ the initial dry density of the soil
➃ 1, 2, and 3
➄ none of the above
9. In the laboratory testing of unsaturated soils, the axis translation method:
➀ is used to convert effective stresses to total stresses
➁ can be used to controlled soil suction
➂ is used in the performance of moisture-density tests (e.g. Standard Proctor)
➃ is used to convert values of water content to values of soil suction
➄ none of the above
10. Please rate the difficulty of this survey:
➀ very difficult
➁ difficult
➂ average
➃ easy
➄ very easy
Copyright 2012 Houston, Zapata, Ornelas, Sadauskas, Savenye,Jarrett & Ramirez

145
APPENDIX B
POST STUDENT CONSENT LETTER, TEST AND SURVEY
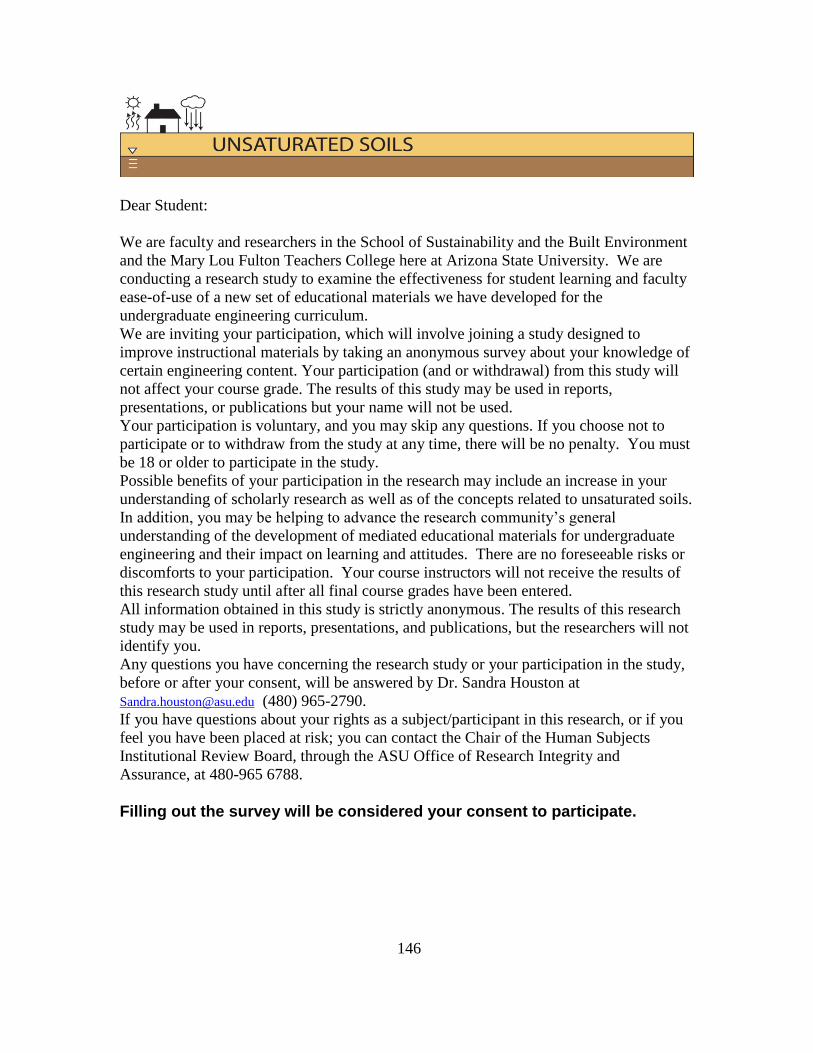
146
Dear Student:
We are faculty and researchers in the School of Sustainability and the Built Environment
and the Mary Lou Fulton Teachers College here at Arizona State University. We are
conducting a research study to examine the effectiveness for student learning and faculty
ease-of-use of a new set of educational materials we have developed for the
undergraduate engineering curriculum.
We are inviting your participation, which will involve joining a study designed to
improve instructional materials by taking an anonymous survey about your knowledge of
certain engineering content. Your participation (and or withdrawal) from this study will
not affect your course grade. The results of this study may be used in reports,
presentations, or publications but your name will not be used.
Your participation is voluntary, and you may skip any questions. If you choose not to
participate or to withdraw from the study at any time, there will be no penalty. You must
be 18 or older to participate in the study.
Possible benefits of your participation in the research may include an increase in your
understanding of scholarly research as well as of the concepts related to unsaturated soils.
In addition, you may be helping to advance the research community’s general
understanding of the development of mediated educational materials for undergraduate
engineering and their impact on learning and attitudes. There are no foreseeable risks or
discomforts to your participation. Your course instructors will not receive the results of
this research study until after all final course grades have been entered.
All information obtained in this study is strictly anonymous. The results of this research
study may be used in reports, presentations, and publications, but the researchers will not
identify you.
Any questions you have concerning the research study or your participation in the study,
before or after your consent, will be answered by Dr. Sandra Houston at
[email protected] (480) 965-2790.
If you have questions about your rights as a subject/participant in this research, or if you
feel you have been placed at risk; you can contact the Chair of the Human Subjects
Institutional Review Board, through the ASU Office of Research Integrity and
Assurance, at 480-965 6788.
Filling out the survey will be considered your consent to participate.
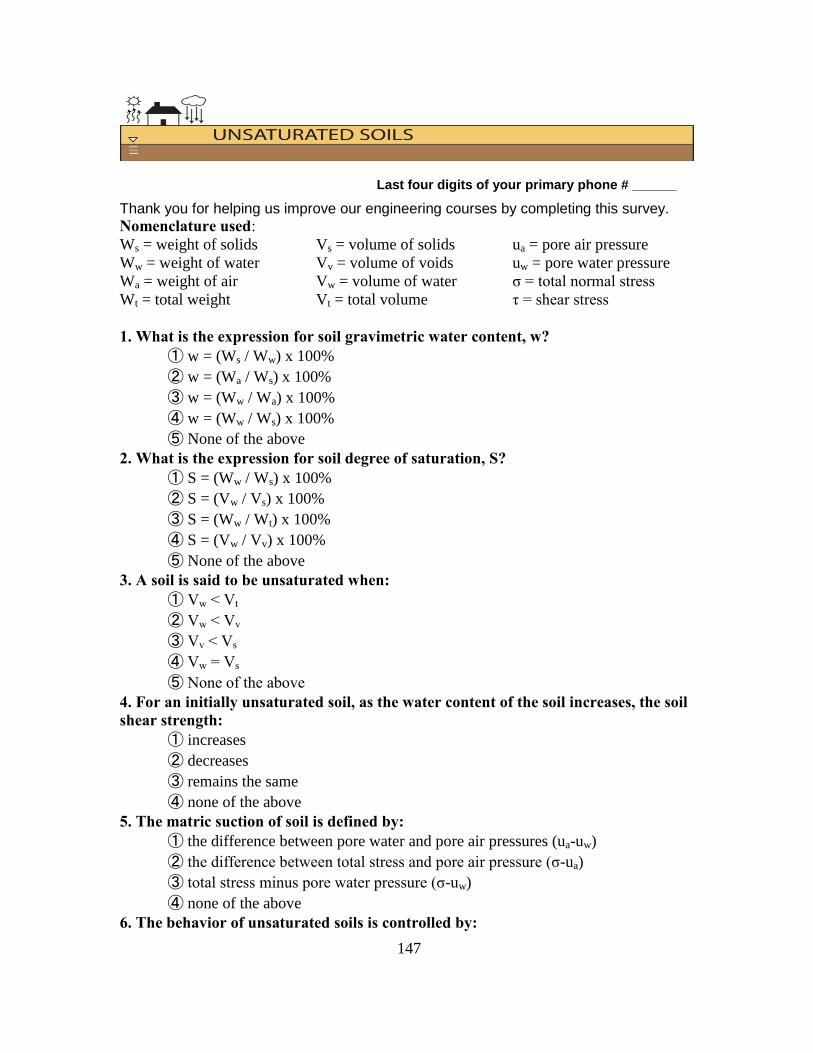
147
Last four digits of your primary phone # ______
Thank you for helping us improve our engineering courses by completing this survey.
Nomenclature used:
Ws = weight of solids Vs = volume of solids ua = pore air pressure
Ww = weight of water Vv = volume of voids uw = pore water pressure
Wa = weight of air Vw = volume of water σ = total normal stress
Wt = total weight Vt = total volume τ = shear stress
1. What is the expression for soil gravimetric water content, w?
➀ w = (Ws / Ww) x 100%
➁ w = (Wa / Ws) x 100%
➂ w = (Ww / Wa) x 100%
➃ w = (Ww / Ws) x 100%
➄ None of the above
2. What is the expression for soil degree of saturation, S?
➀ S = (Ww / Ws) x 100%
➁ S = (Vw / Vs) x 100%
➂ S = (Ww / Wt) x 100%
➃ S = (Vw / Vv) x 100%
➄ None of the above 3. A soil is said to be unsaturated when:
➀ Vw < Vt
➁ Vw < Vv
➂ Vv < Vs
➃ Vw = Vs
➄ None of the above
4. For an initially unsaturated soil, as the water content of the soil increases, the soil
shear strength:
➀ increases
➁ decreases
➂ remains the same
➃ none of the above
5. The matric suction of soil is defined by:
➀ the difference between pore water and pore air pressures (ua-uw)
➁ the difference between total stress and pore air pressure (σ-ua)
➂ total stress minus pore water pressure (σ-uw)
➃ none of the above
6. The behavior of unsaturated soils is controlled by:
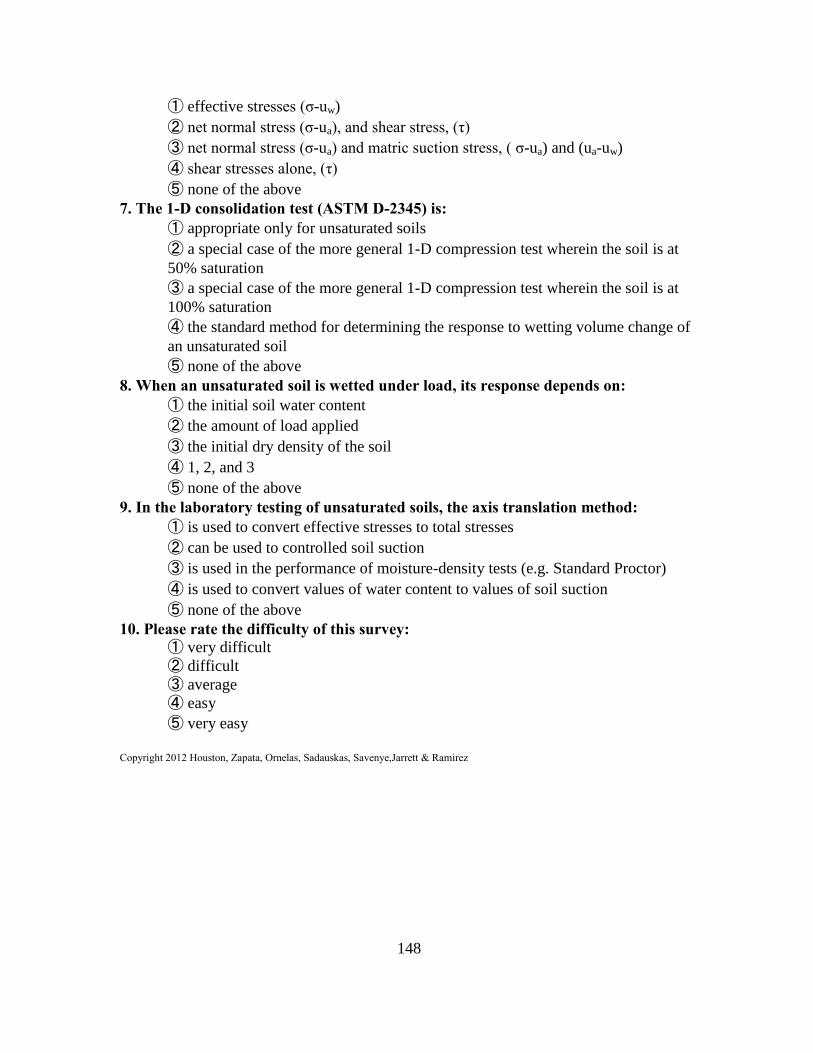
148
➀ effective stresses (σ-uw)
➁ net normal stress (σ-ua), and shear stress, (τ)
➂ net normal stress (σ-ua) and matric suction stress, ( σ-ua) and (ua-uw)
➃ shear stresses alone, (τ)
➄ none of the above
7. The 1-D consolidation test (ASTM D-2345) is:
➀ appropriate only for unsaturated soils
➁ a special case of the more general 1-D compression test wherein the soil is at
50% saturation
➂ a special case of the more general 1-D compression test wherein the soil is at
100% saturation
➃ the standard method for determining the response to wetting volume change of
an unsaturated soil
➄ none of the above 8. When an unsaturated soil is wetted under load, its response depends on:
➀ the initial soil water content
➁ the amount of load applied
➂ the initial dry density of the soil
➃ 1, 2, and 3
➄ none of the above
9. In the laboratory testing of unsaturated soils, the axis translation method:
➀ is used to convert effective stresses to total stresses
➁ can be used to controlled soil suction
➂ is used in the performance of moisture-density tests (e.g. Standard Proctor)
➃ is used to convert values of water content to values of soil suction
➄ none of the above
10. Please rate the difficulty of this survey:
➀ very difficult
➁ difficult
➂ average
➃ easy
➄ very easy
Copyright 2012 Houston, Zapata, Ornelas, Sadauskas, Savenye,Jarrett & Ramirez
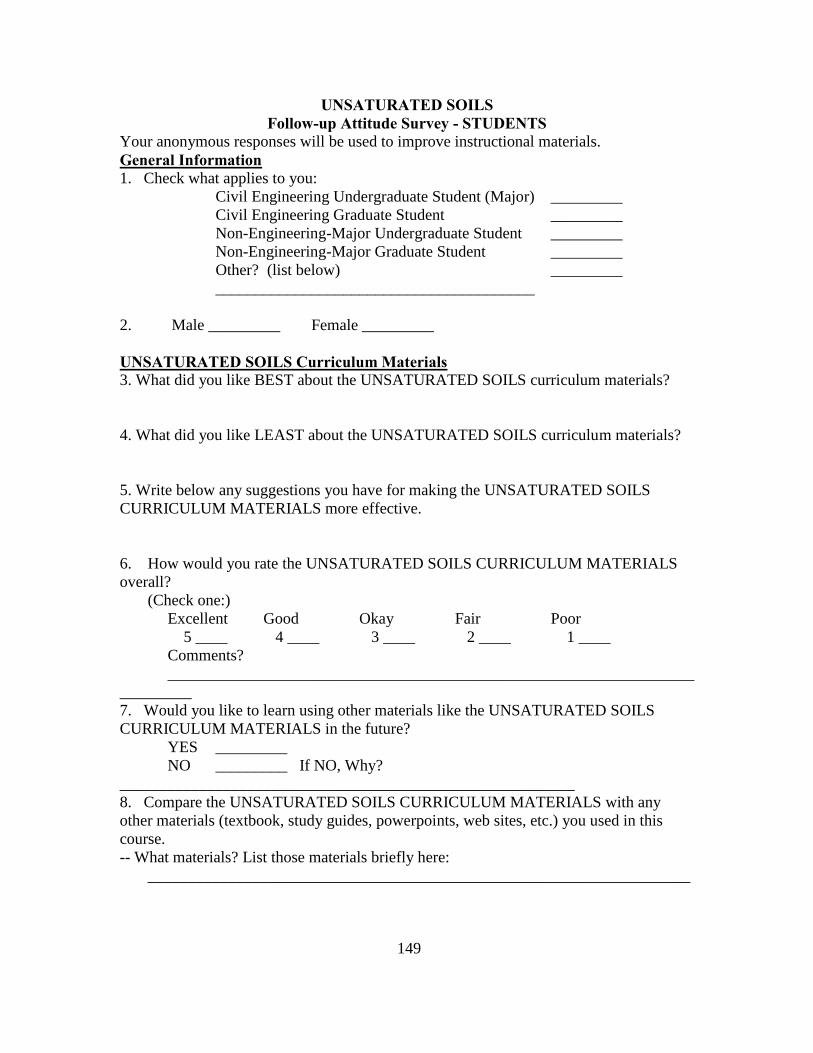
149
UNSATURATED SOILS
Follow-up Attitude Survey - STUDENTS
Your anonymous responses will be used to improve instructional materials.
General Information
1. Check what applies to you:
Civil Engineering Undergraduate Student (Major) _________
Civil Engineering Graduate Student _________
Non-Engineering-Major Undergraduate Student _________
Non-Engineering-Major Graduate Student _________
Other? (list below) _________
________________________________________
2. Male _________ Female _________
UNSATURATED SOILS Curriculum Materials
3. What did you like BEST about the UNSATURATED SOILS curriculum materials?
4. What did you like LEAST about the UNSATURATED SOILS curriculum materials?
5. Write below any suggestions you have for making the UNSATURATED SOILS
CURRICULUM MATERIALS more effective.
6. How would you rate the UNSATURATED SOILS CURRICULUM MATERIALS
overall?
(Check one:)
Excellent Good Okay Fair Poor
5 ____ 4 ____ 3 ____ 2 ____ 1 ____
Comments?
__________________________________________________________________
_________
7. Would you like to learn using other materials like the UNSATURATED SOILS
CURRICULUM MATERIALS in the future?
YES _________
NO _________ If NO, Why?
_________________________________________________________
8. Compare the UNSATURATED SOILS CURRICULUM MATERIALS with any
other materials (textbook, study guides, powerpoints, web sites, etc.) you used in this
course.
-- What materials? List those materials briefly here:
____________________________________________________________________
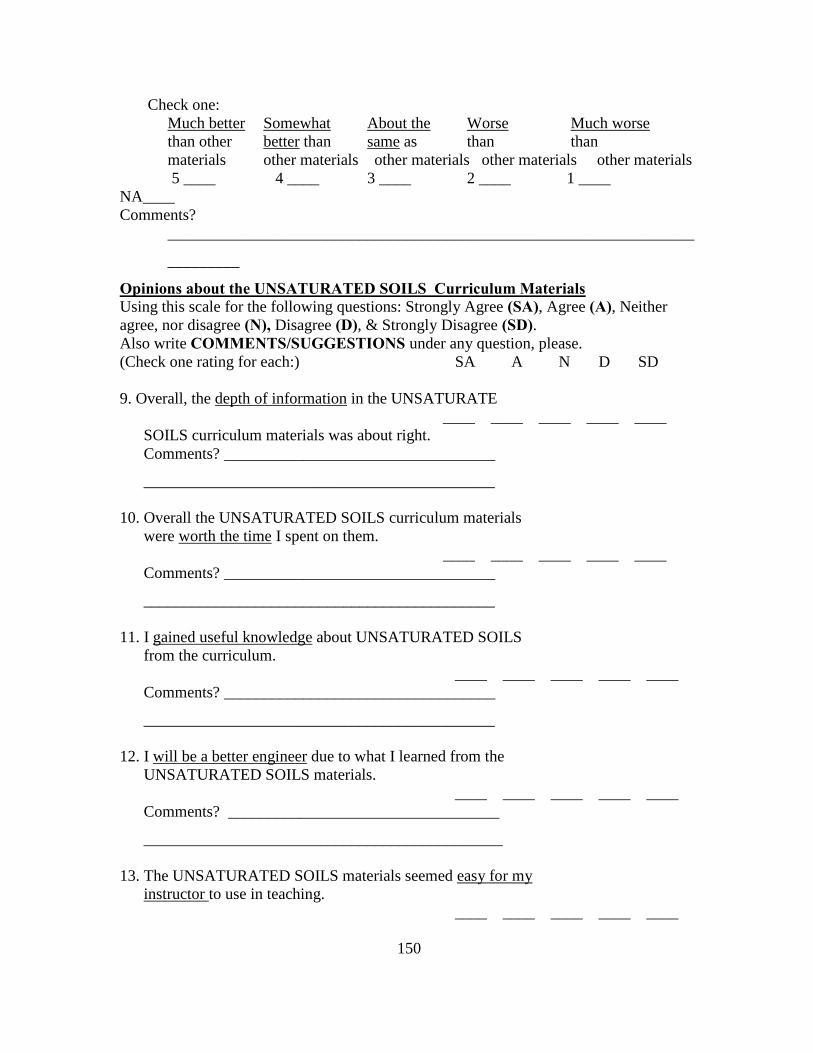
150
Check one:
Much better Somewhat About the Worse Much worse
than other better than same as than than
materials other materials other materials other materials other materials
5 ____ 4 ____ 3 ____ 2 ____ 1 ____
NA____
Comments?
__________________________________________________________________
_________
Opinions about the UNSATURATED SOILS Curriculum Materials
Using this scale for the following questions: Strongly Agree (SA), Agree (A), Neither
agree, nor disagree (N), Disagree (D), & Strongly Disagree (SD).
Also write COMMENTS/SUGGESTIONS under any question, please.
(Check one rating for each:) SA A N D SD
9. Overall, the depth of information in the UNSATURATE
____ ____ ____ ____ ____
SOILS curriculum materials was about right.
Comments? __________________________________
____________________________________________
10. Overall the UNSATURATED SOILS curriculum materials
were worth the time I spent on them.
____ ____ ____ ____ ____
Comments? __________________________________
____________________________________________
11. I gained useful knowledge about UNSATURATED SOILS
from the curriculum.
____ ____ ____ ____ ____
Comments? __________________________________
____________________________________________
12. I will be a better engineer due to what I learned from the
UNSATURATED SOILS materials.
____ ____ ____ ____ ____
Comments? __________________________________
_____________________________________________
13. The UNSATURATED SOILS materials seemed easy for my
instructor to use in teaching.
____ ____ ____ ____ ____

151
Comments?___________________________________
_____________________________________________
14. I plan to refer to the UNSATURATED SOILS
materials as a resource in the future.
____ ____ ____ ____ ____
Which ones? __________________________________
__________________________________________________________________
Additional comments?
__________________________________________________________________
__________________________________________________________________
__________________________________________________________________
Thank you!
Copyright 2012 Savenye, Houston, Zapata, Ornelas, Ramirez

152
APPENDIX C
FACULTY CONSENT LETTER AND SURVEY
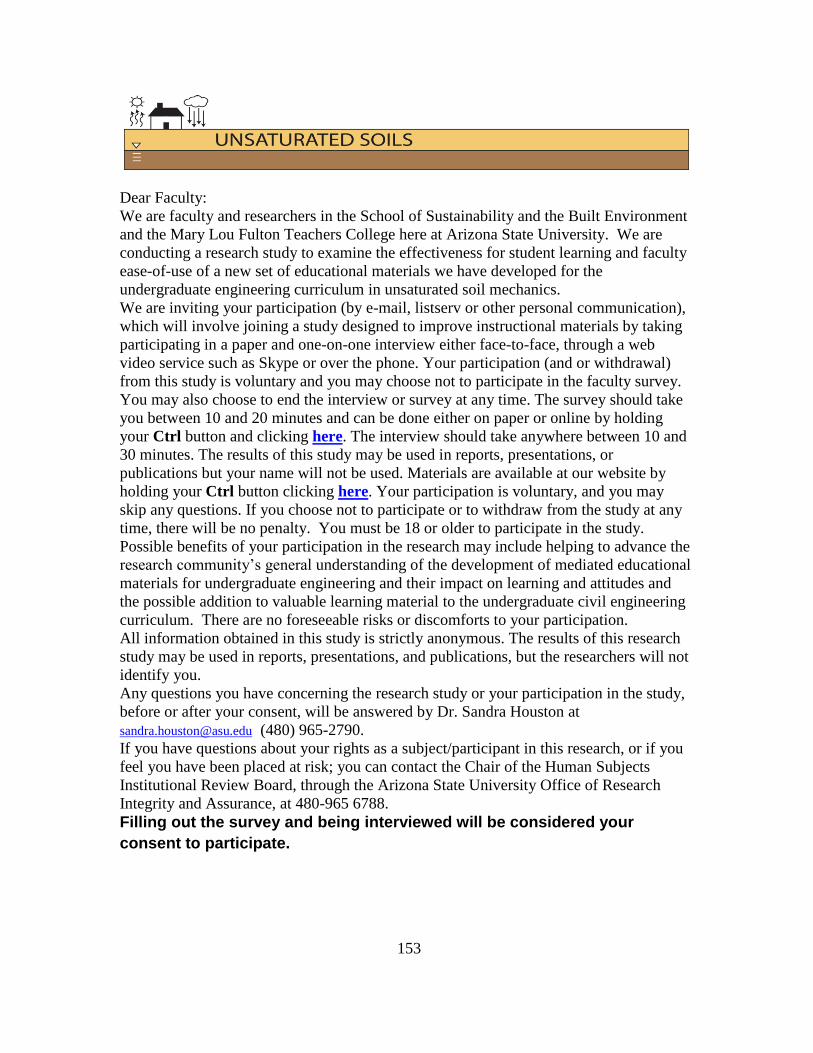
153
Dear Faculty:
We are faculty and researchers in the School of Sustainability and the Built Environment
and the Mary Lou Fulton Teachers College here at Arizona State University. We are
conducting a research study to examine the effectiveness for student learning and faculty
ease-of-use of a new set of educational materials we have developed for the
undergraduate engineering curriculum in unsaturated soil mechanics.
We are inviting your participation (by e-mail, listserv or other personal communication),
which will involve joining a study designed to improve instructional materials by taking
participating in a paper and one-on-one interview either face-to-face, through a web
video service such as Skype or over the phone. Your participation (and or withdrawal)
from this study is voluntary and you may choose not to participate in the faculty survey.
You may also choose to end the interview or survey at any time. The survey should take
you between 10 and 20 minutes and can be done either on paper or online by holding
your Ctrl button and clicking here. The interview should take anywhere between 10 and
30 minutes. The results of this study may be used in reports, presentations, or
publications but your name will not be used. Materials are available at our website by
holding your Ctrl button clicking here. Your participation is voluntary, and you may
skip any questions. If you choose not to participate or to withdraw from the study at any
time, there will be no penalty. You must be 18 or older to participate in the study.
Possible benefits of your participation in the research may include helping to advance the
research community’s general understanding of the development of mediated educational
materials for undergraduate engineering and their impact on learning and attitudes and
the possible addition to valuable learning material to the undergraduate civil engineering
curriculum. There are no foreseeable risks or discomforts to your participation.
All information obtained in this study is strictly anonymous. The results of this research
study may be used in reports, presentations, and publications, but the researchers will not
identify you.
Any questions you have concerning the research study or your participation in the study,
before or after your consent, will be answered by Dr. Sandra Houston at
[email protected] (480) 965-2790.
If you have questions about your rights as a subject/participant in this research, or if you
feel you have been placed at risk; you can contact the Chair of the Human Subjects
Institutional Review Board, through the Arizona State University Office of Research
Integrity and Assurance, at 480-965 6788.
Filling out the survey and being interviewed will be considered your
consent to participate.
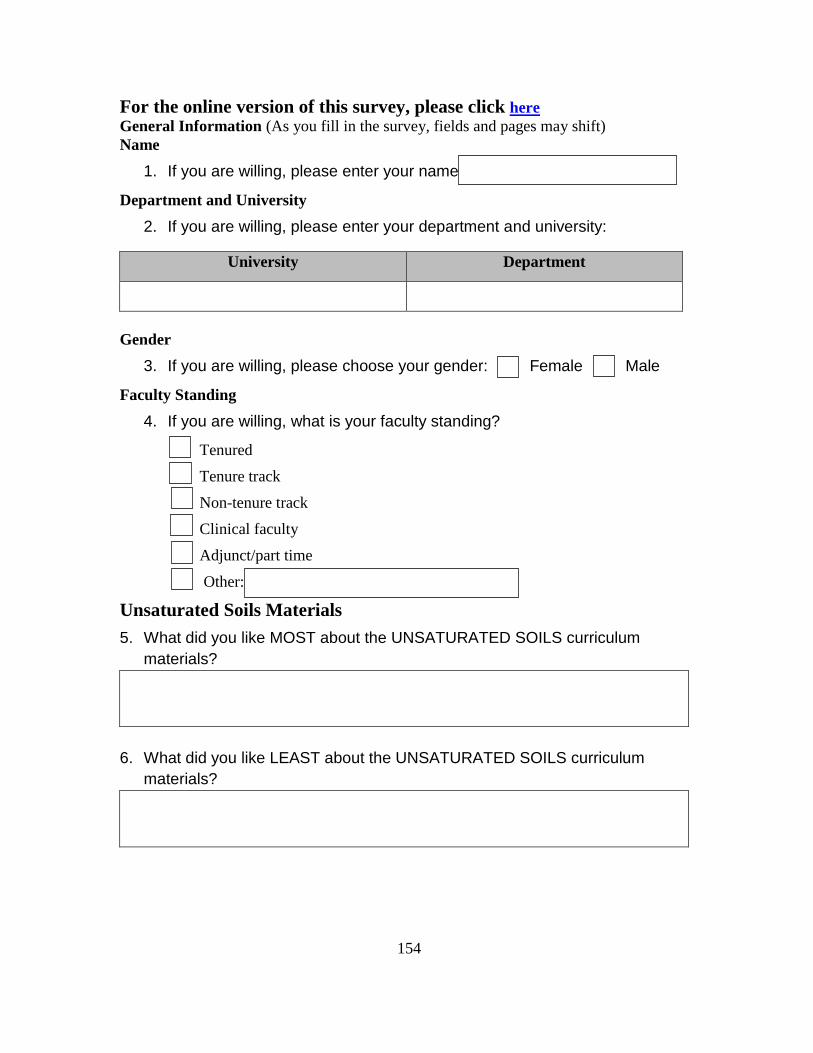
154
For the online version of this survey, please click here General Information (As you fill in the survey, fields and pages may shift)
Name
1. If you are willing, please enter your name:
Department and University
2. If you are willing, please enter your department and university:
University Department
Gender
3. If you are willing, please choose your gender: Female Male
Faculty Standing
4. If you are willing, what is your faculty standing?
Tenured
Tenure track
Non-tenure track
Clinical faculty
Adjunct/part time
Other:
Unsaturated Soils Materials
5. What did you like MOST about the UNSATURATED SOILS curriculum
materials?
6. What did you like LEAST about the UNSATURATED SOILS curriculum
materials?
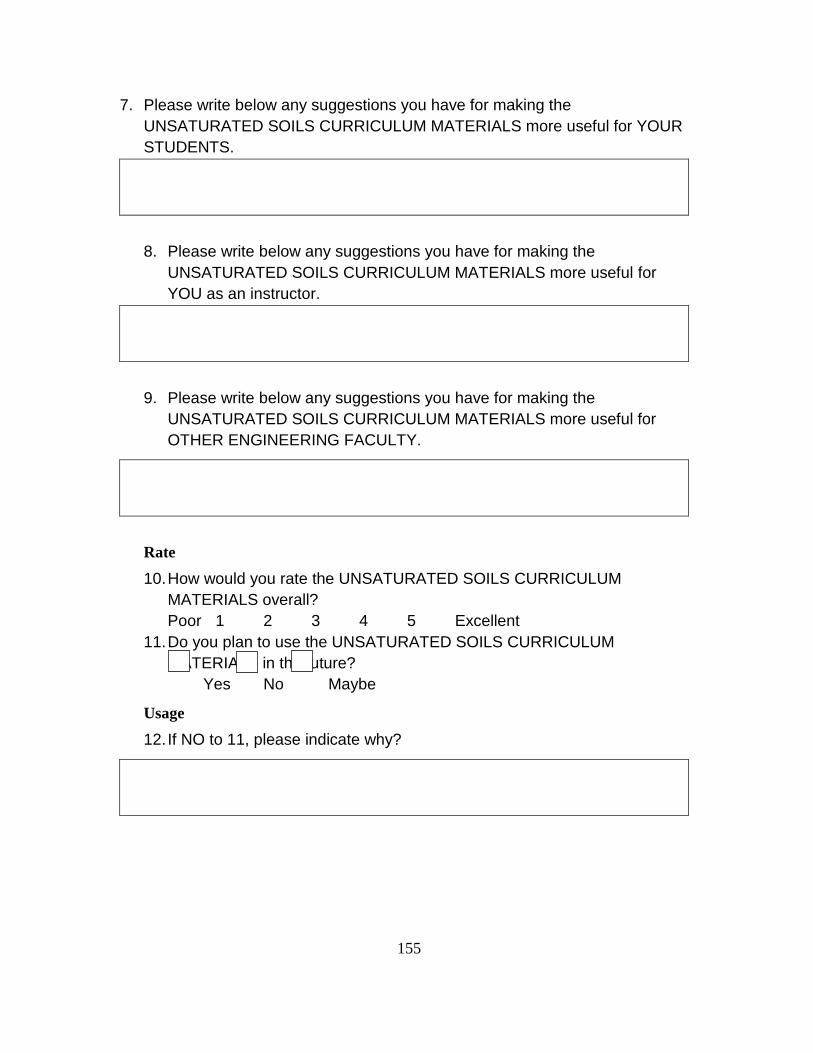
155
7. Please write below any suggestions you have for making the
UNSATURATED SOILS CURRICULUM MATERIALS more useful for YOUR
STUDENTS.
8. Please write below any suggestions you have for making the
UNSATURATED SOILS CURRICULUM MATERIALS more useful for
YOU as an instructor.
9. Please write below any suggestions you have for making the
UNSATURATED SOILS CURRICULUM MATERIALS more useful for
OTHER ENGINEERING FACULTY.
Rate
10. How would you rate the UNSATURATED SOILS CURRICULUM
MATERIALS overall?
Poor 1 2 3 4 5 Excellent
11. Do you plan to use the UNSATURATED SOILS CURRICULUM
MATERIALS in the future?
Yes No Maybe
Usage
12. If NO to 11, please indicate why?
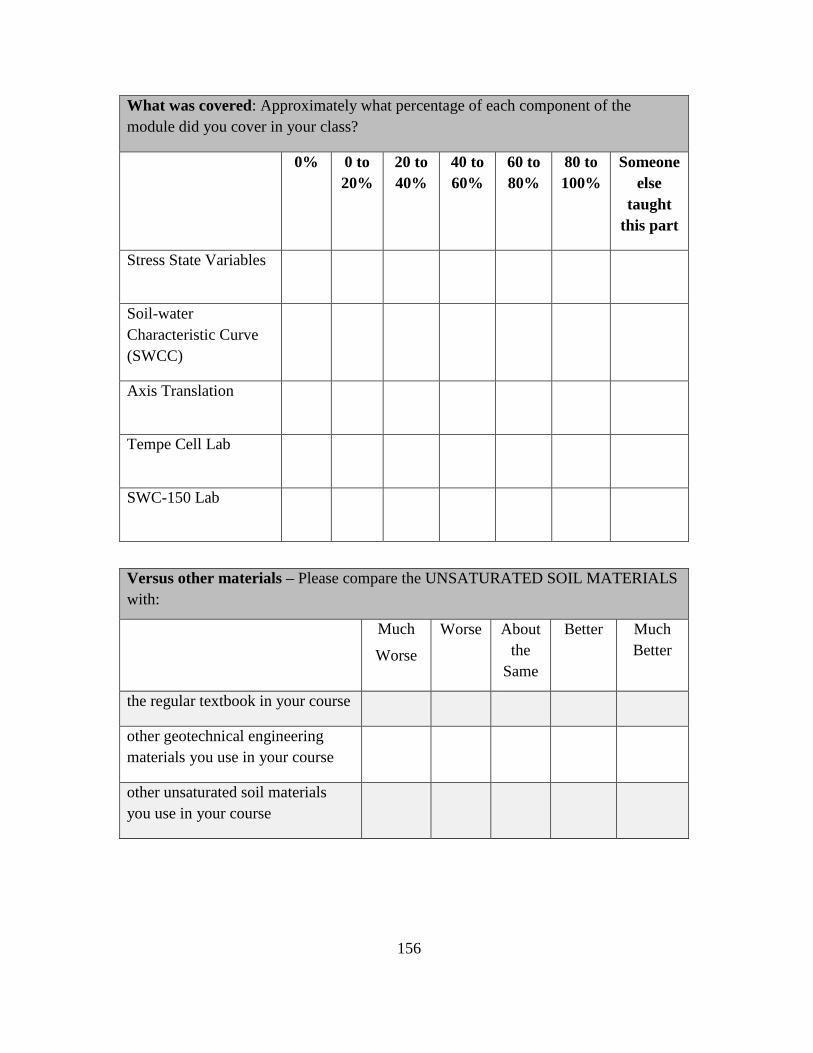
156
What was covered: Approximately what percentage of each component of the
module did you cover in your class?
0% 0 to
20%
20 to
40%
40 to
60%
60 to
80%
80 to
100%
Someone
else
taught
this part
Stress State Variables
Soil-water
Characteristic Curve
(SWCC)
Axis Translation
Tempe Cell Lab
SWC-150 Lab
Versus other materials – Please compare the UNSATURATED SOIL MATERIALS
with:
Much
Worse
Worse About
the
Same
Better Much
Better
the regular textbook in your course
other geotechnical engineering
materials you use in your course
other unsaturated soil materials
you use in your course
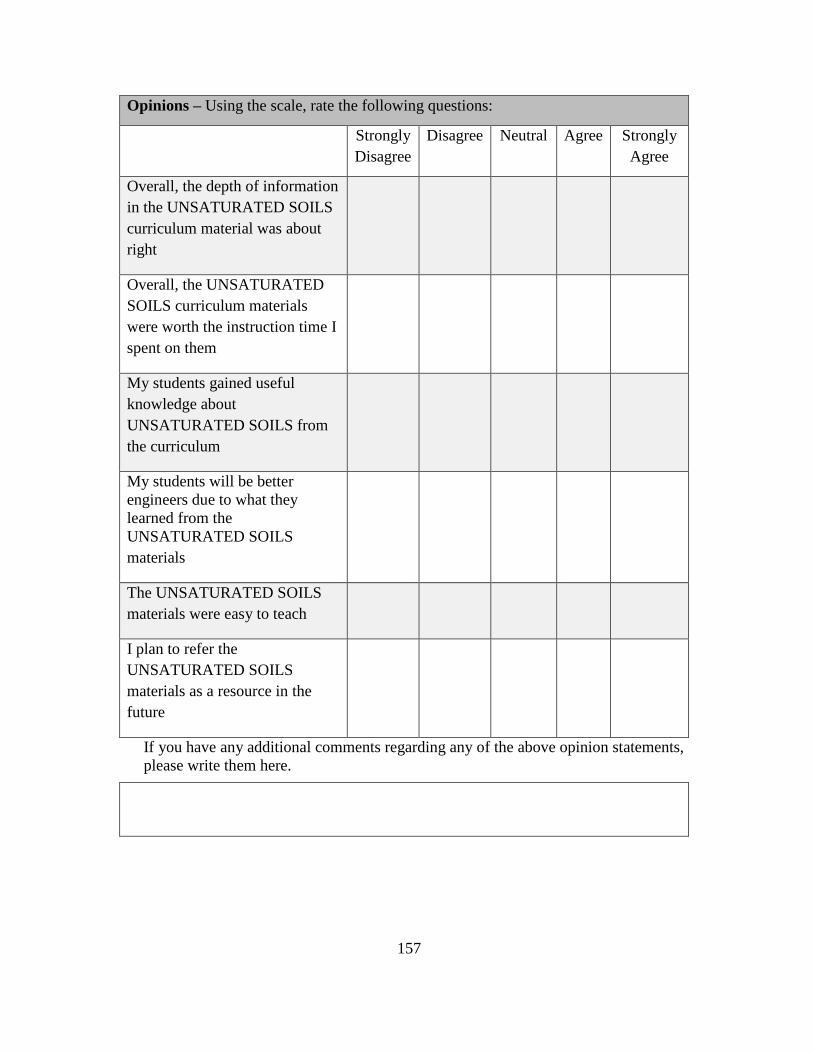
157
Opinions – Using the scale, rate the following questions:
Strongly
Disagree
Disagree Neutral Agree Strongly
Agree
Overall, the depth of information
in the UNSATURATED SOILS
curriculum material was about
right
Overall, the UNSATURATED
SOILS curriculum materials
were worth the instruction time I
spent on them
My students gained useful
knowledge about
UNSATURATED SOILS from
the curriculum
My students will be better
engineers due to what they
learned from the UNSATURATED SOILS
materials
The UNSATURATED SOILS
materials were easy to teach
I plan to refer the
UNSATURATED SOILS
materials as a resource in the
future
If you have any additional comments regarding any of the above opinion statements,
please write them here.
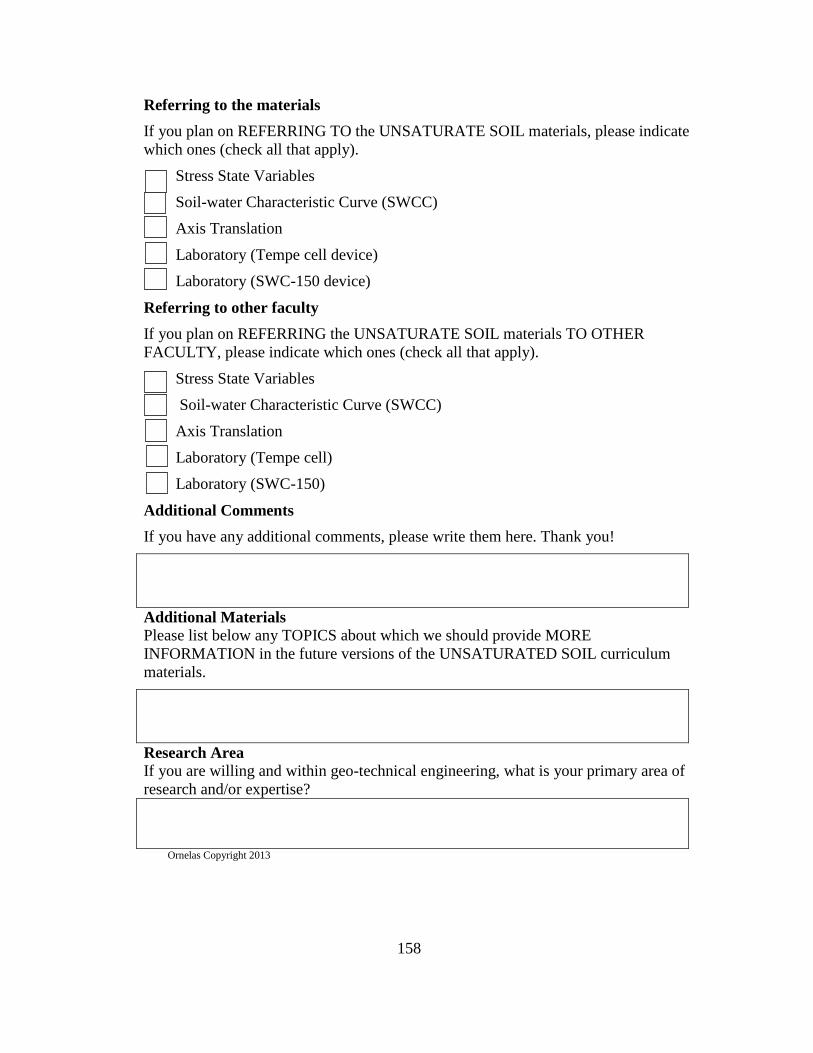
158
Referring to the materials
If you plan on REFERRING TO the UNSATURATE SOIL materials, please indicate
which ones (check all that apply).
Stress State Variables
Soil-water Characteristic Curve (SWCC)
Axis Translation
Laboratory (Tempe cell device)
Laboratory (SWC-150 device)
Referring to other faculty
If you plan on REFERRING the UNSATURATE SOIL materials TO OTHER
FACULTY, please indicate which ones (check all that apply).
Stress State Variables
Soil-water Characteristic Curve (SWCC)
Axis Translation
Laboratory (Tempe cell)
Laboratory (SWC-150)
Additional Comments
If you have any additional comments, please write them here. Thank you!
Additional Materials Please list below any TOPICS about which we should provide MORE
INFORMATION in the future versions of the UNSATURATED SOIL curriculum
materials.
Research Area If you are willing and within geo-technical engineering, what is your primary area of
research and/or expertise?
Ornelas Copyright 2013

159
APPENDIX D
FACULTY CONSENT LETTER AND INTERVIEW SCRIPT
160
STUDY00000378: Unsaturated Soils D&D Research Study
Faculty Survey Information and Consent Letter
Dear Faculty:
We are faculty and researchers in the School of Sustainability and the Built Environment
and the Mary Lou Fulton Teachers College here at Arizona State University. We are
conducting a research study to examine the effectiveness for student learning and faculty
ease-of-use of a new set of educational materials we have developed for the
undergraduate engineering curriculum in unsaturated soil mechanics.
We are inviting your participation, which will involve joining a study designed to
improve instructional materials by taking participating in a paper and one-on-one
interview either face-to-face, through a web video service such as Skype or over the
phone. Your participation (and or withdrawal) from this study is voluntary and you may
choose not to participate in the faculty survey. You may also choose to end the interview
or survey at any time. The survey should take you between 10 and 20 minutes and can be
done either on paper or online by clicking here. The interview should take anywhere
between 10 and 30 minutes. The results of this study may be used in reports,
presentations, or publications but your name will not be used.
Your participation is voluntary, and you may skip any questions. If you choose not to
participate or to withdraw from the study at any time, there will be no penalty. You must
be 18 or older to participate in the study.
Possible benefits of your participation in the research may include helping to advance the
research community’s general understanding of the development of mediated educational
materials for undergraduate engineering and their impact on learning and attitudes and
the possible addition to valuable learning material to the undergraduate civil engineering
curriculum. There are no foreseeable risks or discomforts to your participation.
All information obtained in this study is strictly anonymous. The results of this research
study may be used in reports, presentations, and publications, but the researchers will not
identify you.
Any questions you have concerning the research study or your participation in the study,
before or after your consent, will be answered by Dr. Sandra Houston at
[email protected] (480) 965-2790.
If you have questions about your rights as a subject/participant in this research, or if you
feel you have been placed at risk; you can contact the Chair of the Human Subjects
Institutional Review Board, through the Arizona State University Office of Research
Integrity and Assurance, at 480-965 6788.
Filling out the survey and being interviewed will be considered your
consent to participate.
Copyright 2013 Houston, Savenye, Zapata & Ornelas
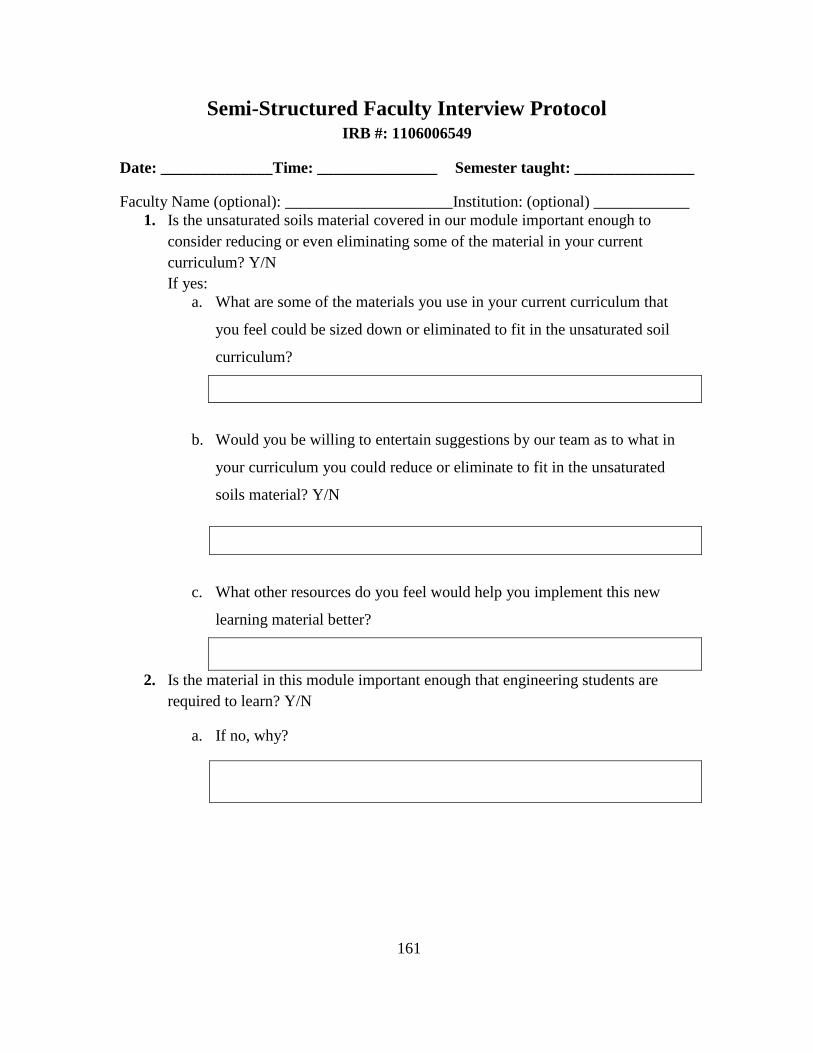
161
Semi-Structured Faculty Interview Protocol IRB #: 1106006549
Date: ______________Time: _______________ Semester taught: _______________
Faculty Name (optional): _____________________Institution: (optional) ____________
1. Is the unsaturated soils material covered in our module important enough to
consider reducing or even eliminating some of the material in your current
curriculum? Y/N
If yes:
a. What are some of the materials you use in your current curriculum that
you feel could be sized down or eliminated to fit in the unsaturated soil
curriculum?
b. Would you be willing to entertain suggestions by our team as to what in
your curriculum you could reduce or eliminate to fit in the unsaturated
soils material? Y/N
c. What other resources do you feel would help you implement this new
learning material better?
2. Is the material in this module important enough that engineering students are
required to learn? Y/N
a. If no, why?
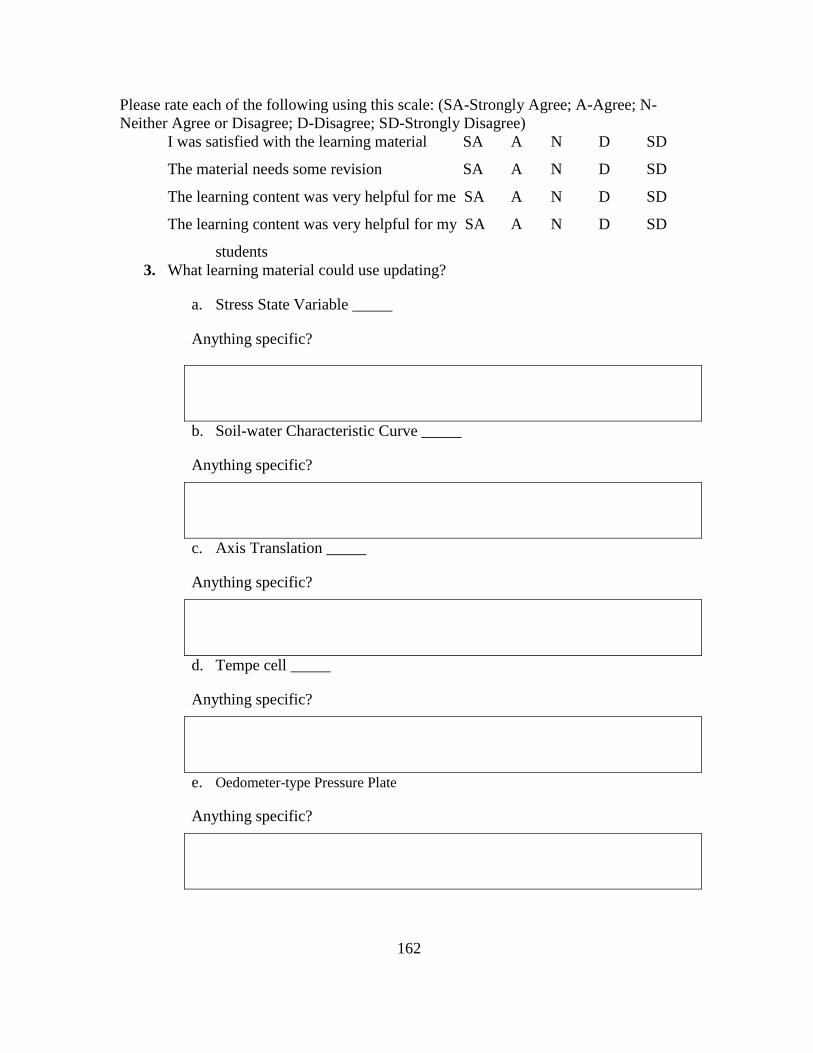
162
Please rate each of the following using this scale: (SA-Strongly Agree; A-Agree; N-
Neither Agree or Disagree; D-Disagree; SD-Strongly Disagree)
I was satisfied with the learning material SA A N D SD
The material needs some revision SA A N D SD
The learning content was very helpful for me SA A N D SD
The learning content was very helpful for my SA A N D SD
students
3. What learning material could use updating?
a. Stress State Variable _____
Anything specific?
b. Soil-water Characteristic Curve _____
Anything specific?
c. Axis Translation _____
Anything specific?
d. Tempe cell _____
Anything specific?
e. Oedometer-type Pressure Plate
Anything specific?
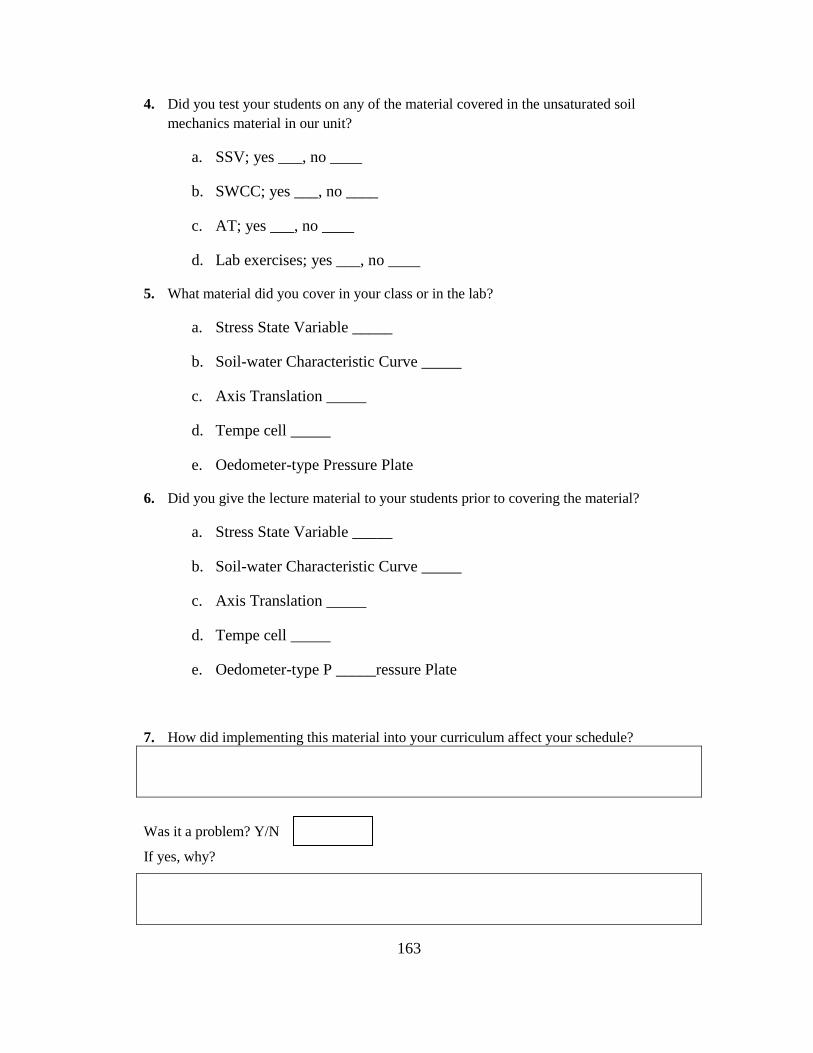
163
4. Did you test your students on any of the material covered in the unsaturated soil
mechanics material in our unit?
a. SSV; yes ___, no ____
b. SWCC; yes ___, no ____
c. AT; yes ___, no ____
d. Lab exercises; yes ___, no ____
5. What material did you cover in your class or in the lab?
a. Stress State Variable _____
b. Soil-water Characteristic Curve _____
c. Axis Translation _____
d. Tempe cell _____
e. Oedometer-type Pressure Plate
6. Did you give the lecture material to your students prior to covering the material?
a. Stress State Variable _____
b. Soil-water Characteristic Curve _____
c. Axis Translation _____
d. Tempe cell _____
e. Oedometer-type P _____ressure Plate
7. How did implementing this material into your curriculum affect your schedule?
Was it a problem? Y/N
If yes, why?
164
8. Our template for the presentations was more than likely different than yours. Was that an
issue with you? Y/N
If yes, why?
With your students? Y/N
If yes, why?
Copyright 2013 Ornelas

165
APPENDIX E
IdID TEAM CONSENT LETTER AND INTERVIEW SCRIPT
166
Dear Design Team Member: Thank you again for agreeing to participate in the Unsaturated Soils D & D research
study. This interview will not take longer than 30 minutes. Your participation is
voluntary and you may skip any questions you do not wish to answer or you may choose
to end the interview at any time.
All information obtained in this study is strictly anonymous. The results of this research
study may be used in reports, presentations, and publications, but the researchers will not
identify you.
I would like to audio record the interview. The interview will not be recorded without
your permission. Please let me know if you do not want the interview to be recorded;
you can also change your mind after the interview starts, just let me know.
Semi-Structured Interdisciplinary Design Team Interview Protocol
IRB #: STUDY00000378
Thank you for assisting in the advancement of interdisciplinary instructional
design teams by participating in this interview.
1. What discipline do you consider your primary area of focus?
2. What is the primary area of focus for the members of your design team that are
not in the same area of focus you consider your primary area of focus?
3. What was the most frustrating thing you found when working with others
OUTSIDE OF your area of focus?
4. What was the most frustrating thing you found when working with others
WITHING your area of focus?
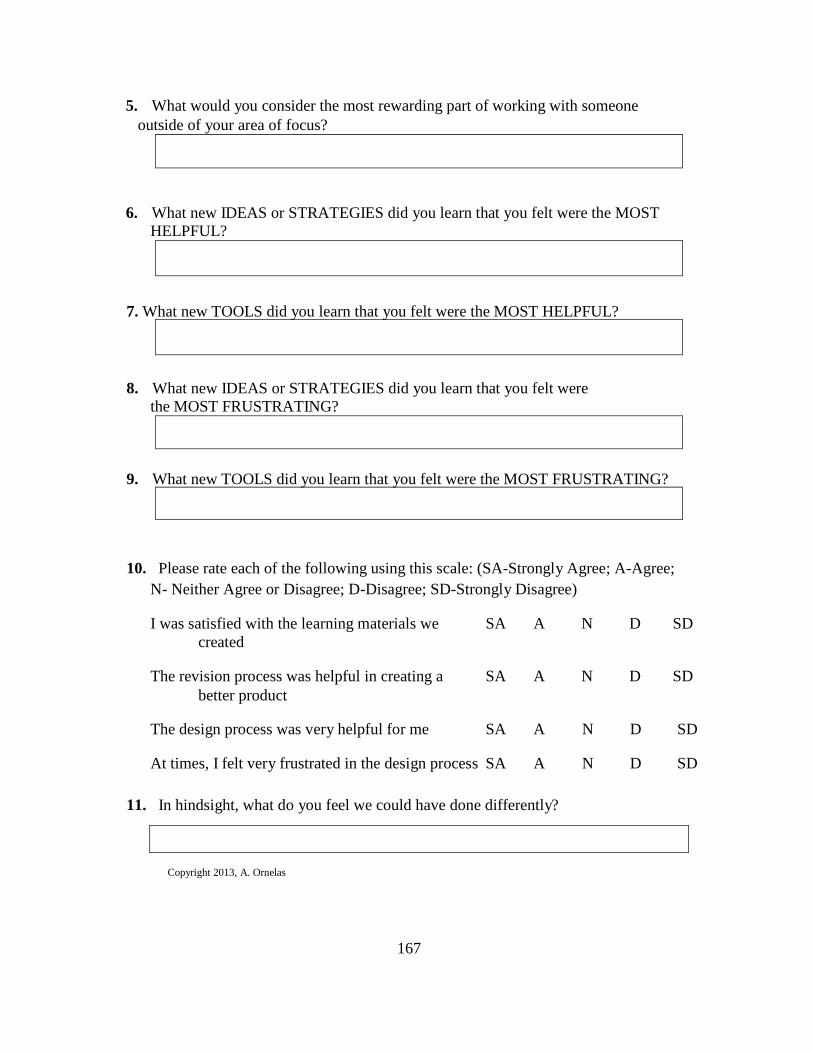
167
5. What would you consider the most rewarding part of working with someone
outside of your area of focus?
6. What new IDEAS or STRATEGIES did you learn that you felt were the MOST
HELPFUL?
7. What new TOOLS did you learn that you felt were the MOST HELPFUL?
8. What new IDEAS or STRATEGIES did you learn that you felt were
the MOST FRUSTRATING?
9. What new TOOLS did you learn that you felt were the MOST FRUSTRATING?
10. Please rate each of the following using this scale: (SA-Strongly Agree; A-Agree;
N- Neither Agree or Disagree; D-Disagree; SD-Strongly Disagree)
I was satisfied with the learning materials we SA A N D SD
created
The revision process was helpful in creating a SA A N D SD
better product
The design process was very helpful for me SA A N D SD
At times, I felt very frustrated in the design process
SA
A
N
D
SD
11. In hindsight, what do you feel we could have done differently?
Copyright 2013, A. Ornelas

168
APPENDIX F
IdID TEAM FOLLOW-UP INTERVIEW SURVEY
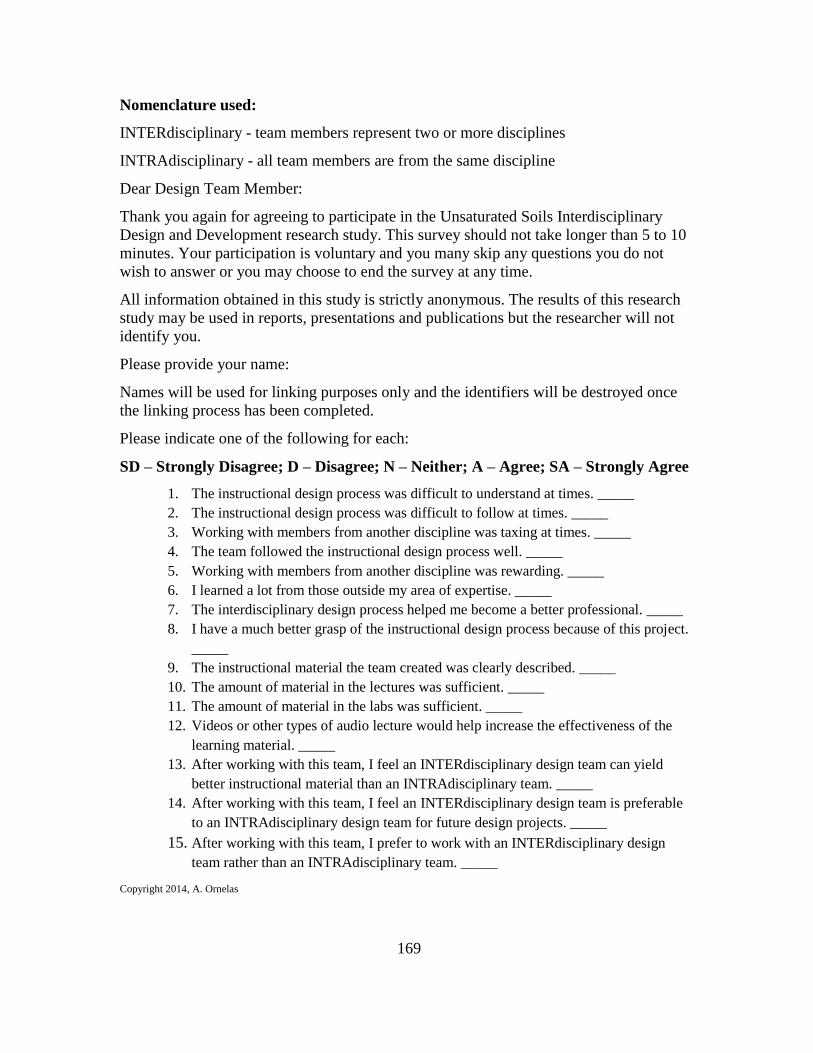
169
Nomenclature used:
INTERdisciplinary - team members represent two or more disciplines
INTRAdisciplinary - all team members are from the same discipline
Dear Design Team Member:
Thank you again for agreeing to participate in the Unsaturated Soils Interdisciplinary
Design and Development research study. This survey should not take longer than 5 to 10
minutes. Your participation is voluntary and you many skip any questions you do not
wish to answer or you may choose to end the survey at any time.
All information obtained in this study is strictly anonymous. The results of this research
study may be used in reports, presentations and publications but the researcher will not
identify you.
Please provide your name:
Names will be used for linking purposes only and the identifiers will be destroyed once
the linking process has been completed.
Please indicate one of the following for each:
SD – Strongly Disagree; D – Disagree; N – Neither; A – Agree; SA – Strongly Agree
1. The instructional design process was difficult to understand at times. _____
2. The instructional design process was difficult to follow at times. _____
3. Working with members from another discipline was taxing at times. _____
4. The team followed the instructional design process well. _____
5. Working with members from another discipline was rewarding. _____
6. I learned a lot from those outside my area of expertise. _____
7. The interdisciplinary design process helped me become a better professional. _____
8. I have a much better grasp of the instructional design process because of this project.
_____
9. The instructional material the team created was clearly described. _____
10. The amount of material in the lectures was sufficient. _____
11. The amount of material in the labs was sufficient. _____
12. Videos or other types of audio lecture would help increase the effectiveness of the
learning material. _____
13. After working with this team, I feel an INTERdisciplinary design team can yield
better instructional material than an INTRAdisciplinary team. _____
14. After working with this team, I feel an INTERdisciplinary design team is preferable
to an INTRAdisciplinary design team for future design projects. _____
15. After working with this team, I prefer to work with an INTERdisciplinary design
team rather than an INTRAdisciplinary team. _____
Copyright 2014, A. Ornelas
Recommended