Annual Report
2019

This is HandelsbankenHandelsbanken was founded in 1871. The Bank has a nationwide branch network in Sweden, the UK, Norway, Denmark, Finland and the Netherlands. We have a decentralised way of working with a strong local presence and a long-term approach to our customer relations. Our goal is to have better profitability than the average of peer competitors in our home markets. We mainly achieve this goal by having more satisfied customers and lower costs.
branches in our six home markets.
Over
750
Handelsbanken was founded in
1871than the sector average in
all six of our home markets.*
More satisfied
customers
SATISFIED CUSTOMERS IN ALL
SIX HOME MARKETS
Every year, EPSI Rating – which includes SKI
(Swedish Quality Index) – carries out independ-
ent surveys of customer satisfaction. This year’s
surveys showed that Handelsbanken has more
satisfied private and corporate customers than
the average for the banking sector in all six of the
Bank’s home markets.
In addition, the survey shows that Handels-
banken’s customers are significantly more loyal
than the customers of other competitors, and
that they give the Bank’s digital services high
marks. The fact that digital customer meetings
are perceived positively is important for fostering
long-term, strong customer relationships, and
contributes to reinforcing the Bank’s strong
position in terms of customer satisfaction.
In Sweden, Handelsbanken has had the most
satisfied private customers for 30 years running,
according to SKI.*
HANDELSBANKEN’S CREDIT RATING
IS TOP OF GLOBAL BANKS
No other bank in the world has a higher rating
than Handelsbanken in terms of bank ratings from
Fitch, Moody’s and Standard & Poor’s.
The Bank’s newly formed UK subsidiary,
Handels banken Plc, has been assigned the same
high rating as Handelsbanken by Fitch and
Standard & Poor’s.
CONTINUED ORGANIC GROWTH
Satisfied customers result in more business.
Which is why Handelsbanken is a growing bank.
In total, the average volume of loans to the public
increased by 5 per cent, while the average volume
of deposits from the public increased by 6 per
cent. Business volumes increased during the year
in all six home markets: in the UK, lending grew by
5 per cent and deposits grew by 10 per cent; in
Norway, the corresponding increases were 5 and
8 per cent, respectively; and in Denmark, 3 and
5 per cent, respectively. In Finland, lending rose by
4 per cent while deposits grew by 5 per cent, and
in the Netherlands, the average volume of lending
increased by 14 per cent while the average volume
of deposits was up by 18 per cent. But it is not just
in our home markets outside Sweden that Handels-
banken is growing.
In Sweden, where Handelsbanken was founded
in 1871, 2019 was another year marked by growth
and large inflows of new business volumes – in
terms of both savings and lending. For the third
consecutive year, Handelsbanken was the largest
player for new savings on the mutual fund market
in Sweden. New savings in the Bank’s mutual funds
in Sweden amounted to SEK 27 billion, equivalent
to a market share of just over 21 per cent, to be
viewed in the light of the Bank’s share of the total
managed volume in the Swedish mutual fund mar-
ket, of 11.2 per cent. At the same time, Handels-
banken’s market share of household deposits in
Sweden increased.
* According to EPSI Rating/SKI (Swedish Quality Index). Since SKI surveys started in 1989, Handelsbanken has had the most
satisfied private customers among the four major Swedish banks – Handelsbanken, Nordea, SEB and Swedbank.
HANDELSBANKEN | ANNUAL REPORT 2019 1
Highlights of the year
Operating profit fell by 1 per cent to SEK 21,796 million (22,013). Adjusted for foreign exchange effects, non-recurring items and special items, operating profit grew by SEK 55 million.
Return on equity decreased to 11.9 per cent (12.8).
The period’s profit after tax declined by 2 per cent to SEK 16,925 million (17,357).
Earnings per share decreased to SEK 8.65 (8.93).
Income grew by 2 per cent to SEK 44,564 million (43,770). Adjusted for foreign exchange effects and non-recurring items, income increased by 3 per cent.
Net interest income rose by 3 per cent to SEK 32,135 million (31,286).
Net fee and commission income rose by 4 per cent to SEK 10,697 million (10,247).
Expenses rose by 4 per cent to SEK -21,743 million (-20,890). Adjusted for foreign exchange effects, non-recurring items and special items, expenses grew by 5 per cent.
The C/I ratio rose to 48.8 per cent (47.7). Adjusted for foreign exchange effects, non-recurring items and special items, the C/I ratio was 48.3% (47.3).
The credit loss ratio was 0.04 per cent (0.04).
The common equity tier 1 ratio increased to 18.5 per cent (16.8).
The Board proposes a dividend of SEK 5.50 per share (5.50), and that the existing mandate to repurchase shares is extended for a further year.
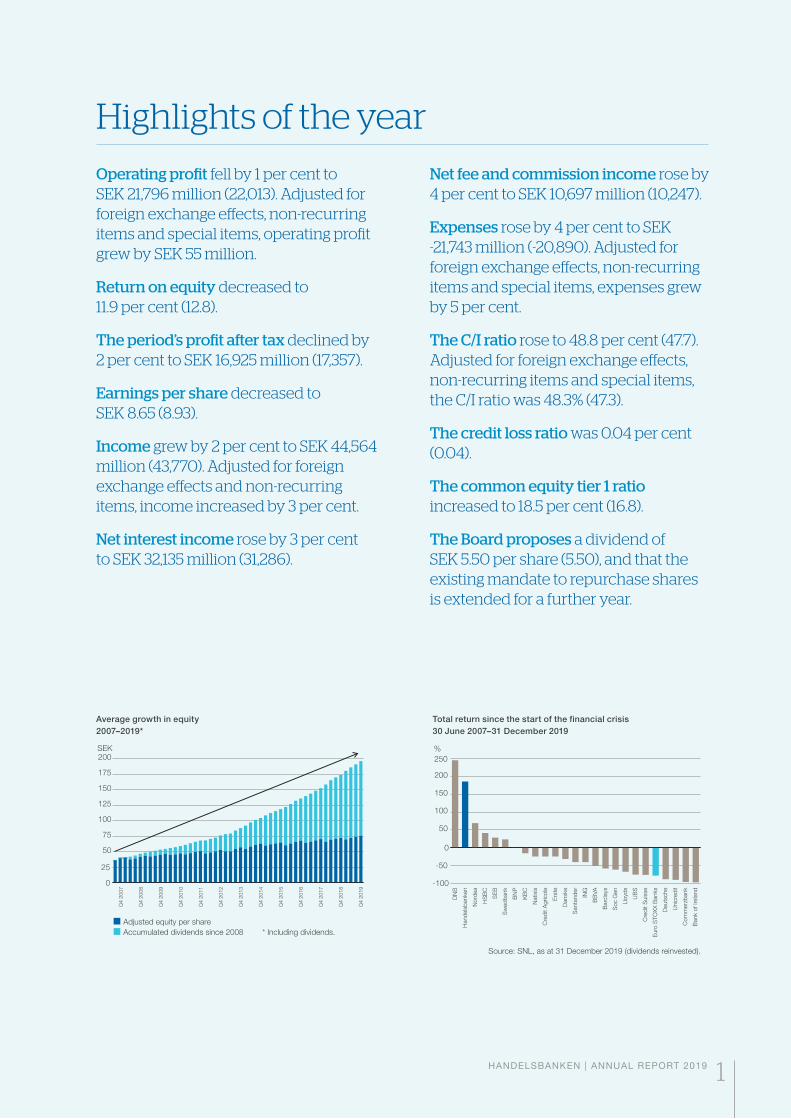
Average growth in equity
2007–2019*
0
25
50
75
100
125
150
175
200
SEK
Q4 2
007
Q4 2
008
Q4 2
009
Q4 2
010
Q4 2
011
Q4 2
012
Q4 2
013
Q4 2
014
Q4 2
015
Q4 2
016
Q4 2
017
Q4 2
018
Q4 2
019
Adjusted equity per share
Accumulated dividends since 2008 * Including dividends.
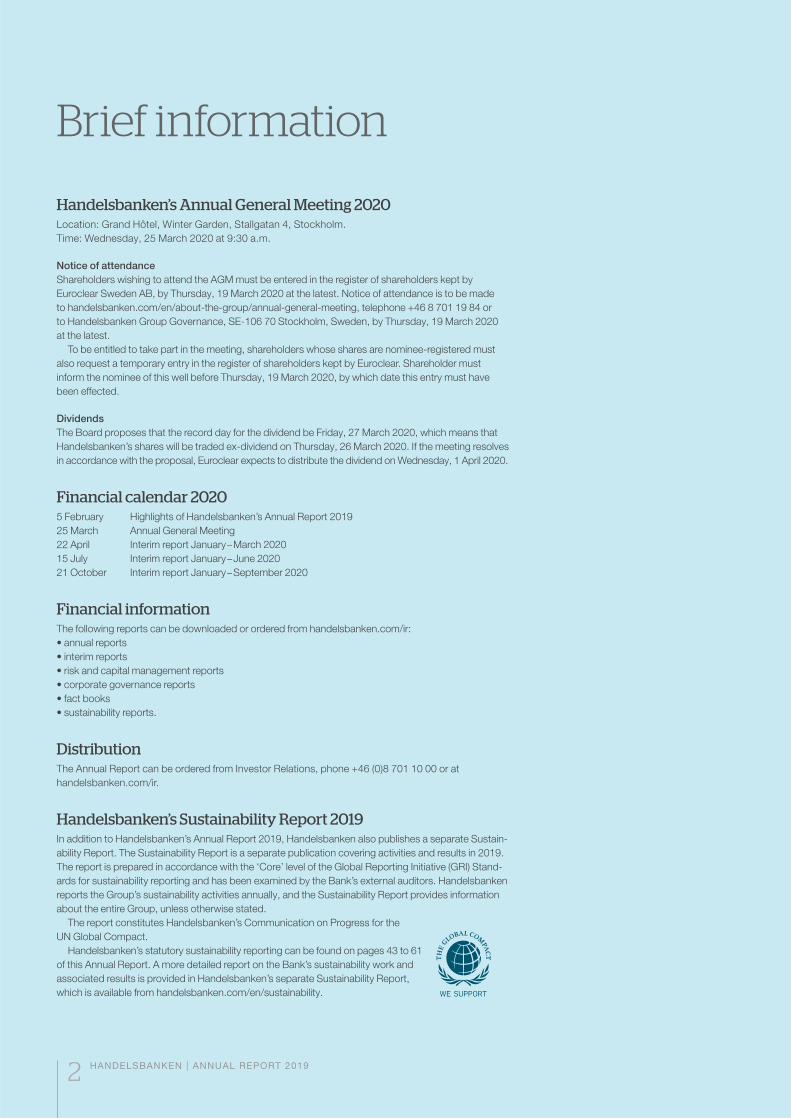
Total return since the start of the financial crisis
30 June 2007–31 December 2019
-100
-50
0
50
100
150
200
250
DN
B
Hand
els
banken
Nord
ea
HS
BC
SE
B
Sw
ed
bank
BN
P
KB
C
Natixis
Cre
dit A
gricole
Ers
te
Danske
Santa
nd
er
ING
BB
VA
Barc
lays
Soc G
en
Llo
yds
UB
S
Cre
dit S
uis
se
Euro
STO
XX
Banks
Deuts
che
Unic
red
it
Com
merz
bank
Bank o
f Irela
nd
%
Source: SNL, as at 31 December 2019 (dividends reinvested).
2 HANDELSBANKEN | ANNUAL REPORT 2019
Brief information
Handelsbanken’s Annual General Meeting 2020Location: Grand Hôtel, Winter Garden, Stallgatan 4, Stockholm.
Time: Wednesday, 25 March 2020 at 9:30 a.m.
Notice of attendance
Shareholders wishing to attend the AGM must be entered in the register of shareholders kept by
Euroclear Sweden AB, by Thursday, 19 March 2020 at the latest. Notice of attendance is to be made
to handelsbanken.com/en/about-the-group/annual-general-meeting, telephone +46 8 701 19 84 or
to Handelsbanken Group Governance, SE-106 70 Stockholm, Sweden, by Thursday, 19 March 2020
at the latest.
To be entitled to take part in the meeting, shareholders whose shares are nominee-registered must
also request a temporary entry in the register of shareholders kept by Euroclear. Shareholder must
inform the nominee of this well before Thursday, 19 March 2020, by which date this entry must have
been effected.
Dividends
The Board proposes that the record day for the dividend be Friday, 27 March 2020, which means that
Handelsbanken’s shares will be traded ex-dividend on Thursday, 26 March 2020. If the meeting resolves
in accordance with the proposal, Euroclear expects to distribute the dividend on Wednesday, 1 April 2020.
Financial calendar 20205 February Highlights of Handelsbanken’s Annual Report 2019
25 March Annual General Meeting
22 April Interim report January – March 2020
15 July Interim report January – June 2020
21 October Interim report January – September 2020
Financial informationThe following reports can be downloaded or ordered from handelsbanken.com/ir:
• annual reports
• interim reports
• risk and capital management reports
• corporate governance reports
• fact books
• sustainability reports.
DistributionThe Annual Report can be ordered from Investor Relations, phone +46 (0)8 701 10 00 or at
handelsbanken.com/ir.
Handelsbanken’s Sustainability Report 2019In addition to Handelsbanken’s Annual Report 2019, Handelsbanken also publishes a separate Sustain-
ability Report. The Sustainability Report is a separate publication covering activities and results in 2019.
The report is prepared in accordance with the ‘Core’ level of the Global Reporting Initiative (GRI) Stand-
ards for sustainability reporting and has been examined by the Bank’s external auditors. Handelsbanken
reports the Group’s sustainability activities annually, and the Sustainability Report provides information
about the entire Group, unless otherwise stated.
The report constitutes Handelsbanken’s Communication on Progress for the
UN Global Compact.
Handelsbanken’s statutory sustainability reporting can be found on pages 43 to 61
of this Annual Report. A more detailed report on the Bank’s sustainability work and
associated results is provided in Handelsbanken’s separate Sustainability Report,
which is available from handelsbanken.com/en/sustainability.
3
Contents
Svenska Handelsbanken AB (publ)
Corporate identity number: 502007-7862
Registered office: Stockholm
handelsbanken.com
This report is also available in Swedish. Every care has been taken in this
translation into English. In the event of discrepancies, the Swedish original
takes precedence over the English version.
The Group Chief Executive’s comments In a time of change 4
ADMINISTRATION REPORT THE GROUP
Contents 6
Concept and goal 7
Goal achievement 8
Our concept 10
Organisation and working methods 12
Enhanced focus – refined offering 14
Review of operations Financial overview 2019 16
Review of operations 17
Five-year overview, Group 20
Key figures per year 22
Quarterly performance 23
Business segments 24
Handelsbanken Sweden 26
Handelsbanken UK 28
Handelsbanken Norway 30
Handelsbanken Denmark 32
Handelsbanken Finland 34
Handelsbanken the Netherlands 36
Handelsbanken Capital Markets 38
The Handelsbanken share and shareholders 40
Sustainability reporting Sustainability Report 2019 43
Corporate Governance Report
Corporate Governance Report 2019 63
Corporate Governance structure 64
The Board 74
Executive management 76
FINANCIAL REPORTS THE GROUP
Contents 77
Income statement, Group 78
Statement of comprehensive income, Group 79
Balance sheet, Group 80
Statement of changes in equity, Group 81
Cash flow statement, Group 83
Notes, Group 84
ADMINISTRATION REPORT PARENT COMPANY 189
FINANCIAL REPORTS PARENT COMPANY
Contents 190
Income statement, Parent company 191
Statement of comprehensive income, Parent company 192
Balance sheet, Parent company 193
Statement of changes in equity, Parent company 194
Cash flow statement, Parent company 196
Five-year overview, Parent company 197
Notes, Parent company 199
SIGNATURES OF THE BOARD AND THE GROUP CHIEF EXECUTIVE
Signatures of the Board and the Group Chief Executive 237
AUDITOR’S REPORT
Auditor’s report 238
Auditor’s report on the sustainability reporting and statutory Sustainability Report 241
CONTACT DETAILS
Contents 243
Contact details 244
Branches and branch managers 246
Boards of subsidiaries 253
OTHER
Definitions and explanations 254
THE GROUP CHIEF EXECUTIVE’S COMMENTS
4 HANDELSBANKEN | ANNUAL REPORT 2019
In a time of change
For me, the 2020s started with skiing on New Year’s Day, sparkling snow
on the slopes, in the middle of Sweden. But just one hour by car to the
south, the ground was bare. Here, not even snow guns could keep the
pistes open at the ski resorts. While a snowless winter is definitely not one
of humanity’s greatest problems, it’s a reminder of something that may
very well become that: global climate change.
If the 2010s was the decade when more and more people became
aware of the issue and started talking about it, I believe that the 2020s will
be when we actually take action. This absolutely necessary transition to
a society which is more sustainable in the long term will affect everything
and everybody, what we do and how we do it. And of course this also
applies to Handelsbanken.
Sometimes it’s easy to get lost in what’s happening at present. Here
at Handelsbanken, we have spent the past year working very hard to step
up the pace of our digitalisation. The main part of this is in new solutions
for customers, new services and interfaces. But there is also integration
with external systems and – particularly – new applications to speed up
internal processes, business and control systems. A lot is happening,
things are moving quickly, and over time there will be a major transition,
both internally and for our customers.
At the same time, I don’t believe that this transition is what we will
remember when looking back at the 2020s. Instead, I hope that the dec-
ade ahead will be marked much more by how all of us – our customers,
we employees of the Bank and the rest of the world’s population – change
from wastefulness and a short-term approach to more sustainable solu-
tions for energy, water supply, transport solutions and more.
I‘m very much of an optimist, both in terms of the wider community and
Handelsbanken in particular. In fact, for our Bank, a long-term approach and
sustainability are not new. On the contrary, they are very natural parts of our
way of working. We have a simple, well-established idea of how to run our
bank, with lower costs and more satisfied customers than our competitors.
The foundation of this is our highly decentralised working method,
where each branch has a high degree of autonomy, with practically all
important business decisions being made locally. Since every branch
manager is responsible for their market and financial results, this creates
commitment, good administrative order and good control of costs.
Decentralisation also leads to strong local commitment, and consequently
more satisfied customers. Our customers like meeting the person who
makes the decision, someone who knows them well, knows their
business and knows the local market.
Over the years, this has proved to be a very effective way of running
a bank in terms of resources. The decisions don’t have to go through
time- consuming roundabout routes, and no more people than necessary
are involved, which makes the decisions just that little bit better. Because
of this, for a number of years, Handelsbanken has not only had more
satisfied customers than the sector average, but also lower credit losses,
particularly in times of financial turbulence.
Our zero tolerance of credit losses is not only a question of avoiding
unnecessary costs. A personal tragedy often lies behind many credit
losses, with major consequences for the individual. Credit losses also
tie up large resources, both within and outside the Bank.
We started the 2010s in the aftermath of a global financial crisis, with
great strain on the public economy. In Europe, not only banks, but also
a couple of countries were at risk of financial collapse. Huge efforts were
required both by governments and central banks. One of extremely few
banks worldwide that didn’t need support, either from central banks or its
shareholders, was Handelsbanken.
This is why I think that our approach to granting credits, with a low risk
tolerance, is also an important component in our ambition to run a bank
that adopts a long-term approach to sustainability. This is also sustaina-
bility for us – that in bad times too, Handelsbanken will never be part of the
problem. It will be part of the solution.
For many years, we have therefore built up stable finances with signifi-
cant reserves that provide us with staying power over time, regardless
of the market situation. The major rating agencies, independent judges
of banks’ financial endurance, also rank Handelsbanken as one of the
world’s strongest banks.
In other words, more satisfied customers, lower credit losses and
strong finances that are sustainable in the long term are the actual result
of an idea, consistently executed for almost half a century.
The idea that the independent local branch is the Bank, has some-
times been described as a bit old-fashioned – although strikingly often
by people who tend to have a somewhat old-fashioned view of what a
branch actually does. It doesn’t reflect the actual situation.
In fact, Handelsbanken’s branches are modern meeting places that
support – and also initiate – local business. In many ways, the branch of
• Handelsbanken’s operating profit for 2019 was SEK 21,796 million, a one per cent decrease compared to the previous year.
• The trend of significantly increasing costs, seen for a number of years, slowed down in 2019. In 2018, expenses grew by 10 per cent, while in the past year the increase was only 4 per cent.
• In the summer of 2019, Handelsbanken started a major project to concentrate operations to the Bank’s core business. This entails full focus on profitable products and services for the Bank’s core customers.
• The change initially involves costs and in the past year, the profit was burdened with a restructuring cost of SEK 930 million.
• In the long run, however, the change to a more focused, concentrated bank is expected to lead to considerably improved potential for stable profits and growth.
• The Board proposes a dividend of SEK 5.50 per share (5.50).
THE GROUP CHIEF EXECUTIVE’S COMMENTS
HANDELSBANKEN | ANNUAL REPORT 2019 5
today is very different from a branch in the early 2010s. In the years ahead,
this development will continue: staffing, skills and work tasks will change
ever more rapidly. But with their unique knowledge of customers and the
local market, our branches will continue to build long-term, personal
customer relationships. I do not believe that personal meetings will ever
become a thing of the past.
But various products and services may.
We have previously aimed to be a universal bank, offering all conceivable
types of financial solutions to our customers. This ambition has become
increasingly demanding of resources at a time when financial services are
increasing in number and becoming more complex, while new regulations
are making even more extensive demands. An obvious consequence is
that trying to be best at everything is a surefire path towards failing to excel
at anything. And just as important, let’s not forget that there has been
extremely little demand for some of our products and services.
So, in summer 2019, we decided to focus completely on the products
and services that our customers actually want, with solutions and markets
where we have good earnings and an acceptable level of risk, while clos-
ing down the parts with low demand, high risk or where we don’t have a
competitive offering. What remains is our core business, above all in lend-
ing and asset management, where we already have very high levels of
skills and demand.
And of course our idea of how to run our bank with a decentralised work
method remains. Our corporate goal is just as fixed: to attain higher profit-
ability than the average of our competitors, with more satisfied customers
and lower costs. Handelsbanken remains Handelsbanken, but just that bit
more effective, and more focused on what we are really good at.
At the time we presented this, our costs were developing in a direction
that we weren’t happy with. So this focus on our core business could be
perceived as part of a savings programme. But it isn’t – even if all our key
figures had been perfect, we would have done the same.
It’s not difficult to justify this: in addition to the conditions for long-term,
stable earnings, it also frees up resources, so that we can develop the
Bank even more quickly.
Not only can more resources be devoted to digitalisation, but we can
also concentrate our development efforts to a more streamlined selection
of products and services. This gives us more time and more focus for each
individual area, which will speed up the development of new solutions and
boost the quality of existing ones. This applies particularly to adaptations
and improvements using new technical solutions to be developed in the
2020s – which include 5G and artificial intelligence.
But not only are we moving away from products and services with low
demand, high risk and poor earnings, we are also rejecting what we consider
is not sustainable in the long term for other reasons. One example is our
asset management, where in principle all Handelsbanken’s funds are
managed with what are known as enhanced exclusion criteria. This means
that the funds don’t invest in companies involved in, for example, arms
manufacture, cannabis, tobacco or fossil fuels.
Throughout the Bank we are also working to identify the environmental
consequences that our business operations might entail. In 2019,
Handels banken endorsed the Principles for Responsible Banking (PRB).
We are also working with and continue to support other international initia-
tives for corporate sustainability, such as the 2030 Agenda for Sustainable
Development and the Sustainable Development Goals, the United Nations
Global Compact and the Principles for Responsible Investment (PRI). We
will also continue to expand our reporting in line with international frame-
works and emerging standards, such as TCFD.
These are just a few examples among many. But we will need to do
more – the 2020s will see all the necessary changes that must be carried
out to create a more sustainable society. I believe we will be able to do
this, since I think that people basically want to do the right thing.
I also work at a bank whose whole idea is based on that conviction.
This is why we work in a decentralised way – if you give people trust
and responsibility, they will do their utmost to meet expectations. And
quite often exceed them. I see this every day, all around our Bank and
I would therefore like to conclude by extending my warmest thanks to all
employees of the Bank for the fantastic work you have done in 2019.
I would also like to thank all our shareholders and our customers for
the trust you have placed in us. We will do our very best to live up to your
expectations, or preferably exceed them.
Stockholm, February 2020
Carina Åkerström, President and Group Chief Executive
6
Administration report
CONTENTS
Concept and goal 7
Goal achievement 8
Our concept 10
Organisation and working methods 12
Enhanced focus – refined offering 14
FINANCIAL OVERVIEW 2019 16
REVIEW OF OPERATIONS 17
FIVE-YEAR OVERVIEW, GROUP 20
KEY FIGURES PER YEAR 22
QUARTERLY PERFORMANCE 23
BUSINESS SEGMENTS 24
Handelsbanken Sweden 26
Handelsbanken UK 28
Handelsbanken Norway 30
Handelsbanken Denmark 32
Handelsbanken Finland 34
Handelsbanken the Netherlands 36
Handelsbanken Capital Markets 38
THE HANDELSBANKEN SHARE AND SHAREHOLDERS 40
SUSTAINABILITY REPORT 2019 43
CORPORATE GOVERNANCE REPORT 2019 63
Contents Corporate Governance Report 63
Corporate Governance structure 64
The Board 74
Executive management 76
CONCEPT AND GOAL | ADMINISTRATION REPORT
HANDELSBANKEN | ANNUAL REPORT 2019 7
ConceptThrough a decentralised way of working, digital solutions, stable finances and a low risk tolerance, Handelsbanken builds long-term customer relationships across networks of local branches.
Handelsbanken has well-defined business operations, which are continuously being adapted and developed to meet the expectations, needs and wants of the Bank’s core customers.
GoalHandelsbanken’s goal is to have better profitability than the average of comparable competitors in its home markets.
One of the purposes of Handelsbanken’s corporate goal is to offer shareholders long-term,
high growth in value expressed in increasing earnings per share over a business cycle.
High and sustainable levels of profitability are crucial, not only because this attracts
shareholders to invest in the Bank, but also because it makes the Bank an attractive
employer, and creates the conditions for growth, a high rating and low funding costs,
and for the Bank’s lending capacity – meaning the Bank can function smoothly and
support our customers’ operations, whatever the prevailing business environment.
This goal is mainly to be achieved by having more satisfied customers and lower costs
than those of competitors.
GOAL ACHIEVEMENT | ADMINISTRATION REPORT
8 HANDELSBANKEN | ANNUAL REPORT 2019
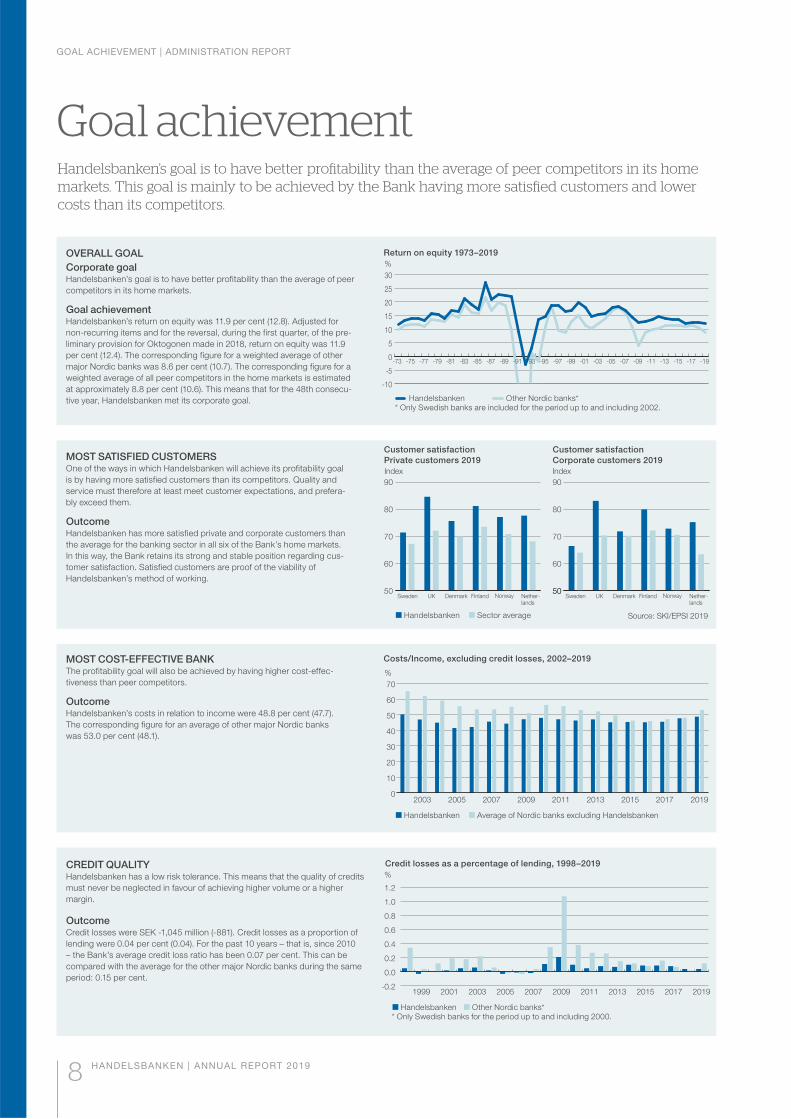
Goal achievementHandelsbanken’s goal is to have better profitability than the average of peer competitors in its home markets. This goal is mainly to be achieved by the Bank having more satisfied customers and lower costs than its competitors.
OVERALL GOAL
Corporate goalHandelsbanken’s goal is to have better profitability than the average of peer
competitors in its home markets.
Goal achievementHandelsbanken’s return on equity was 11.9 per cent (12.8). Adjusted for
non-recurring items and for the reversal, during the first quarter, of the pre-
liminary provision for Oktogonen made in 2018, return on equity was 11.9
per cent (12.4). The corresponding figure for a weighted average of other
major Nordic banks was 8.6 per cent (10.7). The corresponding figure for a
weighted average of all peer competitors in the home markets is estimated
at approximately 8.8 per cent (10.6). This means that for the 48th consecu-
tive year, Handelsbanken met its corporate goal.
Return on equity 1973–2019
MOST COST-EFFECTIVE BANKThe profitability goal will also be achieved by having higher cost-effec-
tiveness than peer competitors.
OutcomeHandelsbanken’s costs in relation to income were 48.8 per cent (47.7).
The corresponding figure for an average of other major Nordic banks
was 53.0 per cent (48.1).
Costs/Income, excluding credit losses, 2002–2019
%
0
10
20
30
40
50
60
70
201920172015201320112009200720052003
Customer satisfaction
Private customers 2019
Customer satisfaction
Corporate customers 2019MOST SATISFIED CUSTOMERSOne of the ways in which Handelsbanken will achieve its profitability goal
is by having more satisfied customers than its competitors. Quality and
service must therefore at least meet customer expectations, and prefera-
bly exceed them.
OutcomeHandelsbanken has more satisfied private and corporate customers than
the average for the banking sector in all six of the Bank’s home markets.
In this way, the Bank retains its strong and stable position regarding cus-
tomer satisfaction. Satisfied customers are proof of the viability of
Handels banken’s method of working.
50
60
70
80
90
50
60
70
80
90
Index Index
50DenmarkSweden FinlandUK Nether-
landsNorway DenmarkSweden FinlandUK Nether-
landsNorway
Source: SKI/EPSI 2019 Handelsbanken Sector average
Handelsbanken Average of Nordic banks excluding Handelsbanken
CREDIT QUALITYHandelsbanken has a low risk tolerance. This means that the quality of credits
must never be neglected in favour of achieving higher volume or a higher
margin.
Outcome Credit losses were SEK -1,045 million (-881). Credit losses as a proportion of
lending were 0.04 per cent (0.04). For the past 10 years – that is, since 2010
– the Bank’s average credit loss ratio has been 0.07 per cent. This can be
compared with the average for the other major Nordic banks during the same
period: 0.15 per cent.
Credit losses as a percentage of lending, 1998–2019
%
-0.2
0.0
0.2
0.4
0.6
0.8
1.0
1.2
20192017201520132011200920072005200320011999
-10
-5
0
5
10
15
20
25
30
-19-17-15-13-11-09-07-05-03-01-99-97-95-93-91-89-87-85-83-81-79-77-75-73
%
Handelsbanken Other Nordic banks* * Only Swedish banks are included for the period up to and including 2002.
Handelsbanken Other Nordic banks* * Only Swedish banks for the period up to and including 2000.
GOAL ACHIEVEMENT | ADMINISTRATION REPORT
HANDELSBANKEN | ANNUAL REPORT 2019 9
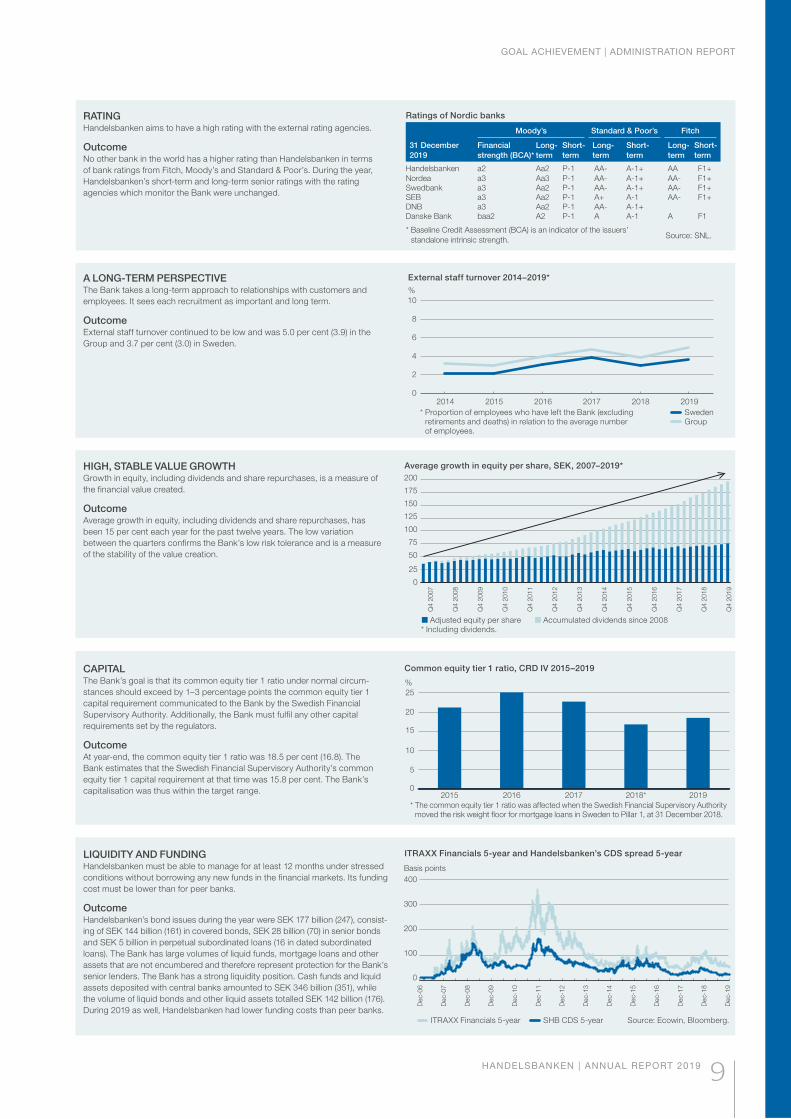
RATINGHandelsbanken aims to have a high rating with the external rating agencies.
Outcome No other bank in the world has a higher rating than Handelsbanken in terms
of bank ratings from Fitch, Moody’s and Standard & Poor’s. During the year,
Handelsbanken’s short-term and long-term senior ratings with the rating
agencies which monitor the Bank were unchanged.
Ratings of Nordic banks
Moody’s Standard & Poor’s Fitch
31 December
2019
Financial
strength (BCA)*
Long-
term
Short-
term
Long-
term
Short-
term
Long-
term
Short-
term
Handelsbanken a2 Aa2 P-1 AA- A-1+ AA F1+
Nordea a3 Aa3 P-1 AA- A-1+ AA- F1+Swedbank a3 Aa2 P-1 AA- A-1+ AA- F1+SEB a3 Aa2 P-1 A+ A-1 AA- F1+DNB a3 Aa2 P-1 AA- A-1+Danske Bank baa2 A2 P-1 A A-1 A F1
* Baseline Credit Assessment (BCA) is an indicator of the issuers’
standalone intrinsic strength.
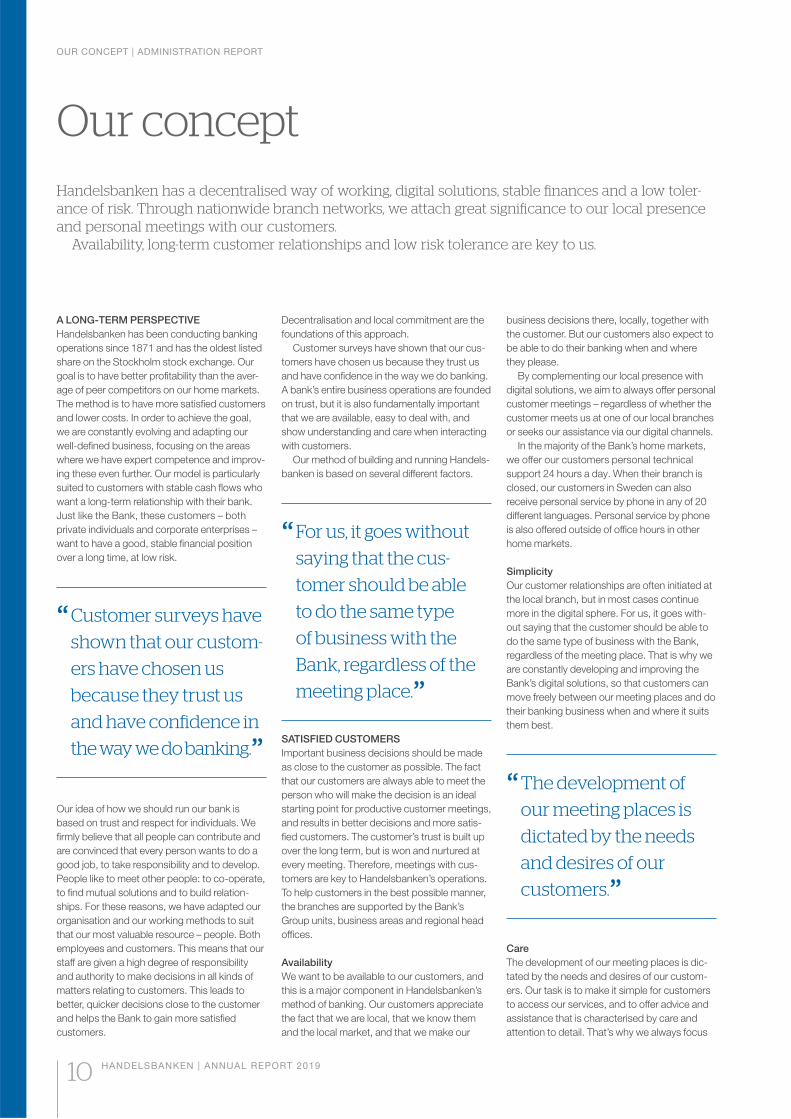
External staff turnover 2014–2019*
%
0
2
4
6
8
10
201920182017201620152014
A LONG-TERM PERSPECTIVEThe Bank takes a long-term approach to relationships with customers and
employees. It sees each recruitment as important and long term.
Outcome External staff turnover continued to be low and was 5.0 per cent (3.9) in the
Group and 3.7 per cent (3.0) in Sweden.
Source: SNL.
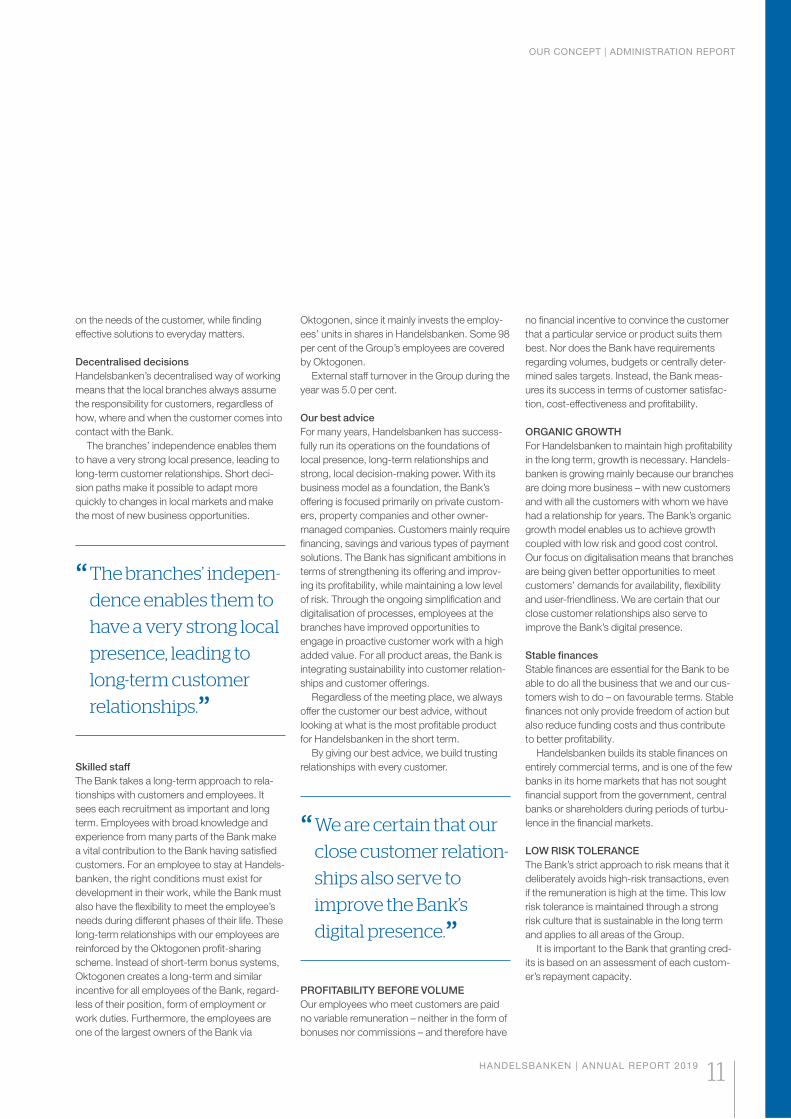
HIGH, STABLE VALUE GROWTHGrowth in equity, including dividends and share repurchases, is a measure of
the financial value created.
OutcomeAverage growth in equity, including dividends and share repurchases, has
been 15 per cent each year for the past twelve years. The low variation
between the quarters confirms the Bank’s low risk tolerance and is a measure
of the stability of the value creation.
0
25
50
75
100
125
150
175
200
Q4 2
007
Q4 2
008
Q4 2
009
Q4 2
010
Q4 2
011
Q4 2
012
Q4 2
013
Q4 2
014
Q4 2
015
Q4 2
016
Q4 2
017
Q4 2
018
Q4 2
019
Average growth in equity per share, SEK, 2007–2019*
Common equity tier 1 ratio, CRD IV 2015–2019
%
0
5
10
15
20
25
20192018*201720162015
CAPITALThe Bank’s goal is that its common equity tier 1 ratio under normal circum-
stances should exceed by 1–3 percentage points the common equity tier 1
capital requirement communicated to the Bank by the Swedish Financial
Supervisory Authority. Additionally, the Bank must fulfil any other capital
requirements set by the regulators.
OutcomeAt year-end, the common equity tier 1 ratio was 18.5 per cent (16.8). The
Bank estimates that the Swedish Financial Supervisory Authority’s common
equity tier 1 capital requirement at that time was 15.8 per cent. The Bank’s
capitalisation was thus within the target range.
* The common equity tier 1 ratio was affected when the Swedish Financial Supervisory Authority moved the risk weight floor for mortgage loans in Sweden to Pillar 1, at 31 December 2018.
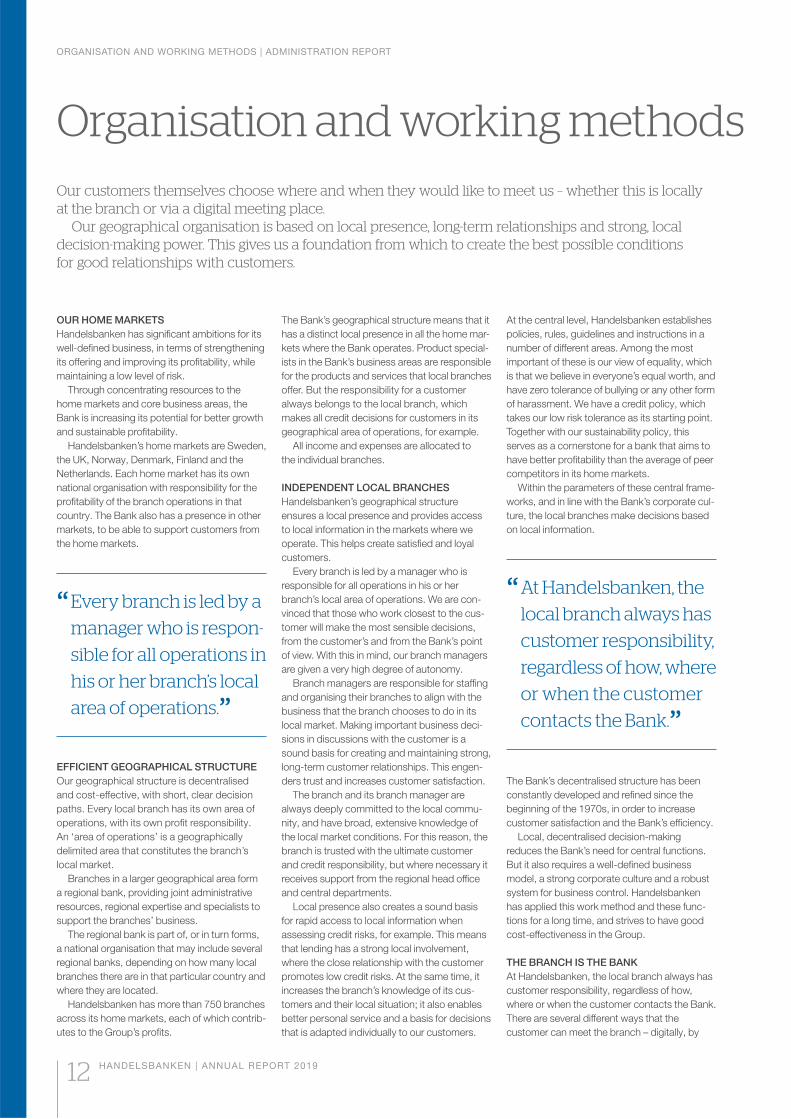
LIQUIDITY AND FUNDINGHandelsbanken must be able to manage for at least 12 months under stressed
conditions without borrowing any new funds in the financial markets. Its funding
cost must be lower than for peer banks.
Outcome Handelsbanken’s bond issues during the year were SEK 177 billion (247), consist-
ing of SEK 144 billion (161) in covered bonds, SEK 28 billion (70) in senior bonds
and SEK 5 billion in perpetual subordinated loans (16 in dated subordinated
loans). The Bank has large volumes of liquid funds, mortgage loans and other
assets that are not encumbered and therefore represent protection for the Bank’s
senior lenders. The Bank has a strong liquidity position. Cash funds and liquid
assets deposited with central banks amounted to SEK 346 billion (351), while
the volume of liquid bonds and other liquid assets totalled SEK 142 billion (176).
During 2019 as well, Handelsbanken had lower funding costs than peer banks.
Basis points
0
100
200
300
400
Dec-0
6
Dec-0
7
Dec-0
8
Dec-0
9
Dec-1
0
Dec-1
1
Dec-1
2
Dec-1
3
Dec-1
4
Dec-1
5
Dec-1
6
Dec-1
7
Dec-1
8
Dec-1
9
ITRAXX Financials 5-year and Handelsbanken’s CDS spread 5-year
* Proportion of employees who have left the Bank (excluding retirements and deaths) in relation to the average number of employees.
Sweden Group
Adjusted equity per share Accumulated dividends since 2008 * Including dividends.
ITRAXX Financials 5-year SHB CDS 5-year Source: Ecowin, Bloomberg.
OUR CONCEPT | ADMINISTRATION REPORT
10 HANDELSBANKEN | ANNUAL REPORT 2019
Our conceptHandelsbanken has a decentralised way of working, digital solutions, stable finances and a low toler-ance of risk. Through nationwide branch networks, we attach great significance to our local presence and personal meetings with our customers.
Availability, long-term customer relationships and low risk tolerance are key to us.
A LONG-TERM PERSPECTIVE
Handelsbanken has been conducting banking
operations since 1871 and has the oldest listed
share on the Stockholm stock exchange. Our
goal is to have better profitability than the aver-
age of peer competitors on our home markets.
The method is to have more satisfied customers
and lower costs. In order to achieve the goal,
we are constantly evolving and adapting our
well-defined business, focusing on the areas
where we have expert competence and improv-
ing these even further. Our model is particularly
suited to customers with stable cash flows who
want a long-term relationship with their bank.
Just like the Bank, these customers – both
private individuals and corporate enterprises –
want to have a good, stable financial position
over a long time, at low risk.
“ Customer surveys have
shown that our custom-
ers have chosen us
because they trust us
and have confidence in
the way we do banking.”Our idea of how we should run our bank is
based on trust and respect for individuals. We
firmly believe that all people can contribute and
are convinced that every person wants to do a
good job, to take responsibility and to develop.
People like to meet other people: to co-operate,
to find mutual solutions and to build relation-
ships. For these reasons, we have adapted our
organisation and our working methods to suit
that our most valuable resource – people. Both
employees and customers. This means that our
staff are given a high degree of responsibility
and authority to make decisions in all kinds of
matters relating to customers. This leads to
better, quicker decisions close to the customer
and helps the Bank to gain more satisfied
customers.
Decentralisation and local commitment are the
foundations of this approach.
Customer surveys have shown that our cus-
tomers have chosen us because they trust us
and have confidence in the way we do banking.
A bank’s entire business operations are founded
on trust, but it is also fundamentally important
that we are available, easy to deal with, and
show understanding and care when interacting
with customers.
Our method of building and running Handels-
banken is based on several different factors.
“ For us, it goes without
saying that the cus-
tomer should be able
to do the same type
of business with the
Bank, regardless of the
meeting place.”SATISFIED CUSTOMERS
Important business decisions should be made
as close to the customer as possible. The fact
that our customers are always able to meet the
person who will make the decision is an ideal
starting point for productive customer meetings,
and results in better decisions and more satis-
fied customers. The customer’s trust is built up
over the long term, but is won and nurtured at
every meeting. Therefore, meetings with cus-
tomers are key to Handelsbanken’s operations.
To help customers in the best possible manner,
the branches are supported by the Bank’s
Group units, business areas and regional head
offices.
Availability
We want to be available to our customers, and
this is a major component in Handelsbanken’s
method of banking. Our customers appreciate
the fact that we are local, that we know them
and the local market, and that we make our
business decisions there, locally, together with
the customer. But our customers also expect to
be able to do their banking when and where
they please.
By complementing our local presence with
digital solutions, we aim to always offer personal
customer meetings – regardless of whether the
customer meets us at one of our local branches
or seeks our assistance via our digital channels.
In the majority of the Bank’s home markets,
we offer our customers personal technical
support 24 hours a day. When their branch is
closed, our customers in Sweden can also
receive personal service by phone in any of 20
different languages. Personal service by phone
is also offered outside of office hours in other
home markets.
Simplicity
Our customer relationships are often initiated at
the local branch, but in most cases continue
more in the digital sphere. For us, it goes with-
out saying that the customer should be able to
do the same type of business with the Bank,
regardless of the meeting place. That is why we
are constantly developing and improving the
Bank’s digital solutions, so that customers can
move freely between our meeting places and do
their banking business when and where it suits
them best.
“ The development of
our meeting places is
dictated by the needs
and desires of our
customers.”Care
The development of our meeting places is dic-
tated by the needs and desires of our custom-
ers. Our task is to make it simple for customers
to access our services, and to offer advice and
assistance that is characterised by care and
attention to detail. That’s why we always focus
OUR CONCEPT | ADMINISTRATION REPORT
HANDELSBANKEN | ANNUAL REPORT 2019 11
on the needs of the customer, while finding
effective solutions to everyday matters.
Decentralised decisions
Handelsbanken’s decentralised way of working
means that the local branches always assume
the responsibility for customers, regardless of
how, where and when the customer comes into
contact with the Bank.
The branches’ independence enables them
to have a very strong local presence, leading to
long-term customer relationships. Short deci-
sion paths make it possible to adapt more
quickly to changes in local markets and make
the most of new business opportunities.
“ The branches’ indepen-
dence enables them to
have a very strong local
presence, leading to
long-term customer
relationships.”Skilled staff
The Bank takes a long-term approach to rela-
tionships with customers and employees. It
sees each recruitment as important and long
term. Employees with broad knowledge and
experience from many parts of the Bank make
a vital contribution to the Bank having satisfied
customers. For an employee to stay at Handels-
banken, the right conditions must exist for
development in their work, while the Bank must
also have the flexibility to meet the employee’s
needs during different phases of their life. These
long-term relationships with our employees are
reinforced by the Oktogonen profit-sharing
scheme. Instead of short-term bonus systems,
Oktogonen creates a long-term and similar
incentive for all employees of the Bank, regard-
less of their position, form of employment or
work duties. Furthermore, the employees are
one of the largest owners of the Bank via
no financial incentive to convince the customer
that a particular service or product suits them
best. Nor does the Bank have requirements
regarding volumes, budgets or centrally deter-
mined sales targets. Instead, the Bank meas-
ures its success in terms of customer satisfac-
tion, cost-effectiveness and profitability.
ORGANIC GROWTH
For Handelsbanken to maintain high profitability
in the long term, growth is necessary. Handels-
banken is growing mainly because our branches
are doing more business – with new customers
and with all the customers with whom we have
had a relationship for years. The Bank’s organic
growth model enables us to achieve growth
coupled with low risk and good cost control.
Our focus on digitalisation means that branches
are being given better opportunities to meet
customers’ demands for availability, flexibility
and user-friendliness. We are certain that our
close customer relationships also serve to
improve the Bank’s digital presence.
Stable finances
Stable finances are essential for the Bank to be
able to do all the business that we and our cus-
tomers wish to do – on favourable terms. Stable
finances not only provide freedom of action but
also reduce funding costs and thus contribute
to better profitability.
Handelsbanken builds its stable finances on
entirely commercial terms, and is one of the few
banks in its home markets that has not sought
financial support from the government, central
banks or shareholders during periods of turbu-
lence in the financial markets.
LOW RISK TOLERANCE
The Bank’s strict approach to risk means that it
deliberately avoids high-risk transactions, even
if the remuneration is high at the time. This low
risk tolerance is maintained through a strong
risk culture that is sustainable in the long term
and applies to all areas of the Group.
It is important to the Bank that granting cred-
its is based on an assessment of each custom-
er’s repayment capacity.
Oktogonen, since it mainly invests the employ-
ees’ units in shares in Handelsbanken. Some 98
per cent of the Group’s employees are covered
by Oktogonen.
External staff turnover in the Group during the
year was 5.0 per cent.
Our best advice
For many years, Handelsbanken has success-
fully run its operations on the foundations of
local presence, long-term relationships and
strong, local decision-making power. With its
business model as a foundation, the Bank’s
offering is focused primarily on private custom-
ers, property companies and other owner-
managed companies. Customers mainly require
financing, savings and various types of payment
solutions. The Bank has significant ambitions in
terms of strengthening its offering and improv-
ing its profitability, while maintaining a low level
of risk. Through the ongoing simplification and
digitalisation of processes, employees at the
branches have improved opportunities to
engage in proactive customer work with a high
added value. For all product areas, the Bank is
integrating sustainability into customer relation-
ships and customer offerings.
Regardless of the meeting place, we always
offer the customer our best advice, without
looking at what is the most profitable product
for Handelsbanken in the short term.
By giving our best advice, we build trusting
relationships with every customer.
“ We are certain that our
close customer relation-
ships also serve to
improve the Bank’s
digital presence.”PROFITABILITY BEFORE VOLUME
Our employees who meet customers are paid
no variable remuneration – neither in the form of
bonuses nor commissions – and therefore have
ORGANISATION AND WORKING METHODS | ADMINISTRATION REPORT
12 HANDELSBANKEN | ANNUAL REPORT 2019
Organisation and working methodsOur customers themselves choose where and when they would like to meet us – whether this is locally at the branch or via a digital meeting place.
Our geographical organisation is based on local presence, long-term relationships and strong, local decision-making power. This gives us a foundation from which to create the best possible conditions for good relationships with customers.
OUR HOME MARKETS
Handelsbanken has significant ambitions for its
well-defined business, in terms of strengthening
its offering and improving its profitability, while
maintaining a low level of risk.
Through concentrating resources to the
home markets and core business areas, the
Bank is increasing its potential for better growth
and sustainable profitability.
Handelsbanken’s home markets are Sweden,
the UK, Norway, Denmark, Finland and the
Netherlands. Each home market has its own
national organisation with responsibility for the
profitability of the branch operations in that
country. The Bank also has a presence in other
markets, to be able to support customers from
the home markets.
“ Every branch is led by a
manager who is respon-
sible for all operations in
his or her branch’s local
area of operations.”EFFICIENT GEOGRAPHICAL STRUCTURE
Our geographical structure is decentralised
and cost-effective, with short, clear decision
paths. Every local branch has its own area of
operations, with its own profit responsibility.
An ‘area of operations’ is a geographically
delimited area that constitutes the branch’s
local market.
Branches in a larger geographical area form
a regional bank, providing joint administrative
resources, regional expertise and specialists to
support the branches’ business.
The regional bank is part of, or in turn forms,
a national organisation that may include several
regional banks, depending on how many local
branches there are in that particular country and
where they are located.
Handelsbanken has more than 750 branches
across its home markets, each of which contrib-
utes to the Group’s profits.
The Bank’s geographical structure means that it
has a distinct local presence in all the home mar-
kets where the Bank operates. Product special-
ists in the Bank’s business areas are responsible
for the products and services that local branches
offer. But the responsibility for a customer
always belongs to the local branch, which
makes all credit decisions for customers in its
geographical area of operations, for example.
All income and expenses are allocated to
the individual branches.
INDEPENDENT LOCAL BRANCHES
Handelsbanken’s geographical structure
ensures a local presence and provides access
to local information in the markets where we
operate. This helps create satisfied and loyal
customers.
Every branch is led by a manager who is
responsible for all operations in his or her
branch’s local area of operations. We are con-
vinced that those who work closest to the cus-
tomer will make the most sensible decisions,
from the customer’s and from the Bank’s point
of view. With this in mind, our branch managers
are given a very high degree of autonomy.
Branch managers are responsible for staffing
and organising their branches to align with the
business that the branch chooses to do in its
local market. Making important business deci-
sions in discussions with the customer is a
sound basis for creating and maintaining strong,
long-term customer relationships. This engen-
ders trust and increases customer satisfaction.
The branch and its branch manager are
always deeply committed to the local commu-
nity, and have broad, extensive knowledge of
the local market conditions. For this reason, the
branch is trusted with the ultimate customer
and credit responsibility, but where necessary it
receives support from the regional head office
and central departments.
Local presence also creates a sound basis
for rapid access to local information when
assessing credit risks, for example. This means
that lending has a strong local involvement,
where the close relationship with the customer
promotes low credit risks. At the same time, it
increases the branch’s knowledge of its cus-
tomers and their local situation; it also enables
better personal service and a basis for decisions
that is adapted individually to our customers.
At the central level, Handelsbanken establishes
policies, rules, guidelines and instructions in a
number of different areas. Among the most
important of these is our view of equality, which
is that we believe in everyone’s equal worth, and
have zero tolerance of bullying or any other form
of harassment. We have a credit policy, which
takes our low risk tolerance as its starting point.
Together with our sustainability policy, this
serves as a cornerstone for a bank that aims to
have better profitability than the average of peer
competitors in its home markets.
Within the parameters of these central frame-
works, and in line with the Bank’s corporate cul-
ture, the local branches make decisions based
on local information.
“ At Handelsbanken, the
local branch always has
customer responsibility,
regardless of how, where
or when the customer
contacts the Bank.”The Bank’s decentralised structure has been
constantly developed and refined since the
beginning of the 1970s, in order to increase
customer satisfaction and the Bank’s efficiency.
Local, decentralised decision-making
reduces the Bank’s need for central functions.
But it also requires a well-defined business
model, a strong corporate culture and a robust
system for business control. Handelsbanken
has applied this work method and these func-
tions for a long time, and strives to have good
cost-effectiveness in the Group.
THE BRANCH IS THE BANK
At Handelsbanken, the local branch always has
customer responsibility, regardless of how,
where or when the customer contacts the Bank.
There are several different ways that the
customer can meet the branch – digitally, by
ORGANISATION AND WORKING METHODS | ADMINISTRATION REPORT
HANDELSBANKEN | ANNUAL REPORT 2019 13
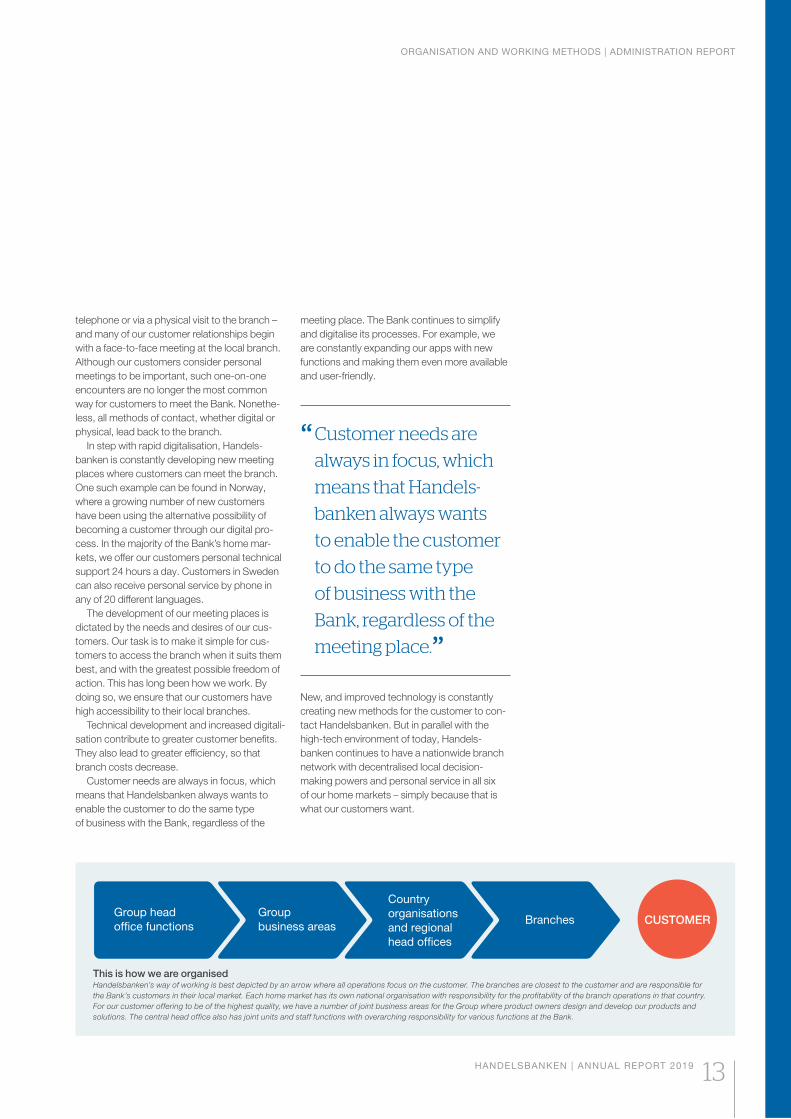
This is how we are organisedHandelsbanken’s way of working is best depicted by an arrow where all operations focus on the customer. The branches are closest to the customer and are responsible for
the Bank’s customers in their local market. Each home market has its own national organisation with responsibility for the profitability of the branch operations in that country.
For our customer offering to be of the highest quality, we have a number of joint business areas for the Group where product owners design and develop our products and
solutions. The central head office also has joint units and staff functions with overarching responsibility for various functions at the Bank.
Group
business areasBranches
Country
organisations
and regional
head offices
CUSTOMERGroup head
office functions
telephone or via a physical visit to the branch –
and many of our customer relationships begin
with a face-to-face meeting at the local branch.
Although our customers consider personal
meetings to be important, such one-on-one
encounters are no longer the most common
way for customers to meet the Bank. Nonethe-
less, all methods of contact, whether digital or
physical, lead back to the branch.
In step with rapid digitalisation, Handels-
banken is constantly developing new meeting
places where customers can meet the branch.
One such example can be found in Norway,
where a growing number of new customers
have been using the alternative possibility of
becoming a customer through our digital pro-
cess. In the majority of the Bank’s home mar-
kets, we offer our customers personal technical
support 24 hours a day. Customers in Sweden
can also receive personal service by phone in
any of 20 different languages.
The development of our meeting places is
dictated by the needs and desires of our cus-
tomers. Our task is to make it simple for cus-
tomers to access the branch when it suits them
best, and with the greatest possible freedom of
action. This has long been how we work. By
doing so, we ensure that our customers have
high accessibility to their local branches.
Technical development and increased digitali-
sation contribute to greater customer benefits.
They also lead to greater efficiency, so that
branch costs decrease.
Customer needs are always in focus, which
means that Handelsbanken always wants to
enable the customer to do the same type
of business with the Bank, regardless of the
meeting place. The Bank continues to simplify
and digitalise its processes. For example, we
are constantly expanding our apps with new
functions and making them even more available
and user-friendly.
“ Customer needs are
always in focus, which
means that Handels-
banken always wants
to enable the customer
to do the same type
of business with the
Bank, regardless of the
meeting place.”New, and improved technology is constantly
creating new methods for the customer to con-
tact Handelsbanken. But in parallel with the
high-tech environment of today, Handels-
banken continues to have a nationwide branch
network with decentralised local decision-
making powers and personal service in all six
of our home markets – simply because that is
what our customers want.
ENHANCED FOCUS – REFINED OFFERING | ADMINISTRATION REPORT
14 HANDELSBANKEN | ANNUAL REPORT 2019
Enhanced focus – refined offering
Handelsbanken has taken the first steps on a journey. The goal remains what it has always been – better profitability than the average of peer competitors. The method is also unchanged – lower costs and more satisfied customers. Our guiding principles have not changed. Handelsbanken continues to be Handelsbanken. But if we are to achieve our goal, we need to change tack slightly. The new direction is clearly plotted out – we will be focusing on the areas where we have expert competence and improving these even further.
The idea of being a full-service bank and trying to do everything, for every-
body, is now in the past. This idea could only work in a time when it was
less expensive to run a bank than it is today. Instead, we are concentrat-
ing on our core customers and our core business areas, where our earn-
ings are stable and risk remains low. These are the hallmarks of our core
business. As a more focused bank, we can create an even higher quality
customer offering, which will benefit sustainable profitability and capital
efficiency.
“ As a more focused bank, we can
create an even higher quality customer
offering, which will benefit sustainable
profitability and capital efficiency.”THE WAY FORWARD
We start from a position of strength. The Bank has an excellent reputa-
tion and enjoys high levels of customer satisfaction in all of our home
markets, in Sweden, the UK, Norway, Denmark, Finland and the Nether-
lands. As a result, customer expectations are high, which means that the
Bank’s ambitions need to be equally high. Our customers should per-
ceive us to be an even more attractive bank when we so clearly choose
to concentrate our resources on the areas they demand.
Handelsbanken’s model, with local presence, long-term customer rela-
tionships and strong local decision-making power, is particularly suited to
customers with stable cash flows who want a long-term relationship with
their bank. Just like the Bank, our private and corporate customers want
to have a good, stable financial position over a long period, at low risk.
With its business model as a foundation, the Bank’s offering is focused
primarily on private customers, property companies and other owner-
managed companies. The local branches provide advice and personal
service. The customers’ main demands are various kinds of financing,
such as mortgage loans, corporate financing and capital market financ-
ing, and risk management. They also demand offerings within savings,
such as asset management, pensions and insurance, private banking
and various security solutions.
The breakdown of products and services varies between the different
branches and between the home markets. However, one thing that they
all have in common is that they are associated with high customer satis-
faction and good profitability.
The constant adjustments we implement to meet the demands of our
customers are made easier by the fact that our customers are both loyal
and demanding. Every day, our branches meet customers who do busi-
ness with us, and who clearly explain what they would like us to do bet-
ter. The customers know that we always take a long-term approach and
have their best interests in mind. This gives a sound basis for mutually
trusting customer relationships.
INCREASED DIGITALISATION
The Bank’s local, personal service at the branches is valued highly, but
our customers also say that we should be even more accessible digitally.
The Bank’s streamlined focus creates improved conditions for further
increasing the pace of digitalisation. The proportion of development
investments put into digital customer solutions has steadily grown. At the
same time, we also need to ensure that we deliver top-class digital tools
to the branches, so that they can devote their time to customers and
business rather than administration, thereby improving efficiency across
the branch network.
It must be simple to be a customer of Handelsbanken – and it must be
simple for our employees to take care of our customers.
Simplified and digitalised processes give employees at the branches
more time for proactive customer work that creates a high added value.
At its core, it is a matter of reducing complexity.
PERSONAL CUSTOMER RELATIONS
The world is going digital, but this does not lessen the need for personal
service and good advice – quite the opposite, in fact. For Handels-
banken, it is a matter of improving and deepening personal, long-term
customer relationships, regardless of meeting place. These relationships
are what makes the Bank unique, and are an indisputable competitive
advantage.
All meeting places must be easily accessible, and developed from an
understanding of the customers’ needs. A positive customer experience
should be inextricably linked with our bank, regardless of whether we meet
the customer via their mobile, the internet, at the branch or by phone.
CONCENTRATED GEOGRAPHY
We have conducted a thorough review during the year, assessing the
customer offering, internal efficiency and the Bank’s geographical pres-
ence outside the home markets.
Similarly to how Handelsbanken will no longer do everything, we will
also no longer be everywhere. To this end, we have therefore distilled our
operations outside our home markets to Luxembourg and New York.
The path that we have chosen to embark on means that we will be
refining our customer offering even further, while reducing, or removing
completely, the parts of the operations that do not support the business.
ENHANCED FOCUS – REFINED OFFERING | ADMINISTRATION REPORT
HANDELSBANKEN | ANNUAL REPORT 2019 15
Doing so will give the Bank major potential for growth with improved,
sustainable profitability, while maintaining low risk.
STRONG MORTGAGE LOAN POSITION
Handelsbanken’s position in the mortgage loan market is strong, and we
will continue to be the leading operator in Sweden. We have increased
the visibility of our offering at more meeting places during the year, while
expanding it with such options as green mortgages, which will contribute
to improving the attractiveness of environmentally certified housing and
will accelerate the rate of energy efficiency enhancements in properties.
We are also developing the digital mortgage loan process, in order to
facilitate quicker turnarounds for our committed loan offers and more dig-
italised mortgage loans for those customers who prefer this.
“ The customers know that we always
take a long-term approach and have
their best interests in mind. This gives
a sound basis for mutually trusting
customer relationships.”For many years, Handelsbanken has had a strong position within the
financing of property companies and housing co-operative associations
with stable cash flows and well-managed properties in desirable loca-
tions. We are also a leading corporate bank. Our various research prod-
ucts, advisory services in the areas of, for example, sustainability and
procurement of capital, risk management, acquisitions and divestments
will remain important parts of our offering. Through additional collabora-
tions with suppliers of business services, the Bank is continuing to
develop its advisory capabilities and business in digital meeting places.
THE SAVINGS BUSINESS AREA IS GROWING
Our professional and personal advisory services, good digital support,
and successful sustainable asset management create good conditions
for our growth in the market to continue. In recent years, the Bank has
improved its offering and strengthened its position within several asset
management services, in both Sweden and other home markets. This
has resulted in increased growth, high customer satisfaction and good
levels of loyalty. We are currently the leading bank within sustainable
asset management. The majority of the fund volume is now managed
with enhanced sustainability criteria, attracting ever more new custom-
ers. Performance within the area of occupational pension is also good,
and contributes significantly to increasing the volumes of assets man-
aged within the Group.
Based on these conditions, the Bank is continuing to invest additional
resources on savings services for both private and corporate customers.
One example is the digital savings guide in Sweden. This is a first-step
tool for fund savings which we are developing so that it can be integrated
with other customer applications.
In the past decade, the Bank’s share of net inflows to the Swedish
fund market has been more than 20 per cent. The increased investment
in our customer offering is expected to result in continued good growth in
this area.
“ It must be simple to be a customer
of Handelsbanken – and it must be
simple for our employees to take
care of our customers.”Our offering within insurance solutions is being co-ordinated to become
an integral part of our advisory services. Research provided by the Bank
has been made even more visible so that it more clearly supports cus-
tomers in the area of savings and the Bank’s advisory services in various
meeting places.
The Bank’s profile as a natural private banking operator provides the
conditions for growth, particularly in Sweden, where there is huge poten-
tial.
TRUST LEADS TO SUCCESS
Our excellent reputation and high levels of customer satisfaction put us in
a strong position for our journey of change. But Handelsbanken’s suc-
cess also depends on the trust of our customers and the community at
large. We must continually earn this trust so that we continue to be suc-
cessful. Availability, simplicity and care are – and will continue to be –
important guiding principles on the journey ahead.
FINANCIAL OVERVIEW | ADMINISTRATION REPORT
16 HANDELSBANKEN | ANNUAL REPORT 2019
Financial overview 2019
• Operating profit fell by 1 per cent to SEK 21,796 million (22,013). Adjusted for foreign exchange effects, non-recurring items and special items, operating profit grew by SEK 55 million.
• Return on equity decreased to 11.9 per cent (12.8).
• The period’s profit after tax declined by 2 per cent to SEK 16,925 million (17,357).
• Earnings per share decreased to SEK 8.65 (8.93).
• Income grew by 2 per cent to SEK 44,564 million (43,770). Adjusted for foreign exchange effects and non-recurring items, income increased by 3 per cent.
• Net interest income rose by 3 per cent to SEK 32,135 million (31,286).
• Net fee and commission income rose by 4 per cent to SEK 10,697 million (10,247).
• Expenses rose by 4 per cent to SEK -21,743 million (-20,890). Adjusted for foreign exchange effects, non-recurring items and special items, expenses grew by 5 per cent.
• The C/I ratio rose to 48.8 per cent (47.7). Adjusted for foreign exchange effects, non-recurring items and special items, the C/I ratio was 48.3% (47.3).
• The credit loss ratio was 0.04 per cent (0.04).
• The common equity tier 1 ratio increased to 18.5 per cent (16.8).
• The Board proposes a dividend of SEK 5.50 per share (5.50), and that the existing mandate to repurchase shares is extended for a further year.
REVIEW OF OPERATIONS | ADMINISTRATION REPORT
HANDELSBANKEN | ANNUAL REPORT 2019 17
Review of operations
INTRODUCTION
The Bank carried out a strategic review of its
operations in 2019, aiming to sharpen its focus
and facilitate profitable growth while maintaining
low risk, as well as to improve efficiency and
enhance its efforts within sustainability. The
Bank will continue to set itself high ambitions
from a sustainability perspective in 2020.
The Bank’s offering is still directed towards
customers with stable cash flows who want
a long-term relationship with their bank, and is
now primarily focused on private customers,
property companies and owner-managed com-
panies. A further decision made on the basis of
the review was to concentrate the Bank’s geo-
graphical presence outside its home markets,
and to further streamline the product portfolio
to ensure that it primarily supports the needs of
core customers. These changes to the Bank’s
strategic direction will also facilitate improve-
ments in internal efficiency and will further
reduce the risk level at the Bank.
A number of initiatives were put into action
during the second half of the year following on
from the review. These included the Bank’s
decision to reduce certain exposures in seg-
ments not considered part of the core customer
business. This downsizing resulted in a decline
of the risk exposure amount in the fourth quar-
ter, contributing to the further strengthening of
the Bank’s capitalisation. The average credit
quality in the credit portfolio continued to
improve as a result of the enhanced focus.
In 2019, procedures, control activities and
systems were further reinforced to protect the
Bank and its stakeholders against being utilised
for financial crime. The direct costs for this work
at central departments and regional head offices
amounted to almost SEK 1.2 billion, and the
Bank expects similar costs to be incurred as
these efforts continue in 2020. In addition, there
are costs associated with the work undertaken
at the local branches for the same reason.
The measures initiated at the Bank during the
second half of 2019 also contributed to further
reducing the risk that the Bank is utilised for finan-
cial crime. This effect is achieved due to both the
geographical concentration of the operations out-
side the home markets and the streamlining of the
product offering. The Bank is adjusting its offering
within certain payment services, where the asso-
ciated risk can be considered to be elevated.
At the same time, the work to improve inter-
nal efficiency at the Bank has intensified. This
work is being undertaken in parallel to the
strengthening of the offering to core customers,
with improvements being made to achieve the
Bank’s major ambitions in terms of customer
benefit and customer relations. The work to dig-
italise internal processes, while also enhancing
digital availability for customers, continued, and
will be further escalated in 2020.
Within fund management, a distinct sustaina-
bility profile has contributed to continued posi-
tive performance. In 2019, the Bank’s share of
the net incoming flows in Sweden was again
significantly larger than its existing market share
of the fund management market.
The efficiency enhancement measures initi-
ated during the second half of the year did not
have sufficient time to manifest themselves on
the Bank’s cost level in 2019. The first visible
cost effects are expected to be seen in Q1
2020. It is estimated that the measures, which
the Bank has announced previously, will result
in a total reduction of the Bank’s annual cost
level of around SEK 1.5 billion by 2022, all else
being equal. Two-thirds of this effect is expected
to have been achieved by late 2020.
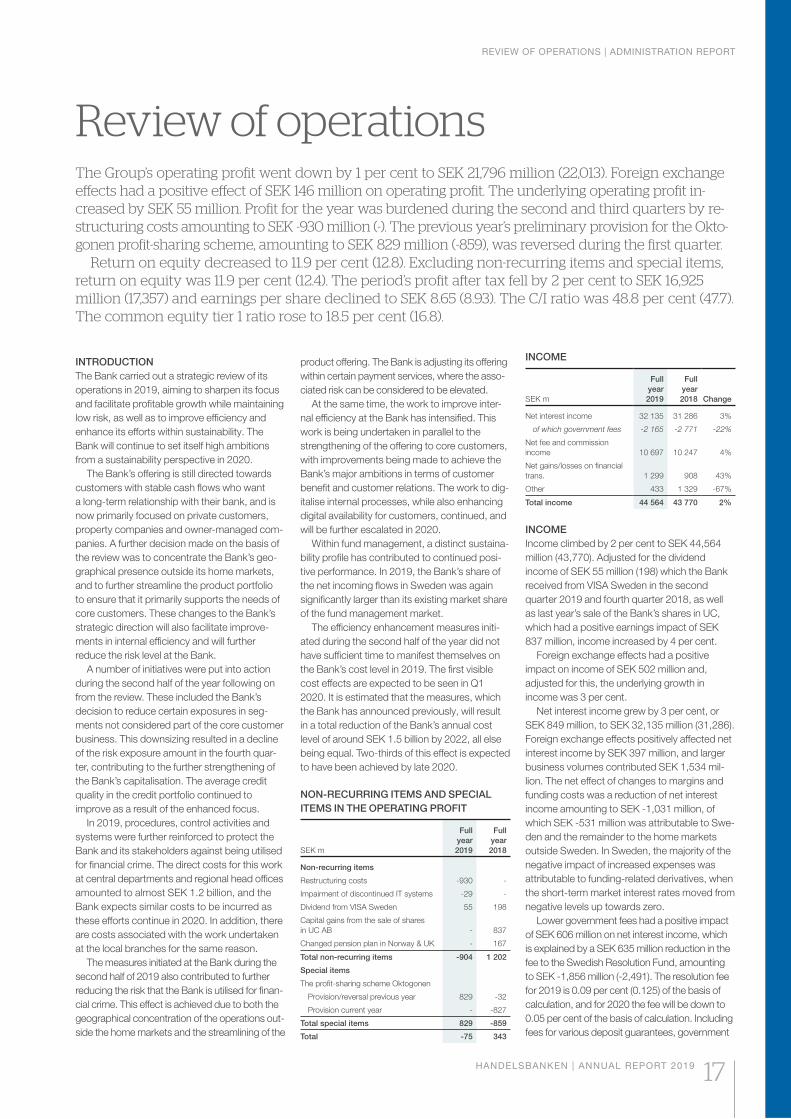
NON-RECURRING ITEMS AND SPECIAL
ITEMS IN THE OPERATING PROFIT
SEK m
Full
year
2019
Full
year
2018
Non-recurring items
Restructuring costs -930 -
Impairment of discontinued IT systems -29 -
Dividend from VISA Sweden 55 198
Capital gains from the sale of shares
in UC AB - 837
Changed pension plan in Norway & UK - 167
Total non-recurring items -904 1 202
Special items
The profit-sharing scheme Oktogonen
Provision/reversal previous year 829 -32
Provision current year - -827
Total special items 829 -859
Total -75 343
INCOME
SEK m
Full
year
2019
Full
year
2018 Change
Net interest income 32 135 31 286 3%
of which government fees -2 165 -2 771 -22%
Net fee and commission
income 10 697 10 247 4%
Net gains/losses on financial
trans. 1 299 908 43%
Other 433 1 329 -67%
Total income 44 564 43 770 2%
INCOME
Income climbed by 2 per cent to SEK 44,564
million (43,770). Adjusted for the dividend
income of SEK 55 million (198) which the Bank
received from VISA Sweden in the second
quarter 2019 and fourth quarter 2018, as well
as last year’s sale of the Bank’s shares in UC,
which had a positive earnings impact of SEK
837 million, income increased by 4 per cent.
Foreign exchange effects had a positive
impact on income of SEK 502 million and,
adjusted for this, the underlying growth in
income was 3 per cent.
Net interest income grew by 3 per cent, or
SEK 849 million, to SEK 32,135 million (31,286).
Foreign exchange effects positively affected net
interest income by SEK 397 million, and larger
business volumes contributed SEK 1,534 mil-
lion. The net effect of changes to margins and
funding costs was a reduction of net interest
income amounting to SEK -1,031 million, of
which SEK -531 million was attributable to Swe-
den and the remainder to the home markets
outside Sweden. In Sweden, the majority of the
negative impact of increased expenses was
attributable to funding-related derivatives, when
the short-term market interest rates moved from
negative levels up towards zero.
Lower government fees had a positive impact
of SEK 606 million on net interest income, which
is explained by a SEK 635 million reduction in the
fee to the Swedish Resolution Fund, amounting
to SEK -1,856 million (-2,491). The resolution fee
for 2019 is 0.09 per cent (0.125) of the basis of
calculation, and for 2020 the fee will be down to
0.05 per cent of the basis of calculation. Including
fees for various deposit guarantees, government
The Group’s operating profit went down by 1 per cent to SEK 21,796 million (22,013). Foreign exchange effects had a positive effect of SEK 146 million on operating profit. The underlying operating profit in-creased by SEK 55 million. Profit for the year was burdened during the second and third quarters by re-structuring costs amounting to SEK -930 million (-). The previous year’s preliminary provision for the Okto-gonen profit-sharing scheme, amounting to SEK 829 million (-859), was reversed during the first quarter.
Return on equity decreased to 11.9 per cent (12.8). Excluding non-recurring items and special items, return on equity was 11.9 per cent (12.4). The period’s profit after tax fell by 2 per cent to SEK 16,925 million (17,357) and earnings per share declined to SEK 8.65 (8.93). The C/I ratio was 48.8 per cent (47.7). The common equity tier 1 ratio rose to 18.5 per cent (16.8).

REVIEW OF OPERATIONS | ADMINISTRATION REPORT
18 HANDELSBANKEN | ANNUAL REPORT 2019
fees amounted to a total of SEK -2,165 million
(-2,771). The remainder of the development of net
interest income is attributable to a SEK -346 mil-
lion drop to net interest income in the liquidity
portfolio, the transition to IFRS 16 – which bur-
dened net interest income in an amount of SEK
-75 million – and other funding effects. The down-
turn in net interest income in the liquidity portfolio
was offset by an equivalent increase in net gains/
losses on financial transactions.
Net fee and commission income went up by
4 per cent, or SEK 450 million, to SEK 10,697
million (10,247). Foreign exchange effects posi-
tively affected net fee and commission income
by SEK 94 million. Fund management, custody
account management and other asset manage-
ment commissions increased by SEK 301 mil-
lion, or 6 per cent, to SEK 5,036 million (4,735).
Brokerage income decreased by 9 per cent to
SEK 625 million (690), while advisory commis-
sions increased to SEK 255 million (214). Lend-
ing and deposit commissions rose by 5 per cent
to SEK 1,401 million (1,340), while net payment
commissions increased by 2 per cent to SEK
2,024 million (1,975). Net fee and commission
income from card operations grew by 5 per cent
to SEK 1,310 million (1,247).
Net gains/losses on financial transactions
grew by 43 per cent to SEK 1,299 million (908).
The increase was mainly due to positive effects
in the Bank’s liquidity portfolio, which corre-
sponded to the negative effects in net interest
income, and improved activity in customer-
driven fixed income trading also contributed
positively.
Other income amounted to SEK 433 million
(1,329), with the figure for the previous year
including the effect on profit of the sale of shares
in UC for SEK 837 million.
EXPENSES
SEK m
Full
year
2019
Full
year
2018 Change
Staff costs -13 549 -13 465 1%
of which restructuring costs -759 -
of which Oktogonen 829 -859
of which pension plan,
Norway & UK - 167
Other expenses -6 524 -6 712 -3%
of which restructuring costs -171 -
of which rental costs -192 -828
Depreciation and amortisation -1 670 -713 134%
of which right-of-use assets -725 -
Total expenses -21 743 -20 890 4%
DEVELOPMENT COSTS
SEK m
Full
year
2019
Full
year
2018 Change
Development spend -2 730 -2 526 8%
of which staff costs -1 281 -1 118 15%
of which other costs -1 449 -1 408 3%
Capitalised costs 1 120 786 42%
Development spend after
capitalised costs -1 610 -1 740 -7%
Amortisation and impairment -449 -276 63%
Development costs -2 059 -2 016 2%
DEVELOPMENT COSTS – BY CATEGORY
SEK m
Full
year
2019
Full
year
2018 Change
Regulatory compliance -660 -881 -25%
Technical development -1 097 -846 30%
Business development -702 -543 29%
UK & The Netherlands -269 -256 5%
Other -2 -
Total development spend -2 730 -2 526 8%
Total expenses rose by 4 per cent to SEK
-21,743 million (-20,890). Foreign exchange
effects increased expenses by SEK -343 million.
Profit for the year was burdened by restructuring
costs amounting to SEK -930 million, which
were recognised in the second and third quar-
ters. The previous year’s preliminary provision
for the Oktogonen profit-sharing scheme,
amounting to SEK 829 million (-859), was
reversed during the first quarter. A non-recurring
item during the comparison year, resulting from
the changes to pension plans in the UK and
Norway, positively affected staff costs in the
amount of SEK 167 million. Adjusted for foreign
exchange effects, non-recurring items and spe-
cial items, the underlying increase in expenses
was 5 per cent. The increase was primarily
attributable to the further strengthening of the
work to protect the Bank and its stakeholders
from financial crime, together with increased
pension costs.
Development costs, including amortisation,
rose by 2 per cent to SEK -2,059 million (-2,016).
Total expenses for the Bank’s development
amounted to SEK -2,730 million (-2,526). Capi-
talised costs grew to SEK 1,120 million (786).
The rise in development costs is primarily due
to technological developments and increased
business development. For the full year 2020,
the Bank’s estimation remains that development
costs will be at the same level as for 2019.
Development costs related to compliance with
regulations have accounted for a smaller pro-
portion of total development costs, giving the
Bank more flexibility to adapt the level of total
development initiatives.
The expenses incurred by the Bank for its
work to prevent financial crime increased to
SEK -1,155 million (-615), a figure which refers
to the expenses incurred at central units and
regional head offices, but which does not
include expenses relating to the work con-
ducted at the local branches. For 2020, total
costs related to financial crime prevention are
expected to be on a par with 2019.
Staff costs increased by 1 per cent to SEK
-13,549 million (-13,465). A total of SEK -738
million of the restructuring cost which affected
profit in the third quarter was comprised of staff
costs. During the second quarter, the Bank
reserved an amount of SEK -21 million for the
planned discontinuation of the branches in the
Baltic States.
A non-recurring item during the comparison
period, resulting from the changes to pension
plans in the UK and Norway, positively affected
staff costs in the amount of SEK 167 million.
The reversal of the preliminary provision for Okt-
ogonen for 2018 amounted to SEK 829 million,
and no provision has been made for 2019. The
preliminary provision during the corresponding
period in 2018 was SEK -859 million. Foreign
exchange effects increased staff costs by
SEK 211 million. The underlying increase in
staff costs, adjusted for the above items, was
5 per cent.
Total pension costs increased to SEK -1,939
million (-1,397), with the period of comparison
including the aforementioned positive one-off
effect. Staff costs relating to the Bank’s IT
development increased to SEK -1,281 million
(-1,118), with the increase partly due to the
replacement of consultants with employed
staff. The average number of employees grew
by 2 per cent to 12,548 (12,307). The increase
is primarily attributable to IT development, the
continued expansion of the head office function
in the UK, together with the continued strength-
ening of the Bank’s work to prevent financial
crime.
Other expenses fell by 3 per cent to SEK
-6,524 million (-6,712). The amount includes
restructuring costs of SEK -171 million. Foreign
exchange effects increased other expenses by
SEK -121 million.
Other costs attributable to the Bank’s devel-
opment amounted to SEK -1,449 million
(-1,408).
Depreciation and amortisation rose to SEK
-1,670 million (-713). In accordance with IFRS
16, the majority of rental costs for premises
have been replaced with depreciation charges
starting in 2019. The depreciation of right-of-
use assets for rented premises amounted to
SEK -725 million (-). Amortisation linked to
development was SEK -449 million (-276).
Foreign exchange effects increased depreci-
ation and amortisation by SEK -11 million.
Adjusted for foreign exchange effects and the
restructuring cost, the sum total of other
expenses, depreciation and amortisation grew
by 6 per cent.
CREDIT LOSSES
SEK m
Full
year
2019
Full
year
2018 Change
Net credit losses -1 045 -881 -164
Credit loss ratio as % of loans 0.04 0.04
Credit losses were SEK -1,045 million (-881).
The majority of the credit losses was attributable
to a single exposure in Sweden. The credit loss
ratio was 0.04 per cent (0.04).
Taxes
The tax rate for the full year 2019 was 22.3%
(21.2). As of 2019, the corporate tax rate in
Sweden is 21.4% (22.0). The fact that interest
expenses on subordinated loans are not tax-
deductible had an impact of 1.4 percentage
points on the tax rate, compared with the cor-
porate tax rate.
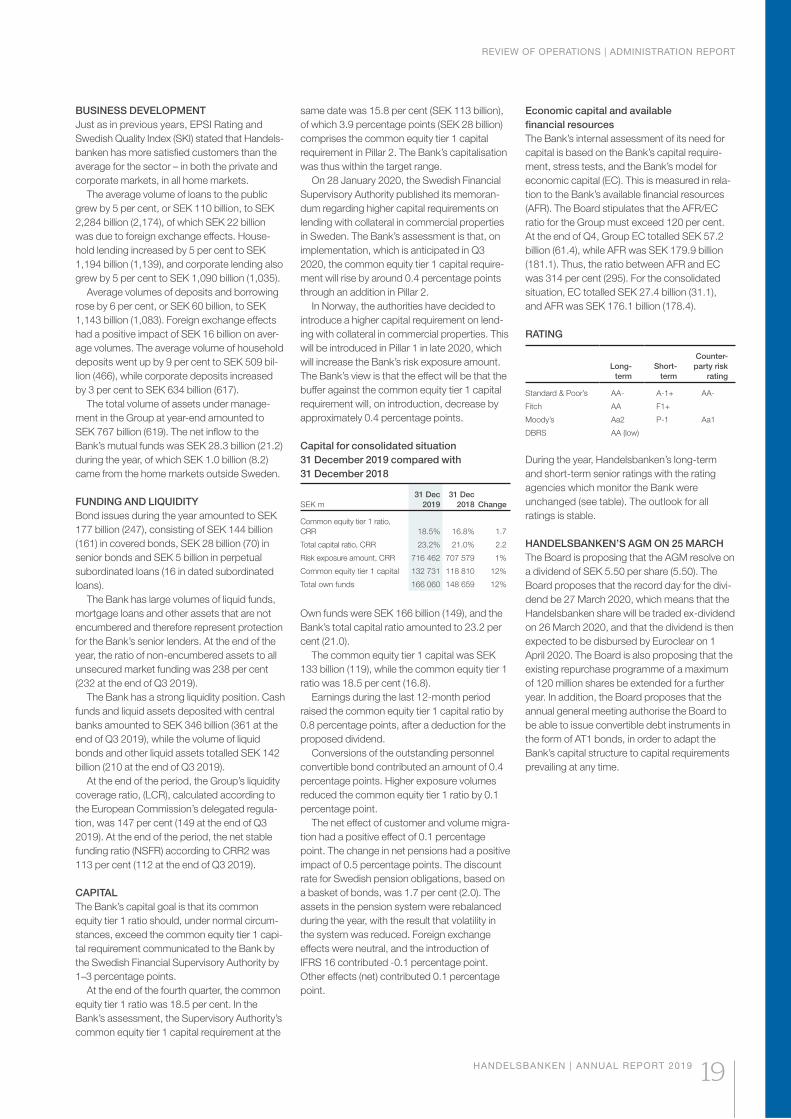
REVIEW OF OPERATIONS | ADMINISTRATION REPORT
HANDELSBANKEN | ANNUAL REPORT 2019 19
BUSINESS DEVELOPMENT
Just as in previous years, EPSI Rating and
Swedish Quality Index (SKI) stated that Handels-
banken has more satisfied customers than the
average for the sector – in both the private and
corporate markets, in all home markets.
The average volume of loans to the public
grew by 5 per cent, or SEK 110 billion, to SEK
2,284 billion (2,174), of which SEK 22 billion
was due to foreign exchange effects. House-
hold lending increased by 5 per cent to SEK
1,194 billion (1,139), and corporate lending also
grew by 5 per cent to SEK 1,090 billion (1,035).
Average volumes of deposits and borrowing
rose by 6 per cent, or SEK 60 billion, to SEK
1,143 billion (1,083). Foreign exchange effects
had a positive impact of SEK 16 billion on aver-
age volumes. The average volume of household
deposits went up by 9 per cent to SEK 509 bil-
lion (466), while corporate deposits increased
by 3 per cent to SEK 634 billion (617).
The total volume of assets under manage-
ment in the Group at year-end amounted to
SEK 767 billion (619). The net inflow to the
Bank’s mutual funds was SEK 28.3 billion (21.2)
during the year, of which SEK 1.0 billion (8.2)
came from the home markets outside Sweden.
FUNDING AND LIQUIDITY
Bond issues during the year amounted to SEK
177 billion (247), consisting of SEK 144 billion
(161) in covered bonds, SEK 28 billion (70) in
senior bonds and SEK 5 billion in perpetual
subordinated loans (16 in dated subordinated
loans).
The Bank has large volumes of liquid funds,
mortgage loans and other assets that are not
encumbered and therefore represent protection
for the Bank’s senior lenders. At the end of the
year, the ratio of non-encumbered assets to all
unsecured market funding was 238 per cent
(232 at the end of Q3 2019).
The Bank has a strong liquidity position. Cash
funds and liquid assets deposited with central
banks amounted to SEK 346 billion (361 at the
end of Q3 2019), while the volume of liquid
bonds and other liquid assets totalled SEK 142
billion (210 at the end of Q3 2019).
At the end of the period, the Group’s liquidity
coverage ratio, (LCR), calculated according to
the European Commission’s delegated regula-
tion, was 147 per cent (149 at the end of Q3
2019). At the end of the period, the net stable
funding ratio (NSFR) according to CRR2 was
113 per cent (112 at the end of Q3 2019).
CAPITAL
The Bank’s capital goal is that its common
equity tier 1 ratio should, under normal circum-
stances, exceed the common equity tier 1 capi-
tal requirement communicated to the Bank by
the Swedish Financial Supervisory Authority by
1–3 percentage points.
At the end of the fourth quarter, the common
equity tier 1 ratio was 18.5 per cent. In the
Bank’s assessment, the Supervisory Authority’s
common equity tier 1 capital requirement at the
same date was 15.8 per cent (SEK 113 billion),
of which 3.9 percentage points (SEK 28 billion)
comprises the common equity tier 1 capital
requirement in Pillar 2. The Bank’s capitalisation
was thus within the target range.
On 28 January 2020, the Swedish Financial
Supervisory Authority published its memoran-
dum regarding higher capital requirements on
lending with collateral in commercial properties
in Sweden. The Bank’s assessment is that, on
implementation, which is anticipated in Q3
2020, the common equity tier 1 capital require-
ment will rise by around 0.4 percentage points
through an addition in Pillar 2.
In Norway, the authorities have decided to
introduce a higher capital requirement on lend-
ing with collateral in commercial properties. This
will be introduced in Pillar 1 in late 2020, which
will increase the Bank’s risk exposure amount.
The Bank’s view is that the effect will be that the
buffer against the common equity tier 1 capital
requirement will, on introduction, decrease by
approximately 0.4 percentage points.
Capital for consolidated situation
31 December 2019 compared with
31 December 2018
SEK m
31 Dec
2019
31 Dec
2018 Change
Common equity tier 1 ratio,
CRR 18.5% 16.8% 1.7
Total capital ratio, CRR 23.2% 21.0% 2.2
Risk exposure amount, CRR 716 462 707 579 1%
Common equity tier 1 capital 132 731 118 810 12%
Total own funds 166 060 148 659 12%
Own funds were SEK 166 billion (149), and the
Bank’s total capital ratio amounted to 23.2 per
cent (21.0).
The common equity tier 1 capital was SEK
133 billion (119), while the common equity tier 1
ratio was 18.5 per cent (16.8).
Earnings during the last 12-month period
raised the common equity tier 1 capital ratio by
0.8 percentage points, after a deduction for the
proposed dividend.
Conversions of the outstanding personnel
convertible bond contributed an amount of 0.4
percentage points. Higher exposure volumes
reduced the common equity tier 1 ratio by 0.1
percentage point.
The net effect of customer and volume migra-
tion had a positive effect of 0.1 percentage
point. The change in net pensions had a positive
impact of 0.5 percentage points. The discount
rate for Swedish pension obligations, based on
a basket of bonds, was 1.7 per cent (2.0). The
assets in the pension system were rebalanced
during the year, with the result that volatility in
the system was reduced. Foreign exchange
effects were neutral, and the introduction of
IFRS 16 contributed -0.1 percentage point.
Other effects (net) contributed 0.1 percentage
point.
Economic capital and available
financial resources
The Bank’s internal assessment of its need for
capital is based on the Bank’s capital require-
ment, stress tests, and the Bank’s model for
economic capital (EC). This is measured in rela-
tion to the Bank’s available financial resources
(AFR). The Board stipulates that the AFR/EC
ratio for the Group must exceed 120 per cent.
At the end of Q4, Group EC totalled SEK 57.2
billion (61.4), while AFR was SEK 179.9 billion
(181.1). Thus, the ratio between AFR and EC
was 314 per cent (295). For the consolidated
situation, EC totalled SEK 27.4 billion (31.1),
and AFR was SEK 176.1 billion (178.4).
RATING
Long-
term
Short-
term
Counter-
party risk
rating
Standard & Poor’s AA- A-1+ AA-
Fitch AA F1+
Moody’s Aa2 P-1 Aa1
DBRS AA (low)
During the year, Handelsbanken’s long-term
and short-term senior ratings with the rating
agencies which monitor the Bank were
unchanged (see table). The outlook for all
ratings is stable.
HANDELSBANKEN’S AGM ON 25 MARCH
The Board is proposing that the AGM resolve on
a dividend of SEK 5.50 per share (5.50). The
Board proposes that the record day for the divi-
dend be 27 March 2020, which means that the
Handelsbanken share will be traded ex-dividend
on 26 March 2020, and that the dividend is then
expected to be disbursed by Euroclear on 1
April 2020. The Board is also proposing that the
existing repurchase programme of a maximum
of 120 million shares be extended for a further
year. In addition, the Board proposes that the
annual general meeting authorise the Board to
be able to issue convertible debt instruments in
the form of AT1 bonds, in order to adapt the
Bank’s capital structure to capital requirements
prevailing at any time.

FIVE-YEAR OVERVIEW, GROUP | ADMINISTRATION REPORT
20 HANDELSBANKEN | ANNUAL REPORT 2019
Five-year overview, GroupConsolidated income statement
SEKm 2019 2018 2017 2016 2015
Net interest income 32 135 31 286 29 766 27 943 27 740
Net fee and commission income 10 697 10 247 9 718 9 156 9 320
Net gains/losses on financial transactions 1 299 908 1 271 3 066 2 608
Risk result – insurance 145 106 142 142 157
Other dividend income 113 218 591 228 281
Share of profit of associates 32 0 14 25 17
Other income 143 1 005 172 203 213
Total income 44 564 43 770 41 674 40 763 40 336
Staff costs -13 549 -13 465 -12 472 -12 542 -12 581
Other expenses -6 524 -6 712 -5 889 -5 401 -5 203
Depreciation, amortisation and impairment of property,
equipment and intangible assets -1 670 -713 -619 -495 -487
Total expenses -21 743 -20 890 -18 980 -18 438 -18 271
Profit before credit losses 22 821 22 880 22 694 22 325 22 065
Net credit losses -1 045 -881 -1 683 -1 724 -1 597
Gains/losses on disposal of property, equipment and intangible assets 20 14 14 32 7
Operating profit 21 796 22 013 21 025 20 633 20 475
Taxes -4 871 -4 656 -4 923 -4 401 -4 277
Profit for the year from continuing operations 16 925 17 357 16 102 16 232 16 198
Profit for the year pertaining to discontinued operations, after tax - - - 13 145
Profit for the year 16 925 17 357 16 102 16 245 16 343
attributable to
Shareholders in Svenska Handelsbanken AB 16 922 17 354 16 099 16 244 16 342
Non-controlling interest 3 3 3 1 1
Earnings per share, continuing operations, SEK 8.65 8.93 8.28 8.42 8.49
after dilution 8.58 8.84 8.20 8.30 8.32
Earnings per share, discontinued operations, SEK - - - 0.01 0.08
after dilution - - - 0.01 0.07
Earnings per share, total operations, SEK 8.65 8.93 8.28 8.43 8.57
after dilution 8.58 8.84 8.20 8.31 8.39
A five-year overview for the parent company is shown on page 197–198.
During the past five years, Handelsbanken has
continued increasing its profits, strengthened its
balance sheet, expanded its operations and
boosted customer satisfaction.
Creating shareholder value
During the past five years – since 31 December
2014 – Handelsbanken has generated positive
shareholder value of SEK 25 billion. Market
capitalisation has decreased by SEK 33 billion,
while the Bank has paid out SEK 58 billion in
dividends to shareholders.
Lower risk
During the past five years, Handelsbanken’s
total credit losses amounted to SEK 6.9 billion,
which corresponds to an average annual credit
loss ratio of just under 0.07 per cent. The corre-
sponding figure for the other major Nordic
banks was 0.15 per cent.
More satisfied customers
Since SKI (Swedish Quality Index) started its
customer satisfaction surveys in 1989, every
year for private customers and every year but
one for corporate customers, Handelsbanken
has come out on top among the four major
banks when assessing which has the most
satisfied customers in Sweden. During the past
five years, Handelsbanken has extended its lead
over the other three major banks in terms of
customer satisfaction, among both private and
corporate customers. In the Bank’s other five
home markets, Handelsbanken also had signifi-
cantly more satisfied customers than the sector
average.
Continued organic growth
Satisfied customers result in more business.
Which is why Handelsbanken is a growing bank.
In total, the average volume of loans to the pub-
lic increased by 5 per cent, while the average
volume of deposits from the public increased by
6 per cent. Business volumes increased during
the year in all six home markets: in the UK, lend-
ing grew by 5 per cent and deposits grew by
10 per cent; in Norway, the corresponding
increases were 5 and 8 per cent, respectively;
and in Denmark, 3 and 5 per cent, respectively.
In Finland, lending rose by 4 per cent while
deposits grew by 5 per cent, and in the Nether-
lands, the average volume of lending increased
by 14 per cent while the average volume of
deposits was up by 18 per cent. But it is not just
in our home markets outside Sweden that
Handels banken is growing.
In Sweden, where Handelsbanken was
founded in 1871, 2019 was another year
marked by growth and large inflows of new
business volumes – in terms of both savings
and lending. For the third consecutive year,
Handelsbanken was the largest player for new
savings on the mutual funds market in Sweden.
New savings in the Bank’s mutual funds in
Sweden amounted to SEK 27 billion, equivalent
to a market share of just over 21 per cent, to be
viewed in the light of the Bank’s share of the
total managed volume in the Swedish mutual
fund market, of 11.2 per cent. At the same time,
Handelsbanken’s market share of household
deposits in Sweden increased.
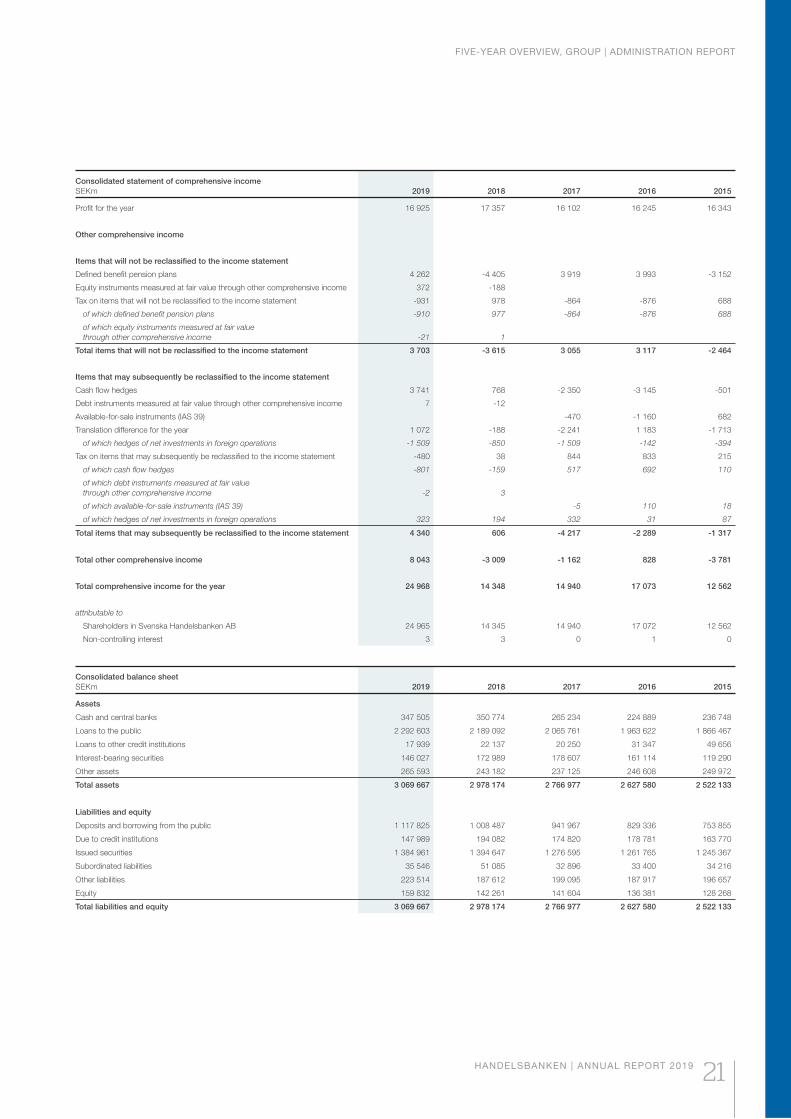
FIVE-YEAR OVERVIEW, GROUP | ADMINISTRATION REPORT
HANDELSBANKEN | ANNUAL REPORT 2019 21
Consolidated statement of comprehensive income
SEKm 2019 2018 2017 2016 2015
Profit for the year 16 925 17 357 16 102 16 245 16 343
Other comprehensive income
Items that will not be reclassified to the income statement
Defined benefit pension plans 4 262 -4 405 3 919 3 993 -3 152
Equity instruments measured at fair value through other comprehensive income 372 -188
Tax on items that will not be reclassified to the income statement -931 978 -864 -876 688
of which defined benefit pension plans -910 977 -864 -876 688
of which equity instruments measured at fair value
through other comprehensive income -21 1
Total items that will not be reclassified to the income statement 3 703 -3 615 3 055 3 117 -2 464
Items that may subsequently be reclassified to the income statement
Cash flow hedges 3 741 768 -2 350 -3 145 -501
Debt instruments measured at fair value through other comprehensive income 7 -12
Available-for-sale instruments (IAS 39) -470 -1 160 682
Translation difference for the year 1 072 -188 -2 241 1 183 -1 713
of which hedges of net investments in foreign operations -1 509 -850 -1 509 -142 -394
Tax on items that may subsequently be reclassified to the income statement -480 38 844 833 215
of which cash flow hedges -801 -159 517 692 110
of which debt instruments measured at fair value
through other comprehensive income -2 3
of which available-for-sale instruments (IAS 39) -5 110 18
of which hedges of net investments in foreign operations 323 194 332 31 87
Total items that may subsequently be reclassified to the income statement 4 340 606 -4 217 -2 289 -1 317
Total other comprehensive income 8 043 -3 009 -1 162 828 -3 781
Total comprehensive income for the year 24 968 14 348 14 940 17 073 12 562
attributable to
Shareholders in Svenska Handelsbanken AB 24 965 14 345 14 940 17 072 12 562
Non-controlling interest 3 3 0 1 0
Consolidated balance sheet
SEKm 2019 2018 2017 2016 2015
Assets
Cash and central banks 347 505 350 774 265 234 224 889 236 748
Loans to the public 2 292 603 2 189 092 2 065 761 1 963 622 1 866 467
Loans to other credit institutions 17 939 22 137 20 250 31 347 49 656
Interest-bearing securities 146 027 172 989 178 607 161 114 119 290
Other assets 265 593 243 182 237 125 246 608 249 972
Total assets 3 069 667 2 978 174 2 766 977 2 627 580 2 522 133
Liabilities and equity
Deposits and borrowing from the public 1 117 825 1 008 487 941 967 829 336 753 855
Due to credit institutions 147 989 194 082 174 820 178 781 163 770
Issued securities 1 384 961 1 394 647 1 276 595 1 261 765 1 245 367
Subordinated liabilities 35 546 51 085 32 896 33 400 34 216
Other liabilities 223 514 187 612 199 095 187 917 196 657
Equity 159 832 142 261 141 604 136 381 128 268
Total liabilities and equity 3 069 667 2 978 174 2 766 977 2 627 580 2 522 133
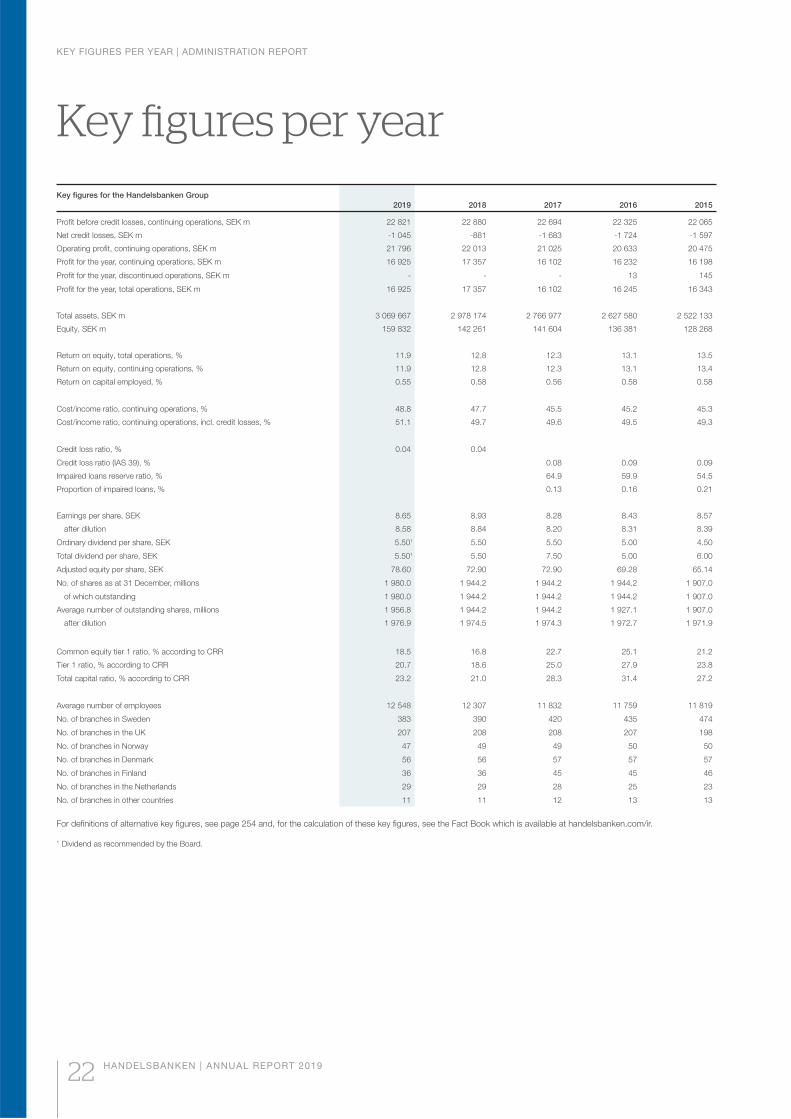
KEY FIGURES PER YEAR | ADMINISTRATION REPORT
22 HANDELSBANKEN | ANNUAL REPORT 2019
Key figures per yearKey figures for the Handelsbanken Group
2019 2018 2017 2016 2015
Profit before credit losses, continuing operations, SEK m 22 821 22 880 22 694 22 325 22 065
Net credit losses, SEK m -1 045 -881 -1 683 -1 724 -1 597
Operating profit, continuing operations, SEK m 21 796 22 013 21 025 20 633 20 475
Profit for the year, continuing operations, SEK m 16 925 17 357 16 102 16 232 16 198
Profit for the year, discontinued operations, SEK m - - - 13 145
Profit for the year, total operations, SEK m 16 925 17 357 16 102 16 245 16 343
Total assets, SEK m 3 069 667 2 978 174 2 766 977 2 627 580 2 522 133
Equity, SEK m 159 832 142 261 141 604 136 381 128 268
Return on equity, total operations, % 11.9 12.8 12.3 13.1 13.5
Return on equity, continuing operations, % 11.9 12.8 12.3 13.1 13.4
Return on capital employed, % 0.55 0.58 0.56 0.58 0.58
Cost/income ratio, continuing operations, % 48.8 47.7 45.5 45.2 45.3
Cost/income ratio, continuing operations, incl. credit losses, % 51.1 49.7 49.6 49.5 49.3
Credit loss ratio, % 0.04 0.04
Credit loss ratio (IAS 39), % 0.08 0.09 0.09
Impaired loans reserve ratio, % 64.9 59.9 54.5
Proportion of impaired loans, % 0.13 0.16 0.21
Earnings per share, SEK 8.65 8.93 8.28 8.43 8.57
after dilution 8.58 8.84 8.20 8.31 8.39
Ordinary dividend per share, SEK 5.501 5.50 5.50 5.00 4.50
Total dividend per share, SEK 5.501 5.50 7.50 5.00 6.00
Adjusted equity per share, SEK 78.60 72.90 72.90 69.28 65.14
No. of shares as at 31 December, millions 1 980.0 1 944.2 1 944.2 1 944.2 1 907.0
of which outstanding 1 980.0 1 944.2 1 944.2 1 944.2 1 907.0
Average number of outstanding shares, millions 1 956.8 1 944.2 1 944.2 1 927.1 1 907.0
after dilution 1 976.9 1 974.5 1 974.3 1 972.7 1 971.9
Common equity tier 1 ratio, % according to CRR 18.5 16.8 22.7 25.1 21.2
Tier 1 ratio, % according to CRR 20.7 18.6 25.0 27.9 23.8
Total capital ratio, % according to CRR 23.2 21.0 28.3 31.4 27.2
Average number of employees 12 548 12 307 11 832 11 759 11 819
No. of branches in Sweden 383 390 420 435 474
No. of branches in the UK 207 208 208 207 198
No. of branches in Norway 47 49 49 50 50
No. of branches in Denmark 56 56 57 57 57
No. of branches in Finland 36 36 45 45 46
No. of branches in the Netherlands 29 29 28 25 23
No. of branches in other countries 11 11 12 13 13
For definitions of alternative key figures, see page 254 and, for the calculation of these key figures, see the Fact Book which is available at handelsbanken.com/ir.
1 Dividend as recommended by the Board.
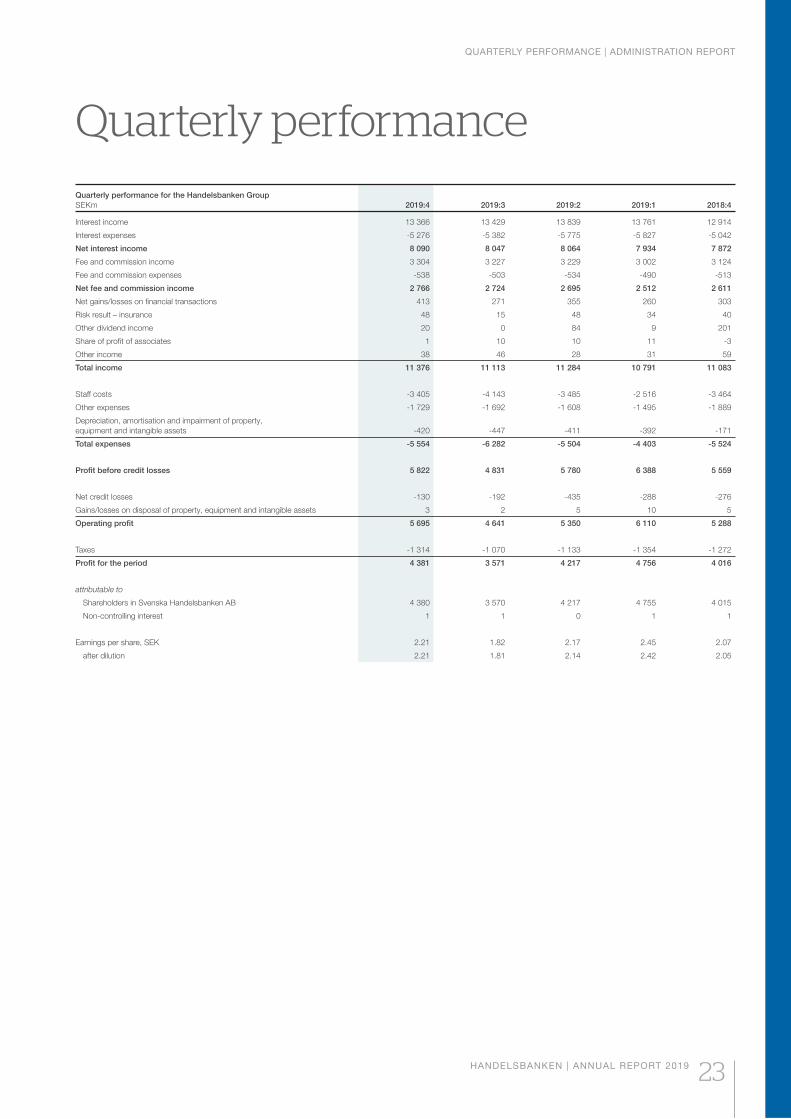
QUARTERLY PERFORMANCE | ADMINISTRATION REPORT
HANDELSBANKEN | ANNUAL REPORT 2019 23
Quarterly performanceQuarterly performance for the Handelsbanken Group
SEKm 2019:4 2019:3 2019:2 2019:1 2018:4
Interest income 13 366 13 429 13 839 13 761 12 914
Interest expenses -5 276 -5 382 -5 775 -5 827 -5 042
Net interest income 8 090 8 047 8 064 7 934 7 872
Fee and commission income 3 304 3 227 3 229 3 002 3 124
Fee and commission expenses -538 -503 -534 -490 -513
Net fee and commission income 2 766 2 724 2 695 2 512 2 611
Net gains/losses on financial transactions 413 271 355 260 303
Risk result – insurance 48 15 48 34 40
Other dividend income 20 0 84 9 201
Share of profit of associates 1 10 10 11 -3
Other income 38 46 28 31 59
Total income 11 376 11 113 11 284 10 791 11 083
Staff costs -3 405 -4 143 -3 485 -2 516 -3 464
Other expenses -1 729 -1 692 -1 608 -1 495 -1 889
Depreciation, amortisation and impairment of property,
equipment and intangible assets -420 -447 -411 -392 -171
Total expenses -5 554 -6 282 -5 504 -4 403 -5 524
Profit before credit losses 5 822 4 831 5 780 6 388 5 559
Net credit losses -130 -192 -435 -288 -276
Gains/losses on disposal of property, equipment and intangible assets 3 2 5 10 5
Operating profit 5 695 4 641 5 350 6 110 5 288
Taxes -1 314 -1 070 -1 133 -1 354 -1 272
Profit for the period 4 381 3 571 4 217 4 756 4 016
attributable to
Shareholders in Svenska Handelsbanken AB 4 380 3 570 4 217 4 755 4 015
Non-controlling interest 1 1 0 1 1
Earnings per share, SEK 2.21 1.82 2.17 2.45 2.07
after dilution 2.21 1.81 2.14 2.42 2.05
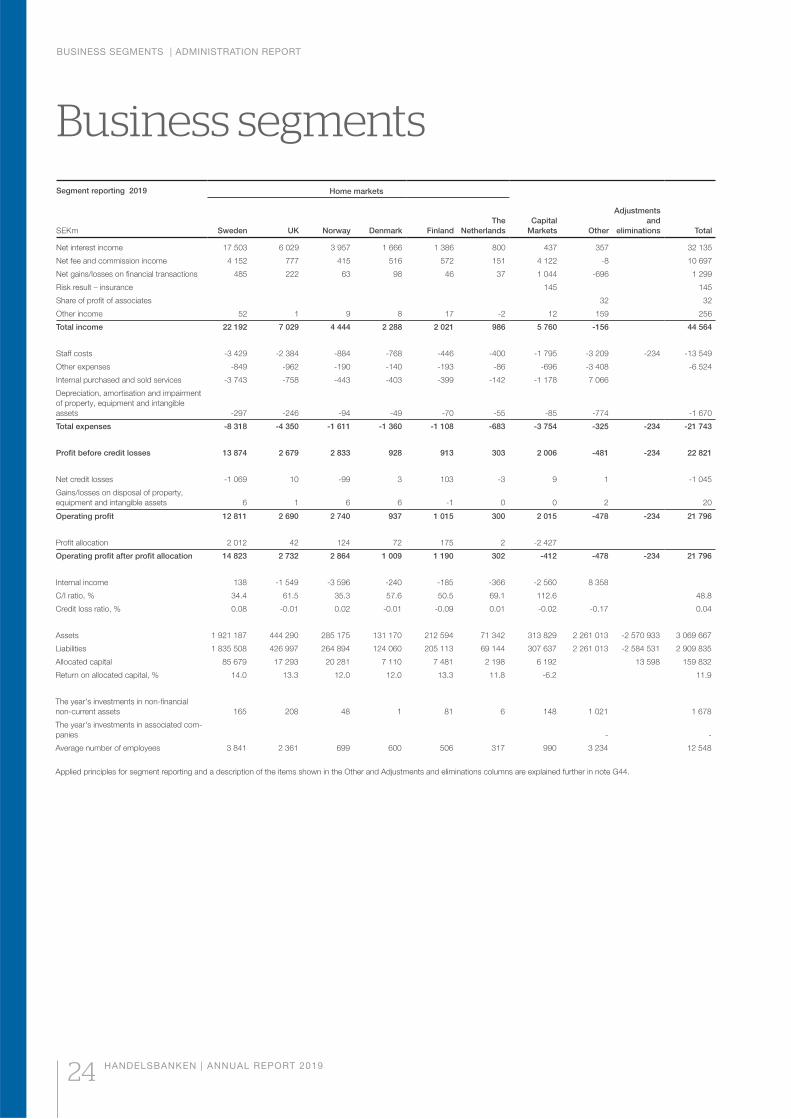
BUSINESS SEGMENTS | ADMINISTRATION REPORT
24 HANDELSBANKEN | ANNUAL REPORT 2019
Business segments Segment reporting 2019
SEKm
Home markets
Capital
Markets Other
Adjustments
and
eliminations TotalSweden UK Norway Denmark Finland
The
Netherlands
Net interest income 17 503 6 029 3 957 1 666 1 386 800 437 357 32 135
Net fee and commission income 4 152 777 415 516 572 151 4 122 -8 10 697
Net gains/losses on financial transactions 485 222 63 98 46 37 1 044 -696 1 299
Risk result – insurance 145 145
Share of profit of associates 32 32
Other income 52 1 9 8 17 -2 12 159 256
Total income 22 192 7 029 4 444 2 288 2 021 986 5 760 -156 44 564
Staff costs -3 429 -2 384 -884 -768 -446 -400 -1 795 -3 209 -234 -13 549
Other expenses -849 -962 -190 -140 -193 -86 -696 -3 408 -6 524
Internal purchased and sold services -3 743 -758 -443 -403 -399 -142 -1 178 7 066
Depreciation, amortisation and impairment
of property, equipment and intangible
assets -297 -246 -94 -49 -70 -55 -85 -774 -1 670
Total expenses -8 318 -4 350 -1 611 -1 360 -1 108 -683 -3 754 -325 -234 -21 743
Profit before credit losses 13 874 2 679 2 833 928 913 303 2 006 -481 -234 22 821
Net credit losses -1 069 10 -99 3 103 -3 9 1 -1 045
Gains/losses on disposal of property,
equipment and intangible assets 6 1 6 6 -1 0 0 2 20
Operating profit 12 811 2 690 2 740 937 1 015 300 2 015 -478 -234 21 796
Profit allocation 2 012 42 124 72 175 2 -2 427
Operating profit after profit allocation 14 823 2 732 2 864 1 009 1 190 302 -412 -478 -234 21 796
Internal income 138 -1 549 -3 596 -240 -185 -366 -2 560 8 358
C/I ratio, % 34.4 61.5 35.3 57.6 50.5 69.1 112.6 48.8
Credit loss ratio, % 0.08 -0.01 0.02 -0.01 -0.09 0.01 -0.02 -0.17 0.04
Assets 1 921 187 444 290 285 175 131 170 212 594 71 342 313 829 2 261 013 -2 570 933 3 069 667
Liabilities 1 835 508 426 997 264 894 124 060 205 113 69 144 307 637 2 261 013 -2 584 531 2 909 835
Allocated capital 85 679 17 293 20 281 7 110 7 481 2 198 6 192 13 598 159 832
Return on allocated capital, % 14.0 13.3 12.0 12.0 13.3 11.8 -6.2 11.9
The year's investments in non-financial
non-current assets 165 208 48 1 81 6 148 1 021 1 678
The year's investments in associated com-
panies - -
Average number of employees 3 841 2 361 699 600 506 317 990 3 234 12 548
Applied principles for segment reporting and a description of the items shown in the Other and Adjustments and eliminations columns are explained further in note G44.
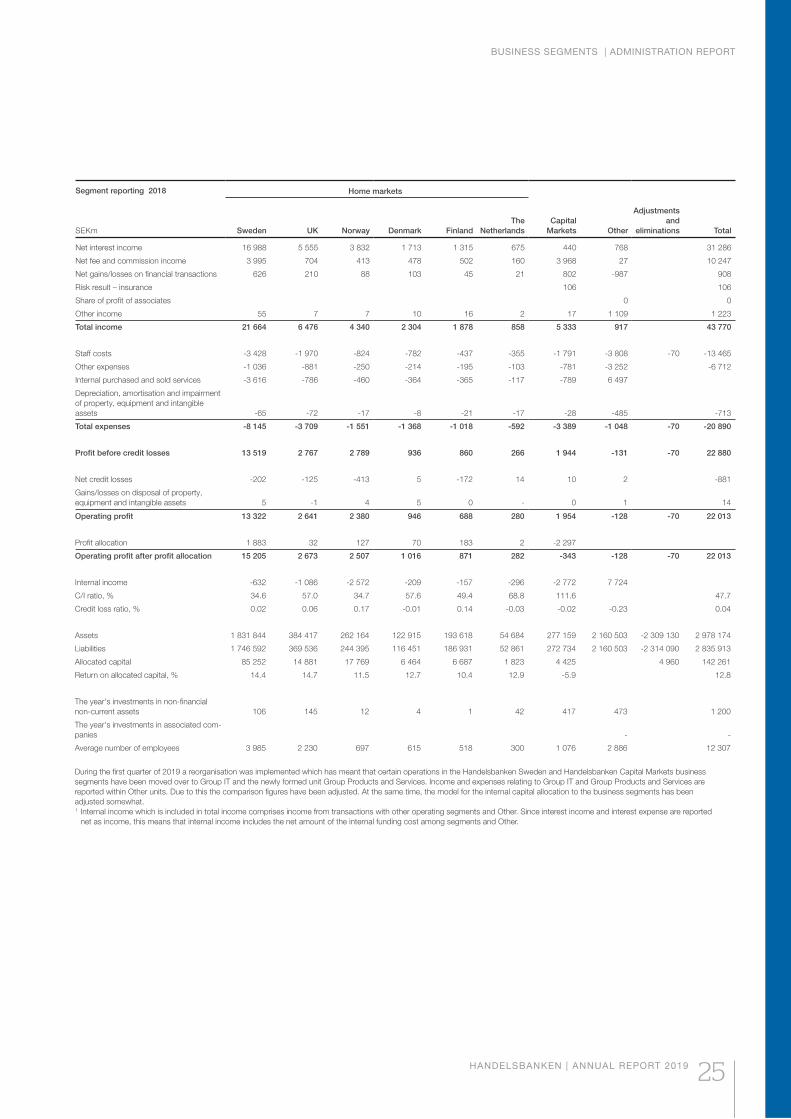
BUSINESS SEGMENTS | ADMINISTRATION REPORT
HANDELSBANKEN | ANNUAL REPORT 2019 25
Segment reporting 2018
SEKm
Home markets
Capital
Markets Other
Adjustments
and
eliminations TotalSweden UK Norway Denmark Finland
The
Netherlands
Net interest income 16 988 5 555 3 832 1 713 1 315 675 440 768 31 286
Net fee and commission income 3 995 704 413 478 502 160 3 968 27 10 247
Net gains/losses on financial transactions 626 210 88 103 45 21 802 -987 908
Risk result – insurance 106 106
Share of profit of associates 0 0
Other income 55 7 7 10 16 2 17 1 109 1 223
Total income 21 664 6 476 4 340 2 304 1 878 858 5 333 917 43 770
Staff costs -3 428 -1 970 -824 -782 -437 -355 -1 791 -3 808 -70 -13 465
Other expenses -1 036 -881 -250 -214 -195 -103 -781 -3 252 -6 712
Internal purchased and sold services -3 616 -786 -460 -364 -365 -117 -789 6 497
Depreciation, amortisation and impairment
of property, equipment and intangible
assets -65 -72 -17 -8 -21 -17 -28 -485 -713
Total expenses -8 145 -3 709 -1 551 -1 368 -1 018 -592 -3 389 -1 048 -70 -20 890
Profit before credit losses 13 519 2 767 2 789 936 860 266 1 944 -131 -70 22 880
Net credit losses -202 -125 -413 5 -172 14 10 2 -881
Gains/losses on disposal of property,
equipment and intangible assets 5 -1 4 5 0 - 0 1 14
Operating profit 13 322 2 641 2 380 946 688 280 1 954 -128 -70 22 013
Profit allocation 1 883 32 127 70 183 2 -2 297
Operating profit after profit allocation 15 205 2 673 2 507 1 016 871 282 -343 -128 -70 22 013
Internal income -632 -1 086 -2 572 -209 -157 -296 -2 772 7 724
C/I ratio, % 34.6 57.0 34.7 57.6 49.4 68.8 111.6 47.7
Credit loss ratio, % 0.02 0.06 0.17 -0.01 0.14 -0.03 -0.02 -0.23 0.04
Assets 1 831 844 384 417 262 164 122 915 193 618 54 684 277 159 2 160 503 -2 309 130 2 978 174
Liabilities 1 746 592 369 536 244 395 116 451 186 931 52 861 272 734 2 160 503 -2 314 090 2 835 913
Allocated capital 85 252 14 881 17 769 6 464 6 687 1 823 4 425 4 960 142 261
Return on allocated capital, % 14.4 14.7 11.5 12.7 10.4 12.9 -5.9 12.8
The year's investments in non-financial
non-current assets 106 145 12 4 1 42 417 473 1 200
The year's investments in associated com-
panies - -
Average number of employees 3 985 2 230 697 615 518 300 1 076 2 886 12 307
During the first quarter of 2019 a reorganisation was implemented which has meant that certain operations in the Handelsbanken Sweden and Handelsbanken Capital Markets business
segments have been moved over to Group IT and the newly formed unit Group Products and Services. Income and expenses relating to Group IT and Group Products and Services are
reported within Other units. Due to this the comparison figures have been adjusted. At the same time, the model for the internal capital allocation to the business segments has been
adjusted somewhat.1 Internal income which is included in total income comprises income from transactions with other operating segments and Other. Since interest income and interest expense are reported
net as income, this means that internal income includes the net amount of the internal funding cost among segments and Other.
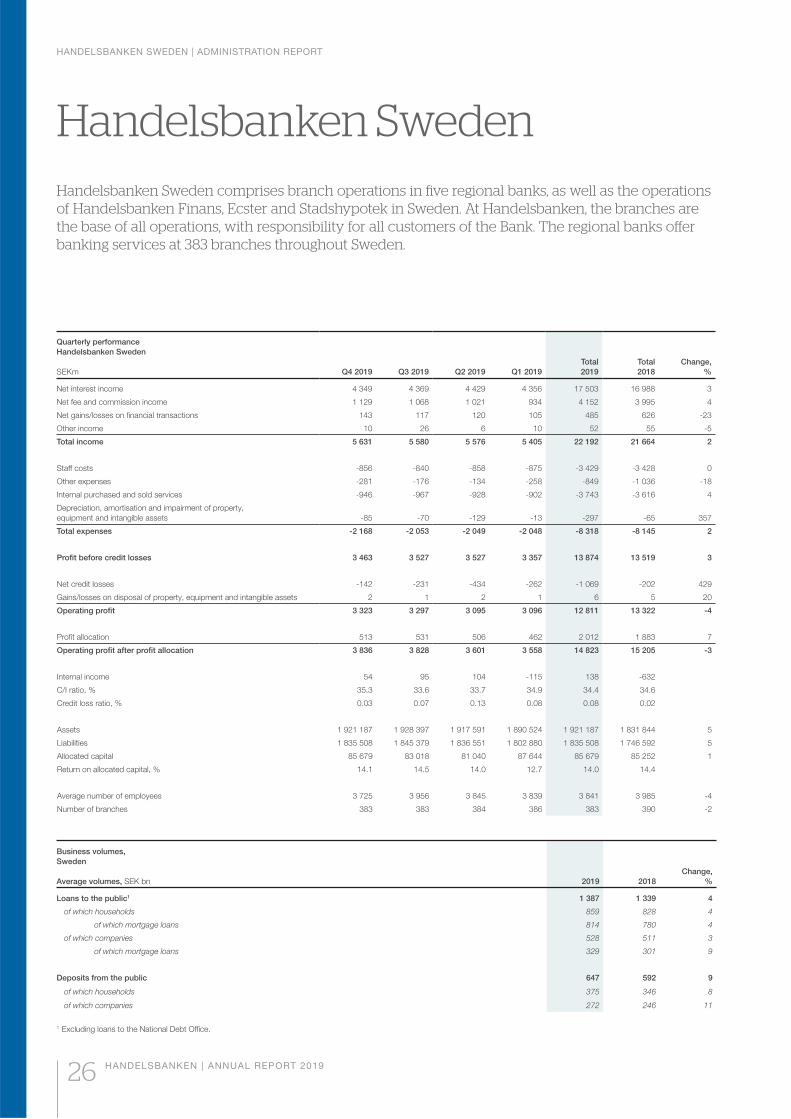
HANDELSBANKEN SWEDEN | ADMINISTRATION REPORT
26 HANDELSBANKEN | ANNUAL REPORT 2019
Handelsbanken Sweden
Quarterly performance
Handelsbanken Sweden
SEKm Q4 2019 Q3 2019 Q2 2019 Q1 2019
Total
2019
Total
2018
Change,
%
Net interest income 4 349 4 369 4 429 4 356 17 503 16 988 3
Net fee and commission income 1 129 1 068 1 021 934 4 152 3 995 4
Net gains/losses on financial transactions 143 117 120 105 485 626 -23
Other income 10 26 6 10 52 55 -5
Total income 5 631 5 580 5 576 5 405 22 192 21 664 2
Staff costs -856 -840 -858 -875 -3 429 -3 428 0
Other expenses -281 -176 -134 -258 -849 -1 036 -18
Internal purchased and sold services -946 -967 -928 -902 -3 743 -3 616 4
Depreciation, amortisation and impairment of property,
equipment and intangible assets -85 -70 -129 -13 -297 -65 357
Total expenses -2 168 -2 053 -2 049 -2 048 -8 318 -8 145 2
Profit before credit losses 3 463 3 527 3 527 3 357 13 874 13 519 3
Net credit losses -142 -231 -434 -262 -1 069 -202 429
Gains/losses on disposal of property, equipment and intangible assets 2 1 2 1 6 5 20
Operating profit 3 323 3 297 3 095 3 096 12 811 13 322 -4
Profit allocation 513 531 506 462 2 012 1 883 7
Operating profit after profit allocation 3 836 3 828 3 601 3 558 14 823 15 205 -3
Internal income 54 95 104 -115 138 -632
C/I ratio, % 35.3 33.6 33.7 34.9 34.4 34.6
Credit loss ratio, % 0.03 0.07 0.13 0.08 0.08 0.02
Assets 1 921 187 1 928 397 1 917 591 1 890 524 1 921 187 1 831 844 5
Liabilities 1 835 508 1 845 379 1 836 551 1 802 880 1 835 508 1 746 592 5
Allocated capital 85 679 83 018 81 040 87 644 85 679 85 252 1
Return on allocated capital, % 14.1 14.5 14.0 12.7 14.0 14.4
Average number of employees 3 725 3 956 3 845 3 839 3 841 3 985 -4
Number of branches 383 383 384 386 383 390 -2
Business volumes,
Sweden
Average volumes, SEK bn 2019 2018
Change,
%
Loans to the public1 1 387 1 339 4
of which households 859 828 4
of which mortgage loans 814 780 4
of which companies 528 511 3
of which mortgage loans 329 301 9
Deposits from the public 647 592 9
of which households 375 346 8
of which companies 272 246 11
1 Excluding loans to the National Debt Office.
Handelsbanken Sweden comprises branch operations in five regional banks, as well as the operations of Handelsbanken Finans, Ecster and Stadshypotek in Sweden. At Handelsbanken, the branches are the base of all operations, with responsibility for all customers of the Bank. The regional banks offer banking services at 383 branches throughout Sweden.

HANDELSBANKEN SWEDEN | ADMINISTRATION REPORT
HANDELSBANKEN | ANNUAL REPORT 2019 27
FINANCIAL PERFORMANCE
Operating profit decreased by 4 per cent to
SEK 12,811 million (13,322) due to higher credit
losses. Profit before credit losses grew by 3 per
cent. Return on allocated capital fell to 14.0 per
cent (14.4). The C/I ratio was 34.4 per cent
(34.6).
Net interest income rose by 3 per cent, or
SEK 515 million, to SEK 17,503 million (16,988).
Government fees went down by SEK 261 mil-
lion to SEK -1,101 million (-1,362), mainly due
to the lower fee to the Resolution Fund. Higher
lending volumes increased net interest income
by SEK 665 million, while higher deposit vol-
umes contributed SEK 162 million. The remain-
der of the change in net interest income is
mainly due to the negative contribution from the
net amount of changed margins and funding
costs, amounting to SEK -531 million.
Net fee and commission income grew by 4
per cent or SEK 157 million to SEK 4,152 million
(3,995), where mutual fund commissions
increased by SEK 75 million to SEK 915 million
(840). Commission income from custody
accounts and other asset management rose by
SEK 25 million. Insurance commissions went up
by SEK 3 million. Net fee and commission income
from payments increased by SEK 31 million.
Total expenses rose by 2 per cent to SEK
-8,318 million (-8,154). Staff costs were largely
unchanged at SEK -3,429 million (-3,428). The
average number of employees fell by 4 per cent
to 3,841 (3,985). In accordance with IFRS 16,
the majority of rental costs for premises are now
recognised as depreciation charges.
Credit losses amounted to SEK -1,069 million
(-202). The majority of the losses were attributa-
ble to a single exposure. The credit loss ratio
was 0.08 per cent (0.02).
BUSINESS DEVELOPMENT
Handelsbanken was the largest player for new
lending in the Swedish mortgage market during
the year, with a market share of 16.8 per cent.
For the third consecutive year, the Bank was the
largest player for net inflows in the mutual fund
market in Sweden, with a market share of 21
per cent. Also as regards new household sav-
ings in bank accounts in Sweden, the Bank was
the largest player during the year, with a market
share of 24.3 per cent.
Just as in previous years, the major Swedish
Quality Index (SKI) survey found that Handels-
banken is “Best among the major banks”. For
private customers, Handelsbanken’s index
value was 71.5, as compared with the other
major banks, all of which recorded scores in the
59.6–67.5 range. For corporate customers,
Handelsbanken’s index value was 66.5, as
compared with the other major banks, all of
which recorded scores in the 58.8–63.9 range.
Finansbarometern’s annual survey, where
companies with fewer than 20 employees rank
their banks, again named Handelsbanken
Sweden’s Small Enterprise Bank – for the eighth
year running. One finding in the survey was that
Handelsbanken “has succeeded in establishing
e-services to a degree that customers appre-
ciate”.
As part of the Bank’s sustainability work, the
customer offering was expanded with the addi-
tion of the Green Mortgage in the fourth quarter.
Customers with an energy-efficient or environ-
mentally certified home are able to apply for a
discounted interest rate on their mortgage. In
order to qualify for a Green Mortgage, the cus-
tomer’s home must be in energy class A or B,
be Nordic Swan Eco-labelled, or be categorised
as either Gold or Silver according to the Sweden
Green Building Council’s standards.
The average volume of mortgage loans to pri-
vate individuals rose by 4.4 per cent to SEK 814
billion (780), while household deposits
increased by 8.4 per cent to SEK 375 billion
(346). The Bank thus continued to increase its
share of the household deposits market. The
average volume of corporate lending went up
by 3.3 per cent to SEK 528 billion (511), while
corporate deposits increased by 10.6 per cent
to SEK 272 billion (246).
New savings in the Bank’s mutual funds in
Sweden totalled SEK 27.3 billion (13.0), corre-
sponding to a market share of 21 per cent (24),
to be viewed in the light of the Bank’s share of
the Swedish mutual fund market of 11 per cent.
Thus, as was the case last year, the Bank was
the largest player for new savings on the Swed-
ish mutual fund market.
383 branches
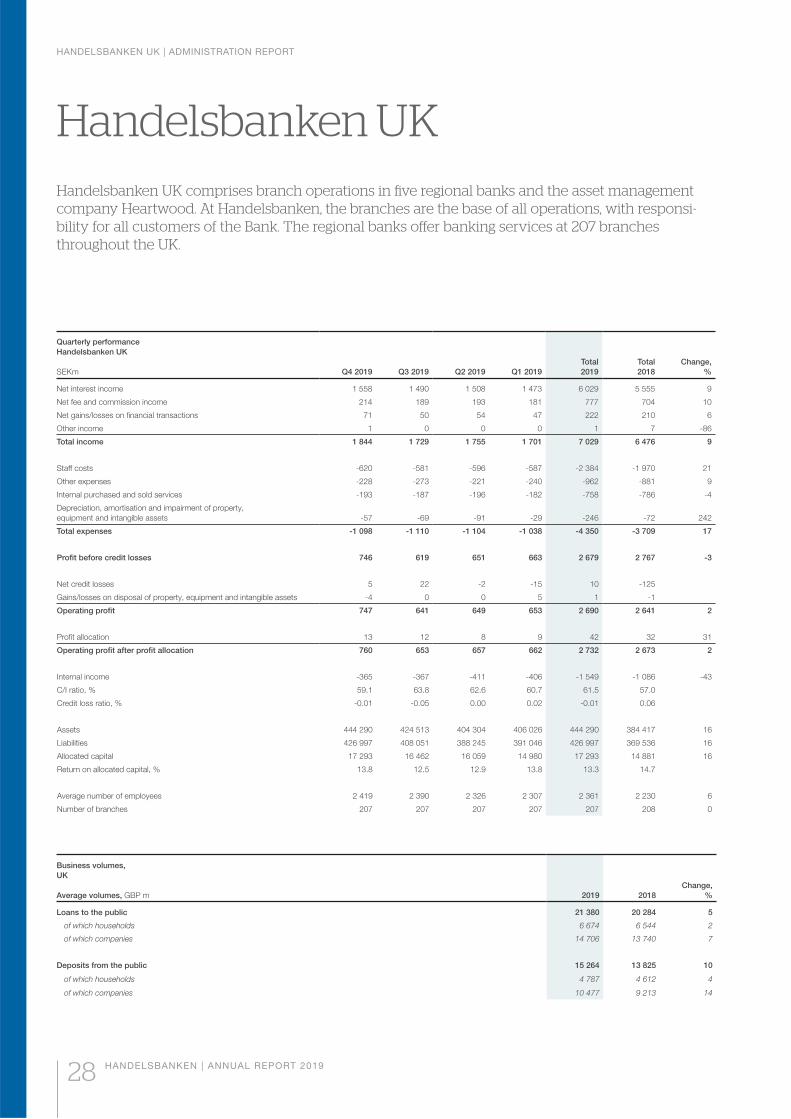
HANDELSBANKEN UK | ADMINISTRATION REPORT
28 HANDELSBANKEN | ANNUAL REPORT 2019
Handelsbanken UKHandelsbanken UK comprises branch operations in five regional banks and the asset management company Heartwood. At Handelsbanken, the branches are the base of all operations, with responsi-bility for all customers of the Bank. The regional banks offer banking services at 207 branches throughout the UK.
Quarterly performance
Handelsbanken UK
SEKm Q4 2019 Q3 2019 Q2 2019 Q1 2019
Total
2019
Total
2018
Change,
%
Net interest income 1 558 1 490 1 508 1 473 6 029 5 555 9
Net fee and commission income 214 189 193 181 777 704 10
Net gains/losses on financial transactions 71 50 54 47 222 210 6
Other income 1 0 0 0 1 7 -86
Total income 1 844 1 729 1 755 1 701 7 029 6 476 9
Staff costs -620 -581 -596 -587 -2 384 -1 970 21
Other expenses -228 -273 -221 -240 -962 -881 9
Internal purchased and sold services -193 -187 -196 -182 -758 -786 -4
Depreciation, amortisation and impairment of property,
equipment and intangible assets -57 -69 -91 -29 -246 -72 242
Total expenses -1 098 -1 110 -1 104 -1 038 -4 350 -3 709 17
Profit before credit losses 746 619 651 663 2 679 2 767 -3
Net credit losses 5 22 -2 -15 10 -125
Gains/losses on disposal of property, equipment and intangible assets -4 0 0 5 1 -1
Operating profit 747 641 649 653 2 690 2 641 2
Profit allocation 13 12 8 9 42 32 31
Operating profit after profit allocation 760 653 657 662 2 732 2 673 2
Internal income -365 -367 -411 -406 -1 549 -1 086 -43
C/I ratio, % 59.1 63.8 62.6 60.7 61.5 57.0
Credit loss ratio, % -0.01 -0.05 0.00 0.02 -0.01 0.06
Assets 444 290 424 513 404 304 406 026 444 290 384 417 16
Liabilities 426 997 408 051 388 245 391 046 426 997 369 536 16
Allocated capital 17 293 16 462 16 059 14 980 17 293 14 881 16
Return on allocated capital, % 13.8 12.5 12.9 13.8 13.3 14.7
Average number of employees 2 419 2 390 2 326 2 307 2 361 2 230 6
Number of branches 207 207 207 207 207 208 0
Business volumes,
UK
Average volumes, GBP m 2019 2018
Change,
%
Loans to the public 21 380 20 284 5
of which households 6 674 6 544 2
of which companies 14 706 13 740 7
Deposits from the public 15 264 13 825 10
of which households 4 787 4 612 4
of which companies 10 477 9 213 14
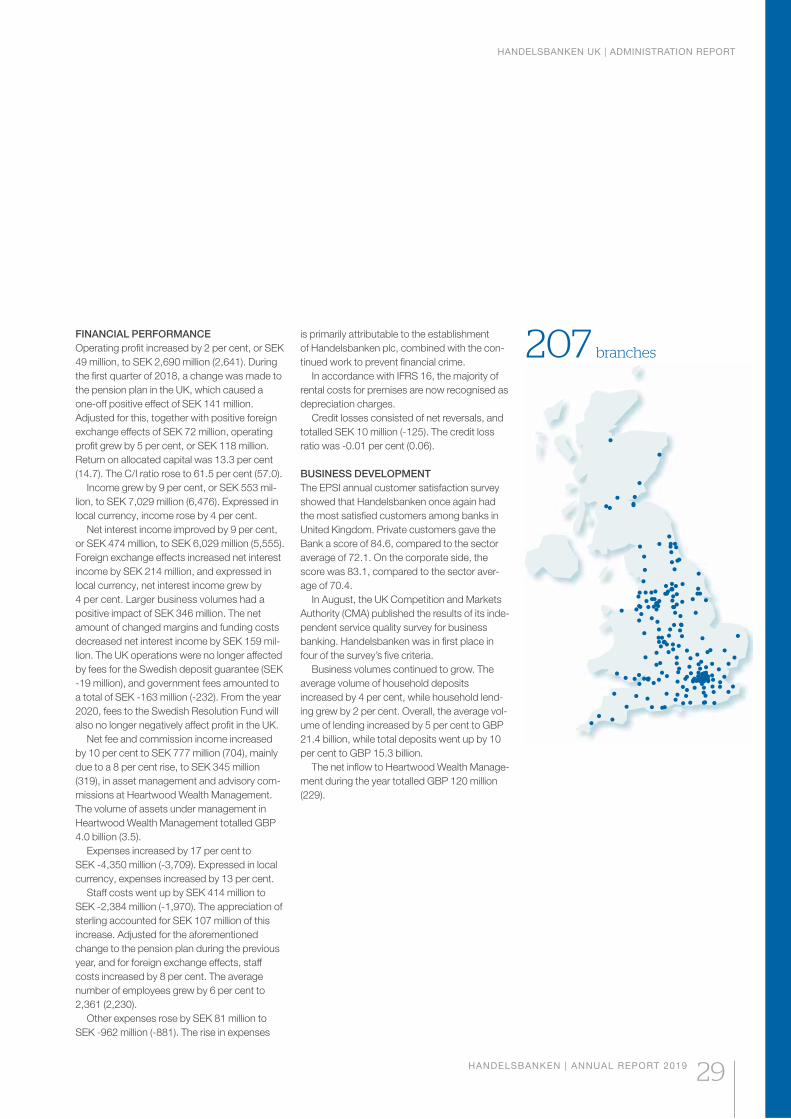
HANDELSBANKEN UK | ADMINISTRATION REPORT
HANDELSBANKEN | ANNUAL REPORT 2019 29
207 branchesFINANCIAL PERFORMANCE
Operating profit increased by 2 per cent, or SEK
49 million, to SEK 2,690 million (2,641). During
the first quarter of 2018, a change was made to
the pension plan in the UK, which caused a
one-off positive effect of SEK 141 million.
Adjusted for this, together with positive foreign
exchange effects of SEK 72 million, operating
profit grew by 5 per cent, or SEK 118 million.
Return on allocated capital was 13.3 per cent
(14.7). The C/I ratio rose to 61.5 per cent (57.0).
Income grew by 9 per cent, or SEK 553 mil-
lion, to SEK 7,029 million (6,476). Expressed in
local currency, income rose by 4 per cent.
Net interest income improved by 9 per cent,
or SEK 474 million, to SEK 6,029 million (5,555).
Foreign exchange effects increased net interest
income by SEK 214 million, and expressed in
local currency, net interest income grew by
4 per cent. Larger business volumes had a
positive impact of SEK 346 million. The net
amount of changed margins and funding costs
decreased net interest income by SEK 159 mil-
lion. The UK operations were no longer affected
by fees for the Swedish deposit guarantee (SEK
-19 million), and government fees amounted to
a total of SEK -163 million (-232). From the year
2020, fees to the Swedish Resolution Fund will
also no longer negatively affect profit in the UK.
Net fee and commission income increased
by 10 per cent to SEK 777 million (704), mainly
due to a 8 per cent rise, to SEK 345 million
(319), in asset management and advisory com-
missions at Heartwood Wealth Management.
The volume of assets under management in
Heartwood Wealth Management totalled GBP
4.0 billion (3.5).
Expenses increased by 17 per cent to
SEK -4,350 million (-3,709). Expressed in local
currency, expenses increased by 13 per cent.
Staff costs went up by SEK 414 million to
SEK -2,384 million (-1,970). The appreciation of
sterling accounted for SEK 107 million of this
increase. Adjusted for the aforementioned
change to the pension plan during the previous
year, and for foreign exchange effects, staff
costs increased by 8 per cent. The average
number of employees grew by 6 per cent to
2,361 (2,230).
Other expenses rose by SEK 81 million to
SEK -962 million (-881). The rise in expenses
is primarily attributable to the establishment
of Handelsbanken plc, combined with the con-
tinued work to prevent financial crime.
In accordance with IFRS 16, the majority of
rental costs for premises are now recognised as
depreciation charges.
Credit losses consisted of net reversals, and
totalled SEK 10 million (-125). The credit loss
ratio was -0.01 per cent (0.06).
BUSINESS DEVELOPMENT
The EPSI annual customer satisfaction survey
showed that Handelsbanken once again had
the most satisfied customers among banks in
United Kingdom. Private customers gave the
Bank a score of 84.6, compared to the sector
average of 72.1. On the corporate side, the
score was 83.1, compared to the sector aver-
age of 70.4.
In August, the UK Competition and Markets
Authority (CMA) published the results of its inde-
pendent service quality survey for business
banking. Handelsbanken was in first place in
four of the survey’s five criteria.
Business volumes continued to grow. The
average volume of household deposits
increased by 4 per cent, while household lend-
ing grew by 2 per cent. Overall, the average vol-
ume of lending increased by 5 per cent to GBP
21.4 billion, while total deposits went up by 10
per cent to GBP 15.3 billion.
The net inflow to Heartwood Wealth Manage-
ment during the year totalled GBP 120 million
(229).
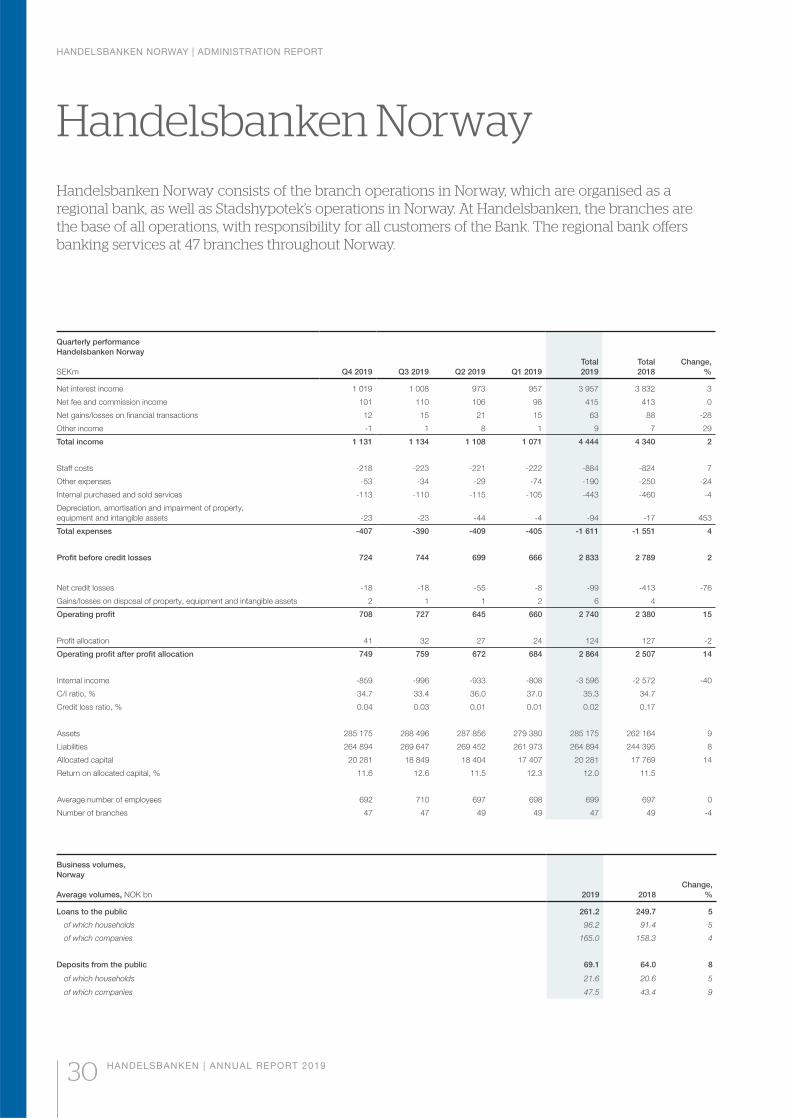
HANDELSBANKEN NORWAY | ADMINISTRATION REPORT
30 HANDELSBANKEN | ANNUAL REPORT 2019
Handelsbanken NorwayHandelsbanken Norway consists of the branch operations in Norway, which are organised as a regional bank, as well as Stadshypotek’s operations in Norway. At Handelsbanken, the branches are the base of all operations, with responsibility for all customers of the Bank. The regional bank offers banking services at 47 branches throughout Norway.
Business volumes,
Norway
Average volumes, NOK bn 2019 2018
Change,
%
Loans to the public 261.2 249.7 5
of which households 96.2 91.4 5
of which companies 165.0 158.3 4
Deposits from the public 69.1 64.0 8
of which households 21.6 20.6 5
of which companies 47.5 43.4 9
Quarterly performance
Handelsbanken Norway
SEKm Q4 2019 Q3 2019 Q2 2019 Q1 2019
Total
2019
Total
2018
Change,
%
Net interest income 1 019 1 008 973 957 3 957 3 832 3
Net fee and commission income 101 110 106 98 415 413 0
Net gains/losses on financial transactions 12 15 21 15 63 88 -28
Other income -1 1 8 1 9 7 29
Total income 1 131 1 134 1 108 1 071 4 444 4 340 2
Staff costs -218 -223 -221 -222 -884 -824 7
Other expenses -53 -34 -29 -74 -190 -250 -24
Internal purchased and sold services -113 -110 -115 -105 -443 -460 -4
Depreciation, amortisation and impairment of property,
equipment and intangible assets -23 -23 -44 -4 -94 -17 453
Total expenses -407 -390 -409 -405 -1 611 -1 551 4
Profit before credit losses 724 744 699 666 2 833 2 789 2
Net credit losses -18 -18 -55 -8 -99 -413 -76
Gains/losses on disposal of property, equipment and intangible assets 2 1 1 2 6 4
Operating profit 708 727 645 660 2 740 2 380 15
Profit allocation 41 32 27 24 124 127 -2
Operating profit after profit allocation 749 759 672 684 2 864 2 507 14
Internal income -859 -996 -933 -808 -3 596 -2 572 -40
C/I ratio, % 34.7 33.4 36.0 37.0 35.3 34.7
Credit loss ratio, % 0.04 0.03 0.01 0.01 0.02 0.17
Assets 285 175 288 496 287 856 279 380 285 175 262 164 9
Liabilities 264 894 269 647 269 452 261 973 264 894 244 395 8
Allocated capital 20 281 18 849 18 404 17 407 20 281 17 769 14
Return on allocated capital, % 11.6 12.6 11.5 12.3 12.0 11.5
Average number of employees 692 710 697 698 699 697 0
Number of branches 47 47 49 49 47 49 -4
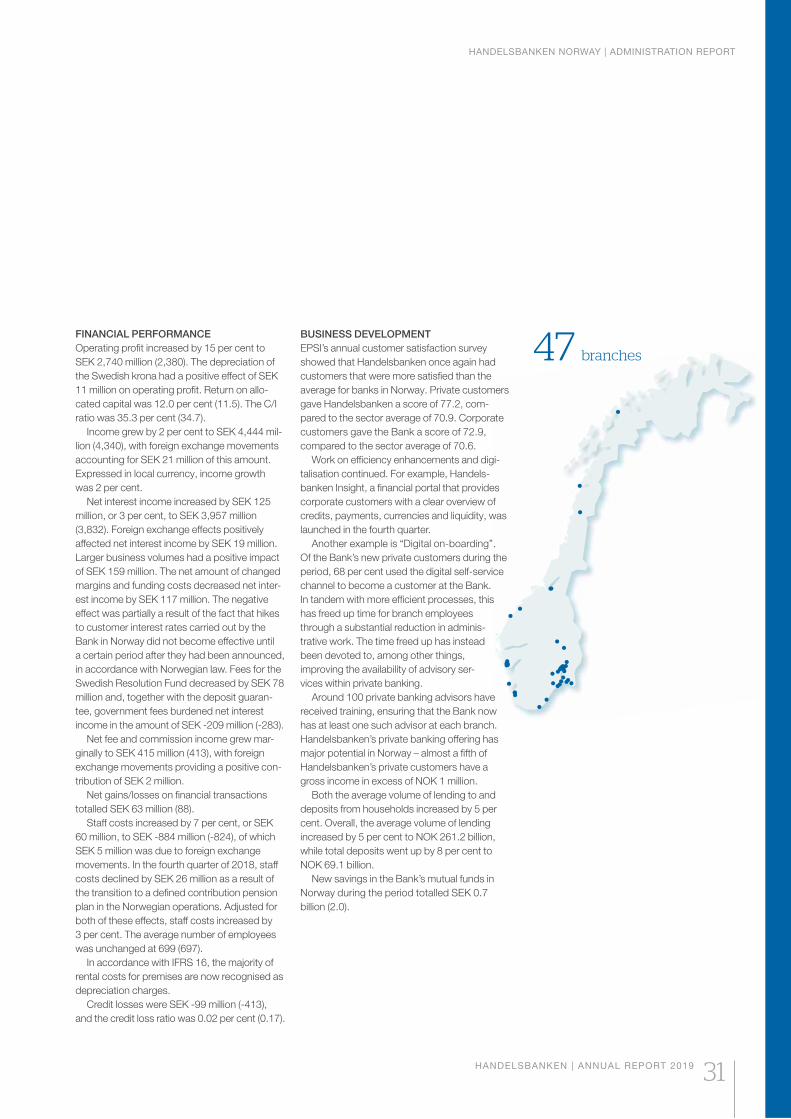
HANDELSBANKEN NORWAY | ADMINISTRATION REPORT
HANDELSBANKEN | ANNUAL REPORT 2019 31
47 branches
FINANCIAL PERFORMANCE
Operating profit increased by 15 per cent to
SEK 2,740 million (2,380). The depreciation of
the Swedish krona had a positive effect of SEK
11 million on operating profit. Return on allo-
cated capital was 12.0 per cent (11.5). The C/I
ratio was 35.3 per cent (34.7).
Income grew by 2 per cent to SEK 4,444 mil-
lion (4,340), with foreign exchange movements
accounting for SEK 21 million of this amount.
Expressed in local currency, income growth
was 2 per cent.
Net interest income increased by SEK 125
million, or 3 per cent, to SEK 3,957 million
(3,832). Foreign exchange effects positively
affected net interest income by SEK 19 million.
Larger business volumes had a positive impact
of SEK 159 million. The net amount of changed
margins and funding costs decreased net inter-
est income by SEK 117 million. The negative
effect was partially a result of the fact that hikes
to customer interest rates carried out by the
Bank in Norway did not become effective until
a certain period after they had been announced,
in accordance with Norwegian law. Fees for the
Swedish Resolution Fund decreased by SEK 78
million and, together with the deposit guaran-
tee, government fees burdened net interest
income in the amount of SEK -209 million (-283).
Net fee and commission income grew mar-
ginally to SEK 415 million (413), with foreign
exchange movements providing a positive con-
tribution of SEK 2 million.
Net gains/losses on financial transactions
totalled SEK 63 million (88).
Staff costs increased by 7 per cent, or SEK
60 million, to SEK -884 million (-824), of which
SEK 5 million was due to foreign exchange
movements. In the fourth quarter of 2018, staff
costs declined by SEK 26 million as a result of
the transition to a defined contribution pension
plan in the Norwegian operations. Adjusted for
both of these effects, staff costs increased by
3 per cent. The average number of employees
was unchanged at 699 (697).
In accordance with IFRS 16, the majority of
rental costs for premises are now recognised as
depreciation charges.
Credit losses were SEK -99 million (-413),
and the credit loss ratio was 0.02 per cent (0.17).
BUSINESS DEVELOPMENT
EPSI’s annual customer satisfaction survey
showed that Handelsbanken once again had
customers that were more satisfied than the
average for banks in Norway. Private customers
gave Handelsbanken a score of 77.2, com-
pared to the sector average of 70.9. Corporate
customers gave the Bank a score of 72.9,
compared to the sector average of 70.6.
Work on efficiency enhancements and digi-
talisation continued. For example, Handels-
banken Insight, a financial portal that provides
corporate customers with a clear overview of
credits, payments, currencies and liquidity, was
launched in the fourth quarter.
Another example is “Digital on-boarding”.
Of the Bank’s new private customers during the
period, 68 per cent used the digital self-service
channel to become a customer at the Bank.
In tandem with more efficient processes, this
has freed up time for branch employees
through a substantial reduction in adminis-
trative work. The time freed up has instead
been devoted to, among other things,
improving the availability of advisory ser-
vices within private banking.
Around 100 private banking advisors have
received training, ensuring that the Bank now
has at least one such advisor at each branch.
Handelsbanken’s private banking offering has
major potential in Norway – almost a fifth of
Handelsbanken’s private customers have a
gross income in excess of NOK 1 million.
Both the average volume of lending to and
deposits from households increased by 5 per
cent. Overall, the average volume of lending
increased by 5 per cent to NOK 261.2 billion,
while total deposits went up by 8 per cent to
NOK 69.1 billion.
New savings in the Bank’s mutual funds in
Norway during the period totalled SEK 0.7
billion (2.0).
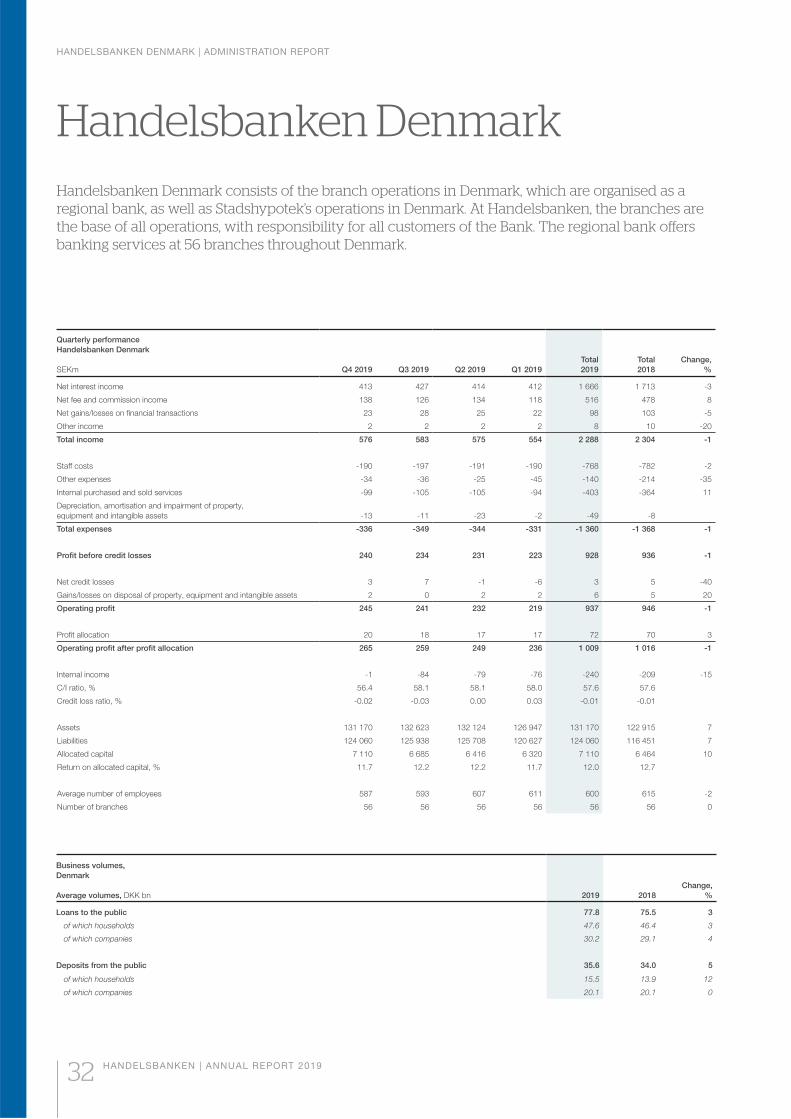
HANDELSBANKEN DENMARK | ADMINISTRATION REPORT
32 HANDELSBANKEN | ANNUAL REPORT 2019
Handelsbanken Denmark consists of the branch operations in Denmark, which are organised as a regional bank, as well as Stadshypotek’s operations in Denmark. At Handelsbanken, the branches are the base of all operations, with responsibility for all customers of the Bank. The regional bank offers banking services at 56 branches throughout Denmark.
Business volumes,
Denmark
Average volumes, DKK bn 2019 2018
Change,
%
Loans to the public 77.8 75.5 3
of which households 47.6 46.4 3
of which companies 30.2 29.1 4
Deposits from the public 35.6 34.0 5
of which households 15.5 13.9 12
of which companies 20.1 20.1 0
Quarterly performance
Handelsbanken Denmark
SEKm Q4 2019 Q3 2019 Q2 2019 Q1 2019
Total
2019
Total
2018
Change,
%
Net interest income 413 427 414 412 1 666 1 713 -3
Net fee and commission income 138 126 134 118 516 478 8
Net gains/losses on financial transactions 23 28 25 22 98 103 -5
Other income 2 2 2 2 8 10 -20
Total income 576 583 575 554 2 288 2 304 -1
Staff costs -190 -197 -191 -190 -768 -782 -2
Other expenses -34 -36 -25 -45 -140 -214 -35
Internal purchased and sold services -99 -105 -105 -94 -403 -364 11
Depreciation, amortisation and impairment of property,
equipment and intangible assets -13 -11 -23 -2 -49 -8
Total expenses -336 -349 -344 -331 -1 360 -1 368 -1
Profit before credit losses 240 234 231 223 928 936 -1
Net credit losses 3 7 -1 -6 3 5 -40
Gains/losses on disposal of property, equipment and intangible assets 2 0 2 2 6 5 20
Operating profit 245 241 232 219 937 946 -1
Profit allocation 20 18 17 17 72 70 3
Operating profit after profit allocation 265 259 249 236 1 009 1 016 -1
Internal income -1 -84 -79 -76 -240 -209 -15
C/I ratio, % 56.4 58.1 58.1 58.0 57.6 57.6
Credit loss ratio, % -0.02 -0.03 0.00 0.03 -0.01 -0.01
Assets 131 170 132 623 132 124 126 947 131 170 122 915 7
Liabilities 124 060 125 938 125 708 120 627 124 060 116 451 7
Allocated capital 7 110 6 685 6 416 6 320 7 110 6 464 10
Return on allocated capital, % 11.7 12.2 12.2 11.7 12.0 12.7
Average number of employees 587 593 607 611 600 615 -2
Number of branches 56 56 56 56 56 56 0
Handelsbanken Denmark
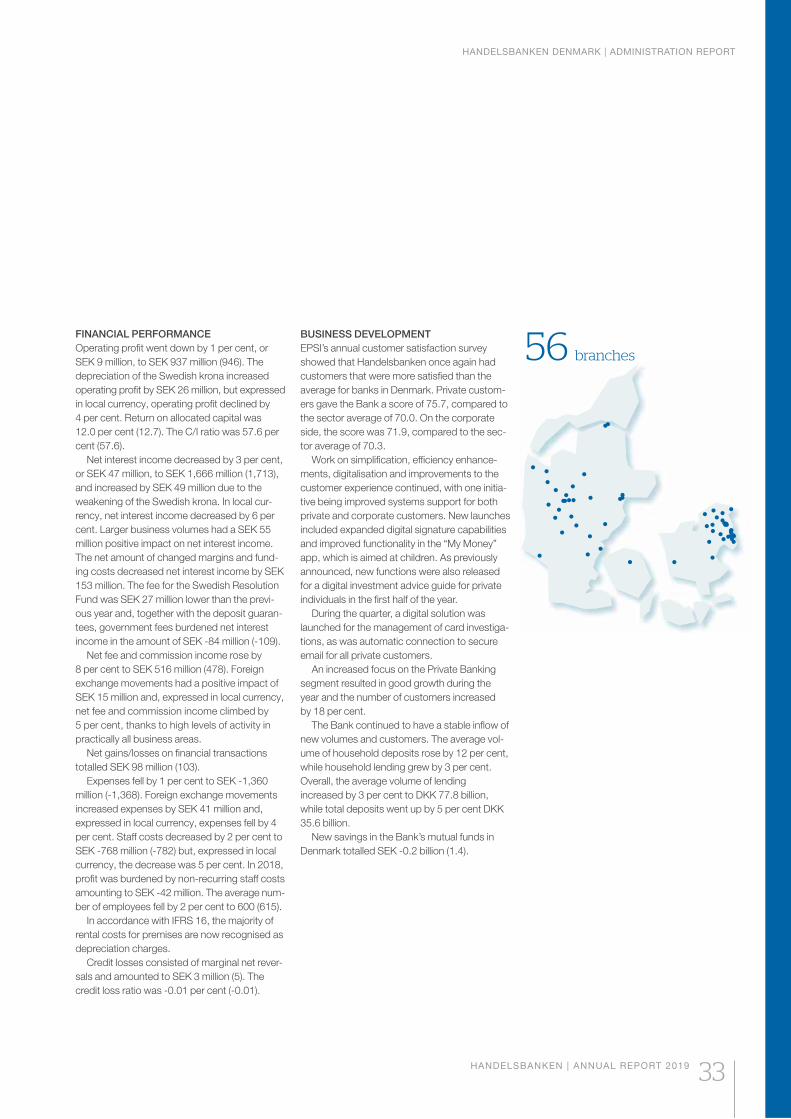
HANDELSBANKEN DENMARK | ADMINISTRATION REPORT
HANDELSBANKEN | ANNUAL REPORT 2019 33
56 branches
FINANCIAL PERFORMANCE
Operating profit went down by 1 per cent, or
SEK 9 million, to SEK 937 million (946). The
depreciation of the Swedish krona increased
operating profit by SEK 26 million, but expressed
in local currency, operating profit declined by
4 per cent. Return on allocated capital was
12.0 per cent (12.7). The C/I ratio was 57.6 per
cent (57.6).
Net interest income decreased by 3 per cent,
or SEK 47 million, to SEK 1,666 million (1,713),
and increased by SEK 49 million due to the
weakening of the Swedish krona. In local cur-
rency, net interest income decreased by 6 per
cent. Larger business volumes had a SEK 55
million positive impact on net interest income.
The net amount of changed margins and fund-
ing costs decreased net interest income by SEK
153 million. The fee for the Swedish Resolution
Fund was SEK 27 million lower than the previ-
ous year and, together with the deposit guaran-
tees, government fees burdened net interest
income in the amount of SEK -84 million (-109).
Net fee and commission income rose by
8 per cent to SEK 516 million (478). Foreign
exchange movements had a positive impact of
SEK 15 million and, expressed in local currency,
net fee and commission income climbed by
5 per cent, thanks to high levels of activity in
practically all business areas.
Net gains/losses on financial transactions
totalled SEK 98 million (103).
Expenses fell by 1 per cent to SEK -1,360
million (-1,368). Foreign exchange movements
increased expenses by SEK 41 million and,
expressed in local currency, expenses fell by 4
per cent. Staff costs decreased by 2 per cent to
SEK -768 million (-782) but, expressed in local
currency, the decrease was 5 per cent. In 2018,
profit was burdened by non-recurring staff costs
amounting to SEK -42 million. The average num-
ber of employees fell by 2 per cent to 600 (615).
In accordance with IFRS 16, the majority of
rental costs for premises are now recognised as
depreciation charges.
Credit losses consisted of marginal net rever-
sals and amounted to SEK 3 million (5). The
credit loss ratio was -0.01 per cent (-0.01).
BUSINESS DEVELOPMENT
EPSI’s annual customer satisfaction survey
showed that Handelsbanken once again had
customers that were more satisfied than the
average for banks in Denmark. Private custom-
ers gave the Bank a score of 75.7, compared to
the sector average of 70.0. On the corporate
side, the score was 71.9, compared to the sec-
tor average of 70.3.
Work on simplification, efficiency enhance-
ments, digitalisation and improvements to the
customer experience continued, with one initia-
tive being improved systems support for both
private and corporate customers. New launches
included expanded digital signature capabilities
and improved functionality in the “My Money”
app, which is aimed at children. As previously
announced, new functions were also released
for a digital investment advice guide for private
individuals in the first half of the year.
During the quarter, a digital solution was
launched for the management of card investiga-
tions, as was automatic connection to secure
email for all private customers.
An increased focus on the Private Banking
segment resulted in good growth during the
year and the number of customers increased
by 18 per cent.
The Bank continued to have a stable inflow of
new volumes and customers. The average vol-
ume of household deposits rose by 12 per cent,
while household lending grew by 3 per cent.
Overall, the average volume of lending
increased by 3 per cent to DKK 77.8 billion,
while total deposits went up by 5 per cent DKK
35.6 billion.
New savings in the Bank’s mutual funds in
Denmark totalled SEK -0.2 billion (1.4).

HANDELSBANKEN FINLAND | ADMINISTRATION REPORT
34 HANDELSBANKEN | ANNUAL REPORT 2019
Handelsbanken FinlandHandelsbanken Finland consists of the branch operations in Finland, which are organised as a regional bank, as well as Handelsbanken Finans’s and Stadshypotek’s operations in Finland. At Handelsbanken, the branches are the base of all operations, with responsibility for all customers of the Bank. The regional bank offers banking services at 36 branches throughout Finland. Handelsbanken Finans offers finance company services and works through the Bank’s branches.
Business volumes,
Finland
Average volumes, EUR m 2019 2018
Change,
%
Loans to the public 13 872 13 340 4
of which households 4 334 4 195 3
of which companies 9 538 9 145 4
Deposits from the public 4 610 4 395 5
of which households 1 707 1 579 8
of which companies 2 903 2 816 3
Quarterly performance
Handelsbanken Finland
SEKm Q4 2019 Q3 2019 Q2 2019 Q1 2019
Total
2019
Total
2018
Change,
%
Net interest income 351 366 332 337 1 386 1 315 5
Net fee and commission income 146 152 141 133 572 502 14
Net gains/losses on financial transactions 9 9 14 14 46 45 2
Other income 3 5 2 7 17 16 6
Total income 509 532 489 491 2 021 1 878 8
Staff costs -111 -110 -115 -110 -446 -437 2
Other expenses -56 -42 -38 -57 -193 -195 -1
Internal purchased and sold services -116 -99 -101 -83 -399 -365 9
Depreciation, amortisation and impairment of property,
equipment and intangible assets -18 -18 -30 -4 -70 -21 233
Total expenses -301 -269 -284 -254 -1 108 -1 018 9
Profit before credit losses 208 263 205 237 913 860 6
Net credit losses 21 31 52 -1 103 -172
Gains/losses on disposal of property, equipment and intangible assets 0 -1 0 0 -1 0
Operating profit 229 293 257 236 1 015 688 48
Profit allocation 45 47 42 41 175 183 -4
Operating profit after profit allocation 274 340 299 277 1 190 871 37
Internal income 35 -73 -77 -70 -185 -157 -18
C/I ratio, % 54.3 46.5 53.5 47.7 50.5 49.4
Credit loss ratio, % -0.18 -0.08 -0.12 0.01 -0.09 0.14
Assets 212 594 213 144 201 027 195 857 212 594 193 618 10
Liabilities 205 113 205 974 194 245 189 119 205 113 186 931 10
Allocated capital 7 481 7 170 6 782 6 738 7 481 6 687 12
Return on allocated capital, % 11.5 14.9 13.9 12.8 13.3 10.4
Average number of employees 501 514 514 496 506 518 -2
Number of branches 36 36 36 36 36 36 0
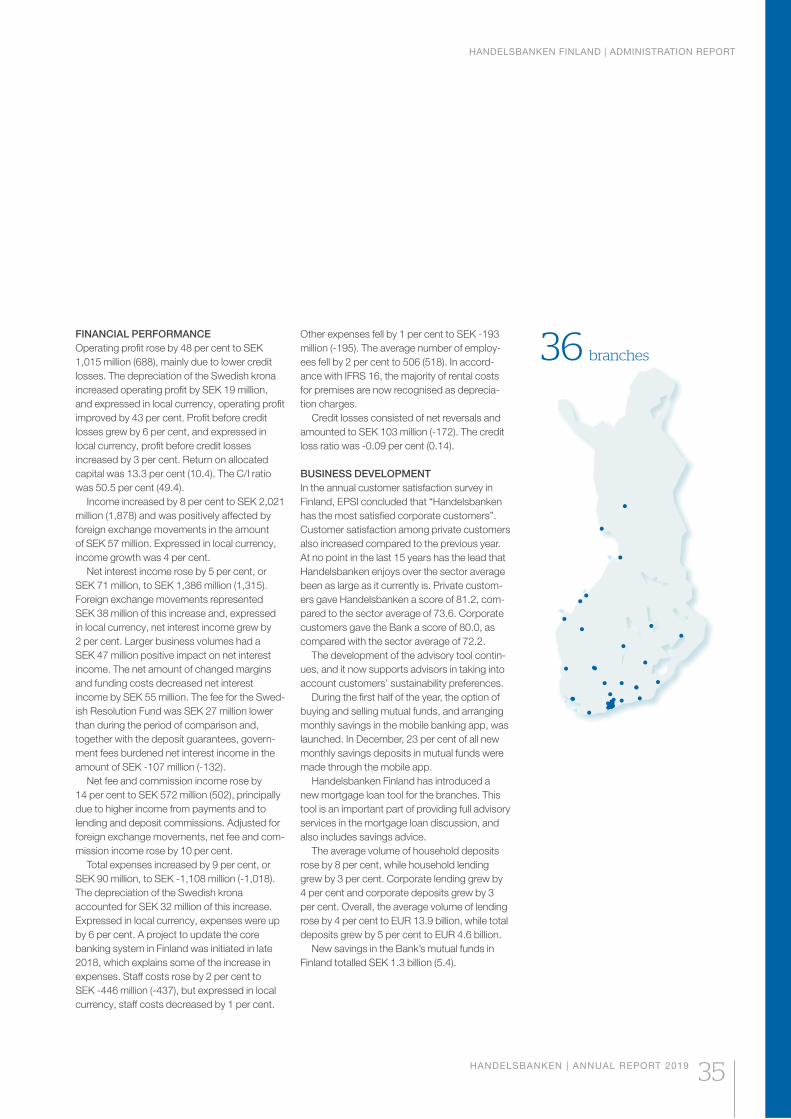
HANDELSBANKEN FINLAND | ADMINISTRATION REPORT
HANDELSBANKEN | ANNUAL REPORT 2019 35
36 branches
FINANCIAL PERFORMANCE
Operating profit rose by 48 per cent to SEK
1,015 million (688), mainly due to lower credit
losses. The depreciation of the Swedish krona
increased operating profit by SEK 19 million,
and expressed in local currency, operating profit
improved by 43 per cent. Profit before credit
losses grew by 6 per cent, and expressed in
local currency, profit before credit losses
increased by 3 per cent. Return on allocated
capital was 13.3 per cent (10.4). The C/I ratio
was 50.5 per cent (49.4).
Income increased by 8 per cent to SEK 2,021
million (1,878) and was positively affected by
foreign exchange movements in the amount
of SEK 57 million. Expressed in local currency,
income growth was 4 per cent.
Net interest income rose by 5 per cent, or
SEK 71 million, to SEK 1,386 million (1,315).
Foreign exchange movements represented
SEK 38 million of this increase and, expressed
in local currency, net interest income grew by
2 per cent. Larger business volumes had a
SEK 47 million positive impact on net interest
income. The net amount of changed margins
and funding costs decreased net interest
income by SEK 55 million. The fee for the Swed-
ish Resolution Fund was SEK 27 million lower
than during the period of comparison and,
together with the deposit guarantees, govern-
ment fees burdened net interest income in the
amount of SEK -107 million (-132).
Net fee and commission income rose by
14 per cent to SEK 572 million (502), principally
due to higher income from payments and to
lending and deposit commissions. Adjusted for
foreign exchange movements, net fee and com-
mission income rose by 10 per cent.
Total expenses increased by 9 per cent, or
SEK 90 million, to SEK -1,108 million (-1,018).
The depreciation of the Swedish krona
accounted for SEK 32 million of this increase.
Expressed in local currency, expenses were up
by 6 per cent. A project to update the core
banking system in Finland was initiated in late
2018, which explains some of the increase in
expenses. Staff costs rose by 2 per cent to
SEK -446 million (-437), but expressed in local
currency, staff costs decreased by 1 per cent.
Other expenses fell by 1 per cent to SEK -193
million (-195). The average number of employ-
ees fell by 2 per cent to 506 (518). In accord-
ance with IFRS 16, the majority of rental costs
for premises are now recognised as deprecia-
tion charges.
Credit losses consisted of net reversals and
amounted to SEK 103 million (-172). The credit
loss ratio was -0.09 per cent (0.14).
BUSINESS DEVELOPMENT
In the annual customer satisfaction survey in
Finland, EPSI concluded that “Handelsbanken
has the most satisfied corporate customers”.
Customer satisfaction among private customers
also increased compared to the previous year.
At no point in the last 15 years has the lead that
Handelsbanken enjoys over the sector average
been as large as it currently is. Private custom-
ers gave Handelsbanken a score of 81.2, com-
pared to the sector average of 73.6. Corporate
customers gave the Bank a score of 80.0, as
compared with the sector average of 72.2.
The development of the advisory tool contin-
ues, and it now supports advisors in taking into
account customers’ sustainability preferences.
During the first half of the year, the option of
buying and selling mutual funds, and arranging
monthly savings in the mobile banking app, was
launched. In December, 23 per cent of all new
monthly savings deposits in mutual funds were
made through the mobile app.
Handelsbanken Finland has introduced a
new mortgage loan tool for the branches. This
tool is an important part of providing full advisory
services in the mortgage loan discussion, and
also includes savings advice.
The average volume of household deposits
rose by 8 per cent, while household lending
grew by 3 per cent. Corporate lending grew by
4 per cent and corporate deposits grew by 3
per cent. Overall, the average volume of lending
rose by 4 per cent to EUR 13.9 billion, while total
deposits grew by 5 per cent to EUR 4.6 billion.
New savings in the Bank’s mutual funds in
Finland totalled SEK 1.3 billion (5.4).
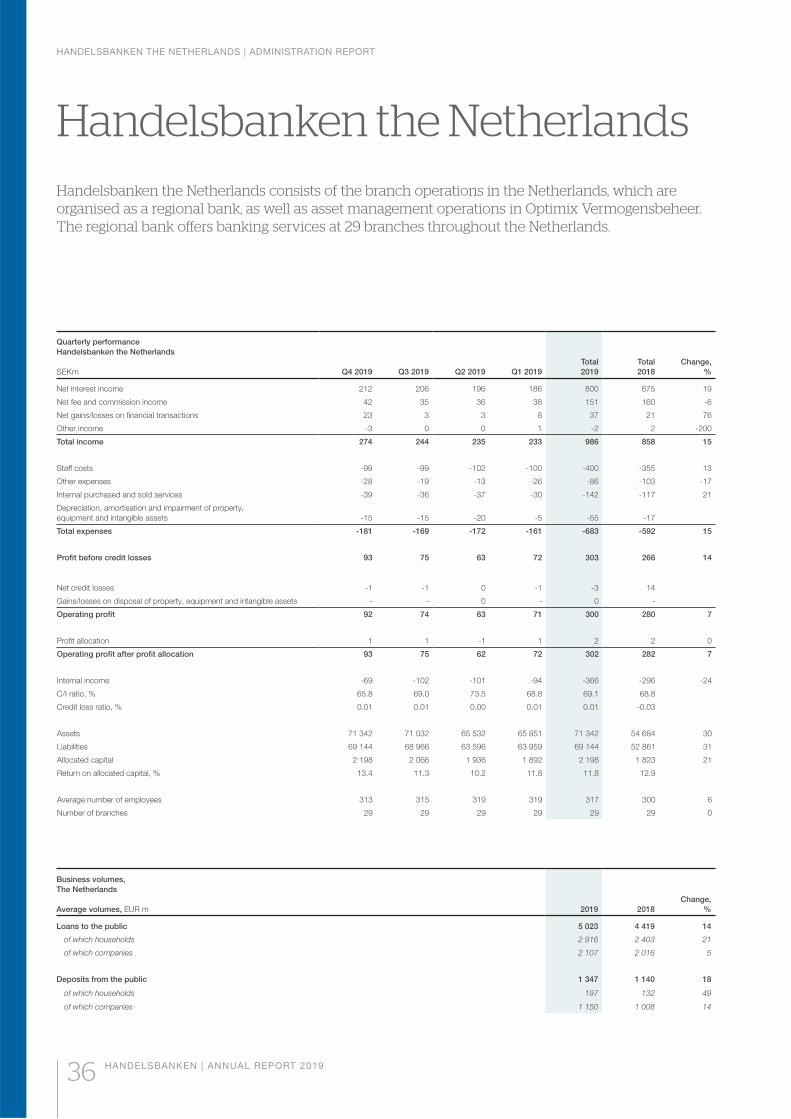
HANDELSBANKEN THE NETHERLANDS | ADMINISTRATION REPORT
36 HANDELSBANKEN | ANNUAL REPORT 2019
Handelsbanken the NetherlandsHandelsbanken the Netherlands consists of the branch operations in the Netherlands, which are organised as a regional bank, as well as asset management operations in Optimix Vermogensbeheer. The regional bank offers banking services at 29 branches throughout the Netherlands.
Quarterly performance
Handelsbanken the Netherlands
SEKm Q4 2019 Q3 2019 Q2 2019 Q1 2019
Total
2019
Total
2018
Change,
%
Net interest income 212 206 196 186 800 675 19
Net fee and commission income 42 35 36 38 151 160 -6
Net gains/losses on financial transactions 23 3 3 8 37 21 76
Other income -3 0 0 1 -2 2 -200
Total income 274 244 235 233 986 858 15
Staff costs -99 -99 -102 -100 -400 -355 13
Other expenses -28 -19 -13 -26 -86 -103 -17
Internal purchased and sold services -39 -36 -37 -30 -142 -117 21
Depreciation, amortisation and impairment of property,
equipment and intangible assets -15 -15 -20 -5 -55 -17
Total expenses -181 -169 -172 -161 -683 -592 15
Profit before credit losses 93 75 63 72 303 266 14
Net credit losses -1 -1 0 -1 -3 14
Gains/losses on disposal of property, equipment and intangible assets - - 0 - 0 -
Operating profit 92 74 63 71 300 280 7
Profit allocation 1 1 -1 1 2 2 0
Operating profit after profit allocation 93 75 62 72 302 282 7
Internal income -69 -102 -101 -94 -366 -296 -24
C/I ratio, % 65.8 69.0 73.5 68.8 69.1 68.8
Credit loss ratio, % 0.01 0.01 0.00 0.01 0.01 -0.03
Assets 71 342 71 032 65 532 65 851 71 342 54 684 30
Liabilities 69 144 68 966 63 596 63 959 69 144 52 861 31
Allocated capital 2 198 2 066 1 936 1 892 2 198 1 823 21
Return on allocated capital, % 13.4 11.3 10.2 11.8 11.8 12.9
Average number of employees 313 315 319 319 317 300 6
Number of branches 29 29 29 29 29 29 0
Business volumes,
The Netherlands
Average volumes, EUR m 2019 2018
Change,
%
Loans to the public 5 023 4 419 14
of which households 2 916 2 403 21
of which companies 2 107 2 016 5
Deposits from the public 1 347 1 140 18
of which households 197 132 49
of which companies 1 150 1 008 14
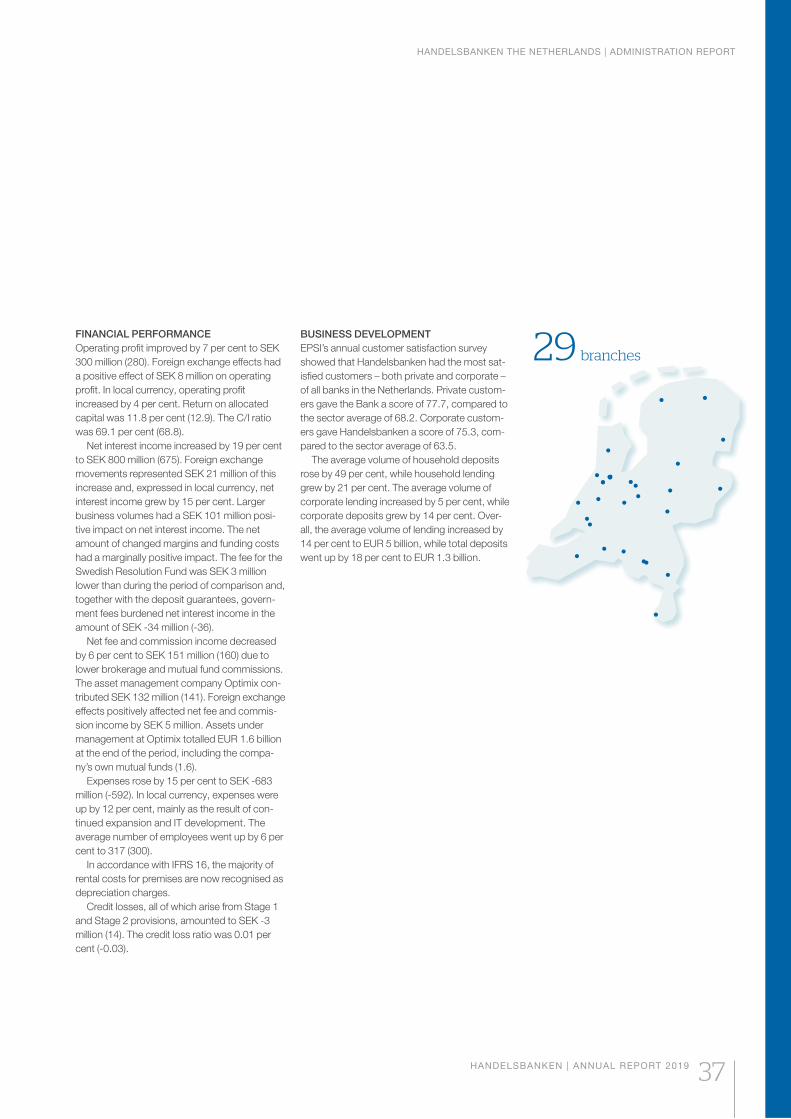
HANDELSBANKEN THE NETHERLANDS | ADMINISTRATION REPORT
HANDELSBANKEN | ANNUAL REPORT 2019 37
29 branches
FINANCIAL PERFORMANCE
Operating profit improved by 7 per cent to SEK
300 million (280). Foreign exchange effects had
a positive effect of SEK 8 million on operating
profit. In local currency, operating profit
increased by 4 per cent. Return on allocated
capital was 11.8 per cent (12.9). The C/I ratio
was 69.1 per cent (68.8).
Net interest income increased by 19 per cent
to SEK 800 million (675). Foreign exchange
movements represented SEK 21 million of this
increase and, expressed in local currency, net
interest income grew by 15 per cent. Larger
business volumes had a SEK 101 million posi-
tive impact on net interest income. The net
amount of changed margins and funding costs
had a marginally positive impact. The fee for the
Swedish Resolution Fund was SEK 3 million
lower than during the period of comparison and,
together with the deposit guarantees, govern-
ment fees burdened net interest income in the
amount of SEK -34 million (-36).
Net fee and commission income decreased
by 6 per cent to SEK 151 million (160) due to
lower brokerage and mutual fund commissions.
The asset management company Optimix con-
tributed SEK 132 million (141). Foreign exchange
effects positively affected net fee and commis-
sion income by SEK 5 million. Assets under
management at Optimix totalled EUR 1.6 billion
at the end of the period, including the compa-
ny’s own mutual funds (1.6).
Expenses rose by 15 per cent to SEK -683
million (-592). In local currency, expenses were
up by 12 per cent, mainly as the result of con-
tinued expansion and IT development. The
average number of employees went up by 6 per
cent to 317 (300).
In accordance with IFRS 16, the majority of
rental costs for premises are now recognised as
depreciation charges.
Credit losses, all of which arise from Stage 1
and Stage 2 provisions, amounted to SEK -3
million (14). The credit loss ratio was 0.01 per
cent (-0.03).
BUSINESS DEVELOPMENT
EPSI’s annual customer satisfaction survey
showed that Handelsbanken had the most sat-
isfied customers – both private and corporate –
of all banks in the Netherlands. Private custom-
ers gave the Bank a score of 77.7, compared to
the sector average of 68.2. Corporate custom-
ers gave Handelsbanken a score of 75.3, com-
pared to the sector average of 63.5.
The average volume of household deposits
rose by 49 per cent, while household lending
grew by 21 per cent. The average volume of
corporate lending increased by 5 per cent, while
corporate deposits grew by 14 per cent. Over-
all, the average volume of lending increased by
14 per cent to EUR 5 billion, while total deposits
went up by 18 per cent to EUR 1.3 billion.
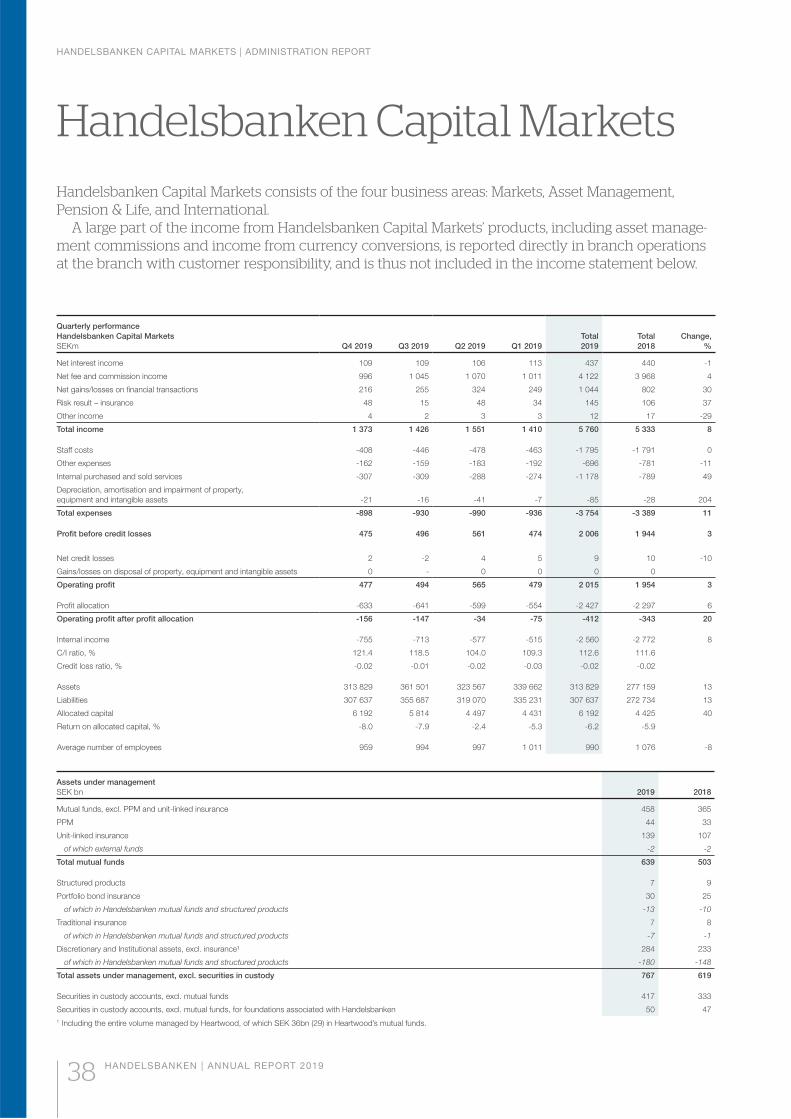
HANDELSBANKEN CAPITAL MARKETS | ADMINISTRATION REPORT
38 HANDELSBANKEN | ANNUAL REPORT 2019
Quarterly performance
Handelsbanken Capital Markets
SEKm Q4 2019 Q3 2019 Q2 2019 Q1 2019
Total
2019
Total
2018
Change,
%
Net interest income 109 109 106 113 437 440 -1
Net fee and commission income 996 1 045 1 070 1 011 4 122 3 968 4
Net gains/losses on financial transactions 216 255 324 249 1 044 802 30
Risk result – insurance 48 15 48 34 145 106 37
Other income 4 2 3 3 12 17 -29
Total income 1 373 1 426 1 551 1 410 5 760 5 333 8
Staff costs -408 -446 -478 -463 -1 795 -1 791 0
Other expenses -162 -159 -183 -192 -696 -781 -11
Internal purchased and sold services -307 -309 -288 -274 -1 178 -789 49
Depreciation, amortisation and impairment of property,
equipment and intangible assets -21 -16 -41 -7 -85 -28 204
Total expenses -898 -930 -990 -936 -3 754 -3 389 11
Profit before credit losses 475 496 561 474 2 006 1 944 3
Net credit losses 2 -2 4 5 9 10 -10
Gains/losses on disposal of property, equipment and intangible assets 0 - 0 0 0 0
Operating profit 477 494 565 479 2 015 1 954 3
Profit allocation -633 -641 -599 -554 -2 427 -2 297 6
Operating profit after profit allocation -156 -147 -34 -75 -412 -343 20
Internal income -755 -713 -577 -515 -2 560 -2 772 8
C/I ratio, % 121.4 118.5 104.0 109.3 112.6 111.6
Credit loss ratio, % -0.02 -0.01 -0.02 -0.03 -0.02 -0.02
Assets 313 829 361 501 323 567 339 662 313 829 277 159 13
Liabilities 307 637 355 687 319 070 335 231 307 637 272 734 13
Allocated capital 6 192 5 814 4 497 4 431 6 192 4 425 40
Return on allocated capital, % -8.0 -7.9 -2.4 -5.3 -6.2 -5.9
Average number of employees 959 994 997 1 011 990 1 076 -8
Handelsbanken Capital Markets
Assets under management
SEK bn 2019 2018
Mutual funds, excl. PPM and unit-linked insurance 458 365
PPM 44 33
Unit-linked insurance 139 107
of which external funds -2 -2
Total mutual funds 639 503
Structured products 7 9
Portfolio bond insurance 30 25
of which in Handelsbanken mutual funds and structured products -13 -10
Traditional insurance 7 8
of which in Handelsbanken mutual funds and structured products -7 -1
Discretionary and Institutional assets, excl. insurance¹ 284 233
of which in Handelsbanken mutual funds and structured products -180 -148
Total assets under management, excl. securities in custody 767 619
Securities in custody accounts, excl. mutual funds 417 333
Securities in custody accounts, excl. mutual funds, for foundations associated with Handelsbanken 50 47
1 Including the entire volume managed by Heartwood, of which SEK 36bn (29) in Heartwood’s mutual funds.
Handelsbanken Capital Markets consists of the four business areas: Markets, Asset Management, Pension & Life, and International.
A large part of the income from Handelsbanken Capital Markets’ products, including asset manage-ment commissions and income from currency conversions, is reported directly in branch operations at the branch with customer responsibility, and is thus not included in the income statement below.
HANDELSBANKEN CAPITAL MARKETS | ADMINISTRATION REPORT
HANDELSBANKEN | ANNUAL REPORT 2019 39
FINANCIAL PERFORMANCE
Operating profit increased by 3 per cent to SEK
2,015 million (1,954). Income grew by 8 per cent
to SEK 5,760 million (5,333). Total expenses
rose by 11 per cent to SEK -3,754 million
(-3,389).
Net fee and commission income increased by
4 per cent to SEK 4,122 million (3,968), which
was due to rising mutual fund volumes and
an increase in advisory and insurance-related
commissions.
Net gains/losses on financial transactions
rose to SEK 1,044 million (802), although the
increase is explained by a change in the principle
for profit allocation, and is offset on the expense
side by higher distribution remuneration.
Staff costs were largely unchanged at SEK
-1,795 million (-1,791). Profit during the second
quarter was negatively affected by one-off
expenses of SEK 21 million in connection with
the closure of the branches in Estonia, Latvia
and Lithuania. Adjusted for this and for foreign
exchange effects, staff costs decreased by
3 per cent. The average number of employees
decreased by 8 per cent to 990 (1,076).
Other expenses fell by 11 per cent to SEK
-696 million (-781). Internal purchased and sold
services increased by SEK 389 million to SEK
-1,178 million (-789), mainly due to higher distri-
bution remuneration to the branch operations.
Credit losses consisted of net reversals, and
totalled SEK 9 million (10). The credit loss ratio
was -0.02 per cent (-0.02).
BUSINESS DEVELOPMENT
Markets
Handelsbanken Markets offers products and
services linked to risk management, securities,
derivatives, research, debt capital markets and
corporate finance.
Markets is currently carrying out extensive
change work to provide a foundation for the
development and extension of the investment
banking business, with the aim of creating more
value centred on the Bank’s core customer
base.
Markets’ offering to the Bank’s core custom-
ers is being developed in close co-operation
with the branch operations. The branches’ local
presence and decision-making power will be
combined even more distinctly with Markets’
strong specialist support. The offering should be
perceived as straightforward and relevant, and
should be aligned with the Bank’s ambitions to
advance development within the field of sustain-
ability.
Through a more focused approach to this
work, and by offering long-term, trusted advice,
the goal is to have the most satisfied customers
in the customer segments that the Bank has
decided to focus on.
Foreign exchange business developed at a
slightly weaker rate than the previous year, while
fixed income business was slightly stronger.
Corporate Finance continued to perform well
and, according to the market research company
Mergermarket, the Bank was the second largest
Nordic player as regards mergers and acquisi-
tions of Swedish companies in 2019. The
Bank’s business volumes in terms of capital
market funding also showed a strong perfor-
mance, with an arranged volume of EUR 12.1
billion spread over 115 bond issues. The Bank
has seen that interest in sustainable funding
remains high. The Bank has provided extensive
sustainable funding throughout the year, in the
form of both loans and bonds, within forestry,
property and wind power.
Asset management
Asset Management offers a full range of prod-
ucts and services linked to asset management,
as well as co-ordinating the Bank’s offering in
the savings area.
Asset management operations continued to
show a strong performance and net savings in
Handelsbanken’s mutual funds in Sweden dur-
ing 2019 amounted to SEK 27.3 billion (13.0),
meaning that the Bank was the largest player
with a market share of 21 per cent of the net
flow. Over the last ten years, the Bank has had
the largest share of net savings during eight of
those years and the second largest during the
other two.
Total net savings in the Group’s funds
amounted to SEK 28.3 billion (21.2). The total
fund volume, including exchange-traded funds,
increased during the year by 27 per cent to SEK
639 billion (503). Both the fund volume in Swe-
den and the aggregated fund volume in the
other Nordic markets are the highest ever. Total
assets under management in the Group rose
during the year by 24 per cent to SEK 767 billion
(619), also to the highest volume ever.
The market research company Kantar Sifo
Prospera ranked Handelsbanken as the number
one “External Asset Manager” in Sweden in
its 2019 survey. Morningstar, a mutual fund
research company, also ranked Handelsbanken
Fonder highest of the Nordic banks when it
evaluated the 30 largest fund managers on the
Swedish market
During the year, work on introducing
enhanced sustainability requirements to the
Bank’s funds has continued, as a result of which
the majority of the Bank’s mutual funds are now
managed according to these requirements. At
year-end 2018, 44 per cent of the total mutual
fund volume was managed according to the
enhanced sustainability requirements. During
the year, this proportion grew further, to the
extent that 90 per cent of the total mutual fund
volume was managed according to the
enhanced sustainability requirements. Morning-
star also ranked the Bank as Europe’s fifth
largest manager of sustainability-focused funds
in 2019.
Pension & Life
Pension & Life comprises the Handelsbanken
Liv subsidiary and offers pension solutions and
other insurance solutions for private and corpo-
rate customers.
The Pension & Life business area performed
well and the total premium volume increased by
12 per cent compared to the previous year.
Occupational pensions performed well and the
total premium flows increased by SEK 336 mil-
lion, or 11 per cent, compared to the previous
year. The number of customers transferring their
pension capital to Handelsbanken Liv continues
to rise, and net transferred capital increased by
61 per cent during the year. Assets under man-
agement at Handelsbanken Liv increased by 27
per cent during the year to SEK 176 billion (139),
the highest volume ever.
International
Handelsbanken International encompasses the
Bank’s branches and representative offices out-
side the Bank’s home markets, as well as the
units for Financial Institutions (global banking
collaborations) and Transaction Banking.
As previously announced, International will be
concentrating its operations to the branches in
Luxembourg and New York. The Luxembourg
branch will also be the base for the business
operations in France and Spain. Increased regu-
latory requirements and investment needs,
combined with changes to customer behaviour
– with customers centralising their administra-
tion and decision-making to fewer units, such
as Treasury Centres – have resulted in the Bank
making the decision to gradually wind down its
operations in Asia. The Bank also intends to
gradually discontinue its operations in Germany.
As previously announced, the Bank decided
during the second quarter to close its branches
in Tallinn, Riga, Vilnius and Warsaw.
The average volume of deposits in Handels-
banken International increased by 4 per cent
during the year, to SEK 62.8 billion (60.1). Lend-
ing decreased by 7 per cent to SEK 29.6 billion
(31.7).
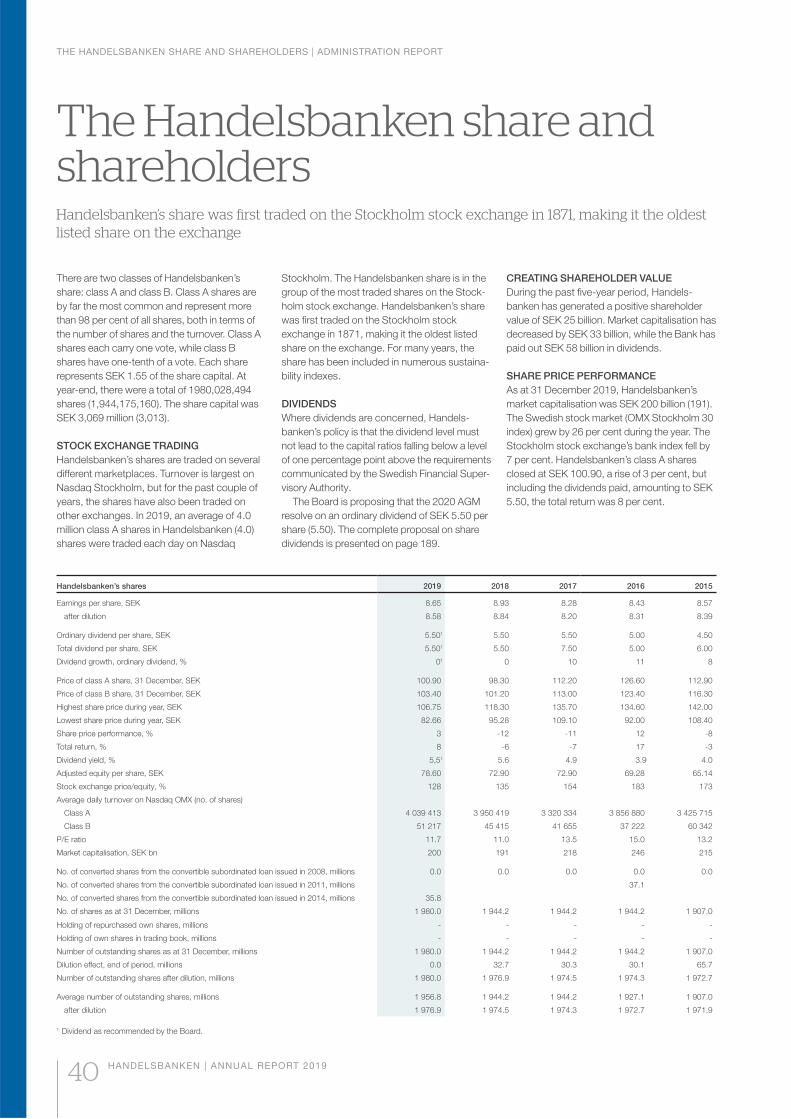
THE HANDELSBANKEN SHARE AND SHAREHOLDERS | ADMINISTRATION REPORT
40 HANDELSBANKEN | ANNUAL REPORT 2019
The Handelsbanken share and shareholders
Handelsbanken’s shares 2019 2018 2017 2016 2015
Earnings per share, SEK 8.65 8.93 8.28 8.43 8.57
after dilution 8.58 8.84 8.20 8.31 8.39
Ordinary dividend per share, SEK 5.501 5.50 5.50 5.00 4.50
Total dividend per share, SEK 5.501 5.50 7.50 5.00 6.00
Dividend growth, ordinary dividend, % 01 0 10 11 8
Price of class A share, 31 December, SEK 100.90 98.30 112.20 126.60 112.90
Price of class B share, 31 December, SEK 103.40 101.20 113.00 123.40 116.30
Highest share price during year, SEK 106.75 118.30 135.70 134.60 142.00
Lowest share price during year, SEK 82.66 95.28 109.10 92.00 108.40
Share price performance, % 3 -12 -11 12 -8
Total return, % 8 -6 -7 17 -3
Dividend yield, % 5,51 5.6 4.9 3.9 4.0
Adjusted equity per share, SEK 78.60 72.90 72.90 69.28 65.14
Stock exchange price/equity, % 128 135 154 183 173
Average daily turnover on Nasdaq OMX (no. of shares)
Class A 4 039 413 3 950 419 3 320 334 3 856 880 3 425 715
Class B 51 217 45 415 41 655 37 222 60 342
P/E ratio 11.7 11.0 13.5 15.0 13.2
Market capitalisation, SEK bn 200 191 218 246 215
No. of converted shares from the convertible subordinated loan issued in 2008, millions 0.0 0.0 0.0 0.0 0.0
No. of converted shares from the convertible subordinated loan issued in 2011, millions 37.1
No. of converted shares from the convertible subordinated loan issued in 2014, millions 35.8
No. of shares as at 31 December, millions 1 980.0 1 944.2 1 944.2 1 944.2 1 907.0
Holding of repurchased own shares, millions - - - - -
Holding of own shares in trading book, millions - - - - -
Number of outstanding shares as at 31 December, millions 1 980.0 1 944.2 1 944.2 1 944.2 1 907.0
Dilution effect, end of period, millions 0.0 32.7 30.3 30.1 65.7
Number of outstanding shares after dilution, millions 1 980.0 1 976.9 1 974.5 1 974.3 1 972.7
Average number of outstanding shares, millions 1 956.8 1 944.2 1 944.2 1 927.1 1 907.0
after dilution 1 976.9 1 974.5 1 974.3 1 972.7 1 971.9
1 Dividend as recommended by the Board.
There are two classes of Handelsbanken’s
share: class A and class B. Class A shares are
by far the most common and represent more
than 98 per cent of all shares, both in terms of
the number of shares and the turnover. Class A
shares each carry one vote, while class B
shares have one-tenth of a vote. Each share
represents SEK 1.55 of the share capital. At
year-end, there were a total of 1980,028,494
shares (1,944,175,160). The share capital was
SEK 3,069 million (3,013).
STOCK EXCHANGE TRADING
Handelsbanken’s shares are traded on several
different marketplaces. Turnover is largest on
Nasdaq Stockholm, but for the past couple of
years, the shares have also been traded on
other exchanges. In 2019, an average of 4.0
million class A shares in Handelsbanken (4.0)
shares were traded each day on Nasdaq
Handelsbanken’s share was first traded on the Stockholm stock exchange in 1871, making it the oldest listed share on the exchange
Stockholm. The Handelsbanken share is in the
group of the most traded shares on the Stock-
holm stock exchange. Handelsbanken’s share
was first traded on the Stockholm stock
exchange in 1871, making it the oldest listed
share on the exchange. For many years, the
share has been included in numerous sustaina-
bility indexes.
DIVIDENDS
Where dividends are concerned, Handels-
banken’s policy is that the dividend level must
not lead to the capital ratios falling below a level
of one percentage point above the requirements
communicated by the Swedish Financial Super-
visory Authority.
The Board is proposing that the 2020 AGM
resolve on an ordinary dividend of SEK 5.50 per
share (5.50). The complete proposal on share
dividends is presented on page 189.
CREATING SHAREHOLDER VALUE
During the past five-year period, Handels-
banken has generated a positive shareholder
value of SEK 25 billion. Market capitalisation has
decreased by SEK 33 billion, while the Bank has
paid out SEK 58 billion in dividends.
SHARE PRICE PERFORMANCE
As at 31 December 2019, Handelsbanken’s
market capitalisation was SEK 200 billion (191).
The Swedish stock market (OMX Stockholm 30
index) grew by 26 per cent during the year. The
Stockholm stock exchange’s bank index fell by
7 per cent. Handelsbanken’s class A shares
closed at SEK 100.90, a rise of 3 per cent, but
including the dividends paid, amounting to SEK
5.50, the total return was 8 per cent.
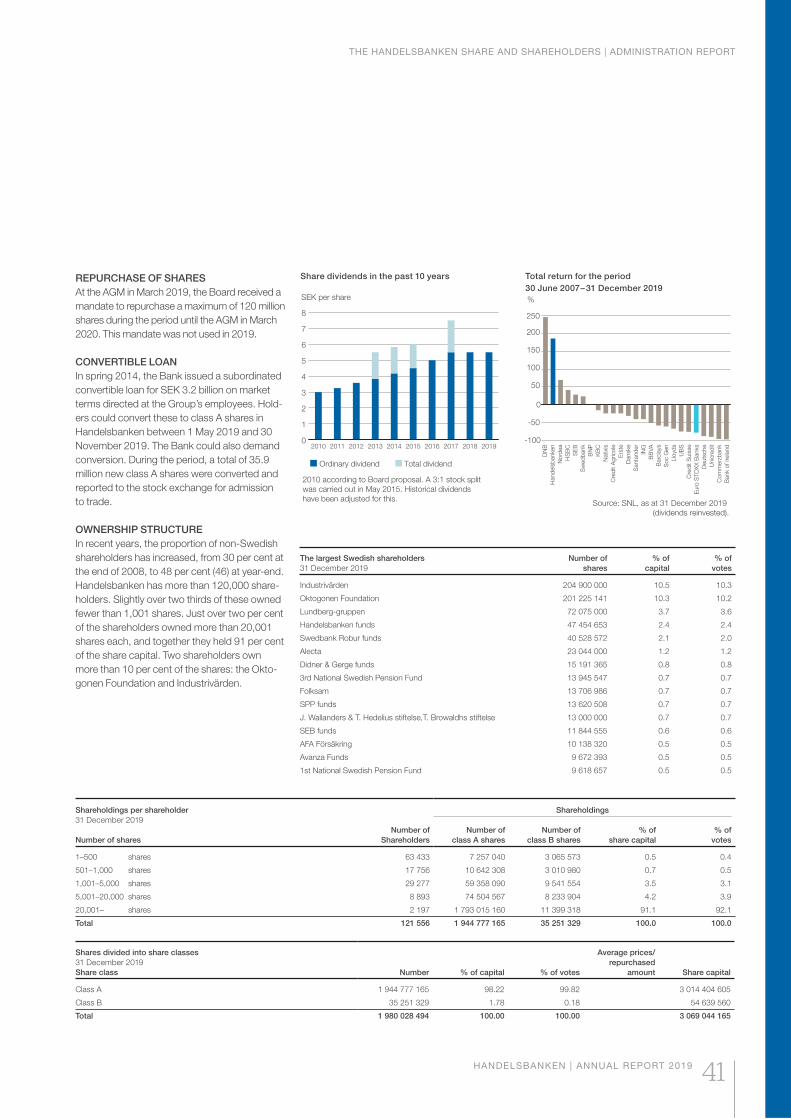
THE HANDELSBANKEN SHARE AND SHAREHOLDERS | ADMINISTRATION REPORT
HANDELSBANKEN | ANNUAL REPORT 2019 41
REPURCHASE OF SHARES
At the AGM in March 2019, the Board received a
mandate to repurchase a maximum of 120 million
shares during the period until the AGM in March
2020. This mandate was not used in 2019.
CONVERTIBLE LOAN
In spring 2014, the Bank issued a subordinated
convertible loan for SEK 3.2 billion on market
terms directed at the Group’s employees. Hold-
ers could convert these to class A shares in
Handelsbanken between 1 May 2019 and 30
November 2019. The Bank could also demand
conversion. During the period, a total of 35.9
million new class A shares were converted and
reported to the stock exchange for admission
to trade.
OWNERSHIP STRUCTURE
In recent years, the proportion of non-Swedish
shareholders has increased, from 30 per cent at
the end of 2008, to 48 per cent (46) at year-end.
Handelsbanken has more than 120,000 share-
holders. Slightly over two thirds of these owned
fewer than 1,001 shares. Just over two per cent
of the shareholders owned more than 20,001
shares each, and together they held 91 per cent
of the share capital. Two shareholders own
more than 10 per cent of the shares: the Okto-
gonen Foundation and Industrivärden.
Share dividends in the past 10 years
0
1
2
3
4
5
6
7
8
2019201820172016201520142013201220112010
SEK per share
Total dividend Ordinary dividend
2010 according to Board proposal. A 3:1 stock split
was carried out in May 2015. Historical dividends
have been adjusted for this.
The largest Swedish shareholders
31 December 2019
Number of
shares
% of
capital
% of
votes
Industrivärden 204 900 000 10.5 10.3
Oktogonen Foundation 201 225 141 10.3 10.2
Lundberg-gruppen 72 075 000 3.7 3.6
Handelsbanken funds 47 454 653 2.4 2.4
Swedbank Robur funds 40 528 572 2.1 2.0
Alecta 23 044 000 1.2 1.2
Didner & Gerge funds 15 191 365 0.8 0.8
3rd National Swedish Pension Fund 13 945 547 0.7 0.7
Folksam 13 706 986 0.7 0.7
SPP funds 13 620 508 0.7 0.7
J. Wallanders & T. Hedelius stiftelse,T. Browaldhs stiftelse 13 000 000 0.7 0.7
SEB funds 11 844 555 0.6 0.6
AFA Försäkring 10 138 320 0.5 0.5
Avanza Funds 9 672 393 0.5 0.5
1st National Swedish Pension Fund 9 618 657 0.5 0.5
-100
-50
0
50
100
150
200
250
DN
B
Hand
els
banken
No
rdea
HS
BC
SE
B
Sw
ed
bank
BN
P
KB
C
Natixis
Cre
dit A
grico
le
Ers
te
Danske
Santa
nd
er
ING
BB
VA
Barc
lays
So
c G
en
Llo
yds
UB
S
Cre
dit S
uis
se
Euro
ST
OX
X B
anks
Deuts
che
Unic
red
it
Co
mm
erz
bank
Bank o
f Irela
nd
%
Source: SNL, as at 31 December 2019
(dividends reinvested).
Total return for the period
30 June 2007 – 31 December 2019
Shares divided into share classes
31 December 2019
Share class Number % of capital % of votes
Average prices/
repurchased
amount Share capital
Class A 1 944 777 165 98.22 99.82 3 014 404 605
Class B 35 251 329 1.78 0.18 54 639 560
Total 1 980 028 494 100.00 100.00 3 069 044 165
Shareholdings per shareholder
31 December 2019
Number of shares
Number of
Shareholders
Shareholdings
Number of
class A shares
Number of
class B shares
% of
share capital
% of
votes
1–500 shares 63 433 7 257 040 3 065 573 0.5 0.4
501–1,000 shares 17 756 10 642 308 3 010 980 0.7 0.5
1,001–5,000 shares 29 277 59 358 090 9 541 554 3.5 3.1
5,001–20,000 shares 8 893 74 504 567 8 233 904 4.2 3.9
20,001– shares 2 197 1 793 015 160 11 399 318 91.1 92.1
Total 121 556 1 944 777 165 35 251 329 100.0 100.0

This is Handelsbanken’s statutory sustainability report for 2019. This report provides informa-tion about the entire Group, unless otherwise stated, and any restrictions in the reporting are clearly stated. The statutory sustainability report focuses on Handelsbanken’s most material sustainability topics and the sustainability information stipulated in the Swedish Annual Accounts Act.
CONTENTS
SUSTAINABILITY AT HANDELSBANKEN 44
A SUSTAINABLE BUSINESS MODEL 44
IN-DEPTH SUSTAINABILITY INFORMATION 45
SUMMARY OF CORPORATE GOVERNANCE 45
Principles for corporate governance at Handelsbanken 45
Recruitment and diversity-related work by the Board 45
Internal control 45
ORGANISATIONAL STRUCTURE FOR SUSTAINABILITY 46
HANDELSBANKEN AND THE SUSTAINABLE DEVELOPMENT GOALS 46
STAKEHOLDER DIALOGUE 46
Our stakeholders 46
Materiality analysis 47
SUSTAINABILITY RISK 48
KEY FIGURES FOR SUSTAINABILITY 49
FACTS: THE BANK AND ITS CUSTOMERS 51
Customer satisfaction 51
Integrity and confidentiality – Informa-tion security and IT security 51
FACTS: THE BANK’S ROLE IN THE COMMUNITY 51
Financial aspects 51
Modern slavery and human trafficking 52
Economic research and education 53
Direct environmental and climate impact 53
Services for the public good 54
FACTS: RESPONSIBLE FINANCING 54
Business relationships 54
Exposure to climate-related risks 55
FACTS: RESPONSIBLE INVESTMENT 55
Investment processes 55
Climate-related financial disclosures 57
FACTS: THE BANK AS AN EMPLOYER 57
Staff turnover 57
Constant development 57
Health and work environment 57
Sickness absence 57
Gender equality 57
Remuneration and benefits 58
Relationships with unions 60
FACTS: THE BANK’S BUSINESS CULTURE 60
Compliance and confirmed incidents 60
Policy for ethical standards 60
Guidelines for managing taxes 60
Policy for sustainability 60
Work to prevent financial crime 60
Conflicts of interest, corruption, bribery and improper influence 60
Suppliers 61
Principles when granting credit 61
FACTS: THE BANK AS AN INVESTMENT 61
Public limited company 61
Dividend 61
Creating shareholder value 61
TCFD – Task Force on Climate-related Financial Disclosures 61
Sustainability report
43
A SUSTAINABLE BUSINESS MODEL
Sustainability is completely integrated into
Handelsbanken’s corporate culture and working
methods, permeating the Group’s operations in
all markets. As a bank, we aim to contribute to
sustainable development, chiefly through our
business operations, and our products and
services.
How we contribute
Long-term business relationships, low risk-taking
and cost-awareness are cornerstones of Handels-
banken’s business culture. Consequently,
sustainability has long been a natural part of
Handels banken’s business operations. Stable
finances are fundamental to the Bank’s sustain-
ability efforts. Thanks to our strict approach to
risk, over time we have successfully kept our
credit losses at a low level. Our financial strength
helps us to avoid becoming a burden on society
when times get tough. Instead, we can positively
contribute by being financially stable and a
responsible taxpayer. Handelsbanken’s greatest
opportunities to assist and influence sustainable
development are in our business operations –
when we finance our customers’ projects and
businesses and are entrusted to manage cus-
tomers’ assets.
A decentralised working method
We always want to be close to the community
where we operate, so we believe in a decentral-
ised business model where the local branch is the
hub of the customer relationship, based on per-
sonal meetings coupled with digital services and
solutions. Our role as a responsible employer is
based on our fundamental belief in the willingness
and ability of individuals to make the right deci-
sions. Managers and employees are together
responsible for seeing the opportunities in one
another’s differences and treating each other
with respect. Gender equality, diversity and an
inclusive corporate culture are therefore part of
Handelsbanken’s core values.
GRI reporting
A more detailed report of the Bank’s sustainability
work and associated results is provided in Handels-
banken’s separate Sustainability Report, which is
prepared according to the Core level of the GRI
Standards and which represents the Group’s
Communication on Progress for the UN-Global
Compact. The complete Sustainability Report is
available at handelsbanken.com/ sustainability.
Sustainability at HandelsbankenThe Bank’s business opportunities and successes depend on customers, employees, the general public, investors and public authorities having confidence in the Bank. A condition for this confidence is that the Bank’s operations are subject to high ethical standards and responsible actions.
SUSTAINABILITY REPORT | ADMINISTRATION REPORT
44 HANDELSBANKEN | ANNUAL REPORT 201944

SUMMARY OF CORPORATE
GOVERNANCE
Corporate governance concerns how the owners
directly or indirectly control the Bank, and how
rights and obligations are allocated among the
Bank’s bodies, in accordance with prevailing laws
and regulations.
Handelsbanken’s Corporate Governance
Report is based on a shareholder perspective.
However, there are other stakeholders interested
in Handelsbanken’s corporate governance upon
whose trust the Bank depends. These include
customers, employees, the Bank’s lenders as
well as the community at large.
PRINCIPLES FOR CORPORATE
GOVERNANCE AT HANDELSBANKEN
Handelsbanken’s shareholders elect the Board,
and the Board appoints the Group Chief Execu-
tive (CEO). One way in which the Board exercises
its governance of the Bank is by issuing policies
and instructions. It is partly through the issued
policies that the Board takes decisions regarding
Handelsbanken’s overall risk tolerance and
ensures the Bank’s financial stability. Through the
policies, the Board also decides on the Bank’s
approach in several essential sustainability issues
relating to prevention of financial crime, the envi-
ronment, remuneration, ethical standards and
corruption. The CEO also exercises governance
by issuing various policy documents. The CEO
issues guidelines, some of which provide more
detailed directions to complement and clarify the
Board’s policies, and also issues instructions to
the managers who report directly to her. These
policy documents are revised every year but can
be adjusted more often when necessary.
However, the foundation of functioning corpo-
rate governance is not only formal documents but
also the Bank’s corporate culture, corporate goal,
working methods and remuneration system.
These are integral with the principles, strategies,
limits and targets described in policy documents
and instructions.
RECRUITMENT AND DIVERSITY-RELATED
WORK BY THE BOARD
Handelsbanken’s Board has adopted a policy
to promote diversity on the Board. The policy
stipulates that, to promote independent opinions
and critical questioning, it is desirable that the
Board should be characterised by sufficient
diversity in terms of age, gender, geographical
origin, and educational and professional back-
ground. The proportion of women on the Board
of the Bank is 45 per cent, and the proportion of
members of a nationality other than the country
where Handelsbanken is domiciled is 36 per cent.
Composition of the Board after election at the AGM
2019 2018 2017 2016 2015
Total number of
Board members 11 11 11 11 10
of which men 6 7 6 6 7
of which women 5 4 5 5 3
Nationality other than
Swedish 4 4 4 5 5
INTERNAL CONTROL
All managers at all levels in the Bank have a
responsibility for internal control and the Bank’s
regulatory compliance. Consequently, fit-for-
purpose instructions and procedures for the
operation must be in place, and compliance
with the procedures is monitored regularly.
Group Compliance is an independent unit with
functional responsibility for compliance in the Group
and provides advice and support in regulatory
matters. Internal control and compliance work
are subject to internal and external risk-based
auditing.
Handelsbanken has an established whistle-
blowing system provided by an external supplier.
This means that an employee who suspects
internal fraud or other irregularities can report
these to a body outside the employee’s own unit.
Anonymous reports are also acted upon.
Selection of policy documents established by
the Board:
• Credit policy
• Policy for operational risk
• Capital policy
• Financial policy
• Information policy
• Policy for sustainability
• Policy for ethical standards
• Policy against corruption
• Policy for management of conflicts of interest
• Policy for remuneration
• Policy for suitability assessment
• Policy for risk control
• Policy for compliance
• Policy on measures against financial crime
• Policy for complaints management.
A summary of these policies can be found in
the Bank’s Corporate Governance Report and
at handelsbanken.com.
Selection of guidelines established by the
Bank’s Group Chief Executive:
• Guidelines regarding the environment and
climate change
• Guidelines regarding human rights and
working conditions
• Guidelines regarding business relations with
the armaments and defence industry
• Guidelines regarding business relations in
forestry and farming
• Guidelines regarding the tobacco industry
• Guidelines for managing taxes.
A selection of policy documents that the
boards of Handelsbanken’s subsidiaries
have decided on:
• Policy for shareholder engagement and
responsible investment at Handelsbanken
Fonder
• Policy for shareholder engagement and
responsible investment at Xact Kapital-
förvaltning
• Policy for responsible investment at
Handelsbanken Liv
• Policy for sustainability at Handelsbanken Liv
• Policy for sustainability at Stadshypotek
• Policy against corruption at Stadshypotek.
Selection of guidelines in the HR area:
• Guidelines on alcohol, drugs and gambling
• Guidelines for the prevention of victimisation
and harassment
• Guidelines on bribery and improper influence
• Guidelines on gender equality, diversity and
inclusion.
In-depth sustainability informationSustainability is well integrated in Handelsbanken’s working methods, and there are several central bodies that co-ordinate the work at Group level and in the subsidiaries. Various processes, such as the ongoing stakeholder dialogues, also exist to support our work with sustainability. This part of the report, which deals with sustainability management, provides more detailed information.
More informationMore information about Handels-
banken’s corporate governance is
also available at handelsbanken.com. The site
includes the following information:
• previous corporate governance reports
from 2006 onwards
• Articles of Association
• information about the nomination committee
• minutes from shareholders’ meetings from
2008 onwards.
SUSTAINABILITY REPORT | ADMINISTRATION REPORT
HANDELSBANKEN | ANNUAL REPORT 2019 45
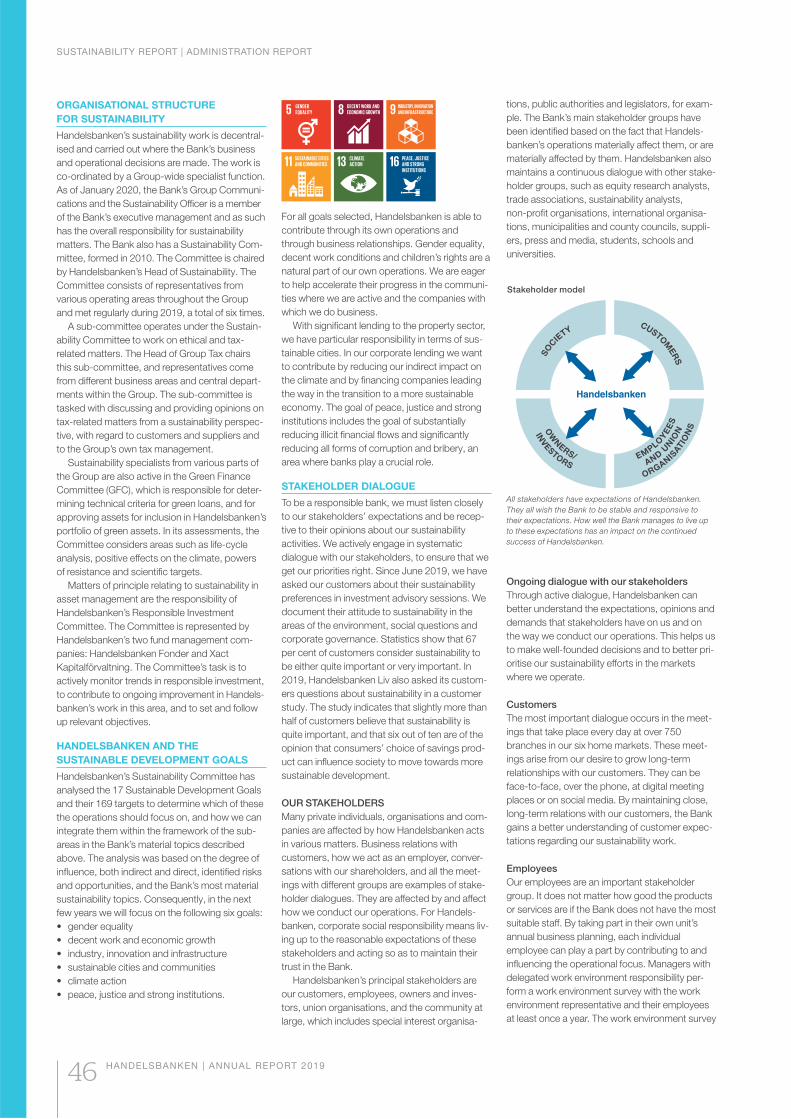
ORGANISATIONAL STRUCTURE
FOR SUSTAINABILITY
Handelsbanken’s sustainability work is decentral-
ised and carried out where the Bank’s business
and operational decisions are made. The work is
co-ordinated by a Group-wide specialist function.
As of January 2020, the Bank’s Group Communi-
cations and the Sustainability Officer is a member
of the Bank’s executive management and as such
has the overall responsibility for sustainability
matters. The Bank also has a Sustainability Com-
mittee, formed in 2010. The Committee is chaired
by Handelsbanken’s Head of Sustainability. The
Committee consists of representatives from
various operating areas throughout the Group
and met regularly during 2019, a total of six times.
A sub-committee operates under the Sustain-
ability Committee to work on ethical and tax-
related matters. The Head of Group Tax chairs
this sub-committee, and representatives come
from different business areas and central depart-
ments within the Group. The sub-committee is
tasked with discussing and providing opinions on
tax-related matters from a sustainability perspec-
tive, with regard to customers and suppliers and
to the Group’s own tax management.
Sustainability specialists from various parts of
the Group are also active in the Green Finance
Committee (GFC), which is responsible for deter-
mining technical criteria for green loans, and for
approving assets for inclusion in Handelsbanken’s
portfolio of green assets. In its assessments, the
Committee considers areas such as life-cycle
analysis, positive effects on the climate, powers
of resistance and scientific targets.
Matters of principle relating to sustainability in
asset management are the responsibility of
Handels banken’s Responsible Investment
Committee. The Committee is represented by
Handelsbanken’s two fund management com-
panies: Handelsbanken Fonder and Xact
Kapitalförvaltning. The Committee’s task is to
actively monitor trends in responsible investment,
to contribute to ongoing improvement in Handels-
banken’s work in this area, and to set and follow
up relevant objectives.
HANDELSBANKEN AND THE
SUSTAINABLE DEVELOPMENT GOALS
Handelsbanken’s Sustainability Committee has
analysed the 17 Sustainable Development Goals
and their 169 targets to determine which of these
the operations should focus on, and how we can
integrate them within the framework of the sub-
areas in the Bank’s material topics described
above. The analysis was based on the degree of
influence, both indirect and direct, identified risks
and opportunities, and the Bank’s most material
sustainability topics. Consequently, in the next
few years we will focus on the following six goals:
• gender equality
• decent work and economic growth
• industry, innovation and infrastructure
• sustainable cities and communities
• climate action
• peace, justice and strong institutions.
For all goals selected, Handelsbanken is able to
contribute through its own operations and
through business relationships. Gender equality,
decent work conditions and children’s rights are a
natural part of our own operations. We are eager
to help accelerate their progress in the communi-
ties where we are active and the companies with
which we do business.
With significant lending to the property sector,
we have particular responsibility in terms of sus-
tainable cities. In our corporate lending we want
to contribute by reducing our indirect impact on
the climate and by financing companies leading
the way in the transition to a more sustainable
economy. The goal of peace, justice and strong
institutions includes the goal of substantially
reducing illicit financial flows and significantly
reducing all forms of corruption and bribery, an
area where banks play a crucial role.
STAKEHOLDER DIALOGUE
To be a responsible bank, we must listen closely
to our stakeholders’ expectations and be recep-
tive to their opinions about our sustainability
activities. We actively engage in systematic
dialogue with our stakeholders, to ensure that we
get our priorities right. Since June 2019, we have
asked our customers about their sustainability
preferences in investment advisory sessions. We
document their attitude to sustainability in the
areas of the environment, social questions and
corporate governance. Statistics show that 67
per cent of customers consider sustainability to
be either quite important or very important. In
2019, Handelsbanken Liv also asked its custom-
ers questions about sustainability in a customer
study. The study indicates that slightly more than
half of customers believe that sustainability is
quite important, and that six out of ten are of the
opinion that consumers’ choice of savings prod-
uct can influence society to move towards more
sustainable development.
OUR STAKEHOLDERS
Many private individuals, organisations and com-
panies are affected by how Handelsbanken acts
in various matters. Business relations with
customers, how we act as an employer, conver-
sations with our shareholders, and all the meet-
ings with different groups are examples of stake-
holder dialogues. They are affected by and affect
how we conduct our operations. For Handels-
banken, corporate social responsibility means liv-
ing up to the reasonable expectations of these
stakeholders and acting so as to maintain their
trust in the Bank.
Handelsbanken’s principal stakeholders are
our customers, employees, owners and inves-
tors, union organisations, and the community at
large, which includes special interest organisa-
tions, public authorities and legislators, for exam-
ple. The Bank’s main stakeholder groups have
been identified based on the fact that Handels-
banken’s operations materially affect them, or are
materially affected by them. Handelsbanken also
maintains a continuous dialogue with other stake-
holder groups, such as equity research analysts,
trade associations, sustainability analysts,
non-profit organisations, international organisa-
tions, municipalities and county councils, suppli-
ers, press and media, students, schools and
universities.
Ongoing dialogue with our stakeholders
Through active dialogue, Handelsbanken can
better understand the expectations, opinions and
demands that stakeholders have on us and on
the way we conduct our operations. This helps us
to make well-founded decisions and to better pri-
oritise our sustainability efforts in the markets
where we operate.
Customers
The most important dialogue occurs in the meet-
ings that take place every day at over 750
branches in our six home markets. These meet-
ings arise from our desire to grow long-term
relationships with our customers. They can be
face-to-face, over the phone, at digital meeting
places or on social media. By maintaining close,
long-term relations with our customers, the Bank
gains a better understanding of customer expec-
tations regarding our sustainability work.
Employees
Our employees are an important stakeholder
group. It does not matter how good the products
or services are if the Bank does not have the most
suitable staff. By taking part in their own unit’s
annual business planning, each individual
employee can play a part by contributing to and
influencing the operational focus. Managers with
delegated work environment responsibility per-
form a work environment survey with the work
environment representative and their employees
at least once a year. The work environment survey
SO
C
IETY
CUSTOM
ER
S
AND U
NIO
N
ORGANIS
ATIO
NS
EMPLO
YE
ES
INVESTO
RS
OW
N
ERS/
All stakeholders have expectations of Handelsbanken.
They all wish the Bank to be stable and responsive to
their expectations. How well the Bank manages to live up
to these expectations has an impact on the continued
success of Handelsbanken.
Stakeholder model
SUSTAINABILITY REPORT | ADMINISTRATION REPORT
46 HANDELSBANKEN | ANNUAL REPORT 2019

is one initiative undertaken to reach the Bank’s
work environment goals. The results of the work
environment survey also serve as supporting
documentation for the local work environment
plan, which makes up part of the business plan.
Owners and investors
Handelsbanken’s shareholders are those who
ultimately decide about the Bank’s governance.
The shareholders exercise their right to decide on
matters concerning the company at shareholders’
meetings. At the meetings, individual shareholders
have the opportunity to put questions to the Bank’s
Board and executive management. Shareholders
show keen interest in Handelsbanken’s annual
general meetings. In the past five years, share-
holders corresponding to more than 50 per cent
of the votes have been represented. The Bank
provides investors, analysts, rating agencies and
other capital market players with information
regarding Handelsbanken’s operations and finan-
cial performance. During the year, the CEO, CFO
and Investor Relations department held more
than 500 meetings with equity and fixed income
investors.
Union organisations
For a long time, Handelsbanken has had good
relations with the union organisations, this being
an important part of the Bank’s business culture.
Union representatives and managers maintain a
continuous dialogue about operations – such as
when changes are to be made – exchanging valu-
able information at the very early stages.
Society
Handelsbanken has a continuous dialogue with
supervisory authorities, central banks and regula-
tory bodies as well as with governments and
parliaments, in Sweden, the EU and the rest of
the world. Increasingly, dialogue between public
authorities and the Bank highlights sustainability.
The Bank also has continuous contact with non-
governmental organisations (NGOs). During the
year, we had several ongoing dialogues with
them, answered questions and participated in
discussions and seminars to keep ourselves
updated in the field of sustainability, and to gather
important opinions.
Sustainability analysts
Around 30 investment banks have research ana-
lysts who regularly monitor Handelsbanken and
its share. In recent years, several of these invest-
ment banks have supplemented the traditional
company research by also evaluating the Bank
from a sustainability perspective. Another
increasingly prominent group are the independent
research firms that specialise in sustainability
analysis. Their research analysts evaluate the
Bank’s sustainability work in several dimensions.
An evaluation is usually carried out by means of a
comprehensive questionnaire, as well as a dia-
logue with the analyst. In 2019, Handelsbanken
responded to some 10 enquiries, surveys and
analyses from various international actors.
Suppliers
Handelsbanken purchases goods and services
from many different suppliers. In the Swedish
operations, 71 per cent of the total volume of
purchases come from more than 130 of the
Bank’s several thousand suppliers. Based on the
Bank’s Supplier Code of Conduct, we conduct an
ongoing dialogue with our key suppliers in which
sustainability figures prominently. As a result
of these dialogues, we become involved, our
employees are inspired, and we improve our own
– as well as our suppliers’ – sustainability work.
MATERIALITY ANALYSIS
The purpose of our materiality analysis is to
identify the sustainability topics where Handels-
banken’s operations have the greatest impact on
external parties, based on an economic, environ-
mental or social stakeholder perspective.
Applying the materiality analysis, we define the
most important sustainability topics that we must
prioritise, report on and communicate about.
In 2018, Handelsbanken carried out a compre-
hensive materiality analysis based on detailed
dialogue with participants from our main stake-
holder groups in the Bank’s home markets. This
materiality analysis is also deemed to be of
relevance for 2019.
Work on the materiality analysis progressed in
three stages:
1. Using a business intelligence analysis, we iden-
tified and ranked the sustainability topics where
Handelsbanken’s operations have the greatest
impact on external parties based on an eco-
nomic, environmental or social stakeholder
perspective.
2. These topics were verified by internal and
external sustainability experts and Handels-
banken’s Sustainability Committee.
3. We carried out a detailed dialogue with stake-
holders through qualitative and quantitative
interaction. In conjunction with this, we
conducted 14 in-depth interviews with repre-
sentatives from our owners, unions, special
interest organisations and large corporate
customers. The quantitative part consisted of
target group-specific surveys aimed at employ-
ees, private customers and corporate
customers in our home markets, where the
stakeholders could assess how important each
sustainability topic was for them in conjunction
with decisions and assessments linked to the
Bank’s operations. Almost 1,000 responses
were received. The large number of responses
made it possible to follow up the results by
stakeholder group and home market.
The identified material sustainability topics were
grouped into the following seven areas:
• the Bank and its customers
• the Bank’s role in the community
• responsible financing
• responsible investment
• the Bank as an employer
• the Bank’s business culture
• the Bank as an investment.
The results of the materiality analysis showed
that the Bank’s most important sustainability
topics are clearly linked to our business in the
form of credits, investments, products and
advisory services. Other key sustainability topics
are strongly associated with how we should
continue to run our business in a sustainable
and responsible manner with our customers’
continuing firm confidence. This means that we
continue to work on integrity and confidentiality,
to prevent financial crime, to strive for openness
and transparency and for the Bank to be financially
sustainable by continuing to run our business in a
responsible manner, with stability and profitability
in focus.
The outcome of the materiality analysis is
presented on pages 10–11 of the Sustainability
Report. These pages also include a description of
the significance of these topics to Handelsbanken
and the risks they are associated with.
Attendance at AGMs 2014–2019
Number
No. of shareholders
present/represented
0
400
800
1,200
1,600
2,000
201920182017201620152014
%
0
20
40
60
80
100
Proportion of votes
SUSTAINABILITY REPORT | ADMINISTRATION REPORT
HANDELSBANKEN | ANNUAL REPORT 2019 47
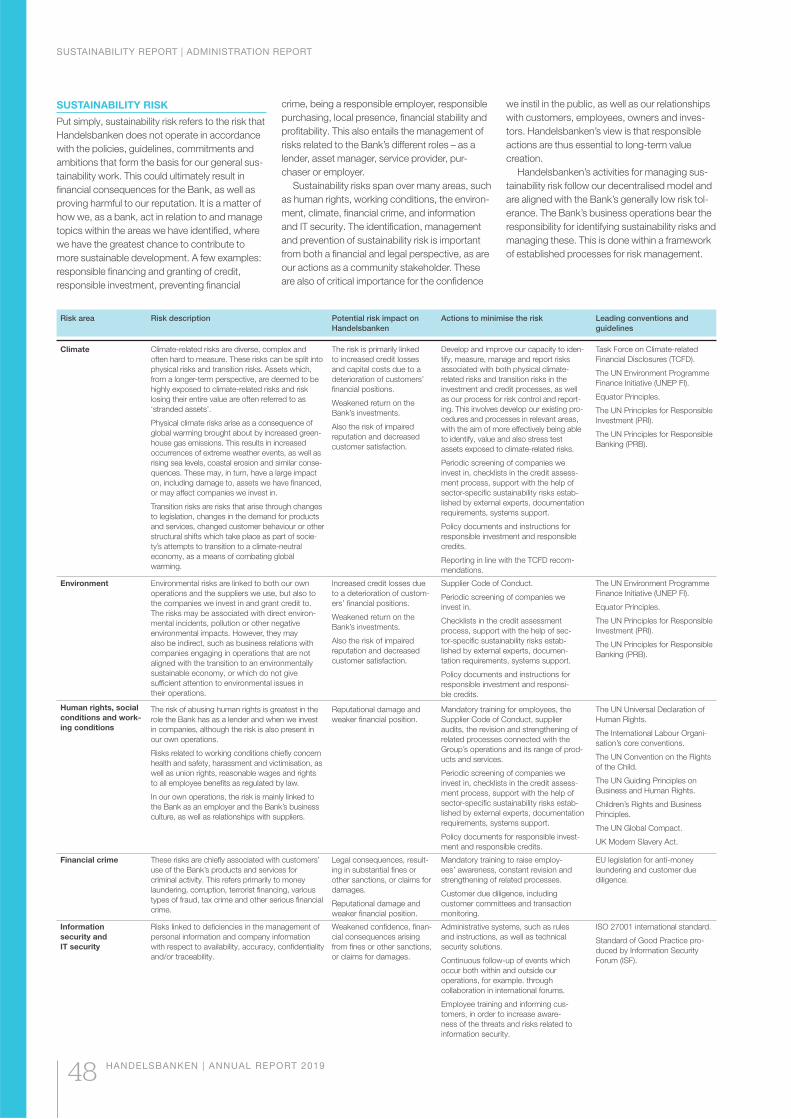
Risk area Risk description Potential risk impact on
Handelsbanken
Actions to minimise the risk Leading conventions and
guidelines
Climate Climate-related risks are diverse, complex and
often hard to measure. These risks can be split into
physical risks and transition risks. Assets which,
from a longer-term perspective, are deemed to be
highly exposed to climate-related risks and risk
losing their entire value are often referred to as
‘stranded assets’.
Physical climate risks arise as a consequence of
global warming brought about by increased green-
house gas emissions. This results in increased
occurrences of extreme weather events, as well as
rising sea levels, coastal erosion and similar conse-
quences. These may, in turn, have a large impact
on, including damage to, assets we have financed,
or may affect companies we invest in.
Transition risks are risks that arise through changes
to legislation, changes in the demand for products
and services, changed customer behaviour or other
structural shifts which take place as part of socie-
ty’s attempts to transition to a climate-neutral
economy, as a means of combating global
warming.
The risk is primarily linked
to increased credit losses
and capital costs due to a
deterioration of customers’
financial positions.
Weakened return on the
Bank’s investments.
Also the risk of impaired
reputation and decreased
customer satisfaction.
Develop and improve our capacity to iden-
tify, measure, manage and report risks
associated with both physical climate-
related risks and transition risks in the
investment and credit processes, as well
as our process for risk control and report-
ing. This involves develop our existing pro-
cedures and processes in relevant areas,
with the aim of more effectively being able
to identify, value and also stress test
assets exposed to climate-related risks.
Periodic screening of companies we
invest in, checklists in the credit assess-
ment process, support with the help of
sector-specific sustainability risks estab-
lished by external experts, documentation
requirements, systems support.
Policy documents and instructions for
responsible investment and responsible
credits.
Reporting in line with the TCFD recom-
mendations.
Task Force on Climate-related
Financial Disclosures (TCFD).
The UN Environment Programme
Finance Initiative (UNEP FI).
Equator Principles.
The UN Principles for Responsible
Investment (PRI).
The UN Principles for Responsible
Banking (PRB).
Environment Environmental risks are linked to both our own
operations and the suppliers we use, but also to
the companies we invest in and grant credit to.
The risks may be associated with direct environ-
mental incidents, pollution or other negative
environmental impacts. However, they may
also be indirect, such as business relations with
companies engaging in operations that are not
aligned with the transition to an environmentally
sustainable economy, or which do not give
sufficient attention to environmental issues in
their operations.
Increased credit losses due
to a deterioration of custom-
ers’ financial positions.
Weakened return on the
Bank’s investments.
Also the risk of impaired
reputation and decreased
customer satisfaction.
Supplier Code of Conduct.
Periodic screening of companies we
invest in.
Checklists in the credit assessment
process, support with the help of sec-
tor-specific sustainability risks estab-
lished by external experts, documen-
tation requirements, systems support.
Policy documents and instructions for
responsible investment and responsi-
ble credits.
The UN Environment Programme
Finance Initiative (UNEP FI).
Equator Principles.
The UN Principles for Responsible
Investment (PRI).
The UN Principles for Responsible
Banking (PRB).
Human rights, social
conditions and work-
ing conditions
The risk of abusing human rights is greatest in the
role the Bank has as a lender and when we invest
in companies, although the risk is also present in
our own operations.
Risks related to working conditions chiefly concern
health and safety, harassment and victimisation, as
well as union rights, reasonable wages and rights
to all employee benefits as regulated by law.
In our own operations, the risk is mainly linked to
the Bank as an employer and the Bank’s business
culture, as well as relationships with suppliers.
Reputational damage and
weaker financial position.
Mandatory training for employees, the
Supplier Code of Conduct, supplier
audits, the revision and strengthening of
related processes connected with the
Group’s operations and its range of prod-
ucts and services.
Periodic screening of companies we
invest in, checklists in the credit assess-
ment process, support with the help of
sector-specific sustainability risks estab-
lished by external experts, documentation
requirements, systems support.
Policy documents for responsible invest-
ment and responsible credits.
The UN Universal Declaration of
Human Rights.
The International Labour Organi-
sation’s core conventions.
The UN Convention on the Rights
of the Child.
The UN Guiding Principles on
Business and Human Rights.
Children’s Rights and Business
Principles.
The UN Global Compact.
UK Modern Slavery Act.
Financial crime These risks are chiefly associated with customers’
use of the Bank’s products and services for
criminal activity. This refers primarily to money
laundering, corruption, terrorist financing, various
types of fraud, tax crime and other serious financial
crime.
Legal consequences, result-
ing in substantial fines or
other sanctions, or claims for
damages.
Reputational damage and
weaker financial position.
Mandatory training to raise employ-
ees’ awareness, constant revision and
strengthening of related processes.
Customer due diligence, including
customer committees and transaction
monitoring.
EU legislation for anti-money
laundering and customer due
diligence.
Information
security and
IT security
Risks linked to deficiencies in the management of
personal information and company information
with respect to availability, accuracy, confidentiality
and/or traceability.
Weakened confidence, finan-
cial consequences arising
from fines or other sanctions,
or claims for damages.
Administrative systems, such as rules
and instructions, as well as technical
security solutions.
Continuous follow-up of events which
occur both within and outside our
operations, for example. through
collaboration in international forums.
Employee training and informing cus-
tomers, in order to increase aware-
ness of the threats and risks related to
information security.
ISO 27001 international standard.
Standard of Good Practice pro-
duced by Information Security
Forum (ISF).
SUSTAINABILITY RISK
Put simply, sustainability risk refers to the risk that
Handelsbanken does not operate in accordance
with the policies, guidelines, commitments and
ambitions that form the basis for our general sus-
tainability work. This could ultimately result in
financial consequences for the Bank, as well as
proving harmful to our reputation. It is a matter of
how we, as a bank, act in relation to and manage
topics within the areas we have identified, where
we have the greatest chance to contribute to
more sustainable development. A few examples:
responsible financing and granting of credit,
responsible investment, preventing financial
crime, being a responsible employer, responsible
purchasing, local presence, financial stability and
profitability. This also entails the management of
risks related to the Bank’s different roles – as a
lender, asset manager, service provider, pur-
chaser or employer.
Sustainability risks span over many areas, such
as human rights, working conditions, the environ-
ment, climate, financial crime, and information
and IT security. The identification, management
and prevention of sustainability risk is important
from both a financial and legal perspective, as are
our actions as a community stakeholder. These
are also of critical importance for the confidence
we instil in the public, as well as our relationships
with customers, employees, owners and inves-
tors. Handelsbanken’s view is that responsible
actions are thus essential to long-term value
creation.
Handelsbanken’s activities for managing sus-
tainability risk follow our decentralised model and
are aligned with the Bank’s generally low risk tol-
erance. The Bank’s business operations bear the
responsibility for identifying sustainability risks and
managing these. This is done within a framework
of established processes for risk management.
SUSTAINABILITY REPORT | ADMINISTRATION REPORT
48 HANDELSBANKEN | ANNUAL REPORT 2019

KEY FIGURES FOR SUSTAINABILITY
Based on the materiality analysis for defining Handelsbanken’s most significant sustainability topics, a number of relevant key figures have been compiled
in a table. The key figures are organised in the same way as the Bank’s material sustainability topics and are grouped in seven sub-areas.
Key figures for sustainability
The Bank and its customers 2019 2018 2017 2016 2015
Customer satisfaction, private customers, SKI/EPSI index
Sweden 71.5 72.3 68.9 67.6 72.4
UK 84.6 83.9 85.2 83.5 83.6
Norway 77.2 78.1 77.5 74.2 75.8
Denmark 75.7 77.8 76.8 77.7 77.7
Finland 81.2 80.1 79.6 80.1 81.9
The Netherlands 77.7 78.0 78.0 74.1 73.5
Customer satisfaction, corporate customers, SKI/EPSI index
Sweden 66.5 67.7 67.5 69.4 74.1
UK 83.1 82.6 83.8 81.6 80.7
Norway 72.9 71.5 72.5 69.9 69.7
Denmark 71.9 71.8 72.3 75.7 72.2
Finland 80.0 79.1 78.7 77.5 76.4
The Netherlands 75.3 73.5 72.4 71.9 72.8
The Bank’s role in the community 2019 2018 2017 2016 2015
Number of branches and meeting places 769 779 807 819 848
Number of local collaborations and activities > 800 > 600 > 400 > 400 -
Only local bank, home markets 68 63 66 59 68
Total taxes and government fees, SEK bn 12 11 10 8 8
Credit losses as a percentage of lending 0.04 0.04 0.08 0.09 0.09
Total emissions of greenhouse gases, CO2e tonnes 9 193 9 628 9 878 9 432 11 580
of which Scope 1 – direct emissions 27 41 86 51 28
of which Scope 2 – indirect emissions 5 422 5 488 5 562 5 416 7 504
of which Scope 3 – other indirect emissions 3 744 4 099 4 230 3 965 4 048
Responsible investment 2019 2018 2017 2016 2015
Assets under management in funds with enhanced sustainability criteria, SEK bn 576 311 221 166 93
Proportion of assets under management in funds 1 with:
enhanced sustainability criteria, % 90 44 32 29 17
negative screening regarding controversial sectors, % 90 44 32 29 17
negative screening regarding companies that violate international standards and conventions, % 90 44 32 29 17
Fund assets under management in companies:
with positive screening regarding sustainability aspects (ESG), SEK bn 3.9 3.0 2.4 0.7 0.7
with screening regarding environmental aspects, SEK bn 0.3 - - - -
Fund assets under management in green, sustainable and social bonds, SEK bn 22.2 - - - -
Fund assets under management in impact investing, SEK bn 2 4.4 1.8 - - -
Proportion of fund assets under management evaluated according to PRI, % 3 100 100 100 100 100
Total number of dialogues for engagement 563 507 251 140
Number of funds with a quantified carbon footprint and official comparative figure 72 31 34 26 24
Responsible financing 2019 2018 2017 2016 2015
Green bonds – volume arranged, SEK bn 16.3 20.0 8.3 5.2 3.0
Green loans outstanding volume, SEK bn 7.4 1.8 0.3 - -
Eligible green assets, SEK bn 12.1 10.1 - - -
Equator Principles
Project financing, number of loans
Category A 0 0 0 0 -
Category B 1 1 0 0 -
Category C 0 0 0 0 -
Project-related corporate loans, number of loans
Category A 0 0 0 0 -
Category B 0 0 0 0 -
Category C 0 0 0 0 -
1 Fund volumes are based on Handelsbanken’s own mutual funds in the Nordic market and mutual funds managed by Optimix (the Netherlands), and the proportion
of total fund volume refers to volume after eliminations on consolidation. 2 Investments that generate measurable, positive impacts on society, combined with a financial return. 3 Requirement that fund managers, internal and external, have signed the Principles for Responsible Investment (PRI).
SUSTAINABILITY REPORT | ADMINISTRATION REPORT
HANDELSBANKEN | ANNUAL REPORT 2019 49
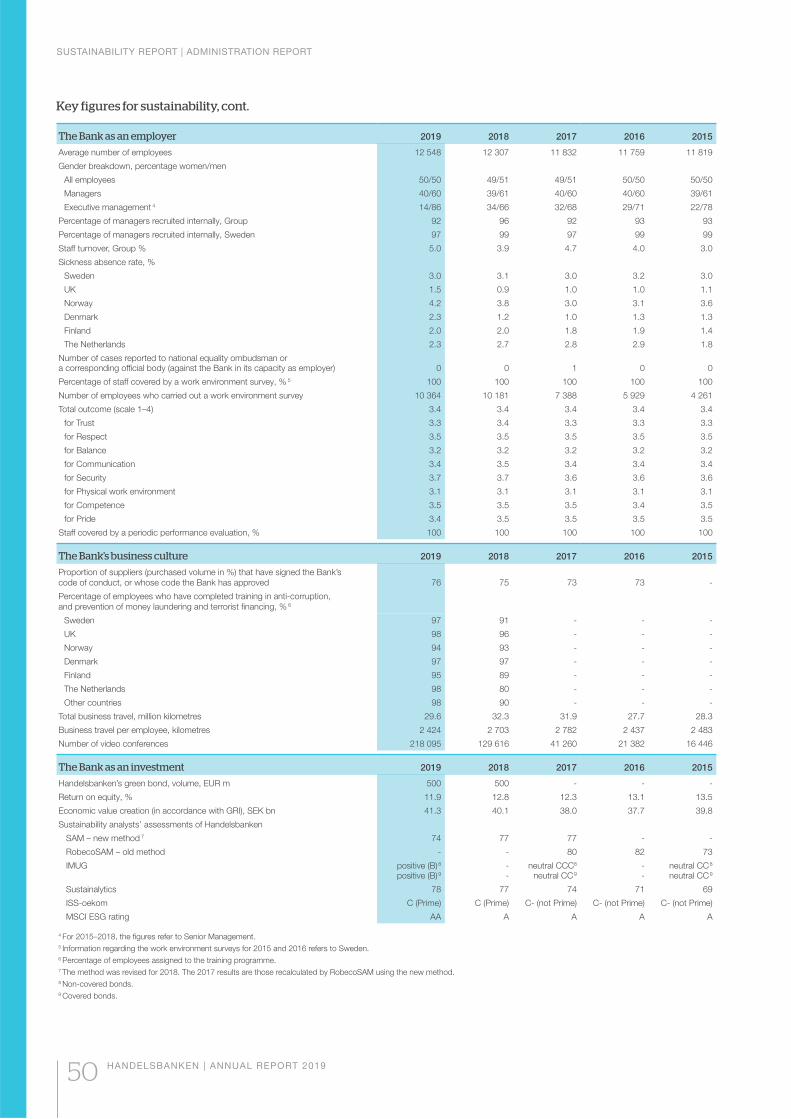
The Bank as an employer 2019 2018 2017 2016 2015
Average number of employees 12 548 12 307 11 832 11 759 11 819
Gender breakdown, percentage women/men
All employees 50/50 49/51 49/51 50/50 50/50
Managers 40/60 39/61 40/60 40/60 39/61
Executive management 4 14/86 34/66 32/68 29/71 22/78
Percentage of managers recruited internally, Group 92 96 92 93 93
Percentage of managers recruited internally, Sweden 97 99 97 99 99
Staff turnover, Group % 5.0 3.9 4.7 4.0 3.0
Sickness absence rate, %
Sweden 3.0 3.1 3.0 3.2 3.0
UK 1.5 0.9 1.0 1.0 1.1
Norway 4.2 3.8 3.0 3.1 3.6
Denmark 2.3 1.2 1.0 1.3 1.3
Finland 2.0 2.0 1.8 1.9 1.4
The Netherlands 2.3 2.7 2.8 2.9 1.8
Number of cases reported to national equality ombudsman or a corresponding official body (against the Bank in its capacity as employer) 0 0 1 0 0
Percentage of staff covered by a work environment survey, % 5 100 100 100 100 100
Number of employees who carried out a work environment survey 10 364 10 181 7 388 5 929 4 261
Total outcome (scale 1–4) 3.4 3.4 3.4 3.4 3.4
for Trust 3.3 3.4 3.3 3.3 3.3
for Respect 3.5 3.5 3.5 3.5 3.5
for Balance 3.2 3.2 3.2 3.2 3.2
for Communication 3.4 3.5 3.4 3.4 3.4
for Security 3.7 3.7 3.6 3.6 3.6
for Physical work environment 3.1 3.1 3.1 3.1 3.1
for Competence 3.5 3.5 3.5 3.4 3.5
for Pride 3.4 3.5 3.5 3.5 3.5
Staff covered by a periodic performance evaluation, % 100 100 100 100 100
The Bank’s business culture 2019 2018 2017 2016 2015
Proportion of suppliers (purchased volume in %) that have signed the Bank’s
code of conduct, or whose code the Bank has approved 76 75 73 73 -
Percentage of employees who have completed training in anti-corruption,
and prevention of money laundering and terrorist financing, % 6
Sweden 97 91 - - -
UK 98 96 - - -
Norway 94 93 - - -
Denmark 97 97 - - -
Finland 95 89 - - -
The Netherlands 98 80 - - -
Other countries 98 90 - - -
Total business travel, million kilometres 29.6 32.3 31.9 27.7 28.3
Business travel per employee, kilometres 2 424 2 703 2 782 2 437 2 483
Number of video conferences 218 095 129 616 41 260 21 382 16 446
The Bank as an investment 2019 2018 2017 2016 2015
Handelsbanken’s green bond, volume, EUR m 500 500 - - -
Return on equity, % 11.9 12.8 12.3 13.1 13.5
Economic value creation (in accordance with GRI), SEK bn 41.3 40.1 38.0 37.7 39.8
Sustainability analysts’ assessments of Handelsbanken
SAM – new method 7 74 77 77 - -
RobecoSAM – old method - - 80 82 73
IMUG positive (B) 8
positive (B) 9--
neutral CCC8
neutral CC 9
--
neutral CC 8
neutral CC 9
Sustainalytics 78 77 74 71 69
ISS-oekom C (Prime) C (Prime) C- (not Prime) C- (not Prime) C- (not Prime)
MSCI ESG rating AA A A A A
4 For 2015–2018, the figures refer to Senior Management. 5 Information regarding the work environment surveys for 2015 and 2016 refers to Sweden. 6 Percentage of employees assigned to the training programme. 7 The method was revised for 2018. The 2017 results are those recalculated by RobecoSAM using the new method. 8 Non-covered bonds. 9 Covered bonds.
Key figures for sustainability, cont.
SUSTAINABILITY REPORT | ADMINISTRATION REPORT
50 HANDELSBANKEN | ANNUAL REPORT 2019
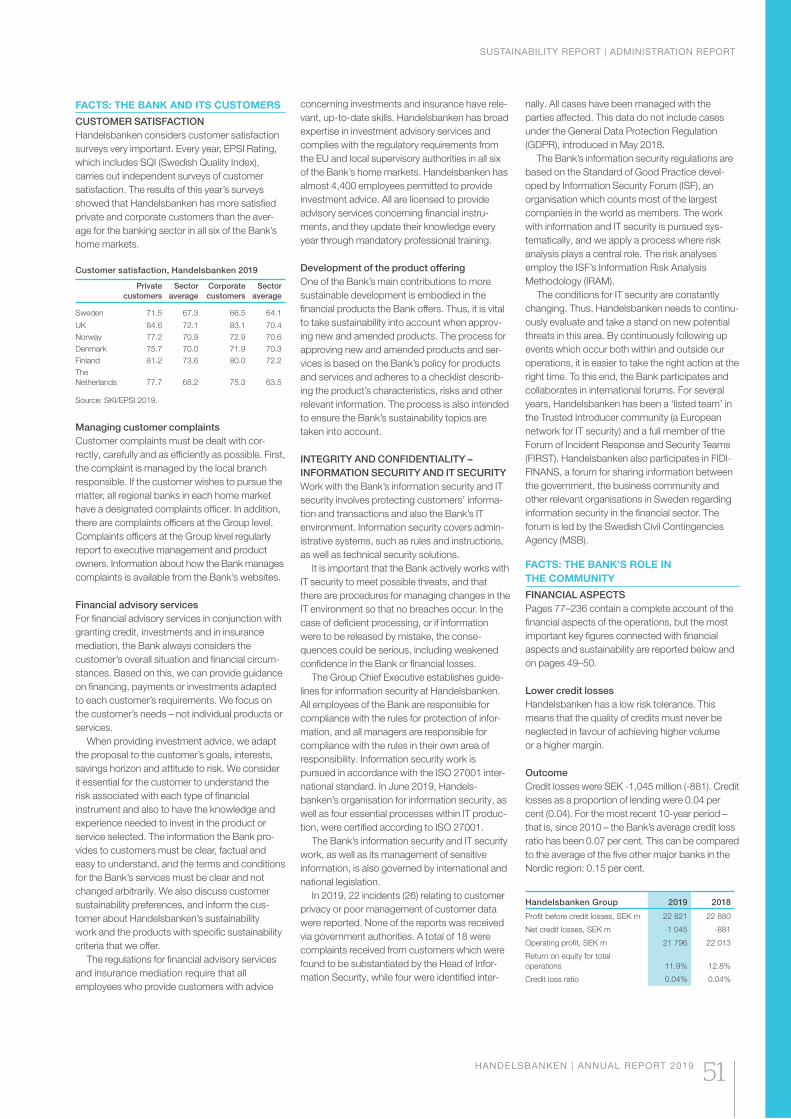
FACTS: THE BANK AND ITS CUSTOMERS
CUSTOMER SATISFACTION
Handelsbanken considers customer satisfaction
surveys very important. Every year, EPSI Rating,
which includes SQI (Swedish Quality Index),
carries out independent surveys of customer
satisfaction. The results of this year’s surveys
showed that Handelsbanken has more satisfied
private and corporate customers than the aver-
age for the banking sector in all six of the Bank’s
home markets.
Customer satisfaction, Handelsbanken 2019
Private
customers
Sector
average
Corporate
customers
Sector
average
Sweden 71.5 67.3 66.5 64.1
UK 84.6 72.1 83.1 70.4
Norway 77.2 70.9 72.9 70.6
Denmark 75.7 70.0 71.9 70.3
Finland 81.2 73.6 80.0 72.2
The
Netherlands 77.7 68.2 75.3 63.5
Source: SKI/EPSI 2019.
Managing customer complaints
Customer complaints must be dealt with cor-
rectly, carefully and as efficiently as possible. First,
the complaint is managed by the local branch
responsible. If the customer wishes to pursue the
matter, all regional banks in each home market
have a designated complaints officer. In addition,
there are complaints officers at the Group level.
Complaints officers at the Group level regularly
report to executive management and product
owners. Information about how the Bank manages
complaints is available from the Bank’s websites.
Financial advisory services
For financial advisory services in conjunction with
granting credit, investments and in insurance
mediation, the Bank always considers the
customer’s overall situation and financial circum-
stances. Based on this, we can provide guidance
on financing, payments or investments adapted
to each customer’s requirements. We focus on
the customer’s needs – not individual products or
services.
When providing investment advice, we adapt
the proposal to the customer’s goals, interests,
savings horizon and attitude to risk. We consider
it essential for the customer to understand the
risk associated with each type of financial
instrument and also to have the knowledge and
experience needed to invest in the product or
service selected. The information the Bank pro-
vides to customers must be clear, factual and
easy to understand, and the terms and conditions
for the Bank’s services must be clear and not
changed arbitrarily. We also discuss customer
sustainability preferences, and inform the cus-
tomer about Handelsbanken’s sustainability
work and the products with specific sustainability
criteria that we offer.
The regulations for financial advisory services
and insurance mediation require that all
employees who provide customers with advice
concerning investments and insurance have rele-
vant, up-to-date skills. Handelsbanken has broad
expertise in investment advisory services and
complies with the regulatory requirements from
the EU and local supervisory authorities in all six
of the Bank’s home markets. Handelsbanken has
almost 4,400 employees permitted to provide
investment advice. All are licensed to provide
advisory services concerning financial instru-
ments, and they update their knowledge every
year through mandatory professional training.
Development of the product offering
One of the Bank’s main contributions to more
sustainable development is embodied in the
financial products the Bank offers. Thus, it is vital
to take sustainability into account when approv-
ing new and amended products. The process for
approving new and amended products and ser-
vices is based on the Bank’s policy for products
and services and adheres to a checklist describ-
ing the product’s characteristics, risks and other
relevant information. The process is also intended
to ensure the Bank’s sustainability topics are
taken into account.
INTEGRITY AND CONFIDENTIALITY –
INFORMATION SECURITY AND IT SECURITY
Work with the Bank’s information security and IT
security involves protecting customers’ informa-
tion and transactions and also the Bank’s IT
environment. Information security covers admin-
istrative systems, such as rules and instructions,
as well as technical security solutions.
It is important that the Bank actively works with
IT security to meet possible threats, and that
there are procedures for managing changes in the
IT environment so that no breaches occur. In the
case of deficient processing, or if information
were to be released by mistake, the conse-
quences could be serious, including weakened
confidence in the Bank or financial losses.
The Group Chief Executive establishes guide-
lines for information security at Handelsbanken.
All employees of the Bank are responsible for
compliance with the rules for protection of infor-
mation, and all managers are responsible for
compliance with the rules in their own area of
responsibility. Information security work is
pursued in accordance with the ISO 27001 inter-
national standard. In June 2019, Handels-
banken’s organisation for information security, as
well as four essential processes within IT produc-
tion, were certified according to ISO 27001.
The Bank’s information security and IT security
work, as well as its management of sensitive
information, is also governed by international and
national legislation.
In 2019, 22 incidents (26) relating to customer
privacy or poor management of customer data
were reported. None of the reports was received
via government authorities. A total of 18 were
complaints received from customers which were
found to be substantiated by the Head of Infor-
mation Security, while four were identified inter-
nally. All cases have been managed with the
parties affected. This data do not include cases
under the General Data Protection Regulation
(GDPR), introduced in May 2018.
The Bank’s information security regulations are
based on the Standard of Good Practice devel-
oped by Information Security Forum (ISF), an
organisation which counts most of the largest
companies in the world as members. The work
with information and IT security is pursued sys-
tematically, and we apply a process where risk
analysis plays a central role. The risk analyses
employ the ISF’s Information Risk Analysis
Methodology (IRAM).
The conditions for IT security are constantly
changing. Thus, Handelsbanken needs to continu-
ously evaluate and take a stand on new potential
threats in this area. By continuously following up
events which occur both within and outside our
operations, it is easier to take the right action at the
right time. To this end, the Bank participates and
collaborates in international forums. For several
years, Handelsbanken has been a ‘listed team’ in
the Trusted Introducer community (a European
network for IT security) and a full member of the
Forum of Incident Response and Security Teams
(FIRST). Handelsbanken also participates in FIDI-
FINANS, a forum for sharing information between
the government, the business community and
other relevant organisations in Sweden regarding
information security in the financial sector. The
forum is led by the Swedish Civil Contingencies
Agency (MSB).
FACTS: THE BANK’S ROLE IN
THE COMMUNITY
FINANCIAL ASPECTS
Pages 77–236 contain a complete account of the
financial aspects of the operations, but the most
important key figures connected with financial
aspects and sustainability are reported below and
on pages 49–50.
Lower credit losses
Handelsbanken has a low risk tolerance. This
means that the quality of credits must never be
neglected in favour of achieving higher volume
or a higher margin.
Outcome
Credit losses were SEK -1,045 million (-881). Credit
losses as a proportion of lending were 0.04 per
cent (0.04). For the most recent 10-year period –
that is, since 2010 – the Bank’s average credit loss
ratio has been 0.07 per cent. This can be compared
to the average of the five other major banks in the
Nordic region: 0.15 per cent.
Handelsbanken Group 2019 2018
Profit before credit losses, SEK m 22 821 22 880
Net credit losses, SEK m -1 045 -881
Operating profit, SEK m 21 796 22 013
Return on equity for total
operations 11.9% 12.8%
Credit loss ratio 0.04% 0.04%
SUSTAINABILITY REPORT | ADMINISTRATION REPORT
HANDELSBANKEN | ANNUAL REPORT 2019 51
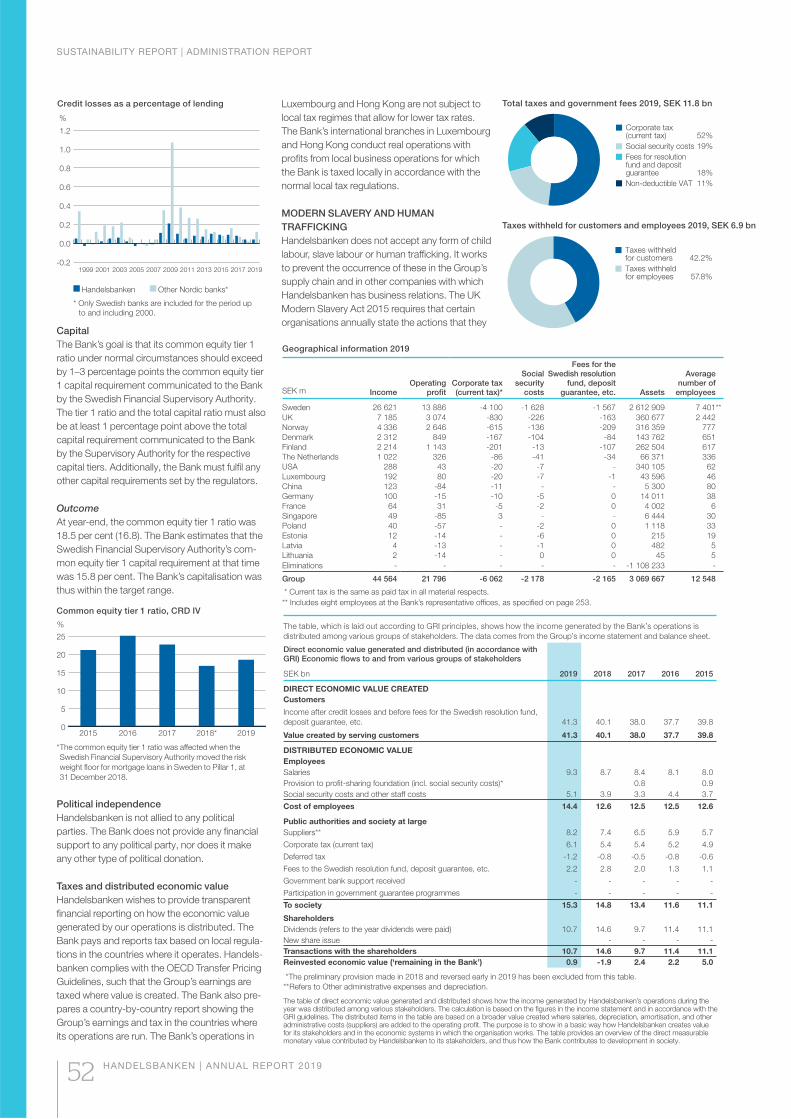
Credit losses as a percentage of lending
-0.2
0.0
0.2
0.4
0.6
0.8
1.0
1.2
20192017201520132011200920072005200320011999
%
Handelsbanken Other Nordic banks*
* Only Swedish banks are included for the period up
to and including 2000.
Capital
The Bank’s goal is that its common equity tier 1
ratio under normal circumstances should exceed
by 1–3 percentage points the common equity tier
1 capital requirement communicated to the Bank
by the Swedish Financial Supervisory Authority.
The tier 1 ratio and the total capital ratio must also
be at least 1 percentage point above the total
capital requirement communicated to the Bank
by the Supervisory Authority for the respective
capital tiers. Additionally, the Bank must fulfil any
other capital requirements set by the regulators.
Outcome
At year-end, the common equity tier 1 ratio was
18.5 per cent (16.8). The Bank estimates that the
Swedish Financial Supervisory Authority’s com-
mon equity tier 1 capital requirement at that time
was 15.8 per cent. The Bank’s capitalisation was
thus within the target range.
%
0
5
10
15
20
25
20192018*201720162015
Common equity tier 1 ratio, CRD IV
* The common equity tier 1 ratio was affected when the
Swedish Financial Supervisory Authority moved the risk
weight floor for mortgage loans in Sweden to Pillar 1, at
31 December 2018.
Political independence
Handelsbanken is not allied to any political
parties. The Bank does not provide any financial
support to any political party, nor does it make
any other type of political donation.
Taxes and distributed economic value
Handelsbanken wishes to provide transparent
financial reporting on how the economic value
generated by our operations is distributed. The
Bank pays and reports tax based on local regula-
tions in the countries where it operates. Handels-
banken complies with the OECD Transfer Pricing
Guidelines, such that the Group’s earnings are
taxed where value is created. The Bank also pre-
pares a country-by-country report showing the
Group’s earnings and tax in the countries where
its operations are run. The Bank’s operations in
Luxembourg and Hong Kong are not subject to
local tax regimes that allow for lower tax rates.
The Bank’s international branches in Luxembourg
and Hong Kong conduct real operations with
profits from local business operations for which
the Bank is taxed locally in accordance with the
normal local tax regulations.
MODERN SLAVERY AND HUMAN
TRAFFICKING
Handelsbanken does not accept any form of child
labour, slave labour or human trafficking. It works
to prevent the occurrence of these in the Group’s
supply chain and in other companies with which
Handelsbanken has business relations. The UK
Modern Slavery Act 2015 requires that certain
organisations annually state the actions that they
Geographical information 2019
SEK m IncomeOperating
profitCorporate tax(current tax)*
Social security
costs
Fees for the Swedish resolution
fund, deposit guarantee, etc. Assets
Average number of
employees
Sweden 26 621 13 886 -4 100 -1 628 -1 567 2 612 909 7 401**
UK 7 185 3 074 -830 -226 -163 360 677 2 442
Norway 4 336 2 646 -615 -136 -209 316 359 777
Denmark 2 312 849 -167 -104 -84 143 762 651
Finland 2 214 1 143 -201 -13 -107 262 504 617
The Netherlands 1 022 326 -86 -41 -34 66 371 336
USA 288 43 -20 -7 - 340 105 62
Luxembourg 192 80 -20 -7 -1 43 596 46
China 123 -84 -11 - - 5 300 80
Germany 100 -15 -10 -5 0 14 011 38
France 64 31 -5 -2 0 4 002 6
Singapore 49 -85 3 - - 6 444 30
Poland 40 -57 - -2 0 1 118 33
Estonia 12 -14 - -6 0 215 19
Latvia 4 -13 - -1 0 482 5
Lithuania 2 -14 - 0 0 45 5
Eliminations - - - - - -1 108 233 -
Group 44 564 21 796 -6 062 -2 178 -2 165 3 069 667 12 548
* Current tax is the same as paid tax in all material respects.
** Includes eight employees at the Bank’s representative offices, as specified on page 253.
The table of direct economic value generated and distributed shows how the income generated by Handelsbanken’s operations during the year was distributed among various stakeholders. The calculation is based on the figures in the income statement and in accordance with the GRI guidelines. The distributed items in the table are based on a broader value created where salaries, depreciation, amortisation, and other administrative costs (suppliers) are added to the operating profit. The purpose is to show in a basic way how Handelsbanken creates value for its stakeholders and in the economic systems in which the organisation works. The table provides an overview of the direct measurable monetary value contributed by Handelsbanken to its stakeholders, and thus how the Bank contributes to development in society.
The table, which is laid out according to GRI principles, shows how the income generated by the Bank’s operations is
distributed among various groups of stakeholders. The data comes from the Group’s income statement and balance sheet.
Direct economic value generated and distributed (in accordance with GRI) Economic flows to and from various groups of stakeholders
SEK bn 2019 2018 2017 2016 2015
DIRECT ECONOMIC VALUE CREATED
Customers
Income after credit losses and before fees for the Swedish resolution fund,
deposit guarantee, etc. 41.3 40.1 38.0 37.7 39.8
Value created by serving customers 41.3 40.1 38.0 37.7 39.8
DISTRIBUTED ECONOMIC VALUE
Employees
Salaries 9.3 8.7 8.4 8.1 8.0
Provision to profit-sharing foundation (incl. social security costs)* 0.8 0.9
Social security costs and other staff costs 5.1 3.9 3.3 4.4 3.7
Cost of employees 14.4 12.6 12.5 12.5 12.6
Public authorities and society at large
Suppliers** 8.2 7.4 6.5 5.9 5.7
Corporate tax (current tax) 6.1 5.4 5.4 5.2 4.9
Deferred tax -1.2 -0.8 -0.5 -0.8 -0.6
Fees to the Swedish resolution fund, deposit guarantee, etc. 2.2 2.8 2.0 1.3 1.1
Government bank support received - - - - -
Participation in government guarantee programmes - - - - -
To society 15.3 14.8 13.4 11.6 11.1
Shareholders
Dividends (refers to the year dividends were paid) 10.7 14.6 9.7 11.4 11.1
New share issue - - - -
Transactions with the shareholders 10.7 14.6 9.7 11.4 11.1
Reinvested economic value (‘remaining in the Bank’) 0.9 -1.9 2.4 2.2 5.0
* The preliminary provision made in 2018 and reversed early in 2019 has been excluded from this table.
** Refers to Other administrative expenses and depreciation.
Total taxes and government fees 2019, SEK 11.8 bn
Taxes withheld for customers and employees 2019, SEK 6.9 bn
Corporate tax (current tax) 52%
Social security costs 19%
Fees for resolution fund and deposit guarantee 18%
Non-deductible VAT 11%
Taxes withheld for customers 42.2%
Taxes withheld for employees 57.8%
SUSTAINABILITY REPORT | ADMINISTRATION REPORT
52 HANDELSBANKEN | ANNUAL REPORT 2019
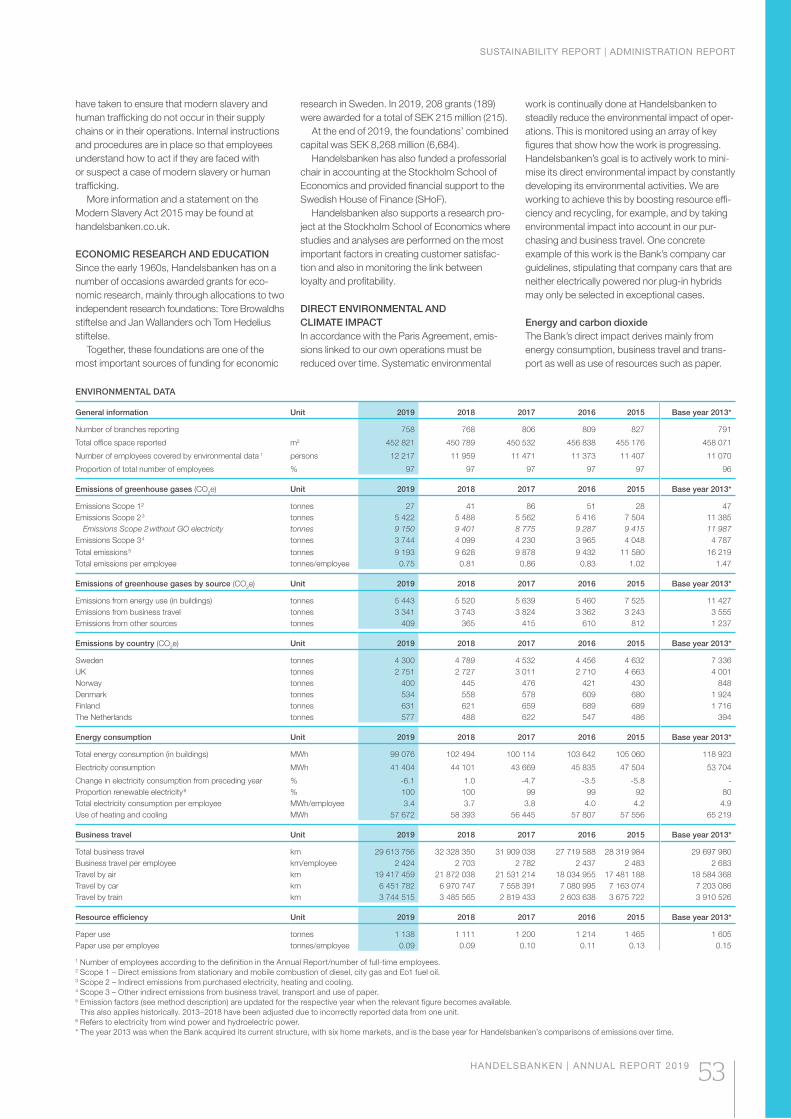
have taken to ensure that modern slavery and
human trafficking do not occur in their supply
chains or in their operations. Internal instructions
and procedures are in place so that employees
understand how to act if they are faced with
or suspect a case of modern slavery or human
trafficking.
More information and a statement on the
Modern Slavery Act 2015 may be found at
handelsbanken.co.uk.
ECONOMIC RESEARCH AND EDUCATION
Since the early 1960s, Handelsbanken has on a
number of occasions awarded grants for eco-
nomic research, mainly through allocations to two
independent research foundations: Tore Browaldhs
stiftelse and Jan Wallanders och Tom Hedelius
stiftelse.
Together, these foundations are one of the
most important sources of funding for economic
research in Sweden. In 2019, 208 grants (189)
were awarded for a total of SEK 215 million (215).
At the end of 2019, the foundations’ combined
capital was SEK 8,268 million (6,684).
Handelsbanken has also funded a professorial
chair in accounting at the Stockholm School of
Economics and provided financial support to the
Swedish House of Finance (SHoF).
Handelsbanken also supports a research pro-
ject at the Stockholm School of Economics where
studies and analyses are performed on the most
important factors in creating customer satisfac-
tion and also in monitoring the link between
loyalty and profitability.
DIRECT ENVIRONMENTAL AND
CLIMATE IMPACT
In accordance with the Paris Agreement, emis-
sions linked to our own operations must be
reduced over time. Systematic environmental
work is continually done at Handelsbanken to
steadily reduce the environmental impact of oper-
ations. This is monitored using an array of key
figures that show how the work is progressing.
Handelsbanken’s goal is to actively work to mini-
mise its direct environmental impact by constantly
developing its environmental activities. We are
working to achieve this by boosting resource effi-
ciency and recycling, for example, and by taking
environmental impact into account in our pur-
chasing and business travel. One concrete
example of this work is the Bank’s company car
guidelines, stipulating that company cars that are
neither electrically powered nor plug-in hybrids
may only be selected in exceptional cases.
Energy and carbon dioxide
The Bank’s direct impact derives mainly from
energy consumption, business travel and trans-
port as well as use of resources such as paper.
ENVIRONMENTAL DATA
General information Unit 2019 2018 2017 2016 2015 Base year 2013*
Number of branches reporting 758 768 806 809 827 791
Total office space reported m2 452 821 450 789 450 532 456 838 455 176 458 071
Number of employees covered by environmental data 1 persons 12 217 11 959 11 471 11 373 11 407 11 070
Proportion of total number of employees % 97 97 97 97 97 96
Emissions of greenhouse gases (CO2e) Unit 2019 2018 2017 2016 2015 Base year 2013*
Emissions Scope 1² tonnes 27 41 86 51 28 47
Emissions Scope 2 3 tonnes 5 422 5 488 5 562 5 416 7 504 11 385
Emissions Scope 2 without GO electricity tonnes 9 150 9 401 8 775 9 287 9 415 11 987
Emissions Scope 3 4 tonnes 3 744 4 099 4 230 3 965 4 048 4 787
Total emissions 5 tonnes 9 193 9 628 9 878 9 432 11 580 16 219
Total emissions per employee tonnes/employee 0.75 0.81 0.86 0.83 1.02 1.47
Emissions of greenhouse gases by source (CO2e) Unit 2019 2018 2017 2016 2015 Base year 2013*
Emissions from energy use (in buildings) tonnes 5 443 5 520 5 639 5 460 7 525 11 427
Emissions from business travel tonnes 3 341 3 743 3 824 3 362 3 243 3 555
Emissions from other sources tonnes 409 365 415 610 812 1 237
Emissions by country (CO2e) Unit 2019 2018 2017 2016 2015 Base year 2013*
Sweden tonnes 4 300 4 789 4 532 4 456 4 632 7 336
UK tonnes 2 751 2 727 3 011 2 710 4 663 4 001
Norway tonnes 400 445 476 421 430 848
Denmark tonnes 534 558 578 609 680 1 924
Finland tonnes 631 621 659 689 689 1 716
The Netherlands tonnes 577 488 622 547 486 394
Energy consumption Unit 2019 2018 2017 2016 2015 Base year 2013*
Total energy consumption (in buildings) MWh 99 076 102 494 100 114 103 642 105 060 118 923
Electricity consumption MWh 41 404 44 101 43 669 45 835 47 504 53 704
Change in electricity consumption from preceding year % -6.1 1.0 -4.7 -3.5 -5.8 -
Proportion renewable electricity 6 % 100 100 99 99 92 80
Total electricity consumption per employee MWh/employee 3.4 3.7 3.8 4.0 4.2 4.9
Use of heating and cooling MWh 57 672 58 393 56 445 57 807 57 556 65 219
Business travel Unit 2019 2018 2017 2016 2015 Base year 2013*
Total business travel km 29 613 756 32 328 350 31 909 038 27 719 588 28 319 984 29 697 980
Business travel per employee km/employee 2 424 2 703 2 782 2 437 2 483 2 683
Travel by air km 19 417 459 21 872 038 21 531 214 18 034 955 17 481 188 18 584 368
Travel by car km 6 451 782 6 970 747 7 558 391 7 080 995 7 163 074 7 203 086
Travel by train km 3 744 515 3 485 565 2 819 433 2 603 638 3 675 722 3 910 526
Resource efficiency Unit 2019 2018 2017 2016 2015 Base year 2013*
Paper use tonnes 1 138 1 111 1 200 1 214 1 465 1 605
Paper use per employee tonnes/employee 0.09 0.09 0.10 0.11 0.13 0.15
1 Number of employees according to the definition in the Annual Report/number of full-time employees.2 Scope 1 – Direct emissions from stationary and mobile combustion of diesel, city gas and Eo1 fuel oil.3 Scope 2 – Indirect emissions from purchased electricity, heating and cooling.4 Scope 3 – Other indirect emissions from business travel, transport and use of paper.5 Emission factors (see method description) are updated for the respective year when the relevant figure becomes available.
This also applies historically. 2013–2018 have been adjusted due to incorrectly reported data from one unit.6 Refers to electricity from wind power and hydroelectric power.
* The year 2013 was when the Bank acquired its current structure, with six home markets, and is the base year for Handelsbanken’s comparisons of emissions over time.
SUSTAINABILITY REPORT | ADMINISTRATION REPORT
HANDELSBANKEN | ANNUAL REPORT 2019 53
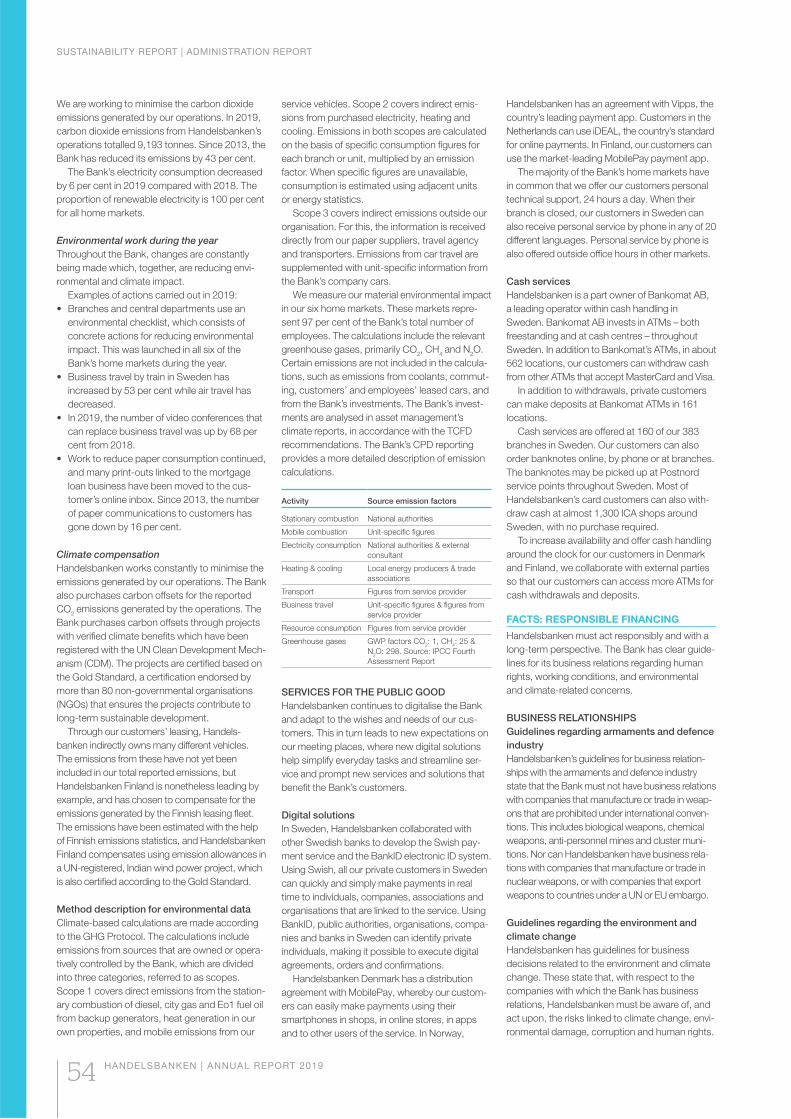
We are working to minimise the carbon dioxide
emissions generated by our operations. In 2019,
carbon dioxide emissions from Handelsbanken’s
operations totalled 9,193 tonnes. Since 2013, the
Bank has reduced its emissions by 43 per cent.
The Bank’s electricity consumption decreased
by 6 per cent in 2019 compared with 2018. The
proportion of renewable electricity is 100 per cent
for all home markets.
Environmental work during the year
Throughout the Bank, changes are constantly
being made which, together, are reducing envi-
ronmental and climate impact.
Examples of actions carried out in 2019:
• Branches and central departments use an
environmental checklist, which consists of
concrete actions for reducing environmental
impact. This was launched in all six of the
Bank’s home markets during the year.
• Business travel by train in Sweden has
increased by 53 per cent while air travel has
decreased.
• In 2019, the number of video conferences that
can replace business travel was up by 68 per
cent from 2018.
• Work to reduce paper consumption continued,
and many print-outs linked to the mortgage
loan business have been moved to the cus-
tomer’s online inbox. Since 2013, the number
of paper communications to customers has
gone down by 16 per cent.
Climate compensation
Handelsbanken works constantly to minimise the
emissions generated by our operations. The Bank
also purchases carbon offsets for the reported
CO2 emissions generated by the operations. The
Bank purchases carbon offsets through projects
with verified climate benefits which have been
registered with the UN Clean Development Mech-
anism (CDM). The projects are certified based on
the Gold Standard, a certification endorsed by
more than 80 non-governmental organisations
(NGOs) that ensures the projects contribute to
long-term sustainable development.
Through our customers’ leasing, Handels-
banken indirectly owns many different vehicles.
The emissions from these have not yet been
included in our total reported emissions, but
Handelsbanken Finland is nonetheless leading by
example, and has chosen to compensate for the
emissions generated by the Finnish leasing fleet.
The emissions have been estimated with the help
of Finnish emissions statistics, and Handelsbanken
Finland compensates using emission allowances in
a UN-registered, Indian wind power project, which
is also certified according to the Gold Standard.
Method description for environmental data
Climate-based calculations are made according
to the GHG Protocol. The calculations include
emissions from sources that are owned or opera-
tively controlled by the Bank, which are divided
into three categories, referred to as scopes.
Scope 1 covers direct emissions from the station-
ary combustion of diesel, city gas and Eo1 fuel oil
from backup generators, heat generation in our
own properties, and mobile emissions from our
service vehicles. Scope 2 covers indirect emis-
sions from purchased electricity, heating and
cooling. Emissions in both scopes are calculated
on the basis of specific consumption figures for
each branch or unit, multiplied by an emission
factor. When specific figures are unavailable,
consumption is estimated using adjacent units
or energy statistics.
Scope 3 covers indirect emissions outside our
organisation. For this, the information is received
directly from our paper suppliers, travel agency
and transporters. Emissions from car travel are
supplemented with unit-specific information from
the Bank’s company cars.
We measure our material environmental impact
in our six home markets. These markets repre-
sent 97 per cent of the Bank’s total number of
employees. The calculations include the relevant
greenhouse gases, primarily CO2, CH
4 and N
2O.
Certain emissions are not included in the calcula-
tions, such as emissions from coolants, commut-
ing, customers’ and employees’ leased cars, and
from the Bank’s investments. The Bank’s invest-
ments are analysed in asset management’s
climate reports, in accordance with the TCFD
recommendations. The Bank’s CPD reporting
provides a more detailed description of emission
calculations.
Activity Source emission factors
Stationary combustion National authorities
Mobile combustion Unit-specific figures
Electricity consumption National authorities & external
consultant
Heating & cooling Local energy producers & trade
associations
Transport Figures from service provider
Business travel Unit-specific figures & figures from
service provider
Resource consumption Figures from service provider
Greenhouse gases GWP factors CO2: 1, CH
4: 25 &
N2O: 298. Source: IPCC Fourth
Assessment Report
SERVICES FOR THE PUBLIC GOOD
Handelsbanken continues to digitalise the Bank
and adapt to the wishes and needs of our cus-
tomers. This in turn leads to new expectations on
our meeting places, where new digital solutions
help simplify everyday tasks and streamline ser-
vice and prompt new services and solutions that
benefit the Bank’s customers.
Digital solutions
In Sweden, Handelsbanken collaborated with
other Swedish banks to develop the Swish pay-
ment service and the BankID electronic ID system.
Using Swish, all our private customers in Sweden
can quickly and simply make payments in real
time to individuals, companies, associations and
organisations that are linked to the service. Using
BankID, public authorities, organisations, compa-
nies and banks in Sweden can identify private
individuals, making it possible to execute digital
agreements, orders and confirmations.
Handelsbanken Denmark has a distribution
agreement with MobilePay, whereby our custom-
ers can easily make payments using their
smartphones in shops, in online stores, in apps
and to other users of the service. In Norway,
Handelsbanken has an agreement with Vipps, the
country’s leading payment app. Customers in the
Netherlands can use iDEAL, the country’s standard
for online payments. In Finland, our customers can
use the market-leading MobilePay payment app.
The majority of the Bank’s home markets have
in common that we offer our customers personal
technical support, 24 hours a day. When their
branch is closed, our customers in Sweden can
also receive personal service by phone in any of 20
different languages. Personal service by phone is
also offered outside office hours in other markets.
Cash services
Handelsbanken is a part owner of Bankomat AB,
a leading operator within cash handling in
Sweden. Bankomat AB invests in ATMs – both
freestanding and at cash centres – throughout
Sweden. In addition to Bankomat’s ATMs, in about
562 locations, our customers can withdraw cash
from other ATMs that accept MasterCard and Visa.
In addition to withdrawals, private customers
can make deposits at Bankomat ATMs in 161
locations.
Cash services are offered at 160 of our 383
branches in Sweden. Our customers can also
order banknotes online, by phone or at branches.
The banknotes may be picked up at Postnord
service points throughout Sweden. Most of
Handelsbanken’s card customers can also with-
draw cash at almost 1,300 ICA shops around
Sweden, with no purchase required.
To increase availability and offer cash handling
around the clock for our customers in Denmark
and Finland, we collaborate with external parties
so that our customers can access more ATMs for
cash withdrawals and deposits.
FACTS: RESPONSIBLE FINANCING
Handelsbanken must act responsibly and with a
long-term perspective. The Bank has clear guide-
lines for its business relations regarding human
rights, working conditions, and environmental
and climate-related concerns.
BUSINESS RELATIONSHIPS
Guidelines regarding armaments and defence
industry
Handelsbanken’s guidelines for business relation-
ships with the armaments and defence industry
state that the Bank must not have business relations
with companies that manufacture or trade in weap-
ons that are prohibited under international conven-
tions. This includes biological weapons, chemical
weapons, anti-personnel mines and cluster muni-
tions. Nor can Handelsbanken have business rela-
tions with companies that manufacture or trade in
nuclear weapons, or with companies that export
weapons to countries under a UN or EU embargo.
Guidelines regarding the environment and
climate change
Handelsbanken has guidelines for business
decisions related to the environment and climate
change. These state that, with respect to the
companies with which the Bank has business
relations, Handelsbanken must be aware of, and
act upon, the risks linked to climate change, envi-
ronmental damage, corruption and human rights.
SUSTAINABILITY REPORT | ADMINISTRATION REPORT
54 HANDELSBANKEN | ANNUAL REPORT 2019
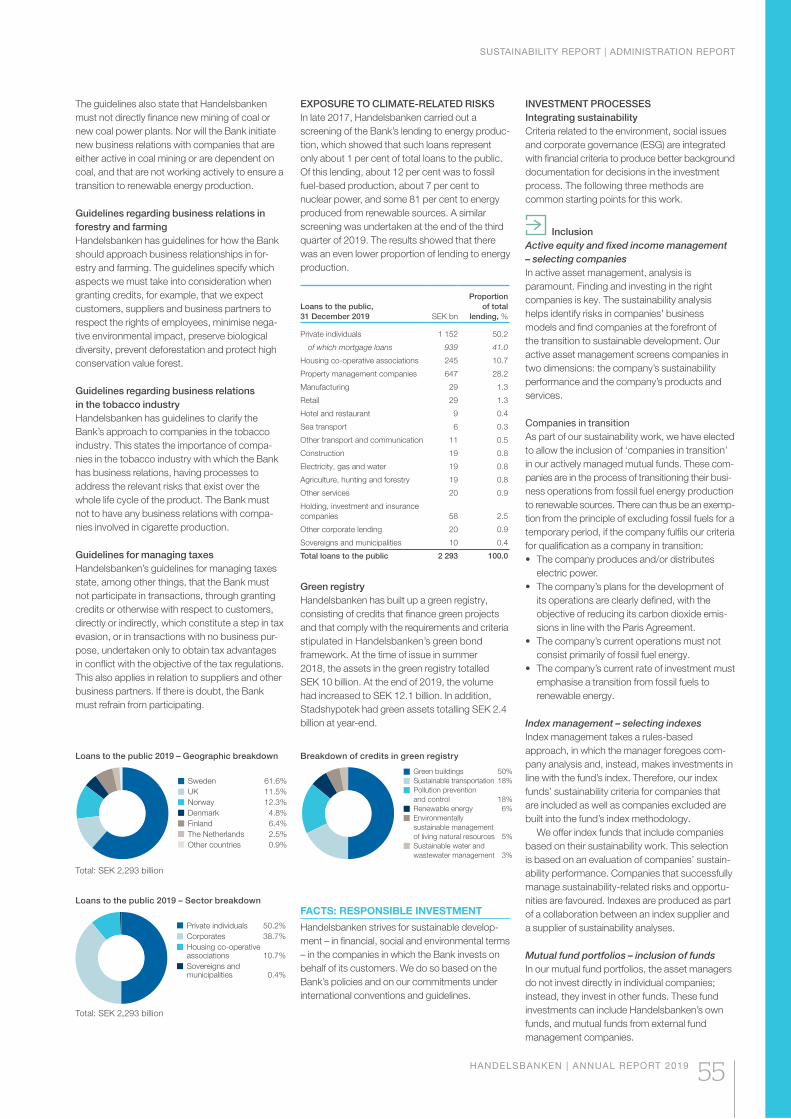
The guidelines also state that Handelsbanken
must not directly finance new mining of coal or
new coal power plants. Nor will the Bank initiate
new business relations with companies that are
either active in coal mining or are dependent on
coal, and that are not working actively to ensure a
transition to renewable energy production.
Guidelines regarding business relations in
forestry and farming
Handelsbanken has guidelines for how the Bank
should approach business relationships in for-
estry and farming. The guidelines specify which
aspects we must take into consideration when
granting credits, for example, that we expect
customers, suppliers and business partners to
respect the rights of employees, minimise nega-
tive environmental impact, preserve biological
diversity, prevent deforestation and protect high
conservation value forest.
Guidelines regarding business relations
in the tobacco industry
Handelsbanken has guidelines to clarify the
Bank’s approach to companies in the tobacco
industry. This states the importance of compa-
nies in the tobacco industry with which the Bank
has business relations, having processes to
address the relevant risks that exist over the
whole life cycle of the product. The Bank must
not to have any business relations with compa-
nies involved in cigarette production.
Guidelines for managing taxes
Handelsbanken’s guidelines for managing taxes
state, among other things, that the Bank must
not participate in transactions, through granting
credits or otherwise with respect to customers,
directly or indirectly, which constitute a step in tax
evasion, or in transactions with no business pur-
pose, undertaken only to obtain tax advantages
in conflict with the objective of the tax regulations.
This also applies in relation to suppliers and other
business partners. If there is doubt, the Bank
must refrain from participating.
EXPOSURE TO CLIMATE-RELATED RISKS
In late 2017, Handelsbanken carried out a
screening of the Bank’s lending to energy produc-
tion, which showed that such loans represent
only about 1 per cent of total loans to the public.
Of this lending, about 12 per cent was to fossil
fuel-based production, about 7 per cent to
nuclear power, and some 81 per cent to energy
produced from renewable sources. A similar
screening was undertaken at the end of the third
quarter of 2019. The results showed that there
was an even lower proportion of lending to energy
production.
Loans to the public,
31 December 2019 SEK bn
Proportion
of total
lending, %
Private individuals 1 152 50.2
of which mortgage loans 939 41.0
Housing co-operative associations 245 10.7
Property management companies 647 28.2
Manufacturing 29 1.3
Retail 29 1.3
Hotel and restaurant 9 0.4
Sea transport 6 0.3
Other transport and communication 11 0.5
Construction 19 0.8
Electricity, gas and water 19 0.8
Agriculture, hunting and forestry 19 0.8
Other services 20 0.9
Holding, investment and insurance
companies 58 2.5
Other corporate lending 20 0.9
Sovereigns and municipalities 10 0.4
Total loans to the public 2 293 100.0
Green registry
Handelsbanken has built up a green registry,
consisting of credits that finance green projects
and that comply with the requirements and criteria
stipulated in Handelsbanken’s green bond
framework. At the time of issue in summer
2018, the assets in the green registry totalled
SEK 10 billion. At the end of 2019, the volume
had increased to SEK 12.1 billion. In addition,
Stadshypotek had green assets totalling SEK 2.4
billion at year-end.
FACTS: RESPONSIBLE INVESTMENT
Handelsbanken strives for sustainable develop-
ment – in financial, social and environmental terms
– in the companies in which the Bank invests on
behalf of its customers. We do so based on the
Bank’s policies and on our commitments under
international conventions and guidelines.
INVESTMENT PROCESSES
Integrating sustainability
Criteria related to the environment, social issues
and corporate governance (ESG) are integrated
with financial criteria to produce better background
documentation for decisions in the investment
process. The following three methods are
common starting points for this work.
Inclusion
Active equity and fixed income management
– selecting companies
In active asset management, analysis is
paramount. Finding and investing in the right
companies is key. The sustainability analysis
helps identify risks in companies’ business
models and find companies at the forefront of
the transition to sustainable development. Our
active asset management screens companies in
two dimensions: the company’s sustainability
performance and the company’s products and
services.
Companies in transition
As part of our sustainability work, we have elected
to allow the inclusion of ‘companies in transition’
in our actively managed mutual funds. These com-
panies are in the process of transitioning their busi-
ness operations from fossil fuel energy production
to renewable sources. There can thus be an exemp-
tion from the principle of excluding fossil fuels for a
temporary period, if the company fulfils our criteria
for qualification as a company in transition:
• The company produces and/or distributes
electric power.
• The company’s plans for the development of
its operations are clearly defined, with the
objective of reducing its carbon dioxide emis-
sions in line with the Paris Agreement.
• The company’s current operations must not
consist primarily of fossil fuel energy.
• The company’s current rate of investment must
emphasise a transition from fossil fuels to
renewable energy.
Index management – selecting indexes
Index management takes a rules-based
approach, in which the manager foregoes com-
pany analysis and, instead, makes investments in
line with the fund’s index. Therefore, our index
funds’ sustainability criteria for companies that
are included as well as companies excluded are
built into the fund’s index methodology.
We offer index funds that include companies
based on their sustainability work. This selection
is based on an evaluation of companies’ sustain-
ability performance. Companies that successfully
manage sustainability-related risks and opportu-
nities are favoured. Indexes are produced as part
of a collaboration between an index supplier and
a supplier of sustainability analyses.
Mutual fund portfolios – inclusion of funds
In our mutual fund portfolios, the asset managers
do not invest directly in individual companies;
instead, they invest in other funds. These fund
investments can include Handelsbanken’s own
funds, and mutual funds from external fund
management companies.
Sweden 61.6%
UK 11.5%
Norway 12.3%
Denmark 4.8%
Finland 6.4%
The Netherlands 2.5%
Other countries 0.9%
Loans to the public 2019 – Geographic breakdown
Total: SEK 2,293 billion
Green buildings 50%
Sustainable transportation 18%
Pollution prevention
and control 18%
Renewable energy 6%
Environmentally
sustainable management
of living natural resources 5%
Sustainable water and
wastewater management 3%
Breakdown of credits in green registry
Total: SEK 2,293 billion
Private individuals 50.2%
Corporates 38.7%
Housing co-operativeassociations 10.7%
Sovereigns and municipalities 0.4%
Loans to the public 2019 – Sector breakdown
SUSTAINABILITY REPORT | ADMINISTRATION REPORT
HANDELSBANKEN | ANNUAL REPORT 2019 55
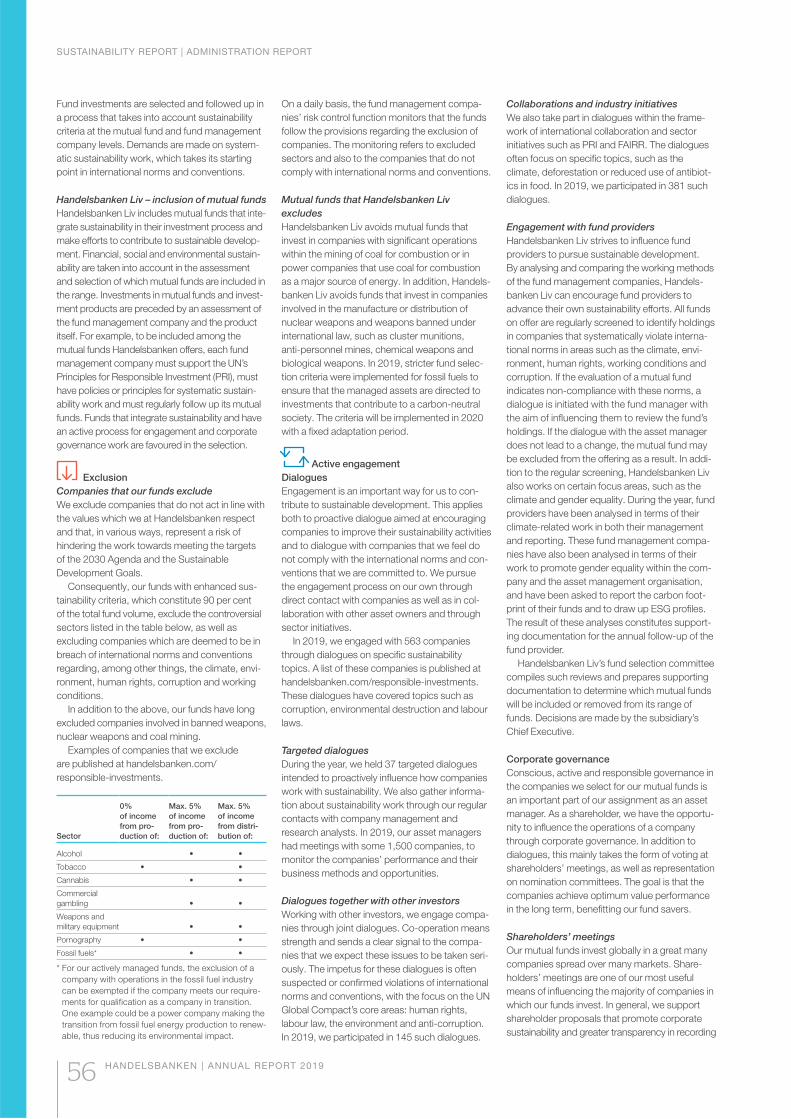
Fund investments are selected and followed up in
a process that takes into account sustainability
criteria at the mutual fund and fund management
company levels. Demands are made on system-
atic sustainability work, which takes its starting
point in international norms and conventions.
Handelsbanken Liv – inclusion of mutual funds
Handelsbanken Liv includes mutual funds that inte-
grate sustainability in their investment process and
make efforts to contribute to sustainable develop-
ment. Financial, social and environmental sustain-
ability are taken into account in the assessment
and selection of which mutual funds are included in
the range. Investments in mutual funds and invest-
ment products are preceded by an assessment of
the fund management company and the product
itself. For example, to be included among the
mutual funds Handelsbanken offers, each fund
management company must support the UN’s
Principles for Responsible Investment (PRI), must
have policies or principles for systematic sustain-
ability work and must regularly follow up its mutual
funds. Funds that integrate sustainability and have
an active process for engagement and corporate
governance work are favoured in the selection.
Exclusion
Companies that our funds exclude
We exclude companies that do not act in line with
the values which we at Handelsbanken respect
and that, in various ways, represent a risk of
hindering the work towards meeting the targets
of the 2030 Agenda and the Sustainable
Develop ment Goals.
Consequently, our funds with enhanced sus-
tainability criteria, which constitute 90 per cent
of the total fund volume, exclude the controversial
sectors listed in the table below, as well as
excluding companies which are deemed to be in
breach of international norms and conventions
regarding, among other things, the climate, envi-
ronment, human rights, corruption and working
conditions.
In addition to the above, our funds have long
excluded companies involved in banned weapons,
nuclear weapons and coal mining.
Examples of companies that we exclude
are published at handelsbanken.com/
responsible-investments.
Sector
0%
of income
from pro-
duction of:
Max. 5%
of income
from pro-
duction of:
Max. 5%
of income
from distri-
bution of:
Alcohol • •
Tobacco • •
Cannabis • •
Commercial
gambling • •
Weapons and
military equipment • •
Pornography • •
Fossil fuels* • •
* For our actively managed funds, the exclusion of a
company with operations in the fossil fuel industry
can be exempted if the company meets our require-
ments for qualification as a company in transition.
One example could be a power company making the
transition from fossil fuel energy production to renew-
able, thus reducing its environmental impact.
On a daily basis, the fund management compa-
nies’ risk control function monitors that the funds
follow the provisions regarding the exclusion of
companies. The monitoring refers to excluded
sectors and also to the companies that do not
comply with international norms and conventions.
Mutual funds that Handelsbanken Liv
excludes
Handelsbanken Liv avoids mutual funds that
invest in companies with significant operations
within the mining of coal for combustion or in
power companies that use coal for combustion
as a major source of energy. In addition, Handels-
banken Liv avoids funds that invest in companies
involved in the manufacture or distribution of
nuclear weapons and weapons banned under
international law, such as cluster munitions,
anti-personnel mines, chemical weapons and
biological weapons. In 2019, stricter fund selec-
tion criteria were implemented for fossil fuels to
ensure that the managed assets are directed to
investments that contribute to a carbon-neutral
society. The criteria will be implemented in 2020
with a fixed adaptation period.
Active engagement
Dialogues
Engagement is an important way for us to con-
tribute to sustainable development. This applies
both to proactive dialogue aimed at encouraging
companies to improve their sustainability activities
and to dialogue with companies that we feel do
not comply with the international norms and con-
ventions that we are committed to. We pursue
the engagement process on our own through
direct contact with companies as well as in col-
laboration with other asset owners and through
sector initiatives.
In 2019, we engaged with 563 companies
through dialogues on specific sustainability
topics. A list of these companies is published at
handelsbanken.com/responsible-investments.
These dialogues have covered topics such as
corruption, environmental destruction and labour
laws.
Targeted dialogues
During the year, we held 37 targeted dialogues
intended to proactively influence how companies
work with sustainability. We also gather informa-
tion about sustainability work through our regular
contacts with company management and
research analysts. In 2019, our asset managers
had meetings with some 1,500 companies, to
monitor the companies’ performance and their
business methods and opportunities.
Dialogues together with other investors
Working with other investors, we engage compa-
nies through joint dialogues. Co-operation means
strength and sends a clear signal to the compa-
nies that we expect these issues to be taken seri-
ously. The impetus for these dialogues is often
suspected or confirmed violations of international
norms and conventions, with the focus on the UN
Global Compact’s core areas: human rights,
labour law, the environment and anti-corruption.
In 2019, we participated in 145 such dialogues.
Collaborations and industry initiatives
We also take part in dialogues within the frame-
work of international collaboration and sector
initiatives such as PRI and FAIRR. The dialogues
often focus on specific topics, such as the
climate, deforestation or reduced use of antibiot-
ics in food. In 2019, we participated in 381 such
dialogues.
Engagement with fund providers
Handelsbanken Liv strives to influence fund
providers to pursue sustainable development.
By analysing and comparing the working methods
of the fund management companies, Handels-
banken Liv can encourage fund providers to
advance their own sustainability efforts. All funds
on offer are regularly screened to identify holdings
in companies that systematically violate interna-
tional norms in areas such as the climate, envi-
ronment, human rights, working conditions and
corruption. If the evaluation of a mutual fund
indicates non-compliance with these norms, a
dialogue is initiated with the fund manager with
the aim of influencing them to review the fund’s
holdings. If the dialogue with the asset manager
does not lead to a change, the mutual fund may
be excluded from the offering as a result. In addi-
tion to the regular screening, Handelsbanken Liv
also works on certain focus areas, such as the
climate and gender equality. During the year, fund
providers have been analysed in terms of their
climate-related work in both their management
and reporting. These fund management compa-
nies have also been analysed in terms of their
work to promote gender equality within the com-
pany and the asset management organisation,
and have been asked to report the carbon foot-
print of their funds and to draw up ESG profiles.
The result of these analyses constitutes support-
ing documentation for the annual follow-up of the
fund provider.
Handelsbanken Liv’s fund selection committee
compiles such reviews and prepares supporting
documentation to determine which mutual funds
will be included or removed from its range of
funds. Decisions are made by the subsidiary’s
Chief Executive.
Corporate governance
Conscious, active and responsible governance in
the companies we select for our mutual funds is
an important part of our assignment as an asset
manager. As a shareholder, we have the opportu-
nity to influence the operations of a company
through corporate governance. In addition to
dialogues, this mainly takes the form of voting at
shareholders’ meetings, as well as representation
on nomination committees. The goal is that the
companies achieve optimum value performance
in the long term, benefitting our fund savers.
Shareholders’ meetings
Our mutual funds invest globally in a great many
companies spread over many markets. Share-
holders’ meetings are one of our most useful
means of influencing the majority of companies in
which our funds invest. In general, we support
shareholder proposals that promote corporate
sustainability and greater transparency in recording
SUSTAINABILITY REPORT | ADMINISTRATION REPORT
56 HANDELSBANKEN | ANNUAL REPORT 2019
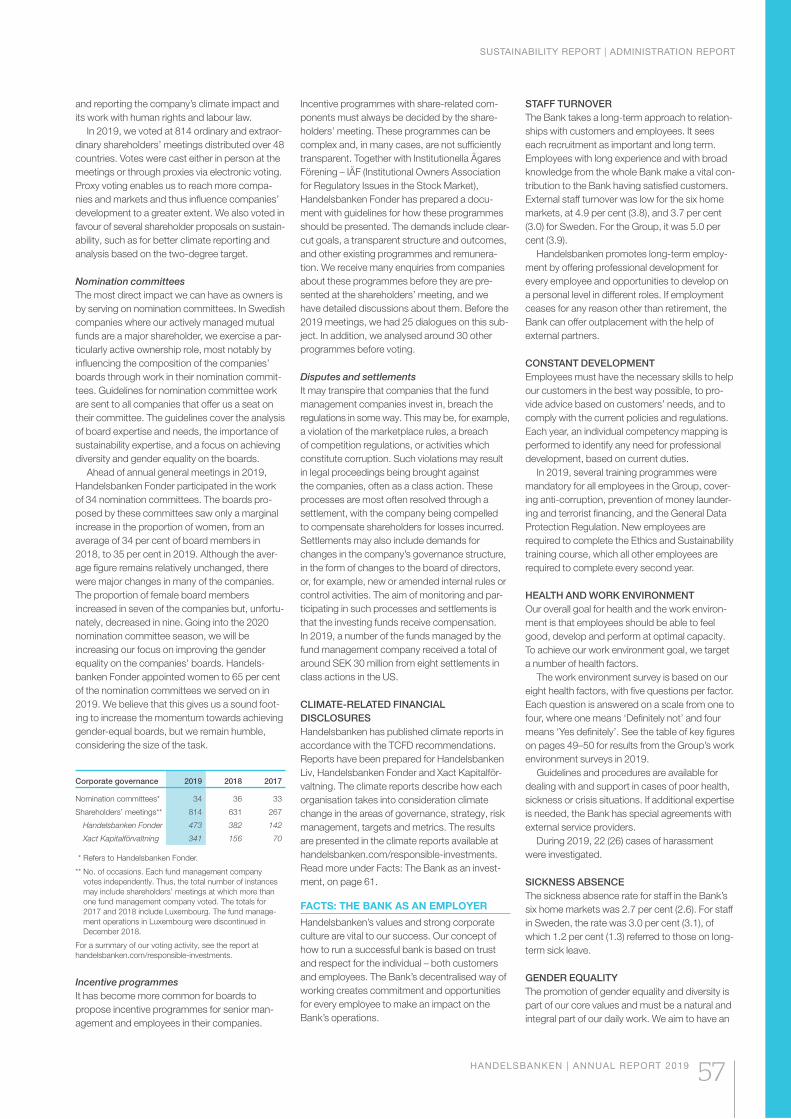
and reporting the company’s climate impact and
its work with human rights and labour law.
In 2019, we voted at 814 ordinary and extraor-
dinary shareholders’ meetings distributed over 48
countries. Votes were cast either in person at the
meetings or through proxies via electronic voting.
Proxy voting enables us to reach more compa-
nies and markets and thus influence companies’
development to a greater extent. We also voted in
favour of several shareholder proposals on sustain-
ability, such as for better climate reporting and
analysis based on the two-degree target.
Nomination committees
The most direct impact we can have as owners is
by serving on nomination committees. In Swedish
companies where our actively managed mutual
funds are a major shareholder, we exercise a par-
ticularly active ownership role, most notably by
influencing the composition of the companies’
boards through work in their nomination commit-
tees. Guidelines for nomination committee work
are sent to all companies that offer us a seat on
their committee. The guidelines cover the analysis
of board expertise and needs, the importance of
sustainability expertise, and a focus on achieving
diversity and gender equality on the boards.
Ahead of annual general meetings in 2019,
Handelsbanken Fonder participated in the work
of 34 nomination committees. The boards pro-
posed by these committees saw only a marginal
increase in the proportion of women, from an
average of 34 per cent of board members in
2018, to 35 per cent in 2019. Although the aver-
age figure remains relatively unchanged, there
were major changes in many of the companies.
The proportion of female board members
increased in seven of the companies but, unfortu-
nately, decreased in nine. Going into the 2020
nomination committee season, we will be
increasing our focus on improving the gender
equality on the companies’ boards. Handels-
banken Fonder appointed women to 65 per cent
of the nomination committees we served on in
2019. We believe that this gives us a sound foot-
ing to increase the momentum towards achieving
gender-equal boards, but we remain humble,
considering the size of the task.
Corporate governance 2019 2018 2017
Nomination committees* 34 36 33
Shareholders’ meetings** 814 631 267
Handelsbanken Fonder 473 382 142
Xact Kapitalförvaltning 341 156 70
* Refers to Handelsbanken Fonder.
** No. of occasions. Each fund management company
votes independently. Thus, the total number of instances
may include shareholders’ meetings at which more than
one fund management company voted. The totals for
2017 and 2018 include Luxembourg. The fund manage-
ment operations in Luxembourg were discontinued in
December 2018.
For a summary of our voting activity, see the report at
handelsbanken.com/responsible-investments.
Incentive programmes
It has become more common for boards to
propose incentive programmes for senior man-
agement and employees in their companies.
Incentive programmes with share-related com-
ponents must always be decided by the share-
holders’ meeting. These programmes can be
complex and, in many cases, are not sufficiently
transparent. Together with Institutionella Ägares
Förening – IÄF (Institutional Owners Association
for Regulatory Issues in the Stock Market),
Handels banken Fonder has prepared a docu-
ment with guidelines for how these programmes
should be presented. The demands include clear-
cut goals, a transparent structure and outcomes,
and other existing programmes and remunera-
tion. We receive many enquiries from companies
about these programmes before they are pre-
sented at the shareholders’ meeting, and we
have detailed discussions about them. Before the
2019 meetings, we had 25 dialogues on this sub-
ject. In addition, we analysed around 30 other
programmes before voting.
Disputes and settlements
It may transpire that companies that the fund
management companies invest in, breach the
regulations in some way. This may be, for example,
a violation of the marketplace rules, a breach
of competition regulations, or activities which
constitute corruption. Such violations may result
in legal proceedings being brought against
the companies, often as a class action. These
processes are most often resolved through a
settlement, with the company being compelled
to compensate shareholders for losses incurred.
Settlements may also include demands for
changes in the company’s governance structure,
in the form of changes to the board of directors,
or, for example, new or amended internal rules or
control activities. The aim of monitoring and par-
ticipating in such processes and settlements is
that the investing funds receive compensation.
In 2019, a number of the funds managed by the
fund management company received a total of
around SEK 30 million from eight settlements in
class actions in the US.
CLIMATE-RELATED FINANCIAL
DISCLOSURES
Handelsbanken has published climate reports in
accordance with the TCFD recommendations.
Reports have been prepared for Handelsbanken
Liv, Handelsbanken Fonder and Xact Kapitalför-
valtning. The climate reports describe how each
organisation takes into consideration climate
change in the areas of governance, strategy, risk
management, targets and metrics. The results
are presented in the climate reports available at
handelsbanken.com/responsible-investments.
Read more under Facts: The Bank as an invest-
ment, on page 61.
FACTS: THE BANK AS AN EMPLOYER
Handelsbanken’s values and strong corporate
culture are vital to our success. Our concept of
how to run a successful bank is based on trust
and respect for the individual – both customers
and employees. The Bank’s decentralised way of
working creates commitment and opportunities
for every employee to make an impact on the
Bank’s operations.
STAFF TURNOVER
The Bank takes a long-term approach to relation-
ships with customers and employees. It sees
each recruitment as important and long term.
Employees with long experience and with broad
knowledge from the whole Bank make a vital con-
tribution to the Bank having satisfied customers.
External staff turnover was low for the six home
markets, at 4.9 per cent (3.8), and 3.7 per cent
(3.0) for Sweden. For the Group, it was 5.0 per
cent (3.9).
Handelsbanken promotes long-term employ-
ment by offering professional development for
every employee and opportunities to develop on
a personal level in different roles. If employment
ceases for any reason other than retirement, the
Bank can offer outplacement with the help of
external partners.
CONSTANT DEVELOPMENT
Employees must have the necessary skills to help
our customers in the best way possible, to pro-
vide advice based on customers’ needs, and to
comply with the current policies and regulations.
Each year, an individual competency mapping is
performed to identify any need for professional
development, based on current duties.
In 2019, several training programmes were
mandatory for all employees in the Group, cover-
ing anti-corruption, prevention of money launder-
ing and terrorist financing, and the General Data
Protection Regulation. New employees are
required to complete the Ethics and Sustainability
training course, which all other employees are
required to complete every second year.
HEALTH AND WORK ENVIRONMENT
Our overall goal for health and the work environ-
ment is that employees should be able to feel
good, develop and perform at optimal capacity.
To achieve our work environment goal, we target
a number of health factors.
The work environment survey is based on our
eight health factors, with five questions per factor.
Each question is answered on a scale from one to
four, where one means ‘Definitely not’ and four
means ‘Yes definitely’. See the table of key figures
on pages 49–50 for results from the Group’s work
environment surveys in 2019.
Guidelines and procedures are available for
dealing with and support in cases of poor health,
sickness or crisis situations. If additional expertise
is needed, the Bank has special agreements with
external service providers.
During 2019, 22 (26) cases of harassment
were investigated.
SICKNESS ABSENCE
The sickness absence rate for staff in the Bank’s
six home markets was 2.7 per cent (2.6). For staff
in Sweden, the rate was 3.0 per cent (3.1), of
which 1.2 per cent (1.3) referred to those on long-
term sick leave.
GENDER EQUALITY
The promotion of gender equality and diversity is
part of our core values and must be a natural and
integral part of our daily work. We aim to have an
SUSTAINABILITY REPORT | ADMINISTRATION REPORT
HANDELSBANKEN | ANNUAL REPORT 2019 57

Conditions and benefits differ within the Group
and are adapted to the markets where the Bank
operates and to the collective agreements which
have been entered into.
Employees’ total remuneration should help to
develop the Handelsbanken Group’s competitive-
ness and profitability by attracting, retaining and
developing skilled staff, and ensuring the Bank’s
management succession. This is stated in the
Bank’s remuneration policy, determined by the
Bank’s Board. The Board is responsible for the
policy being applied and takes decisions to follow
up on it. Once a year, the Bank’s remuneration
committee must make an assessment of the pol-
icy and the remuneration system and report it to
the Board.
Benefits and pensions
Handelsbanken offers various types of competi-
tive benefits, for both permanent and temporary
employees of the Group; these differ between the
countries. In 2019, the proportion of permanent
employees was 94 per cent (94).
Handelsbanken aims to make it easier for all
employees to combine employment with parent-
hood. The Bank subsidises home and family ser-
vices for employees in Sweden who have children
under the age of 12. In addition to current social
insurance regulations for parental leave, in most
of its home markets Handelsbanken provides
remuneration in accordance with local regula-
tions. This means that parents receive between
80 and 100 per cent of their salaries over a limited
period. Employees who take parental leave have
the same right to salary dialogue reviews as other
staff. Of those who took parental leave in 2019 in
the Bank’s home markets, 60 per cent (61) were
women and 40 per cent (39) men. Almost all of
these employees returned to work.
In the Bank’s home markets, employees are
offered credits on special terms. These credits are
mainly granted for financing residential property.
inclusive work environment, where we respect and
appreciate our different backgrounds, competen-
cies and experiences. The goal is also to create
and maintain an even gender balance within differ-
ent professional roles, working groups and units.
At year-end, 40 per cent (39) of managers in
the Group as a whole were women; the corre-
sponding figure for Sweden was 48 per cent (46).
Of the total number of employees in the Group,
50 per cent (49) were women; the corresponding
figure for Sweden was 52 per cent (52). All
managers at Handelsbanken have personnel
responsibility.
A few years ago, the Bank signed the Women
in Finance Charter in the UK, an initiative from HM
Treasury, entailing a commitment to work for a
more even gender balance in the financial sector.
Handelsbanken in the UK has set goals for
women in managerial positions: 30 per cent by
2021 and 40 per cent by 2026. In 2019, the pro-
portion of women managers in the UK increased
from 24 per cent to 26 per cent.
REMUNERATION AND BENEFITS
Handelsbanken aims to be an attractive employer
and offers competitive terms of employment for all
employees – temporary as well as permanent. In
addition to the benefits stipulated by law, regula-
tions, collective bargaining agreements and other
local agreements, we offer benefits that promote
our view of long-term employment, gender equal-
ity and participation in Handelsbanken’s results.
An attractive employer
Handelsbanken aims to meets its employees’
needs during various phases of their life in a flexi-
ble way. Collective bargaining agreements are the
foundation of the conditions the Bank offers to
both temporary and permanent employees. At
Handelsbanken, we have individual salaries which
are set in the salary dialogue review between
manager and employee conducted every year.
The terms and conditions differ between countries
depending on local circumstances, and in several
countries they are a taxable benefit.
Our employees’ health and their work environ-
ment are vital to ensuring that they feel good,
develop and perform at optimal capacity. The
Bank encourages this by granting subsidies for
various leisure activities.
Salary contributions to defined contribution pensions 2019
% Sweden 2 UK Norway 3 Denmark Finland 4
The
Netherlands
Salary contribution by employers 1 2 15.3 7/20 11 17.2 10.5
Salary contribution by employees,
average 0 1.8 0 5.3 6.8/8.3 0
Salary contributions to defined contribution pensions 2018
% Sweden 2 UK Norway 3 Denmark Finland 4The
Netherlands
Salary contribution by employers 1 2 15.3 7/20 11 17.8 14.2
Salary contribution by employees,
average 0 1.8 0 5.3 6.4/7.9 0
1 In Sweden, the UK, Norway and the Netherlands, less than 100 per cent of salary is pension-qualifying, as there is an upper limit.2 In Sweden, retirement pension plans are ‘defined benefit’. The premiums stated refer to defined contribution
supplementary pensions.3 For salaries corresponding to 0–7.1 Norwegian base amounts/For salaries corresponding to 7.1–12 Norwegian base amounts.4 Salary contributions refer to statutory public pensions. Salary contributions by employees are for up to/from 53 years of age.
Defined benefit pensions, pension commitments, and pension assets according to IAS 19 1
31 December 2019 31 December 2018
SEK m % SEK m %
Pension commitments 35 724 100 31 969 100
Earmarked pension assets 36 378 102 28 743 90
Assets part of Handelsbanken’s general
resources
- - 3 226 10
1 For more detailed information for 2019, see note G8.
0
20
40
60
80
100
20192018
%
Defined benefit Defined contribution
Proportion of employees in Handelsbanken’s home
markets who are covered by a retirement pension plan 1
1 Retirement pension plan refers here to both (statutory)
national retirement pensions and occupational pension plans
under local laws and regulations.
Age and gender breakdown 2019
0 200 400 600 800 1 000 1 200 1 400
–19
20–24
25–29
30–34
35–39
40–44
45–49
50–54
55–59
60–64
65–
Age
WomenNumber of employees Men
Gender breakdown – branch managers 2019
%
Women Men
0
20
40
60
80
100
Total branch
managers, home
markets
TheNether-lands
FinlandDenmarkNorwayUKSweden
%
35
40
45
50
55
60
65
20192018201720162015
Percentage of women in the Group
Percentage of men in the Group
Percentage of managers in the Group – women
Percentage of managers in the Group – men
Gender breakdown – Group
SUSTAINABILITY REPORT | ADMINISTRATION REPORT
58 HANDELSBANKEN | ANNUAL REPORT 2019
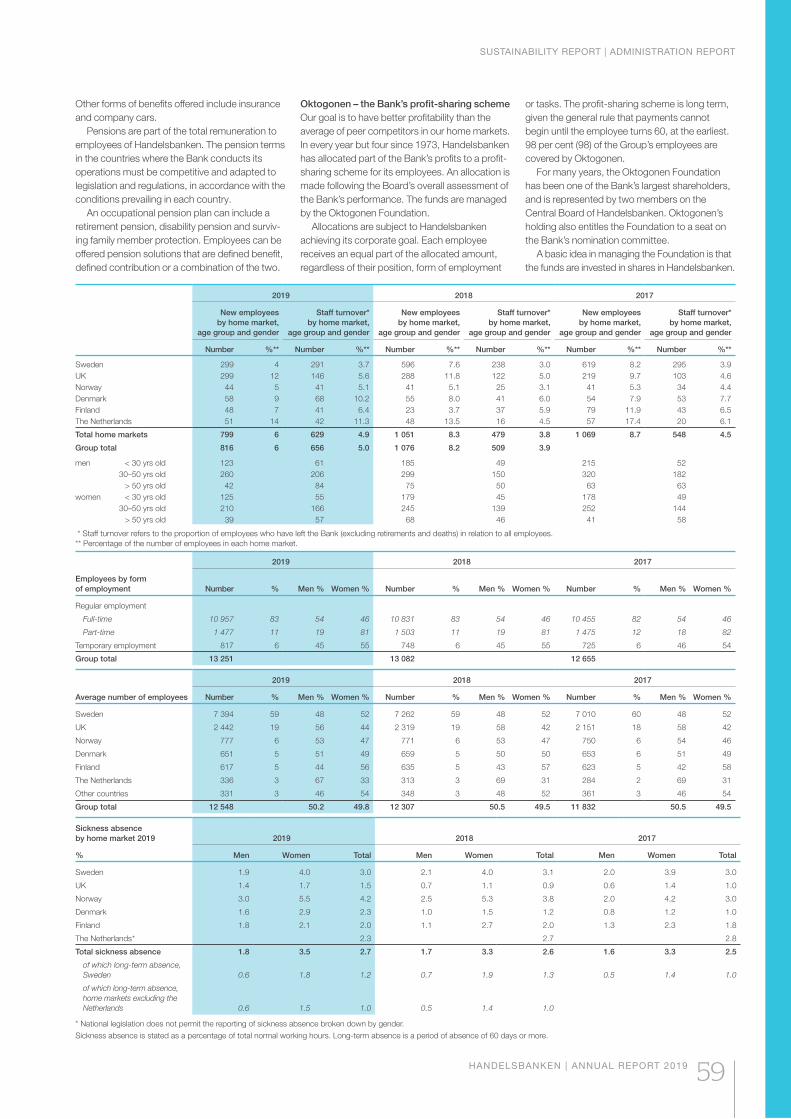
2019 2018 2017
New employees
by home market,
age group and gender
Staff turnover*
by home market,
age group and gender
New employees
by home market,
age group and gender
Staff turnover*
by home market,
age group and gender
New employees
by home market,
age group and gender
Staff turnover*
by home market,
age group and gender
Number %** Number %** Number %** Number %** Number %** Number %**
Sweden 299 4 291 3.7 596 7.6 238 3.0 619 8.2 295 3.9
UK 299 12 146 5.6 288 11.8 122 5.0 219 9.7 103 4.6
Norway 44 5 41 5.1 41 5.1 25 3.1 41 5.3 34 4.4
Denmark 58 9 68 10.2 55 8.0 41 6.0 54 7.9 53 7.7
Finland 48 7 41 6.4 23 3.7 37 5.9 79 11.9 43 6.5
The Netherlands 51 14 42 11.3 48 13.5 16 4.5 57 17.4 20 6.1
Total home markets 799 6 629 4.9 1 051 8.3 479 3.8 1 069 8.7 548 4.5
Group total 816 6 656 5.0 1 076 8.2 509 3.9
men < 30 yrs old 123 61 185 49 215 52
30–50 yrs old 260 206 299 150 320 182
> 50 yrs old 42 84 75 50 63 63
women < 30 yrs old 125 55 179 45 178 49
30–50 yrs old 210 166 245 139 252 144
> 50 yrs old 39 57 68 46 41 58
* Staff turnover refers to the proportion of employees who have left the Bank (excluding retirements and deaths) in relation to all employees.
** Percentage of the number of employees in each home market.
2019 2018 2017
Employees by form
of employment Number % Men % Women % Number % Men % Women % Number % Men % Women %
Regular employment
Full-time 10 957 83 54 46 10 831 83 54 46 10 455 82 54 46
Part-time 1 477 11 19 81 1 503 11 19 81 1 475 12 18 82
Temporary employment 817 6 45 55 748 6 45 55 725 6 46 54
Group total 13 251 13 082 12 655
2019 2018 2017
Average number of employees Number % Men % Women % Number % Men % Women % Number % Men % Women %
Sweden 7 394 59 48 52 7 262 59 48 52 7 010 60 48 52
UK 2 442 19 56 44 2 319 19 58 42 2 151 18 58 42
Norway 777 6 53 47 771 6 53 47 750 6 54 46
Denmark 651 5 51 49 659 5 50 50 653 6 51 49
Finland 617 5 44 56 635 5 43 57 623 5 42 58
The Netherlands 336 3 67 33 313 3 69 31 284 2 69 31
Other countries 331 3 46 54 348 3 48 52 361 3 46 54
Group total 12 548 50.2 49.8 12 307 50.5 49.5 11 832 50.5 49.5
Sickness absence
by home market 2019 2019 2018 2017
% Men Women Total Men Women Total Men Women Total
Sweden 1.9 4.0 3.0 2.1 4.0 3.1 2.0 3.9 3.0
UK 1.4 1.7 1.5 0.7 1.1 0.9 0.6 1.4 1.0
Norway 3.0 5.5 4.2 2.5 5.3 3.8 2.0 4.2 3.0
Denmark 1.6 2.9 2.3 1.0 1.5 1.2 0.8 1.2 1.0
Finland 1.8 2.1 2.0 1.1 2.7 2.0 1.3 2.3 1.8
The Netherlands* 2.3 2.7 2.8
Total sickness absence 1.8 3.5 2.7 1.7 3.3 2.6 1.6 3.3 2.5
of which long-term absence,
Sweden 0.6 1.8 1.2 0.7 1.9 1.3 0.5 1.4 1.0
of which long-term absence,
home markets excluding the
Netherlands 0.6 1.5 1.0 0.5 1.4 1.0
* National legislation does not permit the reporting of sickness absence broken down by gender.
Sickness absence is stated as a percentage of total normal working hours. Long-term absence is a period of absence of 60 days or more.
Other forms of benefits offered include insurance
and company cars.
Pensions are part of the total remuneration to
employees of Handelsbanken. The pension terms
in the countries where the Bank conducts its
operations must be competitive and adapted to
legislation and regulations, in accordance with the
conditions prevailing in each country.
An occupational pension plan can include a
retirement pension, disability pension and surviv-
ing family member protection. Employees can be
offered pension solutions that are defined benefit,
defined contribution or a combination of the two.
Oktogonen – the Bank’s profit-sharing scheme
Our goal is to have better profitability than the
average of peer competitors in our home markets.
In every year but four since 1973, Handelsbanken
has allocated part of the Bank’s profits to a profit-
sharing scheme for its employees. An allocation is
made following the Board’s overall assessment of
the Bank’s performance. The funds are managed
by the Oktogonen Foundation.
Allocations are subject to Handelsbanken
achieving its corporate goal. Each employee
receives an equal part of the allocated amount,
regardless of their position, form of employment
or tasks. The profit-sharing scheme is long term,
given the general rule that payments cannot
begin until the employee turns 60, at the earliest.
98 per cent (98) of the Group’s employees are
covered by Oktogonen.
For many years, the Oktogonen Foundation
has been one of the Bank’s largest shareholders,
and is represented by two members on the
Central Board of Handelsbanken. Oktogonen’s
holding also entitles the Foundation to a seat on
the Bank’s nomination committee.
A basic idea in managing the Foundation is that
the funds are invested in shares in Handelsbanken.
SUSTAINABILITY REPORT | ADMINISTRATION REPORT
HANDELSBANKEN | ANNUAL REPORT 2019 59
RELATIONSHIPS WITH UNIONS
Handelsbanken’s traditionally good relationships
and cooperation with unions are a valuable com-
ponent of the Bank’s culture. The Bank promotes
the right of all employees to join a trade union or
employee organisation. There is an ongoing,
close dialogue between union representatives
and managers concerning changes to the opera-
tions – such as organisational changes, new
products or the appointment of new managers.
All employees in Denmark, Finland, Germany,
Luxembourg, Norway and Sweden – comprising
76 per cent (77) of the Bank’s employees – are
covered by collective bargaining agreements. In
these countries, employees who are not members
of a union are also covered by the terms of the
collective agreement. In addition to collective
agreements, there are also other types of agree-
ments with local employees’ organisations, such
as works councils in the UK and the Netherlands.
In Sweden, Handelsbanken’s part-ownership
of BAO, the Employers’ Association of the Swed-
ish Banking Institutions means that, for matters
relating to, for example, the work environment
and pensions, the Bank is bound by collective
agreements with Finansförbundet (Financial Sec-
tor Union of Sweden) and various associations
which are affiliated to Saco, the Swedish Confed-
eration of Professional Associations. BAO also
has collective agreements with the Swedish Hotel
and Restaurant Workers’ Union and the Swedish
Building Maintenance Workers’ Union. The Bank
has also reached local agreements with Finans-
förbundet and Saco regarding the forms of
influence and co-determination. There is also a
work environment agreement between Handels-
banken and Finansförbundet, regulating areas
including security issues, roles and the allocation
of responsibilities, and the work environment
organisation. At the local level, there are joint work
environment committees comprised of members
representing both the Bank and Finansförbundet.
At the central level, there is a joint work environ-
ment and security committee, with representa-
tives from the Bank, Finansförbundet and Saco.
There are also work environment agreements
in Denmark, Finland and Norway. Similarly, these
agreements regulate security issues, roles and
the allocation of responsibilities, and the organi-
sation of the work environment.
As well as matters dealt with in a dialogue with
the union organisations at national level in each
country, there is also Handelsbanken’s European
Works Council (EWC), which serves as a forum
for joint and cross-border questions in the coun-
tries in Europe where the Group has operations.
The EWC consists of employee representatives
from nine countries: Denmark, Finland, Germany,
Luxembourg, the Netherlands, Norway, Poland,
Sweden and the UK.
FACTS: THE BANK’S BUSINESS CULTURE
Handelsbanken upholds good business ethics
and works systematically to take into account
new requirements and expectations, as well as to
integrate new regulations in daily operations.
Handelsbanken has a number of policies that
describe the Bank’s common view on, and
approach to, a variety of issues. The Bank’s web-
CONDUCT OF EMPLOYEES
The following are extracts from codes of conduct
included in policies and guidelines and refer to human
resources.
Handelsbanken’s employees
• must not be in a position where they may be sus-
pected of taking improper advantage of knowledge
about the financial markets which they obtain in the
course of their work
• must be familiar with legislation concerning trading
in financial instruments and observe the Bank’s
rules for employees’ private securities and currency
transactions
• must, in their work at the Bank and in their private
affairs, refrain from business transactions that violate
the Bank’s rules or current legislation
• must refrain from transactions or other commit-
ments that could seriously jeopardise their personal
financial position
• are not permitted to process transactions in which
they, or persons closely associated with them, have
a personal interest – this also applies to companies
in which employees, or persons closely associated
with them, are involved
• must notify compliance or Group Audit if they
suspect irregularities at the Bank. Handelsbanken’s
separate whistleblowing system provided by an
external supplier may be used as well as these
reporting channels
• must notify the Bank of assignments outside
the Bank and obtain approval – this also applies to
secondary occupations and certain posts in clubs,
societies and the like.
site also has the full texts of the policy for sustain-
ability, policy for ethical standards, policy for man-
agement of conflicts of interest and policy against
corruption as well as summaries of other policies in
the Handelsbanken Group. In addition, a selection
of guidelines adopted by Handelsbanken’s Group
Chief Executive is available on the Bank’s website.
COMPLIANCE AND CONFIRMED INCIDENTS
Banking operations are regulated and governed
by extensive laws and regulations. If a bank does
not comply with these, the responsible supervi-
sory authority can decide on administrative fines
and, in the worst case, revoke the banking
licence. Administrative fines may be imposed on
banks for breaches such as corruption, faulty
product or service information or labelling, or non-
compliance with laws or regulations in the social
or economic spheres. In 2019, 0 (1) confirmed
incidents occurred. The European Securities and
Markets Authority (ESMA) decided in 2018 that
Handelsbanken had issued credit ratings without
being authorised to do so, and imposed a fine of
EUR 495,000. The Bank appealed against the
decision. The Board of Appeal found in March
2019 that the Bank had not acted negligently, and
ruled that the fine amount was to be refunded.
POLICY FOR ETHICAL STANDARDS
The policy for ethical standards is reviewed at
least once a year by the Board. The review begins
with any changes made in the relevant legislation
but also covers changes in external expectations,
the Bank’s experience from ongoing internal
work, and observations from the Bank’s compre-
hensive internal control.
GUIDELINES FOR MANAGING TAXES
Handelsbanken’s actions regarding tax-related
matters must be responsible and transparent and
must comply with prevailing laws and regulations.
At Handelsbanken, high ethical standards
must always be observed, as regulated in policy
documents from the Board.
Internal and external transactions carried out
by the Bank within the framework of its own oper-
ations must always have a business purpose and
must not be carried out for tax purposes only.
Services and products provided by the Bank
must always have a business purpose, and the
Bank must never provide products or services
where the primary purpose is to obtain tax bene-
fits in conflict with the intent of tax regulations.
The Bank must not participate in transactions
with customers, through granting credits or
otherwise, which constitute a step in tax evasion
or in transactions with no business purpose,
undertaken only to obtain tax advantages in
conflict with the objective of the tax regulations.
This also applies in relation to suppliers and other
business partners. If there is doubt, Handels-
banken must refrain from participating.
POLICY FOR SUSTAINABILITY
In 2016, Handelsbanken’s Board adopted a pol-
icy for sustainability that sets the direction for the
Bank’s work and clearly sets out the Bank’s view
of sustainability. The policy applies throughout
the Handelsbanken Group and encompasses all
activities in relation to customers, suppliers and
other business partners.
WORK TO PREVENT FINANCIAL CRIME
At least once a year, Handelsbanken’s Board and
CEO establish a Group-wide policy and guide-
lines that serve as the framework for the Bank’s
actions to prevent financial crime, which include
anti-money laundering and terrorist financing. The
function responsibility for work to prevent financial
crime is held by a central department which must
ensure that there is competency in and awareness
of these areas throughout the Group. The opera-
tional responsibility for work to prevent financial
crime lies with each country’s general manager.
CONFLICTS OF INTEREST, CORRUPTION,
BRIBERY AND IMPROPER INFLUENCE
Handelsbanken has established procedures for
managing conflicts of interest with the aim of
preventing negative impact on customers’ inter-
ests. The Bank’s policy for management of con-
flicts of interest provides further guidance for the
Bank’s work in this area, for example, by listing
areas where conflicts of interest could arise in our
operations. The policy includes details on the
procedure for identifying and managing conflicts
of interest. For example, potential conflicts of
interest, as well as how they have been man-
aged, must be reported each year by units
deemed to have a greater probability of conflicts
of interest.
All unit heads must annually review with their
employees the regulations applying to bribery and
improper influence. The regulations must be
SUSTAINABILITY REPORT | ADMINISTRATION REPORT
60 HANDELSBANKEN | ANNUAL REPORT 2019
followed in all contexts, such as gifts, corporate
hospitality and other events. The department
responsible for actions to prevent financial crime
performs a Group-wide risk assessment at least
once a year in the area of financial crime, which
includes corruption. Areas where the risk of cor-
ruption is assessed to be higher than for normal
customers are, for example, customers who
operate in countries or sectors where corruption
occurs more frequently, and also products and
services used by these customers, such as
cross-border payments. In addition, at least once
a year every unit must perform a self-assessment
of operational risk which includes the area of
corruption. Security reviews are also performed
every year and contain a training and information
section on corruption.
Handelsbanken’s anti-corruption policy states
that all Bank employees must complete a course
on corruption, bribery and improper influence on
an annual basis. Each year, the Bank’s employees
complete a training programme on ethical stand-
ards and sustainability that has sections dealing
with conflicts of interest, corruption, and anti-
money laundering and counter-terrorist financing
(AML/CTF). Handelsbanken’s Central Board and
the boards of the Bank’s subsidiaries have also
received training.
SUPPLIERS
The Group’s purchases can largely be catego-
rised as property and premises, external IT costs,
communications, travel and marketing, pur-
chased services, procurement of materials or
other expenses. External IT costs and communi-
cations are purchased centrally, chiefly from
suppliers which operate internationally. Other
categories are usually purchased mainly from
local suppliers. We work to co-ordinate the
Bank’s purchases over national borders, to take
into account cost effects, quality and environ-
mental impact.
The Bank holds ongoing dialogues with suppli-
ers where sustainability is a key factor. Among
other things, we research whether the supplier
has collective agreements and policies regarding
the work environment, anti-corruption and
environmental impact. In 2016, Handelsbanken
implemented a code of conduct for major suppli-
ers in Sweden, which is now also being rolled out
to the other home markets. The code defines the
expectations we have of our suppliers and their
subcontractors. Most of these expectations are
based on internationally accepted standards,
starting with the UN Global Compact. Among
other things, the Bank requires that suppliers
eliminate and combat all forms of human trafficking,
modern slavery and compulsory labour, that they
are not involved whatsoever in any form of child
labour, and that they ensure that they do not
violate human rights. Results have been promis-
ing, and many of the Bank’s major suppliers have
signed the code. For the Swedish operations, a
project is under way to ensure that all suppliers
providing facility services sign the Bank’s code of
conduct.
We see a positive link between the code and
our relationships with suppliers as well as its
direct impact on our sustainability activities.
Handelsbanken’s Supplier Code of Conduct is
available at handelsbanken.com/sustainability.
PRINCIPLES WHEN GRANTING CREDIT
Sustainability aspects are a vital part of the Bank’s
credit policy. The policy states that the Bank’s
lending must be responsible and meet high
demands for sound ethical standards. When
granting credit, Handelsbanken must assess and
evaluate the customer’s approach to the princi-
ples and agreements supported by the Bank.
This can result in Handelsbanken ultimately
declining to grant credit to companies that do
not apply these principles.
FACTS: THE BANK AS AN INVESTMENT
PUBLIC LIMITED COMPANY
Handelsbanken is a Swedish public limited com-
pany, which means that the public can invest in
the Bank by buying and selling shares on the
open market. Handelsbanken’s shares are traded
on several different marketplaces. Turnover is
largest on Nasdaq Stockholm (the Stockholm
stock exchange), but for several years, the shares
have also been traded on other stock exchanges.
Handelsbanken has over 120,000 shareholders.
DIVIDEND
The Bank’s dividend policy is that the dividend
level must not lead to the capital ratios falling
below a level of one percentage point above the
requirements communicated by the Swedish
Financial Supervisory Authority. For more than
25 years, including during the most recent finan-
cial crisis, Handelsbanken has paid a dividend to
its shareholders.
CREATING SHAREHOLDER VALUE
During the past five-year period, Handelsbanken
has generated a positive shareholder value of
SEK 25 billion. Market capitalisation has decreased
by SEK 33 billion, while the Bank has paid out
SEK 58 billion in dividends to shareholders.
Dividends of SEK 10.9 billion (10.7) are proposed
for 2019.
TCFD – TASK FORCE ON CLIMATE-RELATED
FINANCIAL DISCLOSURES
Climate change caused by global warming is one
of the greatest challenges of our age. Global
emissions of greenhouse gases have to be
reduced if their effects are to be prevented. For
this to be possible, major changes are required
to global consumption patterns, transport and
energy production, which will have an increasingly
significant impact on the global economy. This
will, in turn, have consequences for companies in
numerous sectors, including financial services.
Climate change means that companies and
whole sectors are exposed to new types of risks,
climate-related risks, but the transition to a low-
carbon economy as envisaged in the Paris Agree-
ment also gives rise to business opportunities.
Increased transparency, with more information on
how companies work with and manage these
risks and opportunities, is thus becoming more
and more important for both customers and
investors. This information is needed, alongside
traditional financial disclosures, to assess a
company’s value and position in the market.
Supervisory authorities and legislators are also
emphasising the importance of companies add-
ing information on climate-related risks to their
reporting. In recent years, supervisory authorities
have more clearly included climate-related risks in
their supervision of banks and other financial
institutions. The TCFD recommendations have
become a global guidepost in the work with climate-
related information. The recommendations were
published in 2017 by the TCFD international
working group, together with a presentation on
how companies are to report information relating
to their work on the management of climate-
related risks and opportunities.
The recommendations are based on four core elements:
Governance Description of how climate-related matters
are managed by the company’s board and
management.
Strategy Description of the company’s strategy for
climate change and the transition to a low-
carbon society, as well as the risks and
opportunities identified, including scenario
analyses.
Risk
management
Description of processes used to identify,
assess and manage climate-related risks and
business opportunities.
Metrics and
targets
Reporting of relevant metrics and targets.
Handelsbanken endorses the TCFD’s recommen-
dations, and both Handelsbanken Asset Manage-
ment and Handelsbanken Liv have published
climate reports in line with the recommendations.
Read more on page 55 under Facts: Responsible
investment.
As the first stage of the work to integrate the
TCFD’s recommendations into the Bank’s credit
portfolio, a review of our lending to energy pro-
duction was carried out as early as 2017. Read
more about the result on page 55 under Facts:
Responsible financing.
In 2019, Handelsbanken continued its work
to map and review the Bank’s various processes
for the assessment, management and reporting
of climate-related risks and opportunities, in order
to identify work outstanding to fully align with
TCFD’s recommendations. The Bank has engaged
external experts to provide ancillary support in
this work. The future work mainly entails reformulat-
ing and adding to policy documents and instruc-
tions to increase the level of awareness regarding
climate-related risks – both physical risks and
transition risks – and how they affect different
sectors, as well as calculating the climate impact
of the Bank’s credit portfolio.
SUSTAINABILITY REPORT | ADMINISTRATION REPORT
HANDELSBANKEN | ANNUAL REPORT 2019 61
Corporate Governance Report
Handelsbanken is a Swedish public limited company, whose shares are listed on Nasdaq Stockholm. Here the Board submits its Corporate Governance Report for 2019. Handelsbanken applies the Swedish Code of Corporate Governance with no deviations.
FRAMEWORK FOR CONTROL 69
Internal control for operations 69
Group Compliance 69
Group Risk Control 70
Group Audit 70
POLICY DOCUMENTS 70
PRINCIPLES FOR REMUNERATION AT HANDELSBANKEN 72
Fixed remuneration 72
Variable remuneration 72
Principles for remuneration to executive officers 72
THE BOARD’S REPORT ON INTERNAL CONTROL REGARDING FINANCIAL REPORTING 73
Control environment 73
Risk assessment 73
Control activities 73
Information and communication 73
Follow-up 73
THE BOARD 74
EXECUTIVE MANAGEMENT 76
CONTENTS
CORPORATE GOVERNANCE STRUCTURE 64
CORPORATE GOVERNANCE AT HANDELSBANKEN 66
The Bank’s culture and long-term goal 66
Application of the Swedish Corporate Governance Code 66
General information on the regulation and supervision of banks 66
SHAREHOLDERS AND SHAREHOLDERS’ MEETINGS 66
Rights of shareholders 66
Major shareholders 66
Annual General Meeting 2019 66
Auditors 67
NOMINATION COMMITTEE 67
Recruitment and diversity-related work 67
THE BOARD 67
Composition of the Board 67
Independence of Board members 67
Regulations governing the Board’s work 68
Chairman of the Board 68
The Board’s work in 2019 68
Committee work 68
THE BANK’S MANAGEMENT 68
Group Chief Executive 68
Executive management 69
Decision-making process 69
Risk Forum 69
Operational structure 69
Branch operations 69
63
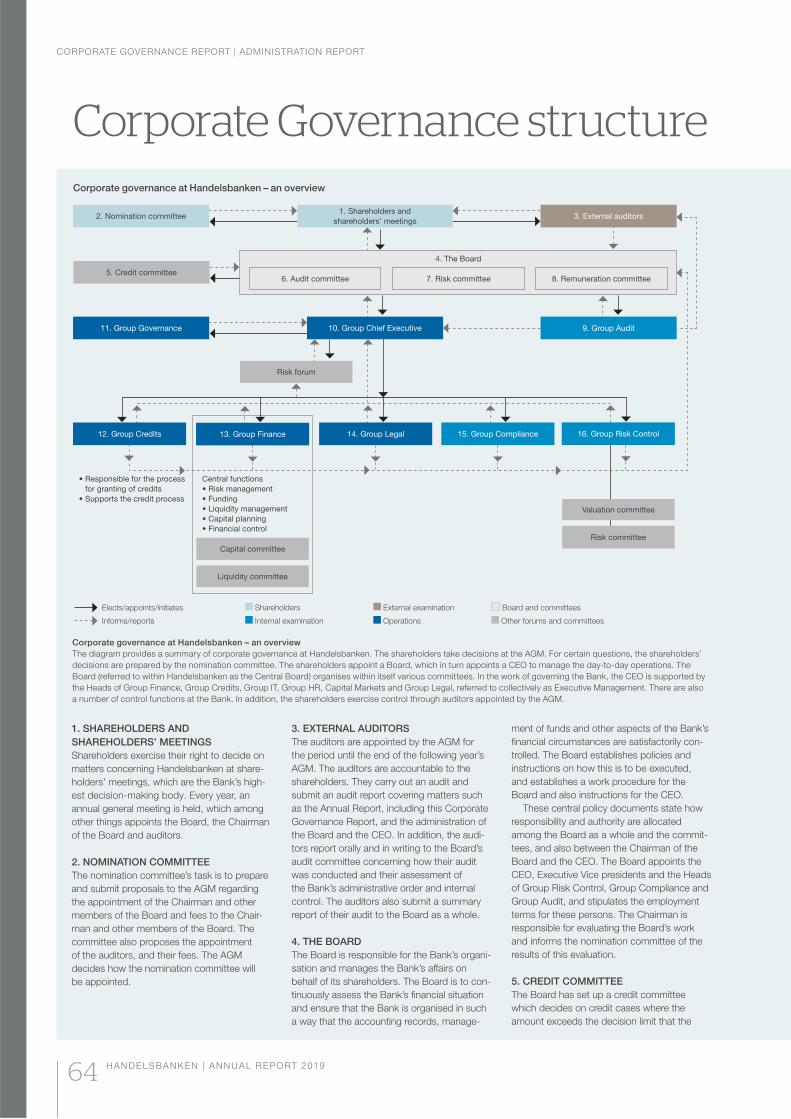
Corporate governance at Handelsbanken – an overview
9. Group Audit11. Group Governance
Risk forum
Capital committee
Valuation committee
Liquidity committee
Risk committee
4. The Board
2. Nomination committee 3. External auditors
10. Group Chief Executive
1. Shareholders and
shareholders’ meetings
5. Credit committee6. Audit committee 8. Remuneration committee7. Risk committee
13. Group Finance 14. Group Legal 15. Group Compliance12. Group Credits 16. Group Risk Control
Central functions
• Risk management
• Funding
• Liquidity management
• Capital planning
• Financial control
• Responsible for the process
for granting of credits
• Supports the credit process
Corporate governance at Handelsbanken – an overview
The diagram provides a summary of corporate governance at Handelsbanken. The shareholders take decisions at the AGM. For certain questions, the shareholders’
decisions are prepared by the nomination committee. The shareholders appoint a Board, which in turn appoints a CEO to manage the day-to-day operations. The
Board (referred to within Handelsbanken as the Central Board) organises within itself various committees. In the work of governing the Bank, the CEO is supported by
the Heads of Group Finance, Group Credits, Group IT, Group HR, Capital Markets and Group Legal, referred to collectively as Executive Management. There are also
a number of control functions at the Bank. In addition, the shareholders exercise control through auditors appointed by the AGM.
CORPORATE GOVERNANCE REPORT | ADMINISTRATION REPORT
64 HANDELSBANKEN | ANNUAL REPORT 2019
Corporate Governance structure
1. SHAREHOLDERS AND
SHAREHOLDERS’ MEETINGS
Shareholders exercise their right to decide on
matters concerning Handelsbanken at share-
holders’ meetings, which are the Bank’s high-
est decision-making body. Every year, an
annual general meeting is held, which among
other things appoints the Board, the Chairman
of the Board and auditors.
2. NOMINATION COMMITTEE
The nomination committee’s task is to prepare
and submit proposals to the AGM regarding
the appointment of the Chairman and other
members of the Board and fees to the Chair-
man and other members of the Board. The
committee also proposes the appointment
of the auditors, and their fees. The AGM
decides how the nomination committee will
be appointed.
3. EXTERNAL AUDITORS
The auditors are appointed by the AGM for
the period until the end of the following year’s
AGM. The auditors are accountable to the
shareholders. They carry out an audit and
submit an audit report covering matters such
as the Annual Report, including this Corporate
Governance Report, and the administration of
the Board and the CEO. In addition, the audi-
tors report orally and in writing to the Board’s
audit committee concerning how their audit
was conducted and their assessment of
the Bank’s administrative order and internal
control. The auditors also submit a summary
report of their audit to the Board as a whole.
4. THE BOARD
The Board is responsible for the Bank’s organi-
sation and manages the Bank’s affairs on
behalf of its shareholders. The Board is to con-
tinuously assess the Bank’s financial situation
and ensure that the Bank is organised in such
a way that the accounting records, manage-
ment of funds and other aspects of the Bank’s
financial circumstances are satisfactorily con-
trolled. The Board establishes policies and
instructions on how this is to be executed,
and establishes a work procedure for the
Board and also instructions for the CEO.
These central policy documents state how
responsibility and authority are allocated
among the Board as a whole and the commit-
tees, and also between the Chairman of the
Board and the CEO. The Board appoints the
CEO, Executive Vice presidents and the Heads
of Group Risk Control, Group Compliance and
Group Audit, and stipulates the employment
terms for these persons. The Chairman is
responsible for evaluating the Board’s work
and informs the nomination committee of the
results of this evaluation.
5. CREDIT COMMITTEE
The Board has set up a credit committee
which decides on credit cases where the
amount exceeds the decision limit that the
Elects/appoints/initiates Shareholders External examination Board and committees
Informs/reports Internal examination Operations Other forums and committees
CORPORATE GOVERNANCE REPORT | ADMINISTRATION REPORT
HANDELSBANKEN | ANNUAL REPORT 2019 65
Central Board has delegated to another unit.
However, cases of special importance and
credits to Board members and certain persons
in managerial positions are decided upon by the
Board as a whole. A representative from the unit
within the Bank to which the credit case applies
presents the case to the credit committee.
6. AUDIT COMMITTEE
The Board’s audit committee monitors the
Bank’s financial reporting by examining impor-
tant accounting matters and other factors that
may affect the qualitative content of the finan-
cial reports. The committee also monitors the
effectiveness of the Bank’s and Group’s inter-
nal control, internal audit and risk management
with regard to financial reporting, as well as the
external auditors’ impartiality and independ-
ence. It evaluates the audit work and assists
the nomination committee in appointing audi-
tors. The committee also receives reports from
the Bank’s internal and external auditors.
7. RISK COMMITTEE
The Board’s risk committee monitors risk
control and risk management in the Handels-
banken Group. The committee prepares deci-
sions regarding the Bank’s risk strategy, risk
tolerance, etc., and examines reports from
Group Compliance and Group Risk Control.
8. REMUNERATION COMMITTEE
The Board’s remuneration committee evaluates
the employment conditions for the Bank’s
executive officers in the light of prevailing
market terms. The committee’s tasks include
preparing the Board’s proposals to the AGM
concerning guidelines for remuneration to
executive officers, monitoring and evaluating
the application of these guidelines, and prepar-
ing the Board’s decisions on remuneration
and other terms of employment for executive
officers, as well as for the Head of Group Audit.
The committee also makes an assessment of
Handelsbanken’s remuneration policy and
remuneration system.
9. GROUP AUDIT
Group Audit (internal audit) performs an inde-
pendent, impartial audit of the operations and
financial reporting of the Group. A key task for
Group Audit is to assess and verify processes
for risk management, internal control and cor-
porate governance. The Chief Audit Officer is
appointed by the Board and reports regularly
to the audit committee, orally and in writing,
and also submits an annual summary report
to the whole Board.
10. PRESIDENT AND GROUP CHIEF
EXECUTIVE (CEO)
The CEO is appointed by the Board to lead
Handelsbanken’s day-to-day operations. In
addition to instructions from the Board, the
CEO is obliged to comply with the provisions
of the Swedish Companies Act and a number of
other statutes concerning the Bank’s account-
ing, management of funds and operational
control.
11. GROUP GOVERNANCE
Group Governance, the corporate governance
unit, ensures that decisions made at share-
holders’ meetings and by the Board, as well
as changes in legislation, regulations and cor-
porate governance code, are implemented in
policy documents from the Board and internal
guidelines and instructions from the CEO, with
the aim of stipulating overall responsibilities
and authorities internally at the Bank.
12. GROUP CREDITS
Group Credits is responsible for formulating
and maintaining the Bank’s credit process,
and for preparing every major credit case that
the Board’s credit committee or the Board as
a whole decides on. The head of the depart-
ment, Handelsbanken’s Chief Credit Officer,
reports to the CEO and is a member of the
credit committee established by the Board.
The Chief Credit Officer also reports to the
Board about losses and risks in the credit
portfolio.
13. GROUP FINANCE
Group Finance is responsible for control sys-
tems, reporting, bookkeeping, accounting and
taxes. It is also responsible for the Group’s
liquidity, funding, and capital and for the
Group’s overall risk management regarding
financial risk, liquidity risk, and insurance risk.
For a detailed description of this risk manage-
ment, see note G2 on pages 96–133. The
Head of Group Finance, Handelsbanken’s
CFO, reports to the CEO and also regularly
reports on behalf of the CEO to the Board’s
audit committee and risk committee and,
regarding market risks, liquidity, funding and
capital, to the Board as a whole.
14. GROUP LEGAL
Group Legal is responsible for legal matters
within the Group and provides other units
with legal advisory services. The department
monitors developments as regards regulations,
laws, standards and guidelines in Handels-
banken’s home markets.
15. GROUP COMPLIANCE
The primary responsibilities of the Compliance
function are to work actively to ensure a high
level of compliance within the Group and to
ensure that Handelsbanken’s low tolerance
of risks linked to non-compliance is fulfilled.
The Compliance function also manages public
authority contacts related to supervisory cases.
The function provides advice and support
about compliance to the employees, CEO and
Board of the Group, and continually informs
the units concerned about the risks which may
arise in the operations due to inadequate com-
pliance.
The function informs and trains employees
affected by new or changed rules. The Compli-
ance function also identifies the risks that the
Group will not meet its obligations under regu-
lations, laws and other rules for operations that
are subject to a licence. It also checks and
monitors that these risks are being managed by
the units concerned, and also submits reports
in accordance with established procedures.
The Group has a compliance manager who
reports directly to the CEO and who leads the
Compliance function in the Group, and is also
ultimately responsible for reporting on regula-
tory compliance. The Compliance function is
independent and organisationally separated
from the functions and areas to be monitored
and controlled. The Head of Group Compli-
ance reports regularly to the CEO, the risk
committee and the Board on matters regarding
compliance.
16. GROUP RISK CONTROL
Group Risk Control is responsible for monitor-
ing and reporting all the Group’s material risks
at an aggregate level. This responsibility com-
prises credit and market risks (interest rate,
exchange rate, equity price and commodity
price risk), operational risk, liquidity risks and
insurance risks, as well as risks associated
with the Group’s remuneration system. Group
Risk Control reports continually to the CEO
and on a regular basis to the risk committee,
the remuneration committee and the Board.
The Head of Group Risk Control, Handels-
banken’s Chief Risk Officer, also provides infor-
mation to the CFO on an ongoing basis. Group
Risk Control reports directly to the CEO, acts
independently, and is separate from the
operations under review. Group Risk Control
has function responsibility for all risk control in
the Group.
More informationMore information about Handels-
banken’s corporate governance is available
at handelsbanken.com. The site includes
the following information:
• Previous years’ corporate governance
reports from 2008
• Articles of Association
• Information about the nomination
committee
• Minutes from shareholders’ meetings
from 2008 onwards.
CORPORATE GOVERNANCE REPORT | ADMINISTRATION REPORT
66 HANDELSBANKEN | ANNUAL REPORT 2019
CORPORATE GOVERNANCE
AT HANDELSBANKEN
Corporate governance concerns how rights and
obligations are allocated among the various
bodies of the Bank, in accordance with prevailing
laws and regulations. Corporate governance also
encompasses the systems for decision-making,
and the structure through which shareholders
control the Bank, directly and indirectly. Handels-
banken’s shareholders exercise corporate govern-
ance principally by electing the Board. The Board
appoints and gives instructions to the CEO.
The following are fundamental to corporate
governance at Handelsbanken: on the one hand
the Articles of Association and documents
adopted by the Board, for example the Board’s
rules of procedure, instructions to the CEO and
the Chief Audit Officer, credit instructions and
policy documents regarding the Bank’s opera-
tions (see also pages 70 –72), and, on the other
hand, the instructions and guidelines issued by
the CEO. These documents are revised every
year, and whenever deemed necessary.
However, the foundation of functioning corpo-
rate governance is not only formal documents but
also the Bank’s corporate culture, corporate goal,
working methods and remuneration system.
A central part of governance of Handels-
banken comprises managing the risks that arise
in operations. Risk management is described in
detail in a separate risk section in the Annual
Report, note G2 on pages 96 –133, in the Bank’s
Pillar 3 report, and also briefly in this Corporate
Governance Report.
The Bank’s culture and long-term goal
Handelsbanken’s corporate goal is to have better
profitability than the average of peer competitors
in its home markets. This is mainly to be achieved
by having more satisfied customers and lower
costs. One of the purposes of this goal is to offer
shareholders long-term high growth in value.
Handelsbanken has a decentralised work
method and a strong local presence due to its
nationwide branch networks and a long-term
approach to customer relations. The Bank’s
decentralised working model involves profound
trust in employees’ willingness and ability to take
responsibility. This working model has been con-
sistently applied for decades and has resulted in
the Bank’s very strong corporate culture.
The Oktogonen profit-sharing scheme sharp-
ens the employees’ focus on profitability, and is
thus a method of reinforcing a corporate culture
that is characterised by cost-awareness and pru-
dence. Provisions for the Oktogonen scheme are
made if Handelsbanken’s profitability is better than
the average of peer competitors in Handels-
banken’s home markets, and following an overall
assessment of the Bank’s performance by the
Board.
Handelsbanken takes a long-term view of both
its employees and its customers. The Bank
wishes to recruit young employees for long-term
employment at the Bank by offering development
opportunities that make the Bank self-sufficient in
terms of skilled employees and managers.
This long-term approach also applies to the
way in which the Bank relates to its customers.
It is manifested in, for example, the ambition of
always giving the customer the best possible
advice – without looking at what is most profita-
ble for the Bank in the short term. In this manner,
the Bank builds long-term relationships with both
customers and employees.
Application of the Swedish Corporate
Governance Code
Handelsbanken applies the Swedish Corporate
Governance Code with no deviations. The code
is available on the Swedish Corporate Govern-
ance Board’s website, bolagsstyrning.se.
General information on the regulation and
supervision of banks
The operations of Swedish banks are regulated
by law, and banking operations may only be run
with a licence from the Swedish Financial Super-
visory Authority.
The regulations for banking operations are
very extensive, and are not described in detail in
this report. A list of the key regulations is availa-
ble on the Swedish Financial Supervisory Author-
ity’s website. Handelsbanken’s main principle is
that operations outside Sweden are subject both
to Swedish regulations and to the host country’s
regulations, if these are stricter or require devia-
tions from Swedish rules.
The Swedish Financial Supervisory Authority
extensively supervises the Bank’s operations in
Sweden and in all countries where the Bank runs
branches, in other words, when the foreign oper-
ation is part of the Swedish legal entity Svenska
Handelsbanken AB. The supervisory work is
co-ordinated in a supervisory group for Handels-
banken, led by the Swedish Financial Super-
visory Authority. Equivalent authorities in other
countries exercise limited supervision over the
branches’ operations, but have full supervision
over the Bank’s subsidiaries outside Sweden.
In addition to laws and ordinances, the Swed-
ish supervision is also based on regulations and
general guidelines from the Swedish Financial
Supervisory Authority. The Supervisory Authority
requires extensive reporting on various matters
such as the Bank’s organisation, decision-
making structure and internal control.
The Supervisory Authority’s work also includes
systematically visiting various parts of the Bank.
The purpose of this is to follow up the Bank’s
actual compliance with the terms and conditions
of granted licences and other detailed regula-
tions.
SHAREHOLDERS AND SHAREHOLDERS’
MEETINGS
Rights of shareholders
At the end of 2019, Handelsbanken had over
120,000 shareholders. They have the right to
decide on matters related to the company at the
AGM or extraordinary meetings of shareholders.
Handelsbanken has two classes of shares: class
A and class B. Class A shares are by far the
most common and represented more than 98
per cent of all outstanding shares at the end of
2019. Each class A share entitles the holder to
one vote, while each class B share entitles the
holder to one-tenth of a vote. Handelsbanken’s
Articles of Association state that at shareholders’
meetings, no shareholder is allowed to exercise
voting rights representing more than 10 per cent
of the total number of votes in the Bank. Class A
shares and class B shares entitle holders to the
same proportion of the profit.
Shareholders who wish to have a matter
considered by the AGM must submit a written
request to the Board sufficiently far in advance
so that the matter can be included in the
notice of the meeting. The Bank’s website,
handelsbanken.com, contains information as to
when this request must have reached the Board.
At the AGM, the Bank’s shareholders make
various decisions of major importance to the
Bank’s governance. Shareholders’ decisions
include:
• adopting the income statement and balance
sheet
• appropriation of profits
• discharge from liability for the Board and the
CEO for the past financial year
• how many members should be on the Board
of the Bank, who these members should be,
and who should be the Bank’s auditors
• determining fees to Board members and
auditors
• principles for remuneration to executive officers.
The shareholders at a shareholders’ meeting can
also make decisions on the Bank’s Articles of
Association. The Articles of Association consti-
tute the fundamental governing document for the
Bank. They specify which operations the Bank is
to conduct, the limits on the amount of share
capital, the right of shareholders to participate at
shareholders’ meetings and the items to be pre-
sented at the AGM. The Articles of Association
state that the number of board members must
be at least eight and at most 15. They are
elected for one year at a time. Handelsbanken’s
Articles of Association contain no stipulation
regarding the appointment and discharging of
board members nor concerning amendments to
the Articles of Association.
Information in preparation for meetings is pub-
lished at handelsbanken.com. Minutes of previ-
ous meetings are also available there in both
Swedish and English.
Major shareholders
At the end of 2019, the holdings of two share-
holders represented more than 10 per cent of the
votes: The Oktogonen Foundation, with 10.5 per
cent, and AB Industrivärden, with 10.6 per cent.
Detailed information on the Bank’s largest Swed-
ish shareholders can be found on page 41.
Annual General Meeting 2019
The annual general meeting took place on 27
March 2019.
Over 1,600 shareholders were represented at
the meeting. They represented almost 56.2 per
cent of all votes in the Bank. All board members
except one were present at the meeting. Also
participating were Helena Stjernholm, nomination
committee chair, as well as Jesper Nilsson of
Ernst & Young AB and Johan Rippe of Pricewa-
terhouseCoopers AB, the auditors-in-charge
from the auditing companies elected by the
AGM. The chairman of the meeting was Sven
Unger, a lawyer.

CORPORATE GOVERNANCE REPORT | ADMINISTRATION REPORT
HANDELSBANKEN | ANNUAL REPORT 2019 67
The decisions made by the shareholders at the
meeting included:
• An ordinary dividend of SEK 5.50 per share.
• Authorisation for the Board to decide on acqui-
sition of not more than 120 million shares in the
Bank, as well as divestment of shares.
• The Board is to consist of 11 members.
• The re-election of 10 Board members and the
election of one new Board member, Carina
Åkerström, for the period until the conclusion
of the next AGM.
• The election of Pär Boman as Chairman of the
Board.
• Fees to be paid to the Board members: SEK
3,400,000 to the Chairman of the Board, SEK
970,000 to the Deputy Chair, and SEK 690,000
to the other Board members. Fees to be paid
for committee work to each member of the
respective committee: SEK 400,000 for the
credit committee, SEK 140,000 for the remu-
neration committee, SEK 400,000 for the risk
committee and SEK 400,000 for the audit
committee. It was decided that the fee to the
chairperson of the risk committee would be
SEK 450,000, and that the fee to the chairper-
son of the audit committee would be SEK
500,000. Board members who are employees
of Handelsbanken shall not receive a fee.
• The AGM appointed Ernst & Young AB (re-
election) and PricewaterhouseCoopers AB (re-
election) to serve as auditors until the end of
the AGM to be held in 2020.
The shareholders at the meeting also adopted
the following guidelines for remuneration and
other terms of employment for executive officers,
as proposed by the Board:
• The total remuneration is to be on market
terms.
• Remuneration is only paid in the form of a fixed
salary, pension provision and customary bene-
fits.
• By special decision of the Board, the Bank can
provide housing.
• Variable remuneration benefits, such as
bonuses or commission on profits, are not paid.
• The executive officers in question are included
in the Oktogonen profit-sharing scheme on the
same terms as all employees of the Bank.
• The retirement age is normally 65. The pension
benefits are defined contribution and may be
payable in addition to pension plans under col-
lective agreements.
• The period of notice on the part of an executive
officer is six months, and on the part of Han-
delsbanken a maximum of 12 months. If the
Bank terminates the employment contract later
than five years after the person becomes one
of the Bank’s executive officers, the period of
notice is a maximum of 24 months. No addi-
tional severance pay is payable. Other time
periods may apply due to collective agree-
ments or labour legislation.
• The Board shall have the right to deviate from
the established guidelines if there are special
reasons in an individual case.
The guidelines do not affect remuneration previ-
ously decided for executive officers. The guide-
lines are applied to the Group Chief Executive,
other executive officers, and any members of
Handelsbanken’s Central Board who are also
employees of the Bank.
Auditors
Jesper Nilsson has been an authorised public
accountant since 2007. He is auditor-in-charge
for Ernst & Young AB at Handelsbanken and
chairs Handelsbanken’s auditing team. Mr Nils-
son is also an auditor for Intrum, Creades, and
Alecta. Jesper Nilsson was born in 1964.
Johan Rippe has been an authorised public
accountant since 1999 and is auditor-in-charge
for PricewaterhouseCoopers AB at Handels-
banken. Mr Rippe is also an auditor for Stena,
Getinge, and Lundin Petroleum, Deputy CEO of
PricewaterhouseCoopers AB, and the Chairman
of the Board of the Swedish Institute of Author-
ised Public Accounts (FAR). Mr Rippe was born
in 1968.
NOMINATION COMMITTEE
The shareholders at the 2010 AGM resolved to
establish instructions for how the nomination
committee is to be appointed. According to the
decision, the instructions will apply until they are
amended by a future AGM. The instructions state
that the nomination committee shall comprise
five members: the Chairman of the Board and
one representative from each of the Bank’s four
largest shareholders as at 31 August the year
before the AGM is held.
However, the nomination committee must not
include representatives of companies which are
significant competitors of the Bank in any of its
main areas of operations. It is the Chairman of
the Board’s task to contact the largest owners,
so that they will appoint one representative each
to sit on the nomination committee, together with
the Chairman. The 2020 nomination committee
comprises:
Representative Shareholders
Voting power
as a %,
31 August 2019
Helena Stjernholm,
Chair Industrivärden 10.6
Christian Dahl Oktogonen Foundation 10.5
Mats Guldbrand
Lundberg ownership
group 3.7
Bo Selling Alecta 1.4
Pär Boman,
Board Chairman
Information on the composition of the nomination
committee has been available on Handels-
banken.com since 21 September 2019.
The nomination committee’s task in prepara-
tion for the AGM on 25 March 2020 is to submit
proposals for the election of a chairman of the
AGM, the Chairman of the Board and other
members of the Board, the fees to the Chairman
and other members of the Board, and remunera-
tion for committee work. In addition, the Han-
delsbanken Board has decided that proposals
regarding the election of and fees to auditors be
made by the nomination committee.
Recruitment and diversity-related work
In its work, the nomination committee takes into
account matters relating to diversity, including
gender distribution, on the Board. Handelsbank-
en’s Board has adopted a policy to promote
diversity in the Board. The policy states that to
promote independent opinions and critical ques-
tioning, it is desirable that the Board should be
characterised by sufficient diversity in terms of
age, gender, geographical origin, and educational
and professional background. The proportion of
women on the Board of the Bank is 45 per cent,
and the proportion who are nationals of a country
other than the one where Handelsbanken is
domiciled is 36 per cent. In compiling its pro-
posal for the AGM, the nomination committee will
also consider the evaluation of the Board carried
out by the Chairman of the Board.
THE BOARD
After the shareholders at the 2019 AGM had
appointed Pär Boman to be Chairman of the
Board, Fredrik Lundberg was appointed as
Deputy Chair at the first Board meeting immedi-
ately after the AGM. At the same time, the Board
appointed members of the credit committee,
audit committee, risk committee and remunera-
tion committee. Information about the Board is
shown on pages 74 –75.
Composition of the Board
The Board consisted of 11 members during
2019. When the Board is to be elected, the nom-
ination committee proposes members. Starting
from the date of the 2020 AGM, the Board will
include two members and two deputy members
who are employee representatives, in accord-
ance with applicable legislation.
The Board members have broad and exten-
sive experience from the business community.
Several are, or have been, chief executives of
major companies, and most of them are also
board members of major companies. See also
pages 74 –75. Several members have worked on
the Bank’s Board for a long time and are very
familiar with the Bank’s operations. The nomina-
tion committee’s proposals at previous AGMs,
including their reasons, are available at handels-
banken.com.
Independence of Board members
The Swedish Corporate Governance Code stipu-
lates that the majority of Board members elected
by the AGM must be independent of the Bank
and the Bank’s management, and that at least
two of the independent Board members must
Attendance at AGMs 2014–2019
Number
No. of shareholders
present/represented
0
400
800
1,200
1,600
2,000
201920182017201620152014
%
0
20
40
60
80
100
Proportion of votes

CORPORATE GOVERNANCE REPORT | ADMINISTRATION REPORT
68 HANDELSBANKEN | ANNUAL REPORT 2019
also be independent of those of the company’s
shareholders that control 10 per cent or more of
the shares and votes in the Bank. The composi-
tion of the Board fulfils the Code’s requirements
for independence.
Regulations governing the Board’s work
The fundamental rules regarding the distribution
of tasks among the Board, the Board commit-
tees, the Chairman, the CEO and Group Audit
are expressed in the Board’s rules of procedure,
as well as in its instructions to the CEO and to
the Chief Audit Officer.
Chairman of the Board
The Board’s rules of procedure state that the
Chairman shall ensure that the Board carries out
its work efficiently and that it fulfils its duties. This
involves organising and managing the Board’s
work and creating the best possible conditions
for this work. The Chairman must also ensure
that the Board members continually update and
expand their knowledge of the Bank’s opera-
tions, and that new members receive appropriate
introduction and training. The Chairman must be
available to the CEO as an advisor and discus-
sion partner, but must also prepare the Board’s
evaluation of the CEO’s work.
The Chairman’s duties include being chairman
of the credit and remuneration committees, as
well as being a member of the audit and risk
committees. The Chairman is responsible for
ensuring that the Board’s work is evaluated
annually. The 2019 Board evaluation was per-
formed by means of a survey and through dis-
cussions between the Chairman and each mem-
ber. The Chairman informed the Board of the
outcome of the evaluation and led a Board dis-
cussion on this. He also informed the nomination
committee about the Board evaluation. The
Chairman is responsible for maintaining contact
with the major shareholders concerning owner-
ship matters.
There is no other regular division of work for
the Board except as concerns the committees.
The Board’s work in 2019
During the year, the Board had 15 meetings,
including a lengthy strategy meeting.
The figure on page 69 gives an overview of the
Board’s work in 2019, including regularly occur-
ring major items at ordinary Board meetings. In
addition, matters discussed at each committee
meeting are reported at the next Board meeting.
Committee work
Credit committee
The credit committee consisted of eight mem-
bers: the Chairman of the Board (Pär Boman,
who also chairs the credit committee), the
Deputy Chair (Fredrik Lundberg), the chair of the
audit committee (Bente Rathe), the CEO (Carina
Åkerström), the Chief Credit Officer (Per Beck-
man), and three Board members appointed by
the Board (Jon Fredrik Baksaas, Ole Johansson,
and Hans Biörck).
The credit committee normally holds one
meeting every month to take decisions on credit
cases that exceed a set limit and that are not
decided on by the whole Board due to the
importance of these cases or legal requirements.
The heads of the regional banks and Handels-
banken International presented cases to the
credit committee from their own units in 2019
and participated when other cases were pre-
sented, with the objective of providing them with
a good picture of the Board’s approach to risk.
Credit cases that are decided upon by the whole
Board are presented by the Chief Credit Officer. If
a delay in the credit decision would inconven-
ience the Bank or the borrower, the credit
instructions allow the CEO and the Chief Credit
Officer to decide on credit cases during the inter-
val between credit committee meetings.
In 2019, the credit committee had 11 meetings.
Audit committee
The audit committee comprised the Chairman of
the Board (Pär Boman) and four Board members
appointed by the Board (Jon Fredrik Baksaas,
Ole Johansson, Lise Kaae and Bente Rathe). The
latter members are independent of the Bank, its
management, and major shareholders. Bente
Rathe was appointed to chair the committee.
The work of the audit committee includes the
following:
• monitoring the financial reporting, as well as the
effectiveness of the Bank’s internal control,
internal audit and risk management systems in
relation to financial reporting
• providing recommendations and proposals
concerning the financial reporting
• preparing the Board’s decision regarding an
audit plan for the work of Group Audit and tak-
ing into account reports from Group Audit
• having regular contact with the external audi-
tors. These auditors report to the committee on
significant matters that have emerged from the
statutory audit
• keeping up to date with the audit of the annual
report and consolidated accounts and the
Swedish Supervisory Board of Public Account-
ants’ quality control
• assisting the nomination committee in the mat-
ter of proposing auditors and thereafter submit-
ting a recommendation regarding the election
of auditors
• informing the Board of the results of the audit
and of the manner in which the audit has con-
tributed to the reliability of the financial reports
• monitoring and verifying the external auditors’
impartiality and independence, with a particular
focus on whether the auditors provide any ser-
vices other than auditing to the company.
All interim reports and year-end reports are
reviewed by the audit committee. Items are pre-
sented by the CEO, the CFO, the Chief Audit
Officer and the persons with main responsibility
from the audit companies appointed by the
AGM. The members of the committee can also
ask questions of the Head of Group Audit and
external auditors when members of Bank man-
agement are not present.
In 2019, the audit committee had ten meetings.
Risk committee
The risk committee comprised the Chairman of
the Board (Pär Boman) and five Board members
appointed by the Board (Jon Fredrik Baksaas,
Ole Johansson, Kerstin Hessius, Lise Kaae and
Bente Rathe). The latter members are independ-
ent of the Bank, its management, and major
shareholders. Kerstin Hessius was appointed to
chair the committee.
The work of the risk committee includes the
following:
• processing reports from the Heads of Group
Risk Control and Group Compliance
• preparing the Board’s decisions regarding the
establishment of the internal capital adequacy
assessment
• processing the validation and evaluation of the
internal risk classification system
• preparing the Board’s decisions regarding risk
tolerance and risk strategy
• processing the evaluation of the risk calculation
methods used for limiting financial risks, calcu-
lating capital requirements and calculating eco-
nomic capital
• preparing the Board’s decisions regarding the
establishment of Handelsbanken’s recovery
plan.
The Head of Group Risk Control, who is also the
Bank’s CRO, and the Chief Compliance Officer
present their reports to the risk committee in per-
son. The members of the committee can also
ask questions of the CRO and Head of Group
Compliance when members of Bank manage-
ment are not present. The Bank’s CEO, CFO,
Chief Credit Officer and Chief Legal Officer also
attend meetings of the risk committee.
In 2019, the risk committee had eight meetings.
Remuneration committee
The remuneration committee comprised the
Chairman of the Board (Pär Boman, who also
chairs the committee) and two Board members
appointed by the Board (Ole Johansson and
Bente Rathe), who are independent of the Bank,
its management, and major share holders.
The tasks of the remuneration committee
include making an independent assessment of
Handelsbanken’s remuneration policy and remu-
neration system. In addition, the remuneration
committee prepares matters regarding remunera-
tion to be decided on by the Board and the
AGM. After the shareholders at the AGM have
decided on guidelines for the terms and condi-
tions of remuneration to executive officers, the
Board decides on remuneration to these officers
and the heads of the control functions: Group
Audit, Group Risk Control and Group Compli-
ance. Each year, the remuneration committee
evaluates Handelsbanken’s guidelines as well as
its remuneration structures and levels in accord-
ance with the Swedish Corporate Governance
Code. A statement from the committee in this
regard is published on handelsbanken.com prior
to the AGM.
In 2019, the remuneration committee had 11
meetings.
THE BANK’S MANAGEMENT
Group Chief Executive
Carina Åkerström has been President and Group
Chief Executive since March 2019. Carina was
born in 1962, is a Bachelor of Laws, and has
worked at Handelsbanken since 1986. In 2008,
Carina Åkerström became a member of the
executive management as Deputy CEO and
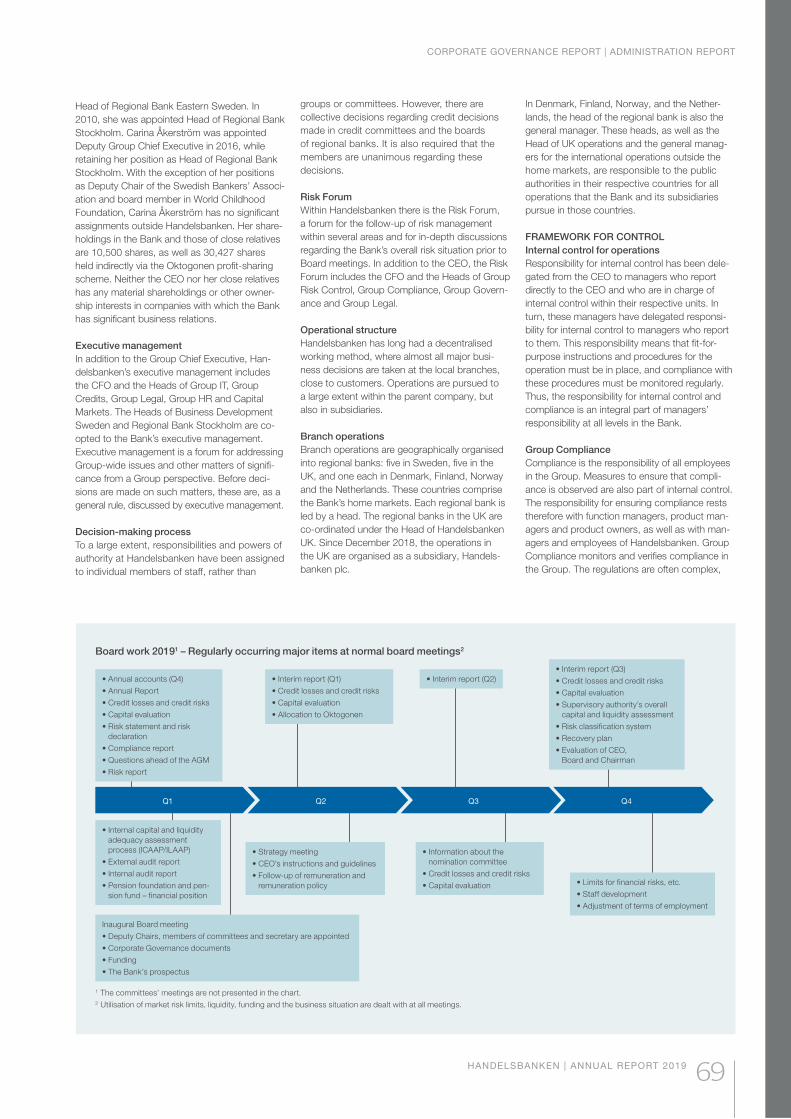
• Annual accounts (Q4)
• Annual Report
• Credit losses and credit risks
• Capital evaluation
• Risk statement and risk
declaration
• Compliance report
• Questions ahead of the AGM
• Risk report
Inaugural Board meeting
• Deputy Chairs, members of committees and secretary are appointed
• Corporate Governance documents
• Funding
• The Bank’s prospectus
• Interim report (Q2)• Interim report (Q1)
• Credit losses and credit risks
• Capital evaluation
• Allocation to Oktogonen
• Interim report (Q3)
• Credit losses and credit risks
• Capital evaluation
• Supervisory authority’s overall
capital and liquidity assessment
• Risk classification system
• Recovery plan
• Evaluation of CEO,
Board and Chairman
• Information about the
nomination committee
• Credit losses and credit risks
• Capital evaluation
• Internal capital and liquidity
adequacy assessment
process (ICAAP/ILAAP)
• External audit report
• Internal audit report
• Pension foundation and pen-
sion fund – financial position
• Limits for financial risks, etc.
• Staff development
• Adjustment of terms of employment
• Strategy meeting
• CEO’s instructions and guidelines
• Follow-up of remuneration and
remuneration policy
Q1 Q2 Q3 Q4
Board work 20191 – Regularly occurring major items at normal board meetings2
1 The committees’ meetings are not presented in the chart.2 Utilisation of market risk limits, liquidity, funding and the business situation are dealt with at all meetings.
CORPORATE GOVERNANCE REPORT | ADMINISTRATION REPORT
HANDELSBANKEN | ANNUAL REPORT 2019 69
Head of Regional Bank Eastern Sweden. In
2010, she was appointed Head of Regional Bank
Stockholm. Carina Åkerström was appointed
Deputy Group Chief Executive in 2016, while
retaining her position as Head of Regional Bank
Stockholm. With the exception of her positions
as Deputy Chair of the Swedish Bankers’ Associ-
ation and board member in World Childhood
Foundation, Carina Åkerström has no significant
assignments outside Handelsbanken. Her share-
holdings in the Bank and those of close relatives
are 10,500 shares, as well as 30,427 shares
held indirectly via the Oktogonen profit-sharing
scheme. Neither the CEO nor her close relatives
has any material shareholdings or other owner-
ship interests in companies with which the Bank
has significant business relations.
Executive management
In addition to the Group Chief Executive, Han-
delsbanken’s executive management includes
the CFO and the Heads of Group IT, Group
Credits, Group Legal, Group HR and Capital
Markets. The Heads of Business Development
Sweden and Regional Bank Stockholm are co-
opted to the Bank’s executive management.
Executive management is a forum for addressing
Group-wide issues and other matters of signifi-
cance from a Group perspective. Before deci-
sions are made on such matters, these are, as a
general rule, discussed by executive management.
Decision-making process
To a large extent, responsibilities and powers of
authority at Handelsbanken have been assigned
to individual members of staff, rather than
groups or committees. However, there are
collective decisions regarding credit decisions
made in credit committees and the boards
of regional banks. It is also required that the
members are unanimous regarding these
decisions.
Risk Forum
Within Handelsbanken there is the Risk Forum,
a forum for the follow-up of risk management
within several areas and for in-depth discussions
regarding the Bank’s overall risk situation prior to
Board meetings. In addition to the CEO, the Risk
Forum includes the CFO and the Heads of Group
Risk Control, Group Compliance, Group Govern-
ance and Group Legal.
Operational structure
Handelsbanken has long had a decentralised
working method, where almost all major busi-
ness decisions are taken at the local branches,
close to customers. Operations are pursued to
a large extent within the parent company, but
also in subsidiaries.
Branch operations
Branch operations are geographically organised
into regional banks: five in Sweden, five in the
UK, and one each in Denmark, Finland, Norway
and the Netherlands. These countries comprise
the Bank’s home markets. Each regional bank is
led by a head. The regional banks in the UK are
co-ordinated under the Head of Handelsbanken
UK. Since December 2018, the operations in
the UK are organised as a subsidiary, Handels-
banken plc.
In Denmark, Finland, Norway, and the Nether-
lands, the head of the regional bank is also the
general manager. These heads, as well as the
Head of UK operations and the general manag-
ers for the international operations outside the
home markets, are responsible to the public
authorities in their respective countries for all
operations that the Bank and its subsidiaries
pursue in those countries.
FRAMEWORK FOR CONTROL
Internal control for operations
Responsibility for internal control has been dele-
gated from the CEO to managers who report
directly to the CEO and who are in charge of
internal control within their respective units. In
turn, these managers have delegated responsi-
bility for internal control to managers who report
to them. This responsibility means that fit-for-
purpose instructions and procedures for the
operation must be in place, and compliance with
these procedures must be monitored regularly.
Thus, the responsibility for internal control and
compliance is an integral part of managers’
responsibility at all levels in the Bank.
Group Compliance
Compliance is the responsibility of all employees
in the Group. Measures to ensure that compli-
ance is observed are also part of internal control.
The responsibility for ensuring compliance rests
therefore with function managers, product man-
agers and product owners, as well as with man-
agers and employees of Handelsbanken. Group
Compliance monitors and verifies compliance in
the Group. The regulations are often complex,
CORPORATE GOVERNANCE REPORT | ADMINISTRATION REPORT
70 HANDELSBANKEN | ANNUAL REPORT 2019
and in some cases the individual employee may
have limited knowledge of these. For this reason,
support and advice from the Compliance func-
tion is important, especially in conjunction with
the introduction of new or changed regulations,
or changes to the Group’s products, services,
processes and organisation.
Group Compliance is an independent unit
with the functional responsibility for compliance
matters in the Group.
The Chief Compliance Officer is appointed by
the Central Board and reports directly to the
CEO on compliance in the Group each quarter.
The Chief Compliance Officer reports on com-
pliance in the Group twice a year directly to the
Board’s risk committee and once a year to the
Board as a whole. In addition, material observa-
tions are reported regularly to the CEO.
Group Risk Control
The Bank is characterised by a clear division of
responsibility where each part of the business
operations bears full responsibility for risk man-
agement.
Group Risk Control identifies, measures,
analyses and reports all the Group’s material
risks. This includes monitoring and checking the
Group’s risk management and assessing that
Handelsbanken’s risk management framework is
fit-for-purpose and efficient. Group Risk Control
also checks that the risks and risk management
comply with the Bank’s risk strategy, and fall
within the risk tolerance thresholds established
by the Board. Group Risk Control is also respon-
sible for checking that financial instruments are
correctly valued. This responsibility includes
ensuring that executive management has reliable
information about risks to use in critical situa-
tions. Group Risk Control is an independent unit
with function responsibility for risk control in the
Group, including subsidiaries.
The Head of Group Risk Control is appointed
by the Central Board and reports directly to the
CEO. Information is also provided to the CFO on
a regular basis. The Head of Group Risk Control
reports regularly to the Board’s risk committee
and remuneration committee, and once a year to
the Board as a whole. Group Risk Control is also
in charge of the Bank’s extensive risk reporting to
the supervisory authorities.
A more detailed description of the Bank’s risk
management and control is contained in note G2
on pages 96 –133, and also in the Bank’s Pillar 3
Report.
Group Audit
Group Audit, which is the Board’s controlling body,
comprises some 100 employees. The Chief Audit
Officer is appointed by and reports to the Board.
Group Audit is tasked with performing an
independent, impartial audit of the operations
and financial reporting of the Group. This
includes assessing and verifying processes for
risk management, internal control and corporate
governance. Their assignment is based on a pol-
icy established by the Board and is performed on
the basis of a risk-based methodology in accord-
ance with internationally accepted standards
issued by the Institute of Internal Auditors. The
planned auditing tasks are documented every
year in an audit plan which is established by the
Board. Group Audit’s conclusions, the actions to
be taken and their status, are reported regularly
to the audit committee and every year to the
Board as a whole. The Chief Audit Officer is also
part of the recipient group for Handelsbanken’s
separate system for whistleblowing.
Group Audit is regularly subject to independ-
ent external quality reviews. In addition, the
Bank’s external auditors perform an annual qual-
ity review of the work of Group Audit.
POLICY DOCUMENTS
The following is a brief summary of a selection
of the policy documents which the Board of
Handels banken has established and which apply
at the time this Annual Report is published.
Credit policy
Credits may only be granted if there are good
grounds for expecting the borrower to meet their
commitments. Credits must normally have satis-
factory collateral. Handelsbanken strives to
maintain its historically low level of credit losses
compared to other banks, thus contributing to
the Bank’s profitability target and retaining its
sound position.
Policy for risk control
Handelsbanken must have a risk control function
that is independent of the functions that are to
be monitored. Risk control must be enforced
regarding all material risks in Handelsbanken,
with the exception of compliance risks, which are
within the purview of Group Compliance. The risk
control function must verify that all material
risks to which the Group is exposed, or may be
exposed in the future, are identified and man-
aged by the relevant functions, and must also
supervise and monitor the Group’s risk manage-
ment. In addition, the function must identify risks
arising as a result of deficiencies in the Group’s
risk management. The risk control function must
also verify that every business unit monitors all its
material risks in an efficient manner. Central risk
control, called Group Risk Control, reports to the
CEO. Risk Control is independent and organisa-
tionally separated from the functions and areas
to be monitored and controlled.
Policy for operational risk
Handelsbanken’s tolerance of operational risk is
very low. Operational risk refers to the risk of loss
due to inadequate or failed internal processes,
human error, erroneous systems or external
events. Operational risks must be managed
so that losses remain small in comparison with
previous losses incurred. The responsibility for
operational risk is an integral part of managerial
responsibility throughout the Group.
Capital policy
The purpose of the capital policy is to ensure
that the Group’s supply of capital is satisfactory.
The Group must at all times be well capitalised
in relation to risk, and fulfil the goals established
by the Board and the capital adequacy require-
ments established by supervisory authorities,
even in situations of financial stress (see the
section on risk in note G2 on pages 96 –133).
Handelsbanken’s capital situation must also
justify a continued high rating from the most
important rating agencies.
Financial policy
Through this policy, the Board establishes the
framework for financial operations in Handels-
banken. This includes the general establishment
of measurement methods for financial risks.
‘Financial risks’ here refers to market risks and
liquidity risks. Market risks are in turn divided into
interest rate risks, equity price risks, currency
risks and commodity price risks.
Financial risks shall only occur as a natural
step in customer business, in connection with
Handelsbanken’s funding and liquidity manage-
ment, and in its role as a market maker. The pur-
pose of the Group’s funding and liquidity man-
agement is to ensure that Handelsbanken is able
to meet its payment commitments in the short
and long term. The Group’s funding must be well
diversified in terms of markets, currencies and
maturities. Handelsbanken must have an ade-
quate liquidity reserve to be able to continue its
operations for predetermined periods of time,
without new funding in the financial markets. This
requirement must also be fulfilled in times of
financial strain.
Information policy
Handelsbanken’s information must be correct,
objective, and easy to understand. It must
respect the recipient of the information and be
provided at the right time and in the right manner.
The information will contribute to strengthening
Handelsbanken’s brand and the trust of its cus-
tomers, the capital markets and society in gen-
eral. Information provided to the capital market
must be correct, relevant, clear, reliable and in
compliance with stock market regulations in all
other respects. Information is to be made public
as soon as possible and simultaneously to the
stock market, investors, analysts, news services
and other media. At press conferences and
the like, the media and analysts should normally
participate at the same time.
Policy for sustainability
Handelsbanken aims to integrate financial, social
and environmental sustainability into all its opera-
tions. Handelsbanken must safeguard human
rights and employees’ rights, and not be
complicit in breaches of these. Gender equality,
diversity and an inclusive corporate culture
should be a fundamental part of Handelsbank-
en’s values. Handelsbanken must, through finan-
cial and environmental sustainable operations,
endeavour to minimise the negative effect on the
environment and climate. Nor shall Handels-
banken accept corruption, money laundering or
terrorist financing, and conflicts of interest must
be managed.
The policy is available at handelsbanken.com.
Policy for ethical standards
Employees of Handelsbanken must conduct
themselves in a manner that upholds confi-
dence in Handelsbanken. All operations in the
Group must be characterised by high ethical
standards. Financial advice must be based on
CORPORATE GOVERNANCE REPORT | ADMINISTRATION REPORT
HANDELSBANKEN | ANNUAL REPORT 2019 71
the customer’s requirements. In case of doubt
as to what is ethically acceptable, the matter
must be discussed with the employee’s immedi-
ate superior. There must be no discrimination on
grounds such as gender or religion. The policy
on ethical standards also describes how
employees who suspect internal fraud or other
irregularities should act. As a supplement to the
paths for reporting provided by the Compliance
and Group Audit functions, Handelsbanken also
has an established whistleblower system,
through which reports may be submitted anony-
mously.
The policy is available at handelsbanken.com.
Policy for management of conflicts of interest
Conflicts of interest are a natural part of a busi-
ness operation, which means that these types of
conflicts may arise within the Group’s operations.
It is the responsibility of all heads of units to con-
tinuously identify potential conflicts of interest in
their operations. If a conflict of interest is identi-
fied, the first priority is to ensure that the custom-
er’s interests are not adversely affected. If this is
not possible, the customer must be informed of
the conflict of interest.
The policy is available at handelsbanken.com.
Policy against corruption
The Bank’s policy against corruption establishes
the importance of preventing and never accept-
ing corruption, and of always taking action where
there is suspicion of corruption.
Employees of the Group must carry out their
responsibilities in all their activities at the Group
and their external assignments in a manner
that upholds confidence in Handelsbanken.
They must not, therefore, participate in actions
that may involve bribery or any other improper
influence.
The policy is available at handelsbanken.com.
Policy for remuneration
Handelsbanken takes a long-term view of its
staff’s employment. Remuneration must be on
market terms, enabling Handelsbanken to
attract, retain and develop skilled staff, and
ensuring good management succession, thus
contributing to the achievement of the Handels-
banken Group’s corporate goal.
Handelsbanken has a low risk tolerance in
general. This is reflected in the company’s view
of remuneration. Handelsbanken considers
that fixed remuneration contributes to healthy
operations. This is therefore the main principle.
Fixed remuneration is comprised primarily of a
basic salary, customary employee benefits and
pension.
Variable remuneration must be applied with
great caution and is not offered to employees
who, in their professional roles, can have a mate-
rial impact on the Bank’s risk profile.
Remuneration at Handelsbanken is generally
established locally in accordance with the Bank’s
decentralised method of operating and is based
on salary-setting factors that are established in
advance.
In certain countries, Handelsbanken is party
to collective agreements on general terms and
conditions of employment and conditions for
pensions. This policy does not affect rights and
obligations under collective agreements; nor
does it affect obligations under applicable con-
tract law or labour law.
Group HR is responsible for verifying that
remuneration in Handelsbanken is compliant with
internal and external rules. The independent con-
trol functions monitor and analyse the remunera-
tion system, and report material risks and flaws
to the Board’s remuneration and risk committees.
A more detailed description of Handels-
banken’s remuneration principles is shown on
page 72 and details about remuneration are
shown in note G8 on pages 136 –139.
Policy for suitability assessment
Group HR performs suitability assessments in
conjunction with the election of board members,
CEOs, board members at the Bank’s subsidiaries
and the Head of Group Audit, and ahead of deci-
sions on appointments of officers that report
directly to the CEO and the Head of Group Audit.
Policy for group audit operations
Group Audit is to evaluate the efficiency and
appropriateness of the Group’s processes for risk
management, internal governance and control.
The Audit function must impartially and indepen-
dently examine the Group’s operations, accounts
and governance process, ensure that material
risks are identified and managed in a satisfactory
manner, and ensure that material financial infor-
mation is reliable, correct and delivered on time.
Group Audit reports directly to the Board; it pro-
vides reports for the Board and its audit commit-
tee, as well as for the CEO.
Policy for managing and reporting events
of material importance
Incidents of material importance must be
reported to the Swedish Financial Supervisory
Authority. This refers to incidents that may
jeopardise the stability of the parent company
or a subsidiary, or the protection of customers’
assets.
Policy for the Bank’s use of the external
auditors’ services
Engaging the Bank’s elected auditors for services
other than auditing is to be avoided when this
can be done without inconvenience. A decision
on this must be made by the Chief Audit Officer
or, in the case of more extensive assignments,
by the Board’s audit committee. This policy is
adopted by the Board’s audit committee on
behalf of the Board.
Policy for compliance
Compliance refers to the observance of regula-
tions, laws, directives and recommendations
from public authorities, internal rules, as well as
generally accepted business practices or stand-
ards relating to all operations conducted within
the Handelsbanken Group that are subject to a
licence. Handelsbanken has a low tolerance of
compliance risks and, as far as possible, must
prevent these risks. Using a risk-based approach,
the Compliance function is to support and verify
compliance. It also analyses shortcomings and
risks relating to compliance. Group Compliance
reports directly to the CEO; it provides reports for
CEO, as well as for the Board and its risk com-
mittee. The Compliance function is independent
and organisationally separated from the functions
and areas to be monitored and controlled.
Policy for complaints management
Complaints must be taken very seriously,
managed with the utmost professionalism and
regarded as an opportunity to correct a mistake
or misunderstanding. The customer in question
must be treated with respect and understanding,
regardless of the size of their commitment with
the Group. The aim of Handelsbanken’s com-
plaints management is that the person making
the complaint must be very satisfied with the
Bank’s handling of the complaint.
Policy for employees’ private securities
and currency transactions
The policy for employees’ private securities and
currency transactions applies to all permanent
and temporary employees of the Handelsbanken
Group, closely related persons and service pro-
viders. The purpose of the policy is to prevent
any person who is covered by the policy from
carrying out his/her own securities transactions
that involve market abuse, or misuse or improper
disclosure of confidential information under the
regulations that apply to Handelsbanken and its
employees, in accordance with prevailing legisla-
tion, directives from public authorities and volun-
tary agreements.
Accounting policy
The accounting policy applies to Handels-
banken’s accounting function. The consolidated
accounts are prepared in accordance with IFRS,
as adopted by the EU, plus additional standards
in accordance with the Swedish Annual Accounts
Act for Credit Institutions and Securities Compa-
nies, and the regulations and general guidelines
issued by the Swedish Financial Supervisory
Authority. The parent company’s annual report is
prepared in accordance with the Swedish Annual
Accounts Act for Credit Institutions and Securi-
ties Companies, and the regulations and general
guidelines issued by the Swedish Financial
Supervisory Authority. International units must
prepare accounts in accordance not only with the
Group’s rules, but also with the regulations that
apply in the country where they are required to
maintain accounting records.
Policy for products and services
The Handelsbanken Group’s range of products
must maintain a high level of quality. This means
that the products’ function, and their associated
costs and risks, must meet customers’ needs,
characteristics and goals, as well as being pre-
sented in such a way that customers are able to
make well-founded decisions. A decision-making
procedure must be in place for the approval of
new and materially changed products. Before
a product is rolled out, it must be subject to
product testing, and no new or materially changed
product may be rolled out until the resources are
in place to manage the risks associated with the
product. The products must have established
target markets and the strategy for distribution
CORPORATE GOVERNANCE REPORT | ADMINISTRATION REPORT
72 HANDELSBANKEN | ANNUAL REPORT 2019
of products must be appropriate in relation to the
target market. Products distributed must be
distributed to the predetermined target market.
Procedures must exist for monitoring the prod-
uct, to ensure that it remains suitable for the
established target market.
Policy on measures against financial crime
The policy on measures against financial crime
is partly based on Swedish laws and regulations
concerning money laundering, terrorist financing,
breaches of international sanctions, applicable
non-Swedish rules (including UK regulations
against tax evasion) and fraud, and it shall be
applied throughout the Handelsbanken Group.
Handelsbanken must not participate in transac-
tions of which the employees do not understand
the implications, or which may be suspected of
being linked to criminal activities. The Group’s
work method is based on having a good knowl-
edge of its customers, and an understanding of
its customers’ business operations, as well as
the purpose and nature of the business relation-
ship. Customer due diligence must be performed
and maintained for as long as the customer rela-
tionship exists. Handelsbanken must monitor
and comply with decisions and sanctions pursu-
ant to the Swedish Act on Certain International
Sanctions.
PRINCIPLES FOR REMUNERATION
AT HANDELSBANKEN
The Bank’s principles for remuneration to employ-
ees are long established. In general, Handels-
banken has low tolerance of risk and holds the
opinion that fixed remuneration contributes to
healthy operations. This is, therefore, the main
principle. Only fixed remuneration is paid to the
Bank’s executive officers and to employees who
make decisions on credits or limits, or who work
at the Bank’s control functions. This also applies
to employees who are assessed as having a
material impact on the Bank’s risk profile, called
‘risk-takers’ in the Bank.
Variable remuneration is applied with great
caution and to a very limited extent. It is only
offered to employees in the Capital Markets busi-
ness area and in mutual fund and asset manage-
ment operations. In these operations, variable
remuneration may only be paid to employees at
units whose profits derive from commissions or
intermediary transactions that take place without
the Bank being subject to credit risk, market risk
or liquidity risk. Approximately 1 per cent of the
Group’s employees are eligible to receive variable
remuneration. The total amount reserved for vari-
able remuneration to employees in the Handels-
banken Group must not exceed 0.4 per cent of
the Bank’s common equity tier 1 capital during
any given year. For 2019, a total of SEK 48 mil-
lion was allocated for variable remuneration, cor-
responding to approximately 0.5 per cent of total
salaries and approximately 0.04 per cent of the
Bank’s common equity tier 1 capital. Handels-
banken complies with the Swedish Financial
Supervisory Authority’s regulations governing
remuneration policies in credit institutions, invest-
ment firms and fund management companies,
which include provisions for formulating and
adopting remuneration policies. The heads of the
areas concerned, as well as the CRO and Chief
Compliance Officer, take part in the remuneration
committee’s preparation and assessment of the
Board’s remuneration policy and the Bank’s
remuneration system.
The main principle is that salaries are set
locally in salary reviews between the employee
and his/her line manager. These principles have
been applied for many years with great success.
They mean that managers at all levels participate
regularly in the salary process, and take respon-
sibility for the Bank’s salary policy and the growth
in their own unit’s staff costs.
Salaries are based on factors known in
advance: the nature and level of difficulty of the
work, competency and skills, work performance
and results achieved, leadership, and being a
cultural ambassador for the Bank.
In Sweden and certain other countries, the
Bank is party to collective agreements on general
terms and conditions of employment during the
employment period and on terms and conditions
of pensions after employees have reached retire-
ment age. The aim of the Bank’s policy on sala-
ries is to increase the Bank’s competitiveness
and profitability, to enable the Bank to attract,
retain and develop skilled staff, and to ensure
good management succession planning. Good
profitability and productivity performance at the
Bank create the necessary conditions for salary
growth for the Bank’s employees.
At Handelsbanken, the Board decides on the
remuneration policy. The main principle of the
remuneration policy is that remuneration is paid
in the form of fixed remuneration. However, the
policy allows for variable remuneration to be
paid. The Board decides on the total amount.
A detailed description of fixed and variable
remuneration at Handelsbanken is given here.
Other information concerning remuneration paid
by the Bank in accordance with the current
regulations is presented in note G8 on pages
136 –139. This note also provides information
about amounts for salaries, pensions and other
benefits, and loans to executive officers.
Fixed remuneration
The Bank takes a long-term view of its staff’s
employment. Remuneration for work performed
is set individually for each employee, and is paid
in the form of a fixed salary, customary salary
benefits and pension. At Handelsbanken, salary-
setting takes place at local level.
Variable remuneration
Variable remuneration is based on Handels-
banken’s factors for setting salaries and it must
be designed so that it does not encourage
unhealthy risk-taking. The financial result on
which the variable remuneration is based is
adjusted for risk and charged with the actual
cost of the capital and liquidity required by the
operations. Normally, variable remuneration is
only paid in cash. In subsidiaries which run
mutual fund operations and in Heartwood Wealth
Management Ltd, the variable remuneration is
entirely or partially paid out as mutual fund units.
The main rule for variable remuneration is that
at least 40 per cent is to be deferred for at least
three years. For particularly large amounts of
variable remuneration, 60 per cent is deferred for
four years. Payment and the right of ownership
to the variable remuneration do not accrue to the
person with the entitlement until after the end of
the deferment period. Deferred variable remuner-
ation can be removed or reduced if losses,
increased risks or increased expenses arise
during the deferment period, or if payment is
deemed to be unjustifiable in view of the Bank’s
financial situation. No employee may receive
variable remuneration of more than 100 per cent
of his/her fixed remuneration.
Principles for remuneration
to executive officers
The shareholders at the AGM decide on guide-
lines for remuneration to the Group Chief Execu-
tive and other executive officers. The guidelines
are applied to the Group Chief Executive, other
executive officers, and any members of Handels-
banken’s Board who are also employees of the
Bank. For the AGM guidelines from 2019, see
the “Annual General Meeting 2019” section on
pages 66 – 67.
The Board decides on remuneration to the
officers who are subject to the AGM’s remunera-
tion guidelines (with the exception of the two
Board members who are Handelsbanken
employees), a total of 13 individuals (as at 31
December 2019). The Board also decides on
remuneration to the Head of Group Audit, among
others.
Executive officers in Handelsbanken are Board
members, members of executive management,
Deputy CEOs and the Heads of Group Risk
Control and Group Compliance. These persons
comprise executive officers according to the defi-
nition in the Swedish Companies Act. These per-
sons are subject to the remuneration guidelines
applied by the annual general meeting. Further
information about executive officers is shown on
pages 136 –139. The Swedish Financial Supervi-
sory Authority’s regulation FFFS 2011:1 states
that ‘senior management’ includes members of
executive management, Deputy CEOs and the
Heads of Group Risk Control and Group Compli-
ance.
CORPORATE GOVERNANCE REPORT | ADMINISTRATION REPORT
HANDELSBANKEN | ANNUAL REPORT 2019 73
The Board’s report on internal control regarding financial reporting
The presentation of Handelsbanken’s internal
control process for financial reporting is based on
the framework developed by the Committee of
Sponsoring Organizations of the Treadway Com-
mission (COSO), and covers the following com-
ponents: control environment, risk assessment,
control activities, information and communica-
tion, and follow-up. The process was designed
to ensure compliance with the Bank’s principles
for financial reporting and internal control, and to
ensure that the financial reporting has been pre-
pared pursuant to the law, applicable accounting
standards, and other requirements related to
listed companies.
Control environment
To ensure reliable financial reporting, Handels-
banken’s internal control process for financial
reporting is based on the control environment.
The control environment is fundamental to other
components of the process and has been
described earlier in the corporate governance
report: organisational structure, division of
responsibilities, guidelines and policy docu-
ments. An important aspect of the control
environment is that decision-making channels,
powers of authority and responsibilities are
clearly defined and communicated, as is that
policy documents and guidelines established by
the Board and CEO give clear guidance and are
complied with.
Risk assessment
Risk assessment aims to identify, manage and
follow up risks with the potential to affect the
financial reporting. Group Finance is responsible
for performing a risk assessment at Group level,
in order to identify units for which the need for
internal control is assessed as of material signifi-
cance to minimise the risk of material error in the
financial reporting. Units that Group Finance
deems must be covered by the process are
required to draw up general documentation of
their processes for internal control regarding
financial reporting. This general documentation
must describe the processes that generate the
unit’s most significant balance sheet and profit
and loss items, risks, procedures for preparing
the accounts, and identified control activities.
The identified control activities are carried out
each quarter to ensure that the financial reporting
is correct, in all material respects.
The annual self-evaluations carried out at
regional banks, subsidiaries, central departments
and international units are an essential part of the
Bank’s total risk assessment. Risks in the finan-
cial reporting are part of this total analysis. Other
aspects of Handelsbanken’s risk management
are detailed in note G2 on pages 96 –133 and in
the Bank’s Pillar 3 report.
Control activities
Various control activities are incorporated in the
entire financial reporting process.
Group Finance bears the overall responsibility for
the financial reporting, the consolidated accounts
and consolidated financial reports, and for finan-
cial and administrative control systems. The unit’s
responsibilities also include the Group’s liquidity,
the internal bank, own funds, tax analysis and
Group-wide reporting to public authorities. The
capital requirements are, however, calculated by
Group Risk Control.
Group Finance has the overall responsibility for
ensuring that a fit-for-purpose process is in place
for reporting on internal control regarding the
financial reporting. For the units that Group
Finance has deemed must be covered by the
process for internal control regarding financial
reporting, control activities are identified which
are aimed at preventing, detecting and correcting
errors and deviations in the financial reporting.
Group Finance has established a number of
financial control activities linked to the general
ledger and the process of preparing the accounts,
which all finance departments at regional banks,
subsidiaries, central departments and interna-
tional units are required to carry out in conjunc-
tion with every quarterly closing of accounts.
These include, for example, the reconciliation
and verification of reported amounts, and analy-
ses of income statements and balance sheets.
In addition to financial control activities, units
selected by Group Finance are responsible for
identifying and evaluating control activities within
business process and systems that have a sub-
stantial impact on the income statement and
balance sheet, with the aim of minimising the risk
of material error in the financial reporting. Heads
of accounting and control at the respective units
are responsible for ensuring that the control
activities in the financial reporting for their unit are
fit-for-purpose – i.e. that they are designed to
prevent, detect and correct errors and deviations
– and are in compliance with internal guidelines
and instructions. At each quarterly closing of
accounts, the units certify to Group Finance
that the control activities have been carried out,
and that their balance sheets and income state-
ments are correct. Based on Group Finance’s
follow-up of the units’ reports, the Head of
Group Finance (i.e. the CFO) reports the status
of the internal control of financial reporting to
the audit committee at each quarterly closing
of accounts.
The CRO is responsible for setting up and
maintaining a valuation committee. The commit-
tee’s role is to support risk control, Group
Finance and the local risk and treasury functions
in the decision-making processes for valuation
and reporting matters. The committee deals with
the valuation of financial assets and liabilities,
including derivatives at fair value and also finan-
cial guarantees. The valuations refer to both own
holdings and holdings on behalf of others. The
committee must ensure that the valuation com-
plies with external regulations, internal guidelines
and current market practices.
High information security is a precondition for
good internal control of financial reporting. Thus
there are regulations and guidelines to ensure
availability, accuracy, confidentiality and tracea-
bility of information in the business systems.
Information and communication
The Bank has information and communication
paths with the aim of achieving completeness
and correctness in its financial reports. Group
Finance must ensure that the staff concerned are
aware of and have access to instructions of sig-
nificance to the financial reporting. The Group’s
general accounting instructions and special pro-
cedures for producing financial reports, and the
process for internal control regarding financial
reporting, are communicated to the staff con-
cerned via the Group’s intranet. The system used
for financial reporting encompasses the entire
Group.
Follow-up
The policy established by the Board for Group
Compliance states that it must monitor and verify
compliance within the Group. Accounting and
financial control departments at regional banks,
subsidiaries, central departments and interna-
tional units also monitor and verify compliance
with applicable rules in the form of internal poli-
cies, instructions and other policy documents
which affect the financial reporting.
The policy established by the Board for inter-
nal audit states that it must examine internal
governance and control, and must evaluate the
reliability of the Group’s financial reporting. Group
Audit is described in more detail on page 65.
The policy established by the Board for Risk
Control states that it must identify, check and
report risks of errors in the Bank’s assumptions
and assessments that form the basis of the
Bank’s financial reporting.
As part of the quality control work for financial
reporting, the Board has set up an audit commit-
tee. Among other responsibilities, the committee
processes crucial accounting matters and the
financial reports produced by the Bank. The
committee also supervises the effectiveness of
the internal control, internal audit and risk man-
agement systems for internal control regarding
financial reporting. The audit committee is
described in more detail on page 65.
The Group’s information and communication
paths are monitored continually to ensure that
they are fit-for-purpose for the financial reporting.
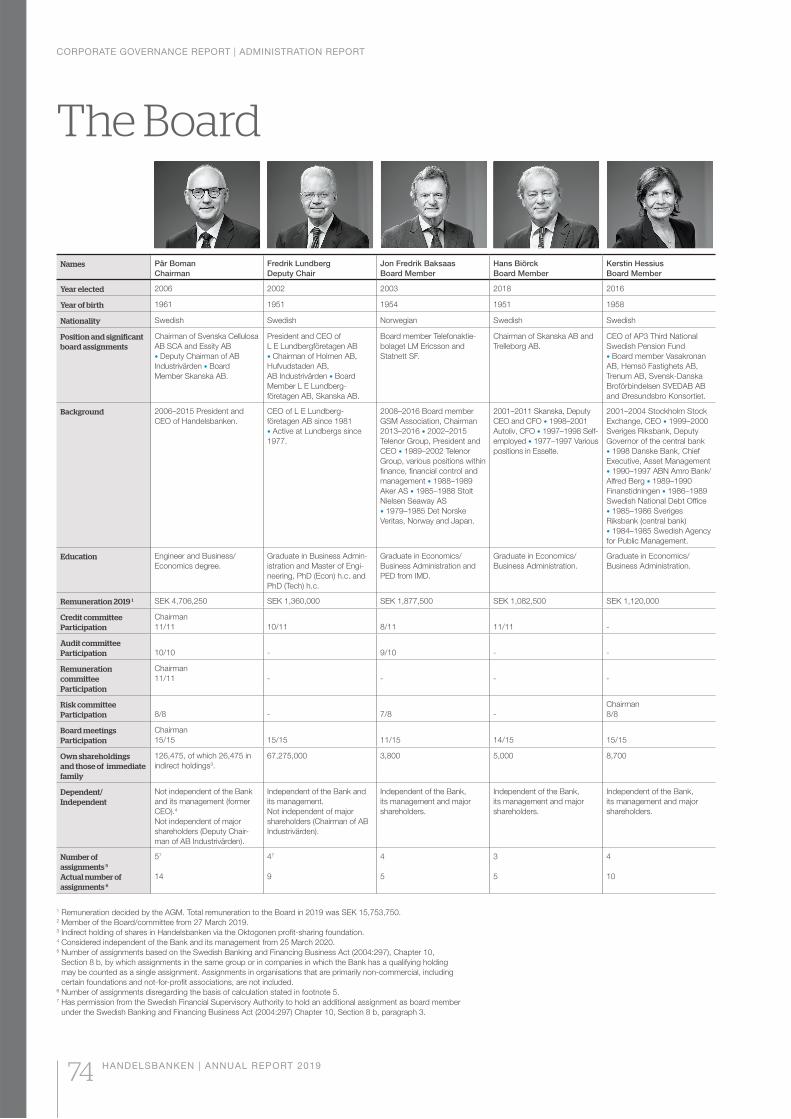
CORPORATE GOVERNANCE REPORT | ADMINISTRATION REPORT
74 HANDELSBANKEN | ANNUAL REPORT 2019
The Board
1 Remuneration decided by the AGM. Total remuneration to the Board in 2019 was SEK 15,753,750.2 Member of the Board/committee from 27 March 2019.3 Indirect holding of shares in Handelsbanken via the Oktogonen profit-sharing foundation.4 Considered independent of the Bank and its management from 25 March 2020.5 Number of assignments based on the Swedish Banking and Financing Business Act (2004:297), Chapter 10,
Section 8 b, by which assignments in the same group or in companies in which the Bank has a qualifying holding
may be counted as a single assignment. Assignments in organisations that are primarily non-commercial, including
certain foundations and not-for-profit associations, are not included.6 Number of assignments disregarding the basis of calculation stated in footnote 5.7 Has permission from the Swedish Financial Supervisory Authority to hold an additional assignment as board member
under the Swedish Banking and Financing Business Act (2004:297) Chapter 10, Section 8 b, paragraph 3.
Names Pär Boman Chairman
Fredrik Lundberg Deputy Chair
Jon Fredrik Baksaas Board Member
Hans Biörck Board Member
Kerstin Hessius Board Member
Year elected 2006 2002 2003 2018 2016
Year of birth 1961 1951 1954 1951 1958
Nationality Swedish Swedish Norwegian Swedish Swedish
Position and significant board assignments
Chairman of Svenska Cellulosa
AB SCA and Essity AB
Deputy Chairman of AB
Industrivärden Board
Member Skanska AB.
President and CEO of
L E Lundbergföretagen AB
Chairman of Holmen AB,
Hufvudstaden AB,
AB Industrivärden Board
Member L E Lundberg-
företagen AB, Skanska AB.
Board member Telefonaktie-
bolaget LM Ericsson and
Statnett SF.
Chairman of Skanska AB and
Trelleborg AB.
CEO of AP3 Third National
Swedish Pension Fund
Board member Vasakronan
AB, Hemsö Fastighets AB,
Trenum AB, Svensk-Danska
Broförbindelsen SVEDAB AB
and Øresundsbro Konsortiet.
Background 2006–2015 President and
CEO of Handelsbanken.
CEO of L E Lundberg-
företagen AB since 1981
Active at Lundbergs since
1977.
2008–2016 Board member
GSM Association, Chairman
2013–2016 2002–2015
Telenor Group, President and
CEO 1989–2002 Telenor
Group, various positions within
finance, financial control and
management 1988–1989
Aker AS 1985–1988 Stolt
Nielsen Seaway AS
1979–1985 Det Norske
Veritas, Norway and Japan.
2001–2011 Skanska, Deputy
CEO and CFO 1998–2001
Autoliv, CFO 1997–1998 Self-
employed 1977–1997 Various
positions in Esselte.
2001–2004 Stockholm Stock
Exchange, CEO 1999–2000
Sveriges Riksbank, Deputy
Governor of the central bank
1998 Danske Bank, Chief
Executive, Asset Management
1990–1997 ABN Amro Bank/
Alfred Berg 1989–1990
Finanstidningen 1986–1989
Swedish National Debt Office
1985–1986 Sveriges
Riksbank (central bank)
1984–1985 Swedish Agency
for Public Management.
Education Engineer and Business/
Economics degree.
Graduate in Business Admin-
istration and Master of Engi-
neering, PhD (Econ) h.c. and
PhD (Tech) h.c.
Graduate in Economics/
Business Administration and
PED from IMD.
Graduate in Economics/
Business Administration.
Graduate in Economics/
Business Administration.
Remuneration 2019 1 SEK 4,706,250 SEK 1,360,000 SEK 1,877,500 SEK 1,082,500 SEK 1,120,000
Credit committee Participation
Chairman
11/11 10/11 8/11 11/11 -
Audit committee Participation 10/10 - 9/10 - -
Remuneration committee Participation
Chairman
11/11 - - - -
Risk committee Participation 8/8 - 7/8 -
Chairman
8/8
Board meetings Participation
Chairman
15/15 15/15 11/15 14/15 15/15
Own shareholdings and those of immediate family
126,475, of which 26,475 in
indirect holdings3.
67,275,000 3,800 5,000 8,700
Dependent/ Independent
Not independent of the Bank
and its management (former
CEO).4
Not independent of major
shareholders (Deputy Chair-
man of AB Industrivärden).
Independent of the Bank and
its management.
Not independent of major
shareholders (Chairman of AB
Industrivärden).
Independent of the Bank,
its management and major
shareholders.
Independent of the Bank,
its management and major
shareholders.
Independent of the Bank,
its management and major
shareholders.
Number of assignments 5
Actual number of assignments 6
57
14
47
9
4
5
3
5
4
10
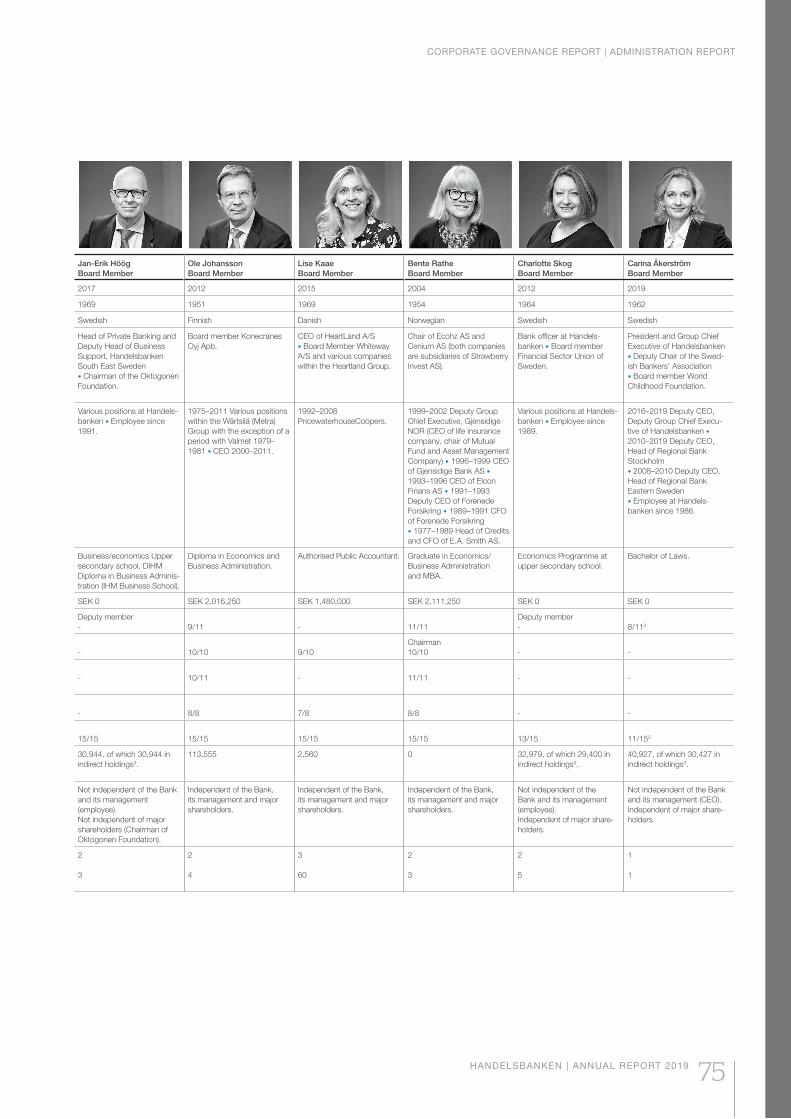
CORPORATE GOVERNANCE REPORT | ADMINISTRATION REPORT
HANDELSBANKEN | ANNUAL REPORT 2019 75
Jan-Erik Höög Board Member
Ole Johansson Board Member
Lise Kaae Board Member
Bente Rathe Board Member
Charlotte Skog Board Member
Carina Åkerström Board Member
2017 2012 2015 2004 2012 2019
1969 1951 1969 1954 1964 1962
Swedish Finnish Danish Norwegian Swedish Swedish
Head of Private Banking and
Deputy Head of Business
Support, Handelsbanken
South East Sweden
Chairman of the Oktogonen
Foundation.
Board member Konecranes
Oyj Apb.
CEO of HeartLand A/S
Board Member Whiteway
A/S and various companies
within the Heartland Group.
Chair of Ecohz AS and
Cenium AS (both companies
are subsidiaries of Strawberry
Invest AS).
Bank officer at Handels-
banken Board member
Financial Sector Union of
Sweden.
President and Group Chief
Executive of Handelsbanken
Deputy Chair of the Swed-
ish Bankers’ Association
Board member World
Childhood Foundation.
Various positions at Handels-
banken Employee since
1991.
1975–2011 Various positions
within the Wärtsilä (Metra)
Group with the exception of a
period with Valmet 1979–
1981 CEO 2000–2011.
1992–2008
PricewaterhouseCoopers.
1999–2002 Deputy Group
Chief Executive, Gjensidige
NOR (CEO of life insurance
company, chair of Mutual
Fund and Asset Management
Company) 1996–1999 CEO
of Gjensidige Bank AS
1993–1996 CEO of Elcon
Finans AS 1991–1993
Deputy CEO of Forenede
Forsikring 1989–1991 CFO
of Forenede Forsikring
1977–1989 Head of Credits
and CFO of E.A. Smith AS.
Various positions at Handels-
banken Employee since
1989.
2016–2019 Deputy CEO,
Deputy Group Chief Execu-
tive of Handelsbanken
2010–2019 Deputy CEO,
Head of Regional Bank
Stockholm
2008–2010 Deputy CEO,
Head of Regional Bank
Eastern Sweden
Employee at Handels-
banken since 1986.
Business/economics Upper
secondary school, DIHM
Diploma in Business Adminis-
tration (IHM Business School).
Diploma in Economics and
Business Administration.
Authorised Public Accountant. Graduate in Economics/
Business Administration
and MBA.
Economics Programme at
upper secondary school.
Bachelor of Laws.
SEK 0 SEK 2,016,250 SEK 1,480,000 SEK 2,111,250 SEK 0 SEK 0
Deputy member
- 9/11 - 11/11
Deputy member
- 8/112
- 10/10 9/10
Chairman
10/10 - -
- 10/11 - 11/11 - -
- 8/8 7/8 8/8 - -
15/15 15/15 15/15 15/15 13/15 11/152
30,944, of which 30,944 in
indirect holdings3.
113,555 2,560 0 32,979, of which 29,400 in
indirect holdings3.
40,927, of which 30,427 in
indirect holdings3.
Not independent of the Bank
and its management
(employee).
Not independent of major
shareholders (Chairman of
Oktogonen Foundation).
Independent of the Bank,
its management and major
shareholders.
Independent of the Bank,
its management and major
shareholders.
Independent of the Bank,
its management and major
shareholders.
Not independent of the
Bank and its management
(employee).
Independent of major share-
holders.
Not independent of the Bank
and its management (CEO).
Independent of major share-
holders.
2
3
2
4
3
60
2
3
2
5
1
1
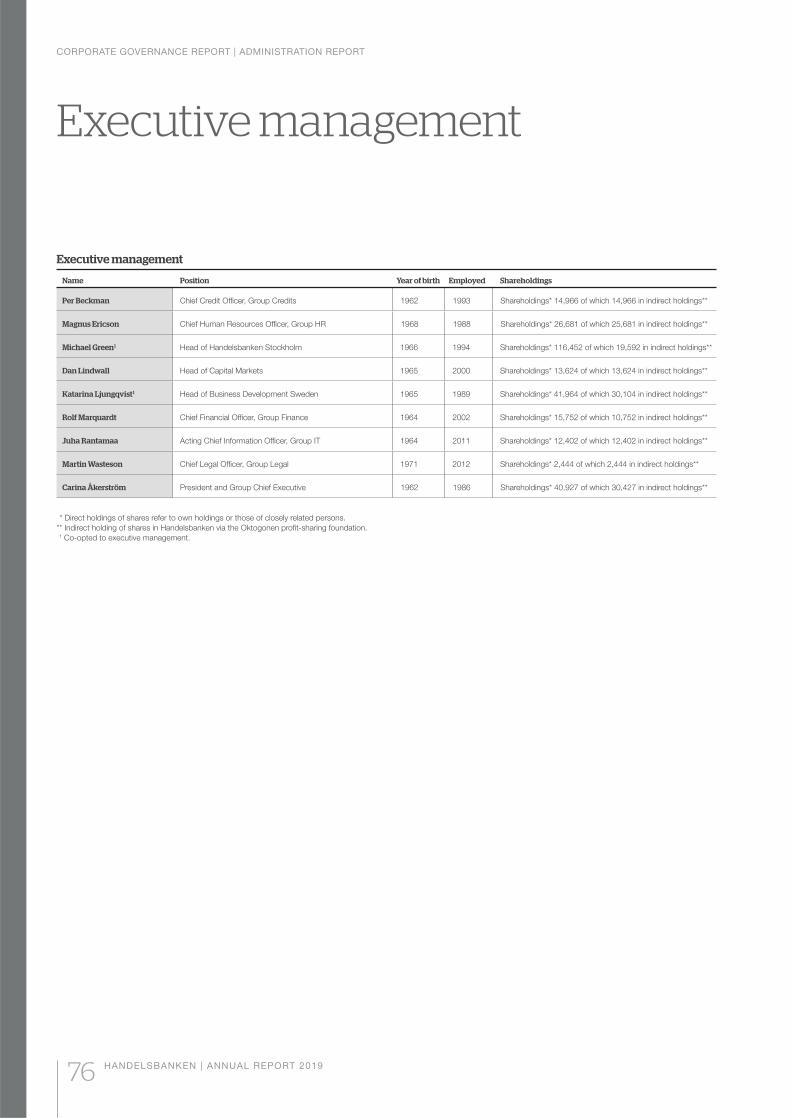
CORPORATE GOVERNANCE REPORT | ADMINISTRATION REPORT
76 HANDELSBANKEN | ANNUAL REPORT 2019
Executive management
Executive management
Name Position Year of birth Employed Shareholdings
Per Beckman Chief Credit Officer, Group Credits 1962 1993 Shareholdings* 14,966 of which 14,966 in indirect holdings**
Magnus Ericson Chief Human Resources Officer, Group HR 1968 1988 Shareholdings* 26,681 of which 25,681 in indirect holdings**
Michael Green 1 Head of Handelsbanken Stockholm 1966 1994 Shareholdings* 116,452 of which 19,592 in indirect holdings**
Dan Lindwall Head of Capital Markets 1965 2000 Shareholdings* 13,624 of which 13,624 in indirect holdings**
Katarina Ljungqvist 1 Head of Business Development Sweden 1965 1989 Shareholdings* 41,964 of which 30,104 in indirect holdings**
Rolf Marquardt Chief Financial Officer, Group Finance 1964 2002 Shareholdings* 15,752 of which 10,752 in indirect holdings**
Juha Rantamaa Acting Chief Information Officer, Group IT 1964 2011 Shareholdings* 12,402 of which 12,402 in indirect holdings**
Martin Wasteson Chief Legal Officer, Group Legal 1971 2012 Shareholdings* 2,444 of which 2,444 in indirect holdings**
Carina Åkerström President and Group Chief Executive 1962 1986 Shareholdings* 40,927 of which 30,427 in indirect holdings**
* Direct holdings of shares refer to own holdings or those of closely related persons.
** Indirect holding of shares in Handelsbanken via the Oktogonen profit-sharing foundation.
1 Co-opted to executive management.
CONTENTS
Income statement 78
Statement of comprehensive income 79
Balance sheet 80
Statement of changes in equity 81
Cash flow statement 83
Notes, Group 84
G1 Accounting policies and other bases for preparing the financial reports 84
G2 Risk and capital management 96
G3 Net interest income 134
G4 Net fee and commission income 134
G5 Net gains/losses on financial transactions 135
G6 Risk result – insurance 135
G7 Other income 135
G8 Staff costs 136
G9 Other expenses 140
G10 Credit losses 140
G11 Gains/losses on disposal of property, equipment and intangible assets 146
G12 Earnings per share 146
G13 Other loans to central banks 146
G14 Loans to other credit institutions 147
G15 Loans to the public 147
G16 Interest-bearing securities 148
G17 Shares 148
G18 Investments in associates 149
G19 Assets where the customer bears the value change risk 149
G20 Interests in unconsolidated structured entities 149
G21 Derivative instruments 150
G22 Hedge accounting 151
G23 Offsetting of financial instruments 155
G24 Intangible assets 156
G25 Property and equipment 157
G26 Other assets 158
G27 Prepaid expenses and accrued income 158
G28 Due to credit institutions 158
G29 Deposits and borrowing from the public 159
G30 Liabilities where the customer bears the value change risk 159
G31 Issued securities 160
G32 Short positions 160
G33 Insurance liabilities 160
G34 Taxes 161
G35 Provisions 162
G36 Other liabilities 162
G37 Accrued expenses and deferred income 162
G38 Subordinated liabilities 163
G39 Classification of financial assets and liabilities 164
G40 Fair value measurement of financial instruments 165
G41 Pledged assets, collateral received and transferred financial assets 168
G42 Contingent liabilities 169
G43 Leasing 170
G44 Segment reporting 172
G45 Geographical information 174
G46 Assets and liabilities by currency 175
G47 Related-party disclosures 176
G48 Events after the balance sheet date 176
G49 Capital adequacy 177
Financial reports Group
77

Income statement, Group
Group
SEK m 2019 2018
Interest income Note G3 54 395 49 171
of which interest income according to effective interest method and interest on derivatives for hedging 53 798 48 341
Interest expenses Note G3 -22 260 -17 885
Net interest income 32 135 31 286
Fee and commission income Note G4 12 762 12 183
Fee and commission expenses Note G4 -2 065 -1 936
Net fee and commission income 10 697 10 247
Net gains/losses on financial transactions Note G5 1 299 908
Risk result – insurance Note G6 145 106
Other dividend income 113 218
Share of profit of associates Note G18 32 0
Other income Note G7 143 1 005
Total income 44 564 43 770
Staff costs Note G8 -13 549 -13 465
Other expenses Note G9 -6 524 -6 712
Depreciation, amortisation and impairment of property, equipment and intangible assets Note G24, G25 -1 670 -713
Total expenses -21 743 -20 890
Profit before credit losses 22 821 22 880
Net credit losses Note G10 -1 045 -881
Gains/losses on disposal of property, equipment and intangible assets Note G11 20 14
Operating profit 21 796 22 013
Taxes Note G34 -4 871 -4 656
Profit for the year 16 925 17 357
attributable to
Shareholders in Svenska Handelsbanken AB 16 922 17 354
Non-controlling interest 3 3
Earnings per share, SEK Note G12 8.65 8.93
after dilution Note G12 8.58 8.84
INCOME STATEMENT | GROUP
78 HANDELSBANKEN | ANNUAL REPORT 2019
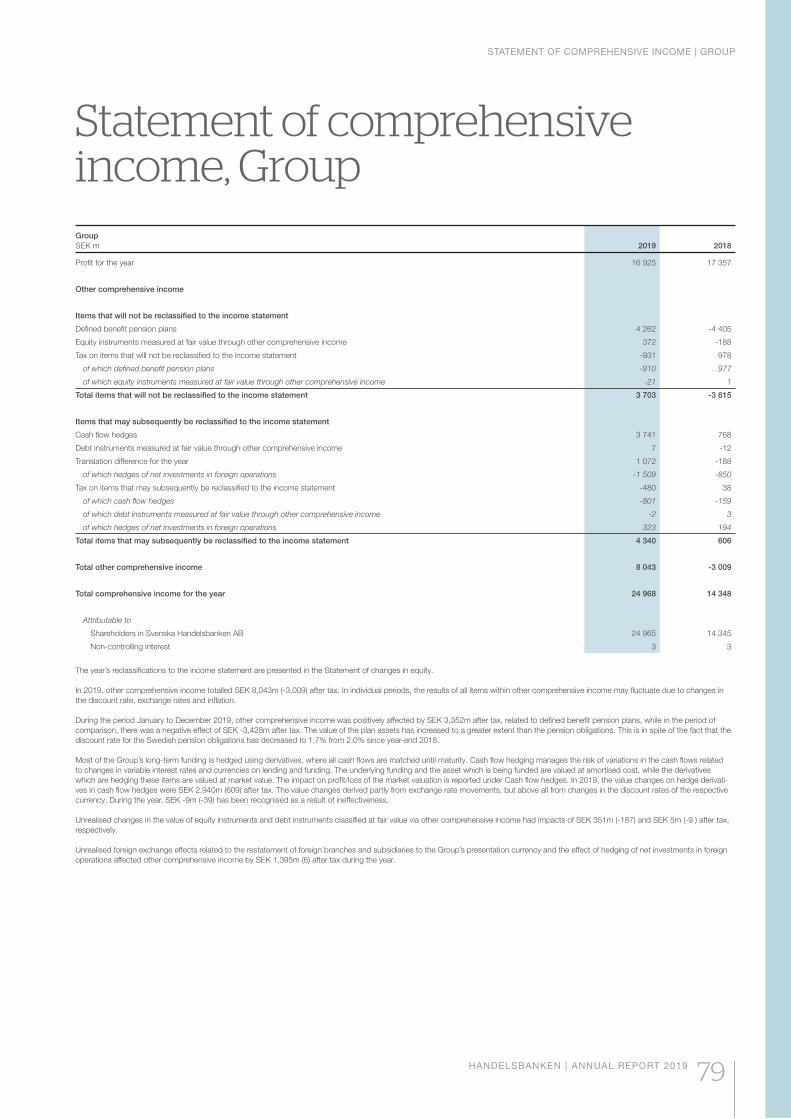
Statement of comprehensive income, GroupGroup
SEK m 2019 2018
Profit for the year 16 925 17 357
Other comprehensive income
Items that will not be reclassified to the income statement
Defined benefit pension plans 4 262 -4 405
Equity instruments measured at fair value through other comprehensive income 372 -188
Tax on items that will not be reclassified to the income statement -931 978
of which defined benefit pension plans -910 977
of which equity instruments measured at fair value through other comprehensive income -21 1
Total items that will not be reclassified to the income statement 3 703 -3 615
Items that may subsequently be reclassified to the income statement
Cash flow hedges 3 741 768
Debt instruments measured at fair value through other comprehensive income 7 -12
Translation difference for the year 1 072 -188
of which hedges of net investments in foreign operations -1 509 -850
Tax on items that may subsequently be reclassified to the income statement -480 38
of which cash flow hedges -801 -159
of which debt instruments measured at fair value through other comprehensive income -2 3
of which hedges of net investments in foreign operations 323 194
Total items that may subsequently be reclassified to the income statement 4 340 606
Total other comprehensive income 8 043 -3 009
Total comprehensive income for the year 24 968 14 348
Attributable to
Shareholders in Svenska Handelsbanken AB 24 965 14 345
Non-controlling interest 3 3
The year’s reclassifications to the income statement are presented in the Statement of changes in equity.
In 2019, other comprehensive income totalled SEK 8,043m (-3,009) after tax. In individual periods, the results of all items within other comprehensive income may fluctuate due to changes in
the discount rate, exchange rates and inflation.
During the period January to December 2019, other comprehensive income was positively affected by SEK 3,352m after tax, related to defined benefit pension plans, while in the period of
comparison, there was a negative effect of SEK -3,428m after tax. The value of the plan assets has increased to a greater extent than the pension obligations. This is in spite of the fact that the
discount rate for the Swedish pension obligations has decreased to 1.7% from 2.0% since year-end 2018.
Most of the Group’s long-term funding is hedged using derivatives, where all cash flows are matched until maturity. Cash flow hedging manages the risk of variations in the cash flows related
to changes in variable interest rates and currencies on lending and funding. The underlying funding and the asset which is being funded are valued at amortised cost, while the derivatives
which are hedging these items are valued at market value. The impact on profit/loss of the market valuation is reported under Cash flow hedges. In 2019, the value changes on hedge derivati-
ves in cash flow hedges were SEK 2,940m (609) after tax. The value changes derived partly from exchange rate movements, but above all from changes in the discount rates of the respective
currency. During the year, SEK -9m (-39) has been recognised as a result of ineffectiveness.
Unrealised changes in the value of equity instruments and debt instruments classified at fair value via other comprehensive income had impacts of SEK 351m (-187) and SEK 5m (-9 ) after tax,
respectively.
Unrealised foreign exchange effects related to the restatement of foreign branches and subsidiaries to the Group’s presentation currency and the effect of hedging of net investments in foreign
operations affected other comprehensive income by SEK 1,395m (6) after tax during the year.
STATEMENT OF COMPREHENSIVE INCOME | GROUP
HANDELSBANKEN | ANNUAL REPORT 2019 79
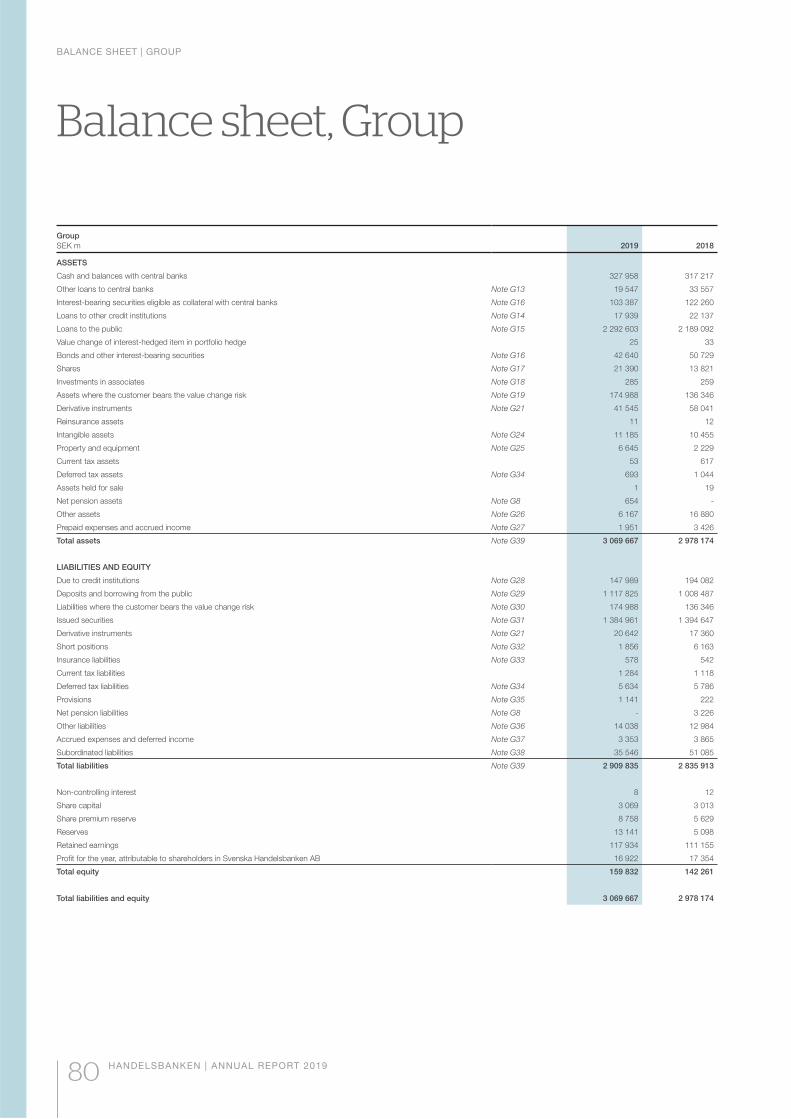
Balance sheet, Group
Group
SEK m 2019 2018
ASSETS
Cash and balances with central banks 327 958 317 217
Other loans to central banks Note G13 19 547 33 557
Interest-bearing securities eligible as collateral with central banks Note G16 103 387 122 260
Loans to other credit institutions Note G14 17 939 22 137
Loans to the public Note G15 2 292 603 2 189 092
Value change of interest-hedged item in portfolio hedge 25 33
Bonds and other interest-bearing securities Note G16 42 640 50 729
Shares Note G17 21 390 13 821
Investments in associates Note G18 285 259
Assets where the customer bears the value change risk Note G19 174 988 136 346
Derivative instruments Note G21 41 545 58 041
Reinsurance assets 11 12
Intangible assets Note G24 11 185 10 455
Property and equipment Note G25 6 645 2 229
Current tax assets 53 617
Deferred tax assets Note G34 693 1 044
Assets held for sale 1 19
Net pension assets Note G8 654 -
Other assets Note G26 6 167 16 880
Prepaid expenses and accrued income Note G27 1 951 3 426
Total assets Note G39 3 069 667 2 978 174
LIABILITIES AND EQUITY
Due to credit institutions Note G28 147 989 194 082
Deposits and borrowing from the public Note G29 1 117 825 1 008 487
Liabilities where the customer bears the value change risk Note G30 174 988 136 346
Issued securities Note G31 1 384 961 1 394 647
Derivative instruments Note G21 20 642 17 360
Short positions Note G32 1 856 6 163
Insurance liabilities Note G33 578 542
Current tax liabilities 1 284 1 118
Deferred tax liabilities Note G34 5 634 5 786
Provisions Note G35 1 141 222
Net pension liabilities Note G8 - 3 226
Other liabilities Note G36 14 038 12 984
Accrued expenses and deferred income Note G37 3 353 3 865
Subordinated liabilities Note G38 35 546 51 085
Total liabilities Note G39 2 909 835 2 835 913
Non-controlling interest 8 12
Share capital 3 069 3 013
Share premium reserve 8 758 5 629
Reserves 13 141 5 098
Retained earnings 117 934 111 155
Profit for the year, attributable to shareholders in Svenska Handelsbanken AB 16 922 17 354
Total equity 159 832 142 261
Total liabilities and equity 3 069 667 2 978 174
BALANCE SHEET | GROUP
80 HANDELSBANKEN | ANNUAL REPORT 2019
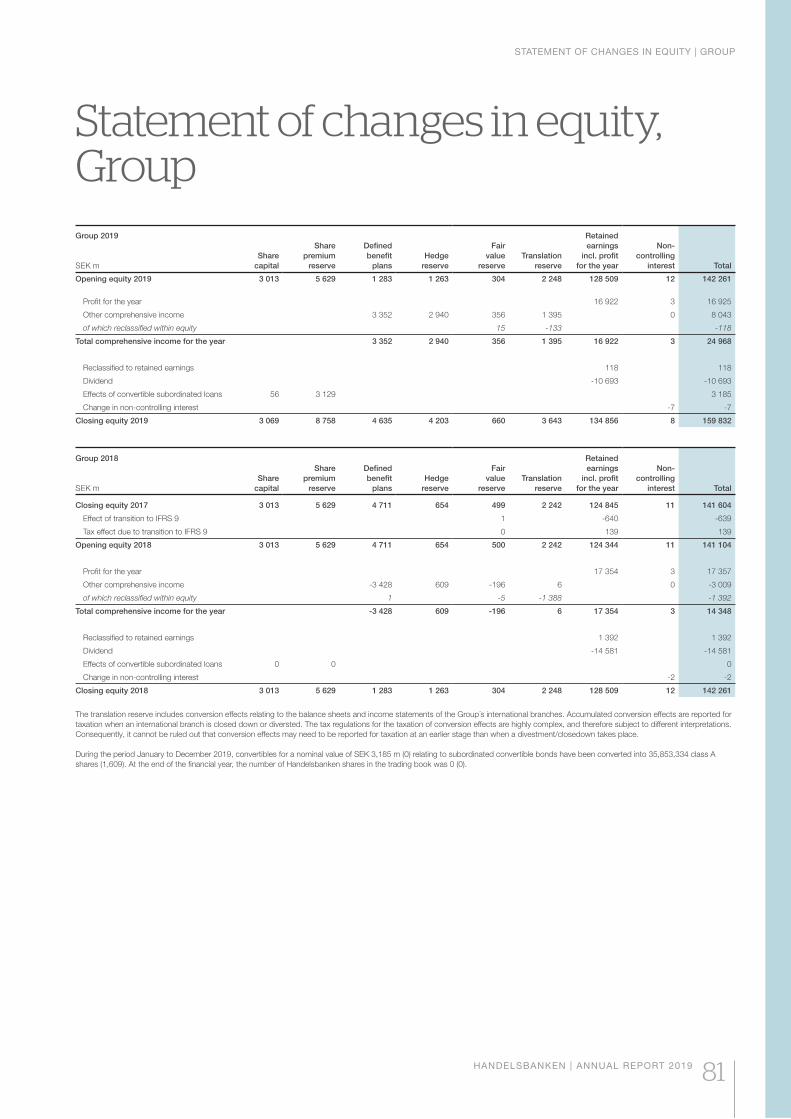
Statement of changes in equity, GroupGroup 2019
SEK m
Share
capital
Share
premium
reserve
Defined
benefit
plans
Hedge
reserve
Fair
value
reserve
Translation
reserve
Retained
earnings
incl. profit
for the year
Non-
controlling
interest Total
Opening equity 2019 3 013 5 629 1 283 1 263 304 2 248 128 509 12 142 261
Profit for the year 16 922 3 16 925
Other comprehensive income 3 352 2 940 356 1 395 0 8 043
of which reclassified within equity 15 -133 -118
Total comprehensive income for the year 3 352 2 940 356 1 395 16 922 3 24 968
Reclassified to retained earnings 118 118
Dividend -10 693 -10 693
Effects of convertible subordinated loans 56 3 129 3 185
Change in non-controlling interest -7 -7
Closing equity 2019 3 069 8 758 4 635 4 203 660 3 643 134 856 8 159 832
Group 2018
SEK m
Share
capital
Share
premium
reserve
Defined
benefit
plans
Hedge
reserve
Fair
value
reserve
Translation
reserve
Retained
earnings
incl. profit
for the year
Non-
controlling
interest Total
Closing equity 2017 3 013 5 629 4 711 654 499 2 242 124 845 11 141 604
Effect of transition to IFRS 9 1 -640 -639
Tax effect due to transition to IFRS 9 0 139 139
Opening equity 2018 3 013 5 629 4 711 654 500 2 242 124 344 11 141 104
Profit for the year 17 354 3 17 357
Other comprehensive income -3 428 609 -196 6 0 -3 009
of which reclassified within equity 1 -5 -1 388 -1 392
Total comprehensive income for the year -3 428 609 -196 6 17 354 3 14 348
Reclassified to retained earnings 1 392 1 392
Dividend -14 581 -14 581
Effects of convertible subordinated loans 0 0 0
Change in non-controlling interest -2 -2
Closing equity 2018 3 013 5 629 1 283 1 263 304 2 248 128 509 12 142 261
The translation reserve includes conversion effects relating to the balance sheets and income statements of the Group´s international branches. Accumulated conversion effects are reported for
taxation when an international branch is closed down or diversted. The tax regulations for the taxation of conversion effects are highly complex, and therefore subject to different interpretations.
Consequently, it cannot be ruled out that conversion effects may need to be reported for taxation at an earlier stage than when a divestment/closedown takes place.
During the period January to December 2019, convertibles for a nominal value of SEK 3,185 m (0) relating to subordinated convertible bonds have been converted into 35,853,334 class A
shares (1,609). At the end of the financial year, the number of Handelsbanken shares in the trading book was 0 (0).
STATEMENT OF CHANGES IN EQUITY | GROUP
HANDELSBANKEN | ANNUAL REPORT 2019 81
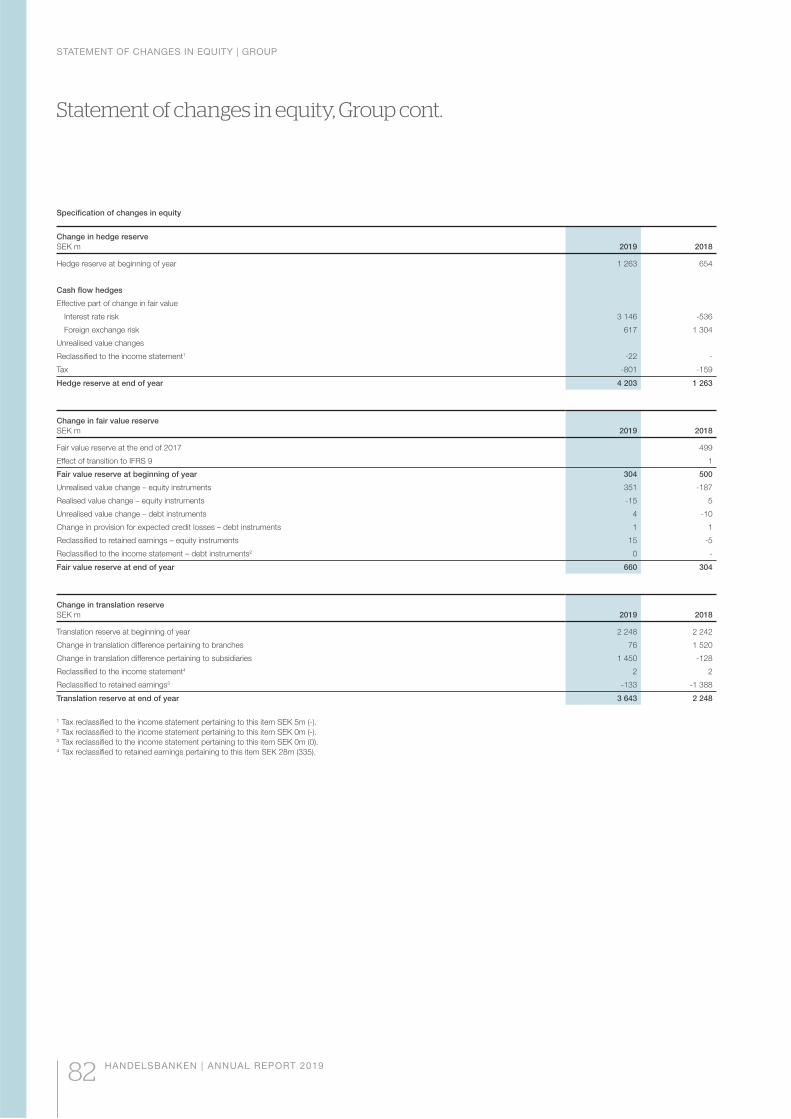
Specification of changes in equity
Change in hedge reserve
SEK m 2019 2018
Hedge reserve at beginning of year 1 263 654
Cash flow hedges
Effective part of change in fair value
Interest rate risk 3 146 -536
Foreign exchange risk 617 1 304
Unrealised value changes
Reclassified to the income statement1 -22 -
Tax -801 -159
Hedge reserve at end of year 4 203 1 263
Change in fair value reserve
SEK m 2019 2018
Fair value reserve at the end of 2017 499
Effect of transition to IFRS 9 1
Fair value reserve at beginning of year 304 500
Unrealised value change – equity instruments 351 -187
Realised value change – equity instruments -15 5
Unrealised value change – debt instruments 4 -10
Change in provision for expected credit losses – debt instruments 1 1
Reclassified to retained earnings – equity instruments 15 -5
Reclassified to the income statement – debt instruments2 0 -
Fair value reserve at end of year 660 304
Change in translation reserve
SEK m 2019 2018
Translation reserve at beginning of year 2 248 2 242
Change in translation difference pertaining to branches 76 1 520
Change in translation difference pertaining to subsidiaries 1 450 -128
Reclassified to the income statement4 2 2
Reclassified to retained earnings5 -133 -1 388
Translation reserve at end of year 3 643 2 248
1 Tax reclassified to the income statement pertaining to this item SEK 5m (-).2 Tax reclassified to the income statement pertaining to this item SEK 0m (-).3 Tax reclassified to the income statement pertaining to this item SEK 0m (0).4 Tax reclassified to retained earnings pertaining to this item SEK 28m (335).
Statement of changes in equity, Group cont.
STATEMENT OF CHANGES IN EQUITY | GROUP
82 HANDELSBANKEN | ANNUAL REPORT 2019

Cash flow statement, Group
Group
SEK m 2019 2018
OPERATING ACTIVITIES
Operating profit, total operations 21 796 22 013
of which paid-in interest 54 358 50 266
of which paid-out interest -23 964 -17 648
of which paid-in dividends 249 372
Adjustment for non-cash items in profit/loss
Credit losses 1 297 1 057
Unrealised changes in value -130 1 589
Depreciation, amortisation and impairment 1 670 713
Paid income tax -5 325 -5 106
Changes in the assets and liabilities of operating activities
Other loans to central banks 14 010 5 363
Loans to other credit institutions 4 198 -1 887
Loans to the public -104 758 -124 830
Interest-bearing securities and shares 19 916 4 872
Due to credit institutions -46 093 19 262
Deposits and borrowing from the public 109 338 66 520
Issued securities -9 686 118 051
Derivative instruments, net positions 20 137 -9 381
Short positions -4 439 4 178
Claims and liabilities on investment banking settlements 7 380 -7 311
Other -6 933 -18 441
Cash flow from operating activities 22 378 76 662
INVESTING ACTIVITIES
Acquisitions of and contributions to associates -134 -219
Sales of shares 39 262
Acquisitions of property and equipment -1 094 -695
Disposals of property and equipment 562 312
Acquisitions of intangible assets -1 120 -786
Cash flow from investing activities -1 747 -1 126
FINANCING ACTIVITIES
Repayment of subordinated loans -17 730 -
Issued subordinated loans 4 670 15 449
Dividend paid -10 693 -14 581
Cash flow from financing activities -23 753 868
of which changes in foreign exchange rates 669 4 132
Cash flow for the year -3 122 76 404
Liquid funds at beginning of year 317 217 226 314
Cash flow from operating activities 22 378 76 662
Cash flow from investing activities -1 747 -1 126
Cash flow from financing activities -23 753 868
Exchange difference on liquid funds 13 863 14 499
Liquid funds at end of year 327 958 317 217
The cash flow statement has been prepared in accordance with the indirect method, which means that operating profit has been adjusted for transactions that did not entail paid-in or paid-out
cash such as depreciations and credit losses.
Liquid funds are defined as cash and balances with central banks.
CASH FLOW STATEMENT | GROUP
HANDELSBANKEN | ANNUAL REPORT 2019 83
Notes, Group
CONTENTS
1. Statement of compliance
2. Changed accounting policies
3. Changes in IFRS which are
yet to be applied
4. Basis of consolidation and presentation
5. Segment reporting
6. Assets and liabilities in foreign currencies
7. Recognition and derecognition of financial
instruments on the balance sheet
8. Financial instruments
9. Principles for fair value measurement
of financial assets and liabilities
10. Credit losses
11. Hedge accounting
12. Leases
13. Insurance operations
14. Intangible assets
15. Property and equipment
16. Provisions
17. Equity
18. Income
19. Employee benefits
20. Taxes
21. Estimates and material assessments
1. STATEMENT OF COMPLIANCE
Basis of accounting
The consolidated accounts have been prepared
in accordance with international financial report-
ing standards (IFRS) and interpretations of these
standards as adopted by the EU. In addition,
the accounting policies also adhere to the
Annual Accounts Act for Credit Institutions and
Securities Companies (1995:1559), and the
regulations and general guidelines issued by the
Swedish Financial Supervisory Authority in FFFS
2008:25, Annual Reports in Credit Institutions
and Securities Companies. RFR 1 Supplemen-
tary Accounting Rules for Groups, and state-
ments from the Swedish Financial Reporting
Board, are also applied in the consolidated
accounts.
The parent company’s accounting policies
are shown in note P1.
Issuing and adoption of annual report
The annual report and consolidated accounts
were approved for issue by the Board on 4
February 2020 and will be presented for
adoption by the AGM on 27 March 2020.
2. CHANGED ACCOUNTING POLICIES
IFRS 16 Leases
On 1 January 2019, IFRS 16 Leases, which
replaced IAS 17, entered into force in the EU.
The implementation of the standard mainly
affects accounting by lessees. Accounting for
lessors remains essentially unchanged. The
main change arising from the new standard is
that all lease contracts (with the exception of
short-term lease contracts and lease contracts
of low value) are recognised as an asset (right-
of-use asset) and as a liability on the lessee’s
balance sheet. In the income statement, the
straight-line expense for the operating lease
has been replaced by a charge for depreciation
on the leased asset and an interest expense
attributable to the lease liability. The main impact
on the Group’s accounts comes from account-
ing for contracts for the rental of premises.
Handelsbanken has applied the modified retro-
spective method in its implementation of the
standard. The comparative figures have there-
fore not been recalculated. As at the transition
date to IFRS 16, 1 January 2019, the asset
(right-of-use assets) amounted to SEK 4.2
billion and the lease liability to SEK 4.2 billion.
The opening balance of retained earnings was
not affected by an initial impact in conjunction
with the transition, as the Bank applied the
alternative of recognising all right-of-use
assets, as at the first date of application, at an
amount corresponding to the lease liability,
adjusted for any prepaid or accrued lease fees
related to the lease agreements.
Amendments to IFRS 9 Financial Instru-
ments, IAS 39 Financial Instruments:
Recognition and measurement and IFRS 7
Financial Instruments: Disclosures
Amendments have been made which introduce
temporary exemptions from applying certain
specific hedge accounting requirements for all
hedging relationships directly affected by the
Interest Rate Benchmark Reform. The purpose
of the temporary exemptions is to prevent the
break-up of otherwise effective hedging rela-
tionships solely due to the uncertainty brought
about by the Interest Rate Benchmark Reform.
According to the regulations, a direct impact on
the hedging relationship exists only if this
causes uncertainty about the benchmark rate
relating to the hedged risk and/or dates or
amounts regarding cash flows from the hedged
item or hedging instrument that are based on
the benchmark rate.
The uncertainty about the benchmark rate will
persist until such time as a decision has been
made about which rate will be the alternative
interest rate, as well as about if and when the
reform will be implemented, including a specifi-
cation of the effects on individual contracts.
The amendments to IAS 39, IFRS 9 and IFRS
7 have been approved by the EU and are effec-
tive from 1 January 2020. However, early adop-
tion is permitted. The amendments are to be
applied retroactively to the hedging relationships
in existence at the start of the reporting period in
which the company chooses to apply the
amendments for the first time, or which arise
thereafter, and to gains and losses recognised
under Other comprehensive income in existence
at the start of this reporting period. The Bank has
chosen to early adopt the amendments.
In other respects, the accounting policies
and calculation methods applied by the Group
during the financial year are consistent with the
policies applied in the 2018 annual report.
3. CHANGES IN IFRS WHICH
ARE YET TO BE APPLIED
IFRS 17 Insurance contracts
IFRS 17 Insurance contracts has been published
by the IASB. Assuming that IFRS 17 is adopted
by the EU, and the date of implementation pro-
posed by the IASB is not changed, this stand-
ard is to be applied as of the 2022 financial year.
IFRS 17 entails a change in how insurance con-
tracts are recognised, presented and valued. It
will also entail extended disclosure requirements.
The Bank is currently analysing the financial
effects of the new standard.
Other changes in IFRS
None of the other changes in the accounting
regulations issued for application are assessed
to have a material impact on Handelsbanken’s
financial reports, capital adequacy, large expo-
sures or other circumstances according to the
applicable regulatory requirements.
4. BASIS OF CONSOLIDATION
AND PRESENTATION
Subsidiaries
All companies directly or indirectly controlled by
Handelsbanken (subsidiaries) have been fully
consolidated. The Bank is deemed to have
direct control of a company when it is exposed
to, or is entitled to, variable returns from its hold-
ings in the company and can affect the return by
means of its influence over the company. As a
rule, control exists if Handelsbanken owns more
than 50 per cent of the voting power at share-
holders’ meetings or the equivalent.
Subsidiaries are consolidated according to
the acquisition method. This means that the
acquisition of a subsidiary is regarded as a
transaction where the Group acquires the com-
pany’s identifiable assets and assumes its liabili-
ties and obligations. In the case of business
combinations, an acquisition balance sheet is
prepared, where identifiable assets and liabilities
are valued at fair value at the acquisition date.
The cost of the business combination comprises
the fair value of all assets, liabilities and issued
equity instruments provided as payment for the
net assets in the subsidiary. Any surplus due to
the cost of the business combination exceeding
the identifiable net assets on the acquisition
G1 Accounting policies and other bases for preparing the financial reports
NOTES | GROUP
84 HANDELSBANKEN | ANNUAL REPORT 2019
balance sheet is recognised as goodwill in the
Group’s balance sheet. Acquisition-related
expenses are recognised when they arise. The
subsidiary’s financial reports are included in the
consolidated accounts starting on the acquisi-
tion date until the date on which control ceases.
Intra- group transactions and balances are elimi-
nated when preparing the Group’s financial
reports.
When accounting for business combinations,
the acquired operations are recognised in the
Group’s accounts from the acquisition date. The
acquisition date is the date when controlling
influence of the acquired entity starts. The acqui-
sition date may differ from the date when the
transaction is legally established.
Where the accounting policies applied for an
individual subsidiary do not correspond to the
policies applied in the Group, an adjustment is
made to the consolidated accounts when con-
solidating the subsidiary.
Structured entities
A structured entity is a company formed to
achieve a limited and well-defined purpose,
where the voting rights are not the definitive fac-
tor in determining whether control exists. Han-
delsbanken’s holdings in structured entities are
restricted to holdings in mutual funds. Funds for
which the Bank is asset manager and where the
Bank owns more than 50 per cent of the shares
are consolidated in their entirety on the balance
sheet under Assets/Liabilities where the cus-
tomer bears the value change risk. Ownership
of between 20 and 50 per cent is consolidated
in certain cases if the circumstances indicate
that the Bank has a controlling interest, for
example if the fund has a broad management
mandate and generates a high proportion of
variable return. Funds which the Bank owns
through unit-linked insurance contracts are not
consolidated. Additional information on hold-
ings in non-consolidated structured entities is
provided in note G20.
Associated companies
Companies in which Handelsbanken has a sig-
nificant influence are reported as associated
companies. A significant influence entails the
right to participate in decisions concerning the
company’s financial and operating strategies but
does not give control over these. As a rule, a sig-
nificant influence exists when the share of voting
power in the company is at least 20 per cent and
at most 50 per cent. Associated companies are
reported in the consolidated accounts in accord-
ance with the equity method. This means that the
holding is initially reported at cost. The carrying
amount is increased or decreased to recognise
the Group’s share of the associated company’s
profits or losses after the date of acquisition.
Any dividends from associated companies are
deducted from the carrying amount of the hold-
ing. Shares of the profit of associated companies
are reported as Share of profit of associates on a
separate row in the Group’s income statement.
Assets held for sale and accounting
of discontinued operations
Non-current assets or a group of assets (dis-
posal group) are classified as held for sale when
the carrying amount will be mainly recovered
through a sale and when a sale is highly prob-
able. If an asset is classified as held for sale,
special valuation principles are applied. These
principles essentially mean that, with the
exception of items such as financial assets and
liabilities (see point 8), assets held for sale and
disposal groups are measured at the lower of
the carrying amount and fair value less costs
to sell. Thus, property, plant and equipment or
intangible assets held for sale are not depreci-
ated or amortised. Any impairment losses
and subsequent revaluations are recognised
directly in the income statement. Gains are not
recognised if they exceed accumulated impair-
ment losses. Assets and liabilities held for sale
are reported as a separate item on the Group’s
balance sheet until the time of sale.
Independent operations of a material nature
which can be clearly differentiated from the
Group’s other operations and which are classi-
fied as held for sale using the policies described
above are recognised as discontinued opera-
tions. Subsidiaries acquired solely for resale are
also recognised as discontinued operations. In
recognition as a discontinued operation, the
operation’s profit is reported on a separate row
in the income statement, separately from other
profit/loss items. Profit or loss from discontinued
operations comprises the profit or loss after tax
of discontinued operations, the profit or loss
after tax that arises when valuing the assets
held for sale/disposal groups that are included
in discontinued operations at fair value less
costs to sell, and realised gains/losses from
the disposal of discontinued operations.
5. SEGMENT REPORTING
The segment reporting presents income/
expenses and assets/liabilities broken down
by business segments. A business segment is
a part of the Group that runs operations which
generate external or internal income and
expenses and of which the profit/loss is regu-
larly assessed and followed up by executive
management as part of corporate governance.
The principles for segment reporting are
described further in note G44.
6. ASSETS AND LIABILITIES
IN FOREIGN CURRENCIES
The consolidated accounts are presented in
Swedish kronor, the Group’s presentation
currency. The functional currency for the
Group’s operations outside Sweden usually
differs from the Group’s presentation currency.
The currency used in the economic environ-
ment where the operations are primarily con-
ducted is regarded as the functional currency.
Translation of transactions in a currency
other than the functional currency
Transactions in a currency other than the func-
tional currency – foreign currency – are initially
translated into the functional currency at the rate
prevailing on the transaction date. Monetary
items in foreign currencies and non-monetary
items in foreign currencies that are measured
at fair value are converted at the balance sheet
date using the prevailing closing rate. Gains and
losses arising from the currency translation of
monetary items and non-monetary items meas-
ured at fair value are recognised in the income
statement as foreign exchange effects under
Net gains/losses on financial transactions.
Translation differences that have arisen from
non-monetary items classified as measured at
fair value through other comprehensive income
are recognised as a component of Other com-
prehensive income and are accumulated in
equity. Exchange differences arising when
translating monetary items comprising part
of a net investment in a foreign operation are
recognised in the same way.
Translation of foreign operations to
the Group’s presentation currency
When translating the foreign entities’ (including
branches’) balance sheets and income state-
ments from the functional currency to the
Group’s presentation currency, the current
method has been used. This means that assets
and liabilities are translated at the closing day
rate. Equity is translated at the rate applicable
at the time of investment or earning. The income
statement has been translated at the average
annual rate. Translation differences are recog-
nised as a component of Other comprehensive
income and are included in the translation
reserve in equity.
7. RECOGNITION AND DERECOGNITION
OF FINANCIAL INSTRUMENTS ON THE
BALANCE SHEET
Purchases and sales of equities and money
market and capital market instruments on the
spot market are recognised on the trade date,
which is the date on which an agreement is
entered into. The same applies to derivatives.
Other financial assets and liabilities are normally
recognised on the settlement date.
Financial assets are derecognised from the
balance sheet when the contractual rights to
the cash flows originating from the asset expire
or when all risks and rewards related to the
asset are transferred to another party. A
financial liability is derecognised from the
balance sheet when the obligation is fulfilled,
ceases or is cancelled.
The policies for recognising financial instru-
ments on the balance sheet are of special
importance when accounting for repurchase
transactions, securities loans and leases (see
the separate sections concerning these).
G1 Cont.
NOTES | GROUP
HANDELSBANKEN | ANNUAL REPORT 2019 85

8. FINANCIAL INSTRUMENTS
Measurement categories
All financial assets, in compliance with IFRS 9,
are allocated to one of the following measure-
ment categories:
1. amortised cost
2. fair value through other comprehensive
income
3. fair value through profit or loss
a. mandatory
b. fair value option
The starting point for the classification of finan-
cial assets into the respective measurement
categories is the company’s business model for
managing the financial instruments, as well as
whether the instruments’ contractual cash flows
only constitute solely payments of principal and
interest.
Financial liabilities are classified as follows:
1. amortised cost
2. fair value through profit or loss
a. mandatory
b. fair value option
As a general rule, financial liabilities are recog-
nised at amortised cost. The exceptions are
financial liabilities which are required to be
measured at fair value through profit or loss,
such as derivatives, and liabilities which, upon
initial recognition, are irrevocably identified as
being measured at fair value (fair value option).
Financial assets and liabilities recognised on
the same row on the balance sheet may be
classified in different measurement categories,
see note G39.
Upon initial recognition, all financial assets
and liabilities are designated at fair value. For
assets and liabilities at fair value through profit
or loss, the transaction costs are recognised in
the income statement on the acquisition date.
For other financial instruments, the transaction
costs are included in the acquisition cost.
Assessment of the business model
The business model for managing financial
assets defines classification into measurement
categories. The business model is determined
at the portfolio level, as this best reflects how
the operations are governed and how informa-
tion is reported to, and evaluated by, the Bank’s
management. Information of significance to
enabling a weighted assessment of the business
model for a portfolio includes the established
guidelines and objectives with a portfolio and
how these are implemented in the operations,
the risks which affect the performance of the
portfolio and how the risks are managed, as
well as the frequency, volume, reasons for and
times of sales.
Assessment of whether contractual
cash flows constitute solely payments
of principal and interest
The assessment of whether contractual cash
flows constitute solely payments of principal
and interest is significant for the classification
into measurement categories. For the purposes
of this assessment, ‘principal’ is defined as the
financial asset’s fair value upon initial recognition.
‘Interest’ is defined as consideration for the time
value of money, credit risk, other fundamental
lending risks (such as liquidity risk) and costs
(such as administrative expenses), as well as
a profit margin.
To assess whether the financial asset’s con-
tractual cash flows constitute solely payments
of principal and interest, the contractual terms
of the financial asset are reviewed. If there are
contractual terms that could change the timing
or amounts of the contractual cash flows, mod-
ify the consideration for the time value of money,
cause leverage or entail extra costs for prepay-
ment and extension, then the cash flows are
assessed as not constituting solely payments
of principal and interest.
Amortised cost
A financial asset is to be measured at amortised
cost if both of the following conditions are met:
• The objective of the business model is to
collect contractual cash flows.
• The contractual cash flows constitute solely
payments of principal and interest.
Financial assets recognised in the measurement
category amortised cost consist of loans and
holdings of interest-bearing securities that fulfil
the above conditions. These assets are subject
to impairment testing. Financial liabilities recog-
nised in the measurement category amortised
cost consist primarily of liabilities due to credit
institutions, deposits and borrowing from the
public, and issued securities.
Amortised cost consists of the discounted
present value of all future cash flows relating
to the instrument where the discount rate is
the instrument’s effective interest rate at the
time of acquisition.
Interest and credit losses relating to financial
instruments measured at amortised cost are
recognised in the income statement under Net
interest income and Credit losses, respectively.
Early repayment charges for loans redeemed
ahead of time, and capital gains/losses gener-
ated from repurchases of the Bank’s own issued
securities, are recognised in the income state-
ment under Net gains/losses on financial trans-
actions. Foreign exchange effects are also
recognised under Net gains/losses on financial
transactions.
Fair value through other
comprehensive income
A financial asset is to be measured at fair value
through other comprehensive income if both of
the following conditions are met:
• The objective of the business model is both
to collect contractual cash flows and to sell
the asset.
• The contractual cash flows constitute solely
payments of principal and interest.
Holdings of interest-bearing securities in the
Bank’s liquidity portfolio which satisfy the above
conditions are recognised in the fair value
through other comprehensive income measure-
ment category. These assets are subject to
impairment testing. Interest income is recog-
nised under Net interest income, while foreign
exchange effects and credit losses are recog-
nised under Net gains/losses on financial trans-
actions. Unrealised changes in value are recog-
nised in other comprehensive income and
reclassified to the income statement, under the
item Net gains/losses on financial transactions,
in conjunction with a sale.
Upon initial recognition, equity instruments
that are not held for trading may be irrevocably
classified as measured at fair value through
other comprehensive income. Subsequent
changes in value, both realised and unrealised
and including exchange gains/losses, are thus
recognised in other comprehensive income.
Realised changes in value are reclassified to
retained earnings, i.e. reclassified within equity,
and not to the income statement. Only dividend
income from these holdings is recognised in the
income statement. This valuation principle is
applied for certain shareholdings in companies
which engage in activities to support the Bank.
For example, these may refer to participating
interests in clearing organisations, or infrastruc-
ture collaborations on the Bank’s home mar-
kets. These shareholdings are long-term and
remain largely unchanged from year to year.
Fair value through profit or loss, mandatory
If a financial asset does not meet the conditions
for measurement at amortised cost or for meas-
urement at fair value through other comprehen-
sive income, measurement at fair value through
profit or loss is mandatory.
Financial assets and liabilities held for trading
are always classified as measured at fair value
through profit or loss, as are financial assets
managed and evaluated on a fair value basis.
The measurement category ‘fair value
through profit or loss, mandatory’ mainly
consists of listed shares, units in mutual funds,
interest-bearing securities and derivatives.
Interest, dividends, foreign exchange effects,
and realised and unrealised changes in value
related to these instruments are recognised in
the income statement under Net gains/losses
on financial transactions. For the recognition
of derivatives through hedge accounting, see
section 11.
Fair value through profit or loss,
fair value option
There is an option, at initial recognition, to
irrevocably designate a financial asset as
measured at fair value through profit or loss
if doing so eliminates or significantly reduces
a measurement or recognition inconsistency
(‘accounting mismatch’) that would otherwise
arise from measuring the asset.
G1 Cont.
NOTES | GROUP
86 HANDELSBANKEN | ANNUAL REPORT 2019
There is a corresponding option to irrevocably
designate, at initial recognition, a financial liabil-
ity as measured at fair value through profit or
loss if either of the following conditions is met:
• It eliminates or significantly reduces a meas-
urement or recognition inconsistency
(‘accounting mismatch’) that would otherwise
arise from measuring the liability.
• A group of financial liabilities or a group of
both financial assets and financial liabilities
is managed and its performance is evaluated
on a fair value basis, in accordance with a
documented risk management or investment
strategy, and information about these instru-
ments is provided internally to the Bank’s
management on that basis.
This valuation principle has been applied to
avoid inconsistencies when measuring assets
and liabilities which are counter-positions of
each other and which are managed on a port-
folio basis, such as liabilities resulting from unit-
linked insurance contracts and certain holdings
in the liquidity portfolio which are hedged with
economic hedges.
Unrealised and realised changes in the fair
value of financial instruments that are measured
at fair value through profit or loss via the fair value
option are recognised under Net gains/losses
on financial transactions. Interest attributable
to these instruments is recognised under Net
interest income.
Reclassifications of financial instruments
As a general rule, financial assets are not reclas-
sified after initial recognition. Reclassification
is permitted in the rare case that the Bank
changes the business model it applies for the
management of a portfolio of financial assets.
The reclassification of financial liabilities is not
permitted after initial recognition.
Financial guarantees and loan commitments
Financial guarantees are contracts that require
the issuer to make specified payments to reim-
burse the holder for a loss incurred because a
specified debtor fails to make payment when
due in accordance with the terms of a debt
instrument (loans and interest-bearing securi-
ties), for example, a credit guarantee. The fair
value of an issued guarantee is the same as the
premium received when it was issued. Upon
initial recognition, the premium received for
the guarantee is recognised as a liability under
Accrued expenses and deferred income on the
balance sheet. The guarantee is subsequently
measured at the higher of the amortised pre-
mium or the provision for the expected loss.
Premiums for issued financial guarantees are
amortised under Net fee and commission
income over the validity period of the guaran-
tee. In addition, the total guaranteed amount
relating to guarantees issued is reported off-
balance as a contingent liability, see note G42.
Premiums for purchased financial guarantees
are accrued and recognised as decreased inter-
est income under Net interest income if the
interest on the debt instrument to which the
guarantee refers is recognised there.
Loan commitments are reported off-balance
until the settlement date of the loan, see note
G42. Fees received for loan commitments are
accrued under net fee and commission income
over the maturity of the commitment unless it is
highly probable that the commitment will be ful-
filled. In such cases, received fees are included
in the effective interest of the loan.
Financial guarantees and irrevocable loan
commitments are subject to impairment testing.
Combined financial instruments
A combined financial instrument consists of an
embedded derivative and a non-derivative host
contract. Some of the combined instrument’s
cash flows vary in a way similar to the cash
flows of a stand-alone derivative.
If the host contract in a combined financial
instrument is a financial liability, an embedded
derivative must be separated from the host
contract and recognised as a derivative if all
of the following terms are met:
• The economic characteristics and risks of the
embedded derivative are not closely related
to the economic characteristics and risks of
the host contract.
• A separate instrument with the same terms
as the embedded derivative would meet the
definition of a derivative.
• The combined financial instrument is not
measured at fair value through profit or loss.
Consequently, derivatives embedded in
financial liabilities measured at fair value
through profit or loss are not recognised
separately.
Such separate recognition is applied, for exam-
ple, to issues of equity-linked bonds and other
structured products.
Separate recognition is not applied to com-
bined financial instruments when the host con-
tract is a financial asset. Financial assets with
embedded derivatives are regarded as a whole
when assessing whether their contractual cash
flows constitute solely payments of principal
and interest.
The inherent value of the option to convert
in issued convertible debt instruments is
recognised separately in equity. The value
of the equity component is determined at the
time of issue as the difference between the
fair value of the convertible debt instrument
in its entirety reduced by the fair value of the
liability component. The carrying amount of
the equity component is not adjusted during
the life of the convertible debt instrument. The
liability component is recognised at fair value
on the balance sheet at the time of issue. After
initial recognition, the liability component is
recognised at amortised cost based on the
original effective interest rate.
Repurchase agreements
and reverse repurchase agreements
Repurchase agreements, or repo transac-
tions, refer to agreements where the parties
simultaneously agree on the sale of specific
securities and the repurchase of these securi-
ties at a pre-determined price. Securities sold
in a repo transaction (repurchase agreement)
remain on the balance sheet during the life of
the transaction, as the Group is exposed to the
value change risk applying to the security during
this period. The sold instrument is also reported
off-balance as a pledged asset. Depend-
ing on the counterparty, payment received is
recognised under Due to credit institutions or
as Deposits and borrowing from the public.
Securities bought in a repo transaction (reverse
repurchase agreement) are accounted for in the
corresponding way, i.e. they are not recognised
on the balance sheet during the life of the trans-
action. Depending on the counterparty, the pay-
ment made is recognised under Other loans to
central banks, Loans to other credit institutions
or Loans to the public. Collateral received which
is sold on under repurchase agreements is rec-
ognised off-balance as a commitment.
Agreements for borrowing
and lending of securities
Lent securities remain on the balance sheet,
as the Group is still exposed to the value change
risk applying to the security, as well as being
reported off-balance as pledged assets.
Borrowed securities are not recognised on
the balance sheet unless they are sold (known
as shortselling). If they are sold, a value corre-
sponding to the sold instrument’s fair value is
recognised as a liability. Borrowed securities
which are lent to a third party are recognised
off-balance as commitments.
Derivative instruments
All derivatives are recognised on the balance
sheet at fair value. Derivatives with positive fair
values are recognised on the assets side under
Derivative instruments. Derivatives with negative
fair values are recognised on the liabilities side
under Derivative instruments. Realised and
unrealised gains and losses on derivatives are
recognised in the income statement under Net
gains/losses on financial transactions. For the
recognition of derivatives through hedge
accounting, see section 11.
Offset of financial assets and liabilities
Financial assets and liabilities are offset on the
balance sheet if the Bank has a contractual right
to offset, in its operating activities and in the
event of bankruptcy, and if the intention is to
settle the items on a net basis or to simultane-
ously liquidate the asset and settle the liability.
Further information about set-off of financial
assets and liabilities is provided in note G23.
G1 Cont.
NOTES | GROUP
HANDELSBANKEN | ANNUAL REPORT 2019 87
9. PRINCIPLES FOR FAIR VALUE
MEASUREMENT OF FINANCIAL
ASSETS AND LIABILITIES
Fair value is defined as the price that would be
received to sell an asset or paid to transfer a
liability in an orderly transaction between inde-
pendent market participants.
For financial instruments traded on an active
market, the fair value is the same as the quoted
market price. An active market is one where
quoted prices are readily and regularly available
from a regulated market, execution venue, relia-
ble news service or equivalent, and where the
price information can be verified by means of
regularly occurring transactions. The current
market price corresponds to the price between
the bid price and the offer price which is most
representative of fair value under the circum-
stances. For groups of financial instruments
which are managed on the basis of the Bank’s
net exposure to market risk, the current market
price is presumed to be the same as the price
which would be received or paid if the net posi-
tion were divested.
When there is no reliable information about
market prices for financial instruments, fair value
is established using valuation models. The valu-
ation models used are based on input data
which essentially can be verified using market
observations such as market interest rates and
share prices. If necessary, an adjustment is
made for other variables which a market par-
ticipant would be expected to take into consid-
eration when setting a price. The assumptions
used in the valuation are based on internally
generated experience and are continuously
reviewed by the risk control function. The result
is compared with the actual outcome so as to
identify any need for adaptations of assump-
tions and forecasting models.
Interest-bearing securities
Interest-bearing securities issued by govern-
ments and Swedish mortgage bonds are
valued using current market prices. Corporate
bonds are valued using valuation techniques
based on market yields for the corresponding
maturity adjusted for credit and liquidity risk.
The values are regularly reviewed in order to
ensure that they reflect the current market price.
The reviews are mainly performed by obtaining
prices from several independent price sources
and by reconciliation with recently performed
transactions in the same or equivalent instru-
ments.
Shares
Shares listed on an active market are valued at
market price. When valuing shares and partici-
pations in level 3, the choice of model is deter-
mined by what is deemed appropriate for the
individual instrument. Holdings of shares in level
3 mainly consist of shares in companies which
engage in activities to support the Bank. In all
material respects, shares in level 3 are classified
at fair value through other comprehensive
income. In general, such holdings are valued
at the Bank’s share of the company’s net asset
value. For shares in level 3 for which the com-
pany agreement regulates the price at which the
shares can be divested, the holdings are valued
at the predetermined divestment price.
When valuing level 3 units in private equity
funds, valuation principles adopted by the
European Venture Capital & Private Equity
Association (EVCA) are used. In these models,
the market value of the investments is derived
from a relative valuation of comparable listed
companies in the same sector. Adjustments
are made for profit/loss items that prevent
comparison between the investment and the
compared company, and the value of the invest-
ment is then determined on the basis of profit
multiples such as P/E and EV/EBITA. Changes
in value and capital gains on holdings in private
equity funds which comprise part of the invest-
ment assets in the insurance operations are not
reported directly in the income statement but
are included in the basis for calculating the yield
split in the insurance operations. See section 13.
Derivatives
Derivatives which are traded on an active
market are valued at market price. Most of the
Group’s derivative contracts, including interest
rate swaps and various types of linear currency
derivatives, are valued using valuation models
based on market rates and other market prices.
The valuation of non-linear derivative contracts
that are not actively traded is also based on a
reasonable assumption of market-based input
data such as volatility.
When performing model valuation for
derivatives, in some cases there are differences
between the transaction price and the value
measured by a valuation model upon initial
recognition. Such differences occur when the
applied valuation model does not fully incorpo-
rate all the components that affect the value of
the derivative. Unrealised results due to positive
differences between the transaction price and
the value measured by a valuation model (day
1 effect) are not recognised in profit/loss upon
initial recognition, but are amortised over the life
of the derivative. In addition, the Bank makes
an independent valuation of the total credit risk
component (own credit risk (DVA) as well as
counterparty risk (CVA)) in outstanding model-
valued derivatives. Changes in fair value due to
changed credit risk are recognised in profit/loss
to the extent that the overall effect exceeds non-
recognised day 1 effects.
Assets and liabilities where the
customer bears the value change risk
Assets where the customer bears the value
change risk mainly comprise shares in unit-
linked insurance contracts. These shares are
valued using the fund’s current market value
(NAV). Each asset corresponds to a liability
where the customer bears the value change
risk. The valuation of these liabilities reflects
the valuation of the assets. Since the policyhold-
ers/shareholders have prior rights to the assets,
there is no motive to adjust the valuation for
credit risk. Assets and liabilities where the cus-
tomer bears the value change risk have essen-
tially been classified at fair value through profit
or loss.
10. CREDIT LOSSES
Expected credit losses
The impairment rules presented in IFRS 9 apply
to financial assets at amortised cost, financial
assets at fair value through other comprehen-
sive income, as well as financial guarantees and
irrevocable loan commitments, and are based
on a model for the recognition of expected
credit losses (ECL). This model stipulates that
the provision must reflect a probability-weighted
amount determined through the evaluation of a
number of potential outcomes, with considera-
tion given to all reasonable and verifiable infor-
mation available on the reporting date without
unreasonable expense or exertion. The assess-
ment takes into account historical, current and
future-oriented factors. The assets to be tested
for impairment are divided into the following
three stages, depending on the degree of credit
impairment:
• Stage 1 comprises financial assets with no
significant increase in credit risk since initial
recognition.
• Stage 2 comprises financial assets with a
significant increase in credit risk since initial
recognition, but for which there is no objec-
tive evidence that the claim is credit-impaired
at the time of reporting.
• Stage 3 comprises financial assets for which
objective circumstances have been identified
indicating that the claim is credit-impaired.
For a definition of credit-impaired assets,
refer to the heading Default/Credit-impaired
asset below.
In Stage 1, provisions are to be recognised
which correspond to the loss expected to occur
within 12 months as a result of default. In Stage
2 and Stage 3, provisions are to be recognised
corresponding to the loss expected to occur at
some time during the whole of the remaining
maturity of the asset as a result of default.
For agreements in Stage 1 and Stage 2, there
is a Group-wide, central process using model-
based calculation. The process begins for all
agreements with an assessment of whether
there has been a significant increase in the
credit risk since initial recognition (start date of
the agreement). For a detailed description of
significant increases in credit risk, see the ‘Credit
risks’ section of note G2. The provisions in the
different impairment stages are calculated on an
individual basis. Manual calculation is used for
agreements in Stage 3, with the exception of a
small portfolio of homogeneous claims which
have a model-calculated provision in Stage 3. In
conjunction with each reporting date, an assess-
ment is made at agreement level as to whether
G1 Cont.
NOTES | GROUP
88 HANDELSBANKEN | ANNUAL REPORT 2019
an agreement will be subject to a model-based
calculation or a manual calculation.
The calculations of expected credit losses are
primarily affected by the risk parameters ‘proba-
bility of default’ (PD), ‘exposure at default’ (EAD)
and ‘loss given default’ (LGD). Expected credit
losses are determined by calculating PD, EAD
and LGD up to the expected final maturity date
of the agreement. The three risk parameters are
multiplied and adjusted by the survival probabil-
ity or, alternatively, the probability that a credit
exposure has not defaulted or been repaid in
advance. The estimated expected credit losses
are then discounted back to the reporting date
using the original effective interest rate and are
totalled. Total credit losses in Stage 1 is cal-
culated using the probability of default during
the coming 12-month period. For Stage 2 and
Stage 3, credit losses are calculated using the
probability of default during the asset’s remain-
ing time to maturity.
Model-based calculation
The calculation of the expected credit
losses takes into consideration at least three
macroeconomic scenarios (one neutral, one
positive and one negative scenario) with
relevant macroeconomic risk factors, such as
unemployment, key/central bank rates, GDP,
inflation and property prices, by country. The
various scenarios are used to adjust the risk
parameters. Every macroeconomic scenario is
assigned a probability, and the expected credit
losses are obtained as a probability-weighted
average of the expected credit losses for each
scenario.
For additional information on the models
used to calculate expected credit losses for
agreements in Stage 1 and Stage 2 (and for a
small portfolio of homogeneous claims in Stage
3), and for an explanation of concepts such as
PD, EAD and LGD, expected maturity, signifi-
cant increase in credit risk and macroeconomic
information, see the ‘Credit risks’ section in note
G2. For sensitivity analyses for expected credit
losses, see note G10.
Manual calculation
Assets in Stage 3 are tested for impairment on
an individual basis using a manual calculation
(with the exception of a small portfolio of homo-
geneous claims which have a model-calculated
provision in Stage 3). This testing is carried out
on a regular basis and in conjunction with every
reporting date by the local branch with business
responsibility (unit with customer and credit
responsibility) and is decided by the regional
and central credit departments.
Impairment testing is carried out when there
are objective circumstances which indicate that
the counterparty will not be able to fulfil its con-
tractual obligations, according to the definition
of default. Such objective circumstances could
be, for example, late payment or non-payment,
a change in the internal rating, or if the borrower
enters bankruptcy.
Impairment testing involves an estimation
of the future cash flows and the value of the
collateral (including guarantees). Consideration
is normally given to at least two forward-looking
scenarios for expected cash flows, based on
both the customer’s repayment capacity and
the value of the collateral. The outcome of
these scenarios is probability-weighted and
discounted with the loan’s original effective
interest rate. The scenarios used can take into
account both macroeconomic and agreement-
specific factors, depending on what is deemed
to affect the individual counterparty’s repayment
capacity and the value of the collateral. The
assessment takes into account the specific
characteristics of the individual counterparty.
An impairment loss is recognised if the
estimated recoverable amount is less than
the carrying amount.
Expert-based calculation
Expert-based calculation is carried out for credit
losses, in order to incorporate the estimated
impact of factors not deemed to have been
considered in the model (Stage 1, Stage 2 and
a small portfolio of homogeneous claims in
Stage 3), or which have not been considered
in manual calculations (Stage 3). The model-
based calculations are constructed with the
ambition of making as accurate estimations
as possible of the individual contributions to the
overall provision requirement. However, it is very
difficult to incorporate all of the particular char-
acteristics that define an individual agreement
into a general model. For this reason, a manual
analysis is carried out of the agreements which
give the largest contributions to the overall
provision requirement. The manual analysis
aims to apply expert knowledge about the indi-
vidual credits to an assessment of whether the
model-based or manual calculations need to
be replaced with an expert-based calculation.
An expert-based calculation may entail either
a higher or lower provision requirement than
the original calculation.
Expert-based calculation can also be carried
out at a more aggregate level to adjust the
model-based calculations for a sub-portfolio
or similar. These adjustments are distributed
proportionally over the agreements involved.
An expert-based calculation may entail either
a higher or lower provision requirement than
the original calculation.
Recognition and presentation
of credit losses
• Financial assets measured at amortised cost
are recognised on the balance sheet at their
net amount, after the deduction of expected
credit losses.
• Off-balance sheet items (financial guarantees
and irrevocable loan commitments) are recog-
nised at their nominal amounts. Provisions for
expected credit losses on these instruments
are recognised as a provision on the balance
sheet.
• Financial assets at fair value through other
comprehensive income are recognised at fair
value on the balance sheet. Provisions for
expected credit losses on these instruments
are recognised in the fair value reserve in
equity and do not, therefore, reduce the
carrying amount of the instrument.
• For financial assets measured at amortised
cost and off-balance sheet items, the period’s
credit losses (expected and actual) are recog-
nised in the income statement under the item
Credit losses. The item Credit losses consists
of the period’s provisions for expected credit
losses, less reversals of previous provisions,
as well as write-offs and recoveries during
the period.
• For financial assets measured at fair value
through other comprehensive income, the
credit losses for the period (expected and
actual) are recognised in the income state-
ment under the item Net gains/losses on
financial transactions.
• Write-offs consist of actual credit losses, less
reversals of previous provisions for expected
credit losses in Stage 3 and may refer to
either the entirety or parts of a financial
asset. Write-offs are recorded when there
is deemed to be no realistic possibility of
repayment. Following a write-off, the claim
on the borrower and any guarantor normally
remains and is thereafter, as a rule, subject
to enforcement activities. Enforcement
activities are not pursued in certain situations,
such as when a trustee in bankruptcy
has submitted their final accounts of the
distribution of assets in conjunction with the
bankruptcy, when a scheme of arrangement
has been accepted or when a claim has been
conceded in its entirety. Claims for which a
concession is granted in conjunction with a
restructuring of financial assets are always
recognised as actual credit losses.
• Payments to the Bank in relation to written-off
financial assets are recognised in income as
recoveries.
Further information on credit losses is provided
in note G10.
Default/Credit-impaired asset
The Bank’s definition of default is identical to the
definition applied in the Capital Requirements
Regulation (CRR), entailing either that the
counterparty is over 90 days overdue with
a payment or that an assessment has been
made that the counterparty will be unable
to fulfil its contractual payment obligations.
Such an assessment implies that it is deemed
to be more likely that the borrower will be
unable to pay than that they will be able to pay.
The assessment is founded on all available
information about the borrower’s repayment
capacity. Consideration is given to indicators of
insolvency such as insufficient liquidity, late and
cancelled payments, records of non-payment
or other signs of impaired repayment capacity.
Other signals may include the borrower entering
G1 Cont.
NOTES | GROUP
HANDELSBANKEN | ANNUAL REPORT 2019 89
into bankruptcy or the granting of a substantial
concession entailing a decrease in the value of
the Bank’s claim on the borrower.
The probability of default is calculated before
each reporting date and is incorporated in the
assessment of whether there has been a signifi-
cant increase in the credit risk since the initial
recognition, as well as in the calculation of
expected credit losses for financial assets in
Stage 1 and Stage 2.
A credit-impaired financial asset, which is an
exposure in Stage 3, is defined as an exposure
in default. This means that the assessment for
accounting purposes is consistent with the
assessment used in the Group’s credit risk
management.
Interest
In Stage 1 and Stage 2, recognition of interest
income attributable to items on the balance
sheet is based on gross accounting, which
means that the full amount of interest income
is recognised under Net interest income.
In Stage 3, interest income is recognised net,
that is, taking into account impairment. Interest
rate effects arising due to discounting effects,
attributable to the decrease of the period until
the expected payment, result in a reversal of
previously provisioned amounts and are recog-
nised as interest income in accordance with the
effective interest method.
Valuation of repossessed property
and equipment to protect claims
Upon initial recognition, repossessed property
and equipment is recognised at fair value on
the balance sheet. Repossessed property
and equipment (including repossessed lease
assets) which is expected to be divested in the
near future is valued at the lower of the car-
rying amount and fair value less costs to sell.
Repossessed property which is not expected
to be divested in the near future is reported as
investment properties at fair value through profit
or loss. Unlisted shareholdings taken over to
protect claims are normally recognised at fair
value through profit or loss.
Modified financial assets
A loan is seen as modified when the terms and
provisions which determine the cash flows are
amended relative to those in the original agree-
ment as the result of forbearance or commercial
renegotiations. Forbearance refers to changes
in terms and conditions in in conjunction with
restructurings or other financial relief measures.
Such changes are implemented with the objec-
tive of securing repayment in full, or of maximis-
ing the repayment of the outstanding loan
amount, from lenders experiencing, or facing,
financial difficulties. Commercial renegotiations
refer to changes to terms and conditions which
are not related to a borrower’s financial difficul-
ties, such as changes in the cash flow for a loan
arising due to changes in the market conditions
for repayment or interest.
If the cash flows from a financial asset which is
classified as measured at amortised cost have
been modified, but the cash flows have not
significantly changed, the modification does
not normally cause the financial asset to be
derecognised from the balance sheet. In such
cases, the gross carrying amount is recalcu-
lated on the basis of the changed cash flows of
the financial asset, and the adjustment amount
is recognised in the income statement.
As there may be various reasons for carrying
out a modification, there is no unconditional
connection between modifications and
assessed credit risk. When a financial asset is
subject to forbearance measures and the asset
remains on the balance sheet, it is classified in
Stage 2 or Stage 3, based on the outcome of
the assessment made when granting the con-
cession. The assessment involves a check of
whether a provision is required for credit loss,
or other circumstance which results in classi-
fication in Stage 3.
If a financial asset is modified in a way that
results in significantly changed cash flows, the
modified financial asset is derecognised from
the balance sheet and replaced with a new
agreement. In such cases, the modification date
constitutes the initial recognition date for the
new agreement and this date is used thereafter
for the calculation of expected credit losses and
for the assessment of whether there has been
a significant increase in the credit risk since the
initial recognition.
11. HEDGE ACCOUNTING
Handelsbanken has elected to continue to
apply the hedge accounting rules in IAS 39, in
accordance with the transitional rules in IFRS 9.
The Group applies different methods for hedge
accounting, depending on the purpose of the
hedge. Derivatives – mainly interest rate swaps
and cross-currency interest rate swaps – are
used as hedging instruments. In addition, when
hedging foreign exchange risks related to net
investments in foreign operations, liabilities in
the functional currency of the respective foreign
operation are used as a hedging instrument. As
part of the Group’s hedging strategies, the value
changes of a hedging instrument are sometimes
divided into separate components and included
in more than one hedge relationship. Therefore,
one and the same hedging instrument can hedge
different risks. Division of hedging instruments
is only done if the hedged risks can clearly
be identified, the efficiency can be reliably
measured, and the total value change of the
hedging instrument is included in any hedge
relationship.
Cash flow hedges are applied to manage
exposures to variations in cash flows relating to
changes in the floating interest rates on lending
and funding. The expected maturity for this type
of lending and funding is normally much longer
than the interest rate adjustment period, which
is very short. Cash flow hedging is also used to
hedge foreign exchange risk in future cash flows
deriving from lending and funding. Foreign
exchange risks deriving from intragroup mone-
tary items can also be subject to this type of
hedging, if they give rise to currency exposures
which are not fully eliminated on consolidation.
Derivatives which are hedging instruments in
cash flow hedges are measured at fair value. If
the derivative’s value change is effective – that
is, it corresponds to future cash flows related to
the hedged item – it is recognised as a compo-
nent of Other comprehensive income and in the
hedge reserve in equity. Ineffective components
of the derivative’s value change are recognised
in the income statement under Net gains/losses
on financial transactions. When a cash flow
hedge is terminated early, the cumulative gain
or loss on the hedging instrument previously
recognised in other comprehensive income is
amortised under Net gains/losses on financial
transactions during the period in which the
hedged cash flows are expected to occur. If
cash flow hedges are terminated early and the
hedged cash flows are no longer expected to
occur, the accumulated value change is reclas-
sified in the hedge reserve to Net gains/losses
on financial transactions.
Fair value hedges are used to protect the
Group against undesirable impact on profit/loss
due to exposure to changes in market prices.
Fair value hedges are applied for individual
assets and liabilities and for portfolios of finan-
cial instruments. Hedged risks in hedging pack-
ages at fair value comprise the interest rate and
foreign exchange risk on lending and borrowing
at fixed interest rates and also lending with inter-
est rate caps. The hedging instruments in these
hedging relationships consist of interest rate
swaps, cross-currency interest rate swaps and
interest rate options. In the case of fair value
hedges, the hedge instrument and hedged risk
are both recognised at fair value. Changes in
value are recognised directly in the income
statement under Net gains/losses on financial
transactions. When portfolio hedging is applied,
the value of the hedged item is reported as a
separate line item in the balance sheet in con-
junction with Loans to the public. When fair
value hedges are terminated early, the accrued
value change on the hedged item is amortised
under Net gains/losses on financial transactions
during the remaining time to maturity. When a
fair value hedge is terminated early, and the
hedged item no longer exists, the value change
generated is reversed directly under Net gains/
losses on financial transactions. Accumulated
changes in the value of portfolio hedges which
have been terminated early are reported on the
balance sheet under Other assets.
Hedging of net investments in foreign units
is applied to protect the Group from exchange
differences due to operations abroad. Cross-
currency interest rate swaps and loans in foreign
currencies are used as hedging instruments.
The hedged item in these hedges is made up
of net investments in the form of direct invest-
ments, as well as claims on foreign operations
G1 Cont.
NOTES | GROUP
90 HANDELSBANKEN | ANNUAL REPORT 2019
that are not expected to be settled in the fore-
seeable future. Loans in foreign currency that
hedge net investments in foreign operations are
recognised in the Group at the exchange rate
on the balance sheet date. The effective part
of the exchange differences for such loans is
recognised as a component of Other compre-
hensive income and in the translation reserve in
equity. The effective part of changes in value in
cross-currency interest rate swaps that hedge
foreign exchange risk in claims on foreign oper-
ations is recognised in the same manner. The
ineffective components of hedges of net invest-
ments in foreign operations are recognised in
the income statement under Net gains/losses
on financial transactions.
12. LEASES
The Bank as lessor
A lessor must classify all leases as either finance
leases or operating leases. A finance lease sub-
stantially transfers all the risks and rewards inci-
dental to legal ownership of the leased asset
from the lessor to the lessee. Other leases are
classified as operating leases. All leases where
the Group is the lessor have been defined as
finance leases. Lease agreements of this kind
are accounted for as loans on the balance
sheet, initially for an amount corresponding to
the net investment. Lease fees received are rec-
ognised on a continual basis as interest income
or repayments.
Finance leases are subject to impairment
testing, in the same way as other financial
assets measured at amortised cost.
The Bank as lessee
At the commencement of a lease agreement,
the lessee recognises a lease liability and right-
of-use asset. The lease liability is initially recog-
nised at the present value of future lease fees,
discounted by the Bank’s incremental borrow-
ing rate. Lease fees included in the valuation of
the lease liability are primarily comprised of fixed
fees and variable index-linked charges. The
right-of-use asset is initially recognised at cost,
which corresponds to the original valuation of
the lease liability, prepaid lease fees, any initial
direct expenditure, and an estimation of future
restoration costs. Restoration costs are only
included in the cost of acquisition when these
are an obligation under the terms of the lease.
In subsequent valuations of the lease
liability, the carrying amount increases due
to interest and decreases in accordance with
lease payments made. In addition, the lease
liability may increase or decrease in conjunction
with reassessments of or amendments to the
lease agreement. In subsequent valuations of
the right-of-use asset, the asset is measured
at cost less accumulated depreciation and
any impairment, taking into account any
revaluations of the lease liability. The right-
of-use asset is depreciated over the term
of the lease. Right-of-use assets are tested
for impairment in accordance with IAS 36
Impairment of Assets. See the section on
impairment testing under point 15.
The right-of-use assets are included in the
Property and equipment balance sheet item,
while the lease liability is included in the Other
liabilities balance sheet item.
Lease agreements with a term of less than
12 months, or for which the underlying asset is
of a low value, are recognised as an expense on
a straight-line basis over the term of the lease,
and are thus not included in lease liabilities and
right-of-use assets.
13. INSURANCE OPERATIONS
The Group’s insurance operations are run
through the subsidiary Handelsbanken Liv.
Products consist mainly of legal life insurance
in the form of traditional life insurance, unit-
linked insurance and risk insurance in the form
of health insurance and waiver of premium.
Classification and unbundling
of insurance contracts
Contracts that include significant insurance risk
are classified in the consolidated accounts as
insurance contracts. ‘Insurance risk’ refers to
risk other than financial risk that is transferred
from the contract’s owner to the issuer. Con-
tracts that do not transfer significant insurance
risk are classified in their entirety as investment
contracts. Generally, this means that insurance
policies with repayment cover are classified as
investment contracts and other contracts are
classified as insurance contracts. Insurance
contracts consisting of both insurance com-
ponents and savings (financial components)
are unbundled and recognised separately
in accordance with the principles described
below.
Accounting for insurance components
in insurance contracts
Premium income and insurance claims paid
for insurance contracts are recognised in the
income statement as a net amount under the
item Risk result – insurance. The change in the
Group’s insurance liability is also reported under
this item.
Premiums received which have not yet been
recognised as income are carried as a liability
for paid-in premiums under Insurance liabilities
on the balance sheet. The balance-sheet item
Insurance liabilities also includes liabilities for
sickness annuities, life annuities and other out-
standing claims. The insurance liability is valued
by discounting the expected future cash flows
relating to insurance contracts entered into. The
valuation is based on assumptions concerning
interest, longevity, health and future charges.
The assumptions concerning longevity vary
depending on when the policy was taken out
and take into account expected future increases
in longevity. The assumptions concerning fees
also depend on when the policy was taken out.
Principally, this means a fee that is proportional
to the premium and a fee that is proportional to
the life insurance provisions. Applied assump-
tions regarding the beneficiaries’ future health
are based on internally accrued experience and
vary depending on the product. Interest rate
assumptions are based on current market rates
and depend on the maturity of the liability. The
Group’s insurance liabilities are subject to regu-
lar review, at least annually, to ensure that the
reported insurance liability is sufficient to cover
expected future claims. If necessary, an addi-
tional provision is made. The difference is recog-
nised in the income statement.
Accounting for investment contracts and
financial components of insurance contracts
Incoming and outgoing payments referring to
customers’ savings capital originating in invest-
ment contracts and financial components of
insurance contracts are recognised directly on
the balance sheet as deposits and withdrawals.
The financial components of traditional life
insurance policies that are separated from
the insurance contract are recognised on the
balance sheet as borrowing from the public.
These liabilities are valued at the higher of the
guaranteed amount and the current value of the
insurance contract. The guaranteed amount
earns interest at the guarantee rate of interest
and corresponds to the amortised cost of the
insurance contract. The current value of the
insurance contract is equal to the value of the
assets managed on behalf of the policyholders,
and earns interest with a return that is based on
the total return for the assets with a deduction
for any yield split. The yield split implies that the
insurer is allocated a contracted part of the total
return if this return exceeds the guaranteed
return during the calendar year. The calcula-
tion is performed annually and is accumulated
for each individual insurance contract. This
means that the conditional bonus is reduced
in those cases where the yield in an individual
year is less than the guaranteed interest rate
and vice versa. The share that accrues to the
Group under the yield split model is reported
as Fee and commission income. If the yield
is less than the guaranteed yield per contract,
the difference is recognised in the income
statement under Net gains/losses on financial
transactions.
Assets and liabilities arising from unit-linked
insurance contracts are recognised at fair value
on the balance sheet under the items Assets/
Liabilities where the customer bears the value
change risk, respectively.
Premium fees, asset fees and administrative
charges for investment contracts and insurance
contracts are recognised in the income state-
ment under Fee and commission income.
Acquisition costs are recognised directly in the
income statement.
Reinsurance
The reinsurer’s share of the Group’s insurance
liabilities is recognised under Reinsurance
assets on the balance sheet.
G1 Cont.
NOTES | GROUP
HANDELSBANKEN | ANNUAL REPORT 2019 91
14. INTANGIBLE ASSETS
Recognition in the balance sheet
An intangible asset is an identifiable, non-mone-
tary asset without physical form. An intangible
asset is only recognised on the balance sheet if
the probable future economic benefits attributa-
ble to the asset will flow to the Group and if the
acquisition cost can be reliably measured. This
means that internally generated values in the
form of goodwill, trademarks, customer data-
bases and similar are not recognised as assets
on the balance sheet.
Investments in software developed in-house
are carried as an expense on a current basis to
the extent that the expenditure refers to mainte-
nance of existing business operations or soft-
ware. In the case of in-house development of
new software, or development of existing soft-
ware for new business operations, the expendi-
ture incurred that can be reliably measured, is
capitalised from the time when it is probable
that economic benefit will arise. Expenditure
arising from borrowing costs is capitalised from
the date on which the decision was made to
capitalise expenditure for the development of
an intangible asset.
When accounting for business combinations,
the acquisition price is allocated to the value of
acquired identifiable assets, liabilities and con-
tingent liabilities in the acquired business. These
assets may also include intangible assets that
would not have been recognised on the balance
sheet if they had been acquired separately or
internally generated. The part of the acquisition
price in a business combination that cannot be
allocated to identifiable assets and liabilities is
recognised as goodwill.
Goodwill and intangible assets
with an indefinite useful life
Goodwill and other intangible assets with an
indefinite useful life are recorded at cost less
any impairment losses. These assets are tested
annually for impairment when preparing the
annual report or when there is an indication that
the asset is impaired. Impairment testing is per-
formed by calculating the recoverable amount
of the assets, i.e. the higher of the value in use
and the fair value less costs to sell. As long as
the recoverable amount exceeds the carrying
amount, no impairment loss needs to be recog-
nised. Impairment losses are recognised directly
in the income statement.
Since it is not possible to differentiate between
cash flows arising from goodwill and cash flows
arising from other assets, impairment testing of
goodwill takes place at the level of cash-gener-
ating unit. A cash-generating unit is the smallest
identifiable group of assets that generates cash
inflows that are largely independent of the cash
inflows from other assets or groups of assets.
Goodwill is followed up at business segment
level. Material assessments and assumptions in
the impairment testing of goodwill are described
in note G24. Previously recognised impairment
losses on goodwill are not reversed.
Intangible assets with a finite useful life
Intangible assets for which it is possible to
establish an estimated useful life are amortised.
The amortisation is on a straight-line basis
over the useful life of the asset. Currently this
means that customer contracts are amortised
over 20 years and that internally developed
software is normally amortised over five years.
In certain infrastructure projects, the useful life is
assessed to be more than five years. For these
types of investment, the amortisation period is
up to 15 years. Brand names which are subject
to amortisation are amortised over five years.
The amortisation period is tested on an individ-
ual basis at the time of new acquisition and also
continually if there are indications that the useful
life may have changed. Intangible assets with
a finite useful life are reviewed for impairment
when there is an indication that the asset may
be impaired. The impairment test is performed
according to the same principles as for intan-
gible assets with an indefinite useful life, i.e. by
calculating the recoverable amount of the asset.
15. PROPERTY AND EQUIPMENT
The Group’s tangible non-current assets consist
of property and equipment. With the exception
of real property that constitutes investment
assets in the insurance business, and repos-
sessed properties to protect claims, these
assets are recorded at cost of acquisition less
accumulated depreciation and impairment
losses.
Depreciation is based on the estimated useful
lives of the assets. A linear depreciation plan is
usually applied. The estimated useful lives are
reviewed annually. The tangible assets that con-
sist of components with different estimated use-
ful lives are sub-divided into different categories
with separate depreciation plans. Such depre-
ciation of components is normally only applied
for real property. Only components of the
property whose acquisition costs are substan-
tial in relation to the total acquisition cost are
separately depreciated. The remaining parts of
the real property (building structure) are depreci-
ated as a whole over their expected useful life.
Currently, the useful life for the building structure
is 100 years, for water and drains 35 years, for
roofs 30 years, for frontage, heating, ventilation
and electricity 25 years, for lifts 20 years and
for permanent equipment, service facilities etc.
in buildings 10 years. Personal computers and
other IT equipment are usually depreciated over
three years and investments in bank vaults and
similar investments in premises over 10 years.
Other equipment is normally depreciated over
five years.
Impairment testing of property and equip-
ment is carried out when there is an indication
that the value of the asset may have decreased.
Impairment loss is recognised in cases where
the recoverable amount is less than the carrying
amount. Any impairment losses are recognised
immediately in the income statement. An
impairment loss is reversed if there is an indica-
tion that there is no longer any impairment loss
and there has been a change in the assump-
tions underpinning the estimated recoverable
amount.
16. PROVISIONS
Provisions consist of recognised expected
negative outflows of resources from the Group
and which are uncertain in terms of timing or
amount. Provisions are reported when the
Group, as a consequence of past events, has
a legal or constructive obligation, and it is prob-
able that an outflow of resources will be required
to settle the obligation. For recognition it must
be possible to estimate the amount reliably. The
amount recognised as a provision corresponds
to the best estimate of the expenditure required
to settle the obligation at the balance sheet date.
The expected future date of the settlement is
taken into account in the estimate.
Provisions are reported for restructuring.
Restructuring refers to major organisational
changes, for example when employees receive
termination benefits relating to early termination
of employment, or branches are closed. In order
for a provision to be reported, a restructuring
plan must have been established and com-
municated so that a valid expectation has been
created in those affected, that the enterprise
will carry out the restructuring. A restructuring
provision only includes the direct expenditures
arising from the restructuring and which are not
related to the future operations.
17. EQUITY
Equity comprises the components described
here.
Share premium reserve
The share premium reserve comprises the
options component of issued convertible debt
instruments and the amount that in the issue
of shares and conversion of convertible debt
instruments exceeds the quotient value of the
shares issued.
Hedge reserve
Unrealised changes in the value of derivative
instruments which comprise hedge instruments
in cash flow hedges are reported in the hedge
reserve.
Fair value reserve
Unrealised changes in the value of financial
assets classified as measured at fair value
through other comprehensive income are rec-
ognised in the fair value reserve. Furthermore,
the fair value reserve includes provisions for
expected credit losses on debt instruments
classified as measured at fair value through
other comprehensive income. Realised
changes in the value of these debt instruments
are reclassified from the fair value reserve to
the income statement. Realised changes in the
value of equity instruments classified as meas-
ured at fair value through other comprehensive
G1 Cont.
NOTES | GROUP
92 HANDELSBANKEN | ANNUAL REPORT 2019
income are reclassified from the fair value
reserve to retained earnings.
Translation reserve
The translation reserve comprises unrealised
foreign exchange effects arising due to transla-
tion of foreign units to the presentation currency
of the consolidated accounts. In addition, effec-
tive parts of hedges of net investments in foreign
operations are recognised in the translation
reserve.
Defined benefit pension plans
The item Defined benefit pension plans is com-
prised of actuarial gains and losses on the pen-
sion obligation, as well as the return on plan
assets that exceeds or falls below the return
based on the discount rate.
Retained earnings including
profit for the year
Retained earnings comprise the profits gener-
ated from the current and previous financial
years. Dividends and repurchases of own
shares are reported as deductions from retained
earnings.
Realised gains/losses which are attributable
to equity instruments classified as measured at
fair value through other comprehensive income
are reclassified from the fair value reserve to
retained earnings.
Non-controlling interest
Non-controlling interest consists of the portion
of the Group’s net assets that is not directly or
indirectly owned by holders of the parent com-
pany’s ordinary shares. Non-controlling interest
is recorded as a separate component of equity.
Accounting for own shares
Repurchased own shares are not recognised as
assets but are offset against retained earnings in
equity.
18. INCOME
Net interest income
Interest income and interest expenses are rec-
ognised as Net interest income in the income
statement, with the exception of interest flows
deriving from financial instruments mandatorily
measured at fair value through profit or loss,
which are recognised under Net gains/losses on
financial transactions, where the overall activity
in the trading book is recognised.
Interest income and interest expenses for
financial instruments at amortised cost are cal-
culated and recognised by applying the effective
interest method or, where considered appro-
priate, by applying a method that results in an
amount constituting a reasonable estimate of
the results of a calculation based on the effec-
tive interest method. Effective interest includes
fees which are considered an integral part of
the effective interest rate of a financial instru-
ment (generally fees compensating for risk).
The effective interest rate corresponds to the
rate used to discount future contractual cash
flows to the carrying amount of the financial
asset or liability.
Net interest income also includes interest
from derivative instruments recognised through
hedge accounting and interest from derivatives
in economic hedges, as these hedge items for
which the interest flows are recognised under
Net interest income.
In addition to interest income and interest
expenses, net interest income includes fees for
state guarantees, such as deposit guarantees
and the resolution fee.
Revenue from contracts with customers
The standard for Revenue from contracts with
customers, IFRS 15, is applied for different
types of services which are mainly recognised
under Fee and commission income in the
income statement. IFRS 15 is also applicable
to certain services included in the item Other
income. However, Other income does not,
in all material respects, refer to income from
contracts with customers.
The income is recognised at the point in time
at which the performance obligation is satisfied,
which corresponds to the transfer of control
over the service to the customer. The total
income is divided between each service and
recognition in income depends on whether the
services are fulfilled at a specific point in time,
or over time.
The following principles apply to when income
is recognised:
• Income earned gradually as the services are
performed, such as management fees in
asset management, is recognised at the rate
these services are delivered, i.e. on a straight-
line basis over time. This is due to the fact
that the customer receives and consumes
the service simultaneously, meaning that the
Bank’s obligation is fulfilled in line with the
rendering of the service.
• Income attributable to a specific service or
action is recognised when the service has
been performed, i.e. at a specific point in
time. Examples of such income are broker-
age and payment commissions.
The income recognised must reflect the
expected income. When the income includes
variable reimbursement, such as a refund,
bonus or performance-based element, the
income is recognised only when it is highly
probable that no repayment of the amount will
take place.
Payments are made on a regular basis as the
services are performed and advance payments
refer to a maximum of 12 months into the future.
Accrued income is recognised for services have
been performed but which have not yet been
paid for. Deferred income is recognised for pay-
ments received for services which have not yet
been performed. Income from contracts with
customers constitutes an immaterial proportion
of the items Accrued income and Deferred
income. Additional expenditure required to
obtain a contract with a customer is not recog-
nised as an asset (prepaid expense), and is
instead recognised as an expense during the
accounting period in which it arises.
Net fee and commission income
Income and expense for various kinds of ser-
vices are recognised in the income statement
under the items Fee and commission income
and Fee and commission expense, respectively.
This means that brokerage income and various
types of management fees are recognised as
commissions. Other forms of income recog-
nised as commissions are payment commis-
sions and card fees, premiums for financial
guarantees issued, and commissions from
insurance operations. Guarantee commissions
that are comparable to interest and fees that
constitute integrated components of financial
instruments and therefore are included when
calculating the effective interest are recognised
under Net interest income and not commis-
sions. Fee and commission expense is transac-
tion-based and directly related to transactions
for which the income is recognised as Fee and
commission income.
Other income
The item Other income is primarily comprised
of rental income and capital gains/losses arising
from the divestment of participating interests
in subsidiaries and associated companies.
Other income therefore does not, in all material
respects, refer to income from contracts with
customers.
Net gains/losses on financial transactions
Net gains/losses on financial transactions
includes all items with an impact on profit or loss
that arise when measuring financial assets and
liabilities at fair value through profit or loss, and
when financial assets and liabilities are realised
(with the exception of equity instruments classi-
fied as measured at fair value through other
comprehensive income).
• Gains/losses on financial instruments at
amortised cost consist of realised gains and
losses on financial assets and liabilities classi-
fied as measured at amortised cost, such as
early repayment charges for loans redeemed
ahead of time, and capital gains/losses gen-
erated from repurchases of the Bank’s own
issued securities.
• Gains/losses on financial instruments at fair
value through other comprehensive income
consist of realised gains and losses on inter-
est-bearing securities classified as measured
at fair value through other comprehensive
income. Realised gains and losses are reclas-
sified from other comprehensive income to
Net gains/losses on financial transactions in
conjunction with a divestment/sale. The item
also includes credit losses (expected and
actual) on these assets.
G1 Cont.
NOTES | GROUP
HANDELSBANKEN | ANNUAL REPORT 2019 93
• Gains/losses on financial instruments meas-
ured at fair value through profit or loss, fair
value option, consist of unrealised and real-
ised changes in the value of financial assets
and liabilities that upon initial recognition were
identified as measured at fair value through
profit or loss.
• Gains/losses on financial instruments
measured at fair value through profit or loss,
mandatory, consist of unrealised and realised
changes in value, dividend income and inter-
est (with the exception of interest deriving
from derivatives used to hedge items for
which the interest flow is recognised in net
interest income) on financial assets and liabili-
ties held for trading, or which are managed
and evaluated on the basis of fair value.
• Fair value hedges consist of unrealised and
realised changes in the value of hedging
instruments, and the hedged risk component
in financial assets and liabilities which consti-
tute hedged items in fair value hedges. Inef-
fective portion of cash flow hedges consists
of changes in the value of hedging instru-
ments which do not correspond to future
cash flows attributable to the hedged item.
• Gains/losses on the financial component in
an insurance contract consist of the gain or
loss arising if the return is less than the guar-
anteed interest.
Dividend
Dividends on shares measured at fair value
through other comprehensive income are rec-
ognised in the income statement under the item
Other dividend income. Dividends on shares
measured at fair value through profit or loss are
recognised in the income statement under the
item Net gains/losses on financial transactions.
Dividends on shares in associated companies
are not included in the Dividends item in the
income statement. The recognition of Share of
profit of associates is described in section 4.
19. EMPLOYEE BENEFITS
Staff costs
Staff costs consist of salaries, pension costs
and other forms of direct staff costs including
social security costs, special payroll tax on pen-
sion costs and other forms of payroll overheads.
Any remuneration in connection with terminated
employment is recognised as a liability when the
agreement is reached and amortised over the
remaining employment period.
Accounting for pensions
Post-employment benefits consist of defined
contribution plans (defined premiums) and
defined benefit plans. Benefit plans under which
the Group pays fixed contributions into a sepa-
rate legal entity, and subsequently has no legal
or constructive obligation to pay further contri-
butions if the legal entity does not hold sufficient
assets to fulfil its obligations to the employee,
are accounted for as defined contribution plans.
Premiums paid for defined contribution plans
are recognised in the income statement as staff
costs as they arise. Other post-employment
benefit plans are accounted for as defined ben-
efit plans. For defined benefit pension plans,
the pension payable is based on the salary
and period of employment, implying that the
employer bears all the material risks for fulfilling
the pension obligation. For the majority of
defined benefit plans, the Group has kept plan
assets separate in pension foundations and
a pension fund. For defined benefit plans, the
pension obligations minus the plan assets are
reported as a net liability on the balance sheet.
Actuarial gains and losses on the pension obli-
gation and any return which exceeds the return
according to the discount rate on plan assets
are reported in Other comprehensive income.
The pension cost recognised for defined
benefit plans is the net amount of the following
items, all included in staff costs:
+ Accrued pension rights for the year, i.e.
the year’s proportion of the calculated final
total pension payment. The calculation
of accrued pension rights is based on an
estimated final salary and is subject to
actuarial assumptions.
+ Interest expense for the year due to the
increase in the present value of the pension
liability during the year since the period up
to payment has decreased. The interest rate
applied in calculating interest expense for the
year is the current corporate bond rate (the
rate at the start of the year) for maturities cor-
responding to the period remaining until the
pension liability is due to be disbursed.
- Estimated yield (interest) on the plan assets.
Interest on the plan assets is reported in
profit/loss using the same interest rate as
when establishing the year’s interest
expenses.
+ The estimated cost of special payroll tax is
accrued using the same principles as for
the underlying pension cost.
Calculation of costs and obligations resulting
from the Group’s defined benefit plans depends
on several assessments and assumptions
which may have a considerable impact on the
amounts reported. A more detailed descrip-
tion of these assumptions and assessments is
provided in section 21 and in note G8.
20. TAXES
The tax expense for the period consists of cur-
rent tax and deferred tax. Current tax refers to
taxes relating to the period’s, or previous peri-
ods’, taxable result. Deferred tax is tax referring
to temporary differences between the carrying
amount of an asset or liability and its taxable
value. Deferred taxes are valued at the tax rate
which is deemed to be applicable when the
item is realised. Deferred tax claims related to
deductible temporary differences and loss carry
forwards are only recognised if it is probable that
they will be utilised. Deferred tax liabilities are
carried at nominal value. Tax is recognised in the
income statement, either in Other comprehen-
sive income or directly in equity depending on
where the underlying transaction is reported.
21. ESTIMATES AND MATERIAL
ASSESSMENTS
In certain cases, the application of the Group’s
accounting policies means that assessments
must be made that have a material impact on
amounts reported. The amounts reported are
also affected, in a number of cases, by esti-
mates and assumptions about the future. Such
assumptions always imply a risk for adjustment
of the reported value of assets and liabilities.
The assessments and assumptions applied
always reflect the management’s best and fair-
est assessments and are continually subject
to examination and validation.
The assessments and assumptions that have
had a material impact on the financial reports
are described below.
Estimates and material assessments concern-
ing the following areas are provided in specific
notes:
• financial instruments measured at fair value,
see note G40, Fair value measurement of
financial instruments
• impairment testing of goodwill, see note G24,
Intangible assets
• claims in civil suits, see note G35, Provisions.
Actuarial calculation of defined
benefit pension plans
Calculation of the Group’s expense and obliga-
tions for defined benefit pensions is based on a
number of actuarial, demographic and financial
assumptions that have a significant impact on
the recognised amounts. Note G8 contains a
list of the assumptions used when calculating
this year’s provision. The calculation of defined
benefit obligations for employees in Sweden
is based on DUS14, which are assumptions
on longevity that are generally accepted in the
market, based on statistics produced by Insur-
ance Sweden. The assumptions on future salary
increases and inflation are based on the antici-
pated long-term trend.
The discount rate is based on a number of
first-class corporate bonds with varying maturi-
ties. For corporate bonds with maturities corre-
sponding to the estimate average maturity of
the pension obligation, this being 20 years, the
discount rate is determined of the basis of mar-
ket interest rates. Due to the fact that that there
are too few issuers of first-class corporate
bonds with a maturity corresponding to that of
the pension obligation, the Bank uses first-class
corporate bonds with a shorter maturity as a
supplementary basis to determine the discount
rate. For these, the discount rate is determined
on the basis of a yield curve. The yield curve is
constructed as a spread over the Swedish swap
G1 Cont.
NOTES | GROUP
94 HANDELSBANKEN | ANNUAL REPORT 2019
curve. The spread, which is based on corporate
bonds, excluding own issues, is applied to the
swap curve. In this way, a yield curve is mod-
elled and a 20-year yield can be derived from
this.
Note G8 provides a sensitivity analysis of the
Group’s defined benefit obligation for all major
actuarial assumptions. This shows how the obli-
gation would have been affected by reasonably
feasible changes in these assumptions.
Credit losses
The calculation of expected credit losses
involves a number of assumptions and assess-
ments. The valuation of expected credit losses
is inherently associated with a certain degree of
uncertainty. Areas involving a high degree of
assumptions and assessments are described
below under the respective headings.
Future-oriented information
in macroeconomic scenarios
Handelsbanken continuously monitors macroe-
conomic developments, with a particular focus
on the home markets. Through this monitoring,
the Bank develops the macroeconomic scenar-
ios which form the basis for the future-oriented
information used in the model-based calculation
of expected credit losses. The capacity of the
Bank’s customers to fulfil their contractual pay-
ments varies in line with macroeconomic devel-
opments. Consequently, future macroeconomic
developments have an impact on the Bank’s
view of the provision needed to cover expected
losses. The calculation of the provision require-
ment for expected credit losses is based on the
neutral scenario proposed by the Bank’s macro-
economic research unit. As the losses may be
more highly affected by a future deterioration of
economic trends than by the equivalent
improvement, the Bank uses at least two alter-
native scenarios to take into account the non-
linear aspects of expected credit losses. These
alternative scenarios represent conceivable
developments, one significantly worse and one
significantly better than the neutral scenario.
The most significant macroeconomic risk fac-
tors have been selected on the basis of the
Bank’s loss history over the past decade, sup-
plemented with experience-based assess-
ments. These macroeconomic risk factors are
then used as macroeconomic risk factors in the
Bank’s quantitative statistical models for fore-
casting migrations, defaults, loss rates and
exposures. The macroeconomic risk factors
include unemployment, key/central bank rates,
GDP, inflation and property prices. The Bank’s
business model, to offer credit to customers
with a high repayment capacity, means that the
connection between the macroeconomic devel-
opments and the provision requirement is not
always especially pronounced. For a detailed
description of macroeconomic information, see
the ‘Credit risks’ section of note G2 and for a
sensitivity analysis, see note G10.
Significant increase in credit risk
The Bank makes an assessment at agreement
level at the end of each reporting period as to
whether there has been a significant increase in
credit risk since initial recognition. For a detailed
description of significant increases in credit risk,
see the ‘Credit risks’ section of note G2.
Model-based calculation
The quantitative models which form the basis
for the calculation of expected credit losses for
agreements in Stage 1 and Stage 2 make use
of several assumptions and assessments. One
key assumption is that the quantifiable relation-
ships between macroeconomic risk factors and
risk parameters in historical data are representa-
tive of future events. The quantitative models
applied are based on a history of approximately
10 years, although this history varies by product
and region due to inconsistency in the avail-
ability of historical outcomes. The quantitative
models have been constructed with the help
of econometric models, applying the assump-
tion that the observations are independently
conditioned by the risk factors. This means that
the risk parameters can be predicted without
distortion. Furthermore, a selection of the most
significant macroeconomic risk factors is made
on the basis of the macroeconomic risk factors’
ability to demonstrate to individual risk param-
eters. The selection of the macroeconomic risk
factors and specification of the model are based
on achieving a balance between simplicity,
demonstrative ability and stability.
Manual and expert-based calculation
As a rule, manual calculation is used for
agreements in Stage 3, with the exception of
a small portfolio of homogeneous claims in
Stage 3. Expert-based calculation is carried
out for model outcomes on agreements in
Stage 1 and Stage 2, in order to incorporate
the estimated impact of factors not deemed to
have been considered in the model, as well as
for manually assessed agreements in Stage 3.
For more detailed descriptions of manual and
expert-based calculation, see point 10 under
the headings ‘Manual calculation’ and ‘Expert-
based calculation’.
NOTES | GROUP
HANDELSBANKEN | ANNUAL REPORT 2019 95
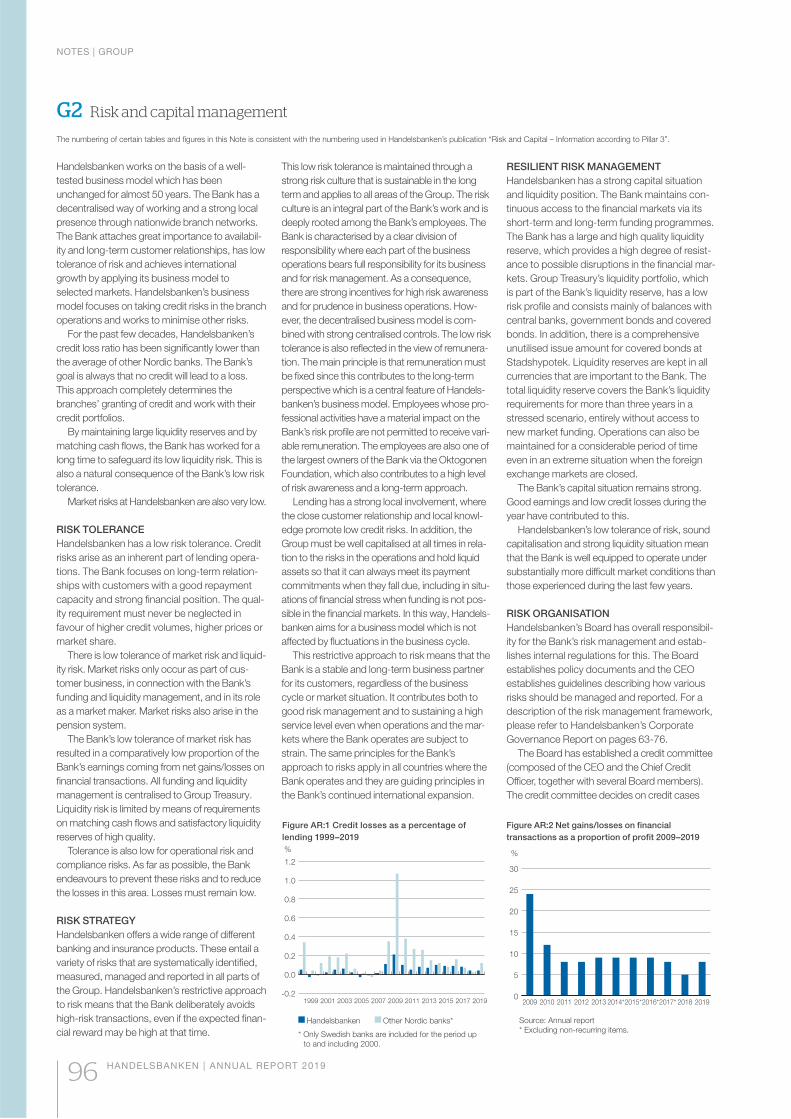
G2 Risk and capital management
Handelsbanken works on the basis of a well-
tested business model which has been
unchanged for almost 50 years. The Bank has a
decentralised way of working and a strong local
presence through nationwide branch networks.
The Bank attaches great importance to availabil-
ity and long-term customer relationships, has low
tolerance of risk and achieves international
growth by applying its business model to
selected markets. Handelsbanken’s business
model focuses on taking credit risks in the branch
operations and works to minimise other risks.
For the past few decades, Handelsbanken’s
credit loss ratio has been significantly lower than
the average of other Nordic banks. The Bank’s
goal is always that no credit will lead to a loss.
This approach completely determines the
branches’ granting of credit and work with their
credit portfolios.
By maintaining large liquidity reserves and by
matching cash flows, the Bank has worked for a
long time to safeguard its low liquidity risk. This is
also a natural consequence of the Bank’s low risk
tolerance.
Market risks at Handelsbanken are also very low.
RISK TOLERANCE
Handelsbanken has a low risk tolerance. Credit
risks arise as an inherent part of lending opera-
tions. The Bank focuses on long-term relation-
ships with customers with a good repayment
capacity and strong financial position. The qual-
ity requirement must never be neglected in
favour of higher credit volumes, higher prices or
market share.
There is low tolerance of market risk and liquid-
ity risk. Market risks only occur as part of cus-
tomer business, in connection with the Bank’s
funding and liquidity management, and in its role
as a market maker. Market risks also arise in the
pension system.
The Bank’s low tolerance of market risk has
resulted in a comparatively low proportion of the
Bank’s earnings coming from net gains/losses on
financial transactions. All funding and liquidity
management is centralised to Group Treasury.
Liquidity risk is limited by means of requirements
on matching cash flows and satisfactory liquidity
reserves of high quality.
Tolerance is also low for operational risk and
compliance risks. As far as possible, the Bank
endeavours to prevent these risks and to reduce
the losses in this area. Losses must remain low.
RISK STRATEGY
Handelsbanken offers a wide range of different
banking and insurance products. These entail a
variety of risks that are systematically identified,
measured, managed and reported in all parts of
the Group. Handelsbanken’s restrictive approach
to risk means that the Bank deliberately avoids
high-risk transactions, even if the expected finan-
cial reward may be high at that time.
This low risk tolerance is maintained through a
strong risk culture that is sustainable in the long
term and applies to all areas of the Group. The risk
culture is an integral part of the Bank’s work and is
deeply rooted among the Bank’s employees. The
Bank is characterised by a clear division of
responsibility where each part of the business
operations bears full responsibility for its business
and for risk management. As a consequence,
there are strong incentives for high risk awareness
and for prudence in business operations. How-
ever, the decentralised business model is com-
bined with strong centralised controls. The low risk
tolerance is also reflected in the view of remunera-
tion. The main principle is that remuneration must
be fixed since this contributes to the long-term
perspective which is a central feature of Handels-
banken’s business model. Employees whose pro-
fessional activities have a material impact on the
Bank’s risk profile are not permitted to receive vari-
able remuneration. The employees are also one of
the largest owners of the Bank via the Oktogonen
Foundation, which also contributes to a high level
of risk awareness and a long-term approach.
Lending has a strong local involvement, where
the close customer relationship and local knowl-
edge promote low credit risks. In addition, the
Group must be well capitalised at all times in rela-
tion to the risks in the operations and hold liquid
assets so that it can always meet its payment
commitments when they fall due, including in situ-
ations of financial stress when funding is not pos-
sible in the financial markets. In this way, Handels-
banken aims for a business model which is not
affected by fluctuations in the business cycle.
This restrictive approach to risk means that the
Bank is a stable and long-term business partner
for its customers, regardless of the business
cycle or market situation. It contributes both to
good risk management and to sustaining a high
service level even when operations and the mar-
kets where the Bank operates are subject to
strain. The same principles for the Bank’s
approach to risks apply in all countries where the
Bank operates and they are guiding principles in
the Bank’s continued international expansion.
RESILIENT RISK MANAGEMENT
Handelsbanken has a strong capital situation
and liquidity position. The Bank maintains con-
tinuous access to the financial markets via its
short-term and long-term funding programmes.
The Bank has a large and high quality liquidity
reserve, which provides a high degree of resist-
ance to possible disruptions in the financial mar-
kets. Group Treasury’s liquidity portfolio, which
is part of the Bank’s liquidity reserve, has a low
risk profile and consists mainly of balances with
central banks, government bonds and covered
bonds. In addition, there is a comprehensive
unutilised issue amount for covered bonds at
Stadshypotek. Liquidity reserves are kept in all
currencies that are important to the Bank. The
total liquidity reserve covers the Bank’s liquidity
requirements for more than three years in a
stressed scenario, entirely without access to
new market funding. Operations can also be
maintained for a considerable period of time
even in an extreme situation when the foreign
exchange markets are closed.
The Bank’s capital situation remains strong.
Good earnings and low credit losses during the
year have contributed to this.
Handelsbanken’s low tolerance of risk, sound
capitalisation and strong liquidity situation mean
that the Bank is well equipped to operate under
substantially more difficult market conditions than
those experienced during the last few years.
RISK ORGANISATION
Handelsbanken’s Board has overall responsibil-
ity for the Bank’s risk management and estab-
lishes internal regulations for this. The Board
establishes policy documents and the CEO
establishes guidelines describing how various
risks should be managed and reported. For a
description of the risk management framework,
please refer to Handelsbanken’s Corporate
Governance Report on pages 63-76.
The Board has established a credit committee
(composed of the CEO and the Chief Credit
Officer, together with several Board members).
The credit committee decides on credit cases
Figure AR:1 Credit losses as a percentage of
lending 1999–2019
-0.2
0.0
0.2
0.4
0.6
0.8
1.0
1.2
20192017201520132011200920072005200320011999
%
Handelsbanken Other Nordic banks*
* Only Swedish banks are included for the period up
to and including 2000.
Figure AR:2 Net gains/losses on financial
transactions as a proportion of profit 2009–2019
0
5
10
15
20
25
30
201920182017*2016*2015*2014*20132012201120102009
Source: Annual report
* Excluding non-recurring items.
%
The numbering of certain tables and figures in this Note is consistent with the numbering used in Handelsbanken’s publication “Risk and Capital – Information according to Pillar 3”.
NOTES | GROUP
96 HANDELSBANKEN | ANNUAL REPORT 2019
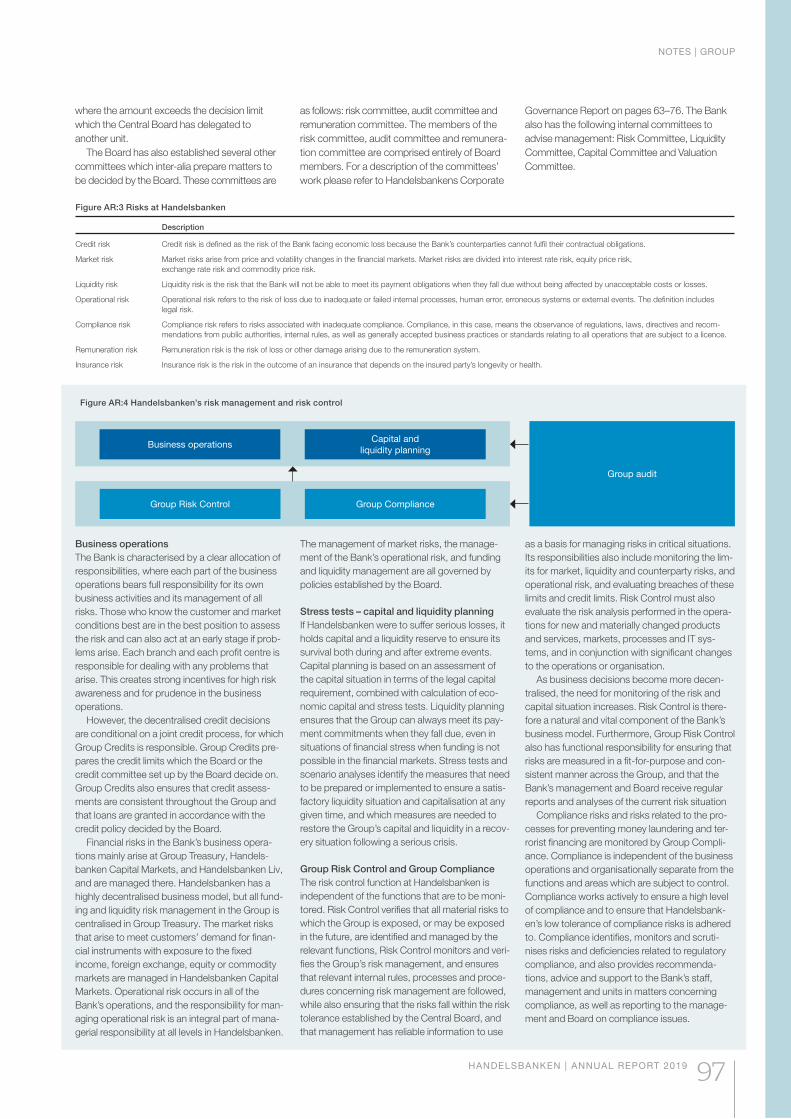
Figure AR:4 Handelsbanken’s risk management and risk control
Business operationsCapital and
liquidity planning
Group Risk Control Group Compliance
Group audit
where the amount exceeds the decision limit
which the Central Board has delegated to
another unit.
The Board has also established several other
committees which inter-alia prepare matters to
be decided by the Board. These committees are
as follows: risk committee, audit committee and
remuneration committee. The members of the
risk committee, audit committee and remunera-
tion committee are comprised entirely of Board
members. For a description of the committees’
work please refer to Handelsbankens Corporate
Governance Report on pages 63–76. The Bank
also has the following internal committees to
advise management: Risk Committee, Liquidity
Committee, Capital Committee and Valuation
Committee.
Business operations
The Bank is characterised by a clear allocation of
responsibilities, where each part of the business
operations bears full responsibility for its own
business activities and its management of all
risks. Those who know the customer and market
conditions best are in the best position to assess
the risk and can also act at an early stage if prob-
lems arise. Each branch and each profit centre is
responsible for dealing with any problems that
arise. This creates strong incentives for high risk
awareness and for prudence in the business
operations.
However, the decentralised credit decisions
are conditional on a joint credit process, for which
Group Credits is responsible. Group Credits pre-
pares the credit limits which the Board or the
credit committee set up by the Board decide on.
Group Credits also ensures that credit assess-
ments are consistent throughout the Group and
that loans are granted in accordance with the
credit policy decided by the Board.
Financial risks in the Bank’s business opera-
tions mainly arise at Group Treasury, Handels-
banken Capital Markets, and Handelsbanken Liv,
and are managed there. Handelsbanken has a
highly decentralised business model, but all fund-
ing and liquidity risk management in the Group is
centralised in Group Treasury. The market risks
that arise to meet customers’ demand for finan-
cial instruments with exposure to the fixed
income, foreign exchange, equity or commodity
markets are managed in Handelsbanken Capital
Markets. Operational risk occurs in all of the
Bank’s operations, and the responsibility for man-
aging operational risk is an integral part of mana-
gerial responsibility at all levels in Handelsbanken.
The management of market risks, the manage-
ment of the Bank’s operational risk, and funding
and liquidity management are all governed by
policies established by the Board.
Stress tests – capital and liquidity planning
If Handelsbanken were to suffer serious losses, it
holds capital and a liquidity reserve to ensure its
survival both during and after extreme events.
Capital planning is based on an assessment of
the capital situation in terms of the legal capital
requirement, combined with calculation of eco-
nomic capital and stress tests. Liquidity planning
ensures that the Group can always meet its pay-
ment commitments when they fall due, even in
situations of financial stress when funding is not
possible in the financial markets. Stress tests and
scenario analyses identify the measures that need
to be prepared or implemented to ensure a satis-
factory liquidity situation and capitalisation at any
given time, and which measures are needed to
restore the Group’s capital and liquidity in a recov-
ery situation following a serious crisis.
Group Risk Control and Group Compliance
The risk control function at Handelsbanken is
independent of the functions that are to be moni-
tored. Risk Control verifies that all material risks to
which the Group is exposed, or may be exposed
in the future, are identified and managed by the
relevant functions, Risk Control monitors and veri-
fies the Group’s risk management, and ensures
that relevant internal rules, processes and proce-
dures concerning risk management are followed,
while also ensuring that the risks fall within the risk
tolerance established by the Central Board, and
that management has reliable information to use
as a basis for managing risks in critical situations.
Its responsibilities also include monitoring the lim-
its for market, liquidity and counterparty risks, and
operational risk, and evaluating breaches of these
limits and credit limits. Risk Control must also
evaluate the risk analysis performed in the opera-
tions for new and materially changed products
and services, markets, processes and IT sys-
tems, and in conjunction with significant changes
to the operations or organisation.
As business decisions become more decen-
tralised, the need for monitoring of the risk and
capital situation increases. Risk Control is there-
fore a natural and vital component of the Bank’s
business model. Furthermore, Group Risk Control
also has functional responsibility for ensuring that
risks are measured in a fit-for-purpose and con-
sistent manner across the Group, and that the
Bank’s management and Board receive regular
reports and analyses of the current risk situation
Compliance risks and risks related to the pro-
cesses for preventing money laundering and ter-
rorist financing are monitored by Group Compli-
ance. Compliance is independent of the business
operations and organisationally separate from the
functions and areas which are subject to control.
Compliance works actively to ensure a high level
of compliance and to ensure that Handelsbank-
en’s low tolerance of compliance risks is adhered
to. Compliance identifies, monitors and scruti-
nises risks and deficiencies related to regulatory
compliance, and also provides recommenda-
tions, advice and support to the Bank’s staff,
management and units in matters concerning
compliance, as well as reporting to the manage-
ment and Board on compliance issues.
Figure AR:3 Risks at Handelsbanken
Description
Credit risk Credit risk is defined as the risk of the Bank facing economic loss because the Bank’s counterparties cannot fulfil their contractual obligations.
Market risk Market risks arise from price and volatility changes in the financial markets. Market risks are divided into interest rate risk, equity price risk,
exchange rate risk and commodity price risk.
Liquidity risk Liquidity risk is the risk that the Bank will not be able to meet its payment obligations when they fall due without being affected by unacceptable costs or losses.
Operational risk Operational risk refers to the risk of loss due to inadequate or failed internal processes, human error, erroneous systems or external events. The definition includes
legal risk.
Compliance risk Compliance risk refers to risks associated with inadequate compliance. Compliance, in this case, means the observance of regulations, laws, directives and recom-
mendations from public authorities, internal rules, as well as generally accepted business practices or standards relating to all operations that are subject to a licence.
Remuneration risk Remuneration risk is the risk of loss or other damage arising due to the remuneration system.
Insurance risk Insurance risk is the risk in the outcome of an insurance that depends on the insured party’s longevity or health.
NOTES | GROUP
HANDELSBANKEN | ANNUAL REPORT 2019 97
REPORTING AND MONITORING OF
THE RISK AND CAPITAL SITUATION
Each quarter, the CRO presents a Group risk
report compiled by Group Risk Control to the
Board’s risk committee, and also presents the
risk situation to the Board once a year. Reports
are also presented to the CEO and Risk Forum.
The Group risk reports include the CRO’s
assessment of the Group’s material risks and an
assessment of whether there are significant
deficiencies in the operation to report and
address. Where applicable, the report also
includes proposed actions and a follow-up of
previously reported risks and deficiencies. The
Group risk reports include forward-looking risk
assessments and must make possible an
assessment of whether Handelsbanken is fulfill-
ing the risk strategy and the risk tolerance
decided by the Board. The Group risk report is
formulated in accordance with the Board’s Pol-
icy for risk control.
The risk committee, chaired by the Bank’s
CRO, acts in an advisory capacity to the CEO and
CFO and met on ten occasions during 2019. At
meetings of the risk committee, the committee
performs an in-depth follow-up of the Group’s cur-
rent risk situation, potential risks and actions for
credit risks, financial risks, operational risk and
risks in the insurance operations. Other types of
risk are commented on where necessary. Indica-
tors for the recovery plan are monitored and any
actions, including an assessment of their neces-
sity, are discussed. In addition, limit utilisation for
financial risks is subject to follow-up for the Group
as a whole. The capital situation, utilisation of mar-
ket risk limits and the liquidity situation are reported
to the Board at each normal Board meeting.
The credit risk situation, including counterparty
risk, is reported periodically to the Bank’s Board
and to the boards of the subsidiaries. This
includes volume growth, risk-reported credits
and information from the Bank’s credit risk mod-
els. The boards of the regional banks monitor the
credit situation on an ongoing basis. Each branch
compiles a quarterly risk report, where it reviews
all its credit exposures where the borrower’s
repayment capacity is impaired and the Bank’s
collateral is insufficient, or there is a risk that it will
be insufficient. Moreover, Group Risk Control
reports on the development of credit risk at the
Bank to the CEO, CFO, Chief Credit Officer and
Heads of Credit in the Group on a monthly basis.
Limit utilisation for market risks and liquidity
risks is compiled and checked on a daily basis
by Group Risk Control. Exceeded limits are
immediately reported to the person who makes
the decision about the limits. The liquidity risk is
summarised by Group Risk Control and reported
daily to the CFO, weekly to the CEO and to the
Board at every normal Board meeting. The
Liquidity Committee, chaired by the Head of
Group Treasury, acts in an advisory capacity to
the CEO and CFO and meets before each regu-
lar Board meeting and on other occasions when
necessary. At this committee meeting, reports
are presented on the current liquidity situation,
on results of stress tests, scenario analysis, and
other information which is relevant for the
assessment of the Group’s liquidity situation.
Operational risks and incidents which have
occurred are reported continuously by branches
and units throughout the Handelsbanken Group
to Risk Control, where they are subsequently
monitored. In turn, Group Risk Control reports
operational risk and incidents which have
occurred to the Risk Committee and the Board’s
risk committee. Risks in the remuneration sys-
tem are evaluated on an annual basis and
reported to the Board’s remuneration committee
and risk committee. Operational risk reporting
includes information regarding significant events,
major losses, important proactive measures and
an aggregated risk assessment at Group level. In
addition, Group Risk Control monitors that the
actions which have been decided are imple-
mented. The Chief Compliance Officer reports
compliance risks at least quarterly to the CEO,
semi-annually to the Boards risk committee and
annually to the Board.
The Bank’s capital requirement is reported
weekly to the CFO and the CEO and at least
quarterly to the Board. In cases where various
thresholds are exceeded, or if the Head of Group
Capital Management or the CFO deems it appro-
priate for some other reason, proposals for
appropriate measures are presented to the CEO.
The capital situation in a medium- and long-term
perspective is summarised quarterly by the Capi-
tal Committee. Group Capital Management per-
forms a complete update of the capital forecast
on a quarterly basis, or when there are significant
changes in conditions.
THE BOARD’S RISK DECLARATION AND RISK STATEMENT
The Board has decided on the following risk
declaration and risk statement.
Risk declaration:
Handelsbanken has satisfactory arrangements
for risk management which are fit for purpose in
relation to the Bank’s business goal, overall risk
profile and the risk strategy which the Board has
decided for the operations.
Risk statement
Handelsbanken’s business goal is to have better
profitability than the average of peer competitors
in our home markets. This goal is mainly to be
achieved by having more satisfied customers and
lower costs than those of competitors. Handels-
banken is a bank with a strong local presence
and a decentralised way of working.
The Bank’s overall risk profile is that risks are to
be kept low. The Group must also be well capital-
ised at all times in relation to the risks, fulfil all
requirements imposed by resolution authorities, and
hold liquid assets so that it can meet its payment
commitments, including in situations of financial
stress in the short and long term. The risk strategy
and Bank’s overall risk profile support Handels-
banken’s aim to have a business model that is inde-
pendent of changes in the business cycle.
The Bank has, and will maintain, a low level of
credit risk. This is achieved by such measures as
its strong local presence and close customer rela-
tions. The quality of credits must never be
neglected in favour of achieving higher volume or
a higher margin. The Bank is selective when
choosing customers with the requirement that
borrowers have a good repayment capacity. As
a consequence of this, the credit portfolio has a
clear concentration on risk classes where the
probability of loss is low. This consistent
approach is reflected in the Bank’s low credit
losses over time. In 2019, credit losses were
0.04 per cent (0.04) of lending.
To ensure that the Bank is well capitalised in
relation to the risks and has a good liquidity situa-
tion, the Board stipulates the Bank’s risk toler-
ance for capitalisation and liquidity. When the risk
tolerance for capitalisation is decided, the capital
measure is set partly in relation to the statutory
requirements and partly in relation to Handels-
banken’s assessed capital requirement based on
the Bank’s model for Economic Capital (EC),
which encompasses all of the Group’s risks in one
single metric. The risk tolerance for the Bank’s
liquidity risk is decided on the one hand through
requirements that the Bank under stressed cir-
cumstances must have a sufficiently large liquidity
reserve in the form of liquid assets and assets
which can be pledged, and also liquidity-creating
measures to be able to continue its operations
during determined time periods, and on the other
hand through requirements regarding the accu-
mulated net amount of incoming and outgoing
cash flows in different time intervals.
The Board has established that the common
equity tier 1 ratio under normal circumstances
must amount to between 1 and 3 percentage
points above the total common equity tier 1 capi-
tal requirement communicated by the Swedish
Financial Supervisory Authority (the Bank’s
assessment of the common equity tier 1 capital
requirement at year-end 2019 was 15.8 per cent),
and that the ratio between AFR (Available Finan-
cial Resources) and EC must exceed 120 per
cent. At the end of 2019, the common equity tier
1 ratio was 18.5 per cent (16.8) and the AFR/EC
ratio was 314 per cent (271). The Board has stip-
ulated the goal that the Bank must have accumu-
lated positive net cash flows over a period of at
least one year, taking into account the liquidity
reserve, and with the assumption that 10 per cent
of the non-fixed-term deposits from households
and companies disappear during the first month.
With Handelsbanken’s total liquidity reserve and
liquidity-creating measures, the liquidity require-
ment would be covered for over three years dur-
ing such stressed conditions. The Bank’s risk pro-
file falls within the risk tolerance established by
the Board.
NOTES | GROUP
98 HANDELSBANKEN | ANNUAL REPORT 2019
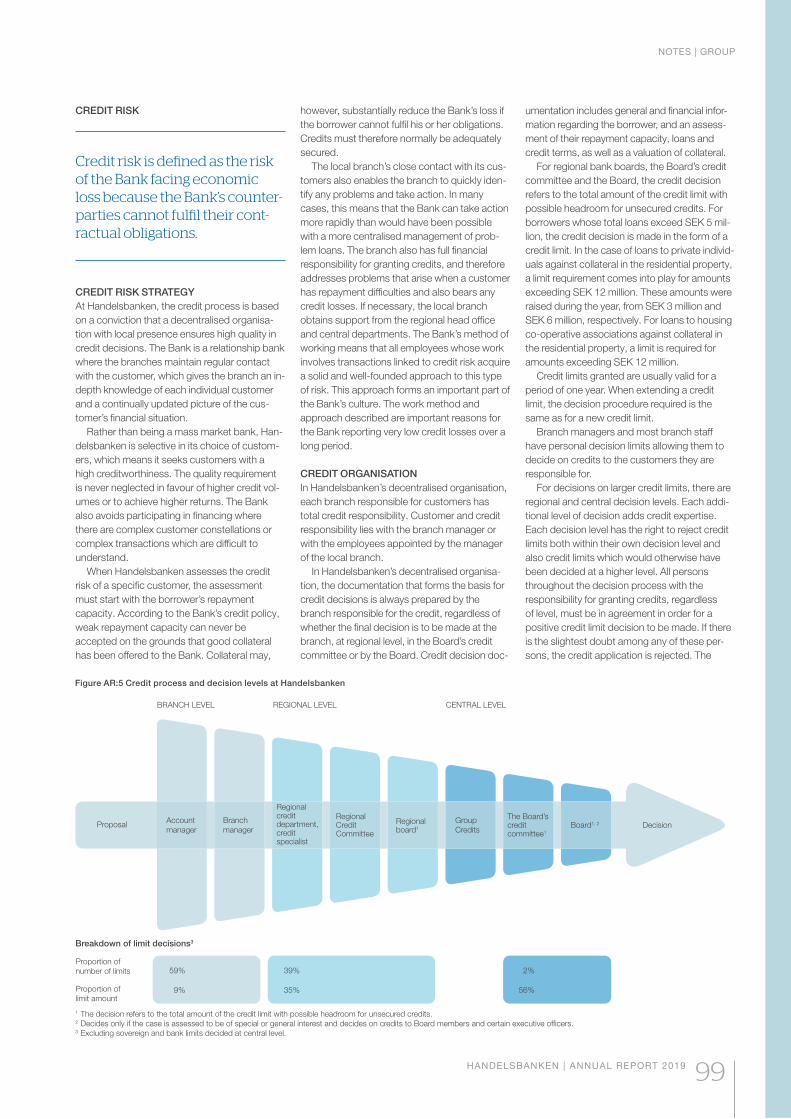
CREDIT RISK
Credit risk is defined as the risk of the Bank facing economic loss because the Bank’s counter-parties cannot fulfil their cont-ractual obligations.
CREDIT RISK STRATEGY
At Handelsbanken, the credit process is based
on a conviction that a decentralised organisa-
tion with local presence ensures high quality in
credit decisions. The Bank is a relationship bank
where the branches maintain regular contact
with the customer, which gives the branch an in-
depth knowledge of each individual customer
and a continually updated picture of the cus-
tomer’s financial situation.
Rather than being a mass market bank, Han-
delsbanken is selective in its choice of custom-
ers, which means it seeks customers with a
high creditworthiness. The quality requirement
is never neglected in favour of higher credit vol-
umes or to achieve higher returns. The Bank
also avoids participating in financing where
there are complex customer constellations or
complex transactions which are difficult to
understand.
When Handelsbanken assesses the credit
risk of a specific customer, the assessment
must start with the borrower’s repayment
capacity. According to the Bank’s credit policy,
weak repayment capacity can never be
accepted on the grounds that good collateral
has been offered to the Bank. Collateral may,
Figure AR:5 Credit process and decision levels at Handelsbanken
however, substantially reduce the Bank’s loss if
the borrower cannot fulfil his or her obligations.
Credits must therefore normally be adequately
secured.
The local branch’s close contact with its cus-
tomers also enables the branch to quickly iden-
tify any problems and take action. In many
cases, this means that the Bank can take action
more rapidly than would have been possible
with a more centralised management of prob-
lem loans. The branch also has full financial
responsibility for granting credits, and therefore
addresses problems that arise when a customer
has repayment difficulties and also bears any
credit losses. If necessary, the local branch
obtains support from the regional head office
and central departments. The Bank’s method of
working means that all employees whose work
involves transactions linked to credit risk acquire
a solid and well-founded approach to this type
of risk. This approach forms an important part of
the Bank’s culture. The work method and
approach described are important reasons for
the Bank reporting very low credit losses over a
long period.
CREDIT ORGANISATION
In Handelsbanken’s decentralised organisation,
each branch responsible for customers has
total credit responsibility. Customer and credit
responsibility lies with the branch manager or
with the employees appointed by the manager
of the local branch.
In Handelsbanken’s decentralised organisa-
tion, the documentation that forms the basis for
credit decisions is always prepared by the
branch responsible for the credit, regardless of
whether the final decision is to be made at the
branch, at regional level, in the Board’s credit
committee or by the Board. Credit decision doc-
umentation includes general and financial infor-
mation regarding the borrower, and an assess-
ment of their repayment capacity, loans and
credit terms, as well as a valuation of collateral.
For regional bank boards, the Board’s credit
committee and the Board, the credit decision
refers to the total amount of the credit limit with
possible headroom for unsecured credits. For
borrowers whose total loans exceed SEK 5 mil-
lion, the credit decision is made in the form of a
credit limit. In the case of loans to private individ-
uals against collateral in the residential property,
a limit requirement comes into play for amounts
exceeding SEK 12 million. These amounts were
raised during the year, from SEK 3 million and
SEK 6 million, respectively. For loans to housing
co-operative associations against collateral in
the residential property, a limit is required for
amounts exceeding SEK 12 million.
Credit limits granted are usually valid for a
period of one year. When extending a credit
limit, the decision procedure required is the
same as for a new credit limit.
Branch managers and most branch staff
have personal decision limits allowing them to
decide on credits to the customers they are
responsible for.
For decisions on larger credit limits, there are
regional and central decision levels. Each addi-
tional level of decision adds credit expertise.
Each decision level has the right to reject credit
limits both within their own decision level and
also credit limits which would otherwise have
been decided at a higher level. All persons
throughout the decision process with the
responsibility for granting credits, regardless
of level, must be in agreement in order for a
positive credit limit decision to be made. If there
is the slightest doubt among any of these per-
sons, the credit application is rejected. The
Breakdown of limit decisions3
Proportion of
number of limits
Proportion of
limit amount
BRANCH LEVEL REGIONAL LEVEL CENTRAL LEVEL
ProposalAccount
manager
Branch
manager
Regional credit department, credit specialist
Regional Credit Committee
Regional board1
Group
Credits
The Board’s credit committee1
Board1, 2 Decision
1 The decision refers to the total amount of the credit limit with possible headroom for unsecured credits.2 Decides only if the case is assessed to be of special or general interest and decides on credits to Board members and certain executive officers.3 Excluding sovereign and bank limits decided at central level.
59% 39% 2%
9% 35% 56%
NOTES | GROUP
HANDELSBANKEN | ANNUAL REPORT 2019 99
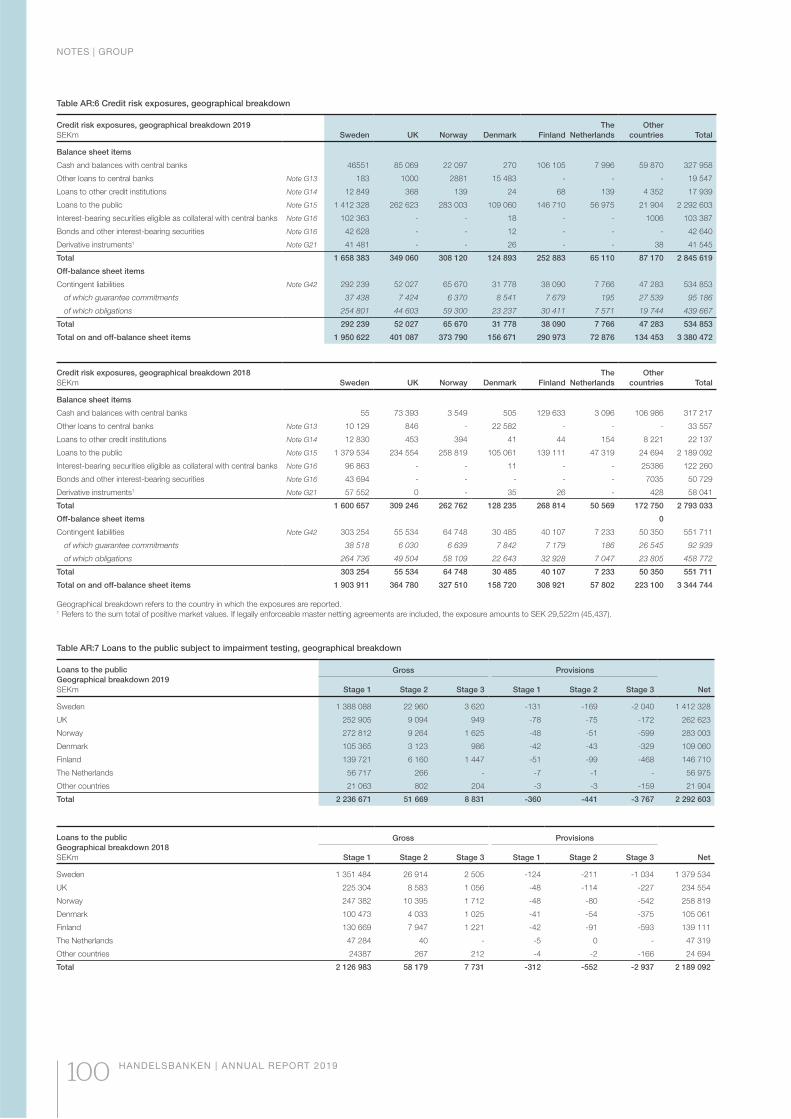
Table AR:6 Credit risk exposures, geographical breakdown
Credit risk exposures, geographical breakdown 2019
SEKm Sweden UK Norway Denmark Finland
The
Netherlands
Other
countries Total
Balance sheet items
Cash and balances with central banks 46551 85 069 22 097 270 106 105 7 996 59 870 327 958
Other loans to central banks Note G13 183 1000 2881 15 483 - - - 19 547
Loans to other credit institutions Note G14 12 849 368 139 24 68 139 4 352 17 939
Loans to the public Note G15 1 412 328 262 623 283 003 109 060 146 710 56 975 21 904 2 292 603
Interest-bearing securities eligible as collateral with central banks Note G16 102 363 - - 18 - - 1006 103 387
Bonds and other interest-bearing securities Note G16 42 628 - - 12 - - - 42 640
Derivative instruments1 Note G21 41 481 - - 26 - - 38 41 545
Total 1 658 383 349 060 308 120 124 893 252 883 65 110 87 170 2 845 619
Off-balance sheet items
Contingent liabilities Note G42 292 239 52 027 65 670 31 778 38 090 7 766 47 283 534 853
of which guarantee commitments 37 438 7 424 6 370 8 541 7 679 195 27 539 95 186
of which obligations 254 801 44 603 59 300 23 237 30 411 7 571 19 744 439 667
Total 292 239 52 027 65 670 31 778 38 090 7 766 47 283 534 853
Total on and off-balance sheet items 1 950 622 401 087 373 790 156 671 290 973 72 876 134 453 3 380 472
Credit risk exposures, geographical breakdown 2018
SEKm Sweden UK Norway Denmark Finland
The
Netherlands
Other
countries Total
Balance sheet items
Cash and balances with central banks 55 73 393 3 549 505 129 633 3 096 106 986 317 217
Other loans to central banks Note G13 10 129 846 - 22 582 - - - 33 557
Loans to other credit institutions Note G14 12 830 453 394 41 44 154 8 221 22 137
Loans to the public Note G15 1 379 534 234 554 258 819 105 061 139 111 47 319 24 694 2 189 092
Interest-bearing securities eligible as collateral with central banks Note G16 96 863 - - 11 - - 25386 122 260
Bonds and other interest-bearing securities Note G16 43 694 - - - - - 7035 50 729
Derivative instruments1 Note G21 57 552 0 - 35 26 - 428 58 041
Total 1 600 657 309 246 262 762 128 235 268 814 50 569 172 750 2 793 033
Off-balance sheet items 0
Contingent liabilities Note G42 303 254 55 534 64 748 30 485 40 107 7 233 50 350 551 711
of which guarantee commitments 38 518 6 030 6 639 7 842 7 179 186 26 545 92 939
of which obligations 264 736 49 504 58 109 22 643 32 928 7 047 23 805 458 772
Total 303 254 55 534 64 748 30 485 40 107 7 233 50 350 551 711
Total on and off-balance sheet items 1 903 911 364 780 327 510 158 720 308 921 57 802 223 100 3 344 744
Geographical breakdown refers to the country in which the exposures are reported.1 Refers to the sum total of positive market values. If legally enforceable master netting agreements are included, the exposure amounts to SEK 29,522m (45,437).
Table AR:7 Loans to the public subject to impairment testing, geographical breakdown
Loans to the public
Geographical breakdown 2019
SEKm
Gross Provisions
Stage 1 Stage 2 Stage 3 Stage 1 Stage 2 Stage 3 Net
Sweden 1 388 088 22 960 3 620 -131 -169 -2 040 1 412 328
UK 252 905 9 094 949 -78 -75 -172 262 623
Norway 272 812 9 264 1 625 -48 -51 -599 283 003
Denmark 105 365 3 123 986 -42 -43 -329 109 060
Finland 139 721 6 160 1 447 -51 -99 -468 146 710
The Netherlands 56 717 266 - -7 -1 - 56 975
Other countries 21 063 802 204 -3 -3 -159 21 904
Total 2 236 671 51 669 8 831 -360 -441 -3 767 2 292 603
Loans to the public
Geographical breakdown 2018
SEKm
Gross Provisions
Stage 1 Stage 2 Stage 3 Stage 1 Stage 2 Stage 3 Net
Sweden 1 351 484 26 914 2 505 -124 -211 -1 034 1 379 534
UK 225 304 8 583 1 056 -48 -114 -227 234 554
Norway 247 382 10 395 1 712 -48 -80 -542 258 819
Denmark 100 473 4 033 1 025 -41 -54 -375 105 061
Finland 130 669 7 947 1 221 -42 -91 -593 139 111
The Netherlands 47 284 40 - -5 0 - 47 319
Other countries 24387 267 212 -4 -2 -166 24 694
Total 2 126 983 58 179 7 731 -312 -552 -2 937 2 189 092
NOTES | GROUP
100 HANDELSBANKEN | ANNUAL REPORT 2019
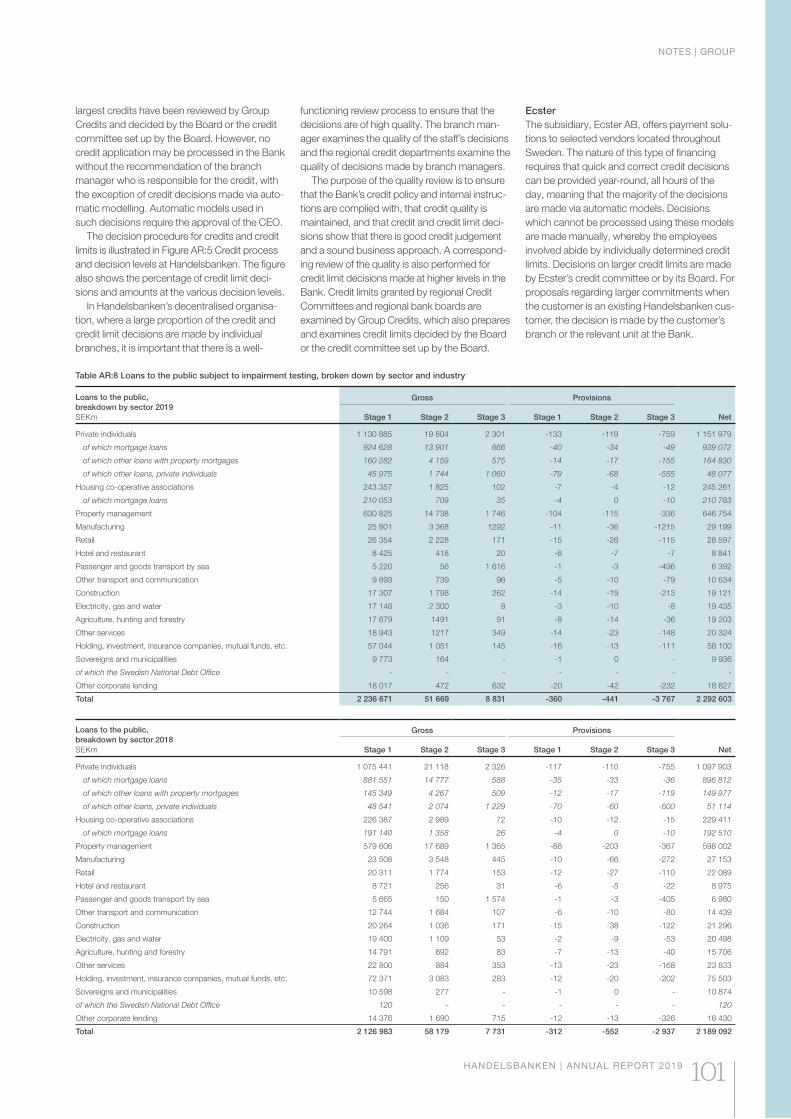
Table AR:8 Loans to the public subject to impairment testing, broken down by sector and industry
Loans to the public,
breakdown by sector 2019
SEKm
Gross Provisions
Stage 1 Stage 2 Stage 3 Stage 1 Stage 2 Stage 3 Net
Private individuals 1 130 885 19 804 2 301 -133 -119 -759 1 151 979
of which mortgage loans 924 628 13 901 666 -40 -34 -49 939 072
of which other loans with property mortgages 160 282 4 159 575 -14 -17 -155 164 830
of which other loans, private individuals 45 975 1 744 1 060 -79 -68 -555 48 077
Housing co-operative associations 243 357 1 825 102 -7 -4 -12 245 261
of which mortgage loans 210 053 709 35 -4 0 -10 210 783
Property management 630 825 14 738 1 746 -104 -115 -336 646 754
Manufacturing 25 801 3 368 1292 -11 -36 -1215 29 199
Retail 26 354 2 228 171 -15 -26 -115 28 597
Hotel and restaurant 8 425 418 20 -8 -7 -7 8 841
Passenger and goods transport by sea 5 220 56 1 616 -1 -3 -496 6 392
Other transport and communication 9 893 739 96 -5 -10 -79 10 634
Construction 17 307 1 798 262 -14 -19 -213 19 121
Electricity, gas and water 17 148 2 300 8 -3 -10 -8 19 435
Agriculture, hunting and forestry 17 679 1491 91 -8 -14 -36 19 203
Other services 18 943 1217 349 -14 -23 -148 20 324
Holding, investment, insurance companies, mutual funds, etc. 57 044 1 051 145 -16 -13 -111 58 100
Sovereigns and municipalities 9 773 164 - -1 0 - 9 936
of which the Swedish National Debt Office - - - - - - -
Other corporate lending 18 017 472 632 -20 -42 -232 18 827
Total 2 236 671 51 669 8 831 -360 -441 -3 767 2 292 603
Loans to the public,
breakdown by sector 2018
SEKm
Gross Provisions
Stage 1 Stage 2 Stage 3 Stage 1 Stage 2 Stage 3 Net
Private individuals 1 075 441 21 118 2 326 -117 -110 -755 1 097 903
of which mortgage loans 881 551 14 777 588 -35 -33 -36 896 812
of which other loans with property mortgages 145 349 4 267 509 -12 -17 -119 149 977
of which other loans, private individuals 48 541 2 074 1 229 -70 -60 -600 51 114
Housing co-operative associations 226 387 2 989 72 -10 -12 -15 229 411
of which mortgage loans 191 140 1 358 26 -4 0 -10 192 510
Property management 579 606 17 689 1 365 -88 -203 -367 598 002
Manufacturing 23 508 3 548 445 -10 -66 -272 27 153
Retail 20 311 1 774 153 -12 -27 -110 22 089
Hotel and restaurant 8 721 256 31 -6 -5 -22 8 975
Passenger and goods transport by sea 5 665 150 1 574 -1 -3 -405 6 980
Other transport and communication 12 744 1 684 107 -6 -10 -80 14 439
Construction 20 264 1 036 171 -15 -38 -122 21 296
Electricity, gas and water 19 400 1 109 53 -2 -9 -53 20 498
Agriculture, hunting and forestry 14 791 892 83 -7 -13 -40 15 706
Other services 22 800 884 353 -13 -23 -168 23 833
Holding, investment, insurance companies, mutual funds, etc. 72 371 3 083 283 -12 -20 -202 75 503
Sovereigns and municipalities 10 598 277 - -1 0 - 10 874
of which the Swedish National Debt Office 120 - - - - - 120
Other corporate lending 14 376 1 690 715 -12 -13 -326 16 430
Total 2 126 983 58 179 7 731 -312 -552 -2 937 2 189 092
largest credits have been reviewed by Group
Credits and decided by the Board or the credit
committee set up by the Board. However, no
credit application may be processed in the Bank
without the recommendation of the branch
manager who is responsible for the credit, with
the exception of credit decisions made via auto-
matic modelling. Automatic models used in
such decisions require the approval of the CEO.
The decision procedure for credits and credit
limits is illustrated in Figure AR:5 Credit process
and decision levels at Handelsbanken. The figure
also shows the percentage of credit limit deci-
sions and amounts at the various decision levels.
In Handelsbanken’s decentralised organisa-
tion, where a large proportion of the credit and
credit limit decisions are made by individual
branches, it is important that there is a well-
functioning review process to ensure that the
decisions are of high quality. The branch man-
ager examines the quality of the staff’s decisions
and the regional credit departments examine the
quality of decisions made by branch managers.
The purpose of the quality review is to ensure
that the Bank’s credit policy and internal instruc-
tions are complied with, that credit quality is
maintained, and that credit and credit limit deci-
sions show that there is good credit judgement
and a sound business approach. A correspond-
ing review of the quality is also performed for
credit limit decisions made at higher levels in the
Bank. Credit limits granted by regional Credit
Committees and regional bank boards are
examined by Group Credits, which also prepares
and examines credit limits decided by the Board
or the credit committee set up by the Board.
Ecster
The subsidiary, Ecster AB, offers payment solu-
tions to selected vendors located throughout
Sweden. The nature of this type of financing
requires that quick and correct credit decisions
can be provided year-round, all hours of the
day, meaning that the majority of the decisions
are made via automatic models. Decisions
which cannot be processed using these models
are made manually, whereby the employees
involved abide by individually determined credit
limits. Decisions on larger credit limits are made
by Ecster’s credit committee or by its Board. For
proposals regarding larger commitments when
the customer is an existing Handelsbanken cus-
tomer, the decision is made by the customer’s
branch or the relevant unit at the Bank.
NOTES | GROUP
HANDELSBANKEN | ANNUAL REPORT 2019 101

Table AR:9 Loans to the public subject to impairment testing, geographical breakdown by sector
Loans to the public after deduction of provisions,
geographical breakdown by sector 2019
SEKm Sweden UK Norway Denmark Finland
The
Netherlands
Other
countries Total
Private individuals 834 052 82 036 105 047 64 429 42 514 16 819 7 082 1 151 979
of which mortgage loans 798 418 - 72 503 48 254 19 897 - - 939 072
of which other loans with property mortgages 6 423 77 089 30 504 11 186 17 275 16 191 6 162 164 830
of which other loans, private individuals 29 211 4 947 2 040 4 989 5 342 628 920 48 077
Housing co-operative associations 188 182 - 23 057 965 33 057 - - 245 261
of which mortgage loans 174 378 - 22 003 - 14 402 - - 210 783
Property management 258 326 153 096 125 524 22 978 44 707 37 706 4 417 646 754
Manufacturing 11 730 2 757 3 065 4 925 2 175 0 4 547 29 199
Retail 14 222 4 040 4 987 2 734 1 008 41 1565 28 597
Hotel and restaurant 2 501 4 083 269 1 931 50 7 - 8 841
Passenger and goods transport by sea 2 464 69 1 607 346 1 906 - - 6 392
Other transport and communication 5 897 944 740 1632 1 396 22 3 10 634
Construction 7 522 3 193 6 870 530 987 19 - 19 121
Electricity, gas and water 6 483 378 4 719 60 6 550 105 1140 19 435
Agriculture, hunting and forestry 16 274 1 998 308 399 181 31 12 19 203
Other services 7 640 5 829 3 420 1104 1 384 738 209 20 324
Holding, investment, insurance companies, mutual funds etc. 40 533 2 632 1 921 6 227 3 356 1 392 2 039 58 100
Sovereigns and municipalities 2 589 - 328 2 7 017 - - 9 936
of which the Swedish National Debt Office - -
Other corporate lending 13 913 1 568 1 141 798 422 95 890 18 827
Total loans to the public, before collective provision 1 412 328 262 623 283 003 109 060 146 710 56 975 21 904 2 292 603
of which total provsions for expected credit losses (Stage 1-3) -2 340 -325 -698 -414 -618 -8 -165 -4 568
Total loans to the public 1 414 668 262 948 283 701 109 474 147 328 56 983 22 069 2 297 171
Loans to the public after deduction of provisions,
geographical breakdown by sector 2018
SEKm Sweden UK Norway Denmark Finland
The
Netherlands
Other
countries Total
Private individuals 806 379 71 668 95 482 63 042 40 995 13 698 6 639 1 097 903
of which mortgage loans 766 746 - 63 683 46 316 20 067 - - 896 812
of which other loans with property mortgages 6 151 66 933 29 376 12 775 15 594 13 284 5 864 149 977
of which other loans, private individuals 33 482 4 735 2 423 3 951 5 334 414 775 51 114
Housing co-operative associations 180 162 - 20 295 891 28 063 - - 229 411
of which mortgage loans 161 651 - 19 161 - 11 698 - - 192 510
Property management 251 580 136 950 111 646 20 731 41 188 31 449 4 458 598 002
Manufacturing 12 996 2 409 2 054 1 743 2 104 1 5 846 27 153
Retail 10 675 4 241 3 483 2 288 1 302 38 62 22 089
Hotel and restaurant 2 159 3 918 514 2 305 77 2 0 8 975
Passenger and goods transport by sea 2 680 16 1 808 611 1 865 - 0 6 980
Other transport and communication 9 168 829 2 536 631 1 237 26 12 14 439
Construction 8 864 3 068 8 021 372 944 2 25 21 296
Electricity, gas and water 7 243 345 4 833 70 7 516 103 388 20 498
Agriculture, hunting and forestry 13 449 1 533 316 239 135 34 - 15 706
Other services 12 179 4 883 3 677 866 1 658 553 17 23 833
Holding, investment, insurance companies, mutual funds etc. 54 119 2 257 1 163 8 717 3 380 1 402 4 465 75 503
Sovereigns and municipalities 2 488 - 270 2 8 114 - - 10 874
of which the Swedish National Debt Office 120 120
Other corporate lending 5 393 2 437 2 721 2 553 533 11 2 782 16 430
Total loans to the public, before collective provision 1 379 534 234 554 258 819 105 061 139 111 47 319 24 694 2 189 092
of which total provsions for expected credit losses (Stage 1-3) -1 369 -389 -670 -470 -726 -5 -172 -3 801
Total loans to the public 1 380 903 234 943 259 489 105 531 139 837 47 324 24 866 2 192 893
CREDIT PORTFOLIO
The Bank’s credit portfolio is presented in this
section based on the categorisation of balance
sheet items. The section on Capital require-
ments for credit risks presents the credit portfo-
lio based on CRR.
Based on the consolidated balance sheet,
credits are categorised as loans to the public or
loans to credit institutions, while off-balance
sheet items are broken down by product type.
‘Exposure’ refers to the sum of items on and off
the balance sheet. Loans to the public is the
dominant item. See Table AR:6 Credit risk expo-
sures, geographical breakdown.
Handelsbanken strives to maintain its histori-
cally low level of credit losses compared to other
banks, thus contributing to the Bank’s profitability
target and retaining its sound financial position. In
granting credits, the Bank never strives toward
goals such as a predetermined volume or market
share in particular sectors, and is instead selec-
tive when choosing its customers, adopting the
mindset that credit customers must be of high
quality. The demands on quality must never be
neglected in favour of achieving a high credit
volume. This is clearly stated in the Bank’s credit
policy, endorsed each year by the Board.
Handelsbanken regularly evaluates the qual-
ity of the credit portfolio in order to identify and
limit impairment requirements. For a more
NOTES | GROUP
102 HANDELSBANKEN | ANNUAL REPORT 2019
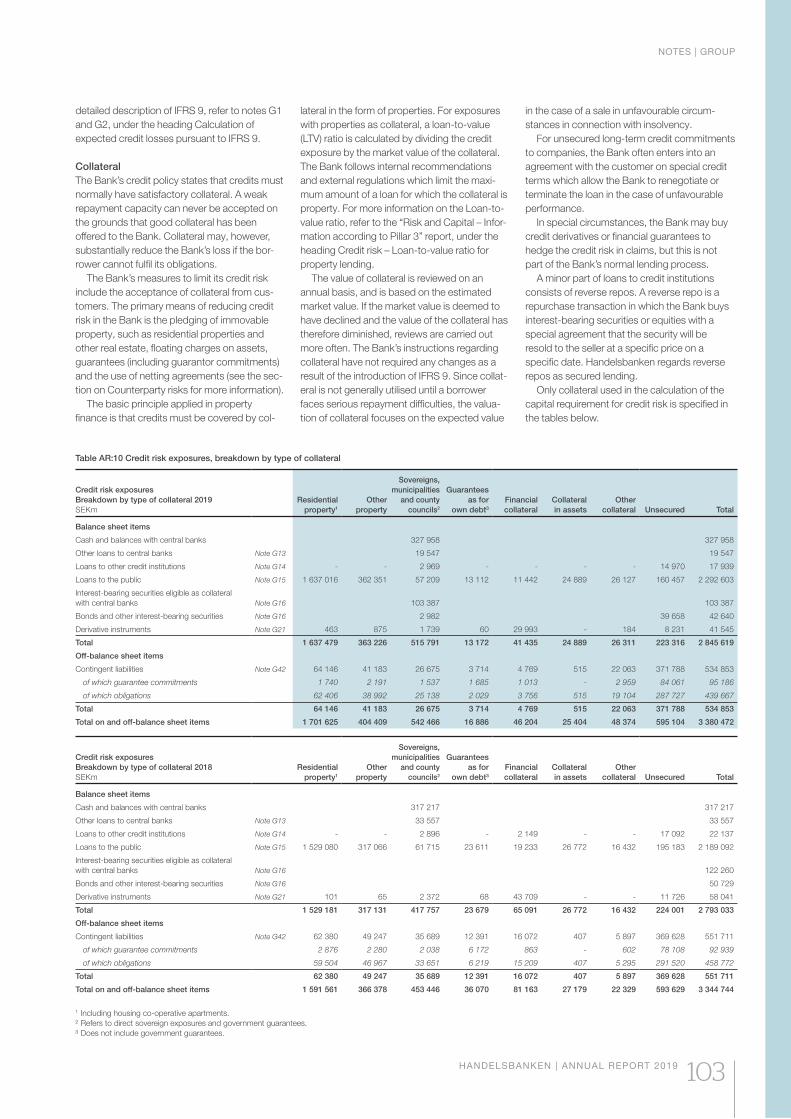
Table AR:10 Credit risk exposures, breakdown by type of collateral
Credit risk exposures
Breakdown by type of collateral 2019
SEKm
Residential
property1
Other
property
Sovereigns,
municipalities
and county
councils2
Guarantees
as for
own debt3
Financial
collateral
Collateral
in assets
Other
collateral Unsecured Total
Balance sheet items
Cash and balances with central banks 327 958 327 958
Other loans to central banks Note G13 19 547 19 547
Loans to other credit institutions Note G14 - - 2 969 - - - - 14 970 17 939
Loans to the public Note G15 1 637 016 362 351 57 209 13 112 11 442 24 889 26 127 160 457 2 292 603
Interest-bearing securities eligible as collateral
with central banks Note G16 103 387 103 387
Bonds and other interest-bearing securities Note G16 2 982 39 658 42 640
Derivative instruments Note G21 463 875 1 739 60 29 993 - 184 8 231 41 545
Total 1 637 479 363 226 515 791 13 172 41 435 24 889 26 311 223 316 2 845 619
Off-balance sheet items
Contingent liabilities Note G42 64 146 41 183 26 675 3 714 4 769 515 22 063 371 788 534 853
of which guarantee commitments 1 740 2 191 1 537 1 685 1 013 - 2 959 84 061 95 186
of which obligations 62 406 38 992 25 138 2 029 3 756 515 19 104 287 727 439 667
Total 64 146 41 183 26 675 3 714 4 769 515 22 063 371 788 534 853
Total on and off-balance sheet items 1 701 625 404 409 542 466 16 886 46 204 25 404 48 374 595 104 3 380 472
Credit risk exposures
Breakdown by type of collateral 2018
SEKm
Residential
property1
Other
property
Sovereigns,
municipalities
and county
councils2
Guarantees
as for
own debt3
Financial
collateral
Collateral
in assets
Other
collateral Unsecured Total
Balance sheet items
Cash and balances with central banks 317 217 317 217
Other loans to central banks Note G13 33 557 33 557
Loans to other credit institutions Note G14 - - 2 896 - 2 149 - - 17 092 22 137
Loans to the public Note G15 1 529 080 317 066 61 715 23 611 19 233 26 772 16 432 195 183 2 189 092
Interest-bearing securities eligible as collateral
with central banks Note G16 122 260
Bonds and other interest-bearing securities Note G16 50 729
Derivative instruments Note G21 101 65 2 372 68 43 709 - - 11 726 58 041
Total 1 529 181 317 131 417 757 23 679 65 091 26 772 16 432 224 001 2 793 033
Off-balance sheet items
Contingent liabilities Note G42 62 380 49 247 35 689 12 391 16 072 407 5 897 369 628 551 711
of which guarantee commitments 2 876 2 280 2 038 6 172 863 - 602 78 108 92 939
of which obligations 59 504 46 967 33 651 6 219 15 209 407 5 295 291 520 458 772
Total 62 380 49 247 35 689 12 391 16 072 407 5 897 369 628 551 711
Total on and off-balance sheet items 1 591 561 366 378 453 446 36 070 81 163 27 179 22 329 593 629 3 344 744
1 Including housing co-operative apartments.
² Refers to direct sovereign exposures and government guarantees.
³ Does not include government guarantees.
detailed description of IFRS 9, refer to notes G1
and G2, under the heading Calculation of
expected credit losses pursuant to IFRS 9.
Collateral
The Bank’s credit policy states that credits must
normally have satisfactory collateral. A weak
repayment capacity can never be accepted on
the grounds that good collateral has been
offered to the Bank. Collateral may, however,
substantially reduce the Bank’s loss if the bor-
rower cannot fulfil its obligations.
The Bank’s measures to limit its credit risk
include the acceptance of collateral from cus-
tomers. The primary means of reducing credit
risk in the Bank is the pledging of immovable
property, such as residential properties and
other real estate, floating charges on assets,
guarantees (including guarantor commitments)
and the use of netting agreements (see the sec-
tion on Counterparty risks for more information).
The basic principle applied in property
finance is that credits must be covered by col-
lateral in the form of properties. For exposures
with properties as collateral, a loan-to-value
(LTV) ratio is calculated by dividing the credit
exposure by the market value of the collateral.
The Bank follows internal recommendations
and external regulations which limit the maxi-
mum amount of a loan for which the collateral is
property. For more information on the Loan-to-
value ratio, refer to the “Risk and Capital – Infor-
mation according to Pillar 3” report, under the
heading Credit risk – Loan-to-value ratio for
property lending.
The value of collateral is reviewed on an
annual basis, and is based on the estimated
market value. If the market value is deemed to
have declined and the value of the collateral has
therefore diminished, reviews are carried out
more often. The Bank’s instructions regarding
collateral have not required any changes as a
result of the introduction of IFRS 9. Since collat-
eral is not generally utilised until a borrower
faces serious repayment difficulties, the valua-
tion of collateral focuses on the expected value
in the case of a sale in unfavourable circum-
stances in connection with insolvency.
For unsecured long-term credit commitments
to companies, the Bank often enters into an
agreement with the customer on special credit
terms which allow the Bank to renegotiate or
terminate the loan in the case of unfavourable
performance.
In special circumstances, the Bank may buy
credit derivatives or financial guarantees to
hedge the credit risk in claims, but this is not
part of the Bank’s normal lending process.
A minor part of loans to credit institutions
consists of reverse repos. A reverse repo is a
repurchase transaction in which the Bank buys
interest-bearing securities or equities with a
special agreement that the security will be
resold to the seller at a specific price on a
specific date. Handelsbanken regards reverse
repos as secured lending.
Only collateral used in the calculation of the
capital requirement for credit risk is specified in
the tables below.
NOTES | GROUP
HANDELSBANKEN | ANNUAL REPORT 2019 103

Table AR:11 On and off-balance sheet items subject to impairment testing, breakdown by type of collateral
On and off-balance sheet items subject to impairment testing, breakdown by type of collateral 2019
2019
SEKm
Gross Provisions
Stage 1 Stage 2 Stage 3 Stage 1 Stage 2 Stage 3
Balance sheet items
Cash and balances with central banks 327 958 - - 0 - -
Sovereigns, municipalities and county councils² 327 958 - - 0 - -
Other loans to central banks Note G13 19 547 - - - - -
Sovereigns, municipalities and county councils² 19 547 - - - - -
Loans to other credit institutions Note G14 17 750 193 - -1 -3 -
Sovereigns, municipalities and county councils² 2 900 71 - -1 -1 -
Financial collateral - - - - - -
Unsecured 14 850 122 - 0 -2 -
Loans to the public Note G15 2 236 671 51 669 8 831 -360 -441 -3 767
Residential property1 1 607 259 28 552 1 774 -110 -129 -330
Other property 350 198 11 567 1 168 -93 -101 -388
Sovereigns, municipalities and county councils² 55 917 1 014 283 -2 -3 -
Guarantees as for own debt3 12 839 199 80 -3 -3 -
Financial collateral 11 228 215 4 -3 -2 -
Collateral in assets 23 514 1 403 40 -21 -28 -19
Other collateral 22 823 2 476 1 882 -17 -54 -983
Unsecured 152 893 6 243 3 600 -111 -121 -2 047
Interest-bearing securities eligible as collateral
with central banks Note G16 1 427 - - 0 - -
Bonds and other interest-bearing securities Note G16 4 953 - - -2 - -
Total 2 608 306 51 862 8 831 -363 -444 -3 767
Off-balance sheet items
Contingent liabilities Note G35, G42 400 479 7 985 712 -69 -66 -106
of which guarantee commitments 92 097 2 593 496 -7 -13 -71
Residential property 1 675 62 4 -2 -1 -
Other property 2 114 68 8 - -1 -
Sovereigns, municipalities and county councils² 1 396 121 20 - -3 -
Guarantees as for own debt 1 669 10 5 - - -
Financial collateral 933 77 3 - - -
Collateral in assets - - - - - -
Other collateral 2 342 253 364 -1 -2 -55
Unsecured 81 968 2 002 92 -4 -6 -16
of which obligations 308 382 5 392 216 -62 -53 -35
Residential property1 61 870 502 34 -5 -2 -5
Other property 38 484 494 14 -4 -5 -
Sovereigns, municipalities and county councils² 25 029 106 4 - - -
Guarantees as for own debt³ 1 853 174 3 -1 -1 -
Financial collateral 3 712 40 4 - - -
Collateral in assets 501 14 - - - -
Other collateral 17 917 1 087 100 -7 -16 -23
Unsecured 159 016 2 975 57 -45 -29 -7
Total 400 479 7 985 712 -69 -66 -106
Total on and off-balance sheet items 3 008 785 59 847 9 543 -432 -510 -3 873
1 Including housing co-operative apartments.
² Refers to direct sovereign exposures and government guarantees.
³ Does not include government guarantees.
NOTES | GROUP
104 HANDELSBANKEN | ANNUAL REPORT 2019
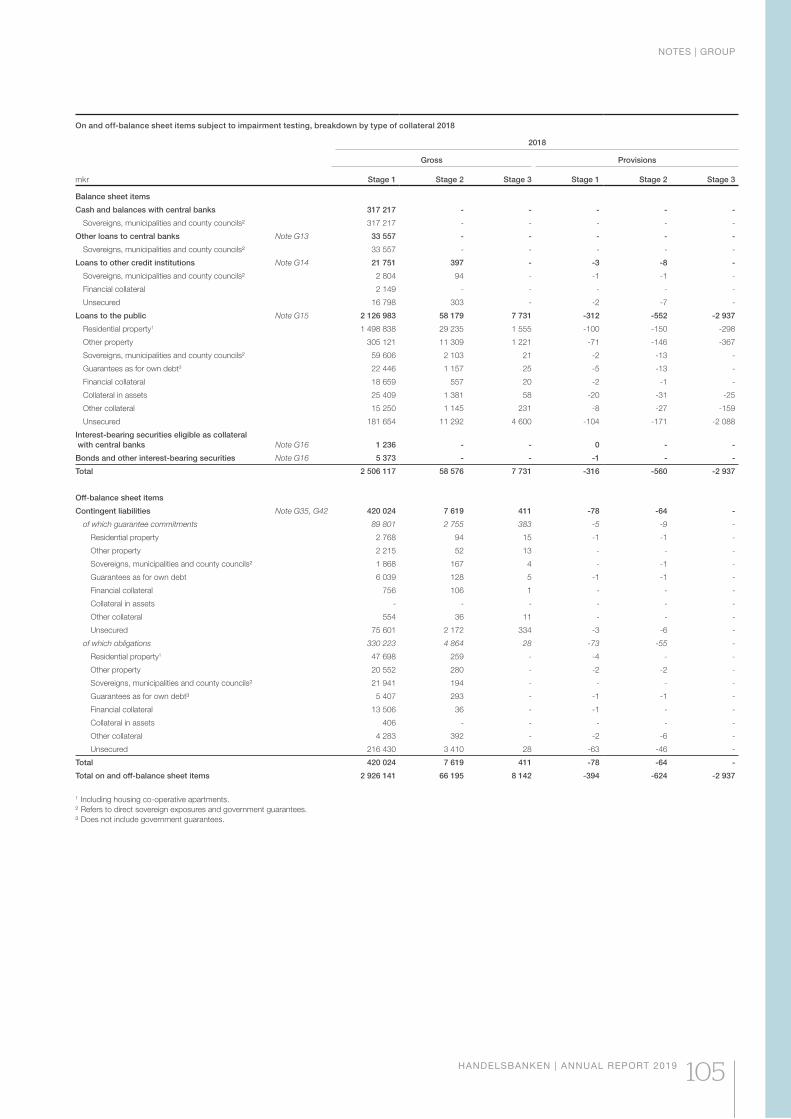
On and off-balance sheet items subject to impairment testing, breakdown by type of collateral 2018
2018
mkr
Gross Provisions
Stage 1 Stage 2 Stage 3 Stage 1 Stage 2 Stage 3
Balance sheet items
Cash and balances with central banks 317 217 - - - - -
Sovereigns, municipalities and county councils² 317 217 - - - - -
Other loans to central banks Note G13 33 557 - - - - -
Sovereigns, municipalities and county councils² 33 557 - - - - -
Loans to other credit institutions Note G14 21 751 397 - -3 -8 -
Sovereigns, municipalities and county councils² 2 804 94 - -1 -1 -
Financial collateral 2 149 - - - - -
Unsecured 16 798 303 - -2 -7 -
Loans to the public Note G15 2 126 983 58 179 7 731 -312 -552 -2 937
Residential property1 1 498 838 29 235 1 555 -100 -150 -298
Other property 305 121 11 309 1 221 -71 -146 -367
Sovereigns, municipalities and county councils² 59 606 2 103 21 -2 -13 -
Guarantees as for own debt3 22 446 1 157 25 -5 -13 -
Financial collateral 18 659 557 20 -2 -1 -
Collateral in assets 25 409 1 381 58 -20 -31 -25
Other collateral 15 250 1 145 231 -8 -27 -159
Unsecured 181 654 11 292 4 600 -104 -171 -2 088
Interest-bearing securities eligible as collateral
with central banks Note G16 1 236 - - 0 - -
Bonds and other interest-bearing securities Note G16 5 373 - - -1 - -
Total 2 506 117 58 576 7 731 -316 -560 -2 937
Off-balance sheet items
Contingent liabilities Note G35, G42 420 024 7 619 411 -78 -64 -
of which guarantee commitments 89 801 2 755 383 -5 -9 -
Residential property 2 768 94 15 -1 -1 -
Other property 2 215 52 13 - - -
Sovereigns, municipalities and county councils² 1 868 167 4 - -1 -
Guarantees as for own debt 6 039 128 5 -1 -1 -
Financial collateral 756 106 1 - - -
Collateral in assets - - - - - -
Other collateral 554 36 11 - - -
Unsecured 75 601 2 172 334 -3 -6 -
of which obligations 330 223 4 864 28 -73 -55 -
Residential property1 47 698 259 - -4 - -
Other property 20 552 280 - -2 -2 -
Sovereigns, municipalities and county councils² 21 941 194 - - - -
Guarantees as for own debt³ 5 407 293 - -1 -1 -
Financial collateral 13 506 36 - -1 - -
Collateral in assets 406 - - - - -
Other collateral 4 283 392 - -2 -6 -
Unsecured 216 430 3 410 28 -63 -46 -
Total 420 024 7 619 411 -78 -64 -
Total on and off-balance sheet items 2 926 141 66 195 8 142 -394 -624 -2 937
1 Including housing co-operative apartments.
² Refers to direct sovereign exposures and government guarantees.
³ Does not include government guarantees.
NOTES | GROUP
HANDELSBANKEN | ANNUAL REPORT 2019 105
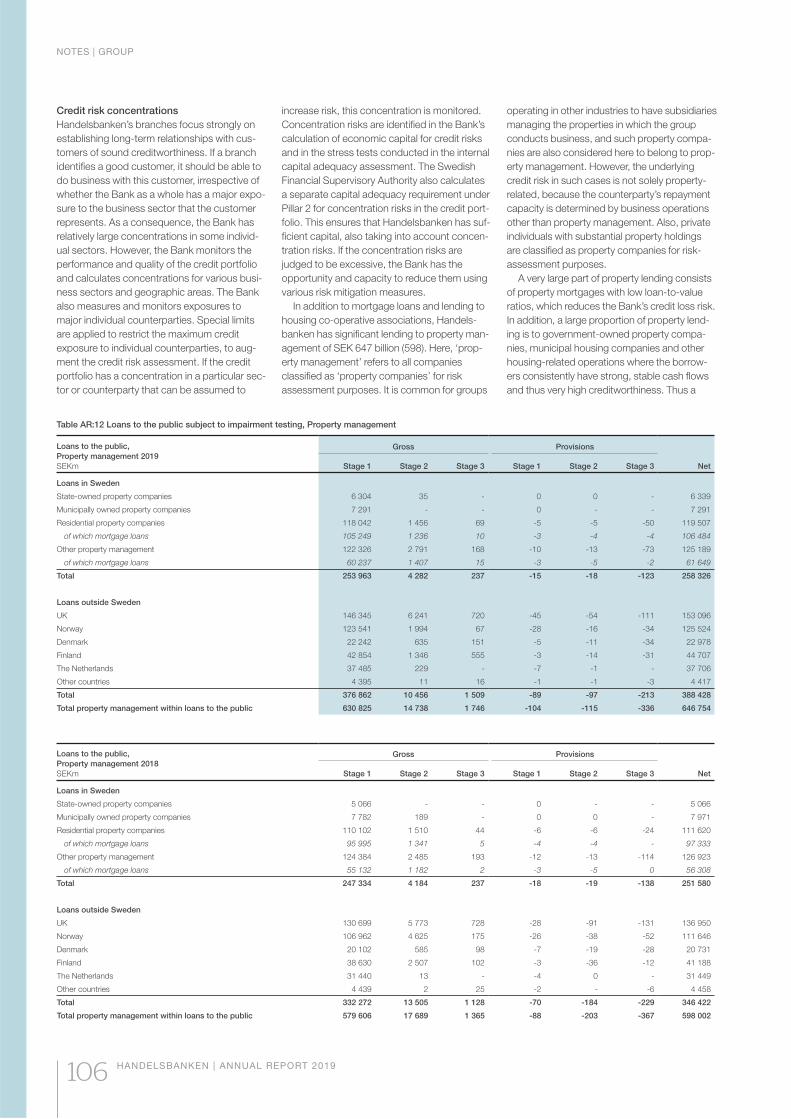
Table AR:12 Loans to the public subject to impairment testing, Property management
Loans to the public,
Property management 2019
SEKm
Gross Provisions
Stage 1 Stage 2 Stage 3 Stage 1 Stage 2 Stage 3 Net
Loans in Sweden
State-owned property companies 6 304 35 - 0 0 - 6 339
Municipally owned property companies 7 291 - - 0 - - 7 291
Residential property companies 118 042 1 456 69 -5 -5 -50 119 507
of which mortgage loans 105 249 1 236 10 -3 -4 -4 106 484
Other property management 122 326 2 791 168 -10 -13 -73 125 189
of which mortgage loans 60 237 1 407 15 -3 -5 -2 61 649
Total 253 963 4 282 237 -15 -18 -123 258 326
Loans outside Sweden
UK 146 345 6 241 720 -45 -54 -111 153 096
Norway 123 541 1 994 67 -28 -16 -34 125 524
Denmark 22 242 635 151 -5 -11 -34 22 978
Finland 42 854 1 346 555 -3 -14 -31 44 707
The Netherlands 37 485 229 - -7 -1 - 37 706
Other countries 4 395 11 16 -1 -1 -3 4 417
Total 376 862 10 456 1 509 -89 -97 -213 388 428
Total property management within loans to the public 630 825 14 738 1 746 -104 -115 -336 646 754
Loans to the public,
Property management 2018
SEKm
Gross Provisions
Stage 1 Stage 2 Stage 3 Stage 1 Stage 2 Stage 3 Net
Loans in Sweden
State-owned property companies 5 066 - - 0 - - 5 066
Municipally owned property companies 7 782 189 - 0 0 - 7 971
Residential property companies 110 102 1 510 44 -6 -6 -24 111 620
of which mortgage loans 95 995 1 341 5 -4 -4 - 97 333
Other property management 124 384 2 485 193 -12 -13 -114 126 923
of which mortgage loans 55 132 1 182 2 -3 -5 0 56 308
Total 247 334 4 184 237 -18 -19 -138 251 580
Loans outside Sweden
UK 130 699 5 773 728 -28 -91 -131 136 950
Norway 106 962 4 625 175 -26 -38 -52 111 646
Denmark 20 102 585 98 -7 -19 -28 20 731
Finland 38 630 2 507 102 -3 -36 -12 41 188
The Netherlands 31 440 13 - -4 0 - 31 449
Other countries 4 439 2 25 -2 - -6 4 458
Total 332 272 13 505 1 128 -70 -184 -229 346 422
Total property management within loans to the public 579 606 17 689 1 365 -88 -203 -367 598 002
Credit risk concentrations
Handelsbanken’s branches focus strongly on
establishing long-term relationships with cus-
tomers of sound creditworthiness. If a branch
identifies a good customer, it should be able to
do business with this customer, irrespective of
whether the Bank as a whole has a major expo-
sure to the business sector that the customer
represents. As a consequence, the Bank has
relatively large concentrations in some individ-
ual sectors. However, the Bank monitors the
performance and quality of the credit portfolio
and calculates concentrations for various busi-
ness sectors and geographic areas. The Bank
also measures and monitors exposures to
major individual counterparties. Special limits
are applied to restrict the maximum credit
exposure to individual counterparties, to aug-
ment the credit risk assessment. If the credit
portfolio has a concentration in a particular sec-
tor or counterparty that can be assumed to
increase risk, this concentration is monitored.
Concentration risks are identified in the Bank’s
calculation of economic capital for credit risks
and in the stress tests conducted in the internal
capital adequacy assessment. The Swedish
Financial Supervisory Authority also calculates
a separate capital adequacy requirement under
Pillar 2 for concentration risks in the credit port-
folio. This ensures that Handelsbanken has suf-
ficient capital, also taking into account concen-
tration risks. If the concentration risks are
judged to be excessive, the Bank has the
opportunity and capacity to reduce them using
various risk mitigation measures.
In addition to mortgage loans and lending to
housing co-operative associations, Handels-
banken has significant lending to property man-
agement of SEK 647 billion (598). Here, ‘prop-
erty management’ refers to all companies
classified as ‘property companies’ for risk
assessment purposes. It is common for groups
operating in other industries to have subsidiaries
managing the properties in which the group
conducts business, and such property compa-
nies are also considered here to belong to prop-
erty management. However, the underlying
credit risk in such cases is not solely property-
related, because the counterparty’s repayment
capacity is determined by business operations
other than property management. Also, private
individuals with substantial property holdings
are classified as property companies for risk-
assessment purposes.
A very large part of property lending consists
of property mortgages with low loan-to-value
ratios, which reduces the Bank’s credit loss risk.
In addition, a large proportion of property lend-
ing is to government-owned property compa-
nies, municipal housing companies and other
housing-related operations where the borrow-
ers consistently have strong, stable cash flows
and thus very high creditworthiness. Thus a
NOTES | GROUP
106 HANDELSBANKEN | ANNUAL REPORT 2019
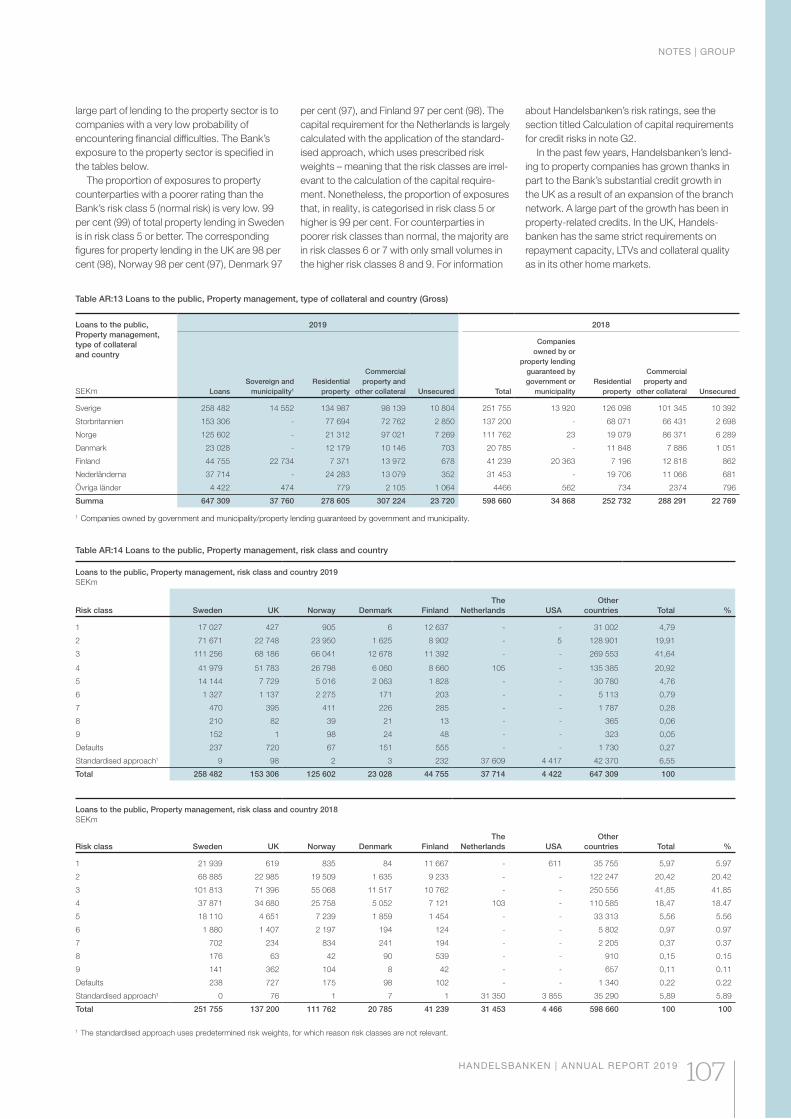
Table AR:13 Loans to the public, Property management, type of collateral and country (Gross)
Loans to the public,
Property management,
type of collateral
and country
SEKm
2019 2018
Loans
Sovereign and
municipality1
Residential
property
Commercial
property and
other collateral Unsecured Total
Companies
owned by or
property lending
guaranteed by
government or
municipality
Residential
property
Commercial
property and
other collateral Unsecured
Sverige 258 482 14 552 134 987 98 139 10 804 251 755 13 920 126 098 101 345 10 392
Storbritannien 153 306 - 77 694 72 762 2 850 137 200 - 68 071 66 431 2 698
Norge 125 602 - 21 312 97 021 7 269 111 762 23 19 079 86 371 6 289
Danmark 23 028 - 12 179 10 146 703 20 785 - 11 848 7 886 1 051
Finland 44 755 22 734 7 371 13 972 678 41 239 20 363 7 196 12 818 862
Nederländerna 37 714 - 24 283 13 079 352 31 453 - 19 706 11 066 681
Övriga länder 4 422 474 779 2 105 1 064 4466 562 734 2374 796
Summa 647 309 37 760 278 605 307 224 23 720 598 660 34 868 252 732 288 291 22 769
1 Companies owned by government and municipality/property lending guaranteed by government and municipality.
Table AR:14 Loans to the public, Property management, risk class and country
Loans to the public, Property management, risk class and country 2019
SEKm
Risk class Sweden UK Norway Denmark Finland
The
Netherlands USA
Other
countries Total %
1 17 027 427 905 6 12 637 - - 31 002 4,79
2 71 671 22 748 23 950 1 625 8 902 - 5 128 901 19,91
3 111 256 68 186 66 041 12 678 11 392 - - 269 553 41,64
4 41 979 51 783 26 798 6 060 8 660 105 - 135 385 20,92
5 14 144 7 729 5 016 2 063 1 828 - - 30 780 4,76
6 1 327 1 137 2 275 171 203 - - 5 113 0,79
7 470 395 411 226 285 - - 1 787 0,28
8 210 82 39 21 13 - - 365 0,06
9 152 1 98 24 48 - - 323 0,05
Defaults 237 720 67 151 555 - - 1 730 0,27
Standardised approach1 9 98 2 3 232 37 609 4 417 42 370 6,55
Total 258 482 153 306 125 602 23 028 44 755 37 714 4 422 647 309 100
Loans to the public, Property management, risk class and country 2018
SEKm
Risk class Sweden UK Norway Denmark Finland
The
Netherlands USA
Other
countries Total %
1 21 939 619 835 84 11 667 - 611 35 755 5,97 5.97
2 68 885 22 985 19 509 1 635 9 233 - - 122 247 20,42 20.42
3 101 813 71 396 55 068 11 517 10 762 - - 250 556 41,85 41.85
4 37 871 34 680 25 758 5 052 7 121 103 - 110 585 18,47 18.47
5 18 110 4 651 7 239 1 859 1 454 - - 33 313 5,56 5.56
6 1 880 1 407 2 197 194 124 - - 5 802 0,97 0.97
7 702 234 834 241 194 - - 2 205 0,37 0.37
8 176 63 42 90 539 - - 910 0,15 0.15
9 141 362 104 8 42 - - 657 0,11 0.11
Defaults 238 727 175 98 102 - - 1 340 0,22 0.22
Standardised approach¹ 0 76 1 7 1 31 350 3 855 35 290 5,89 5.89
Total 251 755 137 200 111 762 20 785 41 239 31 453 4 466 598 660 100 100
1 The standardised approach uses predetermined risk weights, for which reason risk classes are not relevant.
large part of lending to the property sector is to
companies with a very low probability of
encountering financial difficulties. The Bank’s
exposure to the property sector is specified in
the tables below.
The proportion of exposures to property
counterparties with a poorer rating than the
Bank’s risk class 5 (normal risk) is very low. 99
per cent (99) of total property lending in Sweden
is in risk class 5 or better. The corresponding
figures for property lending in the UK are 98 per
cent (98), Norway 98 per cent (97), Denmark 97
per cent (97), and Finland 97 per cent (98). The
capital requirement for the Netherlands is largely
calculated with the application of the standard-
ised approach, which uses prescribed risk
weights – meaning that the risk classes are irrel-
evant to the calculation of the capital require-
ment. Nonetheless, the proportion of exposures
that, in reality, is categorised in risk class 5 or
higher is 99 per cent. For counterparties in
poorer risk classes than normal, the majority are
in risk classes 6 or 7 with only small volumes in
the higher risk classes 8 and 9. For information
about Handelsbanken’s risk ratings, see the
section titled Calculation of capital requirements
for credit risks in note G2.
In the past few years, Handelsbanken’s lend-
ing to property companies has grown thanks in
part to the Bank’s substantial credit growth in
the UK as a result of an expansion of the branch
network. A large part of the growth has been in
property-related credits. In the UK, Handels-
banken has the same strict requirements on
repayment capacity, LTVs and collateral quality
as in its other home markets.
NOTES | GROUP
HANDELSBANKEN | ANNUAL REPORT 2019 107
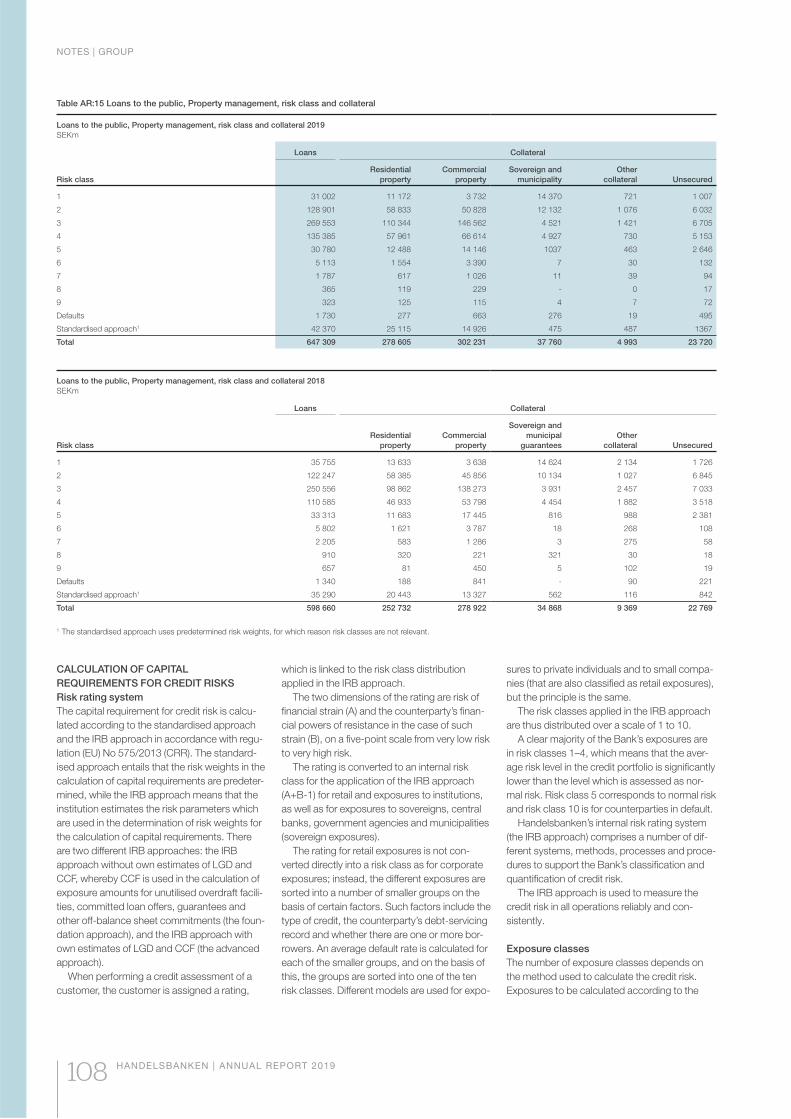
Table AR:15 Loans to the public, Property management, risk class and collateral
Loans to the public, Property management, risk class and collateral 2019
SEKm
Loans Collateral
Risk class
Residential
property
Commercial
property
Sovereign and
municipality
Other
collateral Unsecured
1 31 002 11 172 3 732 14 370 721 1 007
2 128 901 58 833 50 828 12 132 1 076 6 032
3 269 553 110 344 146 562 4 521 1 421 6 705
4 135 385 57 961 66 614 4 927 730 5 153
5 30 780 12 488 14 146 1037 463 2 646
6 5 113 1 554 3 390 7 30 132
7 1 787 617 1 026 11 39 94
8 365 119 229 - 0 17
9 323 125 115 4 7 72
Defaults 1 730 277 663 276 19 495
Standardised approach1 42 370 25 115 14 926 475 487 1367
Total 647 309 278 605 302 231 37 760 4 993 23 720
Loans to the public, Property management, risk class and collateral 2018
SEKm
Loans Collateral
Risk class
Residential
property
Commercial
property
Sovereign and
municipal
guarantees
Other
collateral Unsecured
1 35 755 13 633 3 638 14 624 2 134 1 726
2 122 247 58 385 45 856 10 134 1 027 6 845
3 250 556 98 862 138 273 3 931 2 457 7 033
4 110 585 46 933 53 798 4 454 1 882 3 518
5 33 313 11 683 17 445 816 988 2 381
6 5 802 1 621 3 787 18 268 108
7 2 205 583 1 286 3 275 58
8 910 320 221 321 30 18
9 657 81 450 5 102 19
Defaults 1 340 188 841 - 90 221
Standardised approach1 35 290 20 443 13 327 562 116 842
Total 598 660 252 732 278 922 34 868 9 369 22 769
1 The standardised approach uses predetermined risk weights, for which reason risk classes are not relevant.
CALCULATION OF CAPITAL
REQUIREMENTS FOR CREDIT RISKS
Risk rating system
The capital requirement for credit risk is calcu-
lated according to the standardised approach
and the IRB approach in accordance with regu-
lation (EU) No 575/2013 (CRR). The standard-
ised approach entails that the risk weights in the
calculation of capital requirements are predeter-
mined, while the IRB approach means that the
institution estimates the risk parameters which
are used in the determination of risk weights for
the calculation of capital requirements. There
are two different IRB approaches: the IRB
approach without own estimates of LGD and
CCF, whereby CCF is used in the calculation of
exposure amounts for unutilised overdraft facili-
ties, committed loan offers, guarantees and
other off-balance sheet commitments (the foun-
dation approach), and the IRB approach with
own estimates of LGD and CCF (the advanced
approach).
When performing a credit assessment of a
customer, the customer is assigned a rating,
which is linked to the risk class distribution
applied in the IRB approach.
The two dimensions of the rating are risk of
financial strain (A) and the counterparty’s finan-
cial powers of resistance in the case of such
strain (B), on a five-point scale from very low risk
to very high risk.
The rating is converted to an internal risk
class for the application of the IRB approach
(A+B-1) for retail and exposures to institutions,
as well as for exposures to sovereigns, central
banks, government agencies and municipalities
(sovereign exposures).
The rating for retail exposures is not con-
verted directly into a risk class as for corporate
exposures; instead, the different exposures are
sorted into a number of smaller groups on the
basis of certain factors. Such factors include the
type of credit, the counterparty’s debt-servicing
record and whether there are one or more bor-
rowers. An average default rate is calculated for
each of the smaller groups, and on the basis of
this, the groups are sorted into one of the ten
risk classes. Different models are used for expo-
sures to private individuals and to small compa-
nies (that are also classified as retail exposures),
but the principle is the same.
The risk classes applied in the IRB approach
are thus distributed over a scale of 1 to 10.
A clear majority of the Bank’s exposures are
in risk classes 1–4, which means that the aver-
age risk level in the credit portfolio is significantly
lower than the level which is assessed as nor-
mal risk. Risk class 5 corresponds to normal risk
and risk class 10 is for counterparties in default.
Handelsbanken’s internal risk rating system
(the IRB approach) comprises a number of dif-
ferent systems, methods, processes and proce-
dures to support the Bank’s classification and
quantification of credit risk.
The IRB approach is used to measure the
credit risk in all operations reliably and con-
sistently.
Exposure classes
The number of exposure classes depends on
the method used to calculate the credit risk.
Exposures to be calculated according to the
NOTES | GROUP
108 HANDELSBANKEN | ANNUAL REPORT 2019
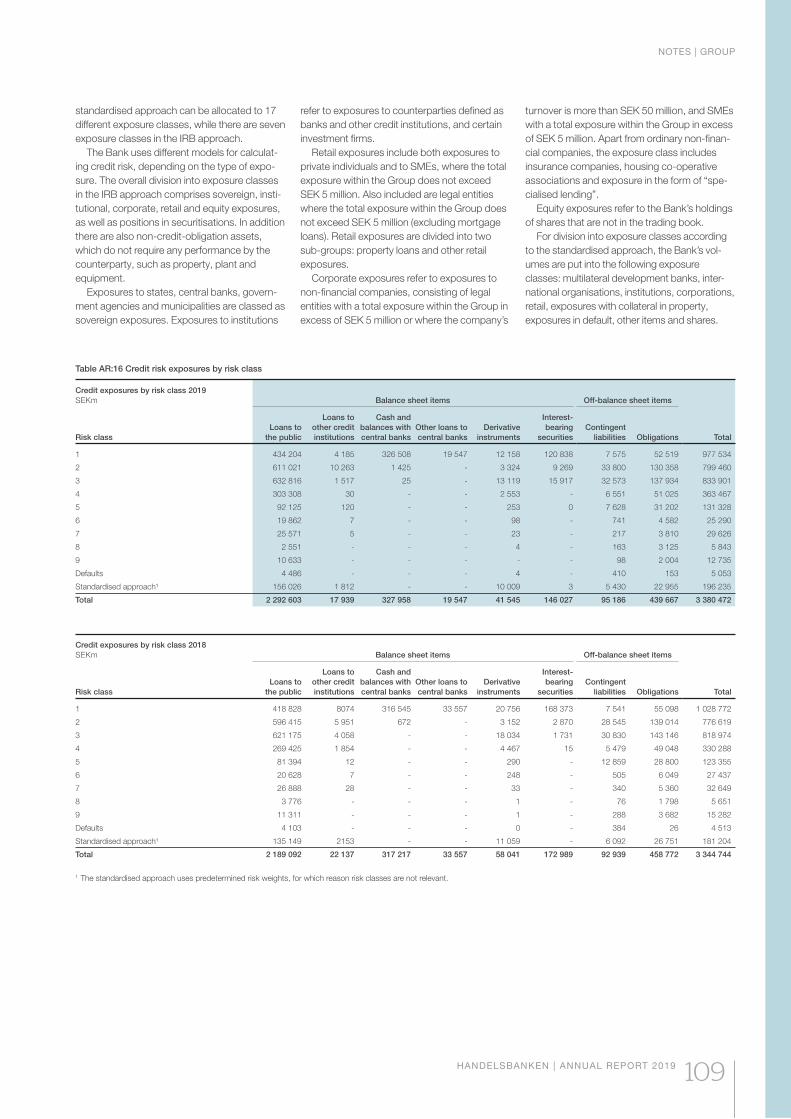
standardised approach can be allocated to 17
different exposure classes, while there are seven
exposure classes in the IRB approach.
The Bank uses different models for calculat-
ing credit risk, depending on the type of expo-
sure. The overall division into exposure classes
in the IRB approach comprises sovereign, insti-
tutional, corporate, retail and equity exposures,
as well as positions in securitisations. In addition
there are also non-credit-obligation assets,
which do not require any performance by the
counterparty, such as property, plant and
equipment.
Exposures to states, central banks, govern-
ment agencies and municipalities are classed as
sovereign exposures. Exposures to institutions
refer to exposures to counterparties defined as
banks and other credit institutions, and certain
investment firms.
Retail exposures include both exposures to
private individuals and to SMEs, where the total
exposure within the Group does not exceed
SEK 5 million. Also included are legal entities
where the total exposure within the Group does
not exceed SEK 5 million (excluding mortgage
loans). Retail exposures are divided into two
sub-groups: property loans and other retail
exposures.
Corporate exposures refer to exposures to
non-financial companies, consisting of legal
entities with a total exposure within the Group in
excess of SEK 5 million or where the company’s
turnover is more than SEK 50 million, and SMEs
with a total exposure within the Group in excess
of SEK 5 million. Apart from ordinary non-finan-
cial companies, the exposure class includes
insurance companies, housing co-operative
associations and exposure in the form of “spe-
cialised lending”.
Equity exposures refer to the Bank’s holdings
of shares that are not in the trading book.
For division into exposure classes according
to the standardised approach, the Bank’s vol-
umes are put into the following exposure
classes: multilateral development banks, inter-
national organisations, institutions, corporations,
retail, exposures with collateral in property,
exposures in default, other items and shares.
Credit exposures by risk class 2018
SEKm Balance sheet items Off-balance sheet items
TotalRisk class
Loans to
the public
Loans to
other credit
institutions
Cash and
balances with
central banks
Other loans to
central banks
Derivative
instruments
Interest-
bearing
securities
Contingent
liabilities Obligations
1 418 828 8074 316 545 33 557 20 756 168 373 7 541 55 098 1 028 772
2 596 415 5 951 672 - 3 152 2 870 28 545 139 014 776 619
3 621 175 4 058 - - 18 034 1 731 30 830 143 146 818 974
4 269 425 1 854 - - 4 467 15 5 479 49 048 330 288
5 81 394 12 - - 290 - 12 859 28 800 123 355
6 20 628 7 - - 248 - 505 6 049 27 437
7 26 888 28 - - 33 - 340 5 360 32 649
8 3 776 - - - 1 - 76 1 798 5 651
9 11 311 - - - 1 - 288 3 682 15 282
Defaults 4 103 - - - 0 - 384 26 4 513
Standardised approach¹ 135 149 2153 - - 11 059 - 6 092 26 751 181 204
Total 2 189 092 22 137 317 217 33 557 58 041 172 989 92 939 458 772 3 344 744
1 The standardised approach uses predetermined risk weights, for which reason risk classes are not relevant.
Table AR:16 Credit risk exposures by risk class
Credit exposures by risk class 2019
SEKm Balance sheet items Off-balance sheet items
TotalRisk class
Loans to
the public
Loans to
other credit
institutions
Cash and
balances with
central banks
Other loans to
central banks
Derivative
instruments
Interest-
bearing
securities
Contingent
liabilities Obligations
1 434 204 4 185 326 508 19 547 12 158 120 838 7 575 52 519 977 534
2 611 021 10 263 1 425 - 3 324 9 269 33 800 130 358 799 460
3 632 816 1 517 25 - 13 119 15 917 32 573 137 934 833 901
4 303 308 30 - - 2 553 - 6 551 51 025 363 467
5 92 125 120 - - 253 0 7 628 31 202 131 328
6 19 862 7 - - 98 - 741 4 582 25 290
7 25 571 5 - - 23 - 217 3 810 29 626
8 2 551 - - - 4 - 163 3 125 5 843
9 10 633 - - - - - 98 2 004 12 735
Defaults 4 486 - - - 4 - 410 153 5 053
Standardised approach¹ 156 026 1 812 - - 10 009 3 5 430 22 955 196 235
Total 2 292 603 17 939 327 958 19 547 41 545 146 027 95 186 439 667 3 380 472
NOTES | GROUP
HANDELSBANKEN | ANNUAL REPORT 2019 109
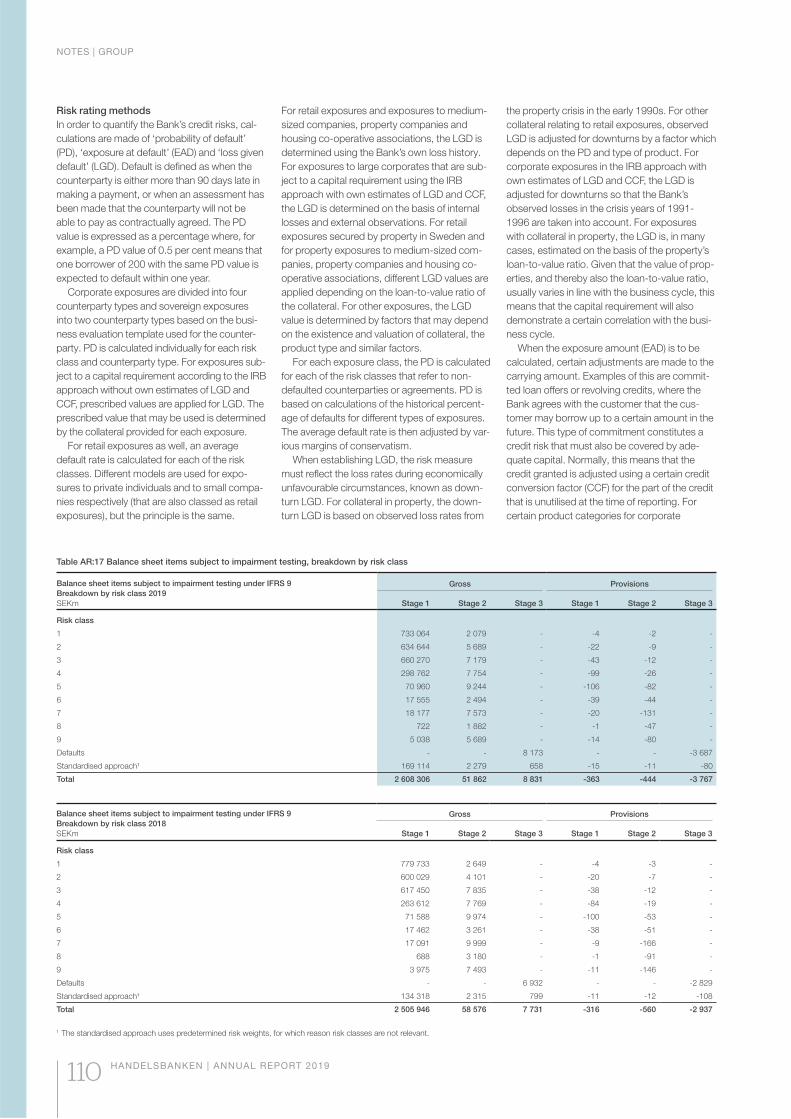
Balance sheet items subject to impairment testing under IFRS 9
Breakdown by risk class 2018
SEKm
Gross Provisions
Stage 1 Stage 2 Stage 3 Stage 1 Stage 2 Stage 3
Risk class
1 779 733 2 649 - -4 -3 -
2 600 029 4 101 - -20 -7 -
3 617 450 7 835 - -38 -12 -
4 263 612 7 769 - -84 -19 -
5 71 588 9 974 - -100 -53 -
6 17 462 3 261 - -38 -51 -
7 17 091 9 999 - -9 -166 -
8 688 3 180 - -1 -91 -
9 3 975 7 493 - -11 -146 -
Defaults - - 6 932 - - -2 829
Standardised approach¹ 134 318 2 315 799 -11 -12 -108
Total 2 505 946 58 576 7 731 -316 -560 -2 937
1 The standardised approach uses predetermined risk weights, for which reason risk classes are not relevant.
Table AR:17 Balance sheet items subject to impairment testing, breakdown by risk class
Balance sheet items subject to impairment testing under IFRS 9
Breakdown by risk class 2019
SEKm
Gross Provisions
Stage 1 Stage 2 Stage 3 Stage 1 Stage 2 Stage 3
Risk class
1 733 064 2 079 - -4 -2 -
2 634 644 5 689 - -22 -9 -
3 660 270 7 179 - -43 -12 -
4 298 762 7 754 - -99 -26 -
5 70 960 9 244 - -106 -82 -
6 17 555 2 494 - -39 -44 -
7 18 177 7 573 - -20 -131 -
8 722 1 882 - -1 -47 -
9 5 038 5 689 - -14 -80 -
Defaults - - 8 173 - - -3 687
Standardised approach¹ 169 114 2 279 658 -15 -11 -80
Total 2 608 306 51 862 8 831 -363 -444 -3 767
Risk rating methods
In order to quantify the Bank’s credit risks, cal-
culations are made of ‘probability of default’
(PD), ‘exposure at default’ (EAD) and ‘loss given
default’ (LGD). Default is defined as when the
counterparty is either more than 90 days late in
making a payment, or when an assessment has
been made that the counterparty will not be
able to pay as contractually agreed. The PD
value is expressed as a percentage where, for
example, a PD value of 0.5 per cent means that
one borrower of 200 with the same PD value is
expected to default within one year.
Corporate exposures are divided into four
counterparty types and sovereign exposures
into two counterparty types based on the busi-
ness evaluation template used for the counter-
party. PD is calculated individually for each risk
class and counterparty type. For exposures sub-
ject to a capital requirement according to the IRB
approach without own estimates of LGD and
CCF, prescribed values are applied for LGD. The
prescribed value that may be used is determined
by the collateral provided for each exposure.
For retail exposures as well, an average
default rate is calculated for each of the risk
classes. Different models are used for expo-
sures to private individuals and to small compa-
nies respectively (that are also classed as retail
exposures), but the principle is the same.
For retail exposures and exposures to medium-
sized companies, property companies and
housing co-operative associations, the LGD is
determined using the Bank’s own loss history.
For exposures to large corporates that are sub-
ject to a capital requirement using the IRB
approach with own estimates of LGD and CCF,
the LGD is determined on the basis of internal
losses and external observations. For retail
exposures secured by property in Sweden and
for property exposures to medium-sized com-
panies, property companies and housing co-
operative associations, different LGD values are
applied depending on the loan-to-value ratio of
the collateral. For other exposures, the LGD
value is determined by factors that may depend
on the existence and valuation of collateral, the
product type and similar factors.
For each exposure class, the PD is calculated
for each of the risk classes that refer to non-
defaulted counterparties or agreements. PD is
based on calculations of the historical percent-
age of defaults for different types of exposures.
The average default rate is then adjusted by var-
ious margins of conservatism.
When establishing LGD, the risk measure
must reflect the loss rates during economically
unfavourable circumstances, known as down-
turn LGD. For collateral in property, the down-
turn LGD is based on observed loss rates from
the property crisis in the early 1990s. For other
collateral relating to retail exposures, observed
LGD is adjusted for downturns by a factor which
depends on the PD and type of product. For
corporate exposures in the IRB approach with
own estimates of LGD and CCF, the LGD is
adjusted for downturns so that the Bank’s
observed losses in the crisis years of 1991-
1996 are taken into account. For exposures
with collateral in property, the LGD is, in many
cases, estimated on the basis of the property’s
loan-to-value ratio. Given that the value of prop-
erties, and thereby also the loan-to-value ratio,
usually varies in line with the business cycle, this
means that the capital requirement will also
demonstrate a certain correlation with the busi-
ness cycle.
When the exposure amount (EAD) is to be
calculated, certain adjustments are made to the
carrying amount. Examples of this are commit-
ted loan offers or revolving credits, where the
Bank agrees with the customer that the cus-
tomer may borrow up to a certain amount in the
future. This type of commitment constitutes a
credit risk that must also be covered by ade-
quate capital. Normally, this means that the
credit granted is adjusted using a certain credit
conversion factor (CCF) for the part of the credit
that is unutilised at the time of reporting. For
certain product categories for corporate
NOTES | GROUP
110 HANDELSBANKEN | ANNUAL REPORT 2019
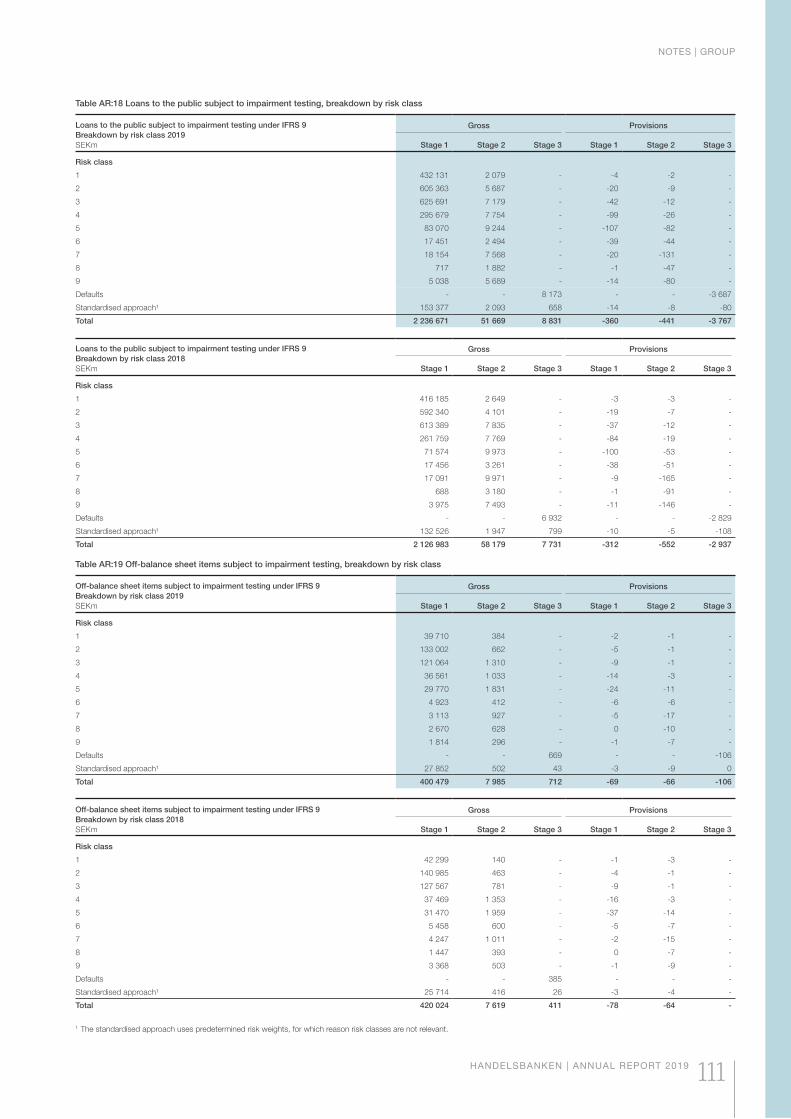
Loans to the public subject to impairment testing under IFRS 9
Breakdown by risk class 2018
SEKm
Gross Provisions
Stage 1 Stage 2 Stage 3 Stage 1 Stage 2 Stage 3
Risk class
1 416 185 2 649 - -3 -3 -
2 592 340 4 101 - -19 -7 -
3 613 389 7 835 - -37 -12 -
4 261 759 7 769 - -84 -19 -
5 71 574 9 973 - -100 -53 -
6 17 456 3 261 - -38 -51 -
7 17 091 9 971 - -9 -165 -
8 688 3 180 - -1 -91 -
9 3 975 7 493 - -11 -146 -
Defaults - - 6 932 - - -2 829
Standardised approach¹ 132 526 1 947 799 -10 -5 -108
Total 2 126 983 58 179 7 731 -312 -552 -2 937
Off-balance sheet items subject to impairment testing under IFRS 9
Breakdown by risk class 2018
SEKm
Gross Provisions
Stage 1 Stage 2 Stage 3 Stage 1 Stage 2 Stage 3
Risk class
1 42 299 140 - -1 -3 -
2 140 985 463 - -4 -1 -
3 127 567 781 - -9 -1 -
4 37 469 1 353 - -16 -3 -
5 31 470 1 959 - -37 -14 -
6 5 458 600 - -5 -7 -
7 4 247 1 011 - -2 -15 -
8 1 447 393 - 0 -7 -
9 3 368 503 - -1 -9 -
Defaults - - 385 - - -
Standardised approach¹ 25 714 416 26 -3 -4 -
Total 420 024 7 619 411 -78 -64 -
1 The standardised approach uses predetermined risk weights, for which reason risk classes are not relevant.
Table AR:19 Off-balance sheet items subject to impairment testing, breakdown by risk class
Off-balance sheet items subject to impairment testing under IFRS 9
Breakdown by risk class 2019
SEKm
Gross Provisions
Stage 1 Stage 2 Stage 3 Stage 1 Stage 2 Stage 3
Risk class
1 39 710 384 - -2 -1 -
2 133 002 662 - -5 -1 -
3 121 064 1 310 - -9 -1 -
4 36 561 1 033 - -14 -3 -
5 29 770 1 831 - -24 -11 -
6 4 923 412 - -6 -6 -
7 3 113 927 - -5 -17 -
8 2 670 628 - 0 -10 -
9 1 814 296 - -1 -7 -
Defaults - - 669 - - -106
Standardised approach¹ 27 852 502 43 -3 -9 0
Total 400 479 7 985 712 -69 -66 -106
Table AR:18 Loans to the public subject to impairment testing, breakdown by risk class
Loans to the public subject to impairment testing under IFRS 9
Breakdown by risk class 2019
SEKm
Gross Provisions
Stage 1 Stage 2 Stage 3 Stage 1 Stage 2 Stage 3
Risk class
1 432 131 2 079 - -4 -2 -
2 605 363 5 687 - -20 -9 -
3 625 691 7 179 - -42 -12 -
4 295 679 7 754 - -99 -26 -
5 83 070 9 244 - -107 -82 -
6 17 451 2 494 - -39 -44 -
7 18 154 7 568 - -20 -131 -
8 717 1 882 - -1 -47 -
9 5 038 5 689 - -14 -80 -
Defaults - - 8 173 - - -3 687
Standardised approach¹ 153 377 2 093 658 -14 -8 -80
Total 2 236 671 51 669 8 831 -360 -441 -3 767
NOTES | GROUP
HANDELSBANKEN | ANNUAL REPORT 2019 111
exposures and exposures to institutions, the
credit conversion factors are determined by the
regulatory code, while for retail exposures and
certain product categories for large corporates,
medium-sized companies, property companies
and housing co-operative associations, the
Bank uses its own calculated conversion fac-
tors. Here, it is the product referred to that
mainly governs the conversion factor, but the
utilisation level may also be of relevance.
In addition to the capital adequacy calcula-
tion, the risk parameters (PD, EAD, LGD) are
used to calculate the cost of capital in each indi-
vidual transaction and to calculate economic
capital (EC).
Comparisons with external ratings
The Bank’s risk classes are not directly compa-
rable with the ratings applied by external credit
rating agencies. The agencies’ ratings do not
correspond to a direct classification of the prob-
ability of the counterparty defaulting, as the
Bank’s rating model does. In addition, the rating
agencies vary in the extent to which they factor
in the seriousness of the losses that default can
lead to. The time horizon for which creditworthi-
ness is assessed is not always the same for the
Bank as it is for the credit rating agencies. The
Bank’s risk classes do not state a uniform scale,
whereby a certain risk class always corresponds
to a certain probability of default. Furthermore,
different PD scales are applied to different parts
of the credit portfolio and the PD value changes
over time.
Overall, it is impossible to unambiguously and
consistently translate the internal risk classes
into an external rating. However, by analysing
the historical default rate in Handelsbanken’s
risk classes in relation to the default rate in the
external rating classes according to the
Moody’s rating agency, a fair table of compari-
son can be obtained.
Quality assurance of the credit risk model
The Bank performs a detailed annual review of
its internal rating model. The review checks that
the internal ratings on which the Bank’s risk rat-
ings are based are applied in a consistent, cor-
rect and fit-for-purpose manner (evaluation) and
also that the models used measure risk in a sat-
isfactory manner (validation). For a more
detailed description, refer to the “Risk and
Capital – Information according to Pillar 3”
report, under the heading Credit risk – Quality
assurance of the rating system.
CALCULATION OF EXPECTED
CREDIT LOSSES
The impairment rules presented in IFRS 9 apply
to financial assets at amortised cost, financial
assets at fair value through other comprehen-
sive income, as well as financial guarantees and
other irrevocable commitments. This section
provides descriptions of the processes and
methods applied in Handelsbanken’s model-
based calculations of provisions for expected
credit losses (ECL).
Estimations of expected credit losses are made
at agreement level, whereby the characteristics
of the agreement and the counterparty govern
the classification and quantification of the provi-
sion requirement. The estimation is made using
either a model-based or manual calculation,
with the choice of method mainly dependent on
whether the agreement is deemed to be credit-
impaired.
For information pertaining to the recognition
and measurement of expected credit losses
and for definitions, refer to note G1, section 10,
Credit losses.
Model-based calculations for
agreements in Stage 1 and Stage 2
Handelsbanken’s Group-wide, central process
for model-based calculations of expected credit
losses incorporates a number of different pro-
cesses and methods which support the quanti-
fication of the provision requirement in Stage 1
and Stage 2.
The model-based calculations factor in his-
torical, current and forward-looking data. His-
torical data forms the basis for the construction
of the model and parameters applied, current
data comprises the prevailing balances on the
reporting date (as included in the calculation
requirements) and forward-looking data refers
to the macroeconomic scenarios used to calcu-
late future risk parameters and exposures.
The models use the same historical risk data
as the IRB models, meaning that the accounting
of provisions and calculations of capital require-
ments are based on the same basic loss history.
Similar to how the risk rating system affects
capital adequacy calculations, the internal rating
(from which the risk rating derives) is a signifi-
cant part of the models for calculating expected
credit losses. The calculations are primarily
affected by the risk parameters known as ‘prob-
ability of default’ (PD), ‘exposure at default’
(EAD) and ‘loss given default’ (LGD). The
expected credit loss in a future period is
obtained by multiplying the present value of the
EAD by the PD and by the LGD. In contrast to
the calculation of credit losses in the Capital
Requirements Regulation, which also uses the
risk parameters PD, EAD and LGD, the estima-
tion of expected credit losses pursuant to IFRS
9 is based on current forward-looking assess-
ments. As the regulations have different pur-
poses, the calculation models differ in terms of
how the risk parameters are set and in how they
are constructed. The main differences between
IFRS 9 and the IRB approach are presented in
table AR:20 Differences between IFRS 9 and
the IRB approach.
Macroeconomic information
The calculations regarding model-based
assessments of significant increases in credit
risk and expected credit losses are undertaken
with the application of models for the respective
risk parameters (PD, EAD and LGD). In order to
ensure that the calculations take into account
non-linear aspects, three forward-looking mac-
roeconomic scenarios are used in the models
(one neutral, one negative and one positive).
Each scenario includes significant macroeco-
nomic risk factors, such as unemployment,
GDP, property prices, key/central bank rates
and inflation, by country. The significant macro-
economic risk factors have been identified from
an assessment of the Bank’s historical data and
the relation to the risk parameters is estimated
using the same historical material. The various
scenarios are used to adjust the risk parameters
in question. Each macroeconomic scenario rep-
resents a probability determined by the Bank.
These probabilities are presently set at 60 (70)
per cent for the neutral scenario, 15 (15) per
cent for the positive scenario and 25 (15) per
cent for the negative scenario. Expected credit
losses are recognised as a probability-weighted
average of the expected credit losses for the
respective scenarios.
All of the macroeconomic scenarios have
been produced by the Bank’s economic
research unit, which is responsible for all eco-
nomic analysis delivered by Handelsbanken,
whether for internal or external use. These mac-
roeconomic scenarios comprise region-specific,
30-year forecasts for Sweden, Norway, Finland,
Denmark, the UK, the eurozone and the US,
together with a global forecast. A change in the
macroeconomic scenarios, or in the probability
weights applied, affects both the assessment of
significant increases in credit risk and the esti-
mated expected credit losses. The scenarios are
updated on a quarterly basis by the Bank’s eco-
nomic research unit and are presented for
approval to the relevant decision-makers before
being applied in the ECL calculations.
Portfolio segmenting
Statistical models are used in the model-based
assessment. These have been developed for dif-
ferent segments in the portfolio, with each seg-
ment being comprised of similar risk exposures,
and the risk parameters can be estimated on the
basis of a common set of risk factors. For retail
exposures, the portfolio segmenting is based on
product type and, for other exposures, it is
based on counterparty type. The segments have
been identified on the basis of statistical analysis
and expert assessment. For retail exposures,
the portfolio has the following eight segments:
exposures with residential property as collateral
for private individuals, revolving credits including
credit card exposures for private individuals, and
for SMEs, other exposures for private individu-
als, and for SMEs, card credits for retail financial
services for private individuals, and for SMEs,
and hire purchase for retail financial services for
private individuals, and for SMEs. Other expo-
sures are split into the following six segments:
property companies, housing co-operative
associations, other large non-financial compa-
nies, other non-financial companies, financial
companies and banks, and sovereigns.
Within the respective portfolio segments, the
agreements are further categorised into different
states, based on risk factors such as internal
NOTES | GROUP
112 HANDELSBANKEN | ANNUAL REPORT 2019
rating, payment history, country affiliation, col-
lateral type and loan-to-value ratio. These states
have been determined on the basis of statistical
analysis of historical outcomes. For every state,
statistical models are used for migrations
between states in order to calculate the for-
ward-looking probabilities for the risk parame-
ters PD, LGD and EAD. One important risk fac-
tor for the states is the counterparty’s internal
rating, which is set in conjunction with the credit
decision and which is updated at least annually,
or whenever there are indications that the coun-
terparty’s repayment capacity has changed.
There are states for ‘not in default’, ‘in default’
and ‘early repayment’ exposures. Retail expo-
sures are divided into nine different states and
other exposures into 12 states.
Significant increase in credit risk
A significant increase in credit risk reflects the
risk of default and is a measurement by which
the agreement’s relative change in credit risk
since initial recognition is measured. For calcu-
lating significant increases in credit risks, the
same underlying model is used in Handels-
banken as is used for the calculation of
expected credit losses, with consideration given
to historical, current and future-oriented infor-
mation. Collateral is not taken into account in
the assessment. At each reporting date, the
Group-wide, central, model-based process
begins for all agreements with an assessment of
whether there has been a significant increase in
the credit risk since initial recognition (start date
of the agreement). This assessment then deter-
mines whether the expected credit loss is
assessed over a 12-month horizon after the
reporting date (Stage 1) or during the agree-
ment’s remaining lifetime (Stage 2). An impor-
tant aspect which affects the size of the provi-
sion for credit losses is therefore which factors
and thresholds are defined as triggers for the
transfer of assets from Stage 1 to Stage 2. The
Bank’s definition of a significant increase in
credit risk, which is decisive in the transfer of
agreements to Stage 2, is based on both quali-
tative and quantitative factors.
The quantitative indicator which is primarily
used to assess the change in credit risk is the
relative change, between the instrument’s initial
recognition and up to the most recent reporting
date, in the probability of default (PD) during the
agreement’s remaining lifetime. In cases where
it has required an unreasonable expense or
exertion to establish the PD in conjunction with
the initial recognition of an instrument, changes
in the counterparty’s or the agreement’s internal
rating or risk rating since initial recognition have
been used to assess the significant change in
the credit risk. For agreements recognised ini-
tially on or after 1 January 2018, the forecasts
regarding the risk of default are based on three
scenarios. For agreements recognised before 1
January 2018, the same criteria are applied but
using a scenario based on the Bank’s most
recently published economic analysis at the
time of initial recognition.
The primary criterion when assessing whether
an agreement is deemed to have incurred a sig-
nificant increase in credit risk and is thus trans-
ferred to Stage 2 is, as defined by Handels-
banken, that the estimated remaining probability
of default (PD) on the reporting date is greater
than a multiple of 2.5 times the corresponding
probability of default upon initial recognition. The
threshold level of 2.5 is based on statistical anal-
ysis of the Bank’s historical data and compares
the increase in the remaining risk that the coun-
terparty will default with the corresponding esti-
mated risk upon the initial recognition of the
agreement. In addition, there are other qualita-
tive factors which the Bank has assessed as
entailing a significant increase in credit risk, such
as the agreement having payments that are
more than 30 days overdue, or that counter-
party having been granted forbearance meas-
ures to be taken as the result of a deteriorated
credit rating.
If a significant increase in credit risk has arisen
since initial recognition, a provision is recognised
which corresponds to the expected credit losses
for the entirety of the remaining lifetime and the
financial instrument is transferred to Stage 2.
The model is symmetrical, meaning that, if the
financial instrument’s credit risk decreases and
there is therefore no longer a significant increase
in credit risk since initial recognition, the financial
asset is transferred back to Stage 1.
Models for risk parameters
and expected lifetime
The risk parameters PD, LGD and EAD are calcu-
lated for every agreement and future point in time,
based on statistical models. These models are,
as far as possible, founded on the relationships
between the significant risk factors and relevant
risk outcomes identifiable in the Bank’s own loss
history. The majority of risk parameters which are
quantified are based on approximately 10 years
of internal data. In cases where the Bank lacks
sufficient information due to, for example, too few
defaults, the data is complemented with external
information. The historical outcomes are analysed
with regard to the covariation in agreement-spe-
cific, counterparty-specific and region-specific
risk factors, such as product type, internal rating,
length of customer relationship, collateral type,
loan-to-value ratio, unemployment and GDP
growth. The risk factors identified as significant
for a specific risk parameter are included in the
model and the historical correlation is quantified.
Probability of default (PD)
PD refers to the probability that a customer or
an agreement will go into default at a given point
in time during the asset’s remaining lifetime.
12-month PD refers to the probability of default
during the coming 12-month period. Lifetime
PD refers to the probability of default during the
asset’s remaining lifetime (up to a maximum of
30 years). The future PDs are forecast on the
reporting date, using forward-looking macroe-
conomic scenarios and current agreement and
counterparty information. The forecast risk of
default takes into account the development of
scenarios and the probability of migrations
between different states over time. The models
calculate annual migration and default probabili-
ties, whereby the migration model presents a
probability that the agreement will belong to a
particular state with a given risk of default in the
future. The agreement’s expected PD for a given
year is calculated as the probability-weighted
PD over all conceivable states and scenarios.
Expected PD for the remaining lifetime is based
on the annual expected default forecasts and
the probability that the agreement will be sub-
ject to early repayment. The degradation of an
economic outlook based on forecast macroe-
conomic risk factors for each scenario, or an
increase in the probability that the negative
scenario will be realised, results in a higher PD.
Exposure at default (EAD)
EAD refers to the expected credit exposure at
default. On the reporting date, future exposure
at default is forecast on the basis of current
repayment plans, the probability of early repay-
ment and the expected utilisation of, for exam-
ple, credit facilities, financial guarantees and
loan commitments. EAD is forecast on an
annual basis and comprises the amount at
which losses and recoveries take place in con-
junction with future defaults.
Expected lifetime
An instrument’s expected lifetime is relevant to
both the assessment of significant increase in
credit risk, which takes into account changes in
PD during the expected remaining lifetime, and
the measurement of expected credit losses for
the asset’s expected remaining lifetime. The
expected lifetime is considered when calculat-
ing the remaining PD, by weighing the forecast
annual PD values during the agreement’s con-
tractual duration against the probability that the
agreement will not be subject to early repay-
ment before defaulting.
The probability of the agreement being sub-
ject to early repayment is based on statistical
analysis and on the Bank’s internal history for
approximately the past ten years, and is
included as a component of the model for EAD.
Potential risk factors in the form of agreement,
counterparty and macroeconomic risk factors
have been assessed in the analysis. The risk
factors identified as significant are included in
the model. In several cases, no significant risk
factors for early repayment are identified other
than counterparty type and rating. These risk
factors are, however, affected by forward-look-
ing macroeconomic scenarios, which means
that early repayment is indirectly dependent on
forward-looking macroeconomic scenarios.
For revolving credits with no maturity date,
such as credit cards, and mortgage loans with
interest-rate fixing periods of a maximum of
three months, a 30-year maturity from the
reporting date is applied, meaning that the
expected lifetime is, in practice, defined by
the behaviour-based statistical model.
NOTES | GROUP
HANDELSBANKEN | ANNUAL REPORT 2019 113
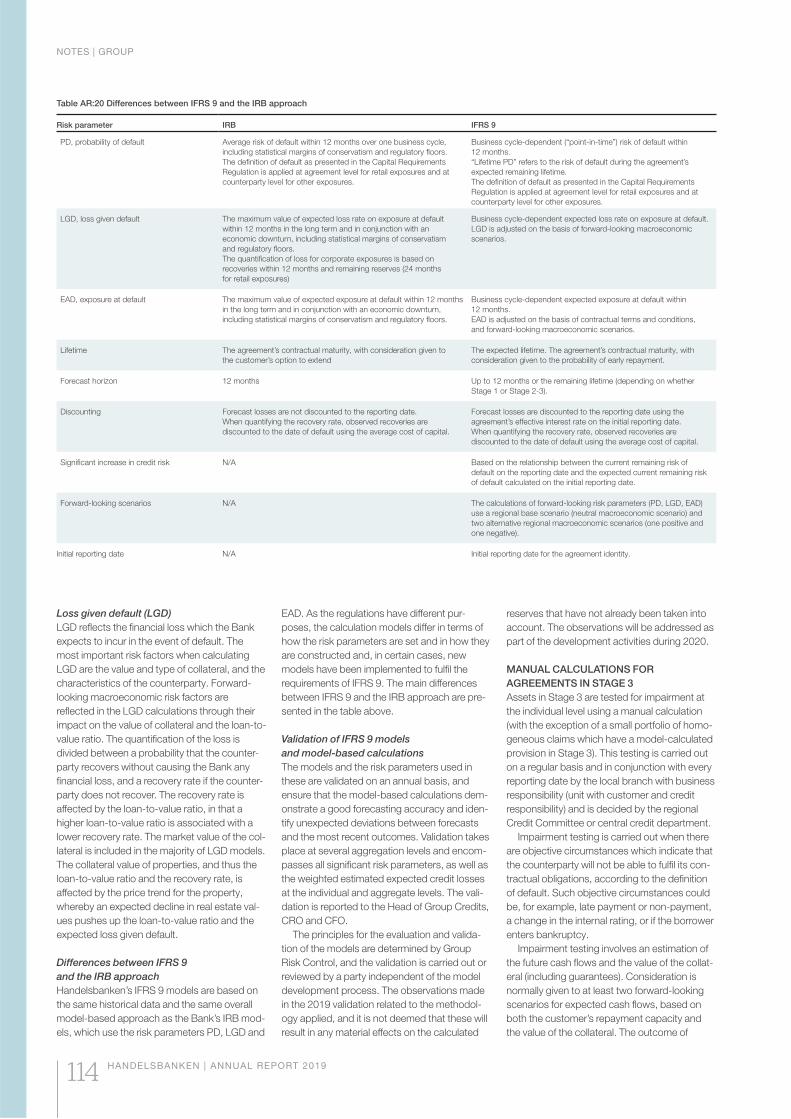
Table AR:20 Differences between IFRS 9 and the IRB approach
Risk parameter IRB IFRS 9
PD, probability of default Average risk of default within 12 months over one business cycle,
including statistical margins of conservatism and regulatory floors.
The definition of default as presented in the Capital Requirements
Regulation is applied at agreement level for retail exposures and at
counterparty level for other exposures.
Business cycle-dependent (“point-in-time”) risk of default within
12 months.
“Lifetime PD” refers to the risk of default during the agreement’s
expected remaining lifetime.
The definition of default as presented in the Capital Requirements
Regulation is applied at agreement level for retail exposures and at
counterparty level for other exposures.
LGD, loss given default The maximum value of expected loss rate on exposure at default
within 12 months in the long term and in conjunction with an
economic downturn, including statistical margins of conservatism
and regulatory floors.
The quantification of loss for corporate exposures is based on
recoveries within 12 months and remaining reserves (24 months
for retail exposures)
Business cycle-dependent expected loss rate on exposure at default.
LGD is adjusted on the basis of forward-looking macroeconomic
scenarios.
EAD, exposure at default The maximum value of expected exposure at default within 12 months
in the long term and in conjunction with an economic downturn,
including statistical margins of conservatism and regulatory floors.
Business cycle-dependent expected exposure at default within
12 months.
EAD is adjusted on the basis of contractual terms and conditions,
and forward-looking macroeconomic scenarios.
Lifetime The agreement’s contractual maturity, with consideration given to
the customer’s option to extend
The expected lifetime. The agreement’s contractual maturity, with
consideration given to the probability of early repayment.
Forecast horizon 12 months Up to 12 months or the remaining lifetime (depending on whether
Stage 1 or Stage 2-3).
Discounting Forecast losses are not discounted to the reporting date.
When quantifying the recovery rate, observed recoveries are
discounted to the date of default using the average cost of capital.
Forecast losses are discounted to the reporting date using the
agreement’s effective interest rate on the initial reporting date.
When quantifying the recovery rate, observed recoveries are
discounted to the date of default using the average cost of capital.
Significant increase in credit risk N/A Based on the relationship between the current remaining risk of
default on the reporting date and the expected current remaining risk
of default calculated on the initial reporting date.
Forward-looking scenarios N/A The calculations of forward-looking risk parameters (PD, LGD, EAD)
use a regional base scenario (neutral macroeconomic scenario) and
two alternative regional macroeconomic scenarios (one positive and
one negative).
Initial reporting date N/A Initial reporting date for the agreement identity.
Loss given default (LGD)
LGD reflects the financial loss which the Bank
expects to incur in the event of default. The
most important risk factors when calculating
LGD are the value and type of collateral, and the
characteristics of the counterparty. Forward-
looking macroeconomic risk factors are
reflected in the LGD calculations through their
impact on the value of collateral and the loan-to-
value ratio. The quantification of the loss is
divided between a probability that the counter-
party recovers without causing the Bank any
financial loss, and a recovery rate if the counter-
party does not recover. The recovery rate is
affected by the loan-to-value ratio, in that a
higher loan-to-value ratio is associated with a
lower recovery rate. The market value of the col-
lateral is included in the majority of LGD models.
The collateral value of properties, and thus the
loan-to-value ratio and the recovery rate, is
affected by the price trend for the property,
whereby an expected decline in real estate val-
ues pushes up the loan-to-value ratio and the
expected loss given default.
Differences between IFRS 9
and the IRB approach
Handelsbanken’s IFRS 9 models are based on
the same historical data and the same overall
model-based approach as the Bank’s IRB mod-
els, which use the risk parameters PD, LGD and
EAD. As the regulations have different pur-
poses, the calculation models differ in terms of
how the risk parameters are set and in how they
are constructed and, in certain cases, new
models have been implemented to fulfil the
requirements of IFRS 9. The main differences
between IFRS 9 and the IRB approach are pre-
sented in the table above.
Validation of IFRS 9 models
and model-based calculations
The models and the risk parameters used in
these are validated on an annual basis, and
ensure that the model-based calculations dem-
onstrate a good forecasting accuracy and iden-
tify unexpected deviations between forecasts
and the most recent outcomes. Validation takes
place at several aggregation levels and encom-
passes all significant risk parameters, as well as
the weighted estimated expected credit losses
at the individual and aggregate levels. The vali-
dation is reported to the Head of Group Credits,
CRO and CFO.
The principles for the evaluation and valida-
tion of the models are determined by Group
Risk Control, and the validation is carried out or
reviewed by a party independent of the model
development process. The observations made
in the 2019 validation related to the methodol-
ogy applied, and it is not deemed that these will
result in any material effects on the calculated
reserves that have not already been taken into
account. The observations will be addressed as
part of the development activities during 2020.
MANUAL CALCULATIONS FOR
AGREEMENTS IN STAGE 3
Assets in Stage 3 are tested for impairment at
the individual level using a manual calculation
(with the exception of a small portfolio of homo-
geneous claims which have a model-calculated
provision in Stage 3). This testing is carried out
on a regular basis and in conjunction with every
reporting date by the local branch with business
responsibility (unit with customer and credit
responsibility) and is decided by the regional
Credit Committee or central credit department.
Impairment testing is carried out when there
are objective circumstances which indicate that
the counterparty will not be able to fulfil its con-
tractual obligations, according to the definition
of default. Such objective circumstances could
be, for example, late payment or non-payment,
a change in the internal rating, or if the borrower
enters bankruptcy.
Impairment testing involves an estimation of
the future cash flows and the value of the collat-
eral (including guarantees). Consideration is
normally given to at least two forward-looking
scenarios for expected cash flows, based on
both the customer’s repayment capacity and
the value of the collateral. The outcome of
NOTES | GROUP
114 HANDELSBANKEN | ANNUAL REPORT 2019
these scenarios is probability-weighted and dis-
counted with the loan’s original effective interest
rate. The scenarios used can take into account
both macroeconomic and agreement-specific
factors, depending on what is deemed to affect
the individual counterparty’s repayment capac-
ity and the value of the collateral. The assess-
ment takes into account the specific character-
istics of the individual counterparty. An
impairment loss is recognised if the estimated
recoverable amount is less than the carrying
amount.
GOVERNANCE AND INTERNAL CONTROL
For calculating the expected credit losses on
agreements in Stage 1 and Stage 2, Handels-
banken has a Group-wide, central process
using internally developed statistical models
(model-based calculation). Manual calculation is
used for agreements in Stage 3. The description
below primarily refers to the model-calculated
provisions for expected credit losses. This pro-
cess is covered by a number of internal con-
trols, which are described below. The various
stages of the process also entail different
approvals/adoptions, creating a governance
structure, which is also described below.
Verification of input data in reports
On each reporting date, the information which
constitutes the basis for the calculations of
expected credit losses is checked for correct-
ness and completeness. This is carried out in
the form of automatic reconciliation of loaded
data from delivery sources. Furthermore, a rea-
sonability assessment is undertaken, whereby
system balances are compared with the bal-
ances recorded on the previous reporting date.
The balances which are ultimately used are then
reconciled against the volumes recorded in the
general ledger.
Models
Before a new quantitative model is included in
the overall model system, it is subject to valida-
tion and must be approved for use by the Head
of Group Credits. On the reporting date, only
this model system can be used for calculations,
meaning that only approved models are usable.
The quantitative models which form the basis
for the calculations of expected credit losses
involve several assumptions and assessments.
Examples include the assumption that the
quantifiable aspects of relationships between
macroeconomic risk factors and risk parame-
ters in historical data are representative for
future events, and the assumption that an
agreement’s expected lifetime can be based on
historical behavioural data. Furthermore, a
selection of the most significant macroeco-
nomic risk factors is made on the basis of the
macroeconomic risk factors’ explanatory power
as regards individual risk parameters. The selec-
tion of the macroeconomic risk factors and
specification of the model are based on achiev-
ing a balance between simplicity, explanatory
power and stability. All assumptions and discre-
tionary decisions are presented to the Head of
Group Credits for approval.
Any expert-assessed calculations in model-
calculated agreements in Stage 1 and Stage 2
or in manually calculated agreements in Stage 3
require the approval of the Head of Group Cred-
its before they are applied.
Macroeconomic scenarios
The macroeconomic scenarios have been pro-
duced by the Bank’s economic research unit,
based on instructions issued by the Head of
Group Credits. These instructions specify the
desired macroeconomic risk factors, geographi-
cal areas to be included, and the number of sce-
narios and probability-weighting between them.
Before every reporting date, the current mac-
roeconomic scenarios are presented to the
Head of Group Credits and the CFO, who
approve the scenarios for use in the reporting
process. The approved macroeconomic sce-
narios are then automatically loaded into the
reporting flow.
Size of the provisions
The total estimated provisions in Stage 1 and
Stage 2 require the approval of the Head of
Group Credits. Estimated provisions in Stage 3
are proposed by the Bank branch with business
responsibility (unit with customer and credit
responsibility) and are approved by either the
regional Credit Committee or a central unit,
depending on the size of the provision. Credit
provisions in Stage 3 which are approved at
regional level are reviewed/quality controlled by
a central unit. In addition, Group Risk Control
submits an independent review on every report-
ing date of a selection of the credit provisions in
Stage 3 which are approved centrally.
The role of the control functions
Group Risk Control determines the validation
principles and ensures that models are vali-
dated. An independent review is conducted on
every reporting date of a selection of the credit
provisions in Stage 3 which are approved cen-
trally. Group Risk Control is described in more
detail on page 65. Group Audit reviews the
estimations of expected credit losses as part of
its assignment to independently examine inter-
nal governance and control, and to evaluate
the reliability of the Group’s financial reporting.
Group Audit is described in more detail on
page 65.
COUNTERPARTY RISK
Counterparty risk arises when the Bank has
entered into derivative contracts or contracts
with a counterparty regarding loans of securi-
ties. In addition to derivatives, the capital ade-
quacy regulations therefore treat both repur-
chase transactions and equity loans as
counterparty risks.
In calculating both the capital requirement
and economic capital (EC), counterparty expo-
sures are taken into account based on the
exposure amounts stipulated by the capital
adequacy regulations. Handelsbanken applies
the mark to market method to calculate expo-
sure amounts on derivative contracts for capital
adequacy purposes. The current remuneration
amount for all contracts with a positive value is
ascertained by assigning the current market val-
ues to the contracts. In order to estimate the
potential future credit exposure, the contracts’
nominal amounts are multiplied by the percent-
ages designated in the regulatory framework,
which vary depending on the type of derivative
and the lifetime of the exposure.
Counterparty risk is regarded as a credit risk
where the market value of the contract deter-
mines the size of the exposure. If the contract
has a positive value, the default of the counter-
party means a potential loss for the Bank.
Reduction of counterparty risk
Counterparty risk arises from the trade date until
the date of delivery, whereby the Bank could be
charged a termination fee if the counterparty is
unable to meet its commitments. This risk exists
in all derivative transactions and in securities
transactions where the Bank has not secured
payment in advance.
The size of counterparty exposures is
restricted by setting credit limits in the regular
credit process. The size of the exposures may
vary substantially due to fluctuations in the price
of the underlying asset. In order to take account
of the risk that the exposure may increase, sup-
plements are added to the value of the exposure
when setting credit limits. These add-ons are
calculated using standard amounts that depend
on the type of contract and the time to maturity.
The exposures are calculated and followed up
daily.
The counterparty risk in derivatives is
reduced through close-out netting agreements,
which involve setting off positive values against
negative values in all derivative transactions with
the same counterparty. Netting agreements are
supplemented with agreements for issuing col-
lateral for the net exposure (Credit Support
Annex, CSA), which further reduce the credit
risk. The collateral for these transactions is
mainly cash, but government securities are also
used. Due to the high proportion of cash, the
concentration risks in the collateral are limited.
The majority of Handelsbanken’s agreements
include close-out netting, and the agreements
with the largest exposures also include CSAs.
Derivatives which are cleared via central
counterparties also give rise to capital require-
ments. Central counterparties are clearing
houses which act as the counterparty for both
the buyer and seller in various transactions, and
thus take over the responsibility for fulfilling the
parties’ obligations. All parties which use a cen-
tral counterparty must provide collateral for all
transactions. In most cases the risk weight for
centrally cleared derivatives is considerably
lower than for other types of derivatives.
NOTES | GROUP
HANDELSBANKEN | ANNUAL REPORT 2019 115
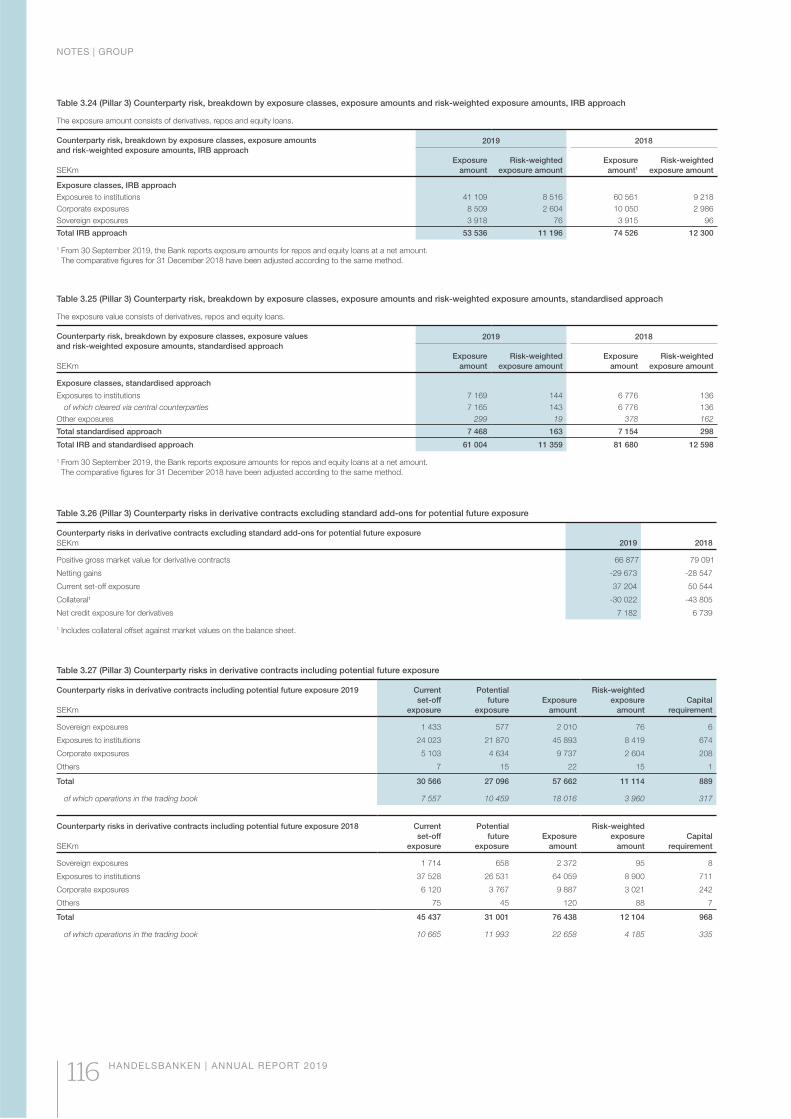
Table 3.26 (Pillar 3) Counterparty risks in derivative contracts excluding standard add-ons for potential future exposure
Counterparty risks in derivative contracts excluding standard add-ons for potential future exposure
SEKm 2019 2018
Positive gross market value for derivative contracts 66 877 79 091
Netting gains -29 673 -28 547
Current set-off exposure 37 204 50 544
Collateral¹ -30 022 -43 805
Net credit exposure for derivatives 7 182 6 739
1 Includes collateral offset against market values on the balance sheet.
Table 3.27 (Pillar 3) Counterparty risks in derivative contracts including potential future exposure
Counterparty risks in derivative contracts including potential future exposure 2019 Current
set-off
exposure
Potential
future
exposure
Exposure
amount
Risk-weighted
exposure
amount
Capital
requirementSEKm
Sovereign exposures 1 433 577 2 010 76 6
Exposures to institutions 24 023 21 870 45 893 8 419 674
Corporate exposures 5 103 4 634 9 737 2 604 208
Others 7 15 22 15 1
Total 30 566 27 096 57 662 11 114 889
of which operations in the trading book 7 557 10 459 18 016 3 960 317
Counterparty risks in derivative contracts including potential future exposure 2018 Current
set-off
exposure
Potential
future
exposure
Exposure
amount
Risk-weighted
exposure
amount
Capital
requirementSEKm
Sovereign exposures 1 714 658 2 372 95 8
Exposures to institutions 37 528 26 531 64 059 8 900 711
Corporate exposures 6 120 3 767 9 887 3 021 242
Others 75 45 120 88 7
Total 45 437 31 001 76 438 12 104 968
of which operations in the trading book 10 665 11 993 22 658 4 185 335
Table 3.24 (Pillar 3) Counterparty risk, breakdown by exposure classes, exposure amounts and risk-weighted exposure amounts, IRB approach
The exposure amount consists of derivatives, repos and equity loans.
Counterparty risk, breakdown by exposure classes, exposure amounts
and risk-weighted exposure amounts, IRB approach
SEKm
2019 2018
Exposure
amount
Risk-weighted
exposure amount
Exposure
amount1
Risk-weighted
exposure amount
Exposure classes, IRB approach
Exposures to institutions 41 109 8 516 60 561 9 218
Corporate exposures 8 509 2 604 10 050 2 986
Sovereign exposures 3 918 76 3 915 96
Total IRB approach 53 536 11 196 74 526 12 300
1 From 30 September 2019, the Bank reports exposure amounts for repos and equity loans at a net amount.
The comparative figures for 31 December 2018 have been adjusted according to the same method.
Table 3.25 (Pillar 3) Counterparty risk, breakdown by exposure classes, exposure amounts and risk-weighted exposure amounts, standardised approach
The exposure value consists of derivatives, repos and equity loans.
Counterparty risk, breakdown by exposure classes, exposure values
and risk-weighted exposure amounts, standardised approach
SEKm
2019 2018
Exposure
amount
Risk-weighted
exposure amount
Exposure
amount
Risk-weighted
exposure amount
Exposure classes, standardised approach
Exposures to institutions 7 169 144 6 776 136
of which cleared via central counterparties 7 165 143 6 776 136
Other exposures 299 19 378 162
Total standardised approach 7 468 163 7 154 298
Total IRB and standardised approach 61 004 11 359 81 680 12 598
1 From 30 September 2019, the Bank reports exposure amounts for repos and equity loans at a net amount.
The comparative figures for 31 December 2018 have been adjusted according to the same method.
NOTES | GROUP
116 HANDELSBANKEN | ANNUAL REPORT 2019

Figure AR:21 Decision levels for market and liquidity risks
The Board
CEO
CFO
Group Treasury
StadshypotekHandelsbanken
Finans
Handelsbanken
Capital Markets
Handelsbanken
plcEcster Local treasury units
MARKET RISK
Market risks arise from price and volatility changes in the financial markets. Market risks are divided into interest rate risks, equity price risks, foreign exchange risks and commodity price risks.
In Handelsbanken’s operations, market risks
arise when the Bank’s customers request ser-
vices for which the Bank must have flexible
funding. The Bank can also obtain funding on
other markets than those where it has its lend-
ing so that it can diversify its sources of funding.
The funding can also have different interest-
fixing periods than the assets which are to be
funded. Market risks can also arise in Group
Treasury’s liquidity portfolio, which can be con-
verted into liquidity at short notice in conjunction
with possible disruptions in the markets where
the Bank conducts its operations. The portfolio
secures the Group’s payments in the daily clear-
ing operations and forms part of the Bank’s
liquidity reserve.
Market risks also arise to meet customers’
demand for financial instruments with exposure
to the fixed income, foreign exchange, equity or
commodity markets. As a consequence, it may
be necessary for the Bank to hold certain posi-
tions. This situation arises for example when the
Bank has undertaken to quote prices in its role
as a market maker.
Market risks in the Bank’s business opera-
tions arise – and thus are managed – mainly at
Group Treasury and Handelsbanken Capital
Markets, although they also exist at Handels-
banken Liv. The market risks at Handelsbanken
Liv are described in a separate section. Conse-
quently, the information on market risks given in
this section refers to risks excluding Handels-
banken Liv.
MARKET RISK STRATEGY
Handelsbanken has a restrictive view of market
risks. Essentially, market risks in the banking
operations are only taken as part of meeting cus-
tomers’ investment and risk management needs.
Market risks must be limited by matching cash
flows and interest-fixing periods, hedging open
positions and taking other actions to limit risk.
Market risks at Handelsbanken are thus very
low. One result of the low market risks is that a
much smaller part of the Bank’s earnings come
from net gains/losses on financial transactions.
ORGANISATIONAL STRUCTURE
The Bank’s limit system restricts the size of the
exposure to market risks. Measurement meth-
ods and limits are established by the Board. The
CFO has the functional responsibility for liquidity
and funding, while the Head of Group Treasury,
who reports to the CFO, is responsible for the
Group’s liquidity and funding. This responsibility
includes managing the Group’s liquidity, foreign
exchange and interest rate risks in its banking
operations. The limits for interest rate, foreign
exchange and liquidity risk are allocated by the
CEO and CFO to the Head of Group Treasury,
who in turn allocates these to the business-
operating units. Limits for equity price risk and
commodity price risk are allocated directly to
Capital Markets by the CFO.
The CEO and the CFO also decide on supple-
mentary risk measures, intraday limits and
detailed guidelines. The supplementary limit
measures aim to reduce the Bank’s sensitivity to
volatility changes in the financial markets, and to
limit the risks of specific holdings and the liquidity
risk per currency. These measures also limit the
risks from a maturity perspective. The CFO, CEO
and Board continually receive reports on the
market risks and utilisation of the limits.
MARKET RISK AT HANDELSBANKEN
Market risks are measured using several different
methods. The sensitivity measures used show
which changes in value would occur in the event
of predefined changes in prices and volatilities.
Position-related risk measures and probability-
based Value at Risk models (VaR) are also used.
VaR
VaR (Value-at-Risk ) is calculated for the portfo-
lios at Handelsbanken Capital Markets and
Group Treasury which are classified as trading
book. VaR is a probability-based measure and
expresses the losses in Swedish kronor that may
arise in risk positions due to movements in the
underlying markets over a specified holding
period and for a given confidence level. VaR is
calculated using historical simulation and is
determined for individual risk factors, classes of
risk and at portfolio level with a 99-per cent confi-
dence level and a one-day holding period. This
means that the Bank would be expected to make
a loss exceeding the VaR outcome on one out of
every 100 trading days. The model means that
different risk classes can be handled in a uniform
way so that they can be compared and aggre-
gated into a total market risk. The overall risk in
the portfolios which are classified as trading book
was SEK 8 million (9) at year-end. VaR is reported
on a regular basis to the CFO, the CEO and the
Board. The VaR model uses historical, observed
outcomes and does not thus cover all potential
outcomes, nor does it always cover the risk of
extreme, rapid market movements. The calcula-
tions are therefore supplemented with stress
tests where the portfolios are tested against sce-
narios based on all events in the financial markets
since 1994. The results of these stress tests are
also reported to the CFO, CEO and the Board’s
risk committee on a regular basis.
NOTES | GROUP
HANDELSBANKEN | ANNUAL REPORT 2019 117
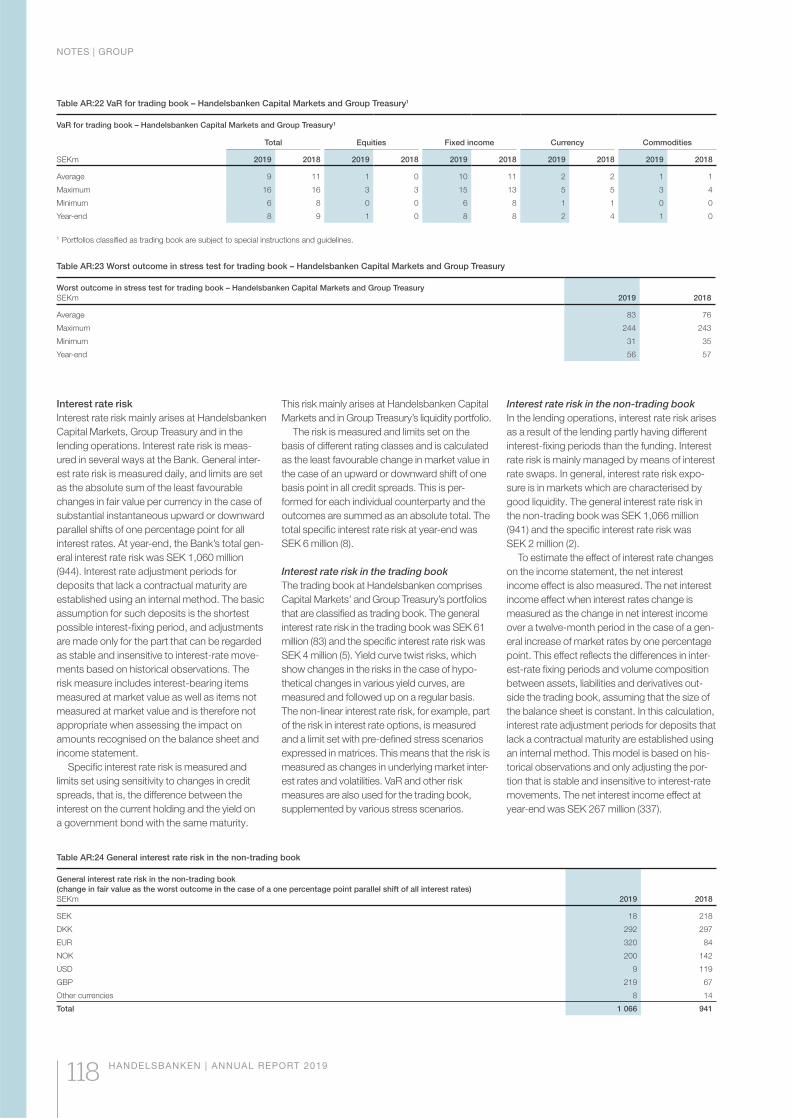
Table AR:22 VaR for trading book – Handelsbanken Capital Markets and Group Treasury1
VaR for trading book – Handelsbanken Capital Markets and Group Treasury¹
Total Equities Fixed income Currency Commodities
SEKm 2019 2018 2019 2018 2019 2018 2019 2018 2019 2018
Average 9 11 1 0 10 11 2 2 1 1
Maximum 16 16 3 3 15 13 5 5 3 4
Minimum 6 8 0 0 6 8 1 1 0 0
Year-end 8 9 1 0 8 8 2 4 1 0
1 Portfolios classified as trading book are subject to special instructions and guidelines.
Table AR:23 Worst outcome in stress test for trading book – Handelsbanken Capital Markets and Group Treasury
Worst outcome in stress test for trading book – Handelsbanken Capital Markets and Group Treasury
SEKm 2019 2018
Average 83 76
Maximum 244 243
Minimum 31 35
Year-end 56 57
Table AR:24 General interest rate risk in the non-trading book
General interest rate risk in the non-trading book
(change in fair value as the worst outcome in the case of a one percentage point parallel shift of all interest rates)
SEKm 2019 2018
SEK 18 218
DKK 292 297
EUR 320 84
NOK 200 142
USD 9 119
GBP 219 67
Other currencies 8 14
Total 1 066 941
Interest rate risk
Interest rate risk mainly arises at Handelsbanken
Capital Markets, Group Treasury and in the
lending operations. Interest rate risk is meas-
ured in several ways at the Bank. General inter-
est rate risk is measured daily, and limits are set
as the absolute sum of the least favourable
changes in fair value per currency in the case of
substantial instantaneous upward or downward
parallel shifts of one percentage point for all
interest rates. At year-end, the Bank’s total gen-
eral interest rate risk was SEK 1,060 million
(944). Interest rate adjustment periods for
deposits that lack a contractual maturity are
established using an internal method. The basic
assumption for such deposits is the shortest
possible interest-fixing period, and adjustments
are made only for the part that can be regarded
as stable and insensitive to interest-rate move-
ments based on historical observations. The
risk measure includes interest-bearing items
measured at market value as well as items not
measured at market value and is therefore not
appropriate when assessing the impact on
amounts recognised on the balance sheet and
income statement.
Specific interest rate risk is measured and
limits set using sensitivity to changes in credit
spreads, that is, the difference between the
interest on the current holding and the yield on
a government bond with the same maturity.
This risk mainly arises at Handelsbanken Capital
Markets and in Group Treasury’s liquidity port folio.
The risk is measured and limits set on the
basis of different rating classes and is calculated
as the least favourable change in market value in
the case of an upward or downward shift of one
basis point in all credit spreads. This is per-
formed for each individual counterparty and the
outcomes are summed as an absolute total. The
total specific interest rate risk at year-end was
SEK 6 million (8).
Interest rate risk in the trading book
The trading book at Handelsbanken comprises
Capital Markets’ and Group Treasury’s portfolios
that are classified as trading book. The general
interest rate risk in the trading book was SEK 61
million (83) and the specific interest rate risk was
SEK 4 million (5). Yield curve twist risks, which
show changes in the risks in the case of hypo-
thetical changes in various yield curves, are
measured and followed up on a regular basis.
The non-linear interest rate risk, for example, part
of the risk in interest rate options, is measured
and a limit set with pre-defined stress scenarios
expressed in matrices. This means that the risk is
measured as changes in underlying market inter-
est rates and volatilities. VaR and other risk
measures are also used for the trading book,
supplemented by various stress scenarios.
Interest rate risk in the non-trading book
In the lending operations, interest rate risk arises
as a result of the lending partly having different
interest-fixing periods than the funding. Interest
rate risk is mainly managed by means of interest
rate swaps. In general, interest rate risk expo-
sure is in markets which are characterised by
good liquidity. The general interest rate risk in
the non-trading book was SEK 1,066 million
(941) and the specific interest rate risk was
SEK 2 million (2).
To estimate the effect of interest rate changes
on the income statement, the net interest
income effect is also measured. The net interest
income effect when interest rates change is
measured as the change in net interest income
over a twelve-month period in the case of a gen-
eral increase of market rates by one percentage
point. This effect reflects the differences in inter-
est-rate fixing periods and volume composition
between assets, liabilities and derivatives out-
side the trading book, assuming that the size of
the balance sheet is constant. In this calculation,
interest rate adjustment periods for deposits that
lack a contractual maturity are established using
an internal method. This model is based on his-
torical observations and only adjusting the por-
tion that is stable and insensitive to interest-rate
movements. The net interest income effect at
year-end was SEK 267 million (337).
NOTES | GROUP
118 HANDELSBANKEN | ANNUAL REPORT 2019
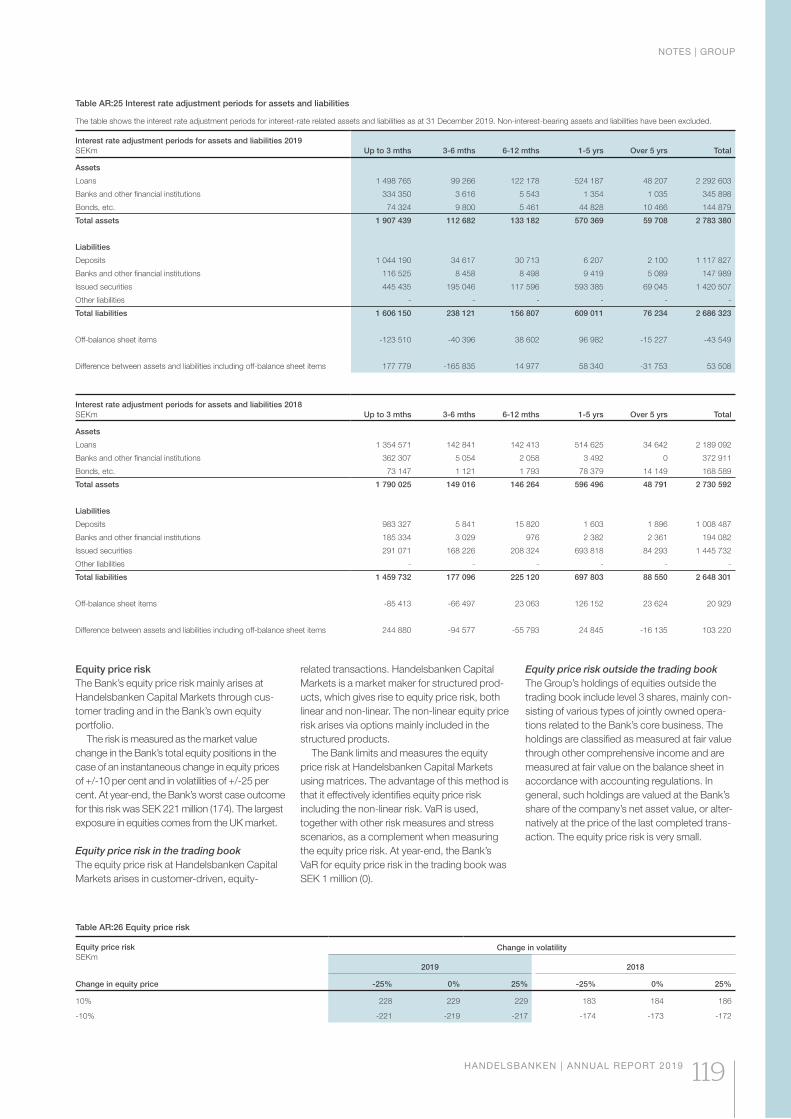
Interest rate adjustment periods for assets and liabilities 2018
SEKm Up to 3 mths 3-6 mths 6-12 mths 1-5 yrs Over 5 yrs Total
Assets
Loans 1 354 571 142 841 142 413 514 625 34 642 2 189 092
Banks and other financial institutions 362 307 5 054 2 058 3 492 0 372 911
Bonds, etc. 73 147 1 121 1 793 78 379 14 149 168 589
Total assets 1 790 025 149 016 146 264 596 496 48 791 2 730 592
Liabilities
Deposits 983 327 5 841 15 820 1 603 1 896 1 008 487
Banks and other financial institutions 185 334 3 029 976 2 382 2 361 194 082
Issued securities 291 071 168 226 208 324 693 818 84 293 1 445 732
Other liabilities - - - - - -
Total liabilities 1 459 732 177 096 225 120 697 803 88 550 2 648 301
Off-balance sheet items -85 413 -66 497 23 063 126 152 23 624 20 929
Difference between assets and liabilities including off-balance sheet items 244 880 -94 577 -55 793 24 845 -16 135 103 220
Table AR:25 Interest rate adjustment periods for assets and liabilities
The table shows the interest rate adjustment periods for interest-rate related assets and liabilities as at 31 December 2019. Non-interest-bearing assets and liabilities have been excluded.
Interest rate adjustment periods for assets and liabilities 2019
SEKm Up to 3 mths 3-6 mths 6-12 mths 1-5 yrs Over 5 yrs Total
Assets
Loans 1 498 765 99 266 122 178 524 187 48 207 2 292 603
Banks and other financial institutions 334 350 3 616 5 543 1 354 1 035 345 898
Bonds, etc. 74 324 9 800 5 461 44 828 10 466 144 879
Total assets 1 907 439 112 682 133 182 570 369 59 708 2 783 380
Liabilities
Deposits 1 044 190 34 617 30 713 6 207 2 100 1 117 827
Banks and other financial institutions 116 525 8 458 8 498 9 419 5 089 147 989
Issued securities 445 435 195 046 117 596 593 385 69 045 1 420 507
Other liabilities - - - - - -
Total liabilities 1 606 150 238 121 156 807 609 011 76 234 2 686 323
Off-balance sheet items -123 510 -40 396 38 602 96 982 -15 227 -43 549
Difference between assets and liabilities including off-balance sheet items 177 779 -165 835 14 977 58 340 -31 753 53 508
Equity price risk
The Bank’s equity price risk mainly arises at
Handelsbanken Capital Markets through cus-
tomer trading and in the Bank’s own equity
portfolio.
The risk is measured as the market value
change in the Bank’s total equity positions in the
case of an instantaneous change in equity prices
of +/-10 per cent and in volatilities of +/-25 per
cent. At year-end, the Bank’s worst case outcome
for this risk was SEK 221 million (174). The largest
exposure in equities comes from the UK market.
Equity price risk in the trading book
The equity price risk at Handelsbanken Capital
Markets arises in customer-driven, equity-
related transactions. Handelsbanken Capital
Markets is a market maker for structured prod-
ucts, which gives rise to equity price risk, both
linear and non-linear. The non-linear equity price
risk arises via options mainly included in the
structured products.
The Bank limits and measures the equity
price risk at Handelsbanken Capital Markets
using matrices. The advantage of this method is
that it effectively identifies equity price risk
including the non-linear risk. VaR is used,
together with other risk measures and stress
scenarios, as a complement when measuring
the equity price risk. At year-end, the Bank’s
VaR for equity price risk in the trading book was
SEK 1 million (0).
Equity price risk outside the trading book
The Group’s holdings of equities outside the
trading book include level 3 shares, mainly con-
sisting of various types of jointly owned opera-
tions related to the Bank’s core business. The
holdings are classified as measured at fair value
through other comprehensive income and are
measured at fair value on the balance sheet in
accordance with accounting regulations. In
general, such holdings are valued at the Bank’s
share of the company’s net asset value, or alter-
natively at the price of the last completed trans-
action. The equity price risk is very small.
Table AR:26 Equity price risk
Equity price risk
SEKmChange in volatility
2019 2018
Change in equity price -25% 0% 25% -25% 0% 25%
10% 228 229 229 183 184 186
-10% -221 -219 -217 -174 -173 -172
NOTES | GROUP
HANDELSBANKEN | ANNUAL REPORT 2019 119
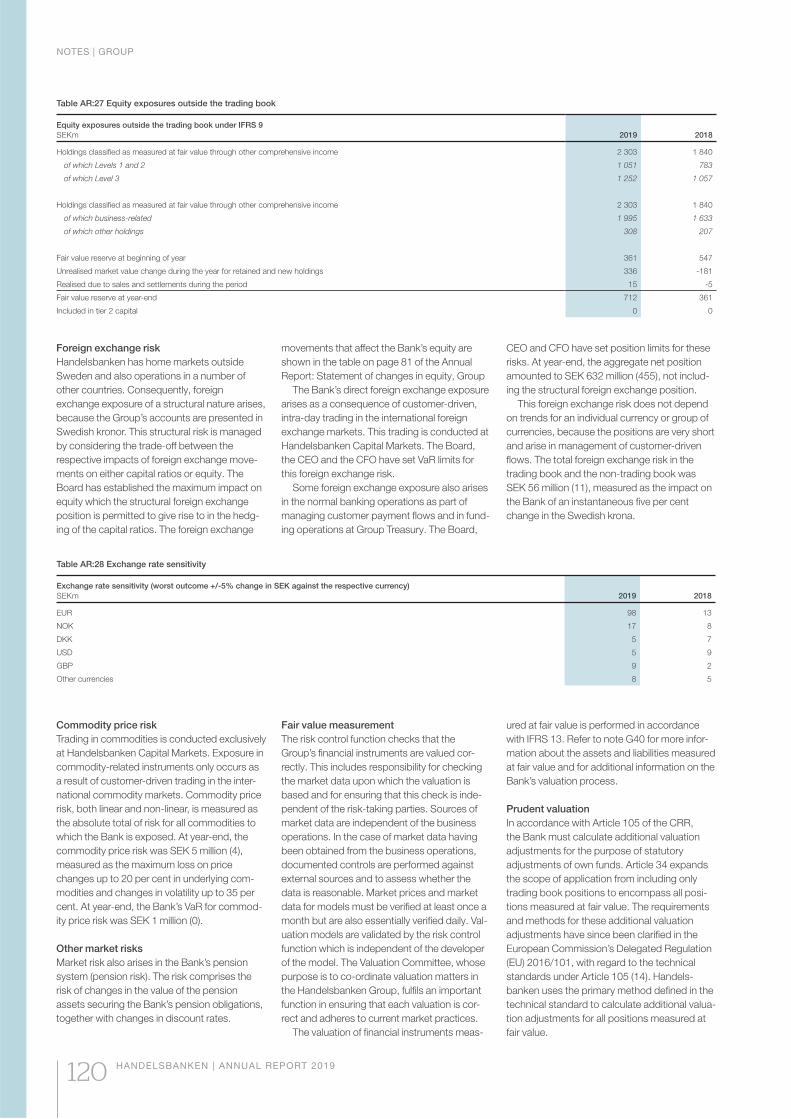
Table AR:27 Equity exposures outside the trading book
Equity exposures outside the trading book under IFRS 9
SEKm 2019 2018
Holdings classified as measured at fair value through other comprehensive income 2 303 1 840
of which Levels 1 and 2 1 051 783
of which Level 3 1 252 1 057
Holdings classified as measured at fair value through other comprehensive income 2 303 1 840
of which business-related 1 995 1 633
of which other holdings 308 207
Fair value reserve at beginning of year 361 547
Unrealised market value change during the year for retained and new holdings 336 -181
Realised due to sales and settlements during the period 15 -5
Fair value reserve at year-end 712 361
Included in tier 2 capital 0 0
Foreign exchange risk
Handelsbanken has home markets outside
Sweden and also operations in a number of
other countries. Consequently, foreign
exchange exposure of a structural nature arises,
because the Group’s accounts are presented in
Swedish kronor. This structural risk is managed
by considering the trade-off between the
respective impacts of foreign exchange move-
ments on either capital ratios or equity. The
Board has established the maximum impact on
equity which the structural foreign exchange
position is permitted to give rise to in the hedg-
ing of the capital ratios. The foreign exchange
movements that affect the Bank’s equity are
shown in the table on page 81 of the Annual
Report: Statement of changes in equity, Group
The Bank’s direct foreign exchange exposure
arises as a consequence of customer-driven,
intra-day trading in the international foreign
exchange markets. This trading is conducted at
Handelsbanken Capital Markets. The Board,
the CEO and the CFO have set VaR limits for
this foreign exchange risk.
Some foreign exchange exposure also arises
in the normal banking operations as part of
managing customer payment flows and in fund-
ing operations at Group Treasury. The Board,
CEO and CFO have set position limits for these
risks. At year-end, the aggregate net position
amounted to SEK 632 million (455), not includ-
ing the structural foreign exchange position.
This foreign exchange risk does not depend
on trends for an individual currency or group of
currencies, because the positions are very short
and arise in management of customer-driven
flows. The total foreign exchange risk in the
trading book and the non-trading book was
SEK 56 million (11), measured as the impact on
the Bank of an instantaneous five per cent
change in the Swedish krona.
Table AR:28 Exchange rate sensitivity
Exchange rate sensitivity (worst outcome +/-5% change in SEK against the respective currency)
SEKm 2019 2018
EUR 98 13
NOK 17 8
DKK 5 7
USD 5 9
GBP 9 2
Other currencies 8 5
Commodity price risk
Trading in commodities is conducted exclusively
at Handelsbanken Capital Markets. Exposure in
commodity-related instruments only occurs as
a result of customer-driven trading in the inter-
national commodity markets. Commodity price
risk, both linear and non-linear, is measured as
the absolute total of risk for all commodities to
which the Bank is exposed. At year-end, the
commodity price risk was SEK 5 million (4),
measured as the maximum loss on price
changes up to 20 per cent in underlying com-
modities and changes in volatility up to 35 per
cent. At year-end, the Bank’s VaR for commod-
ity price risk was SEK 1 million (0).
Other market risks
Market risk also arises in the Bank’s pension
system (pension risk). The risk comprises the
risk of changes in the value of the pension
assets securing the Bank’s pension obligations,
together with changes in discount rates.
Fair value measurement
The risk control function checks that the
Group’s financial instruments are valued cor-
rectly. This includes responsibility for checking
the market data upon which the valuation is
based and for ensuring that this check is inde-
pendent of the risk-taking parties. Sources of
market data are independent of the business
operations. In the case of market data having
been obtained from the business operations,
documented controls are performed against
external sources and to assess whether the
data is reasonable. Market prices and market
data for models must be verified at least once a
month but are also essentially verified daily. Val-
uation models are validated by the risk control
function which is independent of the developer
of the model. The Valuation Committee, whose
purpose is to co-ordinate valuation matters in
the Handelsbanken Group, fulfils an important
function in ensuring that each valuation is cor-
rect and adheres to current market practices.
The valuation of financial instruments meas-
ured at fair value is performed in accordance
with IFRS 13. Refer to note G40 for more infor-
mation about the assets and liabilities measured
at fair value and for additional information on the
Bank’s valuation process.
Prudent valuation
In accordance with Article 105 of the CRR,
the Bank must calculate additional valuation
adjustments for the purpose of statutory
adjustments of own funds. Article 34 expands
the scope of application from including only
trading book positions to encompass all posi-
tions measured at fair value. The requirements
and methods for these additional valuation
adjustments have since been clarified in the
European Commission’s Delegated Regulation
(EU) 2016/101, with regard to the technical
standards under Article 105 (14). Handels-
banken uses the primary method defined in the
technical standard to calculate additional valua-
tion adjustments for all positions measured at
fair value.
NOTES | GROUP
120 HANDELSBANKEN | ANNUAL REPORT 2019
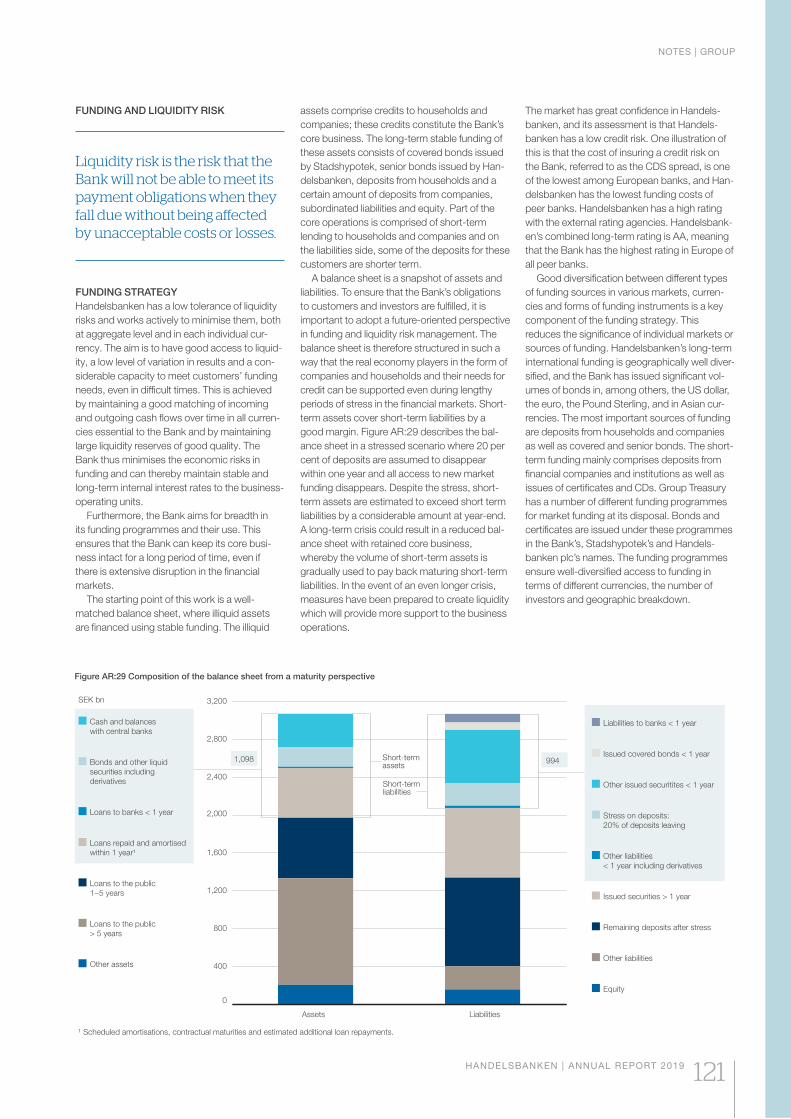
FUNDING AND LIQUIDITY RISK
Liquidity risk is the risk that the Bank will not be able to meet its payment obligations when they fall due without being affected by unacceptable costs or losses.
FUNDING STRATEGY
Handelsbanken has a low tolerance of liquidity
risks and works actively to minimise them, both
at aggregate level and in each individual cur-
rency. The aim is to have good access to liquid-
ity, a low level of variation in results and a con-
siderable capacity to meet customers’ funding
needs, even in difficult times. This is achieved
by maintaining a good matching of incoming
and outgoing cash flows over time in all curren-
cies essential to the Bank and by maintaining
large liquidity reserves of good quality. The
Bank thus minimises the economic risks in
funding and can thereby maintain stable and
long-term internal interest rates to the business-
operating units.
Furthermore, the Bank aims for breadth in
its funding programmes and their use. This
ensures that the Bank can keep its core busi-
ness intact for a long period of time, even if
there is extensive disruption in the financial
markets.
The starting point of this work is a well-
matched balance sheet, where illiquid assets
are financed using stable funding. The illiquid
0
400
800
1,200
1,600
2,000
2,400
2,800
3,200SEK bn
1,098 994Short-term assets
Short-term liabilities
Assets Liabilities
¹ Scheduled amortisations, contractual maturities and estimated additional loan repayments.
Cash and balances
with central banks
Bonds and other liquid
securities including
derivatives
Loans to banks < 1 year
Loans repaid and amortised
within 1 year¹
Loans to the public
1−5 years
Loans to the public
> 5 years
Other assets
Liabilities to banks < 1 year
Issued covered bonds < 1 year
Other issued securitites < 1 year
Stress on deposits:
20% of deposits leaving
Other liabilities
< 1 year including derivatives
Issued securities > 1 year
Remaining deposits after stress
Other liabilities
Equity
Figure AR:29 Composition of the balance sheet from a maturity perspective
assets comprise credits to households and
companies; these credits constitute the Bank’s
core business. The long-term stable funding of
these assets consists of covered bonds issued
by Stadshypotek, senior bonds issued by Han-
delsbanken, deposits from households and a
certain amount of deposits from companies,
subordinated liabilities and equity. Part of the
core operations is comprised of short-term
lending to households and companies and on
the liabilities side, some of the deposits for these
customers are shorter term.
A balance sheet is a snapshot of assets and
liabilities. To ensure that the Bank’s obligations
to customers and investors are fulfilled, it is
important to adopt a future-oriented perspective
in funding and liquidity risk management. The
balance sheet is therefore structured in such a
way that the real economy players in the form of
companies and households and their needs for
credit can be supported even during lengthy
periods of stress in the financial markets. Short-
term assets cover short-term liabilities by a
good margin. Figure AR:29 describes the bal-
ance sheet in a stressed scenario where 20 per
cent of deposits are assumed to disappear
within one year and all access to new market
funding disappears. Despite the stress, short-
term assets are estimated to exceed short term
liabilities by a considerable amount at year-end.
A long-term crisis could result in a reduced bal-
ance sheet with retained core business,
whereby the volume of short-term assets is
gradually used to pay back maturing short-term
liabilities. In the event of an even longer crisis,
measures have been prepared to create liquidity
which will provide more support to the business
operations.
The market has great confidence in Handels-
banken, and its assessment is that Handels-
banken has a low credit risk. One illustration of
this is that the cost of insuring a credit risk on
the Bank, referred to as the CDS spread, is one
of the lowest among European banks, and Han-
delsbanken has the lowest funding costs of
peer banks. Handelsbanken has a high rating
with the external rating agencies. Handelsbank-
en’s combined long-term rating is AA, meaning
that the Bank has the highest rating in Europe of
all peer banks.
Good diversification between different types
of funding sources in various markets, curren-
cies and forms of funding instruments is a key
component of the funding strategy. This
reduces the significance of individual markets or
sources of funding. Handelsbanken’s long-term
international funding is geographically well diver-
sified, and the Bank has issued significant vol-
umes of bonds in, among others, the US dollar,
the euro, the Pound Sterling, and in Asian cur-
rencies. The most important sources of funding
are deposits from households and companies
as well as covered and senior bonds. The short-
term funding mainly comprises deposits from
financial companies and institutions as well as
issues of certificates and CDs. Group Treasury
has a number of different funding programmes
for market funding at its disposal. Bonds and
certificates are issued under these programmes
in the Bank’s, Stadshypotek’s and Handels-
banken plc’s names. The funding programmes
ensure well-diversified access to funding in
terms of different currencies, the number of
investors and geographic breakdown.
NOTES | GROUP
HANDELSBANKEN | ANNUAL REPORT 2019 121
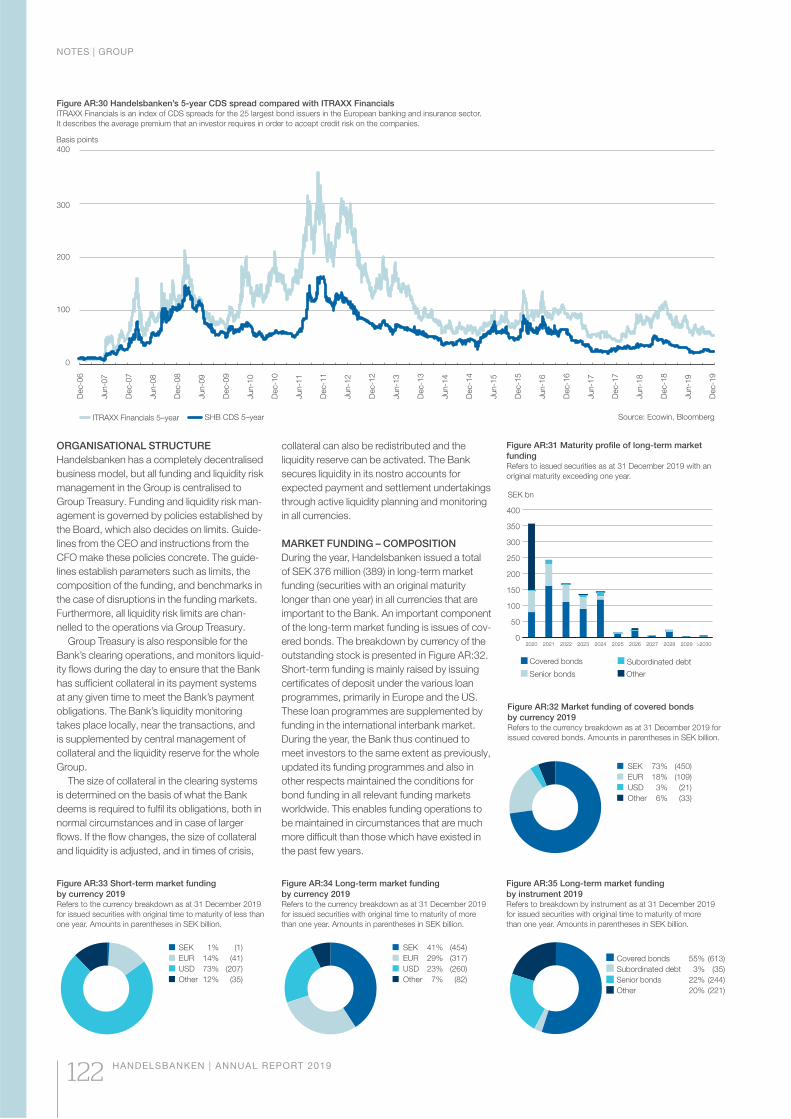
Figure AR:30 Handelsbanken’s 5-year CDS spread compared with ITRAXX Financials ITRAXX Financials is an index of CDS spreads for the 25 largest bond issuers in the European banking and insurance sector.
It describes the average premium that an investor requires in order to accept credit risk on the companies.
0
100
200
300
400
ITRAXX Financials 5–year SHB CDS 5–year Source: Ecowin, Bloomberg
Basis points
Dec-0
6
Jun-0
7
Dec-0
7
Jun-0
8
Dec-0
8
Jun-0
9
Dec-0
9
Jun-1
0
Dec-1
0
Jun-1
1
Dec-1
1
Jun-1
2
Dec-1
2
Jun-1
3
Dec-1
3
Jun-1
4
Dec-1
4
Jun-1
5
Dec-1
5
Jun-1
6
Dec-1
6
Jun-1
7
Dec-1
7
Jun-1
8
Dec-1
8
Jun-1
9
Dec-1
9
ORGANISATIONAL STRUCTURE
Handelsbanken has a completely decentralised
business model, but all funding and liquidity risk
management in the Group is centralised to
Group Treasury. Funding and liquidity risk man-
agement is governed by policies established by
the Board, which also decides on limits. Guide-
lines from the CEO and instructions from the
CFO make these policies concrete. The guide-
lines establish parameters such as limits, the
composition of the funding, and benchmarks in
the case of disruptions in the funding markets.
Furthermore, all liquidity risk limits are chan-
nelled to the operations via Group Treasury.
Group Treasury is also responsible for the
Bank’s clearing operations, and monitors liquid-
ity flows during the day to ensure that the Bank
has sufficient collateral in its payment systems
at any given time to meet the Bank’s payment
obligations. The Bank’s liquidity monitoring
takes place locally, near the transactions, and
is supplemented by central management of
collateral and the liquidity reserve for the whole
Group.
The size of collateral in the clearing systems
is determined on the basis of what the Bank
deems is required to fulfil its obligations, both in
normal circumstances and in case of larger
flows. If the flow changes, the size of collateral
and liquidity is adjusted, and in times of crisis,
collateral can also be redistributed and the
liquidity reserve can be activated. The Bank
secures liquidity in its nostro accounts for
expected payment and settlement undertakings
through active liquidity planning and monitoring
in all currencies.
MARKET FUNDING – COMPOSITION
During the year, Handelsbanken issued a total
of SEK 376 million (389) in long-term market
funding (securities with an original maturity
longer than one year) in all currencies that are
important to the Bank. An important component
of the long-term market funding is issues of cov-
ered bonds. The breakdown by currency of the
outstanding stock is presented in Figure AR:32.
Short-term funding is mainly raised by issuing
certificates of deposit under the various loan
programmes, primarily in Europe and the US.
These loan programmes are supplemented by
funding in the international interbank market.
During the year, the Bank thus continued to
meet investors to the same extent as previously,
updated its funding programmes and also in
other respects maintained the conditions for
bond funding in all relevant funding markets
worldwide. This enables funding operations to
be maintained in circumstances that are much
more difficult than those which have existed in
the past few years.
Covered bonds 55% (613)
Subordinated debt 3% (35)
Senior bonds 22% (244)
Other 20% (221)
Figure AR:35 Long-term market funding
by instrument 2019Refers to breakdown by instrument as at 31 December 2019
for issued securities with original time to maturity of more
than one year. Amounts in parentheses in SEK billion.
SEK 41% (454)
EUR 29% (317)
USD 23% (260)
Other 7% (82)
Figure AR:34 Long-term market funding
by currency 2019Refers to the currency breakdown as at 31 December 2019
for issued securities with original time to maturity of more
than one year. Amounts in parentheses in SEK billion.
SEK 73% (450)
EUR 18% (109)
USD 3% (21)
Other 6% (33)
Figure AR:32 Market funding of covered bonds
by currency 2019Refers to the currency breakdown as at 31 December 2019 for
issued covered bonds. Amounts in parentheses in SEK billion.
SEK 1% (1)
EUR 14% (41)
USD 73% (207)
Other 12% (35)
Figure AR:33 Short-term market funding
by currency 2019Refers to the currency breakdown as at 31 December 2019
for issued securities with original time to maturity of less than
one year. Amounts in parentheses in SEK billion.
Figure AR:31 Maturity profile of long-term market
fundingRefers to issued securities as at 31 December 2019 with an
original maturity exceeding one year.
0
50
100
150
200
250
300
350
400
>20302029202820272026202520242023202220212020
Covered bonds Subordinated debt
Senior bonds Other
SEK bn
NOTES | GROUP
122 HANDELSBANKEN | ANNUAL REPORT 2019
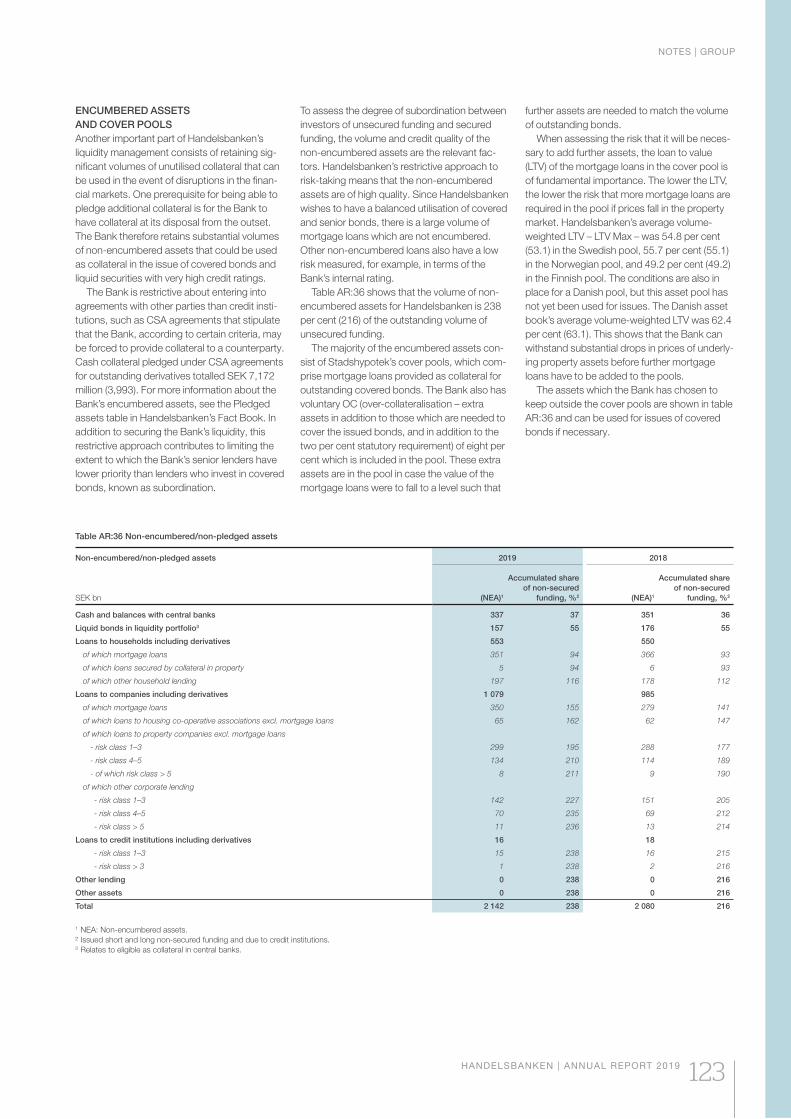
ENCUMBERED ASSETS
AND COVER POOLS
Another important part of Handelsbanken’s
liquidity management consists of retaining sig-
nificant volumes of unutilised collateral that can
be used in the event of disruptions in the finan-
cial markets. One prerequisite for being able to
pledge additional collateral is for the Bank to
have collateral at its disposal from the outset.
The Bank therefore retains substantial volumes
of non-encumbered assets that could be used
as collateral in the issue of covered bonds and
liquid securities with very high credit ratings.
The Bank is restrictive about entering into
agreements with other parties than credit insti-
tutions, such as CSA agreements that stipulate
that the Bank, according to certain criteria, may
be forced to provide collateral to a counterparty.
Cash collateral pledged under CSA agreements
for outstanding derivatives totalled SEK 7,172
million (3,993). For more information about the
Bank’s encumbered assets, see the Pledged
assets table in Handelsbanken’s Fact Book. In
addition to securing the Bank’s liquidity, this
restrictive approach contributes to limiting the
extent to which the Bank’s senior lenders have
lower priority than lenders who invest in covered
bonds, known as subordination.
To assess the degree of subordination between
investors of unsecured funding and secured
funding, the volume and credit quality of the
non-encumbered assets are the relevant fac-
tors. Handelsbanken’s restrictive approach to
risk-taking means that the non-encumbered
assets are of high quality. Since Handelsbanken
wishes to have a balanced utilisation of covered
and senior bonds, there is a large volume of
mortgage loans which are not encumbered.
Other non-encumbered loans also have a low
risk measured, for example, in terms of the
Bank’s internal rating.
Table AR:36 shows that the volume of non-
encumbered assets for Handelsbanken is 238
per cent (216) of the outstanding volume of
unsecured funding.
The majority of the encumbered assets con-
sist of Stadshypotek’s cover pools, which com-
prise mortgage loans provided as collateral for
outstanding covered bonds. The Bank also has
voluntary OC (over-collateralisation – extra
assets in addition to those which are needed to
cover the issued bonds, and in addition to the
two per cent statutory requirement) of eight per
cent which is included in the pool. These extra
assets are in the pool in case the value of the
mortgage loans were to fall to a level such that
further assets are needed to match the volume
of outstanding bonds.
When assessing the risk that it will be neces-
sary to add further assets, the loan to value
(LTV) of the mortgage loans in the cover pool is
of fundamental importance. The lower the LTV,
the lower the risk that more mortgage loans are
required in the pool if prices fall in the property
market. Handelsbanken’s average volume-
weighted LTV – LTV Max – was 54.8 per cent
(53.1) in the Swedish pool, 55.7 per cent (55.1)
in the Norwegian pool, and 49.2 per cent (49.2)
in the Finnish pool. The conditions are also in
place for a Danish pool, but this asset pool has
not yet been used for issues. The Danish asset
book’s average volume-weighted LTV was 62.4
per cent (63.1). This shows that the Bank can
withstand substantial drops in prices of underly-
ing property assets before further mortgage
loans have to be added to the pools.
The assets which the Bank has chosen to
keep outside the cover pools are shown in table
AR:36 and can be used for issues of covered
bonds if necessary.
Table AR:36 Non-encumbered/non-pledged assets
Non-encumbered/non-pledged assets
SEK bn
2019 2018
(NEA)1
Accumulated share
of non-secured
funding, %2 (NEA)1
Accumulated share
of non-secured
funding, %2
Cash and balances with central banks 337 37 351 36
Liquid bonds in liquidity portfolio3 157 55 176 55
Loans to households including derivatives 553 550
of which mortgage loans 351 94 366 93
of which loans secured by collateral in property 5 94 6 93
of which other household lending 197 116 178 112
Loans to companies including derivatives 1 079 985
of which mortgage loans 350 155 279 141
of which loans to housing co-operative associations excl. mortgage loans 65 162 62 147
of which loans to property companies excl. mortgage loans
- risk class 1–3 299 195 288 177
- risk class 4–5 134 210 114 189
- of which risk class > 5 8 211 9 190
of which other corporate lending
- risk class 1–3 142 227 151 205
- risk class 4–5 70 235 69 212
- risk class > 5 11 236 13 214
Loans to credit institutions including derivatives 16 18
- risk class 1–3 15 238 16 215
- risk class > 3 1 238 2 216
Other lending 0 238 0 216
Other assets 0 238 0 216
Total 2 142 238 2 080 216
1 NEA: Non-encumbered assets.
² Issued short and long non-secured funding and due to credit institutions.3 Relates to eligible as collateral in central banks.
NOTES | GROUP
HANDELSBANKEN | ANNUAL REPORT 2019 123
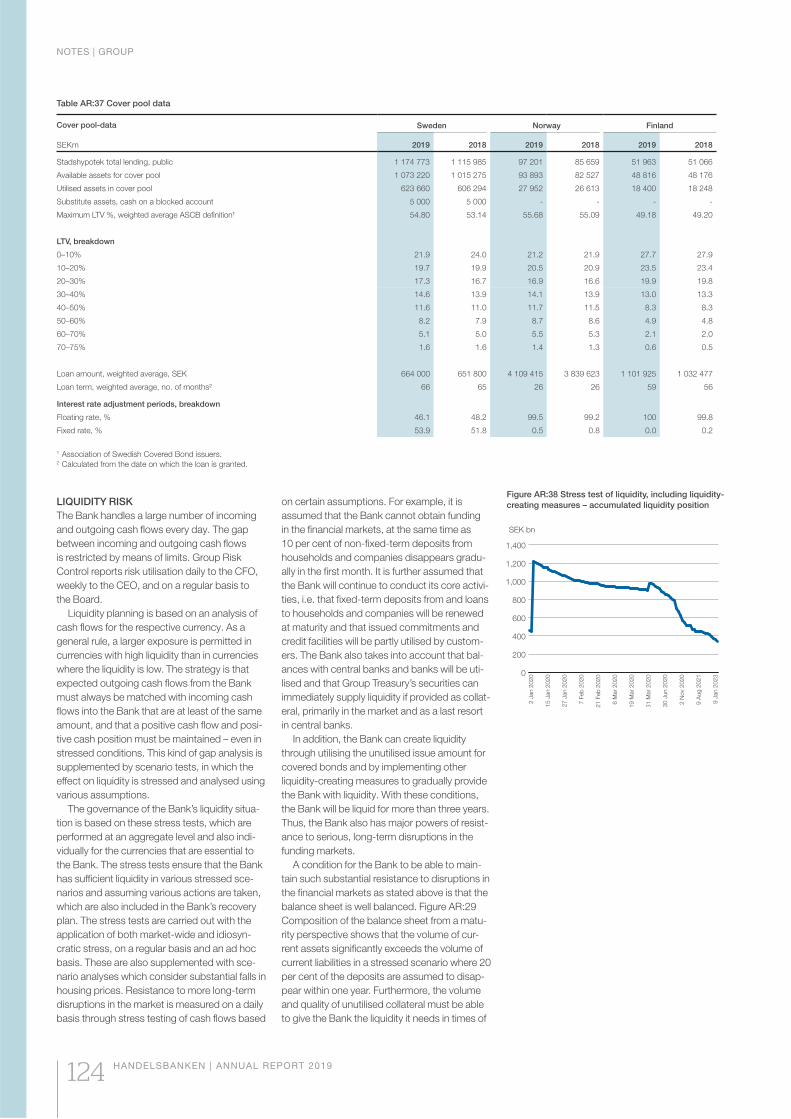
Table AR:37 Cover pool data
Cover pool-data
SEKm
Sweden Norway Finland
2019 2018 2019 2018 2019 2018
Stadshypotek total lending, public 1 174 773 1 115 985 97 201 85 659 51 963 51 066
Available assets for cover pool 1 073 220 1 015 275 93 893 82 527 48 816 48 176
Utilised assets in cover pool 623 660 606 294 27 952 26 613 18 400 18 248
Substitute assets, cash on a blocked account 5 000 5 000 - - - -
Maximum LTV %, weighted average ASCB definition¹ 54.80 53.14 55.68 55.09 49.18 49.20
LTV, breakdown
0–10% 21.9 24.0 21.2 21.9 27.7 27.9
10–20% 19.7 19.9 20.5 20.9 23.5 23.4
20–30% 17.3 16.7 16.9 16.6 19.9 19.8
30–40% 14.6 13.9 14.1 13.9 13.0 13.3
40–50% 11.6 11.0 11.7 11.5 8.3 8.3
50–60% 8.2 7.9 8.7 8.6 4.9 4.8
60–70% 5.1 5.0 5.5 5.3 2.1 2.0
70–75% 1.6 1.6 1.4 1.3 0.6 0.5
Loan amount, weighted average, SEK 664 000 651 800 4 109 415 3 839 623 1 101 925 1 032 477
Loan term, weighted average, no. of months² 66 65 26 26 59 56
Interest rate adjustment periods, breakdown
Floating rate, % 46.1 48.2 99.5 99.2 100 99.8
Fixed rate, % 53.9 51.8 0.5 0.8 0.0 0.2
1 Association of Swedish Covered Bond issuers. 2 Calculated from the date on which the loan is granted.
LIQUIDITY RISK
The Bank handles a large number of incoming
and outgoing cash flows every day. The gap
between incoming and outgoing cash flows
is restricted by means of limits. Group Risk
Control reports risk utilisation daily to the CFO,
weekly to the CEO, and on a regular basis to
the Board.
Liquidity planning is based on an analysis of
cash flows for the respective currency. As a
general rule, a larger exposure is permitted in
currencies with high liquidity than in currencies
where the liquidity is low. The strategy is that
expected outgoing cash flows from the Bank
must always be matched with incoming cash
flows into the Bank that are at least of the same
amount, and that a positive cash flow and posi-
tive cash position must be maintained – even in
stressed conditions. This kind of gap analysis is
supplemented by scenario tests, in which the
effect on liquidity is stressed and analysed using
various assumptions.
The governance of the Bank’s liquidity situa-
tion is based on these stress tests, which are
performed at an aggregate level and also indi-
vidually for the currencies that are essential to
the Bank. The stress tests ensure that the Bank
has sufficient liquidity in various stressed sce-
narios and assuming various actions are taken,
which are also included in the Bank’s recovery
plan. The stress tests are carried out with the
application of both market-wide and idiosyn-
cratic stress, on a regular basis and an ad hoc
basis. These are also supplemented with sce-
nario analyses which consider substantial falls in
housing prices. Resistance to more long-term
disruptions in the market is measured on a daily
basis through stress testing of cash flows based
Figure AR:38 Stress test of liquidity, including liquidity-
creating measures – accumulated liquidity position
0
200
400
600
800
1,000
1,200
1,400
SEK bn2
Jan 2
02
0
15
Jan 2
02
0
27
Jan 2
02
0
7 F
eb
20
20
21
Feb
20
20
6 M
ar
20
20
19
Mar
20
20
31
Mar
20
20
30
Jun 2
02
0
2 N
ov
20
20
9 A
ug
20
21
9 J
an 2
02
3
on certain assumptions. For example, it is
assumed that the Bank cannot obtain funding
in the financial markets, at the same time as
10 per cent of non-fixed-term deposits from
households and companies disappears gradu-
ally in the first month. It is further assumed that
the Bank will continue to conduct its core activi-
ties, i.e. that fixed-term deposits from and loans
to households and companies will be renewed
at maturity and that issued commitments and
credit facilities will be partly utilised by custom-
ers. The Bank also takes into account that bal-
ances with central banks and banks will be uti-
lised and that Group Treasury’s securities can
immediately supply liquidity if provided as collat-
eral, primarily in the market and as a last resort
in central banks.
In addition, the Bank can create liquidity
through utilising the unutilised issue amount for
covered bonds and by implementing other
liquidity-creating measures to gradually provide
the Bank with liquidity. With these conditions,
the Bank will be liquid for more than three years.
Thus, the Bank also has major powers of resist-
ance to serious, long-term disruptions in the
funding markets.
A condition for the Bank to be able to main-
tain such substantial resistance to disruptions in
the financial markets as stated above is that the
balance sheet is well balanced. Figure AR:29
Composition of the balance sheet from a matu-
rity perspective shows that the volume of cur-
rent assets significantly exceeds the volume of
current liabilities in a stressed scenario where 20
per cent of the deposits are assumed to disap-
pear within one year. Furthermore, the volume
and quality of unutilised collateral must be able
to give the Bank the liquidity it needs in times of
NOTES | GROUP
124 HANDELSBANKEN | ANNUAL REPORT 2019
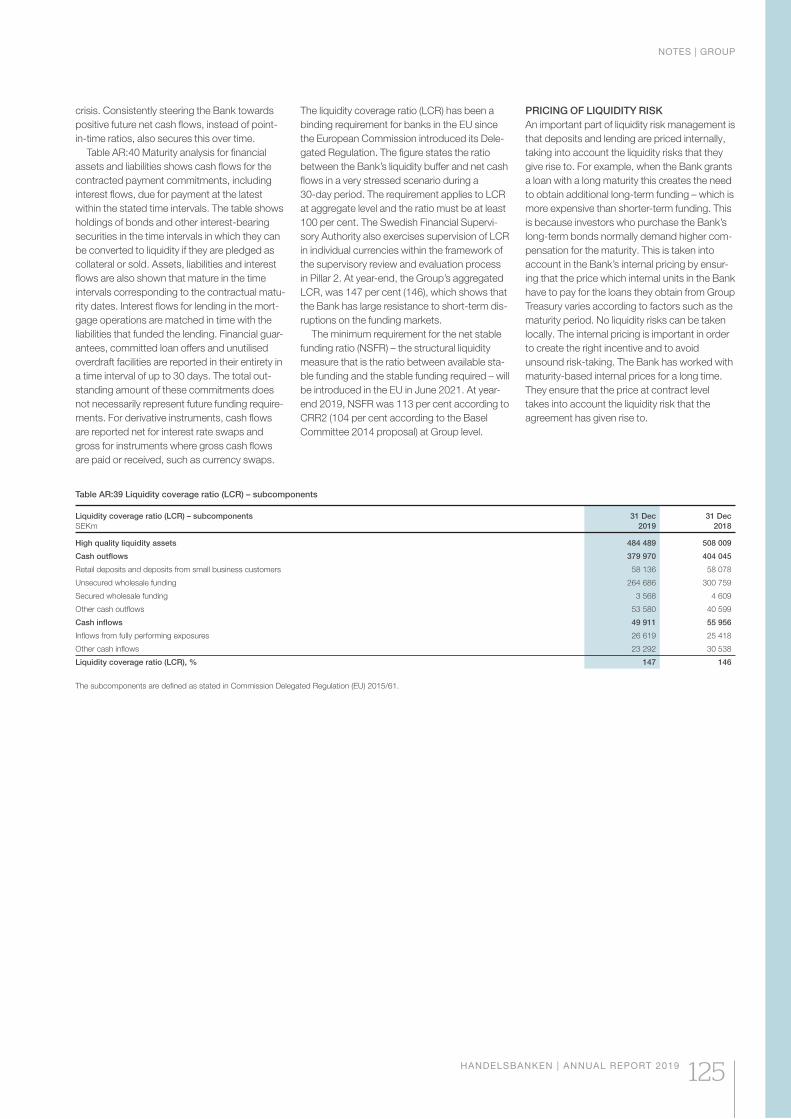
Table AR:39 Liquidity coverage ratio (LCR) – subcomponents
Liquidity coverage ratio (LCR) – subcomponents
SEKm
31 Dec
2019
31 Dec
2018
High quality liquidity assets 484 489 508 009
Cash outflows 379 970 404 045
Retail deposits and deposits from small business customers 58 136 58 078
Unsecured wholesale funding 264 686 300 759
Secured wholesale funding 3 568 4 609
Other cash outflows 53 580 40 599
Cash inflows 49 911 55 956
Inflows from fully performing exposures 26 619 25 418
Other cash inflows 23 292 30 538
Liquidity coverage ratio (LCR), % 147 146
The subcomponents are defined as stated in Commission Delegated Regulation (EU) 2015/61.
crisis. Consistently steering the Bank towards
positive future net cash flows, instead of point-
in-time ratios, also secures this over time.
Table AR:40 Maturity analysis for financial
assets and liabilities shows cash flows for the
contracted payment commitments, including
interest flows, due for payment at the latest
within the stated time intervals. The table shows
holdings of bonds and other interest-bearing
securities in the time intervals in which they can
be converted to liquidity if they are pledged as
collateral or sold. Assets, liabilities and interest
flows are also shown that mature in the time
intervals corresponding to the contractual matu-
rity dates. Interest flows for lending in the mort-
gage operations are matched in time with the
liabilities that funded the lending. Financial guar-
antees, committed loan offers and unutilised
overdraft facilities are reported in their entirety in
a time interval of up to 30 days. The total out-
standing amount of these commitments does
not necessarily represent future funding require-
ments. For derivative instruments, cash flows
are reported net for interest rate swaps and
gross for instruments where gross cash flows
are paid or received, such as currency swaps.
The liquidity coverage ratio (LCR) has been a
binding requirement for banks in the EU since
the European Commission introduced its Dele-
gated Regulation. The figure states the ratio
between the Bank’s liquidity buffer and net cash
flows in a very stressed scenario during a
30-day period. The requirement applies to LCR
at aggregate level and the ratio must be at least
100 per cent. The Swedish Financial Supervi-
sory Authority also exercises supervision of LCR
in individual currencies within the framework of
the supervisory review and evaluation process
in Pillar 2. At year-end, the Group’s aggregated
LCR, was 147 per cent (146), which shows that
the Bank has large resistance to short-term dis-
ruptions on the funding markets.
The minimum requirement for the net stable
funding ratio (NSFR) – the structural liquidity
measure that is the ratio between available sta-
ble funding and the stable funding required – will
be introduced in the EU in June 2021. At year-
end 2019, NSFR was 113 per cent according to
CRR2 (104 per cent according to the Basel
Committee 2014 proposal) at Group level.
PRICING OF LIQUIDITY RISK
An important part of liquidity risk management is
that deposits and lending are priced internally,
taking into account the liquidity risks that they
give rise to. For example, when the Bank grants
a loan with a long maturity this creates the need
to obtain additional long-term funding – which is
more expensive than shorter-term funding. This
is because investors who purchase the Bank’s
long-term bonds normally demand higher com-
pensation for the maturity. This is taken into
account in the Bank’s internal pricing by ensur-
ing that the price which internal units in the Bank
have to pay for the loans they obtain from Group
Treasury varies according to factors such as the
maturity period. No liquidity risks can be taken
locally. The internal pricing is important in order
to create the right incentive and to avoid
unsound risk-taking. The Bank has worked with
maturity-based internal prices for a long time.
They ensure that the price at contract level
takes into account the liquidity risk that the
agreement has given rise to.
NOTES | GROUP
HANDELSBANKEN | ANNUAL REPORT 2019 125

Maturity analysis for financial assets and liabilities 2018
SEKm Up to 30 days 31 days–6 mths 6–12 mths 1–2 yrs 2–5 yrs Over 5 yrs
Unspecified
maturity Total
Cash and balances with central banks 350 692 - - - - - - 350 692
Interest-bearing securities eligible as collateral with central banks1 122 260 - - - - - - 122 260
Bonds and other interest-bearing securities² 50 728 - - - - - - 50 728
Loans to credit institutions 14 067 3 103 1 102 624 2 767 2 852 - 24 515
of which reverse repos 2 758 - - - - - - 2 758
Loans to the public 51 079 260 480 182 526 234 189 441 981 1 099 482 - 2 269 737
of which reverse repos 9 050 - - - - - - 9 050
Other 24 320 - - - - - 222 533 246 853
of which shares and participating interests 13 821 - - - - - - 13 821
of which claims on investment banking settlements 10 499 - - - - - - 10 499
Total assets 613 146 263 583 183 628 234 813 444 748 1 102 334 222 533 3 064 785
Due to credit institutions 104 079 38 652 12 742 4 150 1 056 5 944 30 477 197 100
of which repos - - - - - - - 0
of which deposits from central banks 42 398 24 092 17 - - - 2 316 68 823
Deposits and borrowing from the public 7 508 24 574 4 670 667 609 7 109 962 707 1 007 844
of which repos - - - - - - - 0
Issued securities³ 98 564 351 948 225 311 193 104 498 156 79 751 - 1 446 834
of which covered bonds 74 37 007 87 074 111 155 342 814 70 948 - 649 072
of which certificates and other securities with
original maturity of less than one year 65 559 254 094 63 516 - - - - 383 169
of which senior bonds and other securities with
original maturity of more than one year 32 931 60 847 74 721 81 949 155 342 8 803 - 414 593
Subordinated liabilities 15 655 6 495 27 824 22 839 7 748 - 53 588
Other 9 166 - - - - - 329 197 338 363
of which short positions 6 195 - - - - - - 6 195
of which liabilities on investment banking settlements 2 971 - - - - - - 2 971
Total liabilities 234 972 421 669 242 750 198 745 522 660 100 552 1 322 381 3 043 729
Off-balance sheet items
Financial guarantees and unutilised committed loan offers 458 772
Derivatives 2018
SEKm Up to 30 days 31 days–6 mths 6–12 mths 1–2 yrs 2–5 yrs Over 5 yrs Total
Total derivatives inflow 262 475 411 486 102 761 123 746 257 026 68 164 1 225 658
Total derivatives outflow 256 616 402 697 98 108 113 529 241 314 67 657 1 179 921
Net 5 859 8 789 4 653 10 217 15 712 507 45 737
1 SEK 83,175m (72,611) of the amount (excl. interest) has a residual maturity of less than one year.
² SEK 16,653m (7,047) of the amount (excl. interest) has a residual maturity of less than one year.
³ SEK 644,231m (653,553) of the amount (excl. interest) has a residual maturity of less than one year.
Table AR:40 Maturity analysis for financial assets and liabilities
For deposit volumes, the column “Unspecified maturity” refers to deposits payable on demand. The table contains interest flows, which means that the balance sheet items are not reconcilable
with the Group’s balance sheet. Maturity tables without interest flows, including maturity tables in foreign currencies, can be found in the Fact Book at handelsbanken.com/ir.
Maturity analysis for financial assets and liabilities 2019
SEKm Up to 30 days 31 days–6 mths 6–12 mths 1–2 yrs 2–5 yrs Over 5 yrs
Unspecified
maturity Total
Cash and balances with central banks 347 438 - - - - - - 347 438
Interest-bearing securities eligible as collateral with central banks¹ 103 387 - - - - - - 103 387
Bonds and other interest-bearing securities² 42 639 - - - - - - 42 639
Loans to credit institutions 11 403 1 777 289 935 2 097 3 261 - 19 762
of which reverse repos - - - - - - - 0
Loans to the public 59 185 284 961 204 305 226 877 456 662 1 145 149 - 2 377 139
of which reverse repos 10 438 - - - - - - 10 438
Other 24 442 - - - - - 244 868 269 310
of which shares and participating interests 21 390 - - - - - - 21 390
of which claims on investment banking settlements 3 052 - - - - - - 3 052
Total assets 588 494 286 738 204 594 227 812 458 759 1 148 410 244 868 3 159 675
Due to credit institutions 87 261 26 344 4 984 3 426 547 1 283 24 931 148 776
of which repos - - - - - - - 0
of which deposits from central banks 40 025 12 795 - - - - 26 52 846
Deposits and borrowing from the public 2 139 27 824 4 098 504 340 6 576 1 075 844 1 117 325
of which repos - - - - - - - 0
Issued securities3 53 199 366 519 244 008 247 550 443 595 74 562 - 1 429 433
of which covered bonds 85 63 942 26 761 172 344 333 168 58 595 - 654 895
of which certificates and other securities with
original maturity of less than one year 48 203 275 095 117 376 - - - - 440 674
of which senior bonds and other securities with
original maturity of more than one year 4 911 27 482 99 871 75 206 110 427 15 967 - 333 864
Subordinated liabilities - 1 125 29 12 623 24 631 - - 38 408
Other 4 783 381 383 716 1 692 1 304 381 156 390 415
of which short positions 1 865 - - - - - - 1 865
of which liabilities on investment banking settlements 2 904 - - - - - - 2 904
Total liabilities 147 382 422 193 253 502 264 819 470 805 83 725 1 481 931 3 124 357
Off-balance sheet items
Financial guarantees and unutilised committed loan offers 439 667
Derivatives 2019
SEKm Up to 30 days 31 days–6 mths 6–12 mths 1–2 yrs 2–5 yrs Over 5 yrs Total
Total derivatives inflow 210 350 458 282 124 620 131 515 205 915 70 538 1 201 220
Total derivatives outflow 212 716 459 576 117 496 121 935 196 116 69 638 1 177 477
Net -2 366 -1 294 7 124 9 580 9 799 900 23 743
NOTES | GROUP
126 HANDELSBANKEN | ANNUAL REPORT 2019
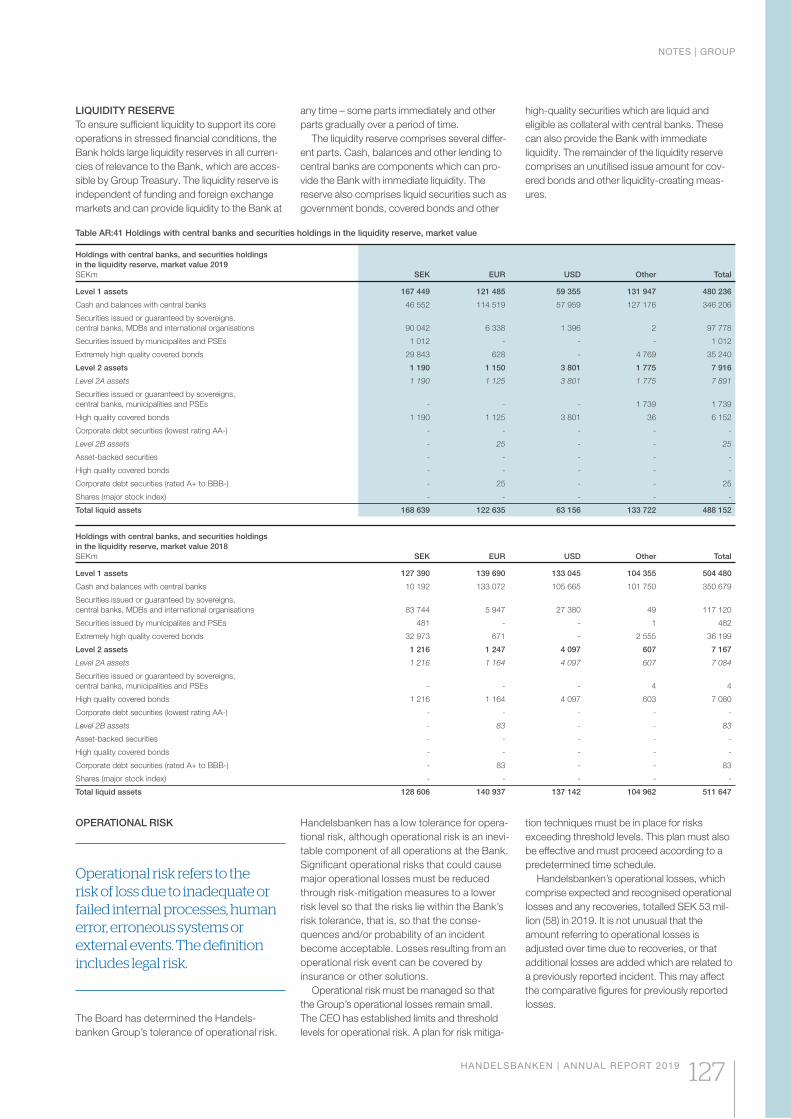
LIQUIDITY RESERVE
To ensure sufficient liquidity to support its core
operations in stressed financial conditions, the
Bank holds large liquidity reserves in all curren-
cies of relevance to the Bank, which are acces-
sible by Group Treasury. The liquidity reserve is
independent of funding and foreign exchange
markets and can provide liquidity to the Bank at
any time – some parts immediately and other
parts gradually over a period of time.
The liquidity reserve comprises several differ-
ent parts. Cash, balances and other lending to
central banks are components which can pro-
vide the Bank with immediate liquidity. The
reserve also comprises liquid securities such as
government bonds, covered bonds and other
high-quality securities which are liquid and
eligible as collateral with central banks. These
can also provide the Bank with immediate
liquidity. The remainder of the liquidity reserve
comprises an unutilised issue amount for cov-
ered bonds and other liquidity-creating meas-
ures.
Table AR:41 Holdings with central banks and securities holdings in the liquidity reserve, market value
Holdings with central banks, and securities holdings
in the liquidity reserve, market value 2019
SEKm SEK EUR USD Other Total
Level 1 assets 167 449 121 485 59 355 131 947 480 236
Cash and balances with central banks 46 552 114 519 57 959 127 176 346 206
Securities issued or guaranteed by sovereigns,
central banks, MDBs and international organisations 90 042 6 338 1 396 2 97 778
Securities issued by municipalites and PSEs 1 012 - - - 1 012
Extremely high quality covered bonds 29 843 628 - 4 769 35 240
Level 2 assets 1 190 1 150 3 801 1 775 7 916
Level 2A assets 1 190 1 125 3 801 1 775 7 891
Securities issued or guaranteed by sovereigns,
central banks, municipalities and PSEs - - - 1 739 1 739
High quality covered bonds 1 190 1 125 3 801 36 6 152
Corporate debt securities (lowest rating AA-) - - - - -
Level 2B assets - 25 - - 25
Asset-backed securities - - - - -
High quality covered bonds - - - - -
Corporate debt securities (rated A+ to BBB-) - 25 - - 25
Shares (major stock index) - - - - -
Total liquid assets 168 639 122 635 63 156 133 722 488 152
Holdings with central banks, and securities holdings
in the liquidity reserve, market value 2018
SEKm SEK EUR USD Other Total
Level 1 assets 127 390 139 690 133 045 104 355 504 480
Cash and balances with central banks 10 192 133 072 105 665 101 750 350 679
Securities issued or guaranteed by sovereigns,
central banks, MDBs and international organisations 83 744 5 947 27 380 49 117 120
Securities issued by municipalites and PSEs 481 - - 1 482
Extremely high quality covered bonds 32 973 671 - 2 555 36 199
Level 2 assets 1 216 1 247 4 097 607 7 167
Level 2A assets 1 216 1 164 4 097 607 7 084
Securities issued or guaranteed by sovereigns,
central banks, municipalities and PSEs - - - 4 4
High quality covered bonds 1 216 1 164 4 097 603 7 080
Corporate debt securities (lowest rating AA-) - - - - -
Level 2B assets - 83 - - 83
Asset-backed securities - - - - -
High quality covered bonds - - - - -
Corporate debt securities (rated A+ to BBB-) - 83 - - 83
Shares (major stock index) - - - - -
Total liquid assets 128 606 140 937 137 142 104 962 511 647
OPERATIONAL RISK
Operational risk refers to the risk of loss due to inadequate or failed internal processes, human error, erroneous systems or external events. The definition includes legal risk.
The Board has determined the Handels-
banken Group’s tolerance of operational risk.
Handelsbanken has a low tolerance for opera-
tional risk, although operational risk is an inevi-
table component of all operations at the Bank.
Significant operational risks that could cause
major operational losses must be reduced
through risk-mitigation measures to a lower
risk level so that the risks lie within the Bank’s
risk tolerance, that is, so that the conse-
quences and/or probability of an incident
become acceptable. Losses resulting from an
operational risk event can be covered by
insurance or other solutions.
Operational risk must be managed so that
the Group’s operational losses remain small.
The CEO has established limits and threshold
levels for operational risk. A plan for risk mitiga-
tion techniques must be in place for risks
exceeding threshold levels. This plan must also
be effective and must proceed according to a
predetermined time schedule.
Handelsbanken’s operational losses, which
comprise expected and recognised operational
losses and any recoveries, totalled SEK 53 mil-
lion (58) in 2019. It is not unusual that the
amount referring to operational losses is
adjusted over time due to recoveries, or that
additional losses are added which are related to
a previously reported incident. This may affect
the comparative figures for previously reported
losses.
NOTES | GROUP
HANDELSBANKEN | ANNUAL REPORT 2019 127
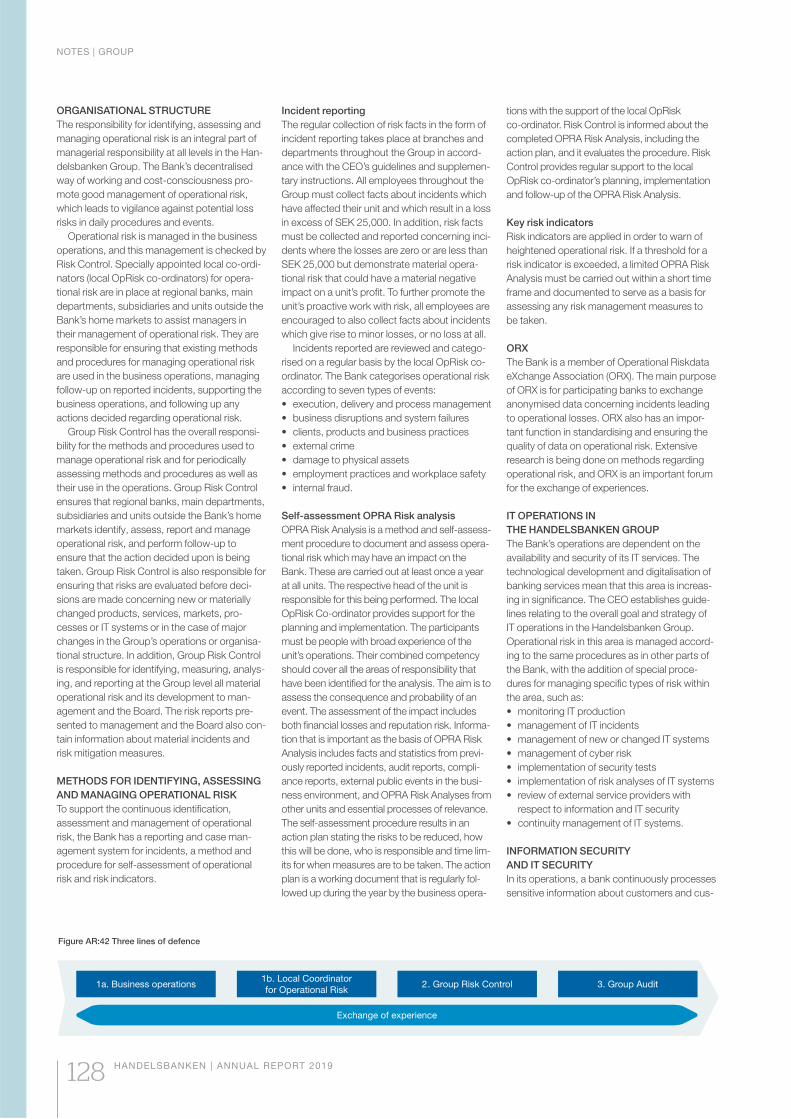
ORGANISATIONAL STRUCTURE
The responsibility for identifying, assessing and
managing operational risk is an integral part of
managerial responsibility at all levels in the Han-
delsbanken Group. The Bank’s decentralised
way of working and cost-consciousness pro-
mote good management of operational risk,
which leads to vigilance against potential loss
risks in daily procedures and events.
Operational risk is managed in the business
operations, and this management is checked by
Risk Control. Specially appointed local co-ordi-
nators (local OpRisk co-ordinators) for opera-
tional risk are in place at regional banks, main
departments, subsidiaries and units outside the
Bank’s home markets to assist managers in
their management of operational risk. They are
responsible for ensuring that existing methods
and procedures for managing operational risk
are used in the business operations, managing
follow-up on reported incidents, supporting the
business operations, and following up any
actions decided regarding operational risk.
Group Risk Control has the overall responsi-
bility for the methods and procedures used to
manage operational risk and for periodically
assessing methods and procedures as well as
their use in the operations. Group Risk Control
ensures that regional banks, main departments,
subsidiaries and units outside the Bank’s home
markets identify, assess, report and manage
operational risk, and perform follow-up to
ensure that the action decided upon is being
taken. Group Risk Control is also responsible for
ensuring that risks are evaluated before deci-
sions are made concerning new or materially
changed products, services, markets, pro-
cesses or IT systems or in the case of major
changes in the Group’s operations or organisa-
tional structure. In addition, Group Risk Control
is responsible for identifying, measuring, analys-
ing, and reporting at the Group level all material
operational risk and its development to man-
agement and the Board. The risk reports pre-
sented to management and the Board also con-
tain information about material incidents and
risk mitigation measures.
METHODS FOR IDENTIFYING, ASSESSING
AND MANAGING OPERATIONAL RISK
To support the continuous identification,
assessment and management of operational
risk, the Bank has a reporting and case man-
agement system for incidents, a method and
procedure for self-assessment of operational
risk and risk indicators.
Incident reporting
The regular collection of risk facts in the form of
incident reporting takes place at branches and
departments throughout the Group in accord-
ance with the CEO’s guidelines and supplemen-
tary instructions. All employees throughout the
Group must collect facts about incidents which
have affected their unit and which result in a loss
in excess of SEK 25,000. In addition, risk facts
must be collected and reported concerning inci-
dents where the losses are zero or are less than
SEK 25,000 but demonstrate material opera-
tional risk that could have a material negative
impact on a unit’s profit. To further promote the
unit’s proactive work with risk, all employees are
encouraged to also collect facts about incidents
which give rise to minor losses, or no loss at all.
Incidents reported are reviewed and catego-
rised on a regular basis by the local OpRisk co-
ordinator. The Bank categorises operational risk
according to seven types of events:
• execution, delivery and process management
• business disruptions and system failures
• clients, products and business practices
• external crime
• damage to physical assets
• employment practices and workplace safety
• internal fraud.
Self-assessment OPRA Risk analysis
OPRA Risk Analysis is a method and self-assess-
ment procedure to document and assess opera-
tional risk which may have an impact on the
Bank. These are carried out at least once a year
at all units. The respective head of the unit is
responsible for this being performed. The local
OpRisk Co-ordinator provides support for the
planning and implementation. The participants
must be people with broad experience of the
unit’s operations. Their combined competency
should cover all the areas of responsibility that
have been identified for the analysis. The aim is to
assess the consequence and probability of an
event. The assessment of the impact includes
both financial losses and reputation risk. Informa-
tion that is important as the basis of OPRA Risk
Analysis includes facts and statistics from previ-
ously reported incidents, audit reports, compli-
ance reports, external public events in the busi-
ness environment, and OPRA Risk Analyses from
other units and essential processes of relevance.
The self-assessment procedure results in an
action plan stating the risks to be reduced, how
this will be done, who is responsible and time lim-
its for when measures are to be taken. The action
plan is a working document that is regularly fol-
lowed up during the year by the business opera-
tions with the support of the local OpRisk
co-ordinator. Risk Control is informed about the
completed OPRA Risk Analysis, including the
action plan, and it evaluates the procedure. Risk
Control provides regular support to the local
OpRisk co-ordinator’s planning, implementation
and follow-up of the OPRA Risk Analysis.
Key risk indicators
Risk indicators are applied in order to warn of
heightened operational risk. If a threshold for a
risk indicator is exceeded, a limited OPRA Risk
Analysis must be carried out within a short time
frame and documented to serve as a basis for
assessing any risk management measures to
be taken.
ORX
The Bank is a member of Operational Riskdata
eXchange Association (ORX). The main purpose
of ORX is for participating banks to exchange
anonymised data concerning incidents leading
to operational losses. ORX also has an impor-
tant function in standardising and ensuring the
quality of data on operational risk. Extensive
research is being done on methods regarding
operational risk, and ORX is an important forum
for the exchange of experiences.
IT OPERATIONS IN
THE HANDELSBANKEN GROUP
The Bank’s operations are dependent on the
availability and security of its IT services. The
technological development and digitalisation of
banking services mean that this area is increas-
ing in significance. The CEO establishes guide-
lines relating to the overall goal and strategy of
IT operations in the Handelsbanken Group.
Operational risk in this area is managed accord-
ing to the same procedures as in other parts of
the Bank, with the addition of special proce-
dures for managing specific types of risk within
the area, such as:
• monitoring IT production
• management of IT incidents
• management of new or changed IT systems
• management of cyber risk
• implementation of security tests
• implementation of risk analyses of IT systems
• review of external service providers with
respect to information and IT security
• continuity management of IT systems.
INFORMATION SECURITY
AND IT SECURITY
In its operations, a bank continuously processes
sensitive information about customers and cus-
Figure AR:42 Three lines of defence
Exchange of experience
3. Group Audit2. Group Risk Control1b. Local Coordinator
for Operational Risk1a. Business operations
NOTES | GROUP
128 HANDELSBANKEN | ANNUAL REPORT 2019
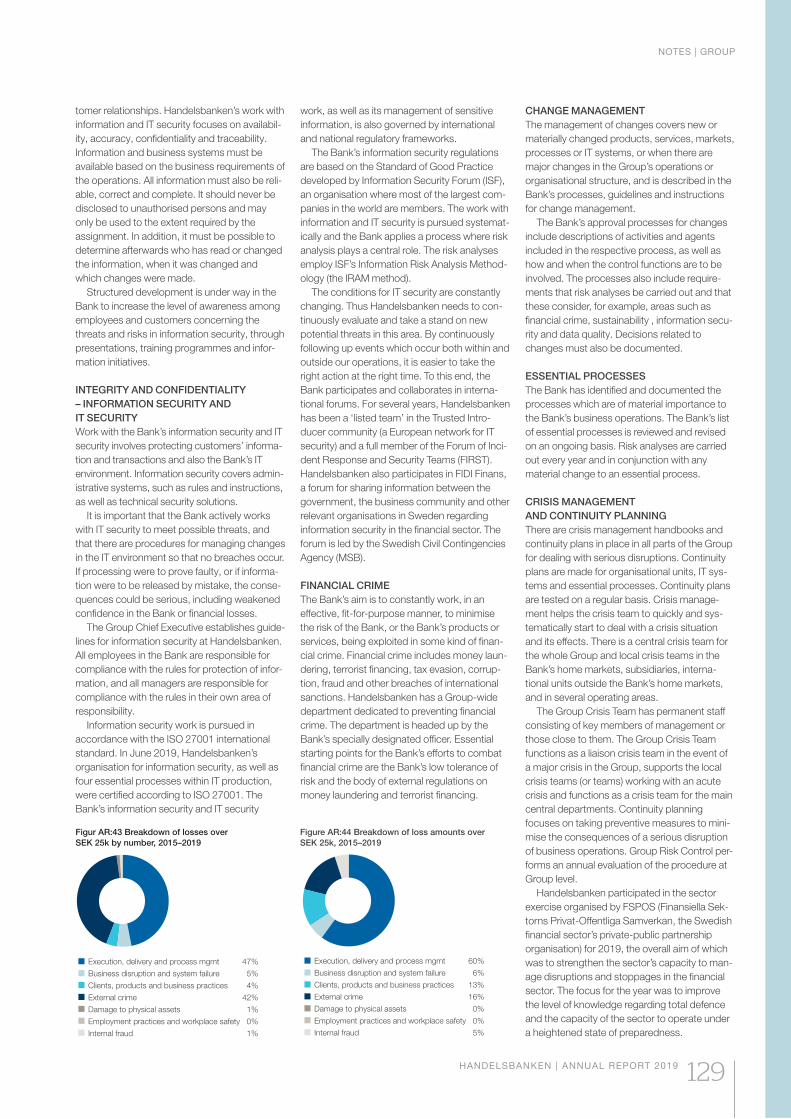
tomer relationships. Handelsbanken’s work with
information and IT security focuses on availabil-
ity, accuracy, confidentiality and traceability.
Information and business systems must be
available based on the business requirements of
the operations. All information must also be reli-
able, correct and complete. It should never be
disclosed to unauthorised persons and may
only be used to the extent required by the
assignment. In addition, it must be possible to
determine afterwards who has read or changed
the information, when it was changed and
which changes were made.
Structured development is under way in the
Bank to increase the level of awareness among
employees and customers concerning the
threats and risks in information security, through
presentations, training programmes and infor-
mation initiatives.
INTEGRITY AND CONFIDENTIALITY
– INFORMATION SECURITY AND
IT SECURITY
Work with the Bank’s information security and IT
security involves protecting customers’ informa-
tion and transactions and also the Bank’s IT
environment. Information security covers admin-
istrative systems, such as rules and instructions,
as well as technical security solutions.
It is important that the Bank actively works
with IT security to meet possible threats, and
that there are procedures for managing changes
in the IT environment so that no breaches occur.
If processing were to prove faulty, or if informa-
tion were to be released by mistake, the conse-
quences could be serious, including weakened
confidence in the Bank or financial losses.
The Group Chief Executive establishes guide-
lines for information security at Handelsbanken.
All employees in the Bank are responsible for
compliance with the rules for protection of infor-
mation, and all managers are responsible for
compliance with the rules in their own area of
responsibility.
Information security work is pursued in
accordance with the ISO 27001 international
standard. In June 2019, Handelsbanken’s
organisation for information security, as well as
four essential processes within IT production,
were certified according to ISO 27001. The
Bank’s information security and IT security
work, as well as its management of sensitive
information, is also governed by international
and national regulatory frameworks.
The Bank’s information security regulations
are based on the Standard of Good Practice
developed by Information Security Forum (ISF),
an organisation where most of the largest com-
panies in the world are members. The work with
information and IT security is pursued systemat-
ically and the Bank applies a process where risk
analysis plays a central role. The risk analyses
employ ISF’s Information Risk Analysis Method-
ology (the IRAM method).
The conditions for IT security are constantly
changing. Thus Handelsbanken needs to con-
tinuously evaluate and take a stand on new
potential threats in this area. By continuously
following up events which occur both within and
outside our operations, it is easier to take the
right action at the right time. To this end, the
Bank participates and collaborates in interna-
tional forums. For several years, Handelsbanken
has been a ‘listed team’ in the Trusted Intro-
ducer community (a European network for IT
security) and a full member of the Forum of Inci-
dent Response and Security Teams (FIRST).
Handelsbanken also participates in FIDI Finans,
a forum for sharing information between the
government, the business community and other
relevant organisations in Sweden regarding
information security in the financial sector. The
forum is led by the Swedish Civil Contingencies
Agency (MSB).
FINANCIAL CRIME
The Bank’s aim is to constantly work, in an
effective, fit-for-purpose manner, to minimise
the risk of the Bank, or the Bank’s products or
services, being exploited in some kind of finan-
cial crime. Financial crime includes money laun-
dering, terrorist financing, tax evasion, corrup-
tion, fraud and other breaches of international
sanctions. Handelsbanken has a Group-wide
department dedicated to preventing financial
crime. The department is headed up by the
Bank’s specially designated officer. Essential
starting points for the Bank’s efforts to combat
financial crime are the Bank’s low tolerance of
risk and the body of external regulations on
money laundering and terrorist financing.
CHANGE MANAGEMENT
The management of changes covers new or
materially changed products, services, markets,
processes or IT systems, or when there are
major changes in the Group’s operations or
organisational structure, and is described in the
Bank’s processes, guidelines and instructions
for change management.
The Bank’s approval processes for changes
include descriptions of activities and agents
included in the respective process, as well as
how and when the control functions are to be
involved. The processes also include require-
ments that risk analyses be carried out and that
these consider, for example, areas such as
financial crime, sustainability , information secu-
rity and data quality. Decisions related to
changes must also be documented.
ESSENTIAL PROCESSES
The Bank has identified and documented the
processes which are of material importance to
the Bank’s business operations. The Bank’s list
of essential processes is reviewed and revised
on an ongoing basis. Risk analyses are carried
out every year and in conjunction with any
material change to an essential process.
CRISIS MANAGEMENT
AND CONTINUITY PLANNING
There are crisis management handbooks and
continuity plans in place in all parts of the Group
for dealing with serious disruptions. Continuity
plans are made for organisational units, IT sys-
tems and essential processes. Continuity plans
are tested on a regular basis. Crisis manage-
ment helps the crisis team to quickly and sys-
tematically start to deal with a crisis situation
and its effects. There is a central crisis team for
the whole Group and local crisis teams in the
Bank’s home markets, subsidiaries, interna-
tional units outside the Bank’s home markets,
and in several operating areas.
The Group Crisis Team has permanent staff
consisting of key members of management or
those close to them. The Group Crisis Team
functions as a liaison crisis team in the event of
a major crisis in the Group, supports the local
crisis teams (or teams) working with an acute
crisis and functions as a crisis team for the main
central departments. Continuity planning
focuses on taking preventive measures to mini-
mise the consequences of a serious disruption
of business operations. Group Risk Control per-
forms an annual evaluation of the procedure at
Group level.
Handelsbanken participated in the sector
exercise organised by FSPOS (Finansiella Sek-
torns Privat-Offentliga Samverkan, the Swedish
financial sector’s private-public partnership
organisation) for 2019, the overall aim of which
was to strengthen the sector’s capacity to man-
age disruptions and stoppages in the financial
sector. The focus for the year was to improve
the level of knowledge regarding total defence
and the capacity of the sector to operate under
a heightened state of preparedness.
Execution, delivery and process mgmt 47%
Business disruption and system failure 5%
Clients, products and business practices 4%
External crime 42%
Damage to physical assets 1%
Employment practices and workplace safety 0%
Internal fraud 1%
Figur AR:43 Breakdown of losses over
SEK 25k by number, 2015–2019
Execution, delivery and process mgmt 60%
Business disruption and system failure 6%
Clients, products and business practices 13%
External crime 16%
Damage to physical assets 0%
Employment practices and workplace safety 0%
Internal fraud 5%
Figure AR:44 Breakdown of loss amounts over
SEK 25k, 2015–2019
NOTES | GROUP
HANDELSBANKEN | ANNUAL REPORT 2019 129
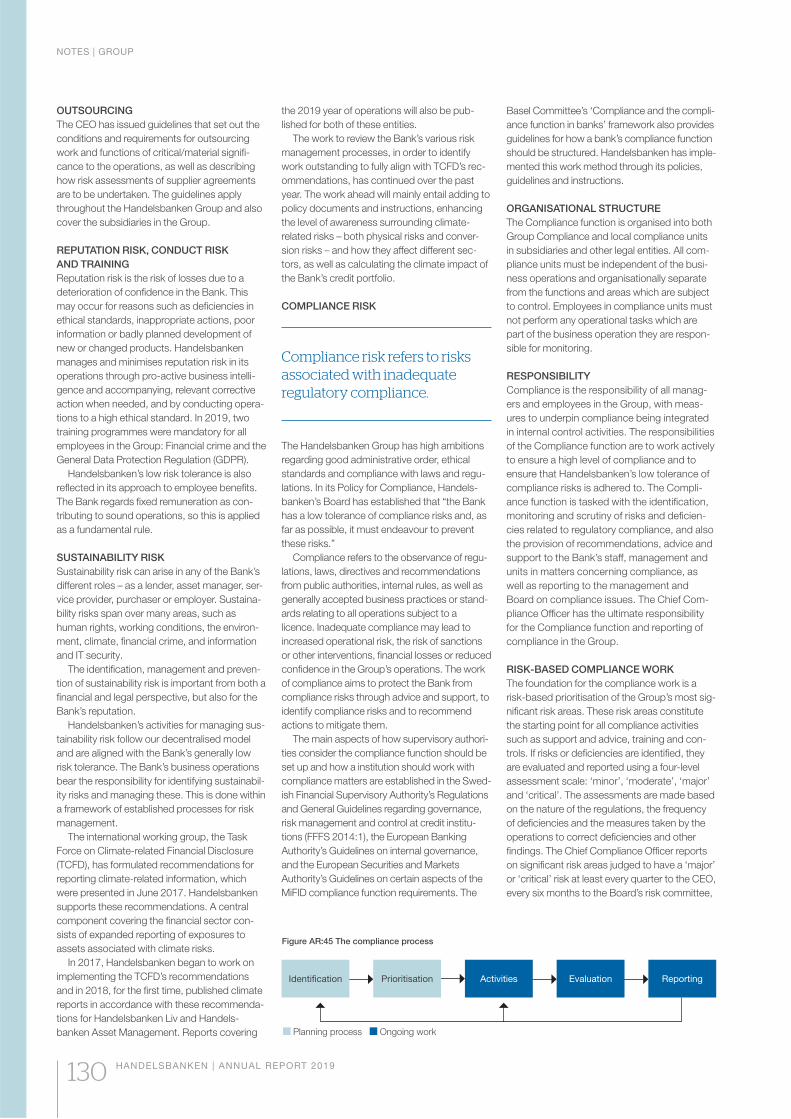
Figure AR:45 The compliance process
Identification Prioritisation Activities Evaluation Reporting
Planning process Ongoing work
OUTSOURCING
The CEO has issued guidelines that set out the
conditions and requirements for outsourcing
work and functions of critical/material signifi-
cance to the operations, as well as describing
how risk assessments of supplier agreements
are to be undertaken. The guidelines apply
throughout the Handelsbanken Group and also
cover the subsidiaries in the Group.
REPUTATION RISK, CONDUCT RISK
AND TRAINING
Reputation risk is the risk of losses due to a
deterioration of confidence in the Bank. This
may occur for reasons such as deficiencies in
ethical standards, inappropriate actions, poor
information or badly planned development of
new or changed products. Handelsbanken
manages and minimises reputation risk in its
operations through pro-active business intelli-
gence and accompanying, relevant corrective
action when needed, and by conducting opera-
tions to a high ethical standard. In 2019, two
training programmes were mandatory for all
employees in the Group: Financial crime and the
General Data Protection Regulation (GDPR).
Handelsbanken’s low risk tolerance is also
reflected in its approach to employee benefits.
The Bank regards fixed remuneration as con-
tributing to sound operations, so this is applied
as a fundamental rule.
SUSTAINABILITY RISK
Sustainability risk can arise in any of the Bank’s
different roles – as a lender, asset manager, ser-
vice provider, purchaser or employer. Sustaina-
bility risks span over many areas, such as
human rights, working conditions, the environ-
ment, climate, financial crime, and information
and IT security.
The identification, management and preven-
tion of sustainability risk is important from both a
financial and legal perspective, but also for the
Bank’s reputation.
Handelsbanken’s activities for managing sus-
tainability risk follow our decentralised model
and are aligned with the Bank’s generally low
risk tolerance. The Bank’s business operations
bear the responsibility for identifying sustainabil-
ity risks and managing these. This is done within
a framework of established processes for risk
management.
The international working group, the Task
Force on Climate-related Financial Disclosure
(TCFD), has formulated recommendations for
reporting climate-related information, which
were presented in June 2017. Handelsbanken
supports these recommendations. A central
component covering the financial sector con-
sists of expanded reporting of exposures to
assets associated with climate risks.
In 2017, Handelsbanken began to work on
implementing the TCFD’s recommendations
and in 2018, for the first time, published climate
reports in accordance with these recommenda-
tions for Handelsbanken Liv and Handels-
banken Asset Management. Reports covering
Basel Committee’s ‘Compliance and the compli-
ance function in banks’ framework also provides
guidelines for how a bank’s compliance function
should be structured. Handelsbanken has imple-
mented this work method through its policies,
guidelines and instructions.
ORGANISATIONAL STRUCTURE
The Compliance function is organised into both
Group Compliance and local compliance units
in subsidiaries and other legal entities. All com-
pliance units must be independent of the busi-
ness operations and organisationally separate
from the functions and areas which are subject
to control. Employees in compliance units must
not perform any operational tasks which are
part of the business operation they are respon-
sible for monitoring.
RESPONSIBILITY
Compliance is the responsibility of all manag-
ers and employees in the Group, with meas-
ures to underpin compliance being integrated
in internal control activities. The responsibilities
of the Compliance function are to work actively
to ensure a high level of compliance and to
ensure that Handelsbanken’s low tolerance of
compliance risks is adhered to. The Compli-
ance function is tasked with the identification,
monitoring and scrutiny of risks and deficien-
cies related to regulatory compliance, and also
the provision of recommendations, advice and
support to the Bank’s staff, management and
units in matters concerning compliance, as
well as reporting to the management and
Board on compliance issues. The Chief Com-
pliance Officer has the ultimate responsibility
for the Compliance function and reporting of
compliance in the Group.
RISK-BASED COMPLIANCE WORK
The foundation for the compliance work is a
risk-based prioritisation of the Group’s most sig-
nificant risk areas. These risk areas constitute
the starting point for all compliance activities
such as support and advice, training and con-
trols. If risks or deficiencies are identified, they
are evaluated and reported using a four-level
assessment scale: ‘minor’, ‘moderate’, ‘major’
and ‘critical’. The assessments are made based
on the nature of the regulations, the frequency
of deficiencies and the measures taken by the
operations to correct deficiencies and other
findings. The Chief Compliance Officer reports
on significant risk areas judged to have a ‘major’
or ‘critical’ risk at least every quarter to the CEO,
every six months to the Board’s risk committee,
the 2019 year of operations will also be pub-
lished for both of these entities.
The work to review the Bank’s various risk
management processes, in order to identify
work outstanding to fully align with TCFD’s rec-
ommendations, has continued over the past
year. The work ahead will mainly entail adding to
policy documents and instructions, enhancing
the level of awareness surrounding climate-
related risks – both physical risks and conver-
sion risks – and how they affect different sec-
tors, as well as calculating the climate impact of
the Bank’s credit portfolio.
COMPLIANCE RISK
Compliance risk refers to risks associated with inadequate regulatory compliance.
The Handelsbanken Group has high ambitions
regarding good administrative order, ethical
standards and compliance with laws and regu-
lations. In its Policy for Compliance, Handels-
banken’s Board has established that “the Bank
has a low tolerance of compliance risks and, as
far as possible, it must endeavour to prevent
these risks.”
Compliance refers to the observance of regu-
lations, laws, directives and recommendations
from public authorities, internal rules, as well as
generally accepted business practices or stand-
ards relating to all operations subject to a
licence. Inadequate compliance may lead to
increased operational risk, the risk of sanctions
or other interventions, financial losses or reduced
confidence in the Group’s operations. The work
of compliance aims to protect the Bank from
compliance risks through advice and support, to
identify compliance risks and to recommend
actions to mitigate them.
The main aspects of how supervisory authori-
ties consider the compliance function should be
set up and how a institution should work with
compliance matters are established in the Swed-
ish Financial Supervisory Authority’s Regulations
and General Guidelines regarding governance,
risk management and control at credit institu-
tions (FFFS 2014:1), the European Banking
Authority’s Guidelines on internal governance,
and the European Securities and Markets
Authority’s Guidelines on certain aspects of the
MiFID compliance function requirements. The
NOTES | GROUP
130 HANDELSBANKEN | ANNUAL REPORT 2019
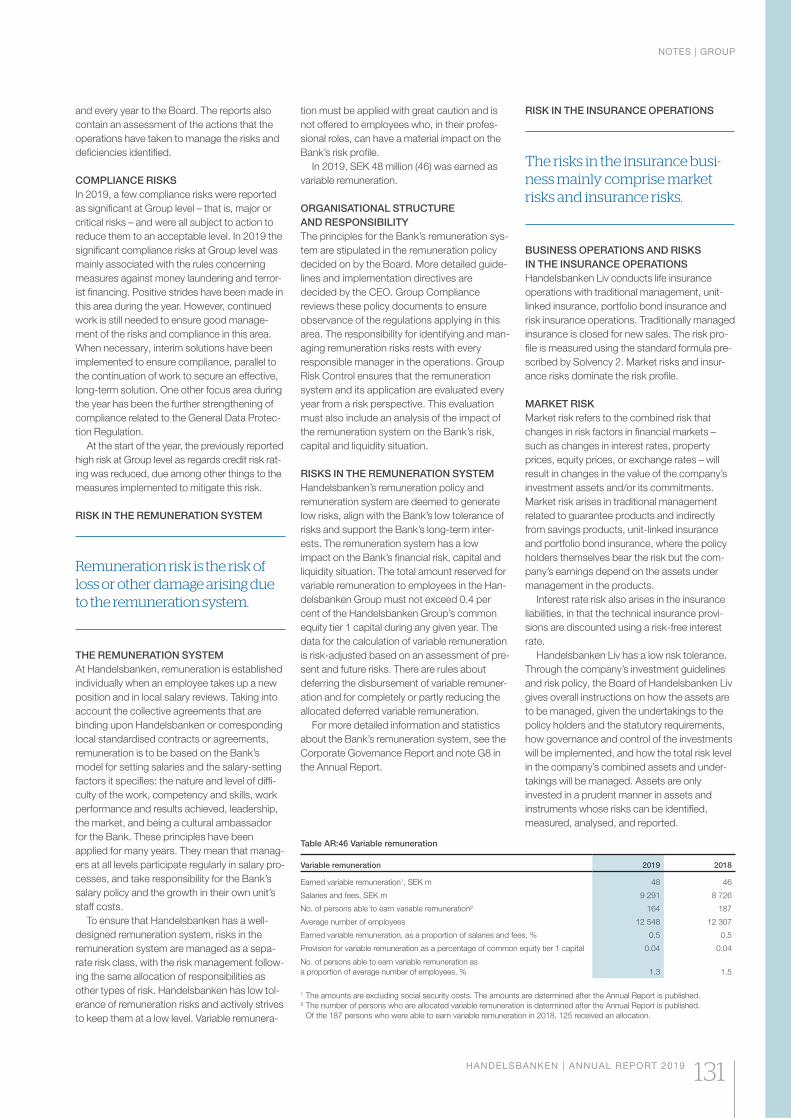
Table AR:46 Variable remuneration
Variable remuneration 2019 2018
Earned variable remuneration1, SEK m 48 46
Salaries and fees, SEK m 9 291 8 726
No. of persons able to earn variable remuneration² 164 187
Average number of employees 12 548 12 307
Earned variable remuneration, as a proportion of salaries and fees, % 0.5 0.5
Provision for variable remuneration as a percentage of common equity tier 1 capital 0.04 0.04
No. of persons able to earn variable remuneration as
a proportion of average number of employees, % 1.3 1.5
1 The amounts are excluding social security costs. The amounts are determined after the Annual Report is published.
² The number of persons who are allocated variable remuneration is determined after the Annual Report is published.
Of the 187 persons who were able to earn variable remuneration in 2018, 125 received an allocation.
tion must be applied with great caution and is
not offered to employees who, in their profes-
sional roles, can have a material impact on the
Bank’s risk profile.
In 2019, SEK 48 million (46) was earned as
variable remuneration.
ORGANISATIONAL STRUCTURE
AND RESPONSIBILITY
The principles for the Bank’s remuneration sys-
tem are stipulated in the remuneration policy
decided on by the Board. More detailed guide-
lines and implementation directives are
decided by the CEO. Group Compliance
reviews these policy documents to ensure
observance of the regulations applying in this
area. The responsibility for identifying and man-
aging remuneration risks rests with every
responsible manager in the operations. Group
Risk Control ensures that the remuneration
system and its application are evaluated every
year from a risk perspective. This evaluation
must also include an analysis of the impact of
the remuneration system on the Bank’s risk,
capital and liquidity situation.
RISKS IN THE REMUNERATION SYSTEM
Handelsbanken’s remuneration policy and
remuneration system are deemed to generate
low risks, align with the Bank’s low tolerance of
risks and support the Bank’s long-term inter-
ests. The remuneration system has a low
impact on the Bank’s financial risk, capital and
liquidity situation. The total amount reserved for
variable remuneration to employees in the Han-
delsbanken Group must not exceed 0.4 per
cent of the Handelsbanken Group’s common
equity tier 1 capital during any given year. The
data for the calculation of variable remuneration
is risk-adjusted based on an assessment of pre-
sent and future risks. There are rules about
deferring the disbursement of variable remuner-
ation and for completely or partly reducing the
allocated deferred variable remuneration.
For more detailed information and statistics
about the Bank’s remuneration system, see the
Corporate Governance Report and note G8 in
the Annual Report.
RISK IN THE INSURANCE OPERATIONS
The risks in the insurance busi-ness mainly comprise market risks and insurance risks.
BUSINESS OPERATIONS AND RISKS
IN THE INSURANCE OPERATIONS
Handelsbanken Liv conducts life insurance
operations with traditional management, unit-
linked insurance, portfolio bond insurance and
risk insurance operations. Traditionally managed
insurance is closed for new sales. The risk pro-
file is measured using the standard formula pre-
scribed by Solvency 2. Market risks and insur-
ance risks dominate the risk profile.
MARKET RISK
Market risk refers to the combined risk that
changes in risk factors in financial markets –
such as changes in interest rates, property
prices, equity prices, or exchange rates – will
result in changes in the value of the company’s
investment assets and/or its commitments.
Market risk arises in traditional management
related to guarantee products and indirectly
from savings products, unit-linked insurance
and portfolio bond insurance, where the policy
holders themselves bear the risk but the com-
pany’s earnings depend on the assets under
management in the products.
Interest rate risk also arises in the insurance
liabilities, in that the technical insurance provi-
sions are discounted using a risk-free interest
rate.
Handelsbanken Liv has a low risk tolerance.
Through the company’s investment guidelines
and risk policy, the Board of Handelsbanken Liv
gives overall instructions on how the assets are
to be managed, given the undertakings to the
policy holders and the statutory requirements,
how governance and control of the investments
will be implemented, and how the total risk level
in the company’s combined assets and under-
takings will be managed. Assets are only
invested in a prudent manner in assets and
instruments whose risks can be identified,
measured, analysed, and reported.
and every year to the Board. The reports also
contain an assessment of the actions that the
operations have taken to manage the risks and
deficiencies identified.
COMPLIANCE RISKS
In 2019, a few compliance risks were reported
as significant at Group level – that is, major or
critical risks – and were all subject to action to
reduce them to an acceptable level. In 2019 the
significant compliance risks at Group level was
mainly associated with the rules concerning
measures against money laundering and terror-
ist financing. Positive strides have been made in
this area during the year. However, continued
work is still needed to ensure good manage-
ment of the risks and compliance in this area.
When necessary, interim solutions have been
implemented to ensure compliance, parallel to
the continuation of work to secure an effective,
long-term solution. One other focus area during
the year has been the further strengthening of
compliance related to the General Data Protec-
tion Regulation.
At the start of the year, the previously reported
high risk at Group level as regards credit risk rat-
ing was reduced, due among other things to the
measures implemented to mitigate this risk.
RISK IN THE REMUNERATION SYSTEM
Remuneration risk is the risk of loss or other damage arising due to the remuneration system.
THE REMUNERATION SYSTEM
At Handelsbanken, remuneration is established
individually when an employee takes up a new
position and in local salary reviews. Taking into
account the collective agreements that are
binding upon Handelsbanken or corresponding
local standardised contracts or agreements,
remuneration is to be based on the Bank’s
model for setting salaries and the salary-setting
factors it specifies: the nature and level of diffi-
culty of the work, competency and skills, work
performance and results achieved, leadership,
the market, and being a cultural ambassador
for the Bank. These principles have been
applied for many years. They mean that manag-
ers at all levels participate regularly in salary pro-
cesses, and take responsibility for the Bank’s
salary policy and the growth in their own unit’s
staff costs.
To ensure that Handelsbanken has a well-
designed remuneration system, risks in the
remuneration system are managed as a sepa-
rate risk class, with the risk management follow-
ing the same allocation of responsibilities as
other types of risk. Handelsbanken has low tol-
erance of remuneration risks and actively strives
to keep them at a low level. Variable remunera-
NOTES | GROUP
HANDELSBANKEN | ANNUAL REPORT 2019 131
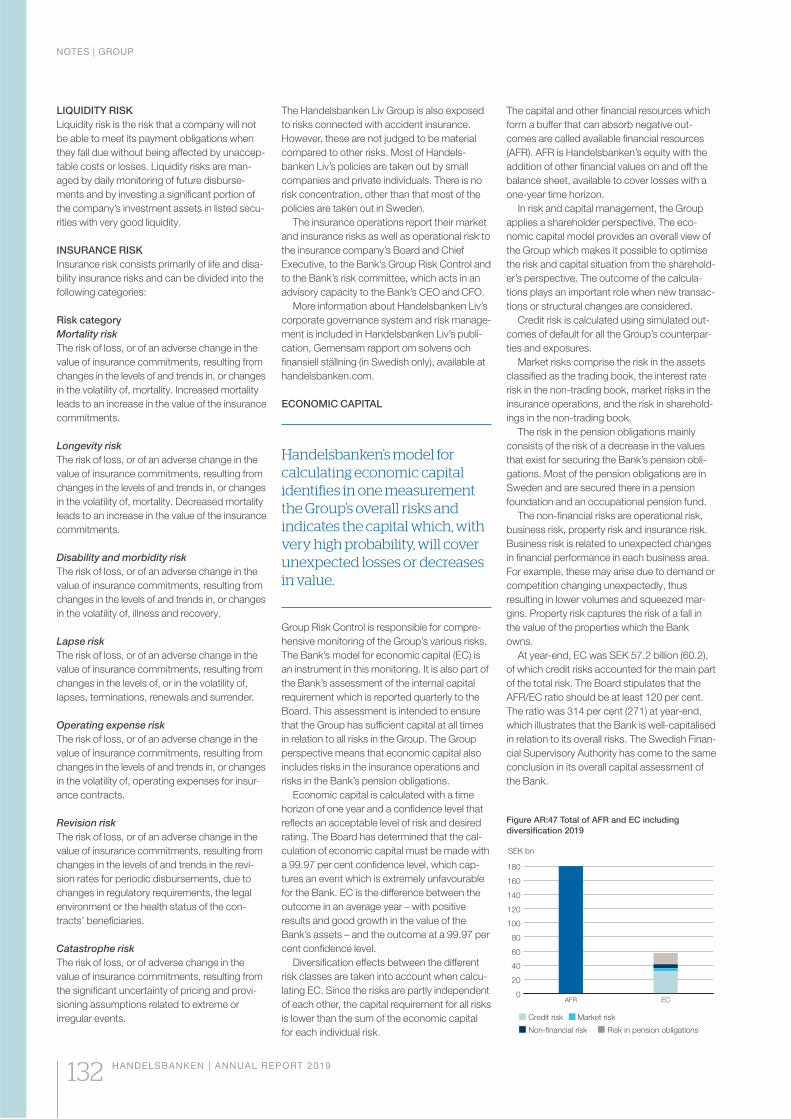
0
20
40
60
80
100
120
140
160
180
ECAFR
SEK bn
Credit risk Market risk
Non-financial risk Risk in pension obligations
Figure AR:47 Total of AFR and EC including
diversification 2019
LIQUIDITY RISK
Liquidity risk is the risk that a company will not
be able to meet its payment obligations when
they fall due without being affected by unaccep-
table costs or losses. Liquidity risks are man-
aged by daily monitoring of future disburse-
ments and by investing a significant portion of
the company’s investment assets in listed secu-
rities with very good liquidity.
INSURANCE RISK
Insurance risk consists primarily of life and disa-
bility insurance risks and can be divided into the
following categories:
Risk category
Mortality risk
The risk of loss, or of an adverse change in the
value of insurance commitments, resulting from
changes in the levels of and trends in, or changes
in the volatility of, mortality. Increased mortality
leads to an increase in the value of the insurance
commitments.
Longevity risk
The risk of loss, or of an adverse change in the
value of insurance commitments, resulting from
changes in the levels of and trends in, or changes
in the volatility of, mortality. Decreased mortality
leads to an increase in the value of the insurance
commitments.
Disability and morbidity risk
The risk of loss, or of an adverse change in the
value of insurance commitments, resulting from
changes in the levels of and trends in, or changes
in the volatility of, illness and recovery.
Lapse risk
The risk of loss, or of an adverse change in the
value of insurance commitments, resulting from
changes in the levels of, or in the volatility of,
lapses, terminations, renewals and surrender.
Operating expense risk
The risk of loss, or of an adverse change in the
value of insurance commitments, resulting from
changes in the levels of and trends in, or changes
in the volatility of, operating expenses for insur-
ance contracts.
Revision risk
The risk of loss, or of an adverse change in the
value of insurance commitments, resulting from
changes in the levels of and trends in the revi-
sion rates for periodic disbursements, due to
changes in regulatory requirements, the legal
environment or the health status of the con-
tracts’ beneficiaries.
Catastrophe risk
The risk of loss, or of adverse change in the
value of insurance commitments, resulting from
the significant uncertainty of pricing and provi-
sioning assumptions related to extreme or
irregular events.
The Handelsbanken Liv Group is also exposed
to risks connected with accident insurance.
However, these are not judged to be material
compared to other risks. Most of Handels-
banken Liv’s policies are taken out by small
companies and private individuals. There is no
risk concentration, other than that most of the
policies are taken out in Sweden.
The insurance operations report their market
and insurance risks as well as operational risk to
the insurance company’s Board and Chief
Executive, to the Bank’s Group Risk Control and
to the Bank’s risk committee, which acts in an
advisory capacity to the Bank’s CEO and CFO.
More information about Handelsbanken Liv’s
corporate governance system and risk manage-
ment is included in Handelsbanken Liv’s publi-
cation, Gemensam rapport om solvens och
finansiell ställning (in Swedish only), available at
handelsbanken.com.
ECONOMIC CAPITAL
Handelsbanken’s model for calculating economic capital identifies in one measurement the Group’s overall risks and indicates the capital which, with very high probability, will cover unexpected losses or decreases in value.
Group Risk Control is responsible for compre-
hensive monitoring of the Group’s various risks.
The Bank’s model for economic capital (EC) is
an instrument in this monitoring. It is also part of
the Bank’s assessment of the internal capital
requirement which is reported quarterly to the
Board. This assessment is intended to ensure
that the Group has sufficient capital at all times
in relation to all risks in the Group. The Group
perspective means that economic capital also
includes risks in the insurance operations and
risks in the Bank’s pension obligations.
Economic capital is calculated with a time
horizon of one year and a confidence level that
reflects an acceptable level of risk and desired
rating. The Board has determined that the cal-
culation of economic capital must be made with
a 99.97 per cent confidence level, which cap-
tures an event which is extremely unfavourable
for the Bank. EC is the difference between the
outcome in an average year – with positive
results and good growth in the value of the
Bank’s assets – and the outcome at a 99.97 per
cent confidence level.
Diversification effects between the different
risk classes are taken into account when calcu-
lating EC. Since the risks are partly independent
of each other, the capital requirement for all risks
is lower than the sum of the economic capital
for each individual risk.
The capital and other financial resources which
form a buffer that can absorb negative out-
comes are called available financial resources
(AFR). AFR is Handelsbanken’s equity with the
addition of other financial values on and off the
balance sheet, available to cover losses with a
one-year time horizon.
In risk and capital management, the Group
applies a shareholder perspective. The eco-
nomic capital model provides an overall view of
the Group which makes it possible to optimise
the risk and capital situation from the sharehold-
er’s perspective. The outcome of the calcula-
tions plays an important role when new transac-
tions or structural changes are considered.
Credit risk is calculated using simulated out-
comes of default for all the Group’s counterpar-
ties and exposures.
Market risks comprise the risk in the assets
classified as the trading book, the interest rate
risk in the non-trading book, market risks in the
insurance operations, and the risk in sharehold-
ings in the non-trading book.
The risk in the pension obligations mainly
consists of the risk of a decrease in the values
that exist for securing the Bank’s pension obli-
gations. Most of the pension obligations are in
Sweden and are secured there in a pension
foundation and an occupational pension fund.
The non-financial risks are operational risk,
business risk, property risk and insurance risk.
Business risk is related to unexpected changes
in financial performance in each business area.
For example, these may arise due to demand or
competition changing unexpectedly, thus
resulting in lower volumes and squeezed mar-
gins. Property risk captures the risk of a fall in
the value of the properties which the Bank
owns.
At year-end, EC was SEK 57.2 billion (60.2),
of which credit risks accounted for the main part
of the total risk. The Board stipulates that the
AFR/EC ratio should be at least 120 per cent.
The ratio was 314 per cent (271) at year-end,
which illustrates that the Bank is well-capitalised
in relation to its overall risks. The Swedish Finan-
cial Supervisory Authority has come to the same
conclusion in its overall capital assessment of
the Bank.
NOTES | GROUP
132 HANDELSBANKEN | ANNUAL REPORT 2019
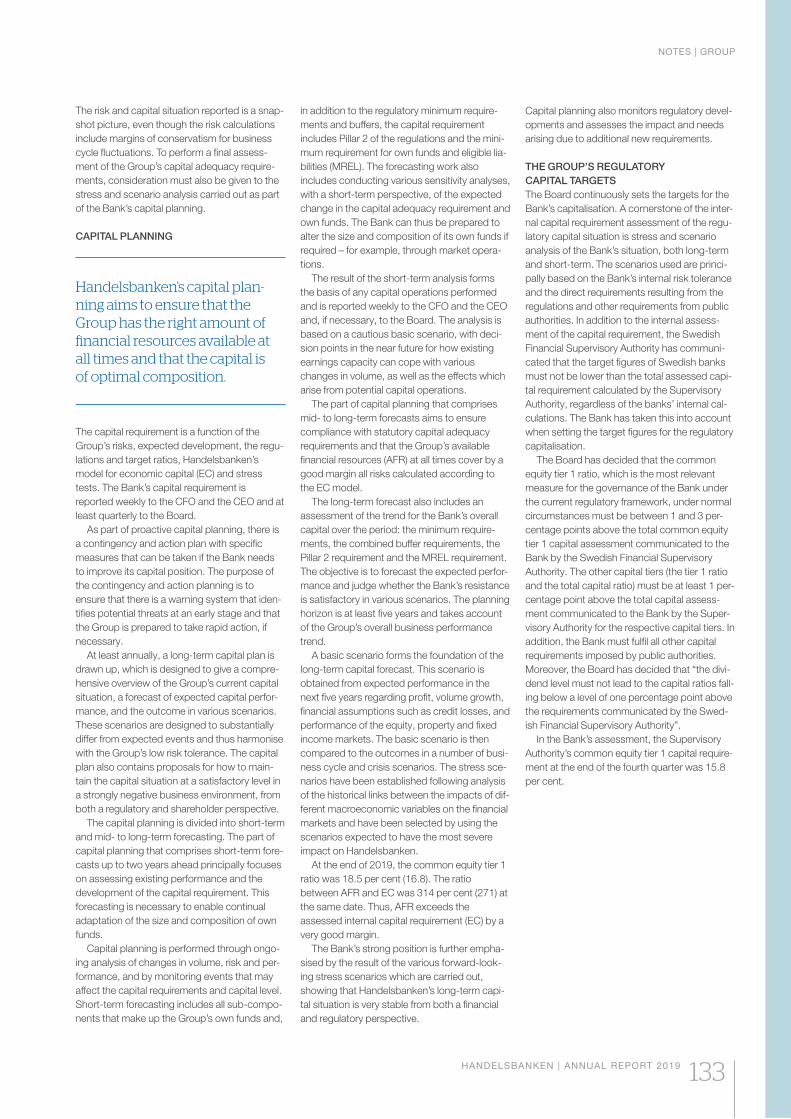
The risk and capital situation reported is a snap-
shot picture, even though the risk calculations
include margins of conservatism for business
cycle fluctuations. To perform a final assess-
ment of the Group’s capital adequacy require-
ments, consideration must also be given to the
stress and scenario analysis carried out as part
of the Bank’s capital planning.
CAPITAL PLANNING
Handelsbanken’s capital plan-ning aims to ensure that the Group has the right amount of financial resources available at all times and that the capital is of optimal composition.
The capital requirement is a function of the
Group’s risks, expected development, the regu-
lations and target ratios, Handelsbanken’s
model for economic capital (EC) and stress
tests. The Bank’s capital requirement is
reported weekly to the CFO and the CEO and at
least quarterly to the Board.
As part of proactive capital planning, there is
a contingency and action plan with specific
measures that can be taken if the Bank needs
to improve its capital position. The purpose of
the contingency and action planning is to
ensure that there is a warning system that iden-
tifies potential threats at an early stage and that
the Group is prepared to take rapid action, if
necessary.
At least annually, a long-term capital plan is
drawn up, which is designed to give a compre-
hensive overview of the Group’s current capital
situation, a forecast of expected capital perfor-
mance, and the outcome in various scenarios.
These scenarios are designed to substantially
differ from expected events and thus harmonise
with the Group’s low risk tolerance. The capital
plan also contains proposals for how to main-
tain the capital situation at a satisfactory level in
a strongly negative business environment, from
both a regulatory and shareholder perspective.
The capital planning is divided into short-term
and mid- to long-term forecasting. The part of
capital planning that comprises short-term fore-
casts up to two years ahead principally focuses
on assessing existing performance and the
development of the capital requirement. This
forecasting is necessary to enable continual
adaptation of the size and composition of own
funds.
Capital planning is performed through ongo-
ing analysis of changes in volume, risk and per-
formance, and by monitoring events that may
affect the capital requirements and capital level.
Short-term forecasting includes all sub-compo-
nents that make up the Group’s own funds and,
in addition to the regulatory minimum require-
ments and buffers, the capital requirement
includes Pillar 2 of the regulations and the mini-
mum requirement for own funds and eligible lia-
bilities (MREL). The forecasting work also
includes conducting various sensitivity analyses,
with a short-term perspective, of the expected
change in the capital adequacy requirement and
own funds. The Bank can thus be prepared to
alter the size and composition of its own funds if
required – for example, through market opera-
tions.
The result of the short-term analysis forms
the basis of any capital operations performed
and is reported weekly to the CFO and the CEO
and, if necessary, to the Board. The analysis is
based on a cautious basic scenario, with deci-
sion points in the near future for how existing
earnings capacity can cope with various
changes in volume, as well as the effects which
arise from potential capital operations.
The part of capital planning that comprises
mid- to long-term forecasts aims to ensure
compliance with statutory capital adequacy
requirements and that the Group’s available
financial resources (AFR) at all times cover by a
good margin all risks calculated according to
the EC model.
The long-term forecast also includes an
assessment of the trend for the Bank’s overall
capital over the period: the minimum require-
ments, the combined buffer requirements, the
Pillar 2 requirement and the MREL requirement.
The objective is to forecast the expected perfor-
mance and judge whether the Bank’s resistance
is satisfactory in various scenarios. The planning
horizon is at least five years and takes account
of the Group’s overall business performance
trend.
A basic scenario forms the foundation of the
long-term capital forecast. This scenario is
obtained from expected performance in the
next five years regarding profit, volume growth,
financial assumptions such as credit losses, and
performance of the equity, property and fixed
income markets. The basic scenario is then
compared to the outcomes in a number of busi-
ness cycle and crisis scenarios. The stress sce-
narios have been established following analysis
of the historical links between the impacts of dif-
ferent macroeconomic variables on the financial
markets and have been selected by using the
scenarios expected to have the most severe
impact on Handelsbanken.
At the end of 2019, the common equity tier 1
ratio was 18.5 per cent (16.8). The ratio
between AFR and EC was 314 per cent (271) at
the same date. Thus, AFR exceeds the
assessed internal capital requirement (EC) by a
very good margin.
The Bank’s strong position is further empha-
sised by the result of the various forward-look-
ing stress scenarios which are carried out,
showing that Handelsbanken’s long-term capi-
tal situation is very stable from both a financial
and regulatory perspective.
Capital planning also monitors regulatory devel-
opments and assesses the impact and needs
arising due to additional new requirements.
THE GROUP’S REGULATORY
CAPITAL TARGETS
The Board continuously sets the targets for the
Bank’s capitalisation. A cornerstone of the inter-
nal capital requirement assessment of the regu-
latory capital situation is stress and scenario
analysis of the Bank’s situation, both long-term
and short-term. The scenarios used are princi-
pally based on the Bank’s internal risk tolerance
and the direct requirements resulting from the
regulations and other requirements from public
authorities. In addition to the internal assess-
ment of the capital requirement, the Swedish
Financial Supervisory Authority has communi-
cated that the target figures of Swedish banks
must not be lower than the total assessed capi-
tal requirement calculated by the Supervisory
Authority, regardless of the banks’ internal cal-
culations. The Bank has taken this into account
when setting the target figures for the regulatory
capitalisation.
The Board has decided that the common
equity tier 1 ratio, which is the most relevant
measure for the governance of the Bank under
the current regulatory framework, under normal
circumstances must be between 1 and 3 per-
centage points above the total common equity
tier 1 capital assessment communicated to the
Bank by the Swedish Financial Supervisory
Authority. The other capital tiers (the tier 1 ratio
and the total capital ratio) must be at least 1 per-
centage point above the total capital assess-
ment communicated to the Bank by the Super-
visory Authority for the respective capital tiers. In
addition, the Bank must fulfil all other capital
requirements imposed by public authorities.
Moreover, the Board has decided that “the divi-
dend level must not lead to the capital ratios fall-
ing below a level of one percentage point above
the requirements communicated by the Swed-
ish Financial Supervisory Authority”.
In the Bank’s assessment, the Supervisory
Authority’s common equity tier 1 capital require-
ment at the end of the fourth quarter was 15.8
per cent.
NOTES | GROUP
HANDELSBANKEN | ANNUAL REPORT 2019 133
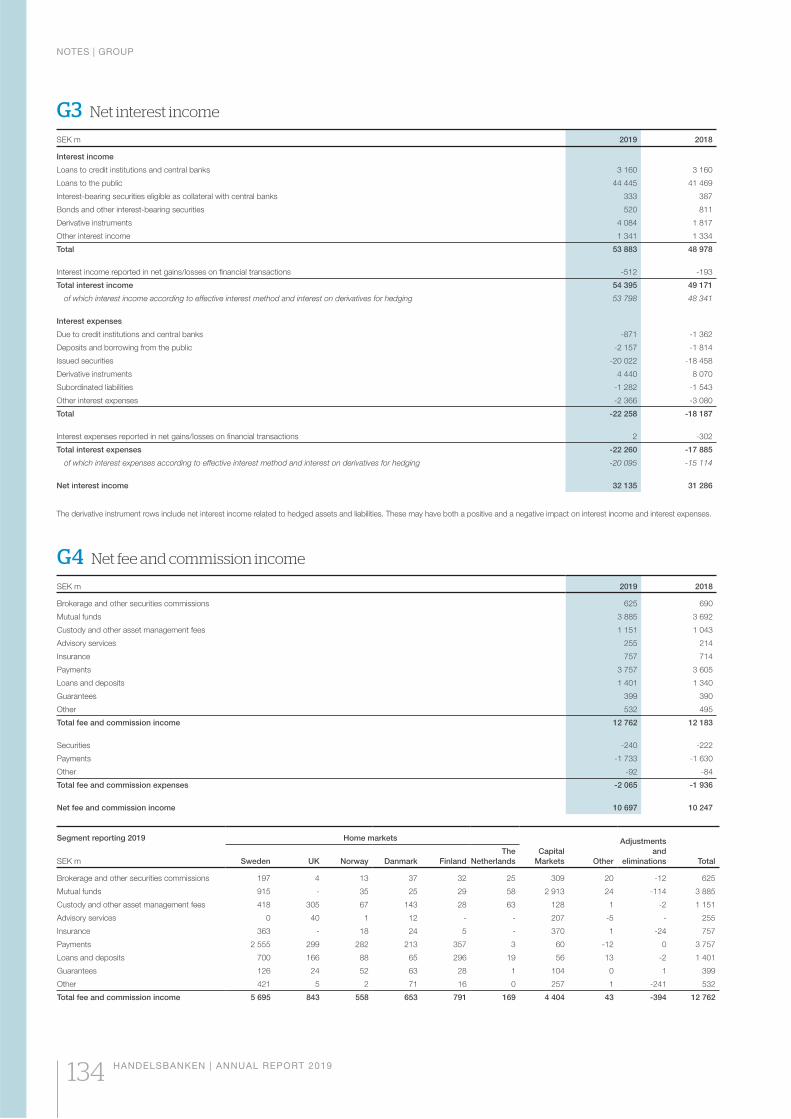
G3 Net interest income
SEK m 2019 2018
Interest income
Loans to credit institutions and central banks 3 160 3 160
Loans to the public 44 445 41 469
Interest-bearing securities eligible as collateral with central banks 333 387
Bonds and other interest-bearing securities 520 811
Derivative instruments 4 084 1 817
Other interest income 1 341 1 334
Total 53 883 48 978
Interest income reported in net gains/losses on financial transactions -512 -193
Total interest income 54 395 49 171
of which interest income according to effective interest method and interest on derivatives for hedging 53 798 48 341
Interest expenses
Due to credit institutions and central banks -871 -1 362
Deposits and borrowing from the public -2 157 -1 814
Issued securities -20 022 -18 458
Derivative instruments 4 440 8 070
Subordinated liabilities -1 282 -1 543
Other interest expenses -2 366 -3 080
Total -22 258 -18 187
Interest expenses reported in net gains/losses on financial transactions 2 -302
Total interest expenses -22 260 -17 885
of which interest expenses according to effective interest method and interest on derivatives for hedging -20 095 -15 114
Net interest income 32 135 31 286
The derivative instrument rows include net interest income related to hedged assets and liabilities. These may have both a positive and a negative impact on interest income and interest expenses.
G4 Net fee and commission income
SEK m 2019 2018
Brokerage and other securities commissions 625 690
Mutual funds 3 885 3 692
Custody and other asset management fees 1 151 1 043
Advisory services 255 214
Insurance 757 714
Payments 3 757 3 605
Loans and deposits 1 401 1 340
Guarantees 399 390
Other 532 495
Total fee and commission income 12 762 12 183
Securities -240 -222
Payments -1 733 -1 630
Other -92 -84
Total fee and commission expenses -2 065 -1 936
Net fee and commission income 10 697 10 247
Segment reporting 2019
SEK m
Home markets
Capital
Markets Other
Adjustments
and
eliminations TotalSweden UK Norway Danmark Finland
The
Netherlands
Brokerage and other securities commissions 197 4 13 37 32 25 309 20 -12 625
Mutual funds 915 - 35 25 29 58 2 913 24 -114 3 885
Custody and other asset management fees 418 305 67 143 28 63 128 1 -2 1 151
Advisory services 0 40 1 12 - - 207 -5 - 255
Insurance 363 - 18 24 5 - 370 1 -24 757
Payments 2 555 299 282 213 357 3 60 -12 0 3 757
Loans and deposits 700 166 88 65 296 19 56 13 -2 1 401
Guarantees 126 24 52 63 28 1 104 0 1 399
Other 421 5 2 71 16 0 257 1 -241 532
Total fee and commission income 5 695 843 558 653 791 169 4 404 43 -394 12 762
NOTES | GROUP
134 HANDELSBANKEN | ANNUAL REPORT 2019
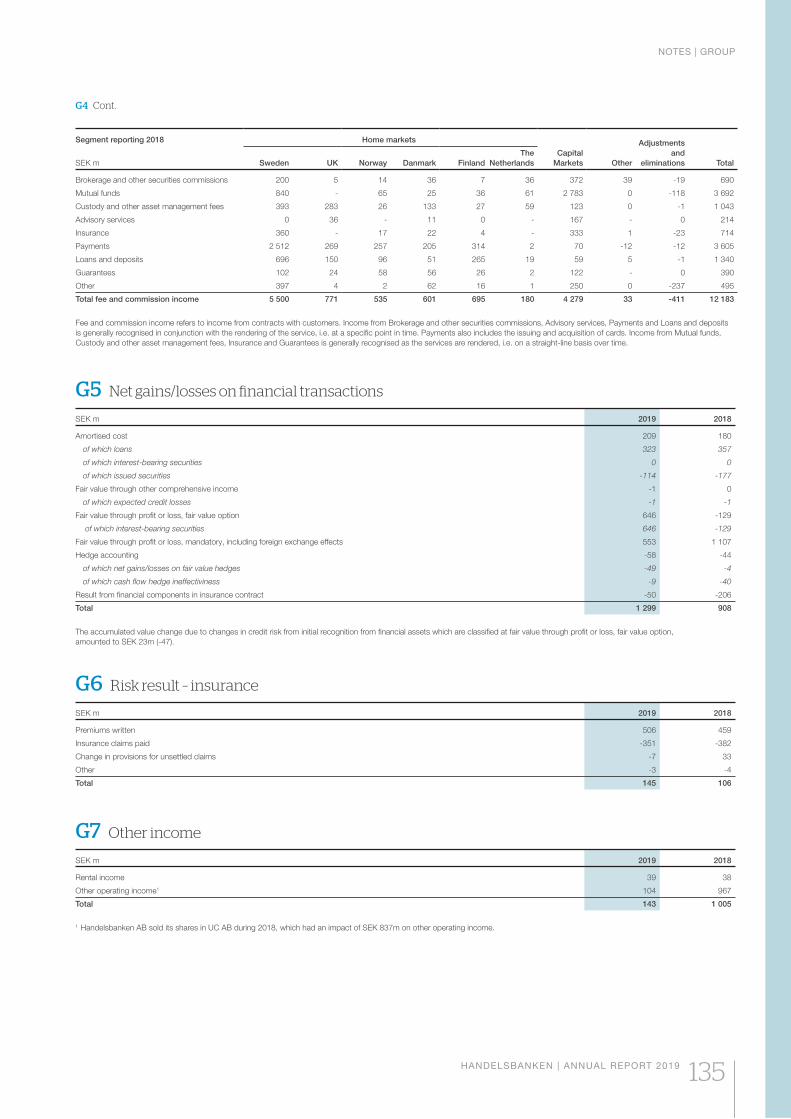
G5 Net gains/losses on financial transactions
SEK m 2019 2018
Amortised cost 209 180
of which loans 323 357
of which interest-bearing securities 0 0
of which issued securities -114 -177
Fair value through other comprehensive income -1 0
of which expected credit losses -1 -1
Fair value through profit or loss, fair value option 646 -129
of which interest-bearing securities 646 -129
Fair value through profit or loss, mandatory, including foreign exchange effects 553 1 107
Hedge accounting -58 -44
of which net gains/losses on fair value hedges -49 -4
of which cash flow hedge ineffectiviness -9 -40
Result from financial components in insurance contract -50 -206
Total 1 299 908
The accumulated value change due to changes in credit risk from initial recognition from financial assets which are classified at fair value through profit or loss, fair value option,
amounted to SEK 23m (-47).
G6 Risk result – insurance
SEK m 2019 2018
Premiums written 506 459
Insurance claims paid -351 -382
Change in provisions for unsettled claims -7 33
Other -3 -4
Total 145 106
G7 Other income
SEK m 2019 2018
Rental income 39 38
Other operating income1 104 967
Total 143 1 005
1 Handelsbanken AB sold its shares in UC AB during 2018, which had an impact of SEK 837m on other operating income.
Segment reporting 2018
SEK m
Home markets
Capital
Markets Other
Adjustments
and
eliminations TotalSweden UK Norway Danmark Finland
The
Netherlands
Brokerage and other securities commissions 200 5 14 36 7 36 372 39 -19 690
Mutual funds 840 - 65 25 36 61 2 783 0 -118 3 692
Custody and other asset management fees 393 283 26 133 27 59 123 0 -1 1 043
Advisory services 0 36 - 11 0 - 167 - 0 214
Insurance 360 - 17 22 4 - 333 1 -23 714
Payments 2 512 269 257 205 314 2 70 -12 -12 3 605
Loans and deposits 696 150 96 51 265 19 59 5 -1 1 340
Guarantees 102 24 58 56 26 2 122 - 0 390
Other 397 4 2 62 16 1 250 0 -237 495
Total fee and commission income 5 500 771 535 601 695 180 4 279 33 -411 12 183
Fee and commission income refers to income from contracts with customers. Income from Brokerage and other securities commissions, Advisory services, Payments and Loans and deposits
is generally recognised in conjunction with the rendering of the service, i.e. at a specific point in time. Payments also includes the issuing and acquisition of cards. Income from Mutual funds,
Custody and other asset management fees, Insurance and Guarantees is generally recognised as the services are rendered, i.e. on a straight-line basis over time.
G4 Cont.
NOTES | GROUP
HANDELSBANKEN | ANNUAL REPORT 2019 135
G8 Staff costs
SEK m 2019 2018
Salaries and fees -9 291 -8 726
Social security costs -2 178 -2 069
Pension costs¹ -1 939 -1 397
Provision for the profit-sharing scheme 829 -859
Other staff costs -970 -414
Total -13 549 -13 465
1 The components in the reported pension costs are shown in the Pension costs table.
Salaries and fees
SEK m 2019 2018
Executive officers2 -144 -146
Others -9 147 -8 580
Total -9 291 -8 726
2 Executive officers and Board members in the parent company and CEOs, Deputy CEOs and
Board members in subsidiaries (on average 53 people).
Remuneration³ exceeding EUR 1 million
No. of persons 2019 2018
Range EUR 1.0 – 1.5m 5 2
Range EUR 1.5 – 2.0m - -
Range EUR 2.0 – 2.5m 2 2
Range EUR exceeding 2.5m - -
Total 7 4
3 Including earned pension and other salary benefits.
Average number
of employees 2019 Men Women 2018 Men Women
Sweden 7 394 3 532 3 862 7 262 3 483 3 779
UK 2 442 1 371 1 071 2 319 1 339 980
Norway 777 412 365 771 411 360
Denmark 651 334 317 659 329 330
Finland 617 273 344 635 273 362
The Netherlands 336 225 111 313 215 98
USA 62 41 21 66 44 22
China 80 30 50 75 28 47
Luxembourg 46 26 20 52 30 22
Singapore 30 11 19 33 11 22
Germany 38 19 19 42 21 21
Poland 33 11 22 36 14 22
Other countries 42 14 28 44 18 26
Total 12 548 6 299 6 249 12 307 6 216 6 091
Gender distribution 2019 2018
% Men Women Men Women
Executive officers excluding Boards 70 30 62 38
Of which in parent company 67 33 62 38
Of which in subsidiaries 71 29 62 38
Boards 68 32 64 36
Of which in parent company 55 45 64 36
Of which in subsidiaries 70 30 65 35
EMPLOYEE BENEFITS
Information about remuneration principles to
all employees in the Handelsbanken Group
is provided in more detail in the Corporate
Governance Report on page 72.
Pursuant to the Swedish Financial Super-
visory Authority’s directive FFFS 2011:1 and the
European Commission Delegated Regulations
(EU) 575/2013 and (EU) 604/2014, banks must
identify employees whose professional activities
have a material impact on the bank’s risk profile.
Handelsbanken has identified 1,163 (1,172)
employees who engage in such activities and
has designated them as ‘risk-takers’. The tables
below present the Handelsbanken Group’s
remuneration to these risk-takers pursuant to
the disclosure requirements in the aforemen-
tioned regulations. In 2019, the Handelsbanken
Group had no risk-takers who earned variable
remuneration.
In 2018, a provision of SEK 859 million was
made for the Oktogonen profit-sharing scheme,
which was reversed by the Board in March 2019
on the basis of an overall assessment of the
Bank’s performance. The reversed provision
was first reported in Q1 2019.
REMUNERATION TO EXECUTIVE OFFICERS
Executive officers in Handelsbanken are Board
members, members of executive management,
Deputy CEOs and the Heads of Group Risk
Control and Group Compliance. Refer also to
pages 74-76 of the Corporate Governance
Report. The remuneration to executive officers
of the parent company is in accordance with the
guidelines for remuneration established by the
2019 annual general meeting (AGM). See also
page 72.
Information regarding remuneration to, pen-
sion obligations for, credits to and deposits from
executive officers of Handelsbanken is provided
on these pages. This also applies to the subsidi-
aries’ CEOs, Deputy CEOs and Board members.
Remuneration to executive officers of the
Handelsbanken Group is paid only in the form of
fixed salary and pension provisions, as well as
customary benefits such as a company car.
Following a special Board decision, the Bank
can provide housing as part of the remunera-
tion. No variable remuneration is paid. Executive
officers who are employees of the Bank are
included in Handelsbanken’s profit-sharing
scheme Oktogonen and are entitled to convert
salary to pension on the same conditions as all
employees.
Board members who are not employees of
the Bank or any of the Bank’s subsidiaries have
only received a fee according to the decision of
the AGM.
Board members who are employees of the
Bank or the Bank’s subsidiaries receive remu-
neration and pension benefits by virtue of their
employment. No further remuneration or pen-
sion benefits are paid for serving on the Board.
Information regarding fees to board members in
the parent company are shown on pages 74-75
of the Corporate Governance Report.
The pension cost stated by the Bank in the
remuneration information for executive officers
below consists of the service cost relating to
defined benefit pensions according to IAS 19,
the agreed premiums for defined contribution
pensions, and any pension premiums that have
been sacrificed from salary.
The CEO’s remuneration and pension terms
The Chief Executive, Carina Åkerström, who
took on the role in conjunction with the 2019
AGM, earned a fixed salary of SEK 9.1 million
during the period 27 March to 31 December.
Other salary benefits are SEK 0.2 million and
the pension cost was SEK 3.2 million. The Chief
Executive is a member of the defined contribu-
tion pension scheme, with the contribution
amounting to 35 per cent of her fixed salary.
The former CEO of the parent company,
Anders Bouvin, earned a fixed salary of SEK 3.4
million (13.2) during the period until 27 March.
His other salary benefits were SEK 0.2 million
(0.5) and the pension cost, in the form of defined
contribution pension, was SEK 1.2 million (8.0).
For the period from 27 March until his retirement
date of 31 August, Anders Bouvin received a
fixed salary of SEK 5.6 million and other salary
benefits of SEK 0.3 million. The defined contri-
bution pension cost was SEK 2.0 million.
Remuneration and pension terms for other
executive officers in the parent company
Pension terms
Three (3) of the Bank’s other executive officers,
employed in the parent company, receive a
defined benefit retirement pension of a maxi-
mum of 65 per cent of their salary at the time
of retirement, and also a pension premium of
NOTES | GROUP
136 HANDELSBANKEN | ANNUAL REPORT 2019
Remuneration¹ to risk-takers², business segments
SEK m
2019 2018
Remuneration No. of persons Remuneration No. of persons
Handelsbanken Sweden 510 437 509 456
Handelsbanken UK 459 290 455 296
Handelsbanken Norway 131 62 121 68
Handelsbanken Denmark 114 73 109 72
Handelsbanken Finland 74 50 84 65
Handelsbanken the Netherlands 78 49 67 48
Handelsbanken Capital Markets 153 36 180 44
Other 400 166 296 123
Total 1 919 1 163 1 821 1 172
Remuneration¹ to risk-takers² 2019 2018
Executive
management³
Other
risk-takers
Executive
management³
Other
risk-takers
Earned fixed remuneration, SEK m 74 1 845 111 1 710
Earned variable remuneration, SEK m - - - -
Total 74 1 845 111 1 710
No. of persons with fixed remuneration only 12 1 151 14 1 158
No. of persons who may receive both fixed and variable remuneration - - 0 0
Total number of persons 12 1 151 14 1 158
Guaranteed variable remuneration recognised as an expense in connection with new employment, SEK m - - - -
Contracted guaranteed variable remuneration recognised as an expense in connection with new
employment, SEK m - - - -
1 Earned remuneration, including pensions and other salary benefits, has been recognised as an expense in its entirety. No risk-takers earned variable remuneration in either 2019 or 2018.
Variable remuneration is allocated at an individual level during the financial year after it is earned and is disbursed or deferred in accordance with the Bank’s policy for variable remuneration.
In 2018, SEK 6m (5) in variable remuneration earned before 2017 was disbursed to risk-takers. The closing balance of deferred remuneration was SEK 2m (8). The right of disposal of the
deferred remuneration transfers to the employees at the time of disbursement. All variable remuneration is paid in cash. The amounts are excluding social security costs. During the year,
SEK 40m (16) in termination benefits was paid to 15 (7) risk-takers. Total contracted termination benefits during the year amount to SEK 47m (17), with the highest individual amount being
SEK 9.5m (8). No guaranteed variable remuneration is paid.2 Employees whose duties can have a material impact on the Bank’s risk profile pursuant to the Commission Delegated Regulation (EU) 604/2014). There may be risk-takers or other specially
regulated employees with variable remuneration in subsidiaries whose remuneration policy is subject to other EU regulations or other regulations published by the Swedish Financial Supervi-
sory Authority.3 The Swedish Financial Supervisory Authority uses the term ‘Senior Management’ in its regulations FFFS 2011:1. At Handelsbanken, this corresponds to the Bank’s executive officers.
a maximum of two per cent of their salary. Their
minimum retirement age is 60* and the defined
benefit retirement pension is earned succes-
sively during the period of employment; it is fully
earned for these persons by the time they reach
the age of retirement.
Eight (9) executive officers receive a defined
contribution pension, with 65 as the age of
retirement. The premium is individual and is a
maximum of 35 per cent of the salary. In addi-
tion to this contribution, six (6) of these individu-
als are members of a collectively agreed occu-
pational BTP and BTPK pension scheme.
An accrued defined benefit pension is vested
and secured in the Bank’s pension foundation
or assured in the Bank’s pension fund. If ser-
vice ceases before retirement age, the person
receives a paid-up policy for the defined benefit
and/or defined contribution pension earned.
Remuneration
Deputy CEO Per Beckman earned a fixed salary
of SEK 5.9 million (5.8) during the year. Other
salary benefits are SEK 0.3 million (0.3) and the
pension cost was SEK 3.8 million (3.6), corre-
sponding to 64.5 per cent (62.5) of the salary.
During the year, other executive officers, an
average of 10 individuals (13), received fixed
salary, after conversion to pension, amounting
to SEK 46.7 million (61.1). Other salary benefits
were SEK 3.0 million (6.6) and the Bank’s pen-
sion cost was SEK 17.7 million (23.0). Before
conversion to pension, the pension cost was
SEK 16.8 million (23.0), corresponding to 35.3
per cent of the salary (37.6).
Fees for serving on the boards of other com-
panies on behalf of the Bank have been paid to
the Bank.
Remuneration in subsidiaries
Fees paid to the 17 (18) board members of
subsidiaries who are not employees of the Bank
or its subsidiaries are SEK 5.4 million (4.2).
In 2019, the CEOs and Deputy CEOs in the
subsidiaries, 16 (17) individuals, received fixed
salaries after conversion to pension amounting
to SEK 57.9 million (47.6). Other salary benefits
were SEK 4.5 million (2.2) and the Bank’s pen-
sion cost was SEK 10.9 million (9.8). Before
conversion to pension, the pension cost was
SEK 10.6 million (9.5), corresponding to 18.2
per cent of the salary (19.8).
Remuneration is not paid to CEOs and Deputy
CEOs in subsidiaries who have other main work
tasks at Handelsbanken.
PENSION OBLIGATIONS
TO EXECUTIVE OFFICERS
As at 31 December 2019, the pension
obligation** for the CEO Carina Åkerström,
earned before she took up the position of CEO
and now placed in a paid-up policy, was SEK
94.2 million (92.7). As at 31 December 2019,
the pension obligation for the Deputy CEO
Per Beckman was SEK 113.9 million (102.3),
and for the other executive officers in the parent
company – 10 individuals (11) – pension
obligations were SEK 181.5 million (260.4).
* In new pension terms entered into after 1 January 2012, the
age of retirement is 65.
** Pension obligations are amounts which, in accordance with
IAS 19, the Bank reserves for payment of future defined
benefit pensions. The size of the amounts depends on
financial and demographic assumptions which may change
from year to year
G8 Cont.
NOTES | GROUP
HANDELSBANKEN | ANNUAL REPORT 2019 137
G8 Cont.
Net pension obligations
SEK m 2019 2018
Pension obligations 35 724 31 969
Fair value of plan assets 36 378 28 743
Net pensions 654 -3 226
In addition to the defined benefit obligation and plan assets in the above table, provisions have
been made in the years 1989-2004 to Svenska Handelsbankens Pensionsstiftelse (pension
foundation) to a special supplementary pension (SKP). This includes plan assets whose mar-
ket value amounts to SEK 10,072m (10,458). SKP entails a commitment by the Bank amoun-
ting to the same amount as the plan assets.
Part of the commitment, SEK 7,631m (7,919), is conditional.
As of 1 March 2018, all new pension earnings in the UK are placed in a defined contribution
plan. Staff in the UK employed before 1 January 2006 were part of a defined benefit pension
scheme, which closed for the accrual of further benefits from 28 February 2018, with the defi-
ned benefit pension accrued until that date remaining a part of the Bank’s pension obligations.
The result of the transition from a defined benefit plan to new earnings in a defined contribution
plan was that pension obligations in the UK decreased by SEK 144m as at 31 December 2018.
As of 1 April 2017, all new pension earnings in Norway are placed in a defined contribution
plan. The defined benefit pension plan in Norway was closed on this date. As a result of this
closure, pension obligations in Norway decreased by SEK 52m as at 31 December 2018.
Pension costs
SEK m 2019 2018
Service cost -885 -842
Past service cost¹ - 166
Interest on pension obligations -664 -681
Interest on plan assets 596 703
Gains and losses from settlements and
curtailments - 58
Social security costs, defined benefit plans 0 4
Pension costs, defined benefit plans -954 -592
Pension costs, defined contribution plans -831 -767
Social security costs, defined contribution plans -154 -38
Total pension costs -1 939 -1 397
1 The final termination of the Norwegian defined benefit scheme during 2018 had a positive
effect on pension costs of SEK 26m as at 31 December 2018.
The transition to a defined contribution scheme in the UK during 2018 had a positive effect on
pension costs of SEK 144m as at 31 December 2018.
Pension obligations
SEK m 2019 2018
Opening balance 31 969 30 455
Service cost 885 838
Past service cost1 - -196
Interest on pension obligations 664 681
Paid benefits -965 -947
Gains and losses from settlements and
curtailments - -58
Actuarial gains (-)/losses (+) 2 980 1 107
Foreign exchange effect 191 89
Closing balance 35 724 31 969
Plan assets
SEK m 2019 2018
Opening balance 28 743 31 694
Past service cost - -30
Interest on plan assets 596 703
Funds contributed by the employer 535 542
Compensation to employer -498 -480
Gains and losses from settlements and
curtailments - -
Funds paid directly to employees -424 -420
Actuarial gains (+)/losses (-) 7 248 -3 309
Foreign exchange effect 178 43
Closing balance 36 378 28 743
Return on plan assets
SEK m 2019 2018
Interest on plan assets 596 703
Actuarial gains (+)/losses (-) 7 248 -3 309
Actual return 7 844 -2 606
Allocation of plan assets
SEK m 2019 2018
Shares and fund shares on an active market2 32 968 25 908
Shares not listed on an active market 513 348
Interest-bearing securities listed on an active
market 2 049 2 185
Interest-bearing securities not listed on an active
market - -
Other plan assets 848 302
Total 36 378 28 743
2 The fund shares are entirely invested in fixed income funds and amount to SEK 8,798m (3,145).
The plan assets include shares in Svenska Handelsbanken AB (publ) with a market value of
SEK 118m (115) on the balance sheet date 31 December 2019. Bonds issued by Svenska
Handelsbanken AB (publ) are included with a market value of SEK -m (439). Other plan assets
include a liability for compensation that has not yet been paid out from the pension foundation.
these persons for deposits in the parent com-
pany was SEK 2.1 million (1.5).
As at 31 December 2019, credits to execu-
tive officers in the subsidiaries in the Handels-
banken Group were SEK 100.1 million (123.5).
Credit and deposit terms for executive offic-
ers employed in the Handelsbanken Group are
in line with the principles applicable for all other
employees of the Handelsbanken Group. All
credits are subject to a credit assessment.
PENSIONS
Pension obligations in the Handelsbanken
Group for all current and former executive
officers were SEK 3,129 million (3,022) as at
31 December 2019, of which pension obliga-
tions for all current and former executive officers
in the parent company were SEK 2,936 million
(2,847) as of the same date. The number of
people covered by these obligations in the
Group is 84 (82), of whom 63 (60) are pension-
ers. The corresponding number for the par-
ent company is 69 (67), of whom 57 (54) are
pensioners.
CREDITS TO AND DEPOSITS FROM
EXECUTIVE OFFICERS
As at 31 December 2019, credits to executive
officers were SEK 9.3 million (64.3) in the parent
company and SEK 95.3 million (93.9) in the sub-
sidiaries. Deposits in the parent company from
these persons totalled SEK 702.3 million
(458.0). In 2019, the Bank’s interest income
from these persons for credits totalled SEK 0.3
million (0.2) in the parent company and SEK 1.2
million (1.2) in the subsidiaries. Interest paid to
NOTES | GROUP
138 HANDELSBANKEN | ANNUAL REPORT 2019
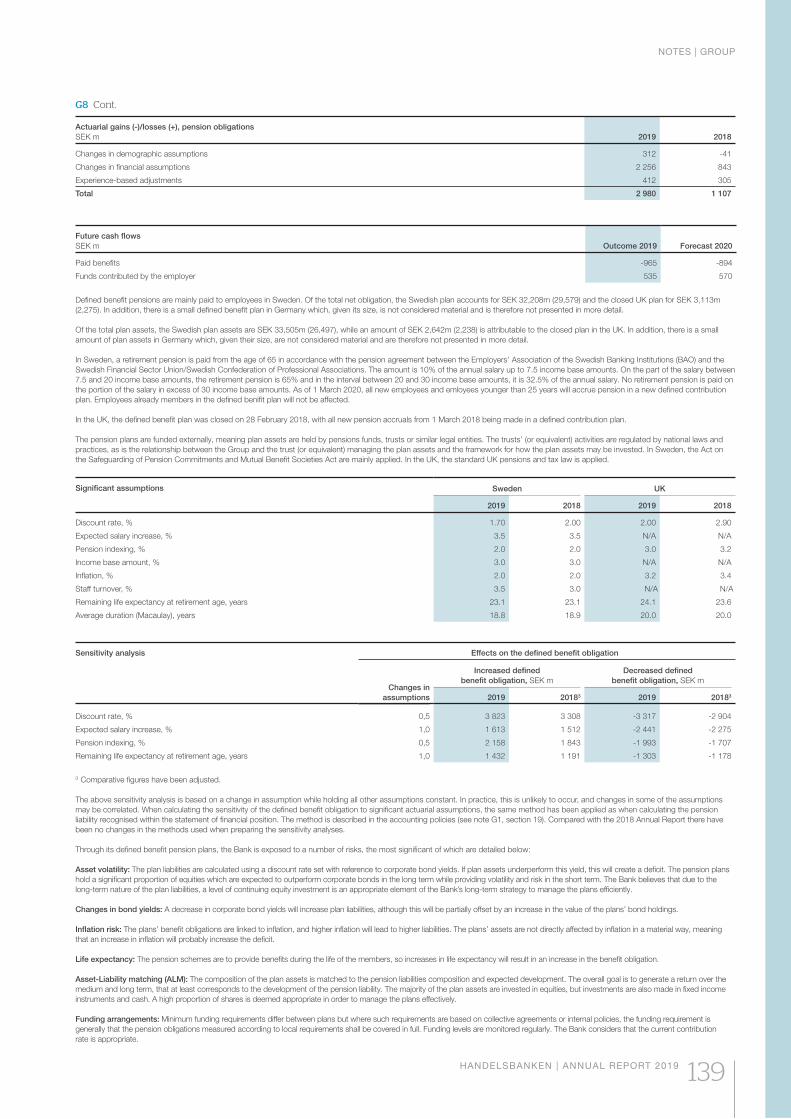
Significant assumptions Sweden UK
2019 2018 2019 2018
Discount rate, % 1.70 2.00 2.00 2.90
Expected salary increase, % 3.5 3.5 N/A N/A
Pension indexing, % 2.0 2.0 3.0 3.2
Income base amount, % 3.0 3.0 N/A N/A
Inflation, % 2.0 2.0 3.2 3.4
Staff turnover, % 3.5 3.0 N/A N/A
Remaining life expectancy at retirement age, years 23.1 23.1 24.1 23.6
Average duration (Macaulay), years 18.8 18.9 20.0 20.0
Sensitivity analysis Effects on the defined benefit obligation
Changes in
assumptions
Increased defined
benefit obligation, SEK m
Decreased defined
benefit obligation, SEK m
2019 20183 2019 20183
Discount rate, % 0,5 3 823 3 308 -3 317 -2 904
Expected salary increase, % 1,0 1 613 1 512 -2 441 -2 275
Pension indexing, % 0,5 2 158 1 843 -1 993 -1 707
Remaining life expectancy at retirement age, years 1,0 1 432 1 191 -1 303 -1 178
3 Comparative figures have been adjusted.
The above sensitivity analysis is based on a change in assumption while holding all other assumptions constant. In practice, this is unlikely to occur, and changes in some of the assumptions
may be correlated. When calculating the sensitivity of the defined benefit obligation to significant actuarial assumptions, the same method has been applied as when calculating the pension
liability recognised within the statement of financial position. The method is described in the accounting policies (see note G1, section 19). Compared with the 2018 Annual Report there have
been no changes in the methods used when preparing the sensitivity analyses.
Through its defined benefit pension plans, the Bank is exposed to a number of risks, the most significant of which are detailed below:
Asset volatility: The plan liabilities are calculated using a discount rate set with reference to corporate bond yields. If plan assets underperform this yield, this will create a deficit. The pension plans
hold a significant proportion of equities which are expected to outperform corporate bonds in the long term while providing volatility and risk in the short term. The Bank believes that due to the
long-term nature of the plan liabilities, a level of continuing equity investment is an appropriate element of the Bank’s long-term strategy to manage the plans efficiently.
Changes in bond yields: A decrease in corporate bond yields will increase plan liabilities, although this will be partially offset by an increase in the value of the plans’ bond holdings.
Inflation risk: The plans’ benefit obligations are linked to inflation, and higher inflation will lead to higher liabilities. The plans’ assets are not directly affected by inflation in a material way, meaning
that an increase in inflation will probably increase the deficit.
Life expectancy: The pension schemes are to provide benefits during the life of the members, so increases in life expectancy will result in an increase in the benefit obligation.
Asset-Liability matching (ALM): The composition of the plan assets is matched to the pension liabilities composition and expected development. The overall goal is to generate a return over the
medium and long term, that at least corresponds to the development of the pension liability. The majority of the plan assets are invested in equities, but investments are also made in fixed income
instruments and cash. A high proportion of shares is deemed appropriate in order to manage the plans effectively.
Funding arrangements: Minimum funding requirements differ between plans but where such requirements are based on collective agreements or internal policies, the funding requirement is
generally that the pension obligations measured according to local requirements shall be covered in full. Funding levels are monitored regularly. The Bank considers that the current contribution
rate is appropriate.
Future cash flows
SEK m Outcome 2019 Forecast 2020
Paid benefits -965 -894
Funds contributed by the employer 535 570
Defined benefit pensions are mainly paid to employees in Sweden. Of the total net obligation, the Swedish plan accounts for SEK 32,208m (29,579) and the closed UK plan for SEK 3,113m
(2,275). In addition, there is a small defined benefit plan in Germany which, given its size, is not considered material and is therefore not presented in more detail.
Of the total plan assets, the Swedish plan assets are SEK 33,505m (26,497), while an amount of SEK 2,642m (2,238) is attributable to the closed plan in the UK. In addition, there is a small
amount of plan assets in Germany which, given their size, are not considered material and are therefore not presented in more detail.
In Sweden, a retirement pension is paid from the age of 65 in accordance with the pension agreement between the Employers’ Association of the Swedish Banking Institutions (BAO) and the
Swedish Financial Sector Union/Swedish Confederation of Professional Associations. The amount is 10% of the annual salary up to 7.5 income base amounts. On the part of the salary between
7.5 and 20 income base amounts, the retirement pension is 65% and in the interval between 20 and 30 income base amounts, it is 32.5% of the annual salary. No retirement pension is paid on
the portion of the salary in excess of 30 income base amounts. As of 1 March 2020, all new employees and emloyees younger than 25 years will accrue pension in a new defined contribution
plan. Employees already members in the defined benifit plan will not be affected.
In the UK, the defined benefit plan was closed on 28 February 2018, with all new pension accruals from 1 March 2018 being made in a defined contribution plan.
The pension plans are funded externally, meaning plan assets are held by pensions funds, trusts or similar legal entities. The trusts’ (or equivalent) activities are regulated by national laws and
practices, as is the relationship between the Group and the trust (or equivalent) managing the plan assets and the framework for how the plan assets may be invested. In Sweden, the Act on
the Safeguarding of Pension Commitments and Mutual Benefit Societies Act are mainly applied. In the UK, the standard UK pensions and tax law is applied.
G8 Cont.
Actuarial gains (-)/losses (+), pension obligations
SEK m 2019 2018
Changes in demographic assumptions 312 -41
Changes in financial assumptions 2 256 843
Experience-based adjustments 412 305
Total 2 980 1 107
NOTES | GROUP
HANDELSBANKEN | ANNUAL REPORT 2019 139
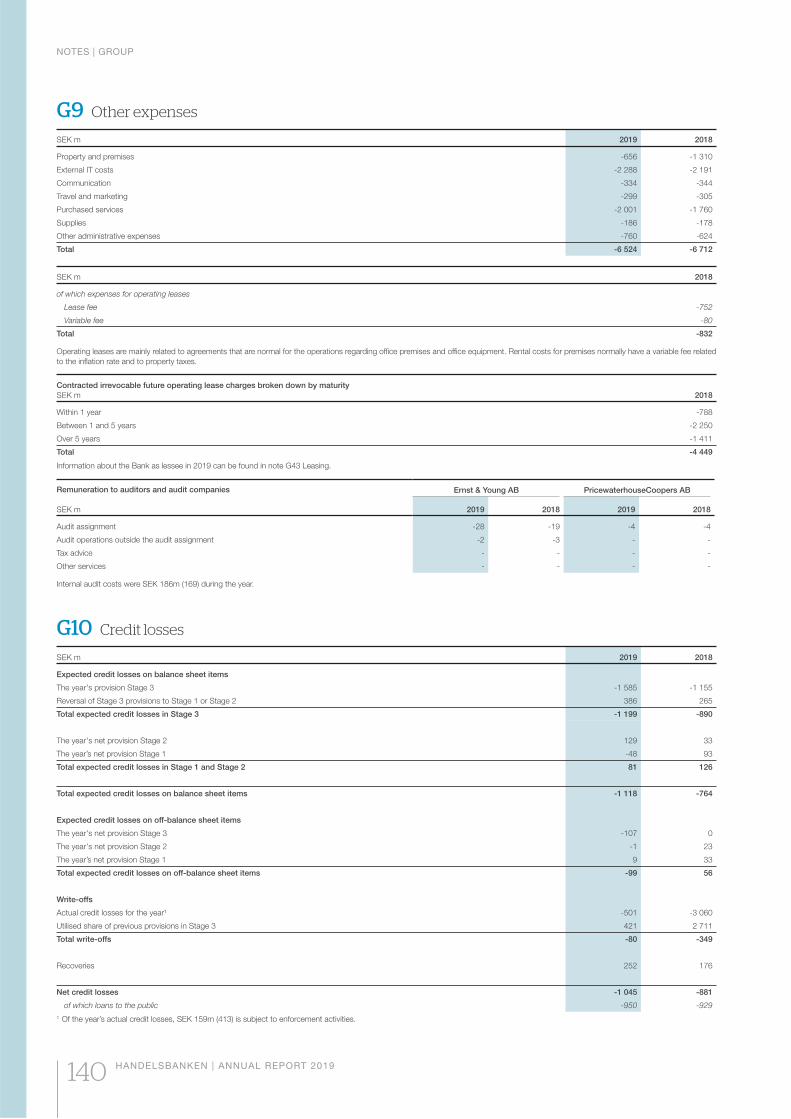
G9 Other expenses
SEK m 2019 2018
Property and premises -656 -1 310
External IT costs -2 288 -2 191
Communication -334 -344
Travel and marketing -299 -305
Purchased services -2 001 -1 760
Supplies -186 -178
Other administrative expenses -760 -624
Total -6 524 -6 712
SEK m 2018
of which expenses for operating leases
Lease fee -752
Variable fee -80
Total -832
Operating leases are mainly related to agreements that are normal for the operations regarding office premises and office equipment. Rental costs for premises normally have a variable fee related
to the inflation rate and to property taxes.
Contracted irrevocable future operating lease charges broken down by maturity
SEK m 2018
Within 1 year -788
Between 1 and 5 years -2 250
Over 5 years -1 411
Total -4 449
Information about the Bank as lessee in 2019 can be found in note G43 Leasing.
Remuneration to auditors and audit companies
SEK m
Ernst & Young AB PricewaterhouseCoopers AB
2019 2018 2019 2018
Audit assignment -28 -19 -4 -4
Audit operations outside the audit assignment -2 -3 - -
Tax advice - - - -
Other services - - - -
Internal audit costs were SEK 186m (169) during the year.
G10 Credit losses
SEK m 2019 2018
Expected credit losses on balance sheet items
The year's provision Stage 3 -1 585 -1 155
Reversal of Stage 3 provisions to Stage 1 or Stage 2 386 265
Total expected credit losses in Stage 3 -1 199 -890
The year's net provision Stage 2 129 33
The year’s net provision Stage 1 -48 93
Total expected credit losses in Stage 1 and Stage 2 81 126
Total expected credit losses on balance sheet items -1 118 -764
Expected credit losses on off-balance sheet items
The year's net provision Stage 3 -107 0
The year's net provision Stage 2 -1 23
The year’s net provision Stage 1 9 33
Total expected credit losses on off-balance sheet items -99 56
Write-offs
Actual credit losses for the year¹ -501 -3 060
Utilised share of previous provisions in Stage 3 421 2 711
Total write-offs -80 -349
Recoveries 252 176
Net credit losses -1 045 -881
of which loans to the public -950 -929
1 Of the year’s actual credit losses, SEK 159m (413) is subject to enforcement activities.
NOTES | GROUP
140 HANDELSBANKEN | ANNUAL REPORT 2019
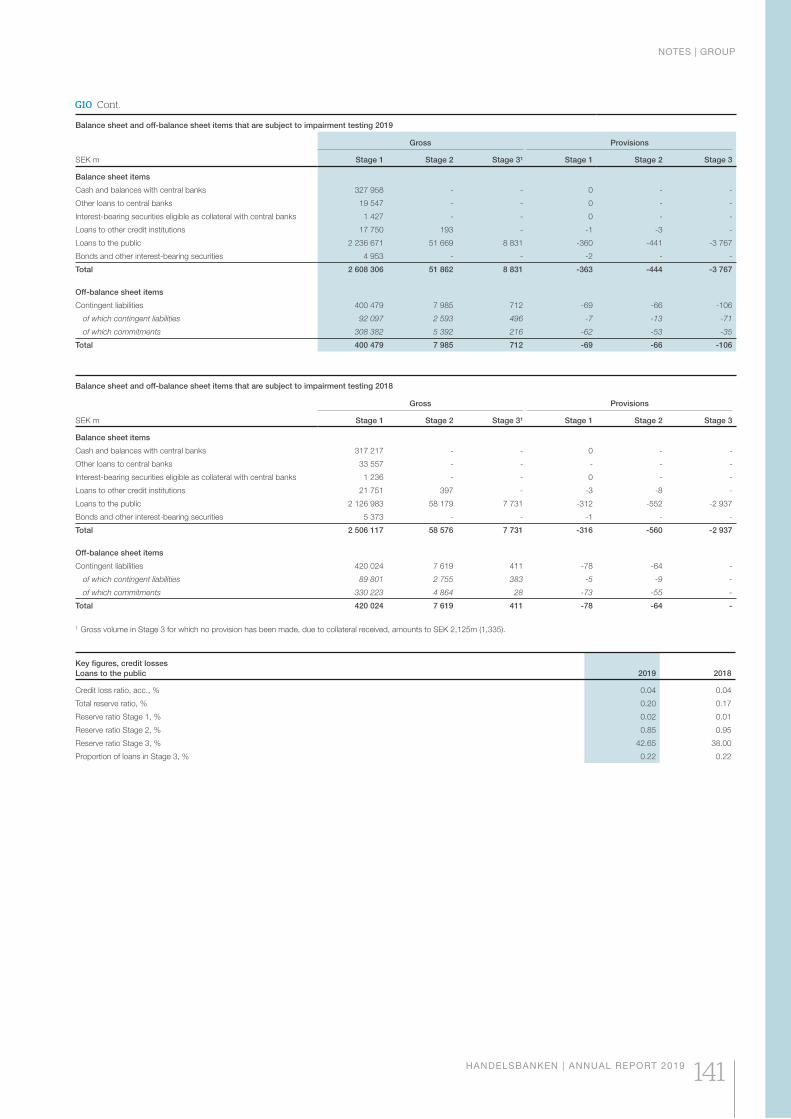
Balance sheet and off-balance sheet items that are subject to impairment testing 2019
SEK m
Gross Provisions
Stage 1 Stage 2 Stage 3¹ Stage 1 Stage 2 Stage 3
Balance sheet items
Cash and balances with central banks 327 958 - - 0 - -
Other loans to central banks 19 547 - - 0 - -
Interest-bearing securities eligible as collateral with central banks 1 427 - - 0 - -
Loans to other credit institutions 17 750 193 - -1 -3 -
Loans to the public 2 236 671 51 669 8 831 -360 -441 -3 767
Bonds and other interest-bearing securities 4 953 - - -2 - -
Total 2 608 306 51 862 8 831 -363 -444 -3 767
Off-balance sheet items
Contingent liabilities 400 479 7 985 712 -69 -66 -106
of which contingent liabilities 92 097 2 593 496 -7 -13 -71
of which commitments 308 382 5 392 216 -62 -53 -35
Total 400 479 7 985 712 -69 -66 -106
Balance sheet and off-balance sheet items that are subject to impairment testing 2018
SEK m
Gross Provisions
Stage 1 Stage 2 Stage 3¹ Stage 1 Stage 2 Stage 3
Balance sheet items
Cash and balances with central banks 317 217 - - 0 - -
Other loans to central banks 33 557 - - - - -
Interest-bearing securities eligible as collateral with central banks 1 236 - - 0 - -
Loans to other credit institutions 21 751 397 - -3 -8 -
Loans to the public 2 126 983 58 179 7 731 -312 -552 -2 937
Bonds and other interest-bearing securities 5 373 - - -1 - -
Total 2 506 117 58 576 7 731 -316 -560 -2 937
Off-balance sheet items
Contingent liabilities 420 024 7 619 411 -78 -64 -
of which contingent liabilities 89 801 2 755 383 -5 -9 -
of which commitments 330 223 4 864 28 -73 -55 -
Total 420 024 7 619 411 -78 -64 -
1 Gross volume in Stage 3 for which no provision has been made, due to collateral received, amounts to SEK 2,125m (1,335).
Key figures, credit losses
Loans to the public 2019 2018
Credit loss ratio, acc., % 0.04 0.04
Total reserve ratio, % 0.20 0.17
Reserve ratio Stage 1, % 0.02 0.01
Reserve ratio Stage 2, % 0.85 0.95
Reserve ratio Stage 3, % 42.65 38.00
Proportion of loans in Stage 3, % 0.22 0.22
G10 Cont.
NOTES | GROUP
HANDELSBANKEN | ANNUAL REPORT 2019 141
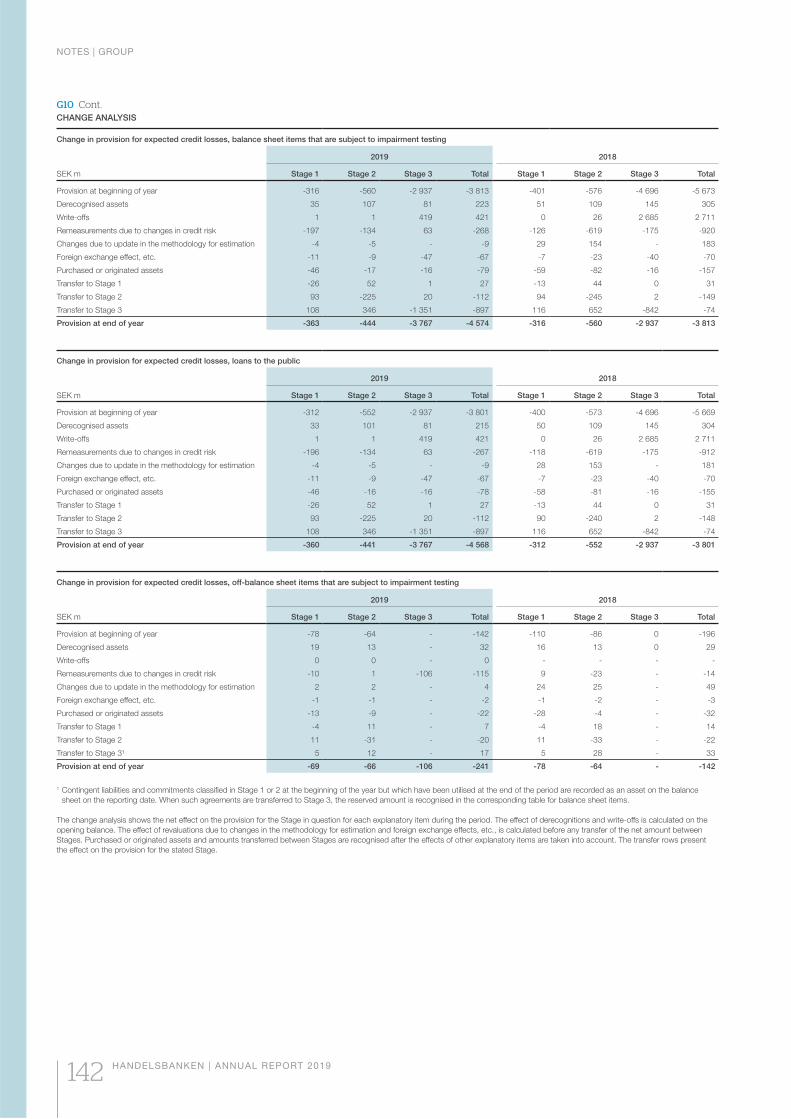
G10 Cont.CHANGE ANALYSIS
Change in provision for expected credit losses, balance sheet items that are subject to impairment testing
2019 2018
SEK m Stage 1 Stage 2 Stage 3 Total Stage 1 Stage 2 Stage 3 Total
Provision at beginning of year -316 -560 -2 937 -3 813 -401 -576 -4 696 -5 673
Derecognised assets 35 107 81 223 51 109 145 305
Write-offs 1 1 419 421 0 26 2 685 2 711
Remeasurements due to changes in credit risk -197 -134 63 -268 -126 -619 -175 -920
Changes due to update in the methodology for estimation -4 -5 - -9 29 154 - 183
Foreign exchange effect, etc. -11 -9 -47 -67 -7 -23 -40 -70
Purchased or originated assets -46 -17 -16 -79 -59 -82 -16 -157
Transfer to Stage 1 -26 52 1 27 -13 44 0 31
Transfer to Stage 2 93 -225 20 -112 94 -245 2 -149
Transfer to Stage 3 108 346 -1 351 -897 116 652 -842 -74
Provision at end of year -363 -444 -3 767 -4 574 -316 -560 -2 937 -3 813
Change in provision for expected credit losses, loans to the public
2019 2018
SEK m Stage 1 Stage 2 Stage 3 Total Stage 1 Stage 2 Stage 3 Total
Provision at beginning of year -312 -552 -2 937 -3 801 -400 -573 -4 696 -5 669
Derecognised assets 33 101 81 215 50 109 145 304
Write-offs 1 1 419 421 0 26 2 685 2 711
Remeasurements due to changes in credit risk -196 -134 63 -267 -118 -619 -175 -912
Changes due to update in the methodology for estimation -4 -5 - -9 28 153 - 181
Foreign exchange effect, etc. -11 -9 -47 -67 -7 -23 -40 -70
Purchased or originated assets -46 -16 -16 -78 -58 -81 -16 -155
Transfer to Stage 1 -26 52 1 27 -13 44 0 31
Transfer to Stage 2 93 -225 20 -112 90 -240 2 -148
Transfer to Stage 3 108 346 -1 351 -897 116 652 -842 -74
Provision at end of year -360 -441 -3 767 -4 568 -312 -552 -2 937 -3 801
Change in provision for expected credit losses, off-balance sheet items that are subject to impairment testing
2019 2018
SEK m Stage 1 Stage 2 Stage 3 Total Stage 1 Stage 2 Stage 3 Total
Provision at beginning of year -78 -64 - -142 -110 -86 0 -196
Derecognised assets 19 13 - 32 16 13 0 29
Write-offs 0 0 - 0 - - - -
Remeasurements due to changes in credit risk -10 1 -106 -115 9 -23 - -14
Changes due to update in the methodology for estimation 2 2 - 4 24 25 - 49
Foreign exchange effect, etc. -1 -1 - -2 -1 -2 - -3
Purchased or originated assets -13 -9 - -22 -28 -4 - -32
Transfer to Stage 1 -4 11 - 7 -4 18 - 14
Transfer to Stage 2 11 -31 - -20 11 -33 - -22
Transfer to Stage 3¹ 5 12 - 17 5 28 - 33
Provision at end of year -69 -66 -106 -241 -78 -64 - -142
1 Contingent liabilities and commitments classified in Stage 1 or 2 at the beginning of the year but which have been utilised at the end of the period are recorded as an asset on the balance
sheet on the reporting date. When such agreements are transferred to Stage 3, the reserved amount is recognised in the corresponding table for balance sheet items.
The change analysis shows the net effect on the provision for the Stage in question for each explanatory item during the period. The effect of derecognitions and write-offs is calculated on the
opening balance. The effect of revaluations due to changes in the methodology for estimation and foreign exchange effects, etc., is calculated before any transfer of the net amount between
Stages. Purchased or originated assets and amounts transferred between Stages are recognised after the effects of other explanatory items are taken into account. The transfer rows present
the effect on the provision for the stated Stage.
NOTES | GROUP
142 HANDELSBANKEN | ANNUAL REPORT 2019
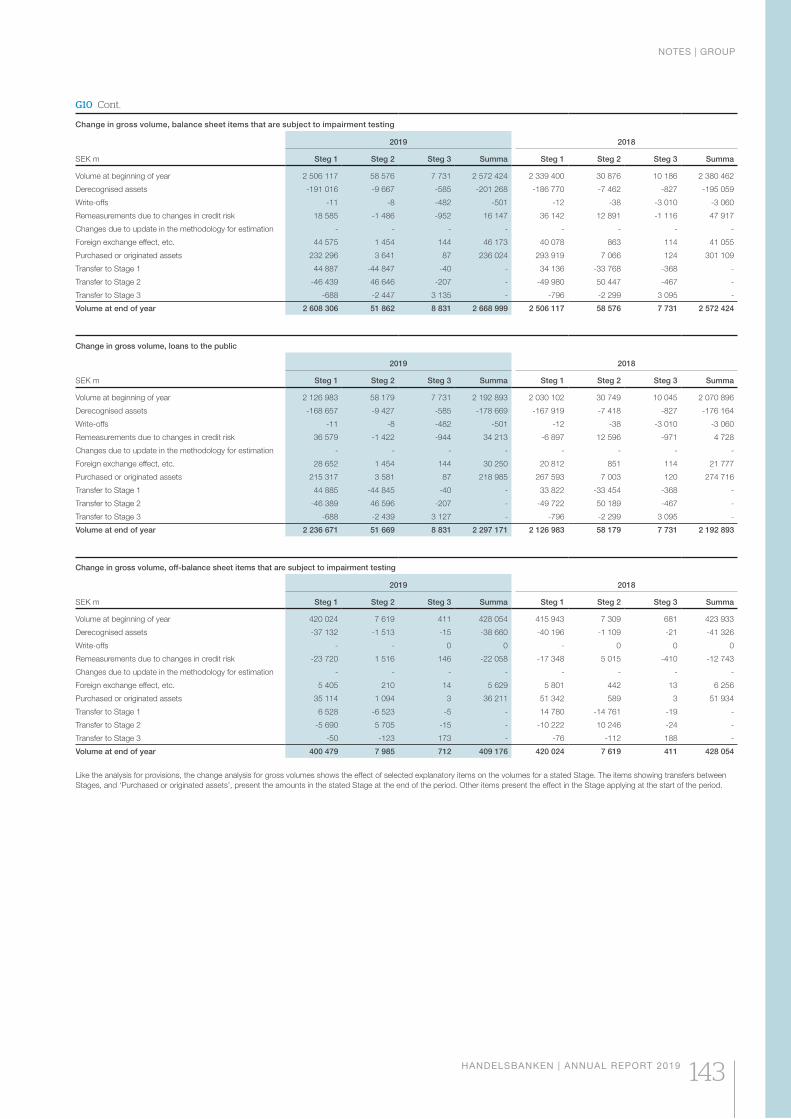
G10 Cont.
Change in gross volume, balance sheet items that are subject to impairment testing
2019 2018
SEK m Steg 1 Steg 2 Steg 3 Summa Steg 1 Steg 2 Steg 3 Summa
Volume at beginning of year 2 506 117 58 576 7 731 2 572 424 2 339 400 30 876 10 186 2 380 462
Derecognised assets -191 016 -9 667 -585 -201 268 -186 770 -7 462 -827 -195 059
Write-offs -11 -8 -482 -501 -12 -38 -3 010 -3 060
Remeasurements due to changes in credit risk 18 585 -1 486 -952 16 147 36 142 12 891 -1 116 47 917
Changes due to update in the methodology for estimation - - - - - - - -
Foreign exchange effect, etc. 44 575 1 454 144 46 173 40 078 863 114 41 055
Purchased or originated assets 232 296 3 641 87 236 024 293 919 7 066 124 301 109
Transfer to Stage 1 44 887 -44 847 -40 - 34 136 -33 768 -368 -
Transfer to Stage 2 -46 439 46 646 -207 - -49 980 50 447 -467 -
Transfer to Stage 3 -688 -2 447 3 135 - -796 -2 299 3 095 -
Volume at end of year 2 608 306 51 862 8 831 2 668 999 2 506 117 58 576 7 731 2 572 424
Change in gross volume, loans to the public
2019 2018
SEK m Steg 1 Steg 2 Steg 3 Summa Steg 1 Steg 2 Steg 3 Summa
Volume at beginning of year 2 126 983 58 179 7 731 2 192 893 2 030 102 30 749 10 045 2 070 896
Derecognised assets -168 657 -9 427 -585 -178 669 -167 919 -7 418 -827 -176 164
Write-offs -11 -8 -482 -501 -12 -38 -3 010 -3 060
Remeasurements due to changes in credit risk 36 579 -1 422 -944 34 213 -6 897 12 596 -971 4 728
Changes due to update in the methodology for estimation - - - - - - - -
Foreign exchange effect, etc. 28 652 1 454 144 30 250 20 812 851 114 21 777
Purchased or originated assets 215 317 3 581 87 218 985 267 593 7 003 120 274 716
Transfer to Stage 1 44 885 -44 845 -40 - 33 822 -33 454 -368 -
Transfer to Stage 2 -46 389 46 596 -207 - -49 722 50 189 -467 -
Transfer to Stage 3 -688 -2 439 3 127 - -796 -2 299 3 095 -
Volume at end of year 2 236 671 51 669 8 831 2 297 171 2 126 983 58 179 7 731 2 192 893
Change in gross volume, off-balance sheet items that are subject to impairment testing
2019 2018
SEK m Steg 1 Steg 2 Steg 3 Summa Steg 1 Steg 2 Steg 3 Summa
Volume at beginning of year 420 024 7 619 411 428 054 415 943 7 309 681 423 933
Derecognised assets -37 132 -1 513 -15 -38 660 -40 196 -1 109 -21 -41 326
Write-offs - - 0 0 - 0 0 0
Remeasurements due to changes in credit risk -23 720 1 516 146 -22 058 -17 348 5 015 -410 -12 743
Changes due to update in the methodology for estimation - - - - - - - -
Foreign exchange effect, etc. 5 405 210 14 5 629 5 801 442 13 6 256
Purchased or originated assets 35 114 1 094 3 36 211 51 342 589 3 51 934
Transfer to Stage 1 6 528 -6 523 -5 - 14 780 -14 761 -19 -
Transfer to Stage 2 -5 690 5 705 -15 - -10 222 10 246 -24 -
Transfer to Stage 3 -50 -123 173 - -76 -112 188 -
Volume at end of year 400 479 7 985 712 409 176 420 024 7 619 411 428 054
Like the analysis for provisions, the change analysis for gross volumes shows the effect of selected explanatory items on the volumes for a stated Stage. The items showing transfers between
Stages, and ‘Purchased or originated assets’, present the amounts in the stated Stage at the end of the period. Other items present the effect in the Stage applying at the start of the period.
NOTES | GROUP
HANDELSBANKEN | ANNUAL REPORT 2019 143
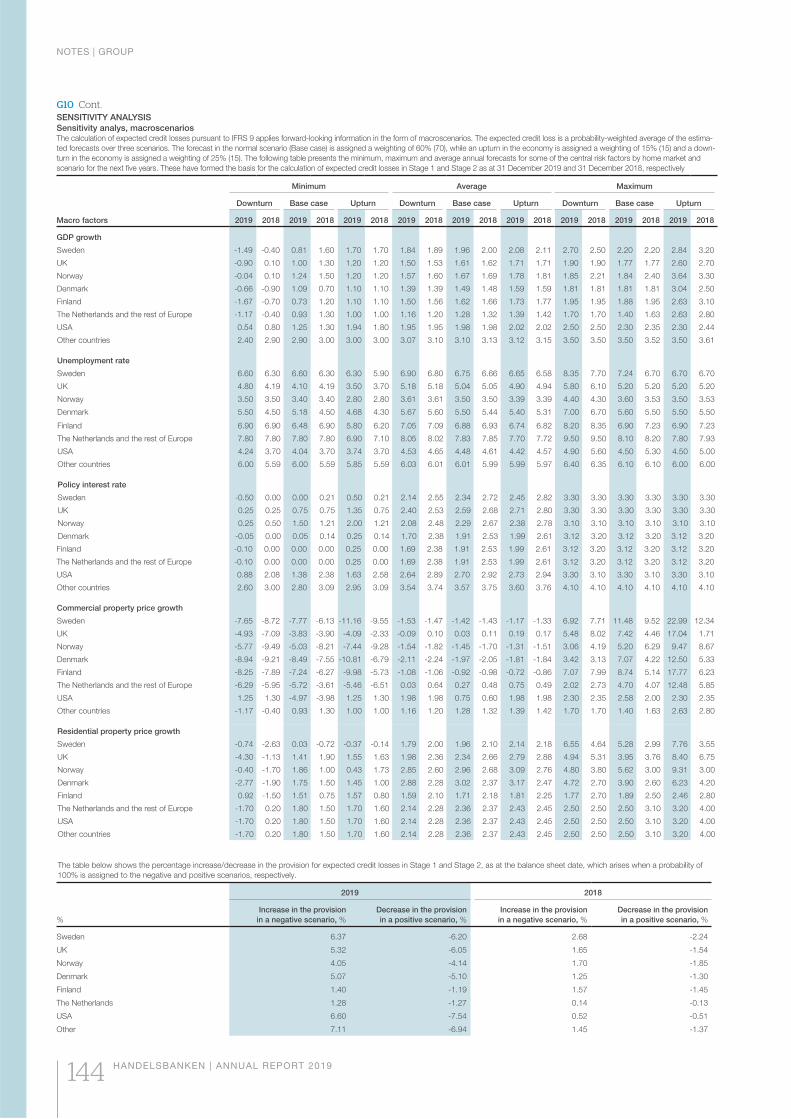
G10 Cont.SENSITIVITY ANALYSIS
Sensitivity analys, macroscenariosThe calculation of expected credit losses pursuant to IFRS 9 applies forward-looking information in the form of macroscenarios. The expected credit loss is a probability-weighted average of the estima-
ted forecasts over three scenarios. The forecast in the normal scenario (Base case) is assigned a weighting of 60% (70), while an upturn in the economy is assigned a weighting of 15% (15) and a down-
turn in the economy is assigned a weighting of 25% (15). The following table presents the minimum, maximum and average annual forecasts for some of the central risk factors by home market and
scenario for the next five years. These have formed the basis for the calculation of expected credit losses in Stage 1 and Stage 2 as at 31 December 2019 and 31 December 2018, respectively
Macro factors
Minimum Average Maximum
Downturn Base case Upturn Downturn Base case Upturn Downturn Base case Upturn
2019 2018 2019 2018 2019 2018 2019 2018 2019 2018 2019 2018 2019 2018 2019 2018 2019 2018
GDP growth
Sweden -1.49 -0.40 0.81 1.60 1.70 1.70 1.84 1.89 1.96 2.00 2.08 2.11 2.70 2.50 2.20 2.20 2.84 3.20
UK -0.90 0.10 1.00 1.30 1.20 1.20 1.50 1.53 1.61 1.62 1.71 1.71 1.90 1.90 1.77 1.77 2.60 2.70
Norway -0.04 0.10 1.24 1.50 1.20 1.20 1.57 1.60 1.67 1.69 1.78 1.81 1.85 2.21 1.84 2.40 3.64 3.30
Denmark -0.66 -0.90 1.09 0.70 1.10 1.10 1.39 1.39 1.49 1.48 1.59 1.59 1.81 1.81 1.81 1.81 3.04 2.50
Finland -1.67 -0.70 0.73 1.20 1.10 1.10 1.50 1.56 1.62 1.66 1.73 1.77 1.95 1.95 1.88 1.95 2.63 3.10
The Netherlands and the rest of Europe -1.17 -0.40 0.93 1.30 1.00 1.00 1.16 1.20 1.28 1.32 1.39 1.42 1.70 1.70 1.40 1.63 2.63 2.80
USA 0.54 0.80 1.25 1.30 1.94 1.80 1.95 1.95 1.98 1.98 2.02 2.02 2.50 2.50 2.30 2.35 2.30 2.44
Other countries 2.40 2.90 2.90 3.00 3.00 3.00 3.07 3.10 3.10 3.13 3.12 3.15 3.50 3.50 3.50 3.52 3.50 3.61
Unemployment rate
Sweden 6.60 6.30 6.60 6.30 6.30 5.90 6.90 6.80 6.75 6.66 6.65 6.58 8.35 7.70 7.24 6.70 6.70 6.70
UK 4.80 4.19 4.10 4.19 3.50 3.70 5.18 5.18 5.04 5.05 4.90 4.94 5.80 6.10 5.20 5.20 5.20 5.20
Norway 3.50 3.50 3.40 3.40 2.80 2.80 3.61 3.61 3.50 3.50 3.39 3.39 4.40 4.30 3.60 3.53 3.50 3.53
Denmark 5.50 4.50 5.18 4.50 4.68 4.30 5.67 5.60 5.50 5.44 5.40 5.31 7.00 6.70 5.60 5.50 5.50 5.50
Finland 6.90 6.90 6.48 6.90 5.80 6.20 7.05 7.09 6.88 6.93 6.74 6.82 8.20 8.35 6.90 7.23 6.90 7.23
The Netherlands and the rest of Europe 7.80 7.80 7.80 7.80 6.90 7.10 8.05 8.02 7.83 7.85 7.70 7.72 9.50 9.50 8.10 8.20 7.80 7.93
USA 4.24 3.70 4.04 3.70 3.74 3.70 4.53 4.65 4.48 4.61 4.42 4.57 4.90 5.60 4.50 5.30 4.50 5.00
Other countries 6.00 5.59 6.00 5.59 5.85 5.59 6.03 6.01 6.01 5.99 5.99 5.97 6.40 6.35 6.10 6.10 6.00 6.00
Policy interest rate
Sweden -0.50 0.00 0.00 0.21 0.50 0.21 2.14 2.55 2.34 2.72 2.45 2.82 3.30 3.30 3.30 3.30 3.30 3.30
UK 0.25 0.25 0.75 0.75 1.35 0.75 2.40 2.53 2.59 2.68 2.71 2.80 3.30 3.30 3.30 3.30 3.30 3.30
Norway 0.25 0.50 1.50 1.21 2.00 1.21 2.08 2.48 2.29 2.67 2.38 2.78 3.10 3.10 3.10 3.10 3.10 3.10
Denmark -0.05 0.00 0.05 0.14 0.25 0.14 1.70 2.38 1.91 2.53 1.99 2.61 3.12 3.20 3.12 3.20 3.12 3.20
Finland -0.10 0.00 0.00 0.00 0.25 0.00 1.69 2.38 1.91 2.53 1.99 2.61 3.12 3.20 3.12 3.20 3.12 3.20
The Netherlands and the rest of Europe -0.10 0.00 0.00 0.00 0.25 0.00 1.69 2.38 1.91 2.53 1.99 2.61 3.12 3.20 3.12 3.20 3.12 3.20
USA 0.88 2.08 1.38 2.38 1.63 2.58 2.64 2.89 2.70 2.92 2.73 2.94 3.30 3.10 3.30 3.10 3.30 3.10
Other countries 2.60 3.00 2.80 3.09 2.95 3.09 3.54 3.74 3.57 3.75 3.60 3.76 4.10 4.10 4.10 4.10 4.10 4.10
Commercial property price growth
Sweden -7.65 -8.72 -7.77 -6.13 -11.16 -9.55 -1.53 -1.47 -1.42 -1.43 -1.17 -1.33 6.92 7.71 11.48 9.52 22.99 12.34
UK -4.93 -7.09 -3.83 -3.90 -4.09 -2.33 -0.09 0.10 0.03 0.11 0.19 0.17 5.48 8.02 7.42 4.46 17.04 1.71
Norway -5.77 -9.49 -5.03 -8.21 -7.44 -9.28 -1.54 -1.82 -1.45 -1.70 -1.31 -1.51 3.06 4.19 5.20 6.29 9.47 8.67
Denmark -8.94 -9.21 -8.49 -7.55 -10.81 -6.79 -2.11 -2.24 -1.97 -2.05 -1.81 -1.84 3.42 3.13 7.07 4.22 12.50 5.33
Finland -8.25 -7.89 -7.24 -6.27 -9.98 -5.73 -1.08 -1.06 -0.92 -0.98 -0.72 -0.86 7.07 7.99 8.74 5.14 17.77 6.23
The Netherlands and the rest of Europe -6.29 -5.95 -5.72 -3.61 -5.46 -6.51 0.03 0.64 0.27 0.48 0.75 0.49 2.02 2.73 4.70 4.07 12.48 5.85
USA 1.25 1.30 -4.97 -3.98 1.25 1.30 1.98 1.98 0.75 0.60 1.98 1.98 2.30 2.35 2.58 2.00 2.30 2.35
Other countries -1.17 -0.40 0.93 1.30 1.00 1.00 1.16 1.20 1.28 1.32 1.39 1.42 1.70 1.70 1.40 1.63 2.63 2.80
Residential property price growth
Sweden -0.74 -2.63 0.03 -0.72 -0.37 -0.14 1.79 2.00 1.96 2.10 2.14 2.18 6.55 4.64 5.28 2.99 7.76 3.55
UK -4.30 -1.13 1.41 1.90 1.55 1.63 1.98 2.36 2.34 2.66 2.79 2.88 4.94 5.31 3.95 3.76 8.40 6.75
Norway -0.40 -1.70 1.86 1.00 0.43 1.73 2.85 2.60 2.96 2.68 3.09 2.76 4.80 3.80 5.62 3.00 9.31 3.00
Denmark -2.77 -1.90 1.75 1.50 1.45 1.00 2.88 2.28 3.02 2.37 3.17 2.47 4.72 2.70 3.90 2.60 6.23 4.20
Finland 0.92 -1.50 1.51 0.75 1.57 0.80 1.59 2.10 1.71 2.18 1.81 2.25 1.77 2.70 1.89 2.50 2.46 2.80
The Netherlands and the rest of Europe -1.70 0.20 1.80 1.50 1.70 1.60 2.14 2.28 2.36 2.37 2.43 2.45 2.50 2.50 2.50 3.10 3.20 4.00
USA -1.70 0.20 1.80 1.50 1.70 1.60 2.14 2.28 2.36 2.37 2.43 2.45 2.50 2.50 2.50 3.10 3.20 4.00
Other countries -1.70 0.20 1.80 1.50 1.70 1.60 2.14 2.28 2.36 2.37 2.43 2.45 2.50 2.50 2.50 3.10 3.20 4.00
The table below shows the percentage increase/decrease in the provision for expected credit losses in Stage 1 and Stage 2, as at the balance sheet date, which arises when a probability of
100% is assigned to the negative and positive scenarios, respectively.
2019 2018
%
Increase in the provision
in a negative scenario, %
Decrease in the provision
in a positive scenario, %
Increase in the provision
in a negative scenario, %
Decrease in the provision
in a positive scenario, %
Sweden 6.37 -6.20 2.68 -2.24
UK 5.32 -6.05 1.65 -1.54
Norway 4.05 -4.14 1.70 -1.85
Denmark 5.07 -5.10 1.25 -1.30
Finland 1.40 -1.19 1.57 -1.45
The Netherlands 1.28 -1.27 0.14 -0.13
USA 6.60 -7.54 0.52 -0.51
Other 7.11 -6.94 1.45 -1.37
NOTES | GROUP
144 HANDELSBANKEN | ANNUAL REPORT 2019
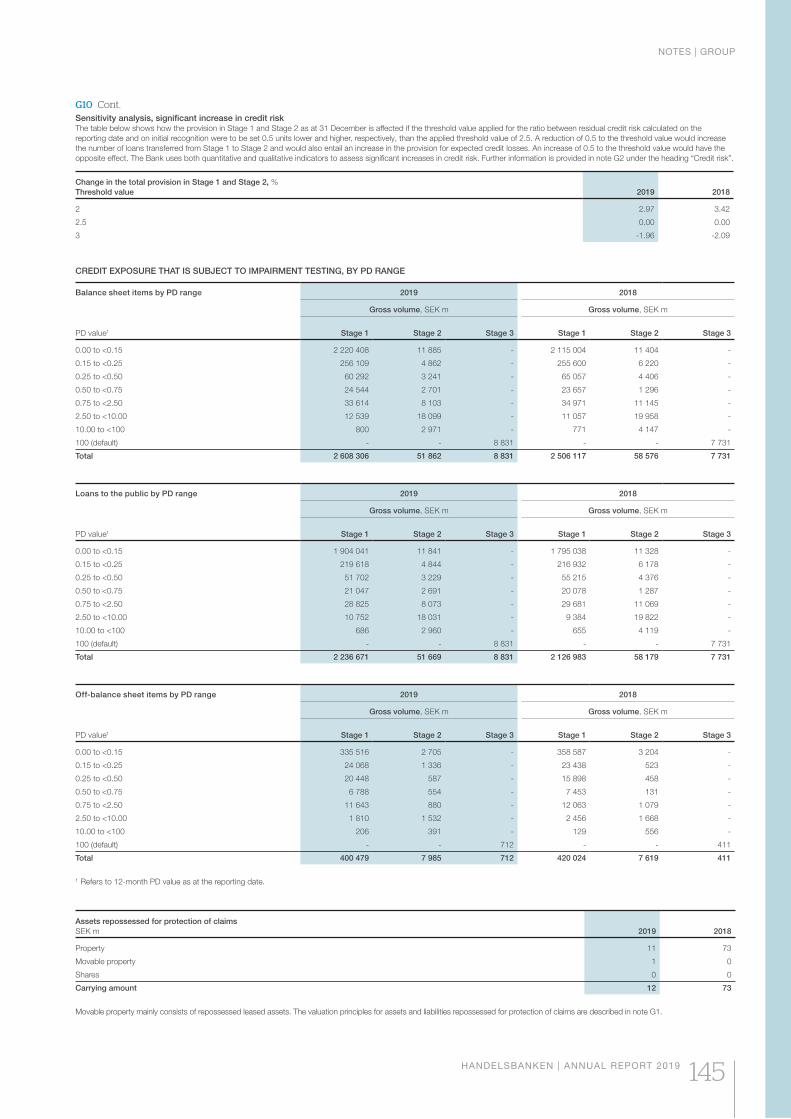
G10 Cont.
Assets repossessed for protection of claims
SEK m 2019 2018
Property 11 73
Movable property 1 0
Shares 0 0
Carrying amount 12 73
Movable property mainly consists of repossessed leased assets. The valuation principles for assets and liabilities repossessed for protection of claims are described in note G1.
CREDIT EXPOSURE THAT IS SUBJECT TO IMPAIRMENT TESTING, BY PD RANGE
Balance sheet items by PD range 2019 2018
Gross volume, SEK m Gross volume, SEK m
PD value1 Stage 1 Stage 2 Stage 3 Stage 1 Stage 2 Stage 3
0.00 to <0.15 2 220 408 11 885 - 2 115 004 11 404 -
0.15 to <0.25 256 109 4 862 - 255 600 6 220 -
0.25 to <0.50 60 292 3 241 - 65 057 4 406 -
0.50 to <0.75 24 544 2 701 - 23 657 1 296 -
0.75 to <2.50 33 614 8 103 - 34 971 11 145 -
2.50 to <10.00 12 539 18 099 - 11 057 19 958 -
10.00 to <100 800 2 971 - 771 4 147 -
100 (default) - - 8 831 - - 7 731
Total 2 608 306 51 862 8 831 2 506 117 58 576 7 731
Loans to the public by PD range 2019 2018
Gross volume, SEK m Gross volume, SEK m
PD value1 Stage 1 Stage 2 Stage 3 Stage 1 Stage 2 Stage 3
0.00 to <0.15 1 904 041 11 841 - 1 795 038 11 328 -
0.15 to <0.25 219 618 4 844 - 216 932 6 178 -
0.25 to <0.50 51 702 3 229 - 55 215 4 376 -
0.50 to <0.75 21 047 2 691 - 20 078 1 287 -
0.75 to <2.50 28 825 8 073 - 29 681 11 069 -
2.50 to <10.00 10 752 18 031 - 9 384 19 822 -
10.00 to <100 686 2 960 - 655 4 119 -
100 (default) - - 8 831 - - 7 731
Total 2 236 671 51 669 8 831 2 126 983 58 179 7 731
Off-balance sheet items by PD range 2019 2018
Gross volume, SEK m Gross volume, SEK m
PD value1 Stage 1 Stage 2 Stage 3 Stage 1 Stage 2 Stage 3
0.00 to <0.15 335 516 2 705 - 358 587 3 204 -
0.15 to <0.25 24 068 1 336 - 23 438 523 -
0.25 to <0.50 20 448 587 - 15 898 458 -
0.50 to <0.75 6 788 554 - 7 453 131 -
0.75 to <2.50 11 643 880 - 12 063 1 079 -
2.50 to <10.00 1 810 1 532 - 2 456 1 668 -
10.00 to <100 206 391 - 129 556 -
100 (default) - - 712 - - 411
Total 400 479 7 985 712 420 024 7 619 411
1 Refers to 12-month PD value as at the reporting date.
Sensitivity analysis, significant increase in credit riskThe table below shows how the provision in Stage 1 and Stage 2 as at 31 December is affected if the threshold value applied for the ratio between residual credit risk calculated on the
reporting date and on initial recognition were to be set 0.5 units lower and higher, respectively, than the applied threshold value of 2.5. A reduction of 0.5 to the threshold value would increase
the number of loans transferred from Stage 1 to Stage 2 and would also entail an increase in the provision for expected credit losses. An increase of 0.5 to the threshold value would have the
opposite effect. The Bank uses both quantitative and qualitative indicators to assess significant increases in credit risk. Further information is provided in note G2 under the heading “Credit risk”.
Change in the total provision in Stage 1 and Stage 2, %
Threshold value 2019 2018
2 2.97 3.42
2.5 0.00 0.00
3 -1.96 -2.09
NOTES | GROUP
HANDELSBANKEN | ANNUAL REPORT 2019 145

G12 Earnings per share
2019 2018
Profit for the year, SEK m 16 925 17 357
of which interest expenses on convertible subordinated loan after tax -41 -104
Average number of shares converted during the year, millions 12.6 0.0
Average holdings of own shares in trading book, millions - -
Average number of outstanding shares, millions 1 956.8 1 944.2
Average dilution effect, number of shares, millions 20.1 30.3
Average number of outstanding shares after dilution, millions 1 976.9 1 974.5
Earnings per share, SEK 8.65 8.93
after dilution 8.58 8.84
Earnings per share after dilution is measured by taking the effects of conversion of outstanding convertible shares into account. The implication of this is that the number of potential converted
shares is added to the average number of outstanding shares and that profit for the year is adjusted for the year’s interest expense on outstanding convertible subordinated loans after tax.
G13 Other loans to central banks
SEK m 2019 2018
Other loans to central banks in Swedish kronor 13 10 128
Other loans to central banks in foreign currency 19 534 23 429
Total 19 547 33 557
Provision for expected credit losses - -
Total other loans to central banks 19 547 33 557
of which accrued interest income -5 -6
Average volumes
SEK m 2019 2018
Other loans to central banks in Swedish kronor 36 071 35 391
Other loans to central banks in foreign currency 12 006 25 125
Total 48 077 60 516
of which reverse repos - -
G11 Gains/losses on disposal of property, equipment and intangible assets
SEK m 2019 2018
Equipment 8 9
Property 12 5
Total 20 14
NOTES | GROUP
146 HANDELSBANKEN | ANNUAL REPORT 2019

G14 Loans to other credit institutions
SEK m 2019 2018
Loans in Swedish kronor
Banks 2 245 1 918
Other credit institutions 18 161
Total 2 263 2 079
Loans in foreign currency
Banks 11 279 12 956
Other credit institutions 4 401 7 113
Total 15 680 20 069
Provision for expected credit losses -4 -11
Total loans to other credit institutions 17 939 22 137
of which accrued interest income 47 63
of which reverse repos - 2 756
Average volumes
SEK m 2019 2018
Loans to other credit institutions in Swedish kronor 4 753 3 419
Loans to other credit institutions in foreign currency 40 016 41 094
Total 44 769 44 513
of which reverse repos 6 892 7 356
G15 Loans to the public
SEK m 2019 2018
Loans in Swedish kronor
Households 873 595 845 880
Companies 500 877 494 228
National Debt Office - 120
Total 1 374 472 1 340 228
Loans in foreign currency
Households 344 861 315 625
Companies 577 838 537 040
National Debt Office - -
Total 922 699 852 665
Provision for expected credit losses -4 568 -3 801
Total loans to the public 2 292 603 2 189 092
of which accrued interest income 3 302 3 119
of which reverse repos 10 441 9 050
of which subordinated - 90
Average volumes, excl. National Debt Office
SEK m 2019 2018
Loans to the public in Swedish kronor 1 376 234 1 326 137
Loans to the public in foreign currency 907 845 848 198
Total 2 284 079 2 174 335
of which reverse repos 16 205 13 648
NOTES | GROUP
HANDELSBANKEN | ANNUAL REPORT 2019 147
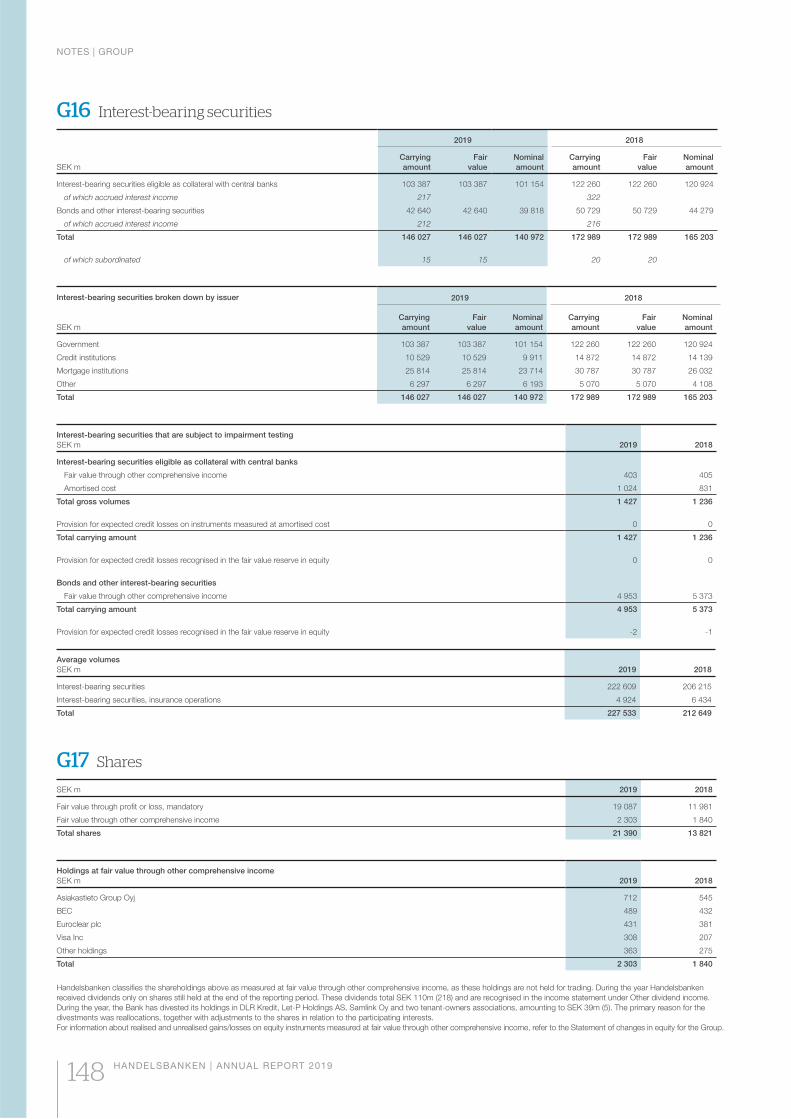
G16 Interest-bearing securities
SEK m
2019 2018
Carrying
amount
Fair
value
Nominal
amount
Carrying
amount
Fair
value
Nominal
amount
Interest-bearing securities eligible as collateral with central banks 103 387 103 387 101 154 122 260 122 260 120 924
of which accrued interest income 217 322
Bonds and other interest-bearing securities 42 640 42 640 39 818 50 729 50 729 44 279
of which accrued interest income 212 216
Total 146 027 146 027 140 972 172 989 172 989 165 203
of which subordinated 15 15 20 20
Interest-bearing securities broken down by issuer
SEK m
2019 2018
Carrying
amount
Fair
value
Nominal
amount
Carrying
amount
Fair
value
Nominal
amount
Government 103 387 103 387 101 154 122 260 122 260 120 924
Credit institutions 10 529 10 529 9 911 14 872 14 872 14 139
Mortgage institutions 25 814 25 814 23 714 30 787 30 787 26 032
Other 6 297 6 297 6 193 5 070 5 070 4 108
Total 146 027 146 027 140 972 172 989 172 989 165 203
Interest-bearing securities that are subject to impairment testing
SEK m 2019 2018
Interest-bearing securities eligible as collateral with central banks
Fair value through other comprehensive income 403 405
Amortised cost 1 024 831
Total gross volumes 1 427 1 236
Provision for expected credit losses on instruments measured at amortised cost 0 0
Total carrying amount 1 427 1 236
Provision for expected credit losses recognised in the fair value reserve in equity 0 0
Bonds and other interest-bearing securities
Fair value through other comprehensive income 4 953 5 373
Total carrying amount 4 953 5 373
Provision for expected credit losses recognised in the fair value reserve in equity -2 -1
Average volumes
SEK m 2019 2018
Interest-bearing securities 222 609 206 215
Interest-bearing securities, insurance operations 4 924 6 434
Total 227 533 212 649
G17 Shares
SEK m 2019 2018
Fair value through profit or loss, mandatory 19 087 11 981
Fair value through other comprehensive income 2 303 1 840
Total shares 21 390 13 821
Holdings at fair value through other comprehensive income
SEK m 2019 2018
Asiakastieto Group Oyj 712 545
BEC 489 432
Euroclear plc 431 381
Visa Inc 308 207
Other holdings 363 275
Total 2 303 1 840
Handelsbanken classifies the shareholdings above as measured at fair value through other comprehensive income, as these holdings are not held for trading. During the year Handelsbanken
received dividends only on shares still held at the end of the reporting period. These dividends total SEK 110m (218) and are recognised in the income statement under Other dividend income.
During the year, the Bank has divested its holdings in DLR Kredit, Let-P Holdings AS, Samlink Oy and two tenant-owners associations, amounting to SEK 39m (5). The primary reason for the
divestments was reallocations, together with adjustments to the shares in relation to the participating interests.
For information about realised and unrealised gains/losses on equity instruments measured at fair value through other comprehensive income, refer to the Statement of changes in equity for the Group.
NOTES | GROUP
148 HANDELSBANKEN | ANNUAL REPORT 2019
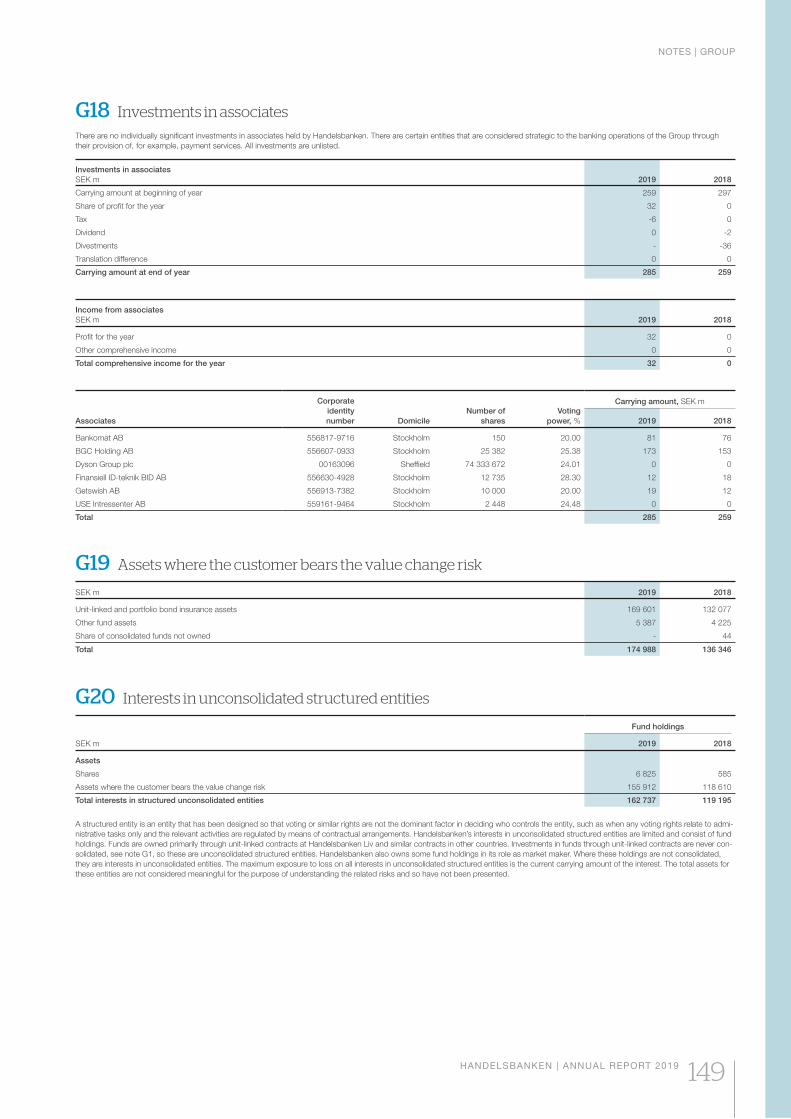
G18 Investments in associates
There are no individually significant investments in associates held by Handelsbanken. There are certain entities that are considered strategic to the banking operations of the Group through
their provision of, for example, payment services. All investments are unlisted.
Investments in associates
SEK m 2019 2018
Carrying amount at beginning of year 259 297
Share of profit for the year 32 0
Tax -6 0
Dividend 0 -2
Divestments - -36
Translation difference 0 0
Carrying amount at end of year 285 259
Income from associates
SEK m 2019 2018
Profit for the year 32 0
Other comprehensive income 0 0
Total comprehensive income for the year 32 0
Associates
Corporate
identity
number Domicile
Number of
shares
Voting
power, %
Carrying amount, SEK m
2019 2018
Bankomat AB 556817-9716 Stockholm 150 20.00 81 76
BGC Holding AB 556607-0933 Stockholm 25 382 25.38 173 153
Dyson Group plc 00163096 Sheffield 74 333 672 24.01 0 0
Finansiell ID-teknik BID AB 556630-4928 Stockholm 12 735 28.30 12 18
Getswish AB 556913-7382 Stockholm 10 000 20.00 19 12
USE Intressenter AB 559161-9464 Stockholm 2 448 24.48 0 0
Total 285 259
G19 Assets where the customer bears the value change risk
SEK m 2019 2018
Unit-linked and portfolio bond insurance assets 169 601 132 077
Other fund assets 5 387 4 225
Share of consolidated funds not owned - 44
Total 174 988 136 346
G20 Interests in unconsolidated structured entities
SEK m
Fund holdings
2019 2018
Assets
Shares 6 825 585
Assets where the customer bears the value change risk 155 912 118 610
Total interests in structured unconsolidated entities 162 737 119 195
A structured entity is an entity that has been designed so that voting or similar rights are not the dominant factor in deciding who controls the entity, such as when any voting rights relate to admi-
nistrative tasks only and the relevant activities are regulated by means of contractual arrangements. Handelsbanken’s interests in unconsolidated structured entities are limited and consist of fund
holdings. Funds are owned primarily through unit-linked contracts at Handelsbanken Liv and similar contracts in other countries. Investments in funds through unit-linked contracts are never con-
solidated, see note G1, so these are unconsolidated structured entities. Handelsbanken also owns some fund holdings in its role as market maker. Where these holdings are not consolidated,
they are interests in unconsolidated entities. The maximum exposure to loss on all interests in unconsolidated structured entities is the current carrying amount of the interest. The total assets for
these entities are not considered meaningful for the purpose of understanding the related risks and so have not been presented.
NOTES | GROUP
HANDELSBANKEN | ANNUAL REPORT 2019 149
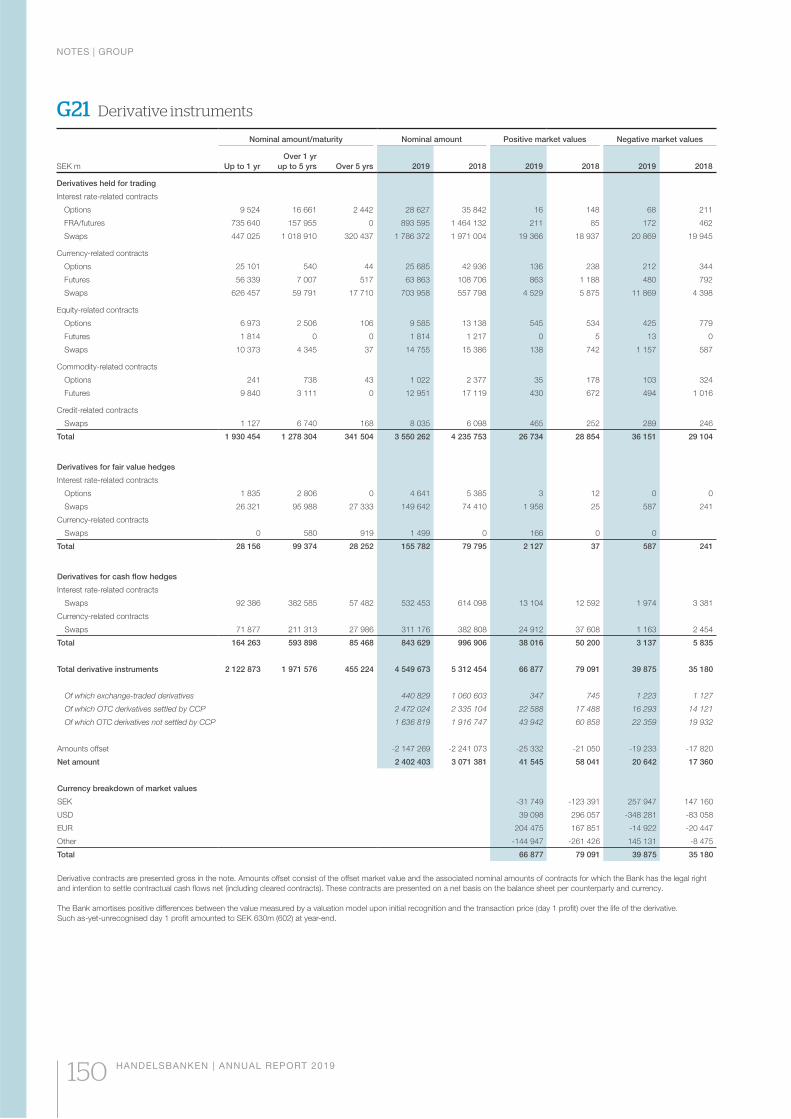
G21 Derivative instruments
Nominal amount/maturity Nominal amount Positive market values Negative market values
SEK m Up to 1 yr
Over 1 yr
up to 5 yrs Over 5 yrs 2019 2018 2019 2018 2019 2018
Derivatives held for trading
Interest rate-related contracts
Options 9 524 16 661 2 442 28 627 35 842 16 148 68 211
FRA/futures 735 640 157 955 0 893 595 1 464 132 211 85 172 462
Swaps 447 025 1 018 910 320 437 1 786 372 1 971 004 19 366 18 937 20 869 19 945
Currency-related contracts
Options 25 101 540 44 25 685 42 936 136 238 212 344
Futures 56 339 7 007 517 63 863 108 706 863 1 188 480 792
Swaps 626 457 59 791 17 710 703 958 557 798 4 529 5 875 11 869 4 398
Equity-related contracts
Options 6 973 2 506 106 9 585 13 138 545 534 425 779
Futures 1 814 0 0 1 814 1 217 0 5 13 0
Swaps 10 373 4 345 37 14 755 15 386 138 742 1 157 587
Commodity-related contracts
Options 241 738 43 1 022 2 377 35 178 103 324
Futures 9 840 3 111 0 12 951 17 119 430 672 494 1 016
Credit-related contracts
Swaps 1 127 6 740 168 8 035 6 098 465 252 289 246
Total 1 930 454 1 278 304 341 504 3 550 262 4 235 753 26 734 28 854 36 151 29 104
Derivatives for fair value hedges
Interest rate-related contracts
Options 1 835 2 806 0 4 641 5 385 3 12 0 0
Swaps 26 321 95 988 27 333 149 642 74 410 1 958 25 587 241
Currency-related contracts
Swaps 0 580 919 1 499 0 166 0 0
Total 28 156 99 374 28 252 155 782 79 795 2 127 37 587 241
Derivatives for cash flow hedges
Interest rate-related contracts
Swaps 92 386 382 585 57 482 532 453 614 098 13 104 12 592 1 974 3 381
Currency-related contracts
Swaps 71 877 211 313 27 986 311 176 382 808 24 912 37 608 1 163 2 454
Total 164 263 593 898 85 468 843 629 996 906 38 016 50 200 3 137 5 835
Total derivative instruments 2 122 873 1 971 576 455 224 4 549 673 5 312 454 66 877 79 091 39 875 35 180
Of which exchange-traded derivatives 440 829 1 060 603 347 745 1 223 1 127
Of which OTC derivatives settled by CCP 2 472 024 2 335 104 22 588 17 488 16 293 14 121
Of which OTC derivatives not settled by CCP 1 636 819 1 916 747 43 942 60 858 22 359 19 932
Amounts offset -2 147 269 -2 241 073 -25 332 -21 050 -19 233 -17 820
Net amount 2 402 403 3 071 381 41 545 58 041 20 642 17 360
Currency breakdown of market values
SEK -31 749 -123 391 257 947 147 160
USD 39 098 296 057 -348 281 -83 058
EUR 204 475 167 851 -14 922 -20 447
Other -144 947 -261 426 145 131 -8 475
Total 66 877 79 091 39 875 35 180
Derivative contracts are presented gross in the note. Amounts offset consist of the offset market value and the associated nominal amounts of contracts for which the Bank has the legal right
and intention to settle contractual cash flows net (including cleared contracts). These contracts are presented on a net basis on the balance sheet per counterparty and currency.
The Bank amortises positive differences between the value measured by a valuation model upon initial recognition and the transaction price (day 1 profit) over the life of the derivative.
Such as-yet-unrecognised day 1 profit amounted to SEK 630m (602) at year-end.
NOTES | GROUP
150 HANDELSBANKEN | ANNUAL REPORT 2019
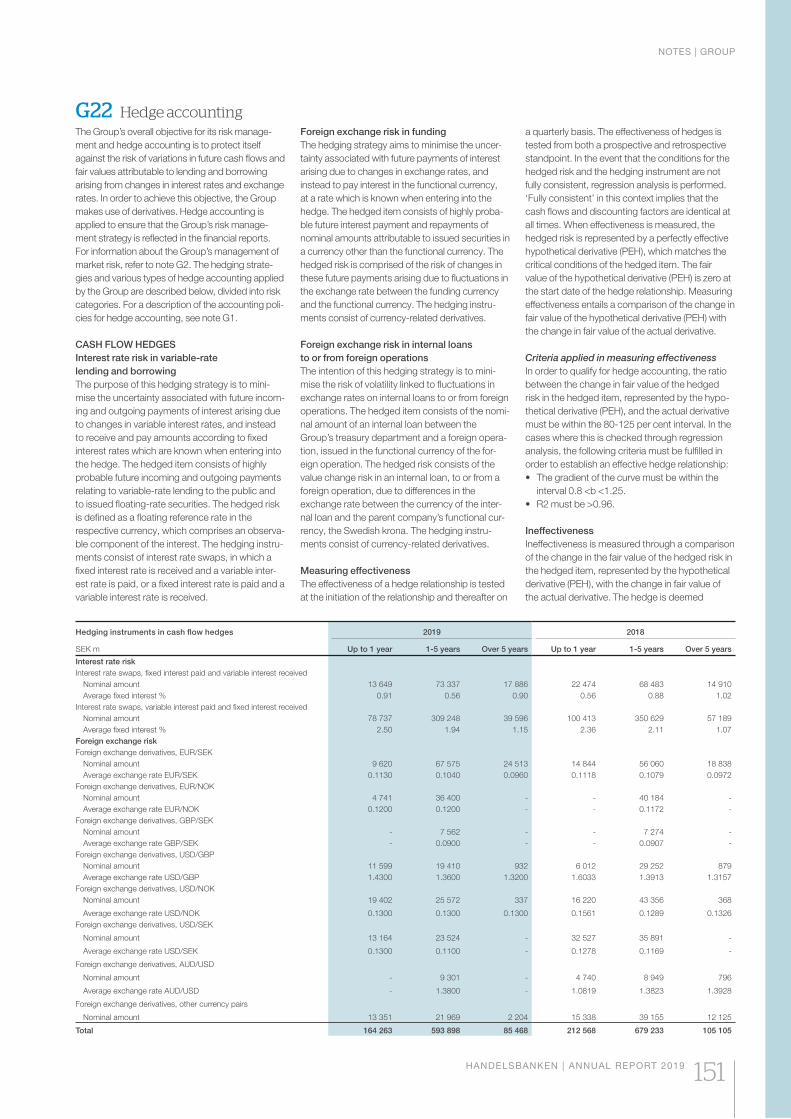
G22 Hedge accountingThe Group’s overall objective for its risk manage-
ment and hedge accounting is to protect itself
against the risk of variations in future cash flows and
fair values attributable to lending and borrowing
arising from changes in interest rates and exchange
rates. In order to achieve this objective, the Group
makes use of derivatives. Hedge accounting is
applied to ensure that the Group’s risk manage-
ment strategy is reflected in the financial reports.
For information about the Group’s management of
market risk, refer to note G2. The hedging strate-
gies and various types of hedge accounting applied
by the Group are described below, divided into risk
categories. For a description of the accounting poli-
cies for hedge accounting, see note G1.
CASH FLOW HEDGES
Interest rate risk in variable-rate
lending and borrowing
The purpose of this hedging strategy is to mini-
mise the uncertainty associated with future incom-
ing and outgoing payments of interest arising due
to changes in variable interest rates, and instead
to receive and pay amounts according to fixed
interest rates which are known when entering into
the hedge. The hedged item consists of highly
probable future incoming and outgoing payments
relating to variable-rate lending to the public and
to issued floating-rate securities. The hedged risk
is defined as a floating reference rate in the
respective currency, which comprises an observa-
ble component of the interest. The hedging instru-
ments consist of interest rate swaps, in which a
fixed interest rate is received and a variable inter-
est rate is paid, or a fixed interest rate is paid and a
variable interest rate is received.
Foreign exchange risk in funding
The hedging strategy aims to minimise the uncer-
tainty associated with future payments of interest
arising due to changes in exchange rates, and
instead to pay interest in the functional currency,
at a rate which is known when entering into the
hedge. The hedged item consists of highly proba-
ble future interest payment and repayments of
nominal amounts attributable to issued securities in
a currency other than the functional currency. The
hedged risk is comprised of the risk of changes in
these future payments arising due to fluctuations in
the exchange rate between the funding currency
and the functional currency. The hedging instru-
ments consist of currency-related derivatives.
Foreign exchange risk in internal loans
to or from foreign operations
The intention of this hedging strategy is to mini-
mise the risk of volatility linked to fluctuations in
exchange rates on internal loans to or from foreign
operations. The hedged item consists of the nomi-
nal amount of an internal loan between the
Group’s treasury department and a foreign opera-
tion, issued in the functional currency of the for-
eign operation. The hedged risk consists of the
value change risk in an internal loan, to or from a
foreign operation, due to differences in the
exchange rate between the currency of the inter-
nal loan and the parent company’s functional cur-
rency, the Swedish krona. The hedging instru-
ments consist of currency-related derivatives.
Measuring effectiveness
The effectiveness of a hedge relationship is tested
at the initiation of the relationship and thereafter on
a quarterly basis. The effectiveness of hedges is
tested from both a prospective and retrospective
standpoint. In the event that the conditions for the
hedged risk and the hedging instrument are not
fully consistent, regression analysis is performed.
‘Fully consistent’ in this context implies that the
cash flows and discounting factors are identical at
all times. When effectiveness is measured, the
hedged risk is represented by a perfectly effective
hypothetical derivative (PEH), which matches the
critical conditions of the hedged item. The fair
value of the hypothetical derivative (PEH) is zero at
the start date of the hedge relationship. Measuring
effectiveness entails a comparison of the change in
fair value of the hypothetical derivative (PEH) with
the change in fair value of the actual derivative.
Criteria applied in measuring effectiveness
In order to qualify for hedge accounting, the ratio
between the change in fair value of the hedged
risk in the hedged item, represented by the hypo-
thetical derivative (PEH), and the actual derivative
must be within the 80-125 per cent interval. In the
cases where this is checked through regression
analysis, the following criteria must be fulfilled in
order to establish an effective hedge relationship:
• The gradient of the curve must be within the
interval 0.8 <b <1.25.
• R2 must be >0.96.
Ineffectiveness
Ineffectiveness is measured through a comparison
of the change in the fair value of the hedged risk in
the hedged item, represented by the hypothetical
derivative (PEH), with the change in fair value of
the actual derivative. The hedge is deemed
Hedging instruments in cash flow hedges 2019 2018
SEK m Up to 1 year 1-5 years Over 5 years Up to 1 year 1-5 years Over 5 years
Interest rate risk
Interest rate swaps, fixed interest paid and variable interest received
Nominal amount 13 649 73 337 17 886 22 474 68 483 14 910
Average fixed interest % 0.91 0.56 0.90 0.56 0.88 1.02
Interest rate swaps, variable interest paid and fixed interest received
Nominal amount 78 737 309 248 39 596 100 413 350 629 57 189
Average fixed interest % 2.50 1.94 1.15 2.36 2.11 1.07
Foreign exchange risk
Foreign exchange derivatives, EUR/SEK
Nominal amount 9 620 67 575 24 513 14 844 56 060 18 838
Average exchange rate EUR/SEK 0.1130 0.1040 0.0960 0.1118 0.1079 0.0972
Foreign exchange derivatives, EUR/NOK
Nominal amount 4 741 36 400 - - 40 184 -
Average exchange rate EUR/NOK 0.1200 0.1200 - - 0.1172 -
Foreign exchange derivatives, GBP/SEK
Nominal amount - 7 562 - - 7 274 -
Average exchange rate GBP/SEK - 0.0900 - - 0.0907 -
Foreign exchange derivatives, USD/GBP
Nominal amount 11 599 19 410 932 6 012 29 252 879
Average exchange rate USD/GBP 1.4300 1.3600 1.3200 1.6033 1.3913 1.3157
Foreign exchange derivatives, USD/NOK
Nominal amount 19 402 25 572 337 16 220 43 356 368
Average exchange rate USD/NOK 0.1300 0.1300 0.1300 0.1561 0.1289 0.1326
Foreign exchange derivatives, USD/SEK
Nominal amount 13 164 23 524 - 32 527 35 891 -
Average exchange rate USD/SEK 0.1300 0.1100 - 0.1278 0.1169 -
Foreign exchange derivatives, AUD/USD
Nominal amount - 9 301 - 4 740 8 949 796
Average exchange rate AUD/USD - 1.3800 - 1.0819 1.3823 1.3928
Foreign exchange derivatives, other currency pairs
Nominal amount 13 351 21 969 2 204 15 338 39 155 12 125
Total 164 263 593 898 85 468 212 568 679 233 105 105
NOTES | GROUP
HANDELSBANKEN | ANNUAL REPORT 2019 151
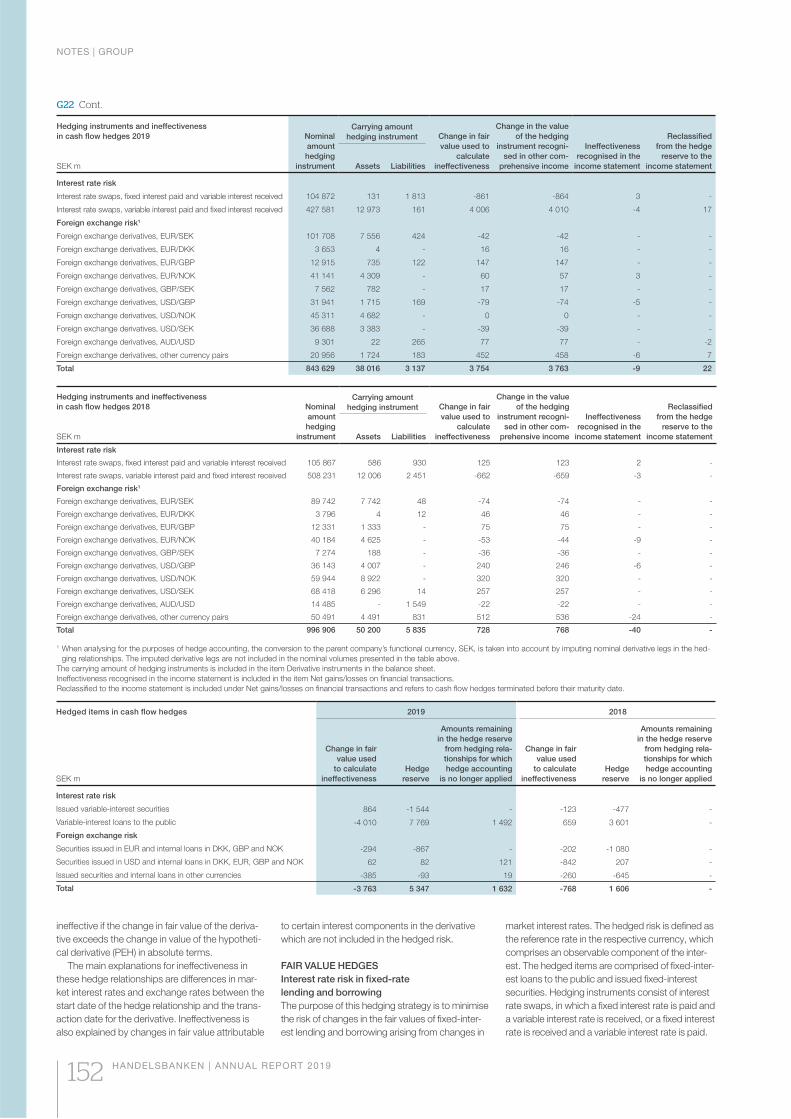
G22 Cont.
Hedged items in cash flow hedges 2019 2018
SEK m
Change in fair
value used
to calculate
ineffectiveness
Hedge
reserve
Amounts remaining
in the hedge reserve
from hedging rela-
tionships for which
hedge accounting
is no longer applied
Change in fair
value used
to calculate
ineffectiveness
Hedge
reserve
Amounts remaining
in the hedge reserve
from hedging rela-
tionships for which
hedge accounting
is no longer applied
Interest rate risk
Issued variable-interest securities 864 -1 544 - -123 -477 -
Variable-interest loans to the public -4 010 7 769 1 492 659 3 601 -
Foreign exchange risk
Securities issued in EUR and internal loans in DKK, GBP and NOK -294 -867 - -202 -1 080 -
Securities issued in USD and internal loans in DKK, EUR, GBP and NOK 62 82 121 -842 207 -
Issued securities and internal loans in other currencies -385 -93 19 -260 -645 -
Total -3 763 5 347 1 632 -768 1 606 -
Hedging instruments and ineffectiveness
in cash flow hedges 2019
SEK m
Nominal
amount
hedging
instrument
Carrying amount
hedging instrument Change in fair
value used to
calculate
ineffectiveness
Change in the value
of the hedging
instrument recogni-
sed in other com-
prehensive income
Ineffectiveness
recognised in the
income statement
Reclassified
from the hedge
reserve to the
income statementAssets Liabilities
Interest rate risk
Interest rate swaps, fixed interest paid and variable interest received 104 872 131 1 813 -861 -864 3 -
Interest rate swaps, variable interest paid and fixed interest received 427 581 12 973 161 4 006 4 010 -4 17
Foreign exchange risk1
Foreign exchange derivatives, EUR/SEK 101 708 7 556 424 -42 -42 - -
Foreign exchange derivatives, EUR/DKK 3 653 4 - 16 16 - -
Foreign exchange derivatives, EUR/GBP 12 915 735 122 147 147 - -
Foreign exchange derivatives, EUR/NOK 41 141 4 309 - 60 57 3 -
Foreign exchange derivatives, GBP/SEK 7 562 782 - 17 17 - -
Foreign exchange derivatives, USD/GBP 31 941 1 715 169 -79 -74 -5 -
Foreign exchange derivatives, USD/NOK 45 311 4 682 - 0 0 - -
Foreign exchange derivatives, USD/SEK 36 688 3 383 - -39 -39 - -
Foreign exchange derivatives, AUD/USD 9 301 22 265 77 77 - -2
Foreign exchange derivatives, other currency pairs 20 956 1 724 183 452 458 -6 7
Total 843 629 38 016 3 137 3 754 3 763 -9 22
Hedging instruments and ineffectiveness
in cash flow hedges 2018
SEK m
Nominal
amount
hedging
instrument
Carrying amount
hedging instrument Change in fair
value used to
calculate
ineffectiveness
Change in the value
of the hedging
instrument recogni-
sed in other com-
prehensive income
Ineffectiveness
recognised in the
income statement
Reclassified
from the hedge
reserve to the
income statementAssets Liabilities
Interest rate risk
Interest rate swaps, fixed interest paid and variable interest received 105 867 586 930 125 123 2 -
Interest rate swaps, variable interest paid and fixed interest received 508 231 12 006 2 451 -662 -659 -3 -
Foreign exchange risk1
Foreign exchange derivatives, EUR/SEK 89 742 7 742 48 -74 -74 - -
Foreign exchange derivatives, EUR/DKK 3 796 4 12 46 46 - -
Foreign exchange derivatives, EUR/GBP 12 331 1 333 - 75 75 - -
Foreign exchange derivatives, EUR/NOK 40 184 4 625 - -53 -44 -9 -
Foreign exchange derivatives, GBP/SEK 7 274 188 - -36 -36 - -
Foreign exchange derivatives, USD/GBP 36 143 4 007 - 240 246 -6 -
Foreign exchange derivatives, USD/NOK 59 944 8 922 - 320 320 - -
Foreign exchange derivatives, USD/SEK 68 418 6 296 14 257 257 - -
Foreign exchange derivatives, AUD/USD 14 485 - 1 549 -22 -22 - -
Foreign exchange derivatives, other currency pairs 50 491 4 491 831 512 536 -24 -
Total 996 906 50 200 5 835 728 768 -40 -
1 When analysing for the purposes of hedge accounting, the conversion to the parent company’s functional currency, SEK, is taken into account by imputing nominal derivative legs in the hed-
ging relationships. The imputed derivative legs are not included in the nominal volumes presented in the table above.
The carrying amount of hedging instruments is included in the item Derivative instruments in the balance sheet.
Ineffectiveness recognised in the income statement is included in the item Net gains/losses on financial transactions.
Reclassified to the income statement is included under Net gains/losses on financial transactions and refers to cash flow hedges terminated before their maturity date.
ineffective if the change in fair value of the deriva-
tive exceeds the change in value of the hypotheti-
cal derivative (PEH) in absolute terms.
The main explanations for ineffectiveness in
these hedge relationships are differences in mar-
ket interest rates and exchange rates between the
start date of the hedge relationship and the trans-
action date for the derivative. Ineffectiveness is
also explained by changes in fair value attributable
to certain interest components in the derivative
which are not included in the hedged risk.
FAIR VALUE HEDGES
Interest rate risk in fixed-rate
lending and borrowing
The purpose of this hedging strategy is to minimise
the risk of changes in the fair values of fixed-inter-
est lending and borrowing arising from changes in
market interest rates. The hedged risk is defined as
the reference rate in the respective currency, which
comprises an observable component of the inter-
est. The hedged items are comprised of fixed-inter-
est loans to the public and issued fixed-interest
securities. Hedging instruments consist of interest
rate swaps, in which a fixed interest rate is paid and
a variable interest rate is received, or a fixed interest
rate is received and a variable interest rate is paid.
NOTES | GROUP
152 HANDELSBANKEN | ANNUAL REPORT 2019
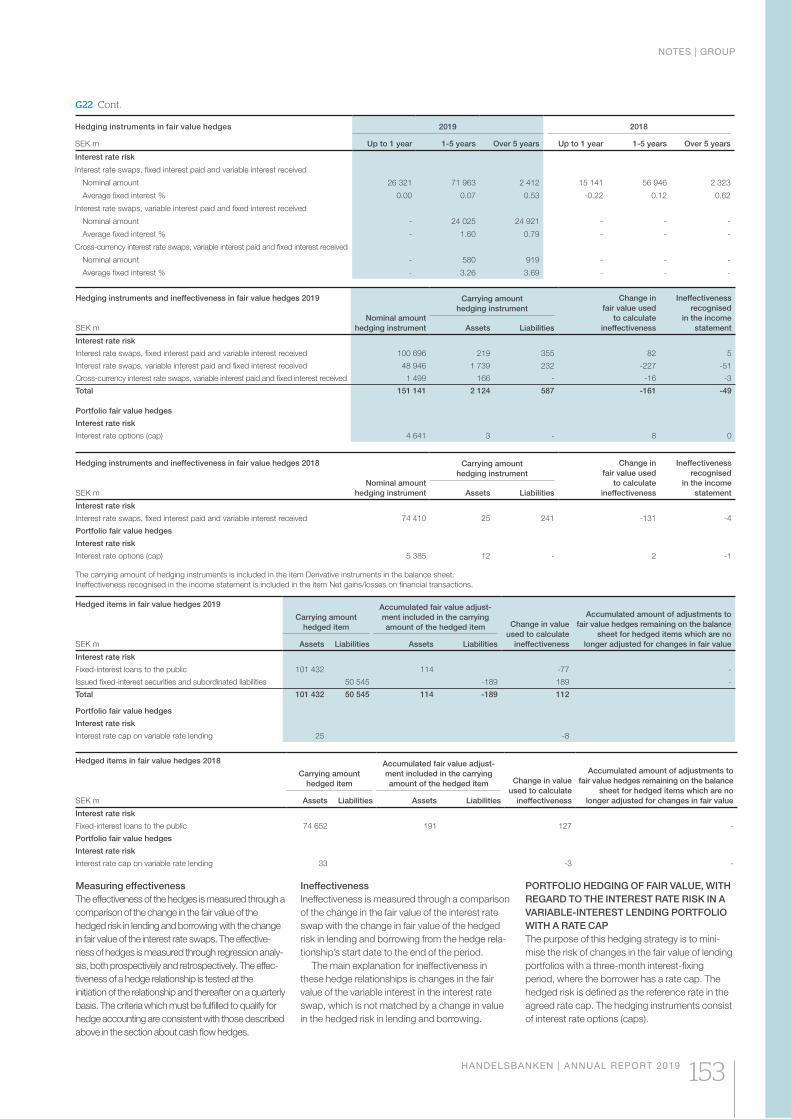
G22 Cont.
Hedging instruments in fair value hedges 2019 2018
SEK m Up to 1 year 1-5 years Over 5 years Up to 1 year 1-5 years Over 5 years
Interest rate risk
Interest rate swaps, fixed interest paid and variable interest received
Nominal amount 26 321 71 963 2 412 15 141 56 946 2 323
Average fixed interest % 0.00 0.07 0.53 -0.22 0.12 0.62
Interest rate swaps, variable interest paid and fixed interest received
Nominal amount - 24 025 24 921 - - -
Average fixed interest % - 1.60 0.79 - - -
Cross-currency interest rate swaps, variable interest paid and fixed interest received
Nominal amount - 580 919 - - -
Average fixed interest % - 3.26 3.69 - - -
Hedging instruments and ineffectiveness in fair value hedges 2019
SEK m
Nominal amount
hedging instrument
Carrying amount
hedging instrument
Change in
fair value used
to calculate
ineffectiveness
Ineffectiveness
recognised
in the income
statementAssets Liabilities
Interest rate risk
Interest rate swaps, fixed interest paid and variable interest received 100 696 219 355 82 5
Interest rate swaps, variable interest paid and fixed interest received 48 946 1 739 232 -227 -51
Cross-currency interest rate swaps, variable interest paid and fixed interest received 1 499 166 - -16 -3
Total 151 141 2 124 587 -161 -49
Portfolio fair value hedges
Interest rate risk
Interest rate options (cap) 4 641 3 - 8 0
Hedging instruments and ineffectiveness in fair value hedges 2018
SEK m
Nominal amount
hedging instrument
Carrying amount
hedging instrument
Change in
fair value used
to calculate
ineffectiveness
Ineffectiveness
recognised
in the income
statementAssets Liabilities
Interest rate risk
Interest rate swaps, fixed interest paid and variable interest received 74 410 25 241 -131 -4
Portfolio fair value hedges
Interest rate risk
Interest rate options (cap) 5 385 12 - 2 -1
The carrying amount of hedging instruments is included in the item Derivative instruments in the balance sheet.
Ineffectiveness recognised in the income statement is included in the item Net gains/losses on financial transactions.
Hedged items in fair value hedges 2019
SEK m
Carrying amount
hedged item
Accumulated fair value adjust-
ment included in the carrying
amount of the hedged item Change in value
used to calculate
ineffectiveness
Accumulated amount of adjustments to
fair value hedges remaining on the balance
sheet for hedged items which are no
longer adjusted for changes in fair valueAssets Liabilities Assets Liabilities
Interest rate risk
Fixed-interest loans to the public 101 432 114 -77 -
Issued fixed-interest securities and subordinated liabilities 50 545 -189 189 -
Total 101 432 50 545 114 -189 112
Portfolio fair value hedges
Interest rate risk
Interest rate cap on variable rate lending 25 -8
Hedged items in fair value hedges 2018
SEK m
Carrying amount
hedged item
Accumulated fair value adjust-
ment included in the carrying
amount of the hedged item Change in value
used to calculate
ineffectiveness
Accumulated amount of adjustments to
fair value hedges remaining on the balance
sheet for hedged items which are no
longer adjusted for changes in fair valueAssets Liabilities Assets Liabilities
Interest rate risk
Fixed-interest loans to the public 74 652 191 127 -
Portfolio fair value hedges
Interest rate risk
Interest rate cap on variable rate lending 33 -3 -
Measuring effectiveness
The effectiveness of the hedges is measured through a
comparison of the change in the fair value of the
hedged risk in lending and borrowing with the change
in fair value of the interest rate swaps. The effective-
ness of hedges is measured through regression analy-
sis, both prospectively and retrospectively. The effec-
tiveness of a hedge relationship is tested at the
initiation of the relationship and thereafter on a quarterly
basis. The criteria which must be fulfilled to qualify for
hedge accounting are consistent with those described
above in the section about cash flow hedges.
Ineffectiveness
Ineffectiveness is measured through a comparison
of the change in the fair value of the interest rate
swap with the change in fair value of the hedged
risk in lending and borrowing from the hedge rela-
tionship’s start date to the end of the period.
The main explanation for ineffectiveness in
these hedge relationships is changes in the fair
value of the variable interest in the interest rate
swap, which is not matched by a change in value
in the hedged risk in lending and borrowing.
PORTFOLIO HEDGING OF FAIR VALUE, WITH
REGARD TO THE INTEREST RATE RISK IN A
VARIABLE-INTEREST LENDING PORTFOLIO
WITH A RATE CAP
The purpose of this hedging strategy is to mini-
mise the risk of changes in the fair value of lending
portfolios with a three-month interest-fixing
period, where the borrower has a rate cap. The
hedged risk is defined as the reference rate in the
agreed rate cap. The hedging instruments consist
of interest rate options (caps).
NOTES | GROUP
HANDELSBANKEN | ANNUAL REPORT 2019 153
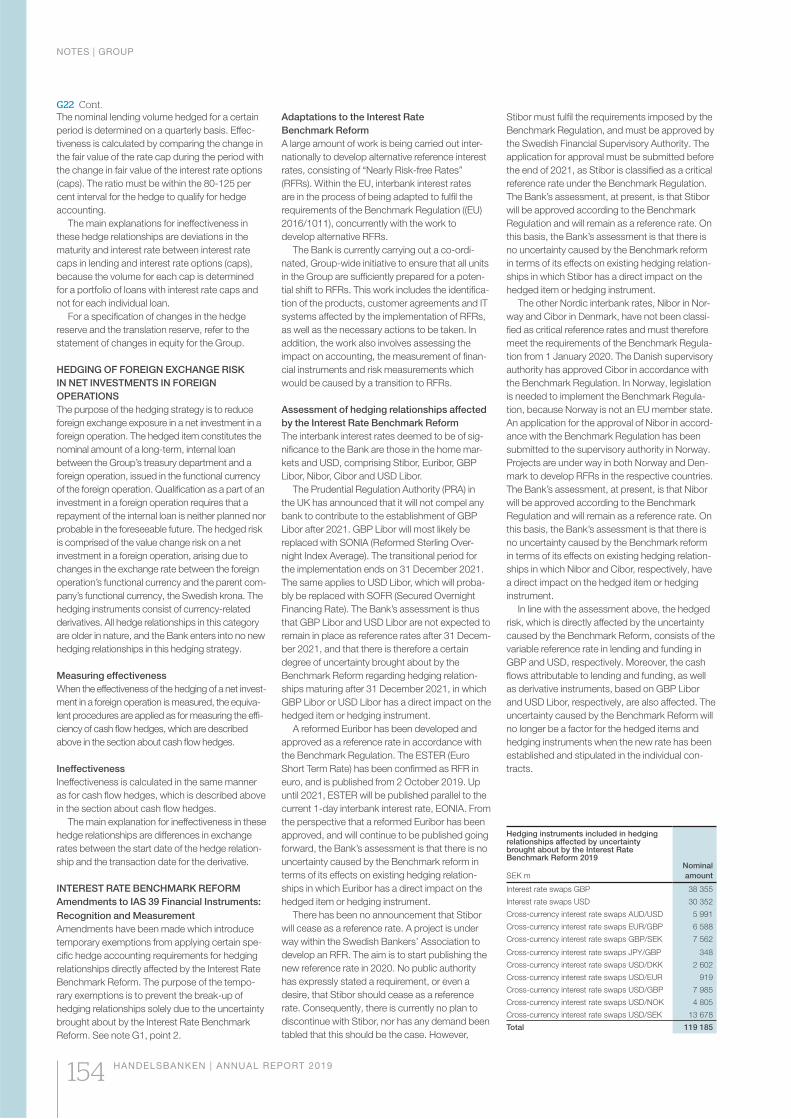
G22 Cont.
Hedging instruments included in hedging relationships affected by uncertainty brought about by the Interest Rate Benchmark Reform 2019
SEK m
Nominal
amount
Interest rate swaps GBP 38 355
Interest rate swaps USD 30 352
Cross-currency interest rate swaps AUD/USD 5 991
Cross-currency interest rate swaps EUR/GBP 6 588
Cross-currency interest rate swaps GBP/SEK 7 562
Cross-currency interest rate swaps JPY/GBP 348
Cross-currency interest rate swaps USD/DKK 2 602
Cross-currency interest rate swaps USD/EUR 919
Cross-currency interest rate swaps USD/GBP 7 985
Cross-currency interest rate swaps USD/NOK 4 805
Cross-currency interest rate swaps USD/SEK 13 678
Total 119 185
The nominal lending volume hedged for a certain
period is determined on a quarterly basis. Effec-
tiveness is calculated by comparing the change in
the fair value of the rate cap during the period with
the change in fair value of the interest rate options
(caps). The ratio must be within the 80-125 per
cent interval for the hedge to qualify for hedge
accounting.
The main explanations for ineffectiveness in
these hedge relationships are deviations in the
maturity and interest rate between interest rate
caps in lending and interest rate options (caps),
because the volume for each cap is determined
for a portfolio of loans with interest rate caps and
not for each individual loan.
For a specification of changes in the hedge
reserve and the translation reserve, refer to the
statement of changes in equity for the Group.
HEDGING OF FOREIGN EXCHANGE RISK
IN NET INVESTMENTS IN FOREIGN
OPERATIONS
The purpose of the hedging strategy is to reduce
foreign exchange exposure in a net investment in a
foreign operation. The hedged item constitutes the
nominal amount of a long-term, internal loan
between the Group’s treasury department and a
foreign operation, issued in the functional currency
of the foreign operation. Qualification as a part of an
investment in a foreign operation requires that a
repayment of the internal loan is neither planned nor
probable in the foreseeable future. The hedged risk
is comprised of the value change risk on a net
investment in a foreign operation, arising due to
changes in the exchange rate between the foreign
operation’s functional currency and the parent com-
pany’s functional currency, the Swedish krona. The
hedging instruments consist of currency-related
derivatives. All hedge relationships in this category
are older in nature, and the Bank enters into no new
hedging relationships in this hedging strategy.
Measuring effectiveness
When the effectiveness of the hedging of a net invest-
ment in a foreign operation is measured, the equiva-
lent procedures are applied as for measuring the effi-
ciency of cash flow hedges, which are described
above in the section about cash flow hedges.
Ineffectiveness
Ineffectiveness is calculated in the same manner
as for cash flow hedges, which is described above
in the section about cash flow hedges.
The main explanation for ineffectiveness in these
hedge relationships are differences in exchange
rates between the start date of the hedge relation-
ship and the transaction date for the derivative.
INTEREST RATE BENCHMARK REFORM
Amendments to IAS 39 Financial Instruments:
Recognition and Measurement
Amendments have been made which introduce
temporary exemptions from applying certain spe-
cific hedge accounting requirements for hedging
relationships directly affected by the Interest Rate
Benchmark Reform. The purpose of the tempo-
rary exemptions is to prevent the break-up of
hedging relationships solely due to the uncertainty
brought about by the Interest Rate Benchmark
Reform. See note G1, point 2.
Adaptations to the Interest Rate
Benchmark Reform
A large amount of work is being carried out inter-
nationally to develop alternative reference interest
rates, consisting of “Nearly Risk-free Rates”
(RFRs). Within the EU, interbank interest rates
are in the process of being adapted to fulfil the
requirements of the Benchmark Regulation ((EU)
2016/1011), concurrently with the work to
develop alternative RFRs.
The Bank is currently carrying out a co-ordi-
nated, Group-wide initiative to ensure that all units
in the Group are sufficiently prepared for a poten-
tial shift to RFRs. This work includes the identifica-
tion of the products, customer agreements and IT
systems affected by the implementation of RFRs,
as well as the necessary actions to be taken. In
addition, the work also involves assessing the
impact on accounting, the measurement of finan-
cial instruments and risk measurements which
would be caused by a transition to RFRs.
Assessment of hedging relationships affected
by the Interest Rate Benchmark Reform
The interbank interest rates deemed to be of sig-
nificance to the Bank are those in the home mar-
kets and USD, comprising Stibor, Euribor, GBP
Libor, Nibor, Cibor and USD Libor.
The Prudential Regulation Authority (PRA) in
the UK has announced that it will not compel any
bank to contribute to the establishment of GBP
Libor after 2021. GBP Libor will most likely be
replaced with SONIA (Reformed Sterling Over-
night Index Average). The transitional period for
the implementation ends on 31 December 2021.
The same applies to USD Libor, which will proba-
bly be replaced with SOFR (Secured Overnight
Financing Rate). The Bank’s assessment is thus
that GBP Libor and USD Libor are not expected to
remain in place as reference rates after 31 Decem-
ber 2021, and that there is therefore a certain
degree of uncertainty brought about by the
Benchmark Reform regarding hedging relation-
ships maturing after 31 December 2021, in which
GBP Libor or USD Libor has a direct impact on the
hedged item or hedging instrument.
A reformed Euribor has been developed and
approved as a reference rate in accordance with
the Benchmark Regulation. The ESTER (Euro
Short Term Rate) has been confirmed as RFR in
euro, and is published from 2 October 2019. Up
until 2021, ESTER will be published parallel to the
current 1-day interbank interest rate, EONIA. From
the perspective that a reformed Euribor has been
approved, and will continue to be published going
forward, the Bank’s assessment is that there is no
uncertainty caused by the Benchmark reform in
terms of its effects on existing hedging relation-
ships in which Euribor has a direct impact on the
hedged item or hedging instrument.
There has been no announcement that Stibor
will cease as a reference rate. A project is under
way within the Swedish Bankers’ Association to
develop an RFR. The aim is to start publishing the
new reference rate in 2020. No public authority
has expressly stated a requirement, or even a
desire, that Stibor should cease as a reference
rate. Consequently, there is currently no plan to
discontinue with Stibor, nor has any demand been
tabled that this should be the case. However,
Stibor must fulfil the requirements imposed by the
Benchmark Regulation, and must be approved by
the Swedish Financial Supervisory Authority. The
application for approval must be submitted before
the end of 2021, as Stibor is classified as a critical
reference rate under the Benchmark Regulation.
The Bank’s assessment, at present, is that Stibor
will be approved according to the Benchmark
Regulation and will remain as a reference rate. On
this basis, the Bank’s assessment is that there is
no uncertainty caused by the Benchmark reform
in terms of its effects on existing hedging relation-
ships in which Stibor has a direct impact on the
hedged item or hedging instrument.
The other Nordic interbank rates, Nibor in Nor-
way and Cibor in Denmark, have not been classi-
fied as critical reference rates and must therefore
meet the requirements of the Benchmark Regula-
tion from 1 January 2020. The Danish supervisory
authority has approved Cibor in accordance with
the Benchmark Regulation. In Norway, legislation
is needed to implement the Benchmark Regula-
tion, because Norway is not an EU member state.
An application for the approval of Nibor in accord-
ance with the Benchmark Regulation has been
submitted to the supervisory authority in Norway.
Projects are under way in both Norway and Den-
mark to develop RFRs in the respective countries.
The Bank’s assessment, at present, is that Nibor
will be approved according to the Benchmark
Regulation and will remain as a reference rate. On
this basis, the Bank’s assessment is that there is
no uncertainty caused by the Benchmark reform
in terms of its effects on existing hedging relation-
ships in which Nibor and Cibor, respectively, have
a direct impact on the hedged item or hedging
instrument.
In line with the assessment above, the hedged
risk, which is directly affected by the uncertainty
caused by the Benchmark Reform, consists of the
variable reference rate in lending and funding in
GBP and USD, respectively. Moreover, the cash
flows attributable to lending and funding, as well
as derivative instruments, based on GBP Libor
and USD Libor, respectively, are also affected. The
uncertainty caused by the Benchmark Reform will
no longer be a factor for the hedged items and
hedging instruments when the new rate has been
established and stipulated in the individual con-
tracts.
NOTES | GROUP
154 HANDELSBANKEN | ANNUAL REPORT 2019
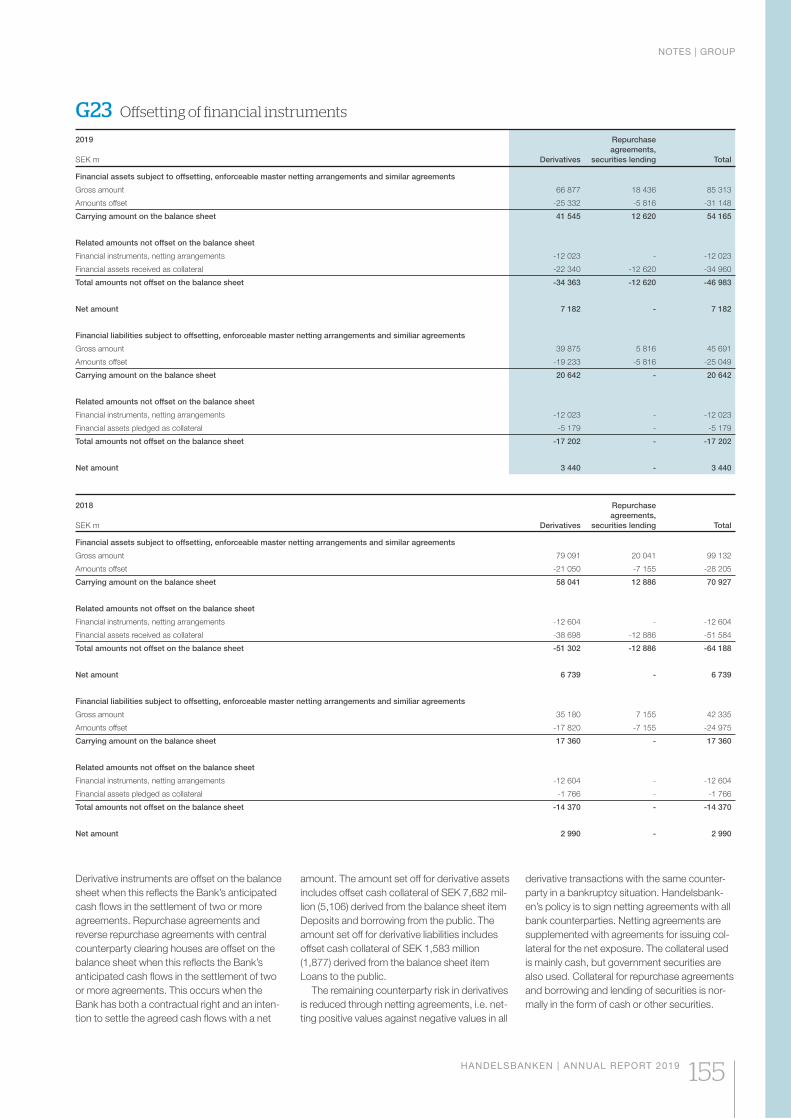
G23 Offsetting of financial instruments
2019
SEK m Derivatives
Repurchase
agreements,
securities lending Total
Financial assets subject to offsetting, enforceable master netting arrangements and similar agreements
Gross amount 66 877 18 436 85 313
Amounts offset -25 332 -5 816 -31 148
Carrying amount on the balance sheet 41 545 12 620 54 165
Related amounts not offset on the balance sheet
Financial instruments, netting arrangements -12 023 - -12 023
Financial assets received as collateral -22 340 -12 620 -34 960
Total amounts not offset on the balance sheet -34 363 -12 620 -46 983
Net amount 7 182 - 7 182
Financial liabilities subject to offsetting, enforceable master netting arrangements and similiar agreements
Gross amount 39 875 5 816 45 691
Amounts offset -19 233 -5 816 -25 049
Carrying amount on the balance sheet 20 642 - 20 642
Related amounts not offset on the balance sheet
Financial instruments, netting arrangements -12 023 - -12 023
Financial assets pledged as collateral -5 179 - -5 179
Total amounts not offset on the balance sheet -17 202 - -17 202
Net amount 3 440 - 3 440
2018
SEK m Derivatives
Repurchase
agreements,
securities lending Total
Financial assets subject to offsetting, enforceable master netting arrangements and similar agreements
Gross amount 79 091 20 041 99 132
Amounts offset -21 050 -7 155 -28 205
Carrying amount on the balance sheet 58 041 12 886 70 927
Related amounts not offset on the balance sheet
Financial instruments, netting arrangements -12 604 - -12 604
Financial assets received as collateral -38 698 -12 886 -51 584
Total amounts not offset on the balance sheet -51 302 -12 886 -64 188
Net amount 6 739 - 6 739
Financial liabilities subject to offsetting, enforceable master netting arrangements and similiar agreements
Gross amount 35 180 7 155 42 335
Amounts offset -17 820 -7 155 -24 975
Carrying amount on the balance sheet 17 360 - 17 360
Related amounts not offset on the balance sheet
Financial instruments, netting arrangements -12 604 - -12 604
Financial assets pledged as collateral -1 766 - -1 766
Total amounts not offset on the balance sheet -14 370 - -14 370
Net amount 2 990 - 2 990
Derivative instruments are offset on the balance
sheet when this reflects the Bank’s anticipated
cash flows in the settlement of two or more
agreements. Repurchase agreements and
reverse repurchase agreements with central
counterparty clearing houses are offset on the
balance sheet when this reflects the Bank’s
anticipated cash flows in the settlement of two
or more agreements. This occurs when the
Bank has both a contractual right and an inten-
tion to settle the agreed cash flows with a net
amount. The amount set off for derivative assets
includes offset cash collateral of SEK 7,682 mil-
lion (5,106) derived from the balance sheet item
Deposits and borrowing from the public. The
amount set off for derivative liabilities includes
offset cash collateral of SEK 1,583 million
(1,877) derived from the balance sheet item
Loans to the public.
The remaining counterparty risk in derivatives
is reduced through netting agreements, i.e. net-
ting positive values against negative values in all
derivative transactions with the same counter-
party in a bankruptcy situation. Handelsbank-
en’s policy is to sign netting agreements with all
bank counterparties. Netting agreements are
supplemented with agreements for issuing col-
lateral for the net exposure. The collateral used
is mainly cash, but government securities are
also used. Collateral for repurchase agreements
and borrowing and lending of securities is nor-
mally in the form of cash or other securities.
NOTES | GROUP
HANDELSBANKEN | ANNUAL REPORT 2019 155
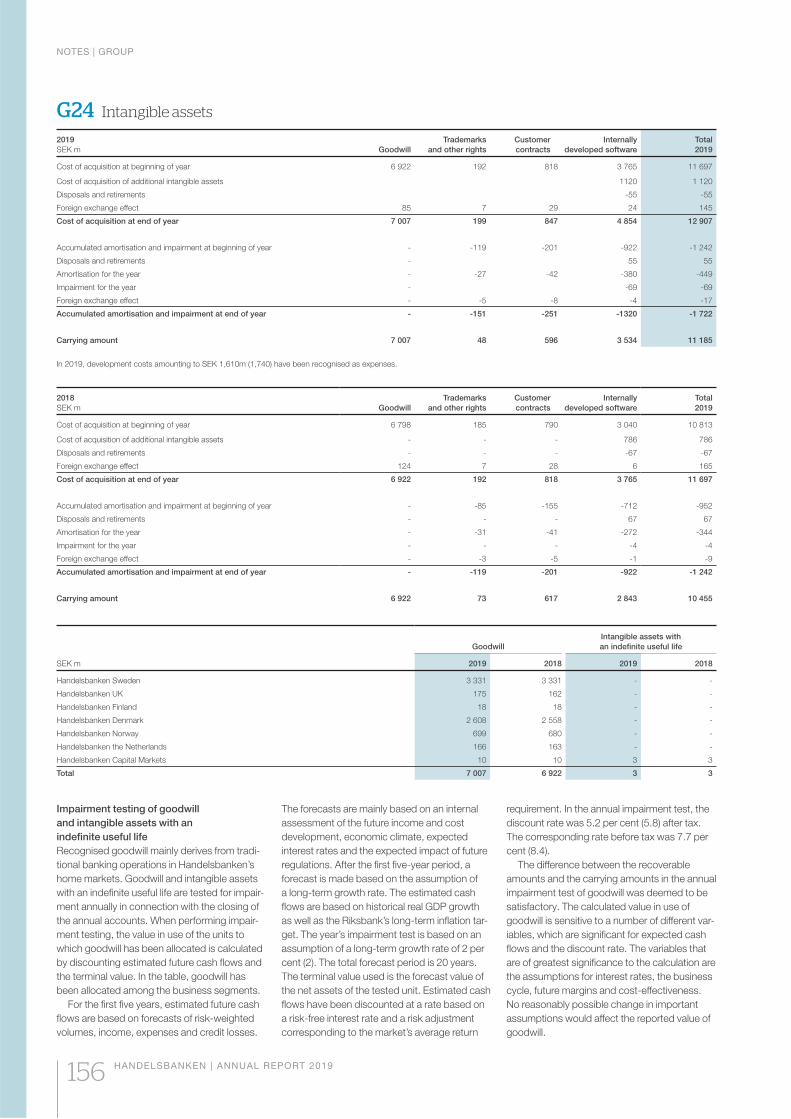
G24 Intangible assets
2019
SEK m Goodwill
Trademarks
and other rights
Customer
contracts
Internally
developed software
Total
2019
Cost of acquisition at beginning of year 6 922 192 818 3 765 11 697
Cost of acquisition of additional intangible assets 1120 1 120
Disposals and retirements -55 -55
Foreign exchange effect 85 7 29 24 145
Cost of acquisition at end of year 7 007 199 847 4 854 12 907
Accumulated amortisation and impairment at beginning of year - -119 -201 -922 -1 242
Disposals and retirements - 55 55
Amortisation for the year - -27 -42 -380 -449
Impairment for the year - -69 -69
Foreign exchange effect - -5 -8 -4 -17
Accumulated amortisation and impairment at end of year - -151 -251 -1320 -1 722
Carrying amount 7 007 48 596 3 534 11 185
In 2019, development costs amounting to SEK 1,610m (1,740) have been recognised as expenses.
2018
SEK m Goodwill
Trademarks
and other rights
Customer
contracts
Internally
developed software
Total
2019
Cost of acquisition at beginning of year 6 798 185 790 3 040 10 813
Cost of acquisition of additional intangible assets - - - 786 786
Disposals and retirements - - - -67 -67
Foreign exchange effect 124 7 28 6 165
Cost of acquisition at end of year 6 922 192 818 3 765 11 697
Accumulated amortisation and impairment at beginning of year - -85 -155 -712 -952
Disposals and retirements - - - 67 67
Amortisation for the year - -31 -41 -272 -344
Impairment for the year - - - -4 -4
Foreign exchange effect - -3 -5 -1 -9
Accumulated amortisation and impairment at end of year - -119 -201 -922 -1 242
Carrying amount 6 922 73 617 2 843 10 455
SEK m
Goodwill
Intangible assets with
an indefinite useful life
2019 2018 2019 2018
Handelsbanken Sweden 3 331 3 331 - -
Handelsbanken UK 175 162 - -
Handelsbanken Finland 18 18 - -
Handelsbanken Denmark 2 608 2 558 - -
Handelsbanken Norway 699 680 - -
Handelsbanken the Netherlands 166 163 - -
Handelsbanken Capital Markets 10 10 3 3
Total 7 007 6 922 3 3
Impairment testing of goodwill
and intangible assets with an
indefinite useful life
Recognised goodwill mainly derives from tradi-
tional banking operations in Handelsbanken’s
home markets. Goodwill and intangible assets
with an indefinite useful life are tested for impair-
ment annually in connection with the closing of
the annual accounts. When performing impair-
ment testing, the value in use of the units to
which goodwill has been allocated is calculated
by discounting estimated future cash flows and
the terminal value. In the table, goodwill has
been allocated among the business segments.
For the first five years, estimated future cash
flows are based on forecasts of risk-weighted
volumes, income, expenses and credit losses.
The forecasts are mainly based on an internal
assessment of the future income and cost
development, economic climate, expected
interest rates and the expected impact of future
regulations. After the first five-year period, a
forecast is made based on the assumption of
a long-term growth rate. The estimated cash
flows are based on historical real GDP growth
as well as the Riksbank’s long-term inflation tar-
get. The year’s impairment test is based on an
assumption of a long-term growth rate of 2 per
cent (2). The total forecast period is 20 years.
The terminal value used is the forecast value of
the net assets of the tested unit. Estimated cash
flows have been discounted at a rate based on
a risk-free interest rate and a risk adjustment
corresponding to the market’s average return
requirement. In the annual impairment test, the
discount rate was 5.2 per cent (5.8) after tax.
The corresponding rate before tax was 7.7 per
cent (8.4).
The difference between the recoverable
amounts and the carrying amounts in the annual
impairment test of goodwill was deemed to be
satisfactory. The calculated value in use of
goodwill is sensitive to a number of different var-
iables, which are significant for expected cash
flows and the discount rate. The variables that
are of greatest significance to the calculation are
the assumptions for interest rates, the business
cycle, future margins and cost-effectiveness.
No reasonably possible change in important
assumptions would affect the reported value of
goodwill.
NOTES | GROUP
156 HANDELSBANKEN | ANNUAL REPORT 2019
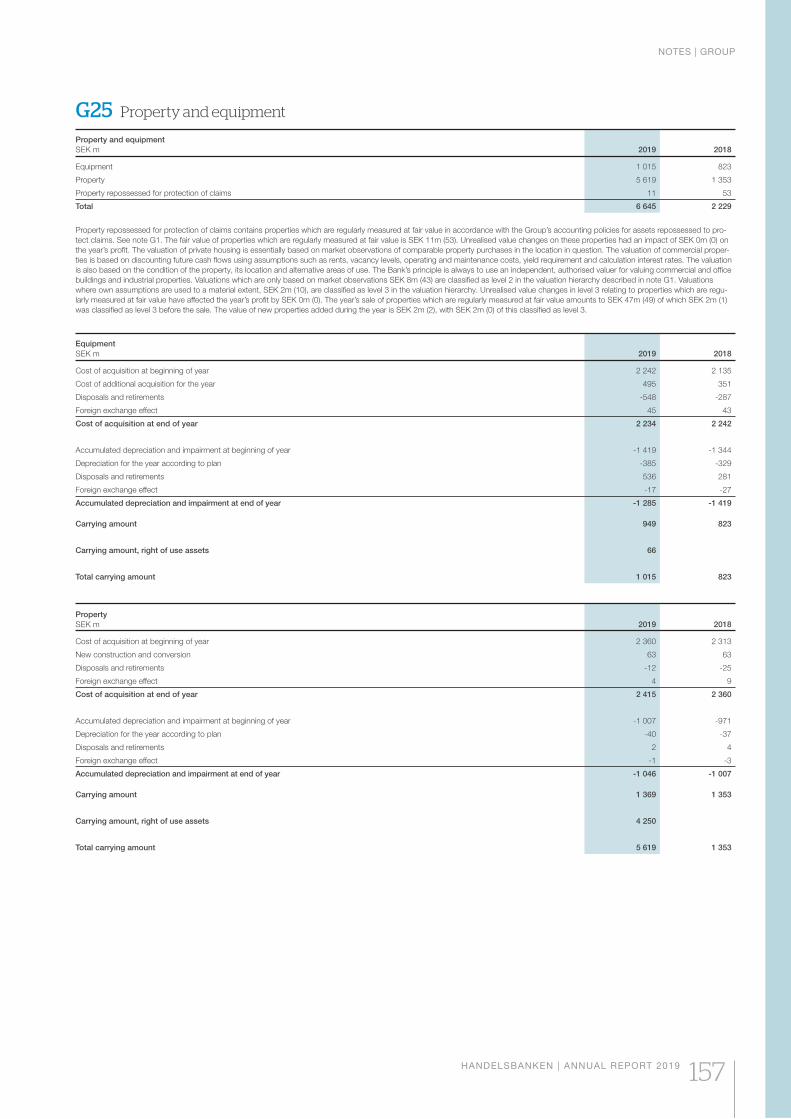
G25 Property and equipment
Property and equipment
SEK m 2019 2018
Equipment 1 015 823
Property 5 619 1 353
Property repossessed for protection of claims 11 53
Total 6 645 2 229
Property repossessed for protection of claims contains properties which are regularly measured at fair value in accordance with the Group’s accounting policies for assets repossessed to pro-
tect claims. See note G1. The fair value of properties which are regularly measured at fair value is SEK 11m (53). Unrealised value changes on these properties had an impact of SEK 0m (0) on
the year’s profit. The valuation of private housing is essentially based on market observations of comparable property purchases in the location in question. The valuation of commercial proper-
ties is based on discounting future cash flows using assumptions such as rents, vacancy levels, operating and maintenance costs, yield requirement and calculation interest rates. The valuation
is also based on the condition of the property, its location and alternative areas of use. The Bank’s principle is always to use an independent, authorised valuer for valuing commercial and office
buildings and industrial properties. Valuations which are only based on market observations SEK 8m (43) are classified as level 2 in the valuation hierarchy described in note G1. Valuations
where own assumptions are used to a material extent, SEK 2m (10), are classified as level 3 in the valuation hierarchy. Unrealised value changes in level 3 relating to properties which are regu-
larly measured at fair value have affected the year’s profit by SEK 0m (0). The year’s sale of properties which are regularly measured at fair value amounts to SEK 47m (49) of which SEK 2m (1)
was classified as level 3 before the sale. The value of new properties added during the year is SEK 2m (2), with SEK 2m (0) of this classified as level 3.
Equipment
SEK m 2019 2018
Cost of acquisition at beginning of year 2 242 2 135
Cost of additional acquisition for the year 495 351
Disposals and retirements -548 -287
Foreign exchange effect 45 43
Cost of acquisition at end of year 2 234 2 242
Accumulated depreciation and impairment at beginning of year -1 419 -1 344
Depreciation for the year according to plan -385 -329
Disposals and retirements 536 281
Foreign exchange effect -17 -27
Accumulated depreciation and impairment at end of year -1 285 -1 419
Carrying amount 949 823
Carrying amount, right of use assets 66
Total carrying amount 1 015 823
Property
SEK m 2019 2018
Cost of acquisition at beginning of year 2 360 2 313
New construction and conversion 63 63
Disposals and retirements -12 -25
Foreign exchange effect 4 9
Cost of acquisition at end of year 2 415 2 360
Accumulated depreciation and impairment at beginning of year -1 007 -971
Depreciation for the year according to plan -40 -37
Disposals and retirements 2 4
Foreign exchange effect -1 -3
Accumulated depreciation and impairment at end of year -1 046 -1 007
Carrying amount 1 369 1 353
Carrying amount, right of use assets 4 250
Total carrying amount 5 619 1 353
NOTES | GROUP
HANDELSBANKEN | ANNUAL REPORT 2019 157
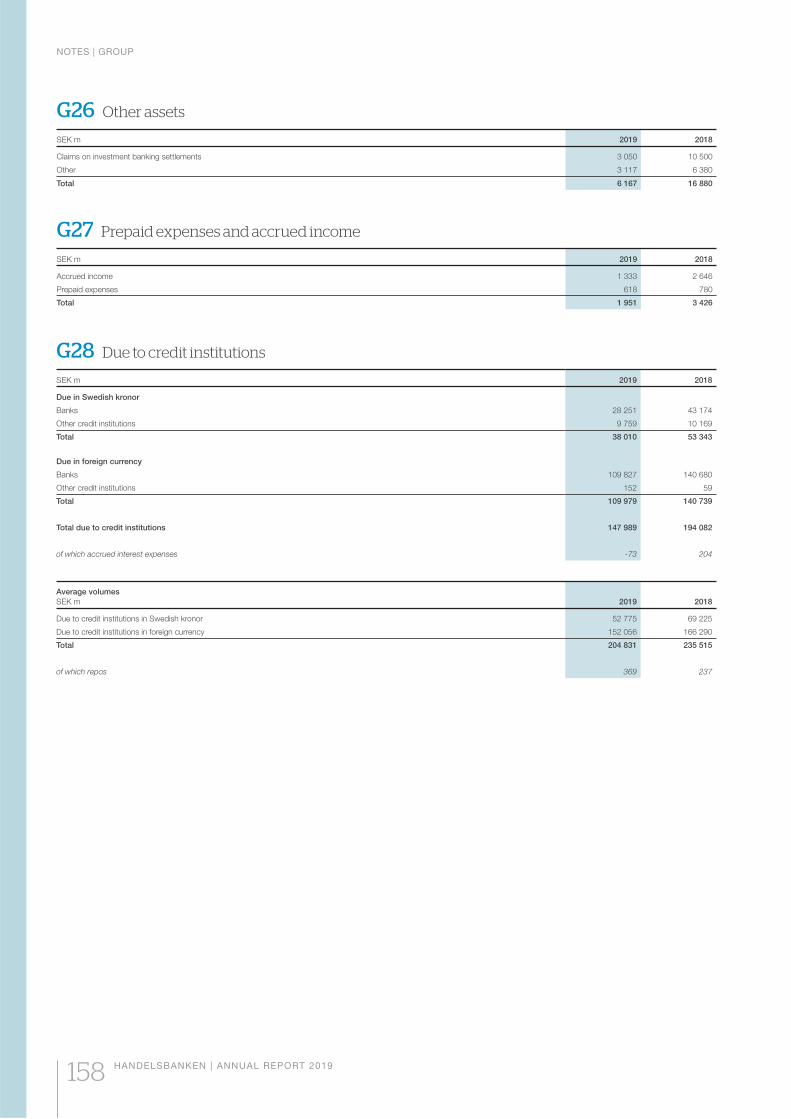
G26 Other assets
SEK m 2019 2018
Claims on investment banking settlements 3 050 10 500
Other 3 117 6 380
Total 6 167 16 880
G27 Prepaid expenses and accrued income
SEK m 2019 2018
Accrued income 1 333 2 646
Prepaid expenses 618 780
Total 1 951 3 426
G28 Due to credit institutions
SEK m 2019 2018
Due in Swedish kronor
Banks 28 251 43 174
Other credit institutions 9 759 10 169
Total 38 010 53 343
Due in foreign currency
Banks 109 827 140 680
Other credit institutions 152 59
Total 109 979 140 739
Total due to credit institutions 147 989 194 082
of which accrued interest expenses -73 204
Average volumes
SEK m 2019 2018
Due to credit institutions in Swedish kronor 52 775 69 225
Due to credit institutions in foreign currency 152 056 166 290
Total 204 831 235 515
of which repos 369 237
NOTES | GROUP
158 HANDELSBANKEN | ANNUAL REPORT 2019

G29 Deposits and borrowing from the public
Deposits from the public
SEK m 2019 2018
Deposits in Swedish kronor
Households 376 314 351 519
Companies 250 866 221 077
National Debt Office - -
Total 627 180 572 596
Deposits in foreign currency
Households 142 227 120 959
Companies 306 425 269 152
National Debt Office - -
Total 448 652 390 111
Total deposits from the public 1 075 832 962 707
Borrowing from the public
SEK m 2019 2018
Borrowing in Swedish kronor 22 290 30 507
Borrowing in foreign currency 19 703 15 273
Total borrowing from the public 41 993 45 780
Total deposits and borrowing from the public 1 117 825 1 008 487
of which accrued interest expenses 521 780
of which within insurance operations 7 224 7 501
Average volumes
SEK m 2019 2018
Deposits from the public
Deposits from the public in Swedish kronor 612 267 561 093
Deposits from the public in foreign currency 439 816 398 432
Total 1 052 083 959 525
Borrowing from the public
Borrowing in Swedish kronor 33 212 32 090
Borrowing in Swedish kronor, insurance operations 7 389 7 720
Borrowing in foreign currency 50 117 83 396
Total 90 718 123 206
of which repos 10 976 12 239
G30 Liabilities where the customer bears the value change risk
SEK m 2019 2018
Unit-linked and portfolio bond insurance liabilities 169 601 132 077
Other fund liabilities 5 387 4 225
Share of consolidated funds not owned - 44
Total 174 988 136 346
NOTES | GROUP
HANDELSBANKEN | ANNUAL REPORT 2019 159
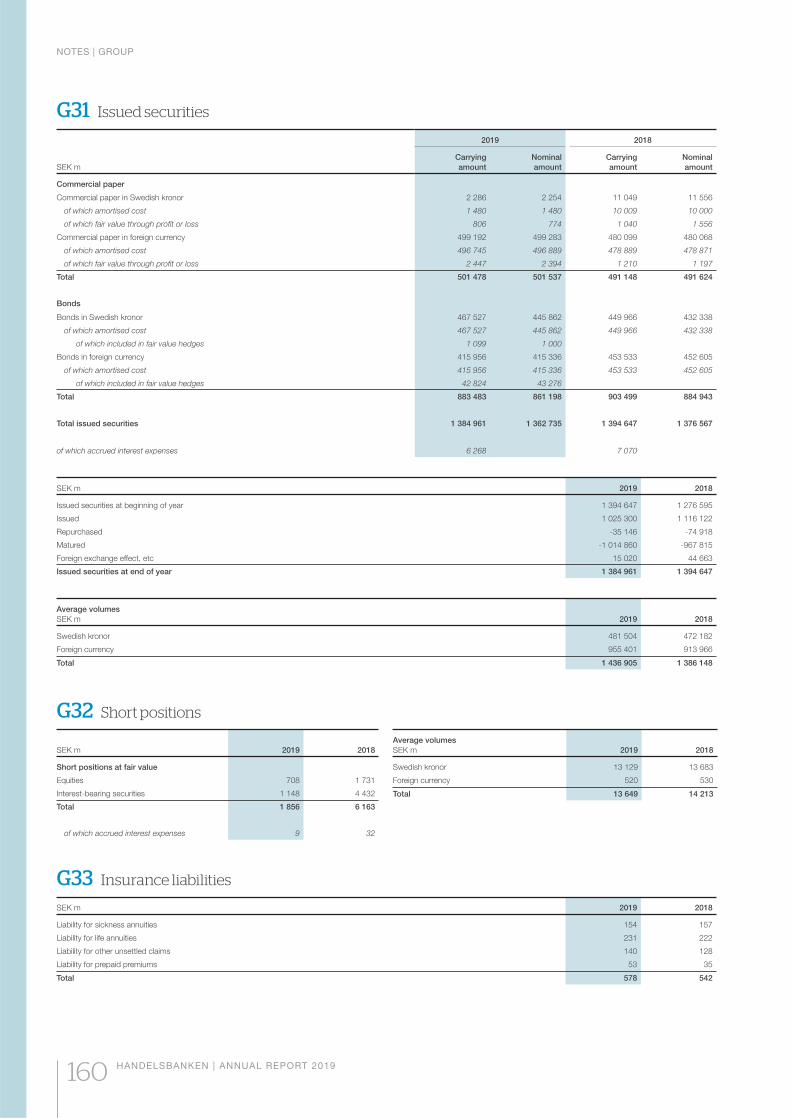
G31 Issued securities
SEK m
2019 2018
Carrying
amount
Nominal
amount
Carrying
amount
Nominal
amount
Commercial paper
Commercial paper in Swedish kronor 2 286 2 254 11 049 11 556
of which amortised cost 1 480 1 480 10 009 10 000
of which fair value through profit or loss 806 774 1 040 1 556
Commercial paper in foreign currency 499 192 499 283 480 099 480 068
of which amortised cost 496 745 496 889 478 889 478 871
of which fair value through profit or loss 2 447 2 394 1 210 1 197
Total 501 478 501 537 491 148 491 624
Bonds
Bonds in Swedish kronor 467 527 445 862 449 966 432 338
of which amortised cost 467 527 445 862 449 966 432 338
of which included in fair value hedges 1 099 1 000
Bonds in foreign currency 415 956 415 336 453 533 452 605
of which amortised cost 415 956 415 336 453 533 452 605
of which included in fair value hedges 42 824 43 276
Total 883 483 861 198 903 499 884 943
Total issued securities 1 384 961 1 362 735 1 394 647 1 376 567
of which accrued interest expenses 6 268 7 070
SEK m 2019 2018
Issued securities at beginning of year 1 394 647 1 276 595
Issued 1 025 300 1 116 122
Repurchased -35 146 -74 918
Matured -1 014 860 -967 815
Foreign exchange effect, etc 15 020 44 663
Issued securities at end of year 1 384 961 1 394 647
Average volumes
SEK m 2019 2018
Swedish kronor 481 504 472 182
Foreign currency 955 401 913 966
Total 1 436 905 1 386 148
G32 Short positions
SEK m 2019 2018
Short positions at fair value
Equities 708 1 731
Interest-bearing securities 1 148 4 432
Total 1 856 6 163
of which accrued interest expenses 9 32
G33 Insurance liabilities
SEK m 2019 2018
Liability for sickness annuities 154 157
Liability for life annuities 231 222
Liability for other unsettled claims 140 128
Liability for prepaid premiums 53 35
Total 578 542
Average volumes
SEK m 2019 2018
Swedish kronor 13 129 13 683
Foreign currency 520 530
Total 13 649 14 213
NOTES | GROUP
160 HANDELSBANKEN | ANNUAL REPORT 2019
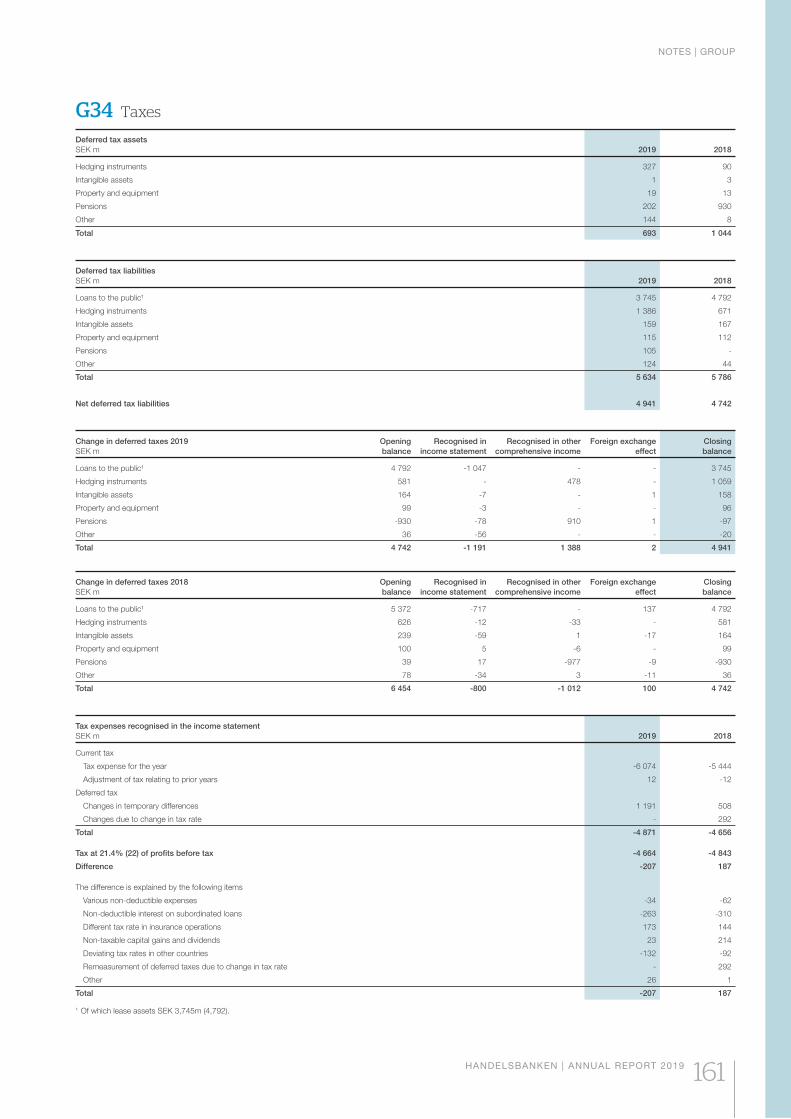
G34 Taxes
Deferred tax assets
SEK m 2019 2018
Hedging instruments 327 90
Intangible assets 1 3
Property and equipment 19 13
Pensions 202 930
Other 144 8
Total 693 1 044
Deferred tax liabilities
SEK m 2019 2018
Loans to the public¹ 3 745 4 792
Hedging instruments 1 386 671
Intangible assets 159 167
Property and equipment 115 112
Pensions 105 -
Other 124 44
Total 5 634 5 786
Net deferred tax liabilities 4 941 4 742
Change in deferred taxes 2019
SEK m
Opening
balance
Recognised in
income statement
Recognised in other
comprehensive income
Foreign exchange
effect
Closing
balance
Loans to the public¹ 4 792 -1 047 - - 3 745
Hedging instruments 581 - 478 - 1 059
Intangible assets 164 -7 - 1 158
Property and equipment 99 -3 - - 96
Pensions -930 -78 910 1 -97
Other 36 -56 - - -20
Total 4 742 -1 191 1 388 2 4 941
Change in deferred taxes 2018
SEK m
Opening
balance
Recognised in
income statement
Recognised in other
comprehensive income
Foreign exchange
effect
Closing
balance
Loans to the public¹ 5 372 -717 - 137 4 792
Hedging instruments 626 -12 -33 - 581
Intangible assets 239 -59 1 -17 164
Property and equipment 100 5 -6 - 99
Pensions 39 17 -977 -9 -930
Other 78 -34 3 -11 36
Total 6 454 -800 -1 012 100 4 742
Tax expenses recognised in the income statement
SEK m 2019 2018
Current tax
Tax expense for the year -6 074 -5 444
Adjustment of tax relating to prior years 12 -12
Deferred tax
Changes in temporary differences 1 191 508
Changes due to change in tax rate - 292
Total -4 871 -4 656
Tax at 21.4% (22) of profits before tax -4 664 -4 843
Difference -207 187
The difference is explained by the following items
Various non-deductible expenses -34 -62
Non-deductible interest on subordinated loans -263 -310
Different tax rate in insurance operations 173 144
Non-taxable capital gains and dividends 23 214
Deviating tax rates in other countries -132 -92
Remeasurement of deferred taxes due to change in tax rate - 292
Other 26 1
Total -207 187
1 Of which lease assets SEK 3,745m (4,792).
NOTES | GROUP
HANDELSBANKEN | ANNUAL REPORT 2019 161
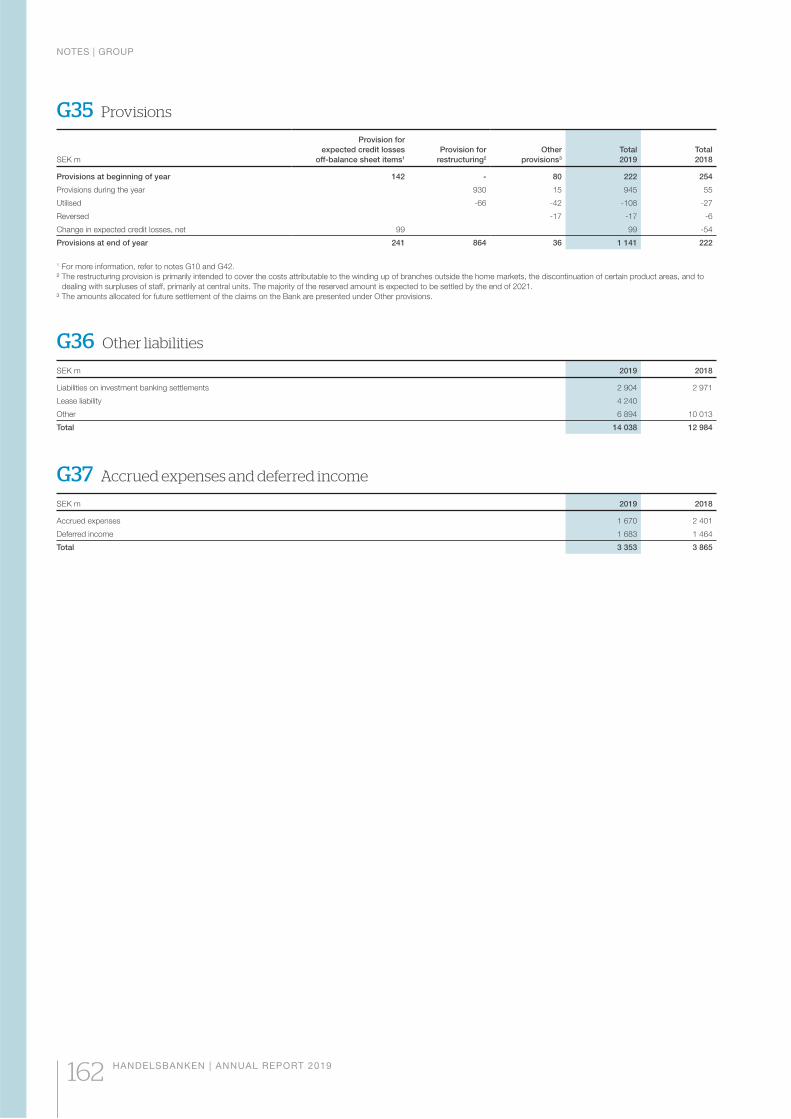
G36 Other liabilities
SEK m 2019 2018
Liabilities on investment banking settlements 2 904 2 971
Lease liability 4 240
Other 6 894 10 013
Total 14 038 12 984
G37 Accrued expenses and deferred income
SEK m 2019 2018
Accrued expenses 1 670 2 401
Deferred income 1 683 1 464
Total 3 353 3 865
G35 Provisions
SEK m
Provision for
expected credit losses
off-balance sheet items1
Provision for
restructuring2
Other
provisions3
Total
2019
Total
2018
Provisions at beginning of year 142 - 80 222 254
Provisions during the year 930 15 945 55
Utilised -66 -42 -108 -27
Reversed -17 -17 -6
Change in expected credit losses, net 99 99 -54
Provisions at end of year 241 864 36 1 141 222
1 For more information, refer to notes G10 and G42.
² The restructuring provision is primarily intended to cover the costs attributable to the winding up of branches outside the home markets, the discontinuation of certain product areas, and to
dealing with surpluses of staff, primarily at central units. The majority of the reserved amount is expected to be settled by the end of 2021.
³ The amounts allocated for future settlement of the claims on the Bank are presented under Other provisions.
NOTES | GROUP
162 HANDELSBANKEN | ANNUAL REPORT 2019
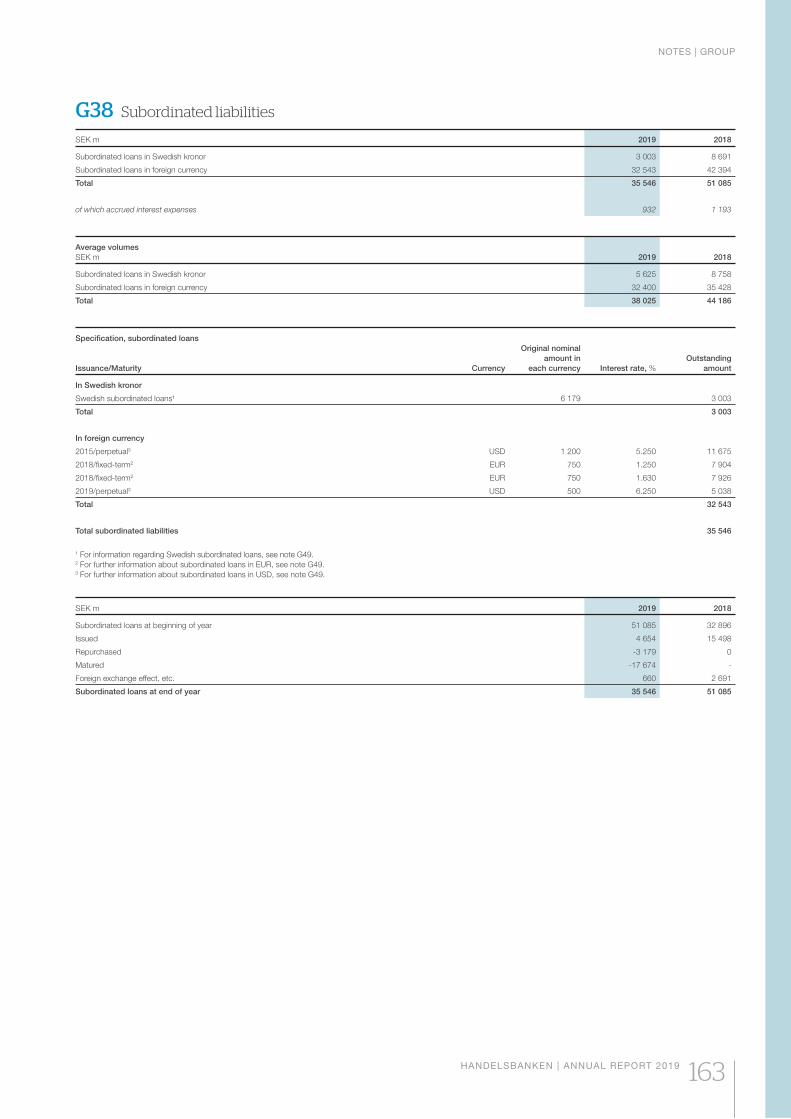
G38 Subordinated liabilities
SEK m 2019 2018
Subordinated loans in Swedish kronor 3 003 8 691
Subordinated loans in foreign currency 32 543 42 394
Total 35 546 51 085
of which accrued interest expenses 932 1 193
Average volumes
SEK m 2019 2018
Subordinated loans in Swedish kronor 5 625 8 758
Subordinated loans in foreign currency 32 400 35 428
Total 38 025 44 186
Specification, subordinated loans
Issuance/Maturity Currency
Original nominal
amount in
each currency Interest rate, %
Outstanding
amount
In Swedish kronor
Swedish subordinated loans¹ 6 179 3 003
Total 3 003
In foreign currency
2015/perpetual3 USD 1 200 5.250 11 675
2018/fixed-term2 EUR 750 1.250 7 904
2018/fixed-term2 EUR 750 1.630 7 926
2019/perpetual3 USD 500 6.250 5 038
Total 32 543
Total subordinated liabilities 35 546
1 For information regarding Swedish subordinated loans, see note G49.2 For further information about subordinated loans in EUR, see note G49. 3 For further information about subordinated loans in USD, see note G49.
SEK m 2019 2018
Subordinated loans at beginning of year 51 085 32 896
Issued 4 654 15 498
Repurchased -3 179 0
Matured -17 674 -
Foreign exchange effect, etc. 660 2 691
Subordinated loans at end of year 35 546 51 085
NOTES | GROUP
HANDELSBANKEN | ANNUAL REPORT 2019 163
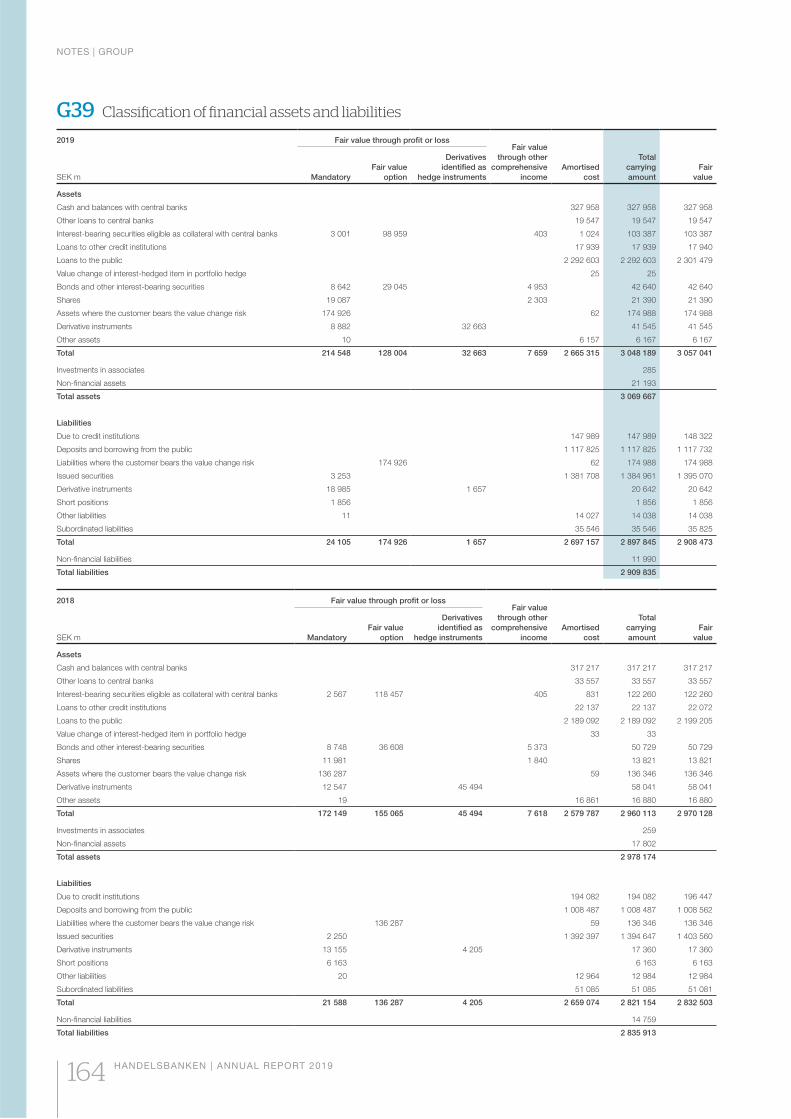
2018 Fair value through profit or loss Fair value
through other
comprehensive
income
Amortised
cost
Total
carrying
amount
Fair
valueSEK m Mandatory
Fair value
option
Derivatives
identified as
hedge instruments
Assets
Cash and balances with central banks 317 217 317 217 317 217
Other loans to central banks 33 557 33 557 33 557
Interest-bearing securities eligible as collateral with central banks 2 567 118 457 405 831 122 260 122 260
Loans to other credit institutions 22 137 22 137 22 072
Loans to the public 2 189 092 2 189 092 2 199 205
Value change of interest-hedged item in portfolio hedge 33 33
Bonds and other interest-bearing securities 8 748 36 608 5 373 50 729 50 729
Shares 11 981 1 840 13 821 13 821
Assets where the customer bears the value change risk 136 287 59 136 346 136 346
Derivative instruments 12 547 45 494 58 041 58 041
Other assets 19 16 861 16 880 16 880
Total 172 149 155 065 45 494 7 618 2 579 787 2 960 113 2 970 128
Investments in associates 259
Non-financial assets 17 802
Total assets 2 978 174
Liabilities
Due to credit institutions 194 082 194 082 196 447
Deposits and borrowing from the public 1 008 487 1 008 487 1 008 562
Liabilities where the customer bears the value change risk 136 287 59 136 346 136 346
Issued securities 2 250 1 392 397 1 394 647 1 403 560
Derivative instruments 13 155 4 205 17 360 17 360
Short positions 6 163 6 163 6 163
Other liabilities 20 12 964 12 984 12 984
Subordinated liabilities 51 085 51 085 51 081
Total 21 588 136 287 4 205 2 659 074 2 821 154 2 832 503
Non-financial liabilities 14 759
Total liabilities 2 835 913
G39 Classification of financial assets and liabilities
2019 Fair value through profit or loss Fair value
through other
comprehensive
income
Amortised
cost
Total
carrying
amount
Fair
valueSEK m Mandatory
Fair value
option
Derivatives
identified as
hedge instruments
Assets
Cash and balances with central banks 327 958 327 958 327 958
Other loans to central banks 19 547 19 547 19 547
Interest-bearing securities eligible as collateral with central banks 3 001 98 959 403 1 024 103 387 103 387
Loans to other credit institutions 17 939 17 939 17 940
Loans to the public 2 292 603 2 292 603 2 301 479
Value change of interest-hedged item in portfolio hedge 25 25
Bonds and other interest-bearing securities 8 642 29 045 4 953 42 640 42 640
Shares 19 087 2 303 21 390 21 390
Assets where the customer bears the value change risk 174 926 62 174 988 174 988
Derivative instruments 8 882 32 663 41 545 41 545
Other assets 10 6 157 6 167 6 167
Total 214 548 128 004 32 663 7 659 2 665 315 3 048 189 3 057 041
Investments in associates 285
Non-financial assets 21 193
Total assets 3 069 667
Liabilities
Due to credit institutions 147 989 147 989 148 322
Deposits and borrowing from the public 1 117 825 1 117 825 1 117 732
Liabilities where the customer bears the value change risk 174 926 62 174 988 174 988
Issued securities 3 253 1 381 708 1 384 961 1 395 070
Derivative instruments 18 985 1 657 20 642 20 642
Short positions 1 856 1 856 1 856
Other liabilities 11 14 027 14 038 14 038
Subordinated liabilities 35 546 35 546 35 825
Total 24 105 174 926 1 657 2 697 157 2 897 845 2 908 473
Non-financial liabilities 11 990
Total liabilities 2 909 835
NOTES | GROUP
164 HANDELSBANKEN | ANNUAL REPORT 2019
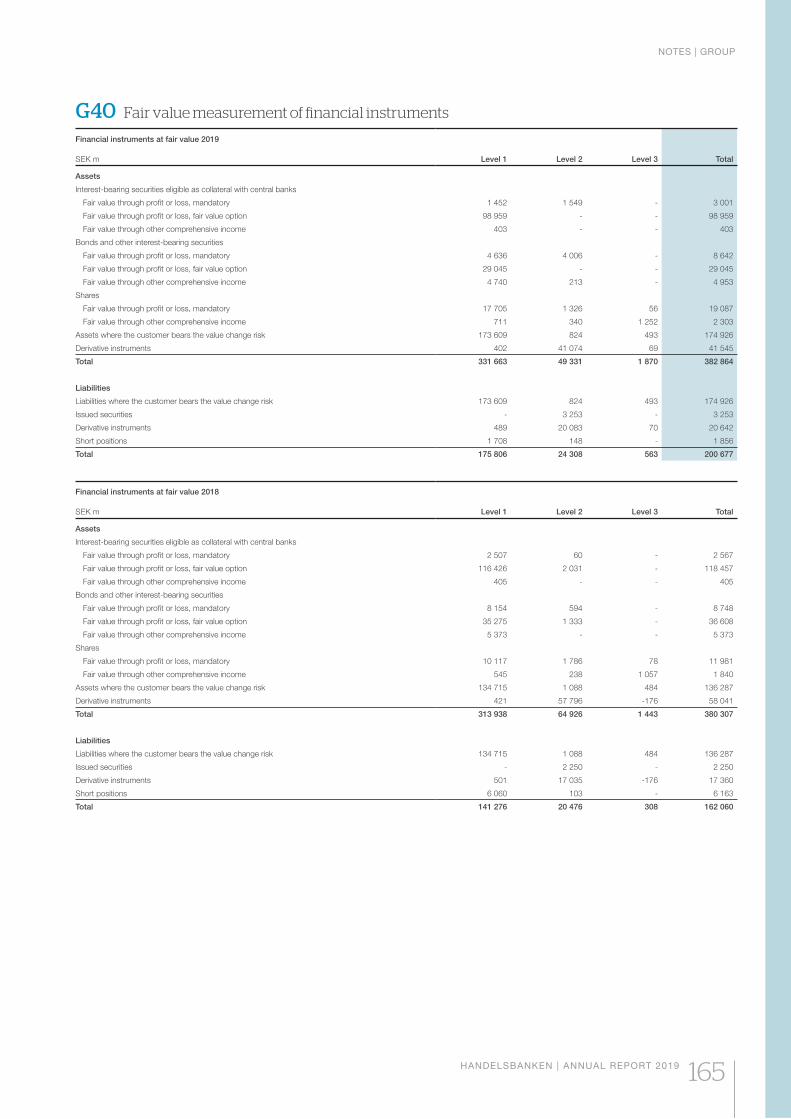
Financial instruments at fair value 2019
SEK m Level 1 Level 2 Level 3 Total
Assets
Interest-bearing securities eligible as collateral with central banks
Fair value through profit or loss, mandatory 1 452 1 549 - 3 001
Fair value through profit or loss, fair value option 98 959 - - 98 959
Fair value through other comprehensive income 403 - - 403
Bonds and other interest-bearing securities
Fair value through profit or loss, mandatory 4 636 4 006 - 8 642
Fair value through profit or loss, fair value option 29 045 - - 29 045
Fair value through other comprehensive income 4 740 213 - 4 953
Shares
Fair value through profit or loss, mandatory 17 705 1 326 56 19 087
Fair value through other comprehensive income 711 340 1 252 2 303
Assets where the customer bears the value change risk 173 609 824 493 174 926
Derivative instruments 402 41 074 69 41 545
Total 331 663 49 331 1 870 382 864
Liabilities
Liabilities where the customer bears the value change risk 173 609 824 493 174 926
Issued securities - 3 253 - 3 253
Derivative instruments 489 20 083 70 20 642
Short positions 1 708 148 - 1 856
Total 175 806 24 308 563 200 677
Financial instruments at fair value 2018
SEK m Level 1 Level 2 Level 3 Total
Assets
Interest-bearing securities eligible as collateral with central banks
Fair value through profit or loss, mandatory 2 507 60 - 2 567
Fair value through profit or loss, fair value option 116 426 2 031 - 118 457
Fair value through other comprehensive income 405 - - 405
Bonds and other interest-bearing securities
Fair value through profit or loss, mandatory 8 154 594 - 8 748
Fair value through profit or loss, fair value option 35 275 1 333 - 36 608
Fair value through other comprehensive income 5 373 - - 5 373
Shares
Fair value through profit or loss, mandatory 10 117 1 786 78 11 981
Fair value through other comprehensive income 545 238 1 057 1 840
Assets where the customer bears the value change risk 134 715 1 088 484 136 287
Derivative instruments 421 57 796 -176 58 041
Total 313 938 64 926 1 443 380 307
Liabilities
Liabilities where the customer bears the value change risk 134 715 1 088 484 136 287
Issued securities - 2 250 - 2 250
Derivative instruments 501 17 035 -176 17 360
Short positions 6 060 103 - 6 163
Total 141 276 20 476 308 162 060
G40 Fair value measurement of financial instruments
NOTES | GROUP
HANDELSBANKEN | ANNUAL REPORT 2019 165
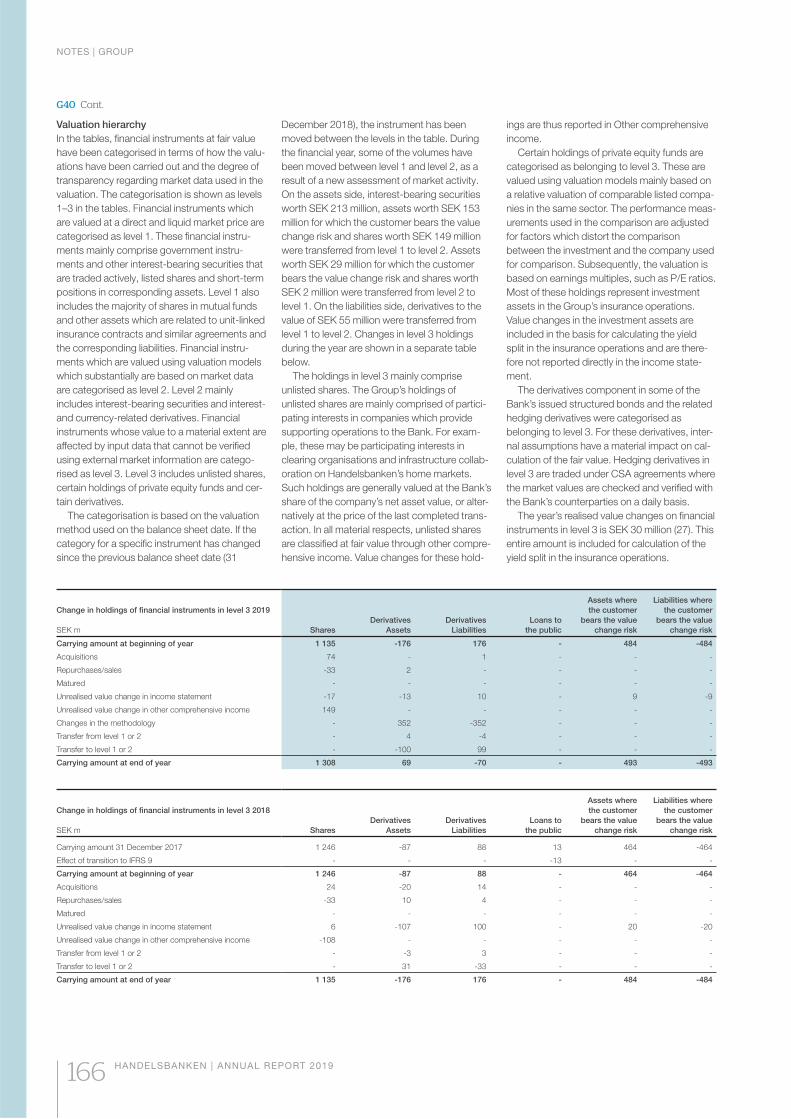
Change in holdings of financial instruments in level 3 2019
SEK m Shares
Derivatives
Assets
Derivatives
Liabilities
Loans to
the public
Assets where
the customer
bears the value
change risk
Liabilities where
the customer
bears the value
change risk
Carrying amount at beginning of year 1 135 -176 176 - 484 -484
Acquisitions 74 - 1 - - -
Repurchases/sales -33 2 - - - -
Matured - - - - - -
Unrealised value change in income statement -17 -13 10 - 9 -9
Unrealised value change in other comprehensive income 149 - - - - -
Changes in the methodology - 352 -352 - - -
Transfer from level 1 or 2 - 4 -4 - - -
Transfer to level 1 or 2 - -100 99 - - -
Carrying amount at end of year 1 308 69 -70 - 493 -493
Change in holdings of financial instruments in level 3 2018
SEK m Shares
Derivatives
Assets
Derivatives
Liabilities
Loans to
the public
Assets where
the customer
bears the value
change risk
Liabilities where
the customer
bears the value
change risk
Carrying amount 31 December 2017 1 246 -87 88 13 464 -464
Effect of transition to IFRS 9 - - - -13 - -
Carrying amount at beginning of year 1 246 -87 88 - 464 -464
Acquisitions 24 -20 14 - - -
Repurchases/sales -33 10 4 - - -
Matured - - - - - -
Unrealised value change in income statement 6 -107 100 - 20 -20
Unrealised value change in other comprehensive income -108 - - - - -
Transfer from level 1 or 2 - -3 3 - - -
Transfer to level 1 or 2 - 31 -33 - - -
Carrying amount at end of year 1 135 -176 176 - 484 -484
Valuation hierarchy
In the tables, financial instruments at fair value
have been categorised in terms of how the valu-
ations have been carried out and the degree of
transparency regarding market data used in the
valuation. The categorisation is shown as levels
1–3 in the tables. Financial instruments which
are valued at a direct and liquid market price are
categorised as level 1. These financial instru-
ments mainly comprise government instru-
ments and other interest-bearing securities that
are traded actively, listed shares and short-term
positions in corresponding assets. Level 1 also
includes the majority of shares in mutual funds
and other assets which are related to unit-linked
insurance contracts and similar agreements and
the corresponding liabilities. Financial instru-
ments which are valued using valuation models
which substantially are based on market data
are categorised as level 2. Level 2 mainly
includes interest-bearing securities and interest-
and currency-related derivatives. Financial
instruments whose value to a material extent are
affected by input data that cannot be verified
using external market information are catego-
rised as level 3. Level 3 includes unlisted shares,
certain holdings of private equity funds and cer-
tain derivatives.
The categorisation is based on the valuation
method used on the balance sheet date. If the
category for a specific instrument has changed
since the previous balance sheet date (31
December 2018), the instrument has been
moved between the levels in the table. During
the financial year, some of the volumes have
been moved between level 1 and level 2, as a
result of a new assessment of market activity.
On the assets side, interest-bearing securities
worth SEK 213 million, assets worth SEK 153
million for which the customer bears the value
change risk and shares worth SEK 149 million
were transferred from level 1 to level 2. Assets
worth SEK 29 million for which the customer
bears the value change risk and shares worth
SEK 2 million were transferred from level 2 to
level 1. On the liabilities side, derivatives to the
value of SEK 55 million were transferred from
level 1 to level 2. Changes in level 3 holdings
during the year are shown in a separate table
below.
The holdings in level 3 mainly comprise
unlisted shares. The Group’s holdings of
unlisted shares are mainly comprised of partici-
pating interests in companies which provide
supporting operations to the Bank. For exam-
ple, these may be participating interests in
clearing organisations and infrastructure collab-
oration on Handelsbanken’s home markets.
Such holdings are generally valued at the Bank’s
share of the company’s net asset value, or alter-
natively at the price of the last completed trans-
action. In all material respects, unlisted shares
are classified at fair value through other compre-
hensive income. Value changes for these hold-
ings are thus reported in Other comprehensive
income.
Certain holdings of private equity funds are
categorised as belonging to level 3. These are
valued using valuation models mainly based on
a relative valuation of comparable listed compa-
nies in the same sector. The performance meas-
urements used in the comparison are adjusted
for factors which distort the comparison
between the investment and the company used
for comparison. Subsequently, the valuation is
based on earnings multiples, such as P/E ratios.
Most of these holdings represent investment
assets in the Group’s insurance operations.
Value changes in the investment assets are
included in the basis for calculating the yield
split in the insurance operations and are there-
fore not reported directly in the income state-
ment.
The derivatives component in some of the
Bank’s issued structured bonds and the related
hedging derivatives were categorised as
belonging to level 3. For these derivatives, inter-
nal assumptions have a material impact on cal-
culation of the fair value. Hedging derivatives in
level 3 are traded under CSA agreements where
the market values are checked and verified with
the Bank’s counterparties on a daily basis.
The year’s realised value changes on financial
instruments in level 3 is SEK 30 million (27). This
entire amount is included for calculation of the
yield split in the insurance operations.
G40 Cont.
NOTES | GROUP
166 HANDELSBANKEN | ANNUAL REPORT 2019
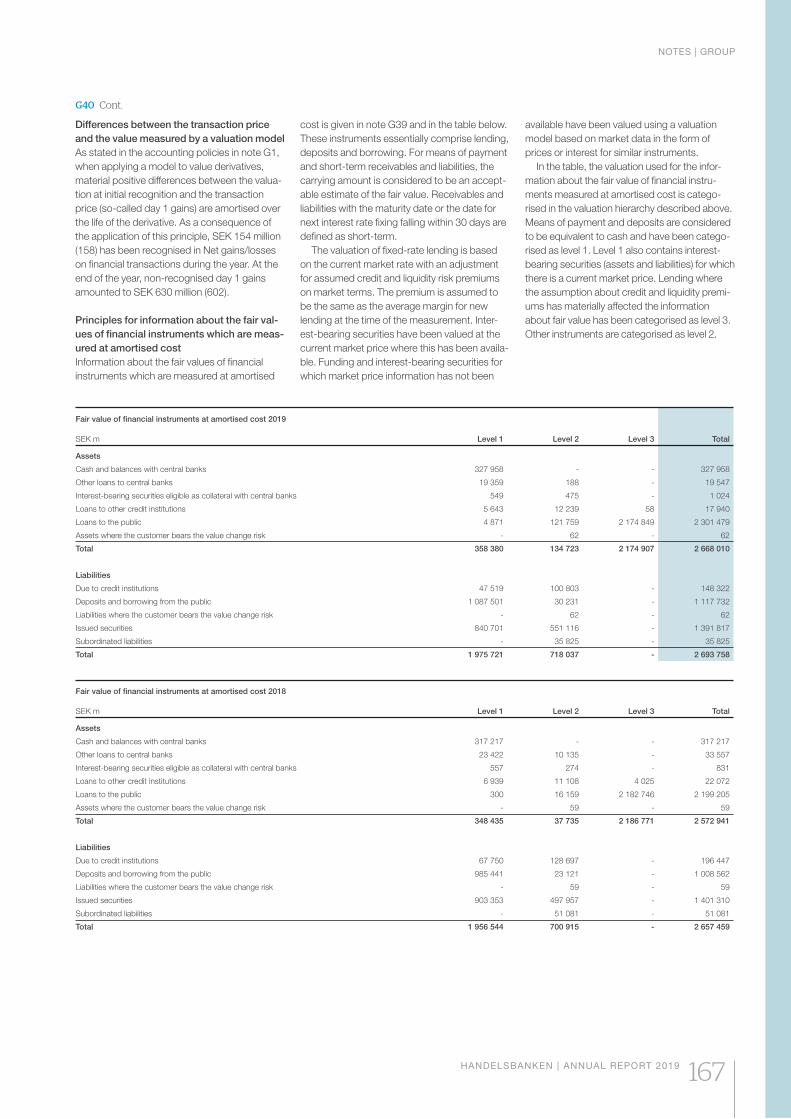
G40 Cont.
Differences between the transaction price
and the value measured by a valuation model
As stated in the accounting policies in note G1,
when applying a model to value derivatives,
material positive differences between the valua-
tion at initial recognition and the transaction
price (so-called day 1 gains) are amortised over
the life of the derivative. As a consequence of
the application of this principle, SEK 154 million
(158) has been recognised in Net gains/losses
on financial transactions during the year. At the
end of the year, non-recognised day 1 gains
amounted to SEK 630 million (602).
Principles for information about the fair val-
ues of financial instruments which are meas-
ured at amortised cost
Information about the fair values of financial
instruments which are measured at amortised
cost is given in note G39 and in the table below.
These instruments essentially comprise lending,
deposits and borrowing. For means of payment
and short-term receivables and liabilities, the
carrying amount is considered to be an accept-
able estimate of the fair value. Receivables and
liabilities with the maturity date or the date for
next interest rate fixing falling within 30 days are
defined as short-term.
The valuation of fixed-rate lending is based
on the current market rate with an adjustment
for assumed credit and liquidity risk premiums
on market terms. The premium is assumed to
be the same as the average margin for new
lending at the time of the measurement. Inter-
est-bearing securities have been valued at the
current market price where this has been availa-
ble. Funding and interest-bearing securities for
which market price information has not been
available have been valued using a valuation
model based on market data in the form of
prices or interest for similar instruments.
In the table, the valuation used for the infor-
mation about the fair value of financial instru-
ments measured at amortised cost is catego-
rised in the valuation hierarchy described above.
Means of payment and deposits are considered
to be equivalent to cash and have been catego-
rised as level 1. Level 1 also contains interest-
bearing securities (assets and liabilities) for which
there is a current market price. Lending where
the assumption about credit and liquidity premi-
ums has materially affected the information
about fair value has been categorised as level 3.
Other instruments are categorised as level 2.
Fair value of financial instruments at amortised cost 2019
SEK m Level 1 Level 2 Level 3 Total
Assets
Cash and balances with central banks 327 958 - - 327 958
Other loans to central banks 19 359 188 - 19 547
Interest-bearing securities eligible as collateral with central banks 549 475 - 1 024
Loans to other credit institutions 5 643 12 239 58 17 940
Loans to the public 4 871 121 759 2 174 849 2 301 479
Assets where the customer bears the value change risk - 62 - 62
Total 358 380 134 723 2 174 907 2 668 010
Liabilities
Due to credit institutions 47 519 100 803 - 148 322
Deposits and borrowing from the public 1 087 501 30 231 - 1 117 732
Liabilities where the customer bears the value change risk - 62 - 62
Issued securities 840 701 551 116 - 1 391 817
Subordinated liabilities - 35 825 - 35 825
Total 1 975 721 718 037 - 2 693 758
Fair value of financial instruments at amortised cost 2018
SEK m Level 1 Level 2 Level 3 Total
Assets
Cash and balances with central banks 317 217 - - 317 217
Other loans to central banks 23 422 10 135 - 33 557
Interest-bearing securities eligible as collateral with central banks 557 274 - 831
Loans to other credit institutions 6 939 11 108 4 025 22 072
Loans to the public 300 16 159 2 182 746 2 199 205
Assets where the customer bears the value change risk - 59 - 59
Total 348 435 37 735 2 186 771 2 572 941
Liabilities
Due to credit institutions 67 750 128 697 - 196 447
Deposits and borrowing from the public 985 441 23 121 - 1 008 562
Liabilities where the customer bears the value change risk - 59 - 59
Issued securities 903 353 497 957 - 1 401 310
Subordinated liabilities - 51 081 - 51 081
Total 1 956 544 700 915 - 2 657 459
NOTES | GROUP
HANDELSBANKEN | ANNUAL REPORT 2019 167

G41 Pledged assets, collateral received and transferred financial assets
Assets pledged for own debt
SEK m 2019 2018
Cash 18 399 14 807
Government instruments and bonds 7 526 41 829
Loans to the public 670 012 651 155
Shares 7 006 947
Assets where the customer bears the value change risk 169 675 132 203
Other 5 839 9 427
Total 878 457 850 368
of which pledged assets that may be freely withdrawn by the Bank 38 27 056
Assets pledged for own debt
SEK m 2019 2018
Cash 1 223 1 326
Government instruments and bonds 41 761 40 632
Loans to the public - -
Shares 6 760 6 664
Other - 0
Total 49 744 48 622
of which pledged assets that may be freely withdrawn by the Bank 39 110 38 919
Other pledged assets refers to collateral pledged for obligations not reported on the balance sheet.
Pledged assets
Pledged assets are recognised as assets on the
balance sheet. Assets pledged in the form of
interest-bearing securities mainly comprise
securities pledged as collateral to central banks
and other credit institutions, for payment sys-
tems, securities trading and clearing and also
securities sold under binding repurchase agree-
ments (repos). Assets pledged in the form of
equities mainly comprise lent equities and equi-
ties in the insurance operations.
Loans to the public pledged as security
mainly comprise collateral registered for the
benefit of holders of covered bonds issued by
Stadshypotek. The collateral mainly comprises
loans granted against mortgages in single-fam-
ily homes, second homes, multi-family dwellings
or housing co-operative apartments with a loan-
to-value ratio within 75 per cent of the market
value. In the event of the company’s insolvency,
pursuant to the Covered Bonds Act and the
Right of Priority Act, the holders of the covered
bonds have prior rights to the pledged assets.
If, at the time of a bankruptcy decision, the
assets in the total collateral fulfil the terms of the
Act, these must be kept separate from the
bankruptcy estate’s other assets and liabilities.
The holders of the bonds will then continue to
receive contractual payments under the terms
of the bond until maturity.
Assets where the customer bears the value
change risk mainly comprise units in unit-linked
insurance contracts in Handelsbanken Liv
where the policyholders have priority rights.
Collateral received
Collateral received is not recognised on the bal-
ance sheet. For reverse repurchase agreements
and equity loans, securities are received that
can be sold or repledged to a third party. The
fair value of received securities under reverse
repurchase agreements and agreements on
equity loans was SEK 28,530 million (28,592) at
the end of the financial year, where collateral
worth SEK 8,761 million (8,034) had been sold
or repledged to a third party. Information about
received pledges for lending and other received
collateral is shown in note G2.
Transferred financial assets recognised
on the balance sheet
Transferred financial assets are recognised as
assets on the balance sheet but, for these, the
rights to future cash flows are directly or indirectly
transferred to an external counterparty. Most of
the transferred financial assets recognised on the
balance sheet comprise interest-bearing securities
which have been sold under binding repurchase
agreements and lent equities. Normally the terms
for the binding repurchases and equity loans are
stipulated in framework agreements between the
Bank and the respective counterparty.
Binding repurchase agreements imply selling
securities with an undertaking to repurchase
them at a fixed price at a pre-determined time in
the future. The seller of the securities thus con-
tinues to be exposed to the risk of value
changes during the life of the agreement. Secu-
rities sold under repurchase agreements remain
at market value in the balance sheet throughout
the life of the agreement. The purchase price
received is reported as a liability to the counter-
party. According to the standard terms of a
repurchase agreement, the right of ownership of
the sold securities is transferred in its entirety
from the seller to the buyer. This means that the
buyer has the right to sell on, repledge or other-
wise dispose of the purchased securities.
According to the standard agreements for
equity loans, the exposure to the value change in
the lent equity remains with the lender. Lent equi-
ties thus remain on the balance sheet throughout
the life of the loan. Collateral for lent securities is
normally in the form of cash or other securities.
Cash collateral received is recognised as a liability
on the balance sheet. In the same way as for
repurchase agreements, the standard agreement
used for equity loans means that during the life of
the loan, the borrower has the right to sell on,
repledge or otherwise dispose of the borrowed
securities.
Government instruments, bonds and equities
provided as collateral for securities trading,
clearing, etc. where the title to the instrument
has been transferred to the counterparty are
reported as other transferred financial assets.
Transferred financial assets also include certain
assets where the customer bears the value
change risk. These assets comprise portfolios
of financial instruments where the Bank has the
formal right of ownership but where the risks
related to the assets and also the right to future
cash flows have been transferred to a third
party. The valuation of these assets reflects the
valuation of the corresponding liability item.
NOTES | GROUP
168 HANDELSBANKEN | ANNUAL REPORT 2019
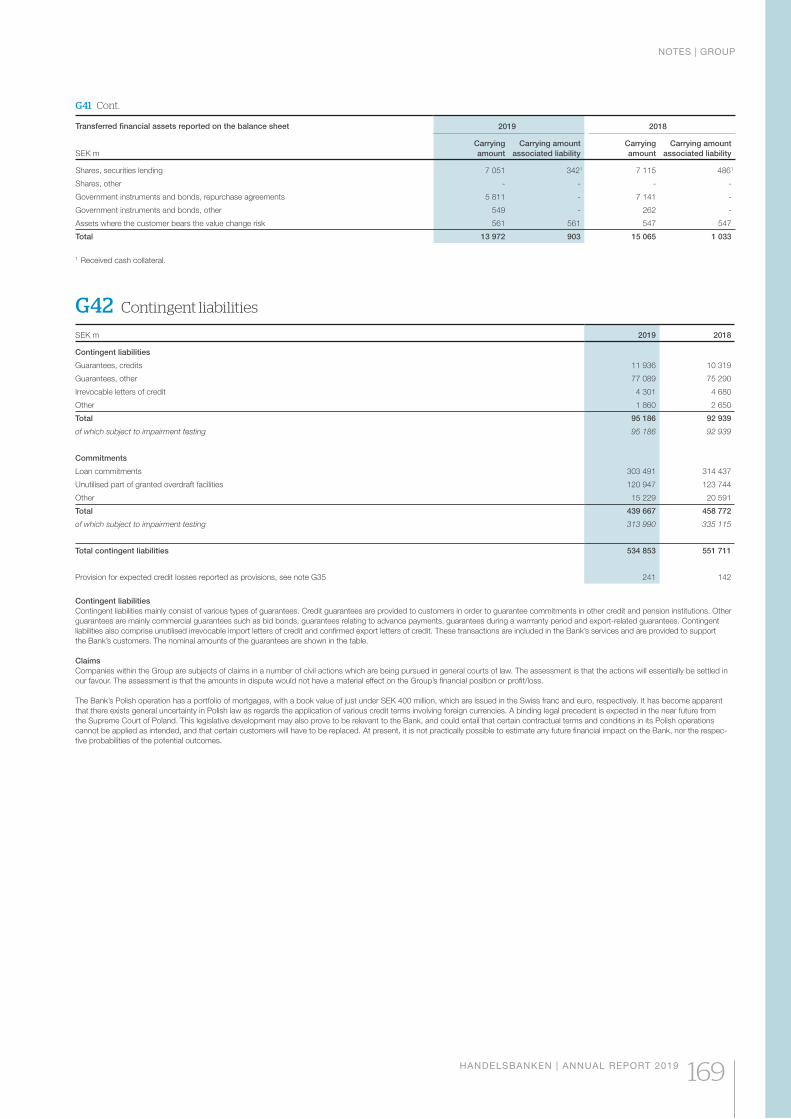
G42 Contingent liabilities
SEK m 2019 2018
Contingent liabilities
Guarantees, credits 11 936 10 319
Guarantees, other 77 089 75 290
Irrevocable letters of credit 4 301 4 680
Other 1 860 2 650
Total 95 186 92 939
of which subject to impairment testing 95 186 92 939
Commitments
Loan commitments 303 491 314 437
Unutilised part of granted overdraft facilities 120 947 123 744
Other 15 229 20 591
Total 439 667 458 772
of which subject to impairment testing 313 990 335 115
Total contingent liabilities 534 853 551 711
Provision for expected credit losses reported as provisions, see note G35 241 142
Contingent liabilities
Contingent liabilities mainly consist of various types of guarantees. Credit guarantees are provided to customers in order to guarantee commitments in other credit and pension institutions. Other
guarantees are mainly commercial guarantees such as bid bonds, guarantees relating to advance payments, guarantees during a warrranty period and export-related guarantees. Contingent
liabilities also comprise unutilised irrevocable import letters of credit and confirmed export letters of credit. These transactions are included in the Bank’s services and are provided to support
the Bank’s customers. The nominal amounts of the guarantees are shown in the table.
Claims
Companies within the Group are subjects of claims in a number of civil actions which are being pursued in general courts of law. The assessment is that the actions will essentially be settled in
our favour. The assessment is that the amounts in dispute would not have a material effect on the Group’s financial position or profit/loss.
The Bank’s Polish operation has a portfolio of mortgages, with a book value of just under SEK 400 million, which are issued in the Swiss franc and euro, respectively. It has become apparent
that there exists general uncertainty in Polish law as regards the application of various credit terms involving foreign currencies. A binding legal precedent is expected in the near future from
the Supreme Court of Poland. This legislative development may also prove to be relevant to the Bank, and could entail that certain contractual terms and conditions in its Polish operations
cannot be applied as intended, and that certain customers will have to be replaced. At present, it is not practically possible to estimate any future financial impact on the Bank, nor the respec-
tive probabilities of the potential outcomes.
G41 Cont.
Transferred financial assets reported on the balance sheet
SEK m
2019 2018
Carrying
amount
Carrying amount
associated liability
Carrying
amount
Carrying amount
associated liability
Shares, securities lending 7 051 3421 7 115 4861
Shares, other - - - -
Government instruments and bonds, repurchase agreements 5 811 - 7 141 -
Government instruments and bonds, other 549 - 262 -
Assets where the customer bears the value change risk 561 561 547 547
Total 13 972 903 15 065 1 033
1 Received cash collateral.
NOTES | GROUP
HANDELSBANKEN | ANNUAL REPORT 2019 169
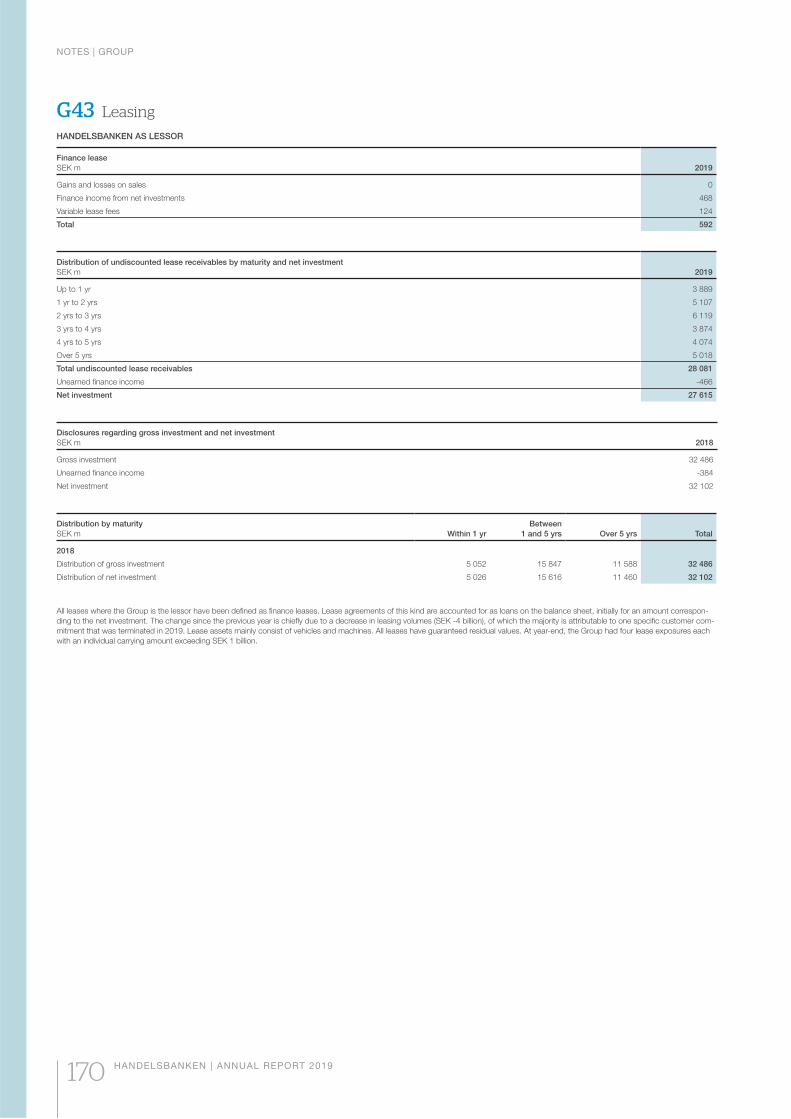
G43 Leasing
HANDELSBANKEN AS LESSOR
Finance lease
SEK m 2019
Gains and losses on sales 0
Finance income from net investments 468
Variable lease fees 124
Total 592
Distribution of undiscounted lease receivables by maturity and net investment
SEK m 2019
Up to 1 yr 3 889
1 yr to 2 yrs 5 107
2 yrs to 3 yrs 6 119
3 yrs to 4 yrs 3 874
4 yrs to 5 yrs 4 074
Over 5 yrs 5 018
Total undiscounted lease receivables 28 081
Unearned finance income -466
Net investment 27 615
Disclosures regarding gross investment and net investment
SEK m 2018
Gross investment 32 486
Unearned finance income -384
Net investment 32 102
Distribution by maturity
SEK m Within 1 yr
Between
1 and 5 yrs Over 5 yrs Total
2018
Distribution of gross investment 5 052 15 847 11 588 32 486
Distribution of net investment 5 026 15 616 11 460 32 102
All leases where the Group is the lessor have been defined as finance leases. Lease agreements of this kind are accounted for as loans on the balance sheet, initially for an amount correspon-
ding to the net investment. The change since the previous year is chiefly due to a decrease in leasing volumes (SEK -4 billion), of which the majority is attributable to one specific customer com-
mitment that was terminated in 2019. Lease assets mainly consist of vehicles and machines. All leases have guaranteed residual values. At year-end, the Group had four lease exposures each
with an individual carrying amount exceeding SEK 1 billion.
NOTES | GROUP
170 HANDELSBANKEN | ANNUAL REPORT 2019
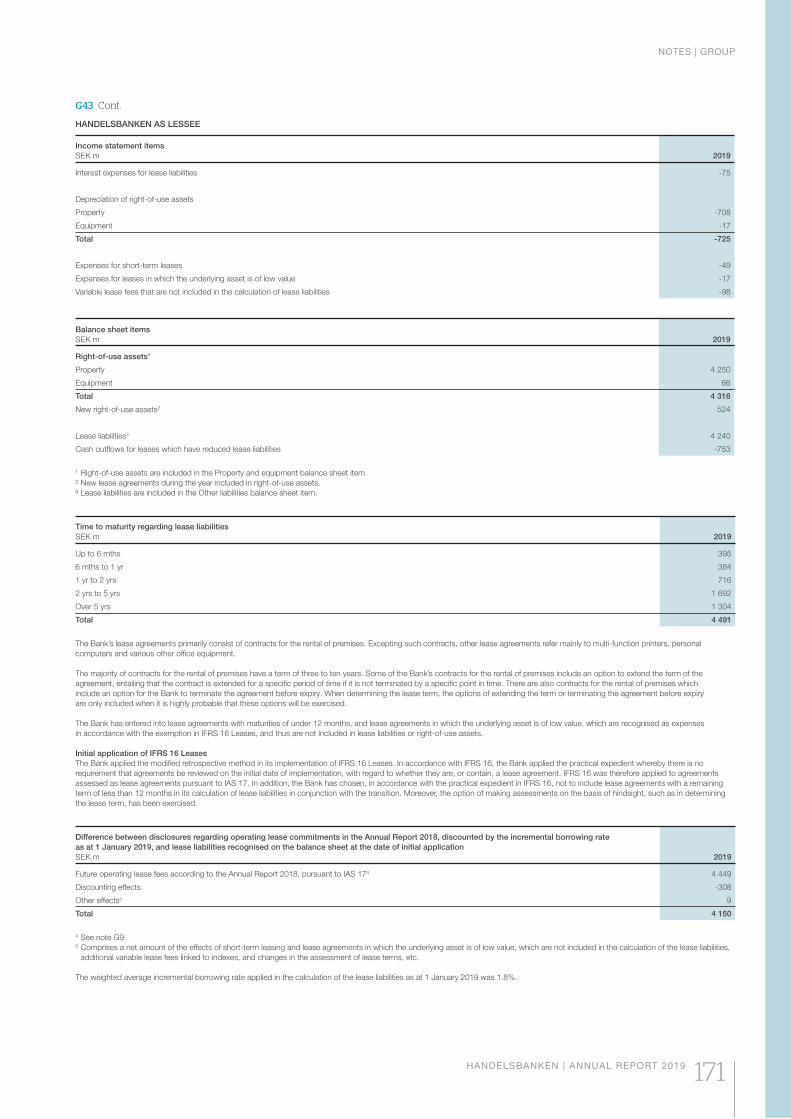
HANDELSBANKEN AS LESSEE
Income statement items
SEK m 2019
Interest expenses for lease liabilities -75
Depreciation of right-of-use assets
Property -708
Equipment -17
Total -725
Expenses for short-term leases -49
Expenses for leases in which the underlying asset is of low value -17
Variable lease fees that are not included in the calculation of lease liabilities -98
Balance sheet items
SEK m 2019
Right-of-use assets1
Property 4 250
Equipment 66
Total 4 316
New right-of-use assets2 524
Lease liabilities3 4 240
Cash outflows for leases which have reduced lease liabilities -753
1 Right-of-use assets are included in the Property and equipment balance sheet item.
² New lease agreements during the year included in right-of-use assets.
³ Lease liabilities are included in the Other liabilities balance sheet item.
Time to maturity regarding lease liabilities
SEK m 2019
Up to 6 mths 395
6 mths to 1 yr 384
1 yr to 2 yrs 716
2 yrs to 5 yrs 1 692
Over 5 yrs 1 304
Total 4 491
The Bank’s lease agreements primarily consist of contracts for the rental of premises. Excepting such contracts, other lease agreements refer mainly to multi-function printers, personal
computers and various other office equipment.
The majority of contracts for the rental of premises have a term of three to ten years. Some of the Bank’s contracts for the rental of premises include an option to extend the term of the
agreement, entailing that the contract is extended for a specific period of time if it is not terminated by a specific point in time. There are also contracts for the rental of premises which
include an option for the Bank to terminate the agreement before expiry. When determining the lease term, the options of extending the term or terminating the agreement before expiry
are only included when it is highly probable that these options will be exercised.
The Bank has entered into lease agreements with maturities of under 12 months, and lease agreements in which the underlying asset is of low value, which are recognised as expenses
in accordance with the exemption in IFRS 16 Leases, and thus are not included in lease liabilities or right-of-use assets.
Initial application of IFRS 16 Leases
The Bank applied the modified retrospective method in its implementation of IFRS 16 Leases. In accordance with IFRS 16, the Bank applied the practical expedient whereby there is no
requirement that agreements be reviewed on the initial date of implementation, with regard to whether they are, or contain, a lease agreement. IFRS 16 was therefore applied to agreements
assessed as lease agreements pursuant to IAS 17. In addition, the Bank has chosen, in accordance with the practical expedient in IFRS 16, not to include lease agreements with a remaining
term of less than 12 months in its calculation of lease liabilities in conjunction with the transition. Moreover, the option of making assessments on the basis of hindsight, such as in determining
the lease term, has been exercised.
Difference between disclosures regarding operating lease commitments in the Annual Report 2018, discounted by the incremental borrowing rate
as at 1 January 2019, and lease liabilities recognised on the balance sheet at the date of initial application
SEK m 2019
Future operating lease fees according to the Annual Report 2018, pursuant to IAS 174 4 449
Discounting effects -308
Other effects5 9
Total 4 150
4 See note G9.5 Comprises a net amount of the effects of short-term leasing and lease agreements in which the underlying asset is of low value, which are not included in the calculation of the lease liabilities,
additional variable lease fees linked to indexes, and changes in the assessment of lease terms, etc.
The weighted average incremental borrowing rate applied in the calculation of the lease liabilities as at 1 January 2019 was 1.8%.
G43 Cont.
NOTES | GROUP
HANDELSBANKEN | ANNUAL REPORT 2019 171
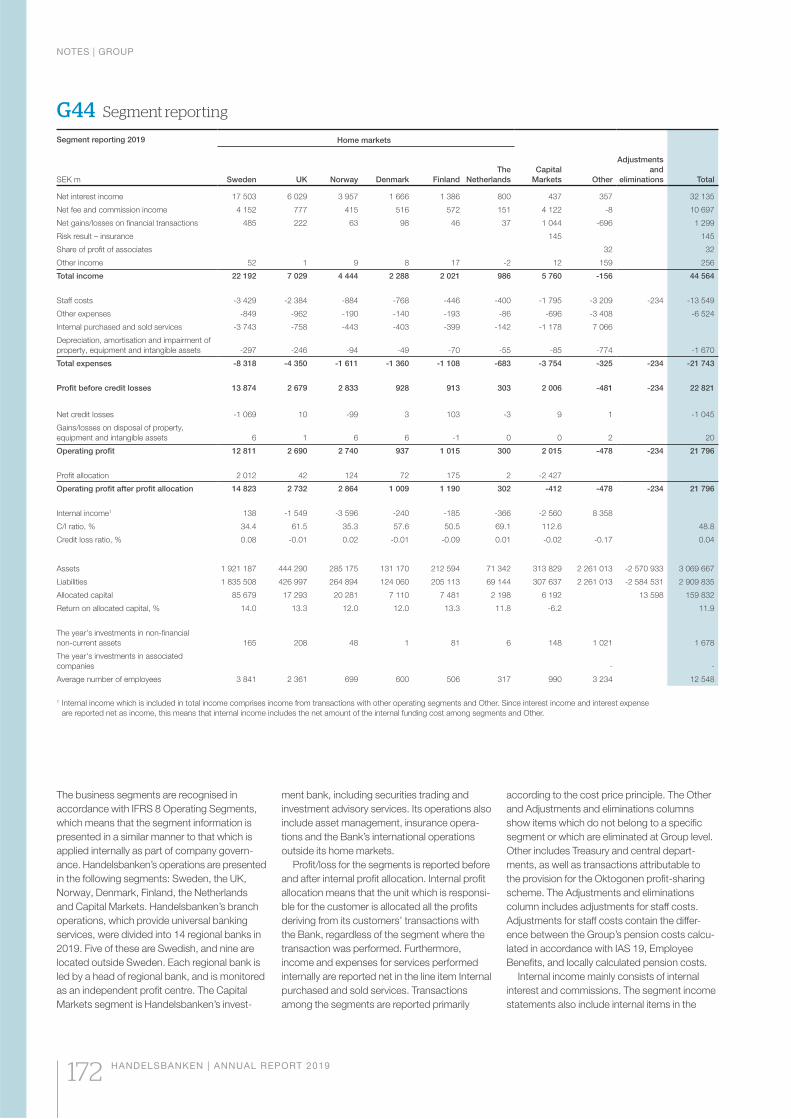
G44 Segment reporting
Segment reporting 2019
SEK m
Home markets
Adjustments
and
eliminationsSweden UK Norway Denmark Finland
The
Netherlands
Capital
Markets Other Total
Net interest income 17 503 6 029 3 957 1 666 1 386 800 437 357 32 135
Net fee and commission income 4 152 777 415 516 572 151 4 122 -8 10 697
Net gains/losses on financial transactions 485 222 63 98 46 37 1 044 -696 1 299
Risk result – insurance 145 145
Share of profit of associates 32 32
Other income 52 1 9 8 17 -2 12 159 256
Total income 22 192 7 029 4 444 2 288 2 021 986 5 760 -156 44 564
Staff costs -3 429 -2 384 -884 -768 -446 -400 -1 795 -3 209 -234 -13 549
Other expenses -849 -962 -190 -140 -193 -86 -696 -3 408 -6 524
Internal purchased and sold services -3 743 -758 -443 -403 -399 -142 -1 178 7 066
Depreciation, amortisation and impairment of
property, equipment and intangible assets -297 -246 -94 -49 -70 -55 -85 -774 -1 670
Total expenses -8 318 -4 350 -1 611 -1 360 -1 108 -683 -3 754 -325 -234 -21 743
Profit before credit losses 13 874 2 679 2 833 928 913 303 2 006 -481 -234 22 821
Net credit losses -1 069 10 -99 3 103 -3 9 1 -1 045
Gains/losses on disposal of property,
equipment and intangible assets 6 1 6 6 -1 0 0 2 20
Operating profit 12 811 2 690 2 740 937 1 015 300 2 015 -478 -234 21 796
Profit allocation 2 012 42 124 72 175 2 -2 427
Operating profit after profit allocation 14 823 2 732 2 864 1 009 1 190 302 -412 -478 -234 21 796
Internal income1 138 -1 549 -3 596 -240 -185 -366 -2 560 8 358
C/I ratio, % 34.4 61.5 35.3 57.6 50.5 69.1 112.6 48.8
Credit loss ratio, % 0.08 -0.01 0.02 -0.01 -0.09 0.01 -0.02 -0.17 0.04
Assets 1 921 187 444 290 285 175 131 170 212 594 71 342 313 829 2 261 013 -2 570 933 3 069 667
Liabilities 1 835 508 426 997 264 894 124 060 205 113 69 144 307 637 2 261 013 -2 584 531 2 909 835
Allocated capital 85 679 17 293 20 281 7 110 7 481 2 198 6 192 13 598 159 832
Return on allocated capital, % 14.0 13.3 12.0 12.0 13.3 11.8 -6.2 11.9
The year's investments in non-financial
non-current assets 165 208 48 1 81 6 148 1 021 1 678
The year's investments in associated
companies - -
Average number of employees 3 841 2 361 699 600 506 317 990 3 234 12 548
1 Internal income which is included in total income comprises income from transactions with other operating segments and Other. Since interest income and interest expense
are reported net as income, this means that internal income includes the net amount of the internal funding cost among segments and Other.
The business segments are recognised in
accordance with IFRS 8 Operating Segments,
which means that the segment information is
presented in a similar manner to that which is
applied internally as part of company govern-
ance. Handelsbanken’s operations are presented
in the following segments: Sweden, the UK,
Norway, Denmark, Finland, the Netherlands
and Capital Markets. Handelsbanken’s branch
operations, which provide universal banking
services, were divided into 14 regional banks in
2019. Five of these are Swedish, and nine are
located outside Sweden. Each regional bank is
led by a head of regional bank, and is monitored
as an independent profit centre. The Capital
Markets segment is Handelsbanken’s invest-
ment bank, including securities trading and
investment advisory services. Its operations also
include asset management, insurance opera-
tions and the Bank’s international operations
outside its home markets.
Profit/loss for the segments is reported before
and after internal profit allocation. Internal profit
allocation means that the unit which is responsi-
ble for the customer is allocated all the profits
deriving from its customers’ transactions with
the Bank, regardless of the segment where the
transaction was performed. Furthermore,
income and expenses for services performed
internally are reported net in the line item Internal
purchased and sold services. Transactions
among the segments are reported primarily
according to the cost price principle. The Other
and Adjustments and eliminations columns
show items which do not belong to a specific
segment or which are eliminated at Group level.
Other includes Treasury and central depart-
ments, as well as transactions attributable to
the provision for the Oktogonen profit-sharing
scheme. The Adjustments and eliminations
column includes adjustments for staff costs.
Adjustments for staff costs contain the differ-
ence between the Group’s pension costs calcu-
lated in accordance with IAS 19, Employee
Benefits, and locally calculated pension costs.
Internal income mainly consists of internal
interest and commissions. The segment income
statements also include internal items in the
NOTES | GROUP
172 HANDELSBANKEN | ANNUAL REPORT 2019
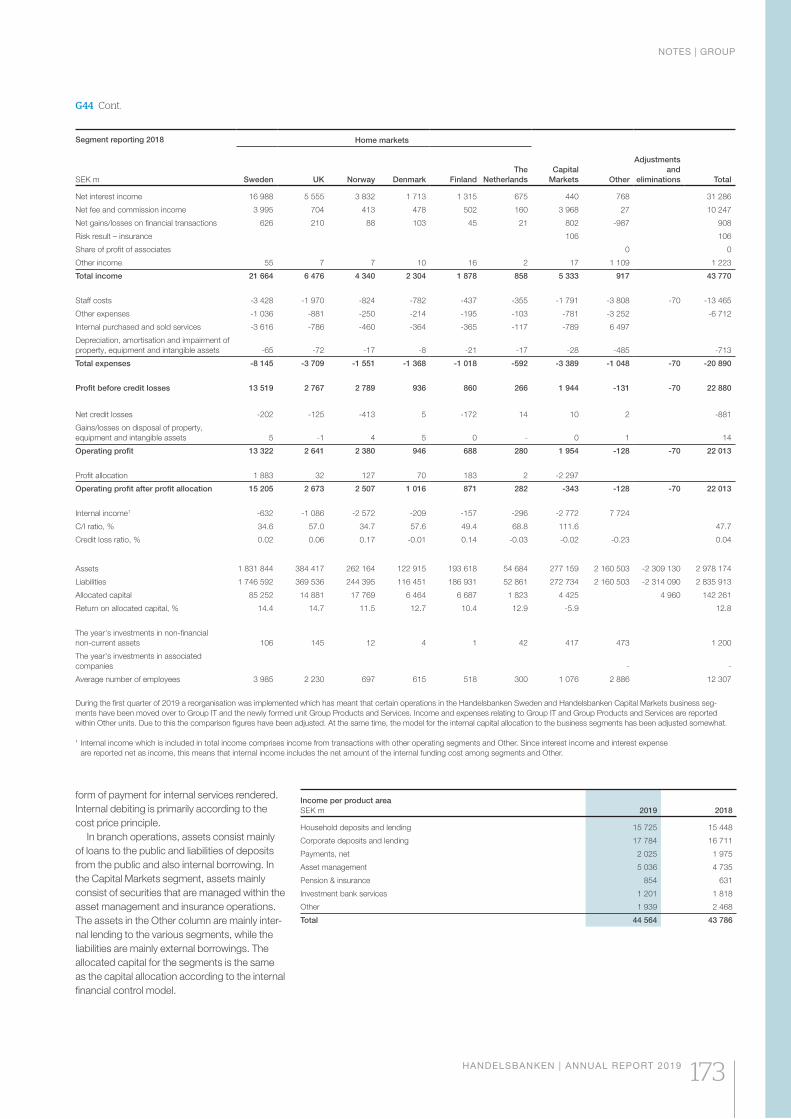
Income per product area
SEK m 2019 2018
Household deposits and lending 15 725 15 448
Corporate deposits and lending 17 784 16 711
Payments, net 2 025 1 975
Asset management 5 036 4 735
Pension & insurance 854 631
Investment bank services 1 201 1 818
Other 1 939 2 468
Total 44 564 43 786
Segment reporting 2018
SEK m
Home markets
Adjustments
and
eliminationsSweden UK Norway Denmark Finland
The
Netherlands
Capital
Markets Other Total
Net interest income 16 988 5 555 3 832 1 713 1 315 675 440 768 31 286
Net fee and commission income 3 995 704 413 478 502 160 3 968 27 10 247
Net gains/losses on financial transactions 626 210 88 103 45 21 802 -987 908
Risk result – insurance 106 106
Share of profit of associates 0 0
Other income 55 7 7 10 16 2 17 1 109 1 223
Total income 21 664 6 476 4 340 2 304 1 878 858 5 333 917 43 770
Staff costs -3 428 -1 970 -824 -782 -437 -355 -1 791 -3 808 -70 -13 465
Other expenses -1 036 -881 -250 -214 -195 -103 -781 -3 252 -6 712
Internal purchased and sold services -3 616 -786 -460 -364 -365 -117 -789 6 497
Depreciation, amortisation and impairment of
property, equipment and intangible assets -65 -72 -17 -8 -21 -17 -28 -485 -713
Total expenses -8 145 -3 709 -1 551 -1 368 -1 018 -592 -3 389 -1 048 -70 -20 890
Profit before credit losses 13 519 2 767 2 789 936 860 266 1 944 -131 -70 22 880
Net credit losses -202 -125 -413 5 -172 14 10 2 -881
Gains/losses on disposal of property,
equipment and intangible assets 5 -1 4 5 0 - 0 1 14
Operating profit 13 322 2 641 2 380 946 688 280 1 954 -128 -70 22 013
Profit allocation 1 883 32 127 70 183 2 -2 297
Operating profit after profit allocation 15 205 2 673 2 507 1 016 871 282 -343 -128 -70 22 013
Internal income1 -632 -1 086 -2 572 -209 -157 -296 -2 772 7 724
C/I ratio, % 34.6 57.0 34.7 57.6 49.4 68.8 111.6 47.7
Credit loss ratio, % 0.02 0.06 0.17 -0.01 0.14 -0.03 -0.02 -0.23 0.04
Assets 1 831 844 384 417 262 164 122 915 193 618 54 684 277 159 2 160 503 -2 309 130 2 978 174
Liabilities 1 746 592 369 536 244 395 116 451 186 931 52 861 272 734 2 160 503 -2 314 090 2 835 913
Allocated capital 85 252 14 881 17 769 6 464 6 687 1 823 4 425 4 960 142 261
Return on allocated capital, % 14.4 14.7 11.5 12.7 10.4 12.9 -5.9 12.8
The year's investments in non-financial
non-current assets 106 145 12 4 1 42 417 473 1 200
The year's investments in associated
companies - -
Average number of employees 3 985 2 230 697 615 518 300 1 076 2 886 12 307
During the first quarter of 2019 a reorganisation was implemented which has meant that certain operations in the Handelsbanken Sweden and Handelsbanken Capital Markets business seg-
ments have been moved over to Group IT and the newly formed unit Group Products and Services. Income and expenses relating to Group IT and Group Products and Services are reported
within Other units. Due to this the comparison figures have been adjusted. At the same time, the model for the internal capital allocation to the business segments has been adjusted somewhat.
1 Internal income which is included in total income comprises income from transactions with other operating segments and Other. Since interest income and interest expense
are reported net as income, this means that internal income includes the net amount of the internal funding cost among segments and Other.
form of payment for internal services rendered.
Internal debiting is primarily according to the
cost price principle.
In branch operations, assets consist mainly
of loans to the public and liabilities of deposits
from the public and also internal borrowing. In
the Capital Markets segment, assets mainly
consist of securities that are managed within the
asset management and insurance operations.
The assets in the Other column are mainly inter-
nal lending to the various segments, while the
liabilities are mainly external borrowings. The
allocated capital for the segments is the same
as the capital allocation according to the internal
financial control model.
G44 Cont.
NOTES | GROUP
HANDELSBANKEN | ANNUAL REPORT 2019 173
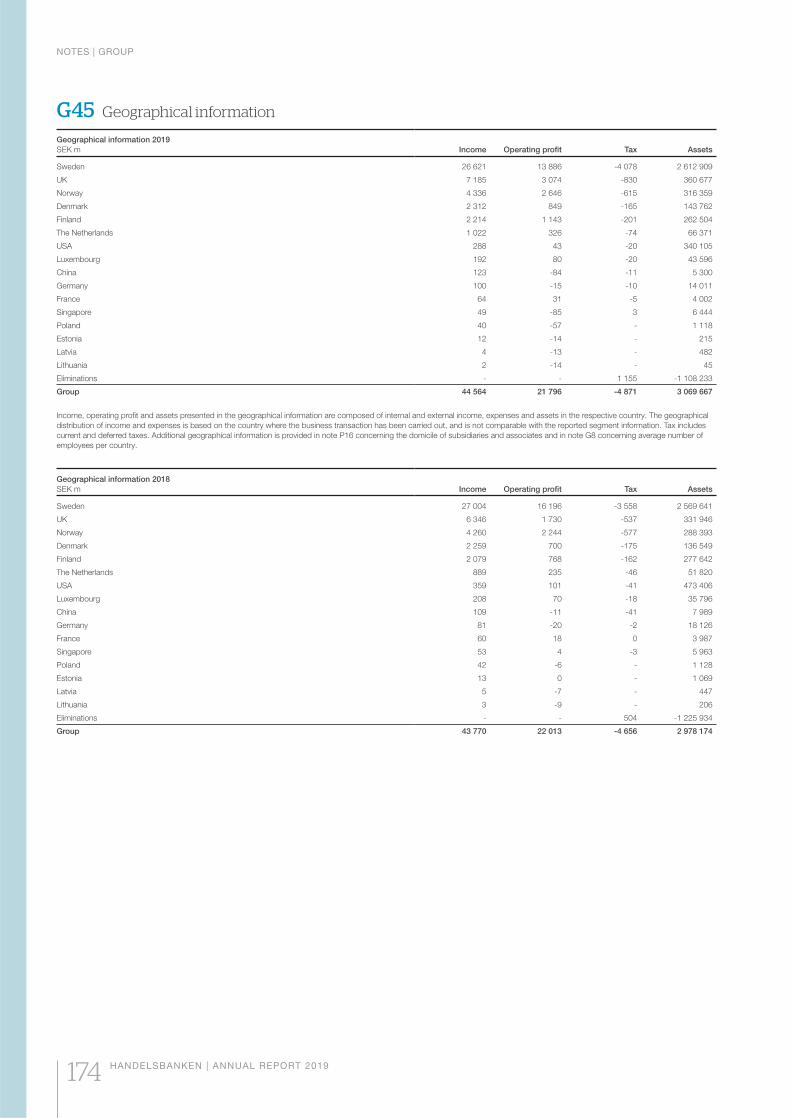
G45 Geographical information
Geographical information 2019
SEK m Income Operating profit Tax Assets
Sweden 26 621 13 886 -4 078 2 612 909
UK 7 185 3 074 -830 360 677
Norway 4 336 2 646 -615 316 359
Denmark 2 312 849 -165 143 762
Finland 2 214 1 143 -201 262 504
The Netherlands 1 022 326 -74 66 371
USA 288 43 -20 340 105
Luxembourg 192 80 -20 43 596
China 123 -84 -11 5 300
Germany 100 -15 -10 14 011
France 64 31 -5 4 002
Singapore 49 -85 3 6 444
Poland 40 -57 - 1 118
Estonia 12 -14 - 215
Latvia 4 -13 - 482
Lithuania 2 -14 - 45
Eliminations - - 1 155 -1 108 233
Group 44 564 21 796 -4 871 3 069 667
Income, operating profit and assets presented in the geographical information are composed of internal and external income, expenses and assets in the respective country. The geographical
distribution of income and expenses is based on the country where the business transaction has been carried out, and is not comparable with the reported segment information. Tax includes
current and deferred taxes. Additional geographical information is provided in note P16 concerning the domicile of subsidiaries and associates and in note G8 concerning average number of
employees per country.
Geographical information 2018
SEK m Income Operating profit Tax Assets
Sweden 27 004 16 196 -3 558 2 569 641
UK 6 346 1 730 -537 331 946
Norway 4 260 2 244 -577 288 393
Denmark 2 259 700 -175 136 549
Finland 2 079 768 -162 277 642
The Netherlands 889 235 -46 51 820
USA 359 101 -41 473 406
Luxembourg 208 70 -18 35 796
China 109 -11 -41 7 989
Germany 81 -20 -2 18 126
France 60 18 0 3 987
Singapore 53 4 -3 5 963
Poland 42 -6 - 1 128
Estonia 13 0 - 1 069
Latvia 5 -7 - 447
Lithuania 3 -9 - 206
Eliminations - - 504 -1 225 934
Group 43 770 22 013 -4 656 2 978 174
NOTES | GROUP
174 HANDELSBANKEN | ANNUAL REPORT 2019
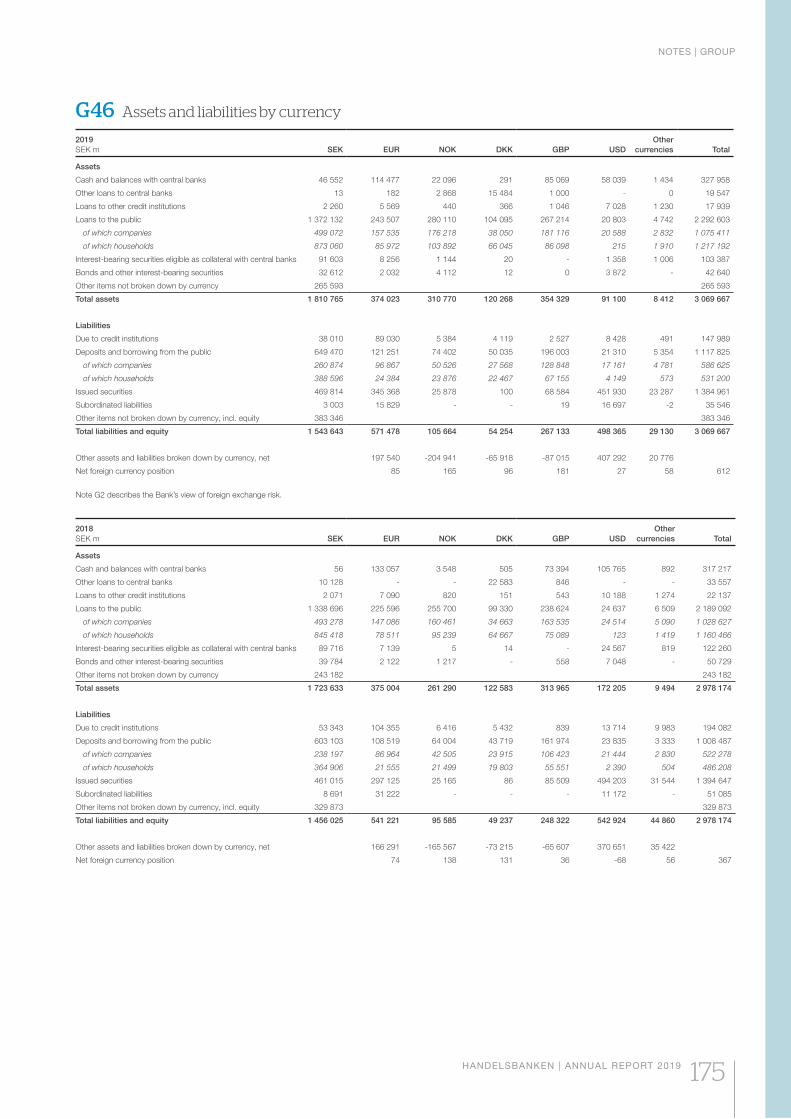
G46 Assets and liabilities by currency
2019
SEK m SEK EUR NOK DKK GBP USD
Other
currencies Total
Assets
Cash and balances with central banks 46 552 114 477 22 096 291 85 069 58 039 1 434 327 958
Other loans to central banks 13 182 2 868 15 484 1 000 - 0 19 547
Loans to other credit institutions 2 260 5 569 440 366 1 046 7 028 1 230 17 939
Loans to the public 1 372 132 243 507 280 110 104 095 267 214 20 803 4 742 2 292 603
of which companies 499 072 157 535 176 218 38 050 181 116 20 588 2 832 1 075 411
of which households 873 060 85 972 103 892 66 045 86 098 215 1 910 1 217 192
Interest-bearing securities eligible as collateral with central banks 91 603 8 256 1 144 20 - 1 358 1 006 103 387
Bonds and other interest-bearing securities 32 612 2 032 4 112 12 0 3 872 - 42 640
Other items not broken down by currency 265 593 265 593
Total assets 1 810 765 374 023 310 770 120 268 354 329 91 100 8 412 3 069 667
Liabilities
Due to credit institutions 38 010 89 030 5 384 4 119 2 527 8 428 491 147 989
Deposits and borrowing from the public 649 470 121 251 74 402 50 035 196 003 21 310 5 354 1 117 825
of which companies 260 874 96 867 50 526 27 568 128 848 17 161 4 781 586 625
of which households 388 596 24 384 23 876 22 467 67 155 4 149 573 531 200
Issued securities 469 814 345 368 25 878 100 68 584 451 930 23 287 1 384 961
Subordinated liabilities 3 003 15 829 - - 19 16 697 -2 35 546
Other items not broken down by currency, incl. equity 383 346 383 346
Total liabilities and equity 1 543 643 571 478 105 664 54 254 267 133 498 365 29 130 3 069 667
Other assets and liabilities broken down by currency, net 197 540 -204 941 -65 918 -87 015 407 292 20 776
Net foreign currency position 85 165 96 181 27 58 612
Note G2 describes the Bank’s view of foreign exchange risk.
2018
SEK m SEK EUR NOK DKK GBP USD
Other
currencies Total
Assets
Cash and balances with central banks 56 133 057 3 548 505 73 394 105 765 892 317 217
Other loans to central banks 10 128 - - 22 583 846 - - 33 557
Loans to other credit institutions 2 071 7 090 820 151 543 10 188 1 274 22 137
Loans to the public 1 338 696 225 596 255 700 99 330 238 624 24 637 6 509 2 189 092
of which companies 493 278 147 086 160 461 34 663 163 535 24 514 5 090 1 028 627
of which households 845 418 78 511 95 239 64 667 75 089 123 1 419 1 160 466
Interest-bearing securities eligible as collateral with central banks 89 716 7 139 5 14 - 24 567 819 122 260
Bonds and other interest-bearing securities 39 784 2 122 1 217 - 558 7 048 - 50 729
Other items not broken down by currency 243 182 243 182
Total assets 1 723 633 375 004 261 290 122 583 313 965 172 205 9 494 2 978 174
Liabilities
Due to credit institutions 53 343 104 355 6 416 5 432 839 13 714 9 983 194 082
Deposits and borrowing from the public 603 103 108 519 64 004 43 719 161 974 23 835 3 333 1 008 487
of which companies 238 197 86 964 42 505 23 915 106 423 21 444 2 830 522 278
of which households 364 906 21 555 21 499 19 803 55 551 2 390 504 486 208
Issued securities 461 015 297 125 25 165 86 85 509 494 203 31 544 1 394 647
Subordinated liabilities 8 691 31 222 - - - 11 172 - 51 085
Other items not broken down by currency, incl. equity 329 873 329 873
Total liabilities and equity 1 456 025 541 221 95 585 49 237 248 322 542 924 44 860 2 978 174
Other assets and liabilities broken down by currency, net 166 291 -165 567 -73 215 -65 607 370 651 35 422
Net foreign currency position 74 138 131 36 -68 56 367
NOTES | GROUP
HANDELSBANKEN | ANNUAL REPORT 2019 175
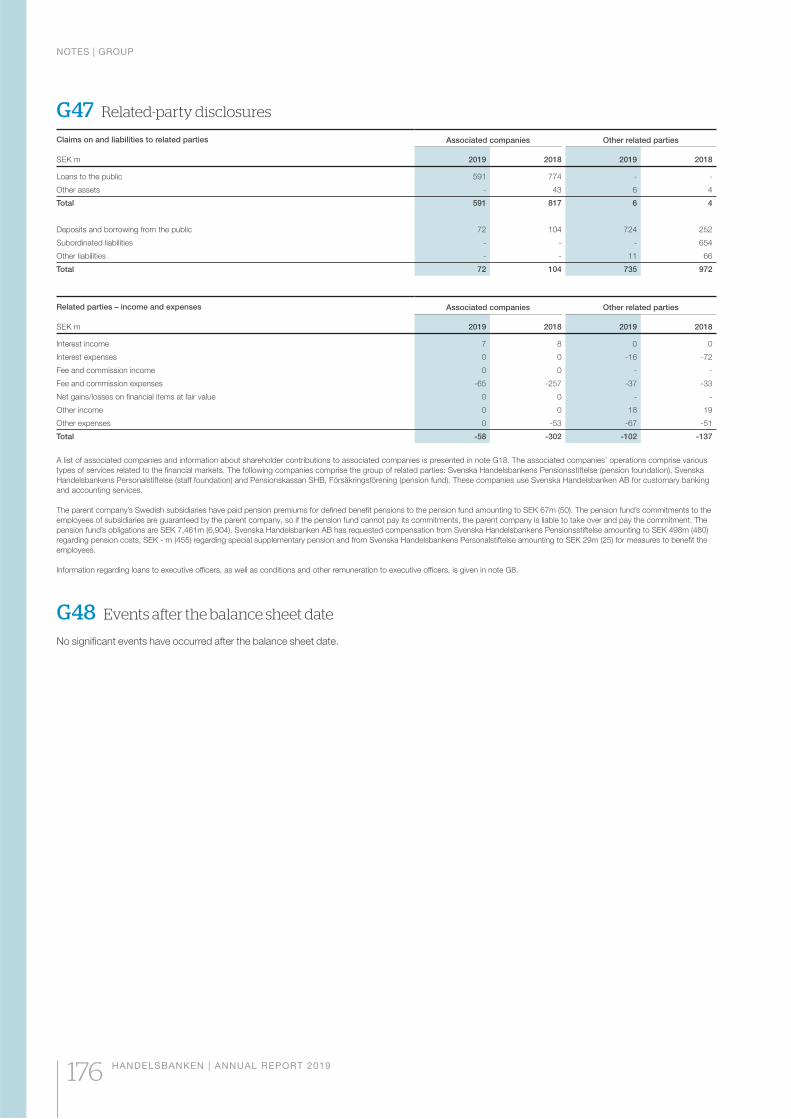
G48 Events after the balance sheet date
No significant events have occurred after the balance sheet date.
G47 Related-party disclosures
Claims on and liabilities to related parties
SEK m
Associated companies Other related parties
2019 2018 2019 2018
Loans to the public 591 774 - -
Other assets - 43 6 4
Total 591 817 6 4
Deposits and borrowing from the public 72 104 724 252
Subordinated liabilities - - - 654
Other liabilities - - 11 66
Total 72 104 735 972
Related parties – income and expenses
SEK m
Associated companies Other related parties
2019 2018 2019 2018
Interest income 7 8 0 0
Interest expenses 0 0 -16 -72
Fee and commission income 0 0 - -
Fee and commission expenses -65 -257 -37 -33
Net gains/losses on financial items at fair value 0 0 - -
Other income 0 0 18 19
Other expenses 0 -53 -67 -51
Total -58 -302 -102 -137
A list of associated companies and information about shareholder contributions to associated companies is presented in note G18. The associated companies’ operations comprise various
types of services related to the financial markets. The following companies comprise the group of related parties: Svenska Handelsbankens Pensionsstiftelse (pension foundation), Svenska
Handelsbankens Personalstiftelse (staff foundation) and Pensionskassan SHB, Försäkringsförening (pension fund). These companies use Svenska Handelsbanken AB for customary banking
and accounting services.
The parent company’s Swedish subsidiaries have paid pension premiums for defined benefit pensions to the pension fund amounting to SEK 67m (50). The pension fund’s commitments to the
employees of subsidiaries are guaranteed by the parent company, so if the pension fund cannot pay its commitments, the parent company is liable to take over and pay the commitment. The
pension fund’s obligations are SEK 7,461m (6,904). Svenska Handelsbanken AB has requested compensation from Svenska Handelsbankens Pensionsstiftelse amounting to SEK 498m (480)
regarding pension costs, SEK - m (455) regarding special supplementary pension and from Svenska Handelsbankens Personalstiftelse amounting to SEK 29m (25) for measures to benefit the
employees.
Information regarding loans to executive officers, as well as conditions and other remuneration to executive officers, is given in note G8.
NOTES | GROUP
176 HANDELSBANKEN | ANNUAL REPORT 2019
CAPITAL POLICY
The Bank aims to maintain a robust capital level
which meets the risk entailed in the Group’s
operations and which exceeds the minimum
requirements prescribed by legislation. A healthy
capital level is needed to manage situations of
financial strain and also for other events such as
acquisitions and major growth in volumes.
CAPITAL REQUIREMENTS REGULATIONS
According to the capital adequacy regulations,
Regulation (EU) No 575/2013 EU (CRR), which
came into force in the EU on 1 January 2014,
and directive 2013/36/EU (CRD IV), which was
implemented in Sweden on 2 August 2014, the
Bank must have common equity tier 1 capital,
tier 1 capital and total own funds which at least
correspond to the individual requirements relative
to the total risk exposure amount for credit risk,
market risk and operational risk. In addition to
holding capital in accordance with the minimum
requirement, the Bank must also hold common
equity tier 1 capital to comply with the combined
buffer requirement which, in Sweden, comprises
the sum of a capital conservation buffer, a
countercyclical buffer and a systemic risk buffer.
The Bank is also required to hold capital for the
Pillar 2 requirement. The Pillar 2 requirement is an
individual requirement which is intended to cover
risks which are underestimated or not covered
by the regulation’s minimum requirement and
combined buffer requirements. The Bank must
also perform an internal capital assessment.
Handelsbanken’s capital policy states the
guidelines for the internal capital assessment.
The Bank must also comply with a capital
requirement at the financial conglomerate level
in accordance with the Financial Conglomerates
(Special Supervision) Act (2006:531). See also
Capital adequacy for the financial conglomerate
below. Since 1 February 2016, the resolution
authority, which in Sweden is the National Debt
Office, must set a minimum requirement for own
funds and eligible liabilities (MREL) for the Bank.
See Minimum requirement for own funds and
eligible liabilities below. In 2019, the Bank met
all the statutory minimum and buffer levels by a
comfortable margin. More detailed information
about the Bank’s own funds and capital require-
ment is available in note G2, Risk and capital
management, and in Handelsbanken’s publication
titled Risk and Capital – Information according
to Pillar 3 (see handelsbanken.com/ir). This
publication also provides a complete description
of the terms and conditions applying to all of
Handelsbanken’s own funds instruments.
DESCRIPTION OF CONSOLIDATED
SITUATION
The regulatory consolidation (consolidated situ-
ation) consists of the parent company, subsidi-
aries and associated companies that are also
included in the consolidated Group accounts,
as shown in table 2.10, Companies included in
consolidated situation. The companies that are
included in the consolidated accounts but are
excluded from the consolidated situation are
also shown in table 2.10, Companies included
in consolidated situation. Just as in the con-
solidated accounts, associated companies are
consolidated using the equity method in the
regulatory consolidated situation. Subsidiar-
ies are further consolidated according to the
acquisition method. All subsidiaries which are
subject to the regulations are included in the
consolidated situation. Handelsbanken has no
subsidiaries where the actual own funds are less
than the prescribed own funds.
DESCRIPTION OF OWN FUNDS
FOR CONSOLIDATED SITUATION
Own funds consist of tier 1 capital and tier 2
capital. The tier 1 capital is divided into common
equity tier 1 capital and additional tier 1 capital.
Common equity tier 1 capital consists mainly of
share capital, retained earnings and other
reserves in the companies that are included in
the consolidation. Remaining tier 1 capital
consists of additional tier 1 instruments. The tier
2 capital mainly consists of subordinated loans.
Certain deductions are subsequently made
from own funds. The deductions are made
mainly from the common equity tier 1 capital.
For the Bank’s risk management, it is important
that in risk terms, both the Group and the
regulatory consolidation can be viewed as one
unit. To enable efficient risk management in the
Group, capital may need to be re-allocated
among the various companies in the Group. In
general, Handelsbanken is able to re-allocate
capital among the Group companies, to the
extent that is permitted by legislation, for
example, capital adequacy requirements and
restrictions in corporate law. The Bank sees
no other material or legal obstacles to a rapid
transfer of funds from the capital base, or
repayment of liabilities between the parent
company and its subsidiaries.
Tier 1 capital
Tier 1 capital consists of common equity tier 1
capital and additional tier 1 capital.
Common equity tier 1 (CET1) capital
Common equity tier 1 capital consists chiefly
of share capital, retained earnings and other
reserves in the companies that are included
in the regulatory consolidation. Since the
Group’s insurance companies are not part of
the consolidation, shown in the table on page
179, retained earnings in these companies
are not included in the common equity tier 1
capital. The items to be excluded from the
common equity tier 1 capital are mainly goodwill
and other intangible assets, and also capital
contributions to the insurance companies in
the Group or certain deferred tax assets which
exceed 10 per cent of the common equity
tier 1 capital. The total of capital contributions
and deferred tax assets must not exceed 15
per cent of the common equity tier 1 capital.
Since neither the capital contributions to the
insurance companies in the Group nor the
deferred tax assets exceed the threshold
value, these do not reduce the common
equity tier 1 capital. Neutrality adjustments
are made for the effect of cash flow hedges
on equity. A price adjustment must also be
calculated and when necessary, be made for a
cautious valuation of instruments at fair value.
Institutions with permission to use internal
ratings-based models must make a deduction
for the difference between expected credit
losses according to the IRB approach and the
provisions made for probable credit losses if the
expected credit losses exceed the provisions
made. A deduction must also be made for
the net value of recognised surplus values in
pension assets. However, the deduction may
be reduced by an amount corresponding to the
Bank’s right to reimbursement for pension costs
from Handelsbanken’s pension foundation. In
addition, a deduction is made for permission
to hold own shares in its capacity as market
maker. The deduction must correspond to
the highest market value covered by the
permission. Finally, a deduction is made for
investments in securitisation.
Additional tier 1 capital
Additional tier 1 capital consists of instruments
which fulfil the requirements for additional tier 1
capital. This capital must be perpetual and must
be redeemable after five years at the earliest,
but only after permission is granted by the
supervisory authority. It must be possible to
write down the nominal value or convert it to
shares to create common equity tier 1 capital at
a pre-defined level for the common equity tier 1
capital and it must be possible to
unconditionally suspend interest payments.
The Bank’s total additional tier 1 capital
amounts to SEK 15.8 billion. Of this amount,
additional tier 1 capital for SEK 11.2 billion was
issued in 2015 and SEK 4.6 billion was issued
in 2019, which fulfils the requirements of CRR.
If there are no distributable funds, coupon
payments must be suspended for additional
tier 1 capital.
Tier 2 (T2) capital
The tier 2 capital consists of subordinated loans
with a maturity of at least five years. Deductions
are made for subordinated loan contributions to
the insurance companies within the Group.
G49 Capital adequacy
The numbering of certain tables and figures in this Note is consistent with the numbering used in Handelsbanken’s publication “Risk and Capital – Information according to Pillar 3”.
NOTES | GROUP
HANDELSBANKEN | ANNUAL REPORT 2019 177
CAPITAL REQUIREMENTS
Credit risk
The capital requirements for credit risk are
calculated according to the standardised
approach and the IRB approach according to
CRR. There are two different IRB approaches:
the IRB approach without own estimates of
LGD and CCF (the foundation approach), and
the IRB approach with own estimates of LGD
and CCF (the advanced approach).
In the IRB approach without own estimates
of LGD and CCF, the Bank uses its own method
to determine the probability of the customer
defaulting within one year (PD), while the other
parameters are set out in CRR. In the IRB
approach with own estimates of LGD and CCF,
the Bank uses its own methods to calculate the
loss given default (LGD) and the credit conver-
sion factor (CCF). A definition of the credit con-
version factor (CCF) is provided in Handels-
banken’s Fact Book.
Handelsbanken uses the IRB approach
without own estimates of LGD and CCF for
exposures to institutions and for certain product
and collateral types for corporate exposures in
the whole of the regional banking operations
and in the following subsidiaries: Stadshypotek
AB, Handelsbanken Finans AB, Ecster AB and
Rahoitus Oy.
The IRB approach with own estimates of
LGD and CCF is applied to most exposures to
large corporates, medium-sized companies,
property companies and housing co-operative
associations in the regional banks (excluding the
Netherlands), Handelsbanken Capital Markets,
Stadshypotek AB and Handelsbanken Finans
AB, for retail exposures in Sweden, Norway,
Denmark and Finland, and in the subsidiaries
Stadshypotek AB, Handelsbanken Finans AB,
Ecster AB and Rahoitus Oy.
As of 1 December 2018, operations in the UK
are conducted in the subsidiary Handelsbanken
plc. Previously, the operations were conducted
in the form of a branch office. In the consoli-
dated situation at Group level, capital adequacy
for corporate exposure in the UK is set using the
IRB approach, while the local capital require-
ment is set using the standardised approach.
At year-end, the IRB approach was applied
to 86 per cent (86) of the total risk exposure
amount for credit risk. For the remaining credit
risk exposures, the capital requirements are
calculated using the standardised approach.
Figures reported in this section refer to the mini-
mum capital requirements under Pillar 1 and
buffers of the capital adequacy regulations,
CRR and CRD IV.
The total average risk weight for exposures
approved for the IRB approach decreased
during the year to 13.7 per cent (13.9). The
decrease was marginal and can mainly be
attributed to the breakdown of the portfolio, in
that exposure classes with somewhat lower risk
weights, housing co-operative associations and
households, have risen proportionally slightly
more than those with higher risk weights.
Adjusted for the move of the risk weight floor for
Swedish mortgage loans from Pillar 2 to Pillar 1,
the total average risk weight is 20.0 per cent
(19.9).
Credit quality is good. Of Handelsbanken’s
corporate exposures, 98 per cent (98) were
customers with a repayment capacity assessed
as normal or better than normal, i.e. with a rat-
ing grade between one and five on the Bank’s
10-point risk rating scale.
In 2017, Handelsbanken received permission
to use new PD models for companies in the IRB
approach. The models are based on historical
default frequency, by both risk class and portfo-
lio. The estimates for each portfolio are based
on the Bank’s internal data and data from other
sources, such as external credit rating agencies,
and the duration of a business cycle in which
one of five years is a downturn year and in which
the Swedish banking crisis of the 1990s is taken
into account, as required by the Swedish Finan-
cial Supervisory Authority. Significant margins
of conservatism are added, and the PD for the
portfolios are not expected to vary year on year.
The estimates by risk class are based on the
Bank’s internal default data and a model that
determines the relationship of probability of
default between different risk classes. The mar-
gins are then added up so that each portfolio’s
aggregate PD corresponds to the estimated
portfolio PD. This means that the PD for each
risk class may vary over time even if the portfolio
PD does not, as counterparties may move
between risk classes over time.
The capital requirements for equity exposures
in the IRB approach are calculated according to
a simplified risk weight method.
Further information about changes during the
year is provided in the Bank’s interim reports for
2019 and the publication ‘Risk and Capital
– Information according to Pillar 3’.
Market risks
The capital requirement for market risk is calcu-
lated for the Bank’s consolidated situation. The
capital requirements for interest rate risk and
equity price risk are, however, only calculated
for positions in the trading book. When calculat-
ing the capital requirement for market risk, the
standardised approach is applied.
Capital requirement for operational risk
Handelsbanken uses the standardised
approach to calculate the capital requirement
for operational risk. According to the standard-
ised approach, the capital requirement is
calculated by multiplying a factor specified in
the regulations by the average operating income
during the last three years of operation. Different
factors are applied in different business
segments.
The total capital requirement for operational
risks for the consolidated situation was SEK
5,282 million (5,115) at the end of 2019.
CAPITAL ADEQUACY FOR
THE FINANCIAL CONGLOMERATE
Institutions and insurance companies which are
part of a financial conglomerate must have own
funds which are adequate in relation to the capi-
tal requirement for the financial conglomerate.
Own funds and the capital requirement for the
financial conglomerate have been calculated
according to the deduction and aggregation
method (method 2, Annex I, Directive 2002/87/
EC). The financial conglomerate’s total own
funds exceed the financial conglomerate’s capi-
tal requirement.
MINIMUM REQUIREMENT FOR OWN
FUNDS AND ELIGIBLE LIABILITIES (MREL)
The Bank Recovery and Resolution Directive
(2014/59/EU, BRRD), was implemented in
Swedish law through the Resolution Act
(2015:1016). These regulations state ways to
manage bank crises, and enable authorities,
within a set framework, to assume control of,
restructure and sell either all or parts of a bank,
without liquidating the bank or entering it into
bankruptcy. In addition to these crisis manage-
ment measures, the regulations offer the oppor-
tunity to write down certain debt instruments to
recapitalise a crisis-hit bank.
One aspect of these regulations was the
introduction of a minimum requirement for such
liabilities eligible for impairment (MREL) from
1 January 2018. The minimum requirement is
set in the Bank’s resolution plan, drawn up by
the Swedish National Debt Office and the
Swedish Financial Supervisory Authority. The
Bank’s 2020 MREL amounts to 5.8 per cent
(6.2) of total liabilities and own funds at consoli-
dated level. The requirement is comprised of a
loss absorption amount and a recapitalisation
amount.
The Swedish National Debt Office also
applies the liabilities proportion principle, mean-
ing that MREL must partially be fulfilled solely
with eligible, qualified liabilities (as opposed to
own funds). To meet this requirement, a new
type of debt instrument was introduced in
Swedish legislation in December 2018. This
type is subordinate to current senior debt instru-
ments, but ranks more highly than own funds
instruments as part of a resolution procedure.
Handelsbanken has issued this type of subordi-
nated debt instrument in 2019. During 2020,
the regulations will be adapted to comply with
new EU directives. Handelsbanken is monitor-
ing developments.
G49 Cont.
NOTES | GROUP
178 HANDELSBANKEN | ANNUAL REPORT 2019
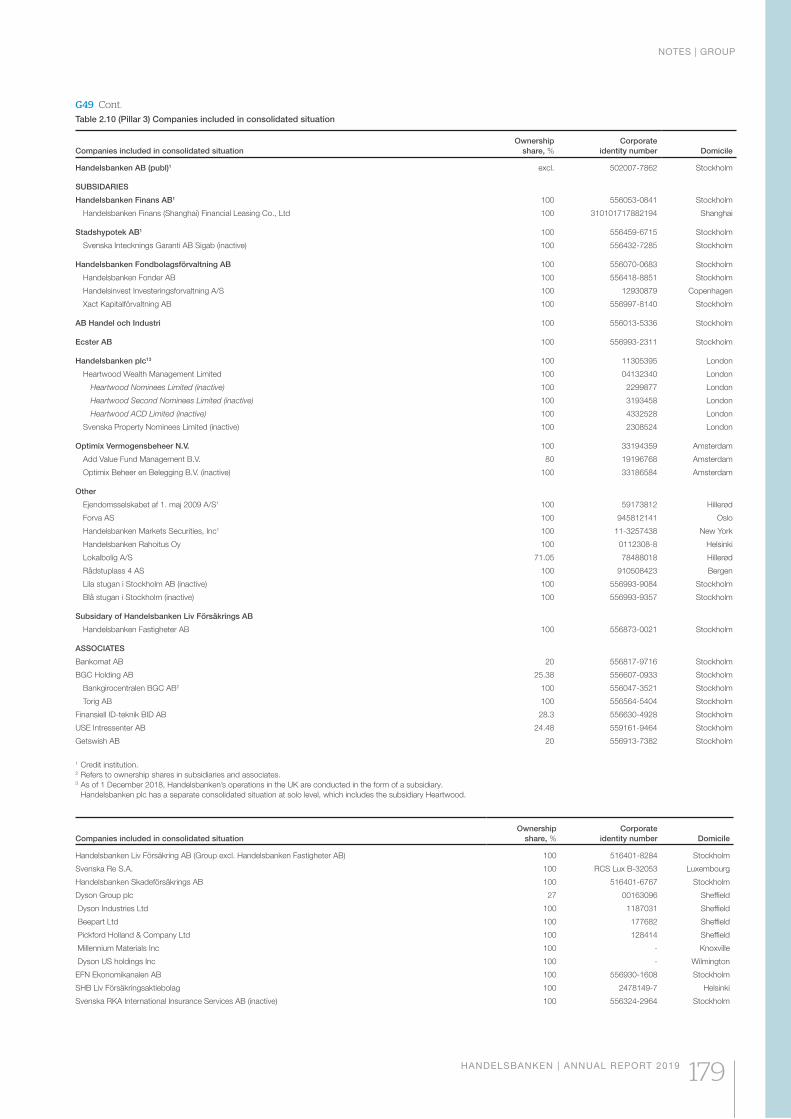
Table 2.10 (Pillar 3) Companies included in consolidated situation
Companies included in consolidated situation
Ownership
share, %
Corporate
identity number Domicile
Handelsbanken AB (publ)1 excl. 502007-7862 Stockholm
SUBSIDARIES
Handelsbanken Finans AB1 100 556053-0841 Stockholm
Handelsbanken Finans (Shanghai) Financial Leasing Co., Ltd 100 310101717882194 Shanghai
Stadshypotek AB1 100 556459-6715 Stockholm
Svenska Intecknings Garanti AB Sigab (inactive) 100 556432-7285 Stockholm
Handelsbanken Fondbolagsförvaltning AB 100 556070-0683 Stockholm
Handelsbanken Fonder AB 100 556418-8851 Stockholm
Handelsinvest Investeringsforvaltning A/S 100 12930879 Copenhagen
Xact Kapitalförvaltning AB 100 556997-8140 Stockholm
AB Handel och Industri 100 556013-5336 Stockholm
Ecster AB 100 556993-2311 Stockholm
Handelsbanken plc13 100 11305395 London
Heartwood Wealth Management Limited 100 04132340 London
Heartwood Nominees Limited (inactive) 100 2299877 London
Heartwood Second Nominees Limited (inactive) 100 3193458 London
Heartwood ACD Limited (inactive) 100 4332528 London
Svenska Property Nominees Limited (inactive) 100 2308524 London
Optimix Vermogensbeheer N.V. 100 33194359 Amsterdam
Add Value Fund Management B.V. 80 19196768 Amsterdam
Optimix Beheer en Belegging B.V. (inactive) 100 33186584 Amsterdam
Other
Ejendomsselskabet af 1. maj 2009 A/S1 100 59173812 Hillerød
Forva AS 100 945812141 Oslo
Handelsbanken Markets Securities, Inc1 100 11-3257438 New York
Handelsbanken Rahoitus Oy 100 0112308-8 Helsinki
Lokalbolig A/S 71.05 78488018 Hillerød
Rådstuplass 4 AS 100 910508423 Bergen
Lila stugan i Stockholm AB (inactive) 100 556993-9084 Stockholm
Blå stugan i Stockholm (inactive) 100 556993-9357 Stockholm
Subsidary of Handelsbanken Liv Försäkrings AB
Handelsbanken Fastigheter AB 100 556873-0021 Stockholm
ASSOCIATES
Bankomat AB 20 556817-9716 Stockholm
BGC Holding AB 25.38 556607-0933 Stockholm
Bankgirocentralen BGC AB2 100 556047-3521 Stockholm
Torig AB 100 556564-5404 Stockholm
Finansiell ID-teknik BID AB 28.3 556630-4928 Stockholm
USE Intressenter AB 24.48 559161-9464 Stockholm
Getswish AB 20 556913-7382 Stockholm
1 Credit institution. 2 Refers to ownership shares in subsidiaries and associates. 3 As of 1 December 2018, Handelsbanken’s operations in the UK are conducted in the form of a subsidiary.
Handelsbanken plc has a separate consolidated situation at solo level, which includes the subsidiary Heartwood.
Companies included in consolidated situation
Ownership
share, %
Corporate
identity number Domicile
Handelsbanken Liv Försäkring AB (Group excl. Handelsbanken Fastigheter AB) 100 516401-8284 Stockholm
Svenska Re S.A. 100 RCS Lux B-32053 Luxembourg
Handelsbanken Skadeförsäkrings AB 100 516401-6767 Stockholm
Dyson Group plc 27 00163096 Sheffield
Dyson Industries Ltd 100 1187031 Sheffield
Beepart Ltd 100 177682 Sheffield
Pickford Holland & Company Ltd 100 128414 Sheffield
Millennium Materials Inc 100 - Knoxville
Dyson US holdings Inc 100 - Wilmington
EFN Ekonomikanalen AB 100 556930-1608 Stockholm
SHB Liv Försäkringsaktiebolag 100 2478149-7 Helsinki
Svenska RKA International Insurance Services AB (inactive) 100 556324-2964 Stockholm
G49 Cont.
NOTES | GROUP
HANDELSBANKEN | ANNUAL REPORT 2019 179
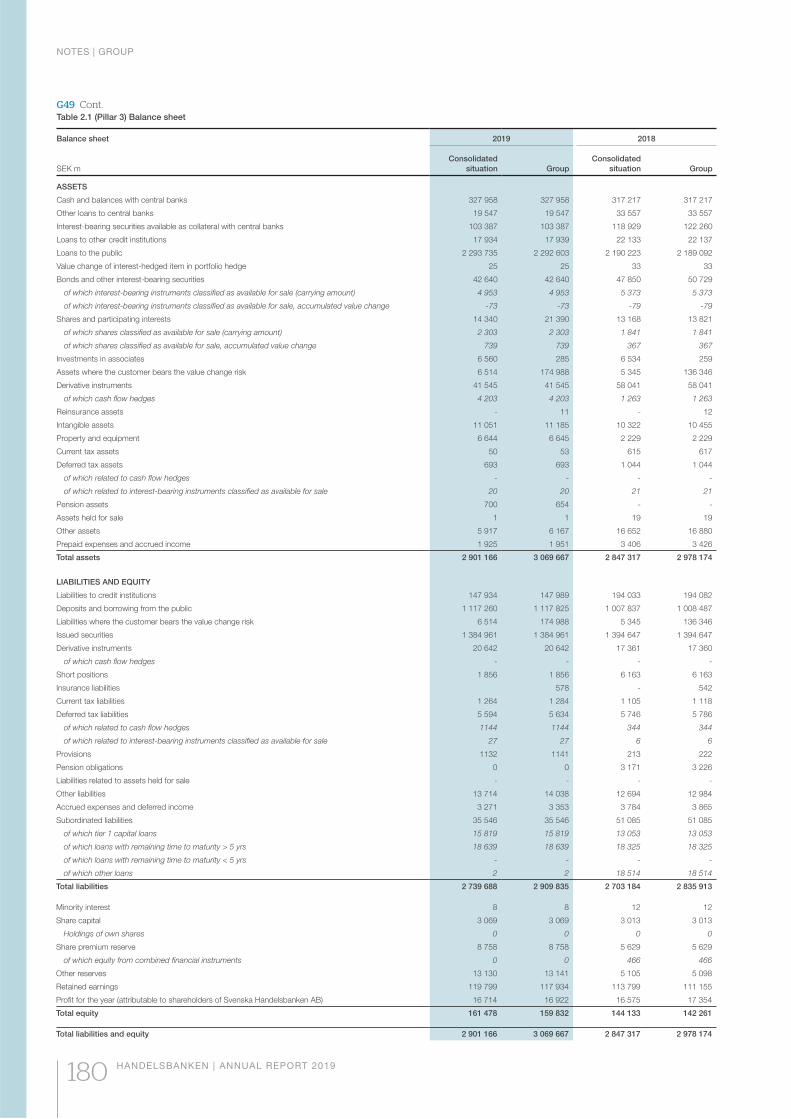
G49 Cont.Table 2.1 (Pillar 3) Balance sheet
Balance sheet
SEK m
2019 2018
Consolidated
situation Group
Consolidated
situation Group
ASSETS
Cash and balances with central banks 327 958 327 958 317 217 317 217
Other loans to central banks 19 547 19 547 33 557 33 557
Interest-bearing securities available as collateral with central banks 103 387 103 387 118 929 122 260
Loans to other credit institutions 17 934 17 939 22 133 22 137
Loans to the public 2 293 735 2 292 603 2 190 223 2 189 092
Value change of interest-hedged item in portfolio hedge 25 25 33 33
Bonds and other interest-bearing securities 42 640 42 640 47 850 50 729
of which interest-bearing instruments classified as available for sale (carrying amount) 4 953 4 953 5 373 5 373
of which interest-bearing instruments classified as available for sale, accumulated value change -73 -73 -79 -79
Shares and participating interests 14 340 21 390 13 168 13 821
of which shares classified as available for sale (carrying amount) 2 303 2 303 1 841 1 841
of which shares classified as available for sale, accumulated value change 739 739 367 367
Investments in associates 6 560 285 6 534 259
Assets where the customer bears the value change risk 6 514 174 988 5 345 136 346
Derivative instruments 41 545 41 545 58 041 58 041
of which cash flow hedges 4 203 4 203 1 263 1 263
Reinsurance assets - 11 - 12
Intangible assets 11 051 11 185 10 322 10 455
Property and equipment 6 644 6 645 2 229 2 229
Current tax assets 50 53 615 617
Deferred tax assets 693 693 1 044 1 044
of which related to cash flow hedges - - - -
of which related to interest-bearing instruments classified as available for sale 20 20 21 21
Pension assets 700 654 - -
Assets held for sale 1 1 19 19
Other assets 5 917 6 167 16 652 16 880
Prepaid expenses and accrued income 1 925 1 951 3 406 3 426
Total assets 2 901 166 3 069 667 2 847 317 2 978 174
LIABILITIES AND EQUITY
Liabilities to credit institutions 147 934 147 989 194 033 194 082
Deposits and borrowing from the public 1 117 260 1 117 825 1 007 837 1 008 487
Liabilities where the customer bears the value change risk 6 514 174 988 5 345 136 346
Issued securities 1 384 961 1 384 961 1 394 647 1 394 647
Derivative instruments 20 642 20 642 17 361 17 360
of which cash flow hedges - - - -
Short positions 1 856 1 856 6 163 6 163
Insurance liabilities 578 - 542
Current tax liabilities 1 264 1 284 1 105 1 118
Deferred tax liabilities 5 594 5 634 5 746 5 786
of which related to cash flow hedges 1144 1144 344 344
of which related to interest-bearing instruments classified as available for sale 27 27 6 6
Provisions 1132 1141 213 222
Pension obligations 0 0 3 171 3 226
Liabilities related to assets held for sale - - - -
Other liabilities 13 714 14 038 12 694 12 984
Accrued expenses and deferred income 3 271 3 353 3 784 3 865
Subordinated liabilities 35 546 35 546 51 085 51 085
of which tier 1 capital loans 15 819 15 819 13 053 13 053
of which loans with remaining time to maturity > 5 yrs 18 639 18 639 18 325 18 325
of which loans with remaining time to maturity < 5 yrs - - - -
of which other loans 2 2 18 514 18 514
Total liabilities 2 739 688 2 909 835 2 703 184 2 835 913
Minority interest 8 8 12 12
Share capital 3 069 3 069 3 013 3 013
Holdings of own shares 0 0 0 0
Share premium reserve 8 758 8 758 5 629 5 629
of which equity from combined financial instruments 0 0 466 466
Other reserves 13 130 13 141 5 105 5 098
Retained earnings 119 799 117 934 113 799 111 155
Profit for the year (attributable to shareholders of Svenska Handelsbanken AB) 16 714 16 922 16 575 17 354
Total equity 161 478 159 832 144 133 142 261
Total liabilities and equity 2 901 166 3 069 667 2 847 317 2 978 174
NOTES | GROUP
180 HANDELSBANKEN | ANNUAL REPORT 2019
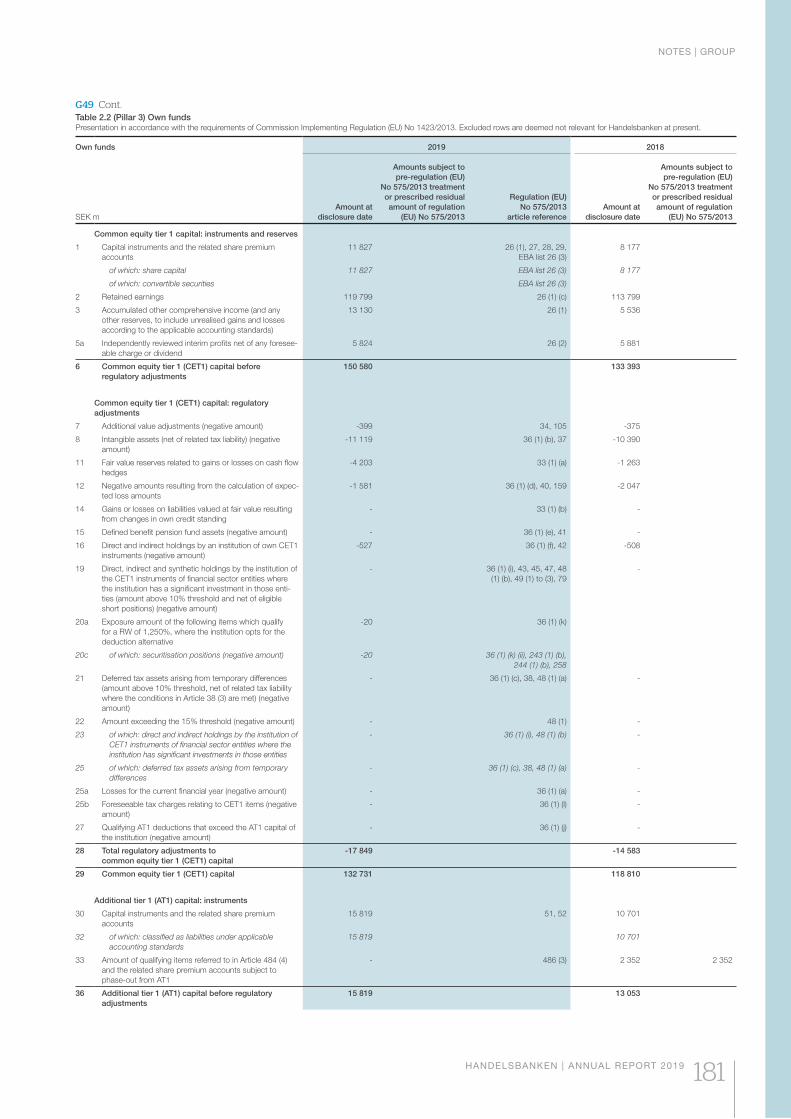
Table 2.2 (Pillar 3) Own fundsPresentation in accordance with the requirements of Commission Implementing Regulation (EU) No 1423/2013. Excluded rows are deemed not relevant for Handelsbanken at present.
Own funds
SEK m
2019 2018
Amount at
disclosure date
Amounts subject to
pre-regulation (EU)
No 575/2013 treatment
or prescribed residual
amount of regulation
(EU) No 575/2013
Regulation (EU)
No 575/2013
article reference
Amount at
disclosure date
Amounts subject to
pre-regulation (EU)
No 575/2013 treatment
or prescribed residual
amount of regulation
(EU) No 575/2013
Common equity tier 1 capital: instruments and reserves
1 Capital instruments and the related share premium
accounts
11 827 26 (1), 27, 28, 29,
EBA list 26 (3)
8 177
of which: share capital 11 827 EBA list 26 (3) 8 177
of which: convertible securities EBA list 26 (3)
2 Retained earnings 119 799 26 (1) (c) 113 799
3 Accumulated other comprehensive income (and any
other reserves, to include unrealised gains and losses
according to the applicable accounting standards)
13 130 26 (1) 5 536
5a Independently reviewed interim profits net of any foresee-
able charge or dividend
5 824 26 (2) 5 881
6 Common equity tier 1 (CET1) capital before
regulatory adjustments
150 580 133 393
Common equity tier 1 (CET1) capital: regulatory
adjustments
7 Additional value adjustments (negative amount) -399 34, 105 -375
8 Intangible assets (net of related tax liability) (negative
amount)
-11 119 36 (1) (b), 37 -10 390
11 Fair value reserves related to gains or losses on cash flow
hedges
-4 203 33 (1) (a) -1 263
12 Negative amounts resulting from the calculation of expec-
ted loss amounts
-1 581 36 (1) (d), 40, 159 -2 047
14 Gains or losses on liabilities valued at fair value resulting
from changes in own credit standing
- 33 (1) (b) -
15 Defined benefit pension fund assets (negative amount) - 36 (1) (e), 41 -
16 Direct and indirect holdings by an institution of own CET1
instruments (negative amount)
-527 36 (1) (f), 42 -508
19 Direct, indirect and synthetic holdings by the institution of
the CET1 instruments of financial sector entities where
the institution has a significant investment in those enti-
ties (amount above 10% threshold and net of eligible
short positions) (negative amount)
- 36 (1) (i), 43, 45, 47, 48
(1) (b), 49 (1) to (3), 79
-
20a Exposure amount of the following items which qualify
for a RW of 1,250%, where the institution opts for the
deduction alternative
-20 36 (1) (k)
20c of which: securitisation positions (negative amount) -20 36 (1) (k) (ii), 243 (1) (b),
244 (1) (b), 258
21 Deferred tax assets arising from temporary differences
(amount above 10% threshold, net of related tax liability
where the conditions in Article 38 (3) are met) (negative
amount)
- 36 (1) (c), 38, 48 (1) (a) -
22 Amount exceeding the 15% threshold (negative amount) - 48 (1) -
23 of which: direct and indirect holdings by the institution of
CET1 instruments of financial sector entities where the
institution has significant investments in those entities
- 36 (1) (i), 48 (1) (b) -
25 of which: deferred tax assets arising from temporary
differences
- 36 (1) (c), 38, 48 (1) (a) -
25a Losses for the current financial year (negative amount) - 36 (1) (a) -
25b Foreseeable tax charges relating to CET1 items (negative
amount)
- 36 (1) (l) -
27 Qualifying AT1 deductions that exceed the AT1 capital of
the institution (negative amount)
- 36 (1) (j) -
28 Total regulatory adjustments to
common equity tier 1 (CET1) capital
-17 849 -14 583
29 Common equity tier 1 (CET1) capital 132 731 118 810
Additional tier 1 (AT1) capital: instruments
30 Capital instruments and the related share premium
accounts
15 819 51, 52 10 701
32 of which: classified as liabilities under applicable
accounting standards
15 819 10 701
33 Amount of qualifying items referred to in Article 484 (4)
and the related share premium accounts subject to
phase-out from AT1
- 486 (3) 2 352 2 352
36 Additional tier 1 (AT1) capital before regulatory
adjustments
15 819 13 053
G49 Cont.
NOTES | GROUP
HANDELSBANKEN | ANNUAL REPORT 2019 181
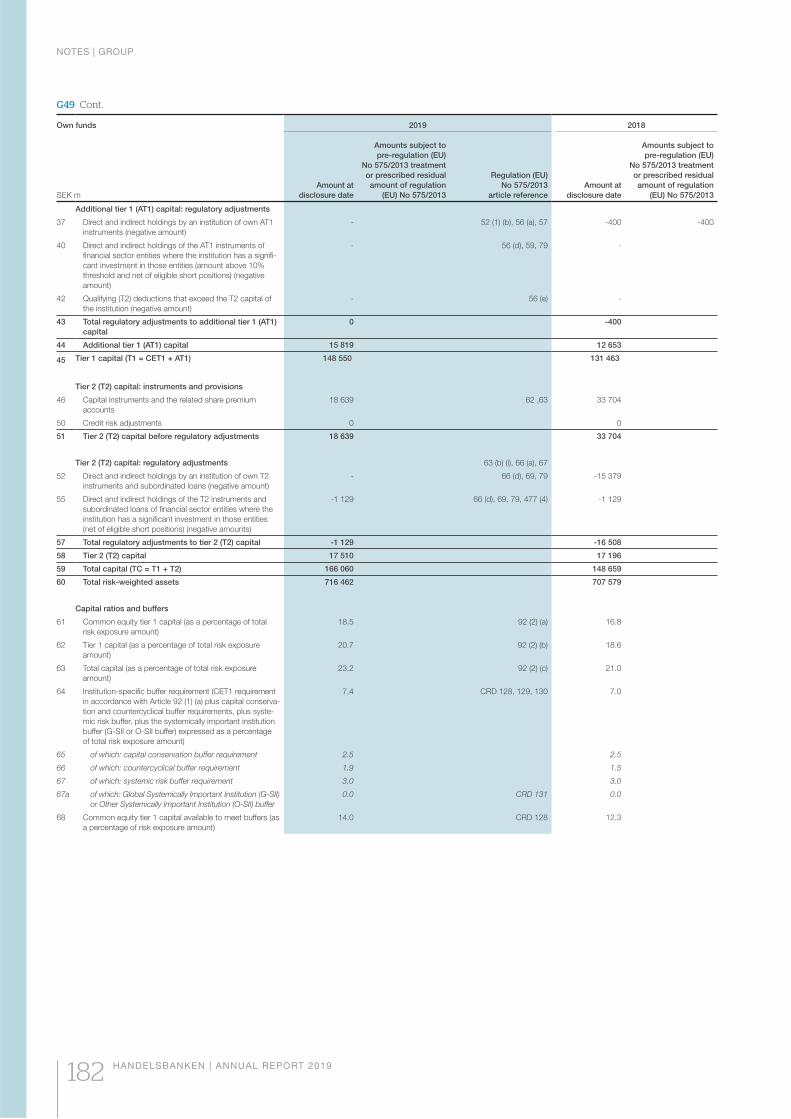
G49 Cont.
Own funds
SEK m
2019 2018
Amount at
disclosure date
Amounts subject to
pre-regulation (EU)
No 575/2013 treatment
or prescribed residual
amount of regulation
(EU) No 575/2013
Regulation (EU)
No 575/2013
article reference
Amount at
disclosure date
Amounts subject to
pre-regulation (EU)
No 575/2013 treatment
or prescribed residual
amount of regulation
(EU) No 575/2013
Additional tier 1 (AT1) capital: regulatory adjustments
37 Direct and indirect holdings by an institution of own AT1
instruments (negative amount)
- 52 (1) (b), 56 (a), 57 -400 -400
40 Direct and indirect holdings of the AT1 instruments of
financial sector entities where the institution has a signifi-
cant investment in those entities (amount above 10%
threshold and net of eligible short positions) (negative
amount)
- 56 (d), 59, 79 -
42 Qualifying (T2) deductions that exceed the T2 capital of
the institution (negative amount)
- 56 (e) -
43 Total regulatory adjustments to additional tier 1 (AT1)
capital
0 -400
44 Additional tier 1 (AT1) capital 15 819 12 653
45 Tier 1 capital (T1 = CET1 + AT1) 148 550 131 463
Tier 2 (T2) capital: instruments and provisions
46 Capital instruments and the related share premium
accounts
18 639 62 ,63 33 704
50 Credit risk adjustments 0 0
51 Tier 2 (T2) capital before regulatory adjustments 18 639 33 704
Tier 2 (T2) capital: regulatory adjustments 63 (b) (i), 66 (a), 67
52 Direct and indirect holdings by an institution of own T2
instruments and subordinated loans (negative amount)
- 66 (d), 69, 79 -15 379
55 Direct and indirect holdings of the T2 instruments and
subordinated loans of financial sector entities where the
institution has a significant investment in those entities
(net of eligible short positions) (negative amounts)
-1 129 66 (d), 69, 79, 477 (4) -1 129
57 Total regulatory adjustments to tier 2 (T2) capital -1 129 -16 508
58 Tier 2 (T2) capital 17 510 17 196
59 Total capital (TC = T1 + T2) 166 060 148 659
60 Total risk-weighted assets 716 462 707 579
Capital ratios and buffers
61 Common equity tier 1 capital (as a percentage of total
risk exposure amount)
18.5 92 (2) (a) 16.8
62 Tier 1 capital (as a percentage of total risk exposure
amount)
20.7 92 (2) (b) 18.6
63 Total capital (as a percentage of total risk exposure
amount)
23.2 92 (2) (c) 21.0
64 Institution-specific buffer requirement (CET1 requirement
in accordance with Article 92 (1) (a) plus capital conserva-
tion and countercyclical buffer requirements, plus syste-
mic risk buffer, plus the systemically important institution
buffer (G-SII or O-SII buffer) expressed as a percentage
of total risk exposure amount)
7.4 CRD 128, 129, 130 7.0
65 of which: capital conservation buffer requirement 2.5 2.5
66 of which: countercyclical buffer requirement 1.9 1.5
67 of which: systemic risk buffer requirement 3.0 3.0
67a of which: Global Systemically Important Institution (G-SII)
or Other Systemically Important Institution (O-SII) buffer
0.0 CRD 131 0.0
68 Common equity tier 1 capital available to meet buffers (as
a percentage of risk exposure amount)
14.0 CRD 128 12.3
NOTES | GROUP
182 HANDELSBANKEN | ANNUAL REPORT 2019
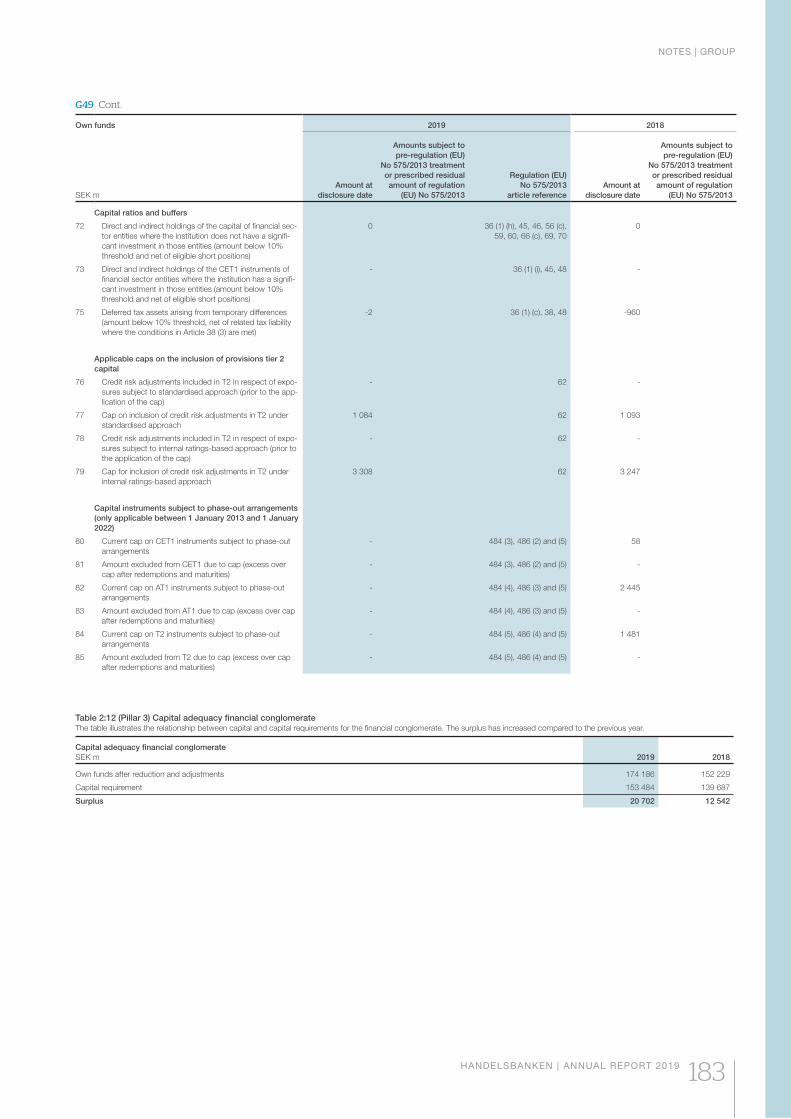
Own funds
SEK m
2019 2018
Amount at
disclosure date
Amounts subject to
pre-regulation (EU)
No 575/2013 treatment
or prescribed residual
amount of regulation
(EU) No 575/2013
Regulation (EU)
No 575/2013
article reference
Amount at
disclosure date
Amounts subject to
pre-regulation (EU)
No 575/2013 treatment
or prescribed residual
amount of regulation
(EU) No 575/2013
Capital ratios and buffers
72 Direct and indirect holdings of the capital of financial sec-
tor entities where the institution does not have a signifi-
cant investment in those entities (amount below 10%
threshold and net of eligible short positions)
0 36 (1) (h), 45, 46, 56 (c),
59, 60, 66 (c), 69, 70
0
73 Direct and indirect holdings of the CET1 instruments of
financial sector entities where the institution has a signifi-
cant investment in those entities (amount below 10%
threshold and net of eligible short positions)
- 36 (1) (i), 45, 48 -
75 Deferred tax assets arising from temporary differences
(amount below 10% threshold, net of related tax liability
where the conditions in Article 38 (3) are met)
-2 36 (1) (c), 38, 48 -960
Applicable caps on the inclusion of provisions tier 2
capital
76 Credit risk adjustments included in T2 in respect of expo-
sures subject to standardised approach (prior to the app-
lication of the cap)
- 62 -
77 Cap on inclusion of credit risk adjustments in T2 under
standardised approach
1 084 62 1 093
78 Credit risk adjustments included in T2 in respect of expo-
sures subject to internal ratings-based approach (prior to
the application of the cap)
- 62 -
79 Cap for inclusion of credit risk adjustments in T2 under
internal ratings-based approach
3 308 62 3 247
Capital instruments subject to phase-out arrangements
(only applicable between 1 January 2013 and 1 January
2022)
80 Current cap on CET1 instruments subject to phase-out
arrangements
- 484 (3), 486 (2) and (5) 58
81 Amount excluded from CET1 due to cap (excess over
cap after redemptions and maturities)
- 484 (3), 486 (2) and (5) -
82 Current cap on AT1 instruments subject to phase-out
arrangements
- 484 (4), 486 (3) and (5) 2 445
83 Amount excluded from AT1 due to cap (excess over cap
after redemptions and maturities)
- 484 (4), 486 (3) and (5) -
84 Current cap on T2 instruments subject to phase-out
arrangements
- 484 (5), 486 (4) and (5) 1 481
85 Amount excluded from T2 due to cap (excess over cap
after redemptions and maturities)
- 484 (5), 486 (4) and (5) -
Table 2:12 (Pillar 3) Capital adequacy financial conglomerateThe table illustrates the relationship between capital and capital requirements for the financial conglomerate. The surplus has increased compared to the previous year.
Capital adequacy financial conglomerate
SEK m 2019 2018
Own funds after reduction and adjustments 174 186 152 229
Capital requirement 153 484 139 687
Surplus 20 702 12 542
G49 Cont.
NOTES | GROUP
HANDELSBANKEN | ANNUAL REPORT 2019 183
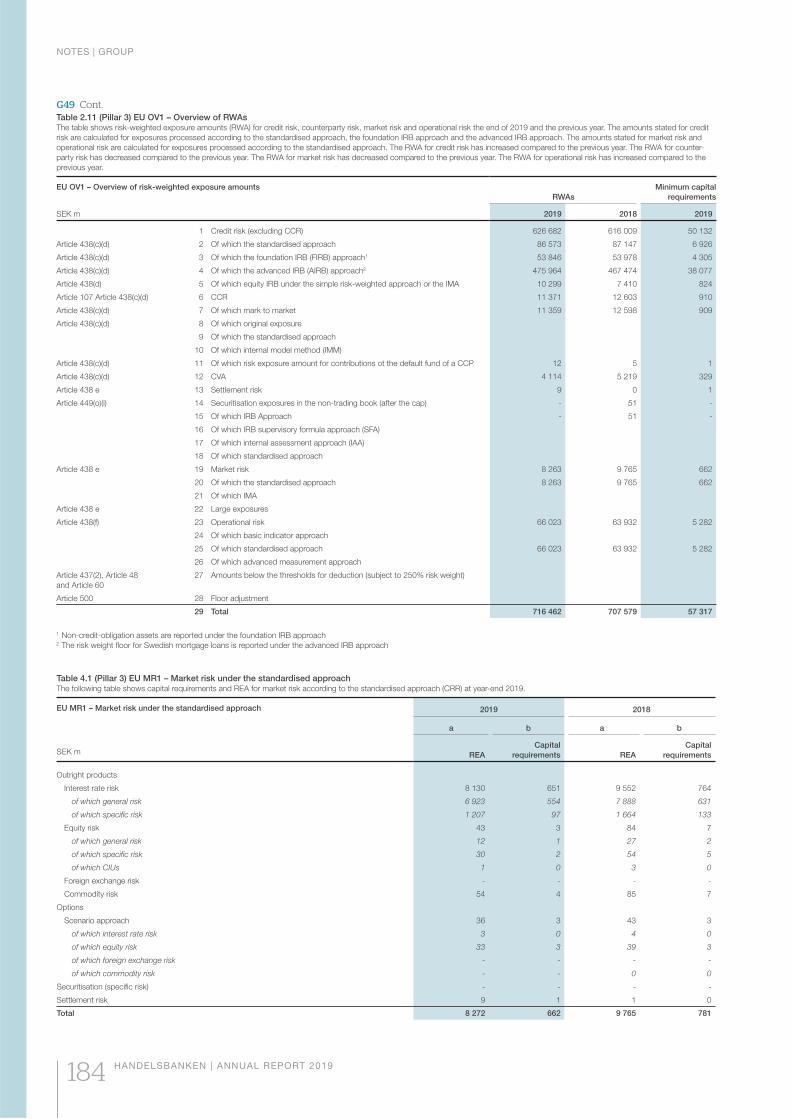
G49 Cont.
Table 4.1 (Pillar 3) EU MR1 – Market risk under the standardised approachThe following table shows capital requirements and REA for market risk according to the standardised approach (CRR) at year-end 2019.
EU MR1 – Market risk under the standardised approach
SEK m
2019 2018
a b a b
REA
Capital
requirements REA
Capital
requirements
Outright products
Interest rate risk 8 130 651 9 552 764
of which general risk 6 923 554 7 888 631
of which specific risk 1 207 97 1 664 133
Equity risk 43 3 84 7
of which general risk 12 1 27 2
of which specific risk 30 2 54 5
of which CIUs 1 0 3 0
Foreign exchange risk - - - -
Commodity risk 54 4 85 7
Options
Scenario approach 36 3 43 3
of which interest rate risk 3 0 4 0
of which equity risk 33 3 39 3
of which foreign exchange risk - - - -
of which commodity risk - - 0 0
Securitisation (specific risk) - - - -
Settlement risk 9 1 1 0
Total 8 272 662 9 765 781
Table 2.11 (Pillar 3) EU OV1 – Overview of RWAsThe table shows risk-weighted exposure amounts (RWA) for credit risk, counterparty risk, market risk and operational risk the end of 2019 and the previous year. The amounts stated for credit
risk are calculated for exposures processed according to the standardised approach, the foundation IRB approach and the advanced IRB approach. The amounts stated for market risk and
operational risk are calculated for exposures processed according to the standardised approach. The RWA for credit risk has increased compared to the previous year. The RWA for counter-
party risk has decreased compared to the previous year. The RWA for market risk has decreased compared to the previous year. The RWA for operational risk has increased compared to the
previous year.
EU OV1 – Overview of risk-weighted exposure amounts
RWAs
Minimum capital
requirements
SEK m 2019 2018 2019
1 Credit risk (excluding CCR) 626 682 616 009 50 132
Article 438(c)(d) 2 Of which the standardised approach 86 573 87 147 6 926
Article 438(c)(d) 3 Of which the foundation IRB (FIRB) approach1 53 846 53 978 4 305
Article 438(c)(d) 4 Of which the advanced IRB (AIRB) approach2 475 964 467 474 38 077
Article 438(d) 5 Of which equity IRB under the simple risk-weighted approach or the IMA 10 299 7 410 824
Article 107 Article 438(c)(d) 6 CCR 11 371 12 603 910
Article 438(c)(d) 7 Of which mark to market 11 359 12 598 909
Article 438(c)(d) 8 Of which original exposure
9 Of which the standardised approach
10 Of which internal model method (IMM)
Article 438(c)(d) 11 Of which risk exposure amount for contributions ot the default fund of a CCP 12 5 1
Article 438(c)(d) 12 CVA 4 114 5 219 329
Article 438 e 13 Settlement risk 9 0 1
Article 449(o)(i) 14 Securitisation exposures in the non-trading book (after the cap) - 51 -
15 Of which IRB Approach - 51 -
16 Of which IRB supervisory formula approach (SFA)
17 Of which internal assessment approach (IAA)
18 Of which standardised approach
Article 438 e 19 Market risk 8 263 9 765 662
20 Of which the standardised approach 8 263 9 765 662
21 Of which IMA
Article 438 e 22 Large exposures
Article 438(f) 23 Operational risk 66 023 63 932 5 282
24 Of which basic indicator approach
25 Of which standardised approach 66 023 63 932 5 282
26 Of which advanced measurement approach
Article 437(2), Article 48
and Article 60
27 Amounts below the thresholds for deduction (subject to 250% risk weight)
Article 500 28 Floor adjustment
29 Total 716 462 707 579 57 317
1 Non-credit-obligation assets are reported under the foundation IRB approach 2 The risk weight floor for Swedish mortgage loans is reported under the advanced IRB approach
NOTES | GROUP
184 HANDELSBANKEN | ANNUAL REPORT 2019
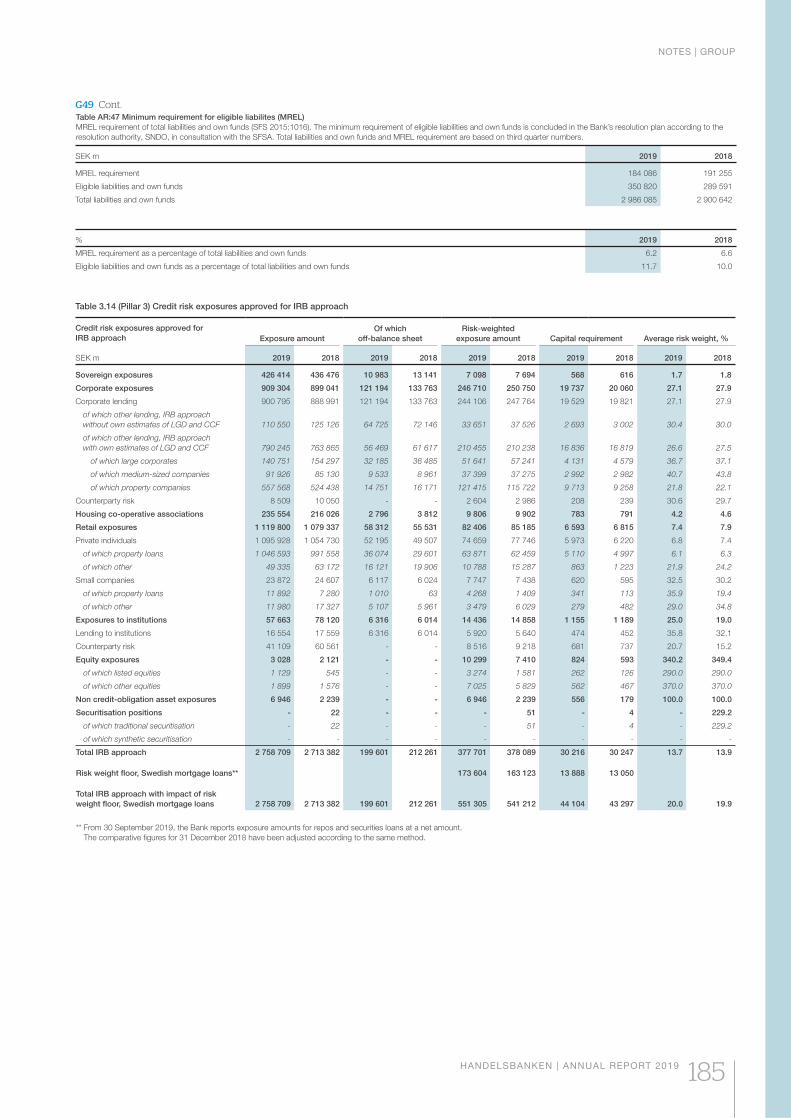
G49 Cont.
Table 3.14 (Pillar 3) Credit risk exposures approved for IRB approach
Credit risk exposures approved for
IRB approach
SEK m
Exposure amount
Of which
off-balance sheet
Risk-weighted
exposure amount Capital requirement Average risk weight, %
2019 2018 2019 2018 2019 2018 2019 2018 2019 2018
Sovereign exposures 426 414 436 476 10 983 13 141 7 098 7 694 568 616 1.7 1.8
Corporate exposures 909 304 899 041 121 194 133 763 246 710 250 750 19 737 20 060 27.1 27.9
Corporate lending 900 795 888 991 121 194 133 763 244 106 247 764 19 529 19 821 27.1 27.9
of which other lending, IRB approach
without own estimates of LGD and CCF 110 550 125 126 64 725 72 146 33 651 37 526 2 693 3 002 30.4 30.0
of which other lending, IRB approach
with own estimates of LGD and CCF 790 245 763 865 56 469 61 617 210 455 210 238 16 836 16 819 26.6 27.5
of which large corporates 140 751 154 297 32 185 36 485 51 641 57 241 4 131 4 579 36.7 37.1
of which medium-sized companies 91 926 85 130 9 533 8 961 37 399 37 275 2 992 2 982 40.7 43.8
of which property companies 557 568 524 438 14 751 16 171 121 415 115 722 9 713 9 258 21.8 22.1
Counterparty risk 8 509 10 050 - - 2 604 2 986 208 239 30.6 29.7
Housing co-operative associations 235 554 216 026 2 796 3 812 9 806 9 902 783 791 4.2 4.6
Retail exposures 1 119 800 1 079 337 58 312 55 531 82 406 85 185 6 593 6 815 7.4 7.9
Private individuals 1 095 928 1 054 730 52 195 49 507 74 659 77 746 5 973 6 220 6.8 7.4
of which property loans 1 046 593 991 558 36 074 29 601 63 871 62 459 5 110 4 997 6.1 6.3
of which other 49 335 63 172 16 121 19 906 10 788 15 287 863 1 223 21.9 24.2
Small companies 23 872 24 607 6 117 6 024 7 747 7 438 620 595 32.5 30.2
of which property loans 11 892 7 280 1 010 63 4 268 1 409 341 113 35.9 19.4
of which other 11 980 17 327 5 107 5 961 3 479 6 029 279 482 29.0 34.8
Exposures to institutions 57 663 78 120 6 316 6 014 14 436 14 858 1 155 1 189 25.0 19.0
Lending to institutions 16 554 17 559 6 316 6 014 5 920 5 640 474 452 35.8 32.1
Counterparty risk 41 109 60 561 - - 8 516 9 218 681 737 20.7 15.2
Equity exposures 3 028 2 121 - - 10 299 7 410 824 593 340.2 349.4
of which listed equities 1 129 545 - - 3 274 1 581 262 126 290.0 290.0
of which other equities 1 899 1 576 - - 7 025 5 829 562 467 370.0 370.0
Non credit-obligation asset exposures 6 946 2 239 - - 6 946 2 239 556 179 100.0 100.0
Securitisation positions - 22 - - - 51 - 4 - 229.2
of which traditional securitisation - 22 - - - 51 - 4 - 229.2
of which synthetic securitisation - - - - - - - - - -
Total IRB approach 2 758 709 2 713 382 199 601 212 261 377 701 378 089 30 216 30 247 13.7 13.9
Risk weight floor, Swedish mortgage loans** 173 604 163 123 13 888 13 050
Total IRB approach with impact of risk
weight floor, Swedish mortgage loans 2 758 709 2 713 382 199 601 212 261 551 305 541 212 44 104 43 297 20.0 19.9
** From 30 September 2019, the Bank reports exposure amounts for repos and securities loans at a net amount.
The comparative figures for 31 December 2018 have been adjusted according to the same method.
Table AR:47 Minimum requirement for eligible liabilites (MREL)
MREL requirement of total liabilities and own funds (SFS 2015:1016). The minimum requirement of eligible liabilities and own funds is concluded in the Bank’s resolution plan according to the
resolution authority, SNDO, in consultation with the SFSA. Total liabilities and own funds and MREL requirement are based on third quarter numbers.
SEK m 2019 2018
MREL requirement 184 086 191 255
Eligible liabilities and own funds 350 820 289 591
Total liabilities and own funds 2 986 085 2 900 642
% 2019 2018
MREL requirement as a percentage of total liabilities and own funds 6.2 6.6
Eligible liabilities and own funds as a percentage of total liabilities and own funds 11.7 10.0
NOTES | GROUP
HANDELSBANKEN | ANNUAL REPORT 2019 185
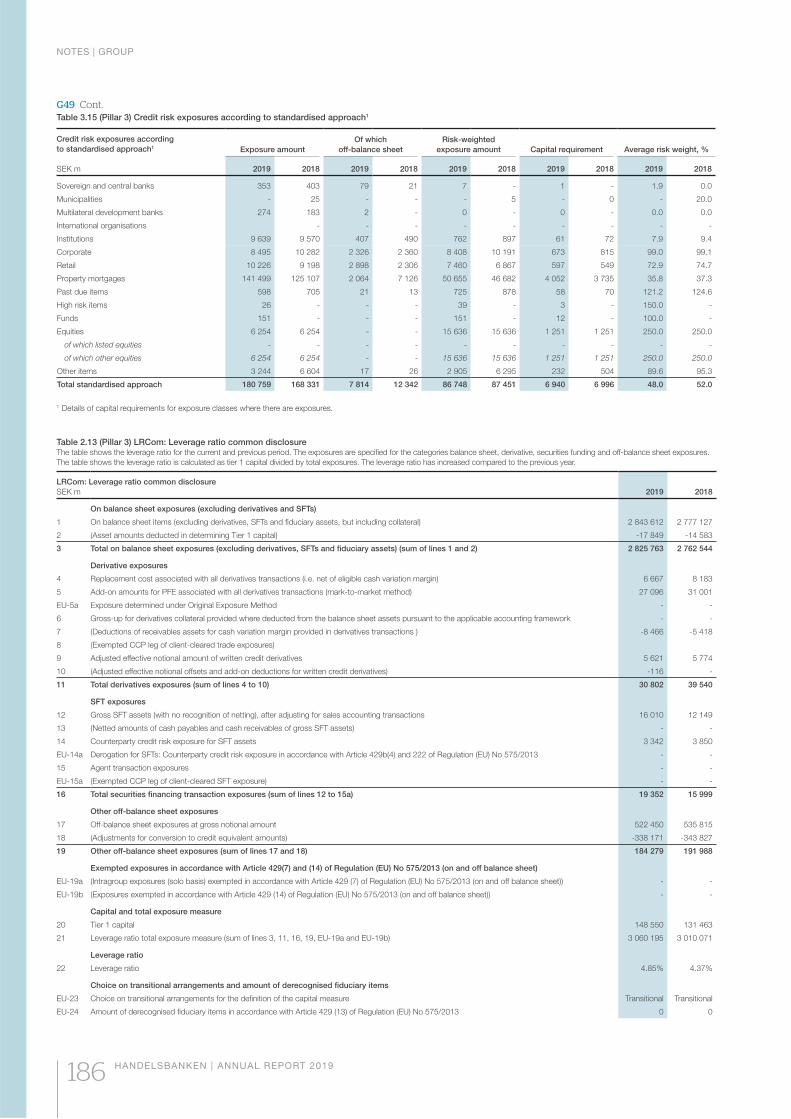
G49 Cont.Table 3.15 (Pillar 3) Credit risk exposures according to standardised approach1
Credit risk exposures according
to standardised approach1
SEK m
Exposure amount
Of which
off-balance sheet
Risk-weighted
exposure amount Capital requirement Average risk weight, %
2019 2018 2019 2018 2019 2018 2019 2018 2019 2018
Sovereign and central banks 353 403 79 21 7 - 1 - 1.9 0.0
Municipalities - 25 - - - 5 - 0 - 20.0
Multilateral development banks 274 183 2 - 0 - 0 - 0.0 0.0
International organisations - - - - - - - - -
Institutions 9 639 9 570 407 490 762 897 61 72 7.9 9.4
Corporate 8 495 10 282 2 326 2 360 8 408 10 191 673 815 99.0 99.1
Retail 10 226 9 198 2 898 2 306 7 460 6 867 597 549 72.9 74.7
Property mortgages 141 499 125 107 2 064 7 126 50 655 46 682 4 052 3 735 35.8 37.3
Past due items 598 705 21 13 725 878 58 70 121.2 124.6
High risk items 26 - - - 39 - 3 - 150.0 -
Funds 151 - - - 151 - 12 - 100.0 -
Equities 6 254 6 254 - - 15 636 15 636 1 251 1 251 250.0 250.0
of which listed equities - - - - - - - - - -
of which other equities 6 254 6 254 - - 15 636 15 636 1 251 1 251 250.0 250.0
Other items 3 244 6 604 17 26 2 905 6 295 232 504 89.6 95.3
Total standardised approach 180 759 168 331 7 814 12 342 86 748 87 451 6 940 6 996 48.0 52.0
1 Details of capital requirements for exposure classes where there are exposures.
Table 2.13 (Pillar 3) LRCom: Leverage ratio common disclosureThe table shows the leverage ratio for the current and previous period. The exposures are specified for the categories balance sheet, derivative, securities funding and off-balance sheet exposures.
The table shows the leverage ratio is calculated as tier 1 capital divided by total exposures. The leverage ratio has increased compared to the previous year.
LRCom: Leverage ratio common disclosure
SEK m 2019 2018
On balance sheet exposures (excluding derivatives and SFTs)
1 On balance sheet items (excluding derivatives, SFTs and fiduciary assets, but including collateral) 2 843 612 2 777 127
2 (Asset amounts deducted in determining Tier 1 capital) -17 849 -14 583
3 Total on balance sheet exposures (excluding derivatives, SFTs and fiduciary assets) (sum of lines 1 and 2) 2 825 763 2 762 544
Derivative exposures
4 Replacement cost associated with all derivatives transactions (i.e. net of eligible cash variation margin) 6 667 8 183
5 Add-on amounts for PFE associated with all derivatives transactions (mark-to-market method) 27 096 31 001
EU-5a Exposure determined under Original Exposure Method - -
6 Gross-up for derivatives collateral provided where deducted from the balance sheet assets pursuant to the applicable accounting framework - -
7 (Deductions of receivables assets for cash variation margin provided in derivatives transactions ) -8 466 -5 418
8 (Exempted CCP leg of client-cleared trade exposures)
9 Adjusted effective notional amount of written credit derivatives 5 621 5 774
10 (Adjusted effective notional offsets and add-on deductions for written credit derivatives) -116 -
11 Total derivatives exposures (sum of lines 4 to 10) 30 802 39 540
SFT exposures
12 Gross SFT assets (with no recognition of netting), after adjusting for sales accounting transactions 16 010 12 149
13 (Netted amounts of cash payables and cash receivables of gross SFT assets) - -
14 Counterparty credit risk exposure for SFT assets 3 342 3 850
EU-14a Derogation for SFTs: Counterparty credit risk exposure in accordance with Article 429b(4) and 222 of Regulation (EU) No 575/2013 - -
15 Agent transaction exposures - -
EU-15a (Exempted CCP leg of client-cleared SFT exposure) - -
16 Total securities financing transaction exposures (sum of lines 12 to 15a) 19 352 15 999
Other off-balance sheet exposures
17 Off-balance sheet exposures at gross notional amount 522 450 535 815
18 (Adjustments for conversion to credit equivalent amounts) -338 171 -343 827
19 Other off-balance sheet exposures (sum of lines 17 and 18) 184 279 191 988
Exempted exposures in accordance with Article 429(7) and (14) of Regulation (EU) No 575/2013 (on and off balance sheet)
EU-19a (Intragroup exposures (solo basis) exempted in accordance with Article 429 (7) of Regulation (EU) No 575/2013 (on and off balance sheet)) - -
EU-19b (Exposures exempted in accordance with Article 429 (14) of Regulation (EU) No 575/2013 (on and off balance sheet)) - -
Capital and total exposure measure
20 Tier 1 capital 148 550 131 463
21 Leverage ratio total exposure measure (sum of lines 3, 11, 16, 19, EU-19a and EU-19b) 3 060 195 3 010 071
Leverage ratio
22 Leverage ratio 4.85% 4.37%
Choice on transitional arrangements and amount of derecognised fiduciary items
EU-23 Choice on transitional arrangements for the definition of the capital measure Transitional Transitional
EU-24 Amount of derecognised fiduciary items in accordance with Article 429 (13) of Regulation (EU) No 575/2013 0 0
NOTES | GROUP
186 HANDELSBANKEN | ANNUAL REPORT 2019
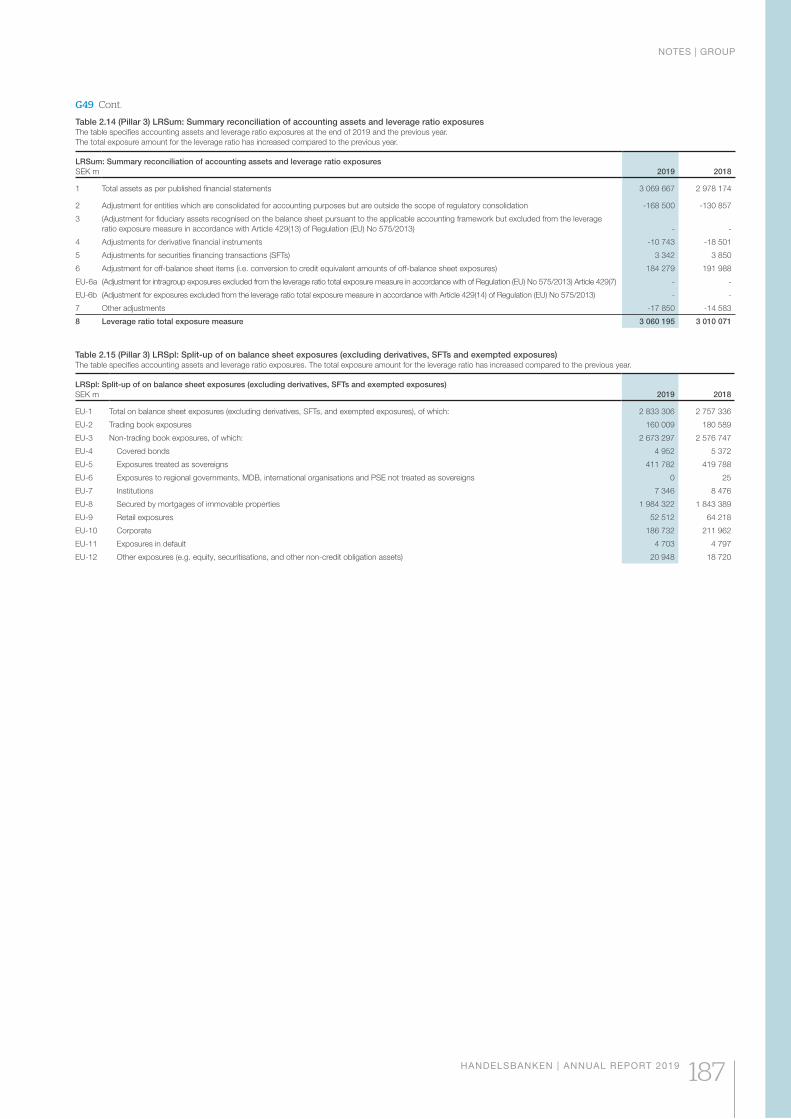
Table 2.15 (Pillar 3) LRSpl: Split-up of on balance sheet exposures (excluding derivatives, SFTs and exempted exposures)The table specifies accounting assets and leverage ratio exposures. The total exposure amount for the leverage ratio has increased compared to the previous year.
LRSpl: Split-up of on balance sheet exposures (excluding derivatives, SFTs and exempted exposures)
SEK m 2019 2018
EU-1 Total on balance sheet exposures (excluding derivatives, SFTs, and exempted exposures), of which: 2 833 306 2 757 336
EU-2 Trading book exposures 160 009 180 589
EU-3 Non-trading book exposures, of which: 2 673 297 2 576 747
EU-4 Covered bonds 4 952 5 372
EU-5 Exposures treated as sovereigns 411 782 419 788
EU-6 Exposures to regional governments, MDB, international organisations and PSE not treated as sovereigns 0 25
EU-7 Institutions 7 346 8 476
EU-8 Secured by mortgages of immovable properties 1 984 322 1 843 389
EU-9 Retail exposures 52 512 64 218
EU-10 Corporate 186 732 211 962
EU-11 Exposures in default 4 703 4 797
EU-12 Other exposures (e.g. equity, securitisations, and other non-credit obligation assets) 20 948 18 720
Table 2.14 (Pillar 3) LRSum: Summary reconciliation of accounting assets and leverage ratio exposuresThe table specifies accounting assets and leverage ratio exposures at the end of 2019 and the previous year.
The total exposure amount for the leverage ratio has increased compared to the previous year.
LRSum: Summary reconciliation of accounting assets and leverage ratio exposures
SEK m 2019 2018
1 Total assets as per published financial statements 3 069 667 2 978 174
2 Adjustment for entities which are consolidated for accounting purposes but are outside the scope of regulatory consolidation -168 500 -130 857
3 (Adjustment for fiduciary assets recognised on the balance sheet pursuant to the applicable accounting framework but excluded from the leverage
ratio exposure measure in accordance with Article 429(13) of Regulation (EU) No 575/2013) - -
4 Adjustments for derivative financial instruments -10 743 -18 501
5 Adjustments for securities financing transactions (SFTs) 3 342 3 850
6 Adjustment for off-balance sheet items (i.e. conversion to credit equivalent amounts of off-balance sheet exposures) 184 279 191 988
EU-6a (Adjustment for intragroup exposures excluded from the leverage ratio total exposure measure in accordance with of Regulation (EU) No 575/2013) Article 429(7) - -
EU-6b (Adjustment for exposures excluded from the leverage ratio total exposure measure in accordance with Article 429(14) of Regulation (EU) No 575/2013) - -
7 Other adjustments -17 850 -14 583
8 Leverage ratio total exposure measure 3 060 195 3 010 071
G49 Cont.
NOTES | GROUP
HANDELSBANKEN | ANNUAL REPORT 2019 187

Parent company
Administration report for the Parent company
Performance in the parent company
The parent company’s accounts cover parts of
the operations that, in organisational terms, are
included in branch operations within and out-
side Sweden, Capital Markets, and central
departments and staff functions. Although most
of Handelsbanken’s business comes from the
local branches and is co-ordinated by them, in
legal terms a sizeable part of business volumes
are outside the parent company in wholly owned
subsidiaries – particularly in the Stadshypotek
AB mortgage institution and, since 1 December
2018, in the UK, where the operations are con-
ducted in Handelsbanken plc. Thus, the perfor-
mance of the parent company is not equivalent
to the performance of business operations in
the Group as a whole.
The parent company’s operating profit
increased by 16 per cent to SEK 20,325 million
(17,528), chiefly owing to increased dividends.
Profit for the year increased by 13 per cent to
SEK 15,648 million (13,855). Dividends have
been received amounting to SEK 17,338 million
(11,023). Net interest income decreased by
24 per cent to SEK 13,039 million (17,234) and
net fee and commission income decreased by
3 per cent to SEK 6,011 million (6,218). The
main reason for the decrease in net interest
income is that the UK operations are no longer
included in the parent company’s accounts.
Since the start of the year, the parent company’s
equity has increased to SEK 130,935 million
(121,062). For the parent company’s five-year
overview, see pages 197–198.
Risk management
Handelsbanken has a low risk tolerance that is
maintained through a strong risk culture which
is sustainable in the long term and applies to all
areas of the Group. For a detailed description of
the Bank’s exposure to risks, and the manage-
ment of these, see note G2.
Principles for remuneration
to executive officers
Handelsbanken’s principles for remuneration to
executive officers are set out in note G8 and in
the Principles for remuneration to executive
officers section of the Corporate Governance
Report (see page 72).
Recommended appropriation of profits
In accordance with the balance sheet for
Handelsbanken, profits totalling SEK 122,150
million are at the disposal of the annual general
meeting.
The Board recommends that the profit be appropriated
as follows:
Dividend per share paid to the shareholders
SEK 5.50 (SEK 5.50 for 2018) 10 890
Balance carried forward to the next year 111 260
Total allocated 122 150
The Board’s assessment is that the amount of
the proposed dividend, totalling SEK 10,890
million, is justifiable in view of the nature of oper-
ations, their scope, consolidation requirement,
risk- taking, liquidity, and the general situation in
both the Bank and the rest of the Group.
Unrealised changes in assets and liabilities
at fair value have had a net impact on equity of
SEK 10,963 million.
The total capitalisation of the parent company
and the consolidated situation at year-end,
minus the proposed dividend based on com-
pleted conversions and other material changes
since the year-end, exceeded the statutory min-
imum requirement pursuant to EU Regulation
575/2013 and Directive 2013/36/EU and other
relevant requirements established for the Bank
by public authorities.
The Handelsbanken share
Shares divided into share classes
31 December 2019
Share class Number
% of
capital
% of
votes
Class A 1 944 777 165 98.22 99.82
Class B 35 251 329 1.78 0.18
Total 1 980 028 494 100.00 100.00
Two shareholders own more than 10 per cent of
the shares: AB Industrivärden and the Oktogonen
Foundation. Detailed information on the Bank’s
largest Swedish shareholders can be found on
page 41.
Handelsbanken’s Articles of Association state
that at the AGM, no shareholder is allowed to
exercise voting rights representing more than
10 per cent of the total number of votes in the
Bank. For more information regarding share-
holders’ rights, see page 66.
At the AGM in March 2019, the Board
received a mandate to repurchase a maximum
of 120 million shares during the period until the
AGM in March 2020. This mandate was not
used in 2019. More detailed information on this
can be found on pages 40-41.
Other
Handelsbanken works continually with
measures to minimise the Bank’s direct and
indirect impact on the environment. For more
information regarding the Bank’s environmental
activities, see page 43.
Handelsbanken strives for its decentralised
working method and belief in the individual to be
integral to its operations. For a more detailed
description of the Bank as an employer, please
refer to the information beginning on page 57.
ADMINISTRATION REPORT | PARENT COMPANY
HANDELSBANKEN | ANNUAL REPORT 2019 189
Financial reports Parent company
CONTENTS
Income statement 191
Statement of comprehensive income 192
Balance sheet 193
Statement of changes in equity 194
Cash flow statement 196
Five-year overview 197
Notes, Parent company 199
P1 Accounting policies 199
P2 Risk and capital management 200
P3 Net interest income 203
P4 Dividends received 203
P5 Net fee and commission income 203
P6 Net gains/losses on financial transactions 204
P7 Other operating income 204
P8 Staff costs 204
P9 Other administrative expenses 205
P10 Credit losses 205
P11 Appropriations 211
P12 Loans to credit institutions 211
P13 Loans to the public 211
P14 Interest-bearing securities 212
P15 Shares 212
P16 Shares in subsidiaries and investments in associates 213
P17 Derivative instruments 214
P18 Hedge accounting 215
P19 Offsetting of financial instruments 217
P20 Intangible assets 218
P21 Property, equipment and lease assets 218
P22 Other assets 219
P23 Prepaid expenses and accrued income 219
P24 Due to credit institutions 220
P25 Deposits and borrowing from the public 220
P26 Issued securities 221
P27 Short positions 221
P28 Taxes 222
P29 Provisions 222
P30 Other liabilities 223
P31 Accrued expenses and deferred income 223
P32 Subordinated liabilities 223
P33 Untaxed reserves 223
P34 Classification of financial assets and liabilities 224
P35 Fair value measurement of financial instruments 225
P36 Pledged assets, collateral received and transferred financial assets 227
P37 Contingent liabilities 227
P38 Pension obligations 228
P39 Assets and liabilities by currency 229
P40 Related-party disclosures 230
P41 Recommended appropriation of profits 230
P42 Share information 230
P43 Events after the balance sheet date 230
P44 Capital adequacy 231
190

Income statement, Parent companySEK m 2019 2018
Interest income Note P3 28 701 30 745
Lease income Note P3 1 488 724
Interest expenses Note P3 -17 150 -14 235
Dividends received Note P4 17 338 11 023
Fee and commission income Note P5 8 028 8 206
Fee and commission expenses Note P5 -2 017 -1 988
Net gains/losses on financial transactions Note P6 618 1 020
Other operating income Note P7 2 638 2 805
Total operating income 39 644 38 300
General administrative expenses
Staff costs Note P8 -10 148 -12 255
Other administrative expenses Note P9 -5 808 -6 332
Depreciation, amortisation and impairment of property, equipment, lease and intangible assets Note P20, P21 -2 156 -1 350
Total expenses before credit losses -18 112 -19 937
Profit before credit losses 21 532 18 363
Net credit losses Note P10 -1 059 -835
Impairment loss on financial fixed assets -148 -
Operating profit 20 325 17 528
Appropriations Note P11 -380 332
Profit before taxes 19 945 17 860
Taxes Note P28 -4 297 -4 005
Profit for the year 15 648 13 855
INCOME STATEMENT | PARENT COMPANY
HANDELSBANKEN | ANNUAL REPORT 2019 191
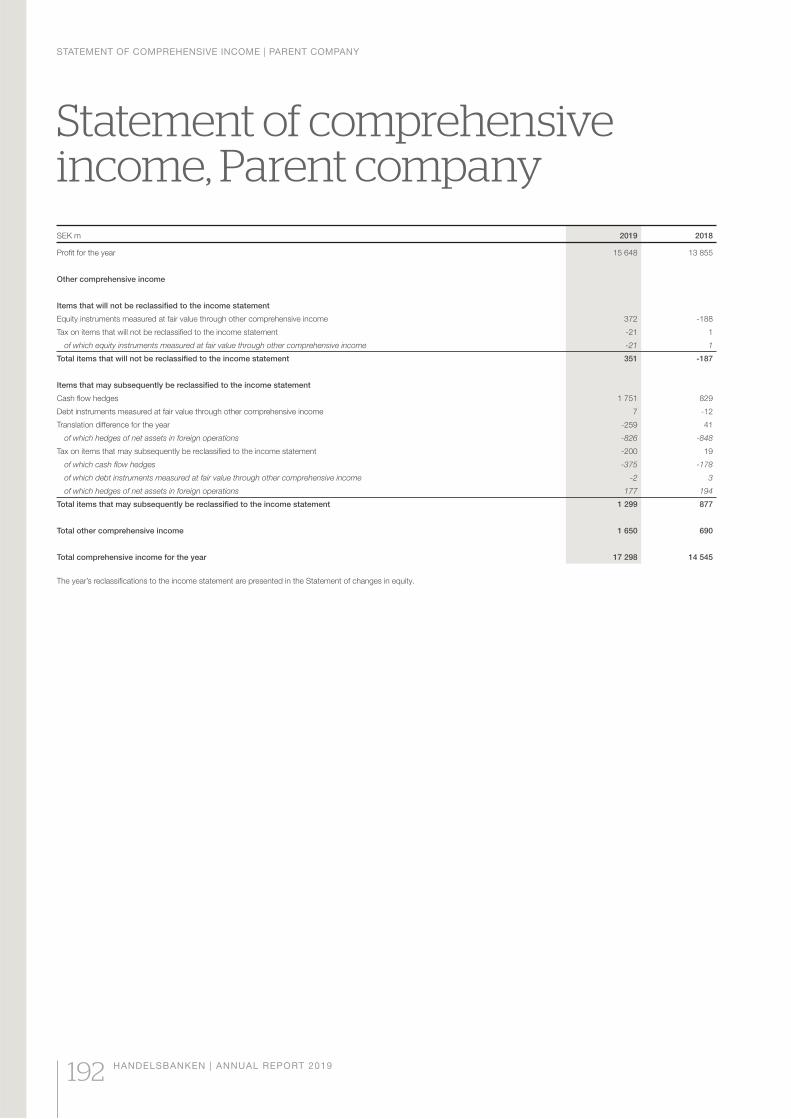
Statement of comprehensive income, Parent companySEK m 2019 2018
Profit for the year 15 648 13 855
Other comprehensive income
Items that will not be reclassified to the income statement
Equity instruments measured at fair value through other comprehensive income 372 -188
Tax on items that will not be reclassified to the income statement -21 1
of which equity instruments measured at fair value through other comprehensive income -21 1
Total items that will not be reclassified to the income statement 351 -187
Items that may subsequently be reclassified to the income statement
Cash flow hedges 1 751 829
Debt instruments measured at fair value through other comprehensive income 7 -12
Translation difference for the year -259 41
of which hedges of net assets in foreign operations -826 -848
Tax on items that may subsequently be reclassified to the income statement -200 19
of which cash flow hedges -375 -178
of which debt instruments measured at fair value through other comprehensive income -2 3
of which hedges of net assets in foreign operations 177 194
Total items that may subsequently be reclassified to the income statement 1 299 877
Total other comprehensive income 1 650 690
Total comprehensive income for the year 17 298 14 545
The year’s reclassifications to the income statement are presented in the Statement of changes in equity.
STATEMENT OF COMPREHENSIVE INCOME | PARENT COMPANY
192 HANDELSBANKEN | ANNUAL REPORT 2019
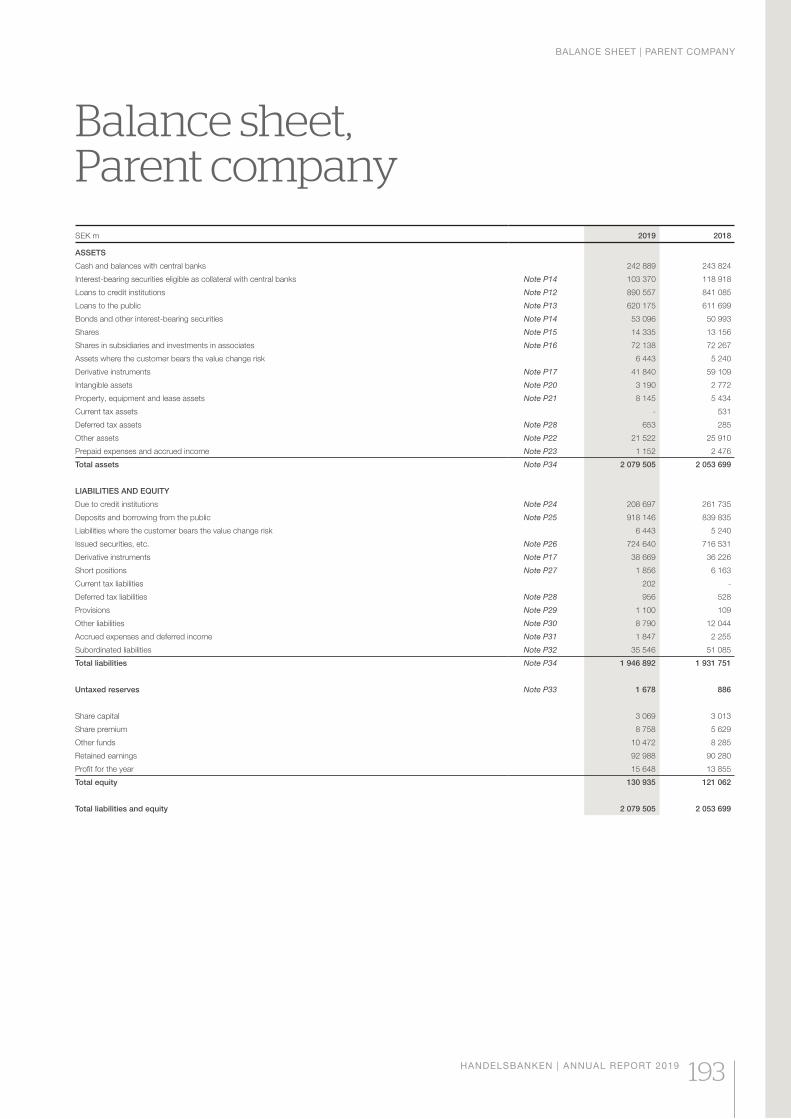
Balance sheet, Parent companySEK m 2019 2018
ASSETS
Cash and balances with central banks 242 889 243 824
Interest-bearing securities eligible as collateral with central banks Note P14 103 370 118 918
Loans to credit institutions Note P12 890 557 841 085
Loans to the public Note P13 620 175 611 699
Bonds and other interest-bearing securities Note P14 53 096 50 993
Shares Note P15 14 335 13 156
Shares in subsidiaries and investments in associates Note P16 72 138 72 267
Assets where the customer bears the value change risk 6 443 5 240
Derivative instruments Note P17 41 840 59 109
Intangible assets Note P20 3 190 2 772
Property, equipment and lease assets Note P21 8 145 5 434
Current tax assets - 531
Deferred tax assets Note P28 653 285
Other assets Note P22 21 522 25 910
Prepaid expenses and accrued income Note P23 1 152 2 476
Total assets Note P34 2 079 505 2 053 699
LIABILITIES AND EQUITY
Due to credit institutions Note P24 208 697 261 735
Deposits and borrowing from the public Note P25 918 146 839 835
Liabilities where the customer bears the value change risk 6 443 5 240
Issued securities, etc. Note P26 724 640 716 531
Derivative instruments Note P17 38 669 36 226
Short positions Note P27 1 856 6 163
Current tax liabilities 202 -
Deferred tax liabilities Note P28 956 528
Provisions Note P29 1 100 109
Other liabilities Note P30 8 790 12 044
Accrued expenses and deferred income Note P31 1 847 2 255
Subordinated liabilities Note P32 35 546 51 085
Total liabilities Note P34 1 946 892 1 931 751
Untaxed reserves Note P33 1 678 886
Share capital 3 069 3 013
Share premium 8 758 5 629
Other funds 10 472 8 285
Retained earnings 92 988 90 280
Profit for the year 15 648 13 855
Total equity 130 935 121 062
Total liabilities and equity 2 079 505 2 053 699
BALANCE SHEET | PARENT COMPANY
HANDELSBANKEN | ANNUAL REPORT 2019 193
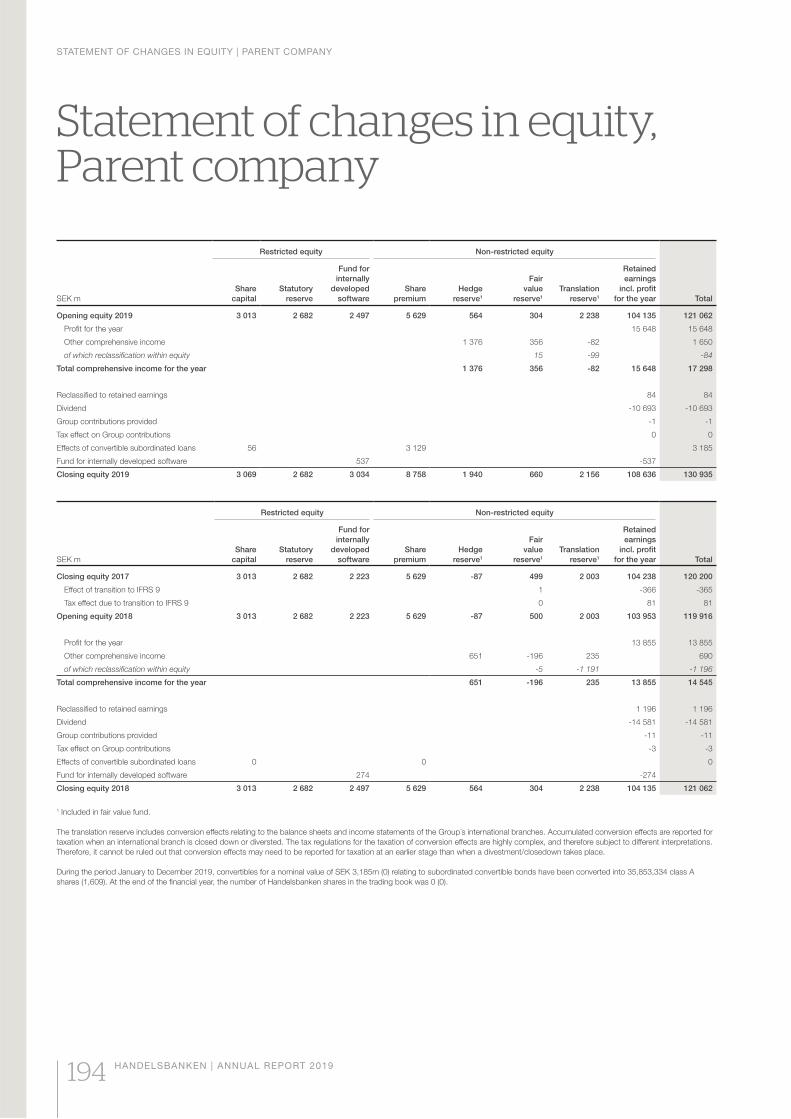
Statement of changes in equity, Parent company
Restricted equity Non-restricted equity
SEK m
Share
capital
Statutory
reserve
Fund for
internally
developed
software
Share
premium
Hedge
reserve1
Fair
value
reserve1
Translation
reserve1
Retained
earnings
incl. profit
for the year Total
Opening equity 2019 3 013 2 682 2 497 5 629 564 304 2 238 104 135 121 062
Profit for the year 15 648 15 648
Other comprehensive income 1 376 356 -82 1 650
of which reclassification within equity 15 -99 -84
Total comprehensive income for the year 1 376 356 -82 15 648 17 298
Reclassified to retained earnings 84 84
Dividend -10 693 -10 693
Group contributions provided -1 -1
Tax effect on Group contributions 0 0
Effects of convertible subordinated loans 56 3 129 3 185
Fund for internally developed software 537 -537
Closing equity 2019 3 069 2 682 3 034 8 758 1 940 660 2 156 108 636 130 935
Restricted equity Non-restricted equity
SEK m
Share
capital
Statutory
reserve
Fund for
internally
developed
software
Share
premium
Hedge
reserve1
Fair
value
reserve1
Translation
reserve1
Retained
earnings
incl. profit
for the year Total
Closing equity 2017 3 013 2 682 2 223 5 629 -87 499 2 003 104 238 120 200
Effect of transition to IFRS 9 1 -366 -365
Tax effect due to transition to IFRS 9 0 81 81
Opening equity 2018 3 013 2 682 2 223 5 629 -87 500 2 003 103 953 119 916
Profit for the year 13 855 13 855
Other comprehensive income 651 -196 235 690
of which reclassification within equity -5 -1 191 -1 196
Total comprehensive income for the year 651 -196 235 13 855 14 545
Reclassified to retained earnings 1 196 1 196
Dividend -14 581 -14 581
Group contributions provided -11 -11
Tax effect on Group contributions -3 -3
Effects of convertible subordinated loans 0 0 0
Fund for internally developed software 274 -274
Closing equity 2018 3 013 2 682 2 497 5 629 564 304 2 238 104 135 121 062
1 Included in fair value fund.
The translation reserve includes conversion effects relating to the balance sheets and income statements of the Group´s international branches. Accumulated conversion effects are reported for
taxation when an international branch is closed down or diversted. The tax regulations for the taxation of conversion effects are highly complex, and therefore subject to different interpretations.
Therefore, it cannot be ruled out that conversion effects may need to be reported for taxation at an earlier stage than when a divestment/closedown takes place.
During the period January to December 2019, convertibles for a nominal value of SEK 3,185m (0) relating to subordinated convertible bonds have been converted into 35,853,334 class A
shares (1,609). At the end of the financial year, the number of Handelsbanken shares in the trading book was 0 (0).
STATEMENT OF CHANGES IN EQUITY | PARENT COMPANY
194 HANDELSBANKEN | ANNUAL REPORT 2019
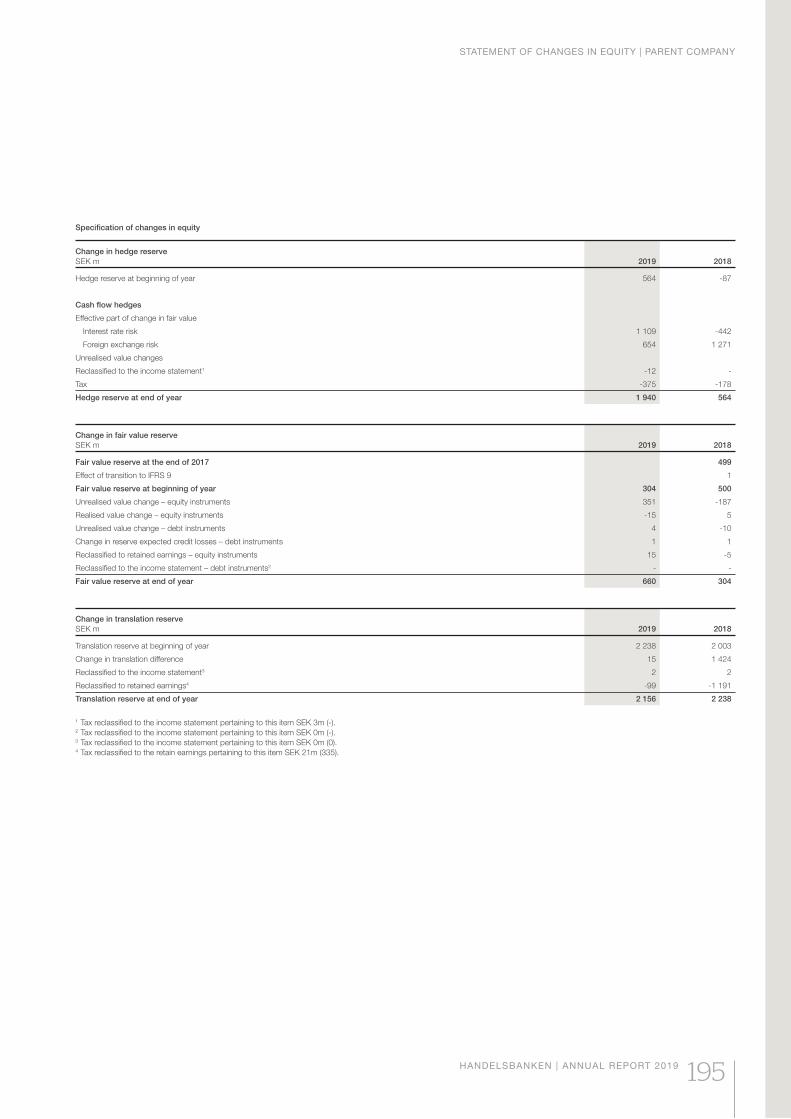
Specification of changes in equity
Change in hedge reserve
SEK m 2019 2018
Hedge reserve at beginning of year 564 -87
Cash flow hedges
Effective part of change in fair value
Interest rate risk 1 109 -442
Foreign exchange risk 654 1 271
Unrealised value changes
Reclassified to the income statement1 -12 -
Tax -375 -178
Hedge reserve at end of year 1 940 564
Change in fair value reserve
SEK m 2019 2018
Fair value reserve at the end of 2017 499
Effect of transition to IFRS 9 1
Fair value reserve at beginning of year 304 500
Unrealised value change – equity instruments 351 -187
Realised value change – equity instruments -15 5
Unrealised value change – debt instruments 4 -10
Change in reserve expected credit losses – debt instruments 1 1
Reclassified to retained earnings – equity instruments 15 -5
Reclassified to the income statement – debt instruments2 - -
Fair value reserve at end of year 660 304
Change in translation reserve
SEK m 2019 2018
Translation reserve at beginning of year 2 238 2 003
Change in translation difference 15 1 424
Reclassified to the income statement3 2 2
Reclassified to retained earnings4 -99 -1 191
Translation reserve at end of year 2 156 2 238
1 Tax reclassified to the income statement pertaining to this item SEK 3m (-).2 Tax reclassified to the income statement pertaining to this item SEK 0m (-).3 Tax reclassified to the income statement pertaining to this item SEK 0m (0).4 Tax reclassified to the retain earnings pertaining to this item SEK 21m (335).
STATEMENT OF CHANGES IN EQUITY | PARENT COMPANY
HANDELSBANKEN | ANNUAL REPORT 2019 195
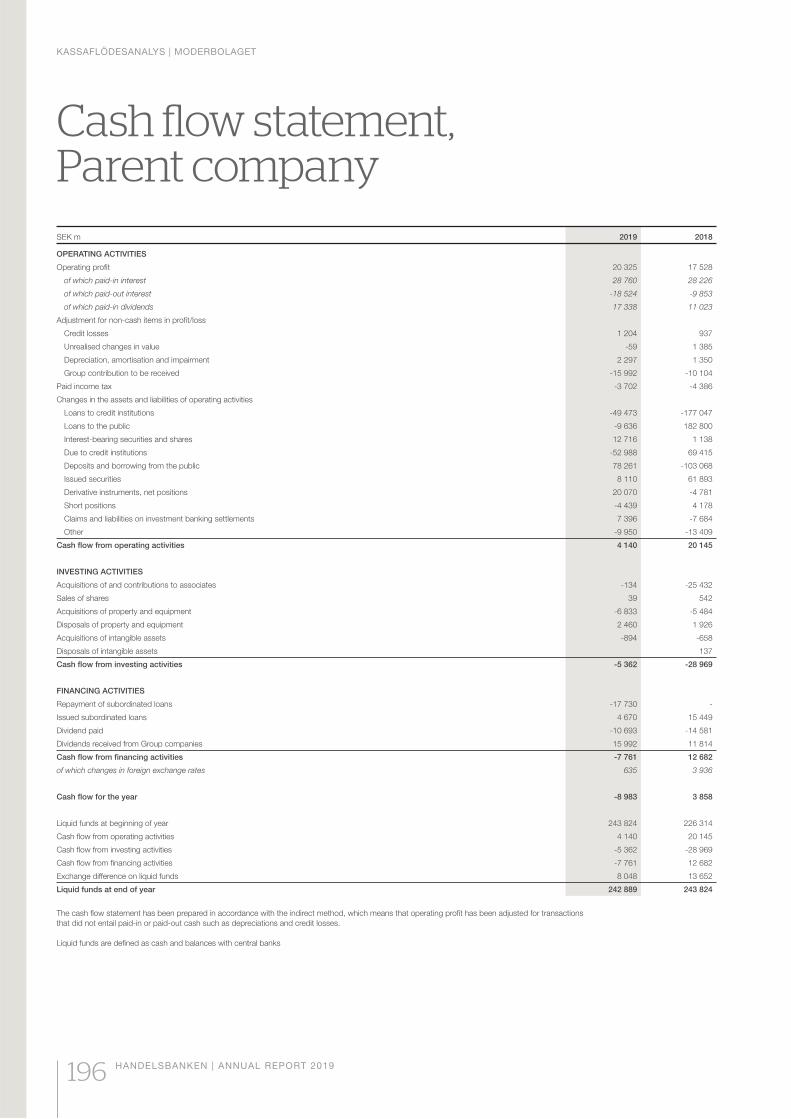
Cash flow statement, Parent companySEK m 2019 2018
OPERATING ACTIVITIES
Operating profit 20 325 17 528
of which paid-in interest 28 760 28 226
of which paid-out interest -18 524 -9 853
of which paid-in dividends 17 338 11 023
Adjustment for non-cash items in profit/loss
Credit losses 1 204 937
Unrealised changes in value -59 1 385
Depreciation, amortisation and impairment 2 297 1 350
Group contribution to be received -15 992 -10 104
Paid income tax -3 702 -4 386
Changes in the assets and liabilities of operating activities
Loans to credit institutions -49 473 -177 047
Loans to the public -9 636 182 800
Interest-bearing securities and shares 12 716 1 138
Due to credit institutions -52 988 69 415
Deposits and borrowing from the public 78 261 -103 068
Issued securities 8 110 61 893
Derivative instruments, net positions 20 070 -4 781
Short positions -4 439 4 178
Claims and liabilities on investment banking settlements 7 396 -7 684
Other -9 950 -13 409
Cash flow from operating activities 4 140 20 145
INVESTING ACTIVITIES
Acquisitions of and contributions to associates -134 -25 432
Sales of shares 39 542
Acquisitions of property and equipment -6 833 -5 484
Disposals of property and equipment 2 460 1 926
Acquisitions of intangible assets -894 -658
Disposals of intangible assets 137
Cash flow from investing activities -5 362 -28 969
FINANCING ACTIVITIES
Repayment of subordinated loans -17 730 -
Issued subordinated loans 4 670 15 449
Dividend paid -10 693 -14 581
Dividends received from Group companies 15 992 11 814
Cash flow from financing activities -7 761 12 682
of which changes in foreign exchange rates 635 3 936
Cash flow for the year -8 983 3 858
Liquid funds at beginning of year 243 824 226 314
Cash flow from operating activities 4 140 20 145
Cash flow from investing activities -5 362 -28 969
Cash flow from financing activities -7 761 12 682
Exchange difference on liquid funds 8 048 13 652
Liquid funds at end of year 242 889 243 824
The cash flow statement has been prepared in accordance with the indirect method, which means that operating profit has been adjusted for transactions
that did not entail paid-in or paid-out cash such as depreciations and credit losses.
Liquid funds are defined as cash and balances with central banks
KASSAFLÖDESANALYS | MODERBOLAGET
196 HANDELSBANKEN | ANNUAL REPORT 2019
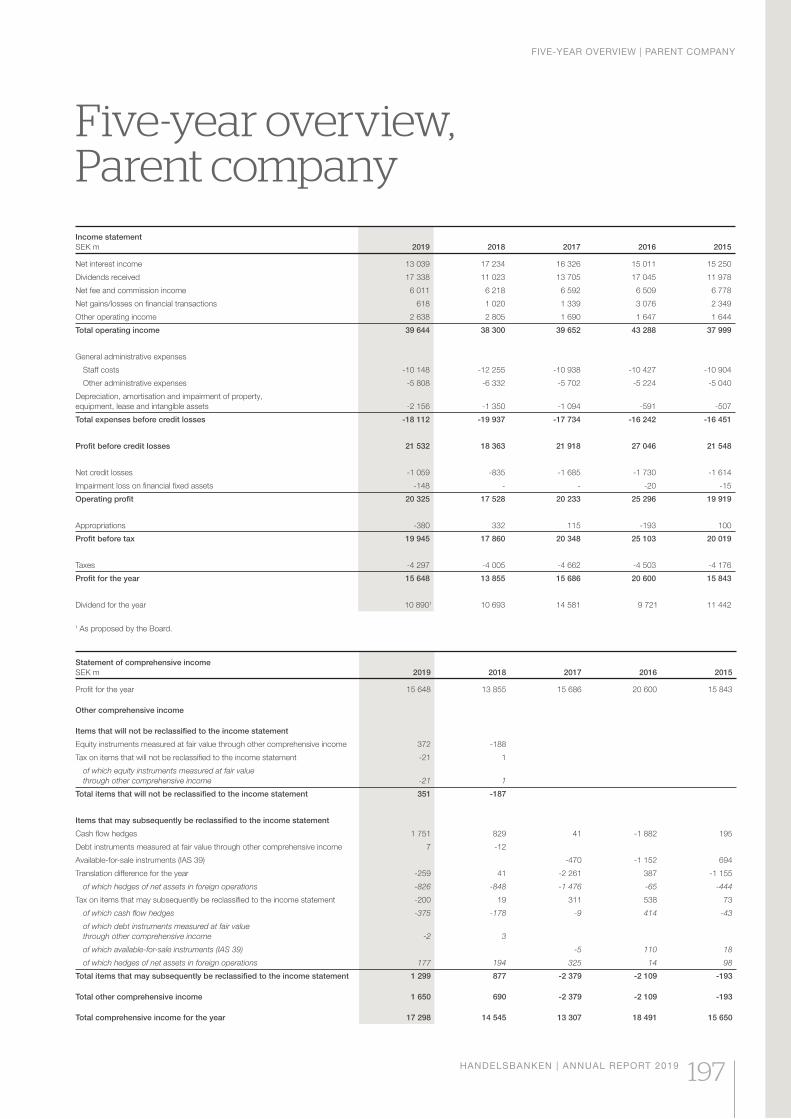
Five-year overview, Parent companyIncome statement
SEK m 2019 2018 2017 2016 2015
Net interest income 13 039 17 234 16 326 15 011 15 250
Dividends received 17 338 11 023 13 705 17 045 11 978
Net fee and commission income 6 011 6 218 6 592 6 509 6 778
Net gains/losses on financial transactions 618 1 020 1 339 3 076 2 349
Other operating income 2 638 2 805 1 690 1 647 1 644
Total operating income 39 644 38 300 39 652 43 288 37 999
General administrative expenses
Staff costs -10 148 -12 255 -10 938 -10 427 -10 904
Other administrative expenses -5 808 -6 332 -5 702 -5 224 -5 040
Depreciation, amortisation and impairment of property,
equipment, lease and intangible assets -2 156 -1 350 -1 094 -591 -507
Total expenses before credit losses -18 112 -19 937 -17 734 -16 242 -16 451
Profit before credit losses 21 532 18 363 21 918 27 046 21 548
Net credit losses -1 059 -835 -1 685 -1 730 -1 614
Impairment loss on financial fixed assets -148 - - -20 -15
Operating profit 20 325 17 528 20 233 25 296 19 919
Appropriations -380 332 115 -193 100
Profit before tax 19 945 17 860 20 348 25 103 20 019
Taxes -4 297 -4 005 -4 662 -4 503 -4 176
Profit for the year 15 648 13 855 15 686 20 600 15 843
Dividend for the year 10 8901 10 693 14 581 9 721 11 442
1 As proposed by the Board.
Statement of comprehensive income
SEK m 2019 2018 2017 2016 2015
Profit for the year 15 648 13 855 15 686 20 600 15 843
Other comprehensive income
Items that will not be reclassified to the income statement
Equity instruments measured at fair value through other comprehensive income 372 -188
Tax on items that will not be reclassified to the income statement -21 1
of which equity instruments measured at fair value
through other comprehensive income -21 1
Total items that will not be reclassified to the income statement 351 -187
Items that may subsequently be reclassified to the income statement
Cash flow hedges 1 751 829 41 -1 882 195
Debt instruments measured at fair value through other comprehensive income 7 -12
Available-for-sale instruments (IAS 39) -470 -1 152 694
Translation difference for the year -259 41 -2 261 387 -1 155
of which hedges of net assets in foreign operations -826 -848 -1 476 -65 -444
Tax on items that may subsequently be reclassified to the income statement -200 19 311 538 73
of which cash flow hedges -375 -178 -9 414 -43
of which debt instruments measured at fair value
through other comprehensive income -2 3
of which available-for-sale instruments (IAS 39) -5 110 18
of which hedges of net assets in foreign operations 177 194 325 14 98
Total items that may subsequently be reclassified to the income statement 1 299 877 -2 379 -2 109 -193
Total other comprehensive income 1 650 690 -2 379 -2 109 -193
Total comprehensive income for the year 17 298 14 545 13 307 18 491 15 650
FIVE-YEAR OVERVIEW | PARENT COMPANY
HANDELSBANKEN | ANNUAL REPORT 2019 197
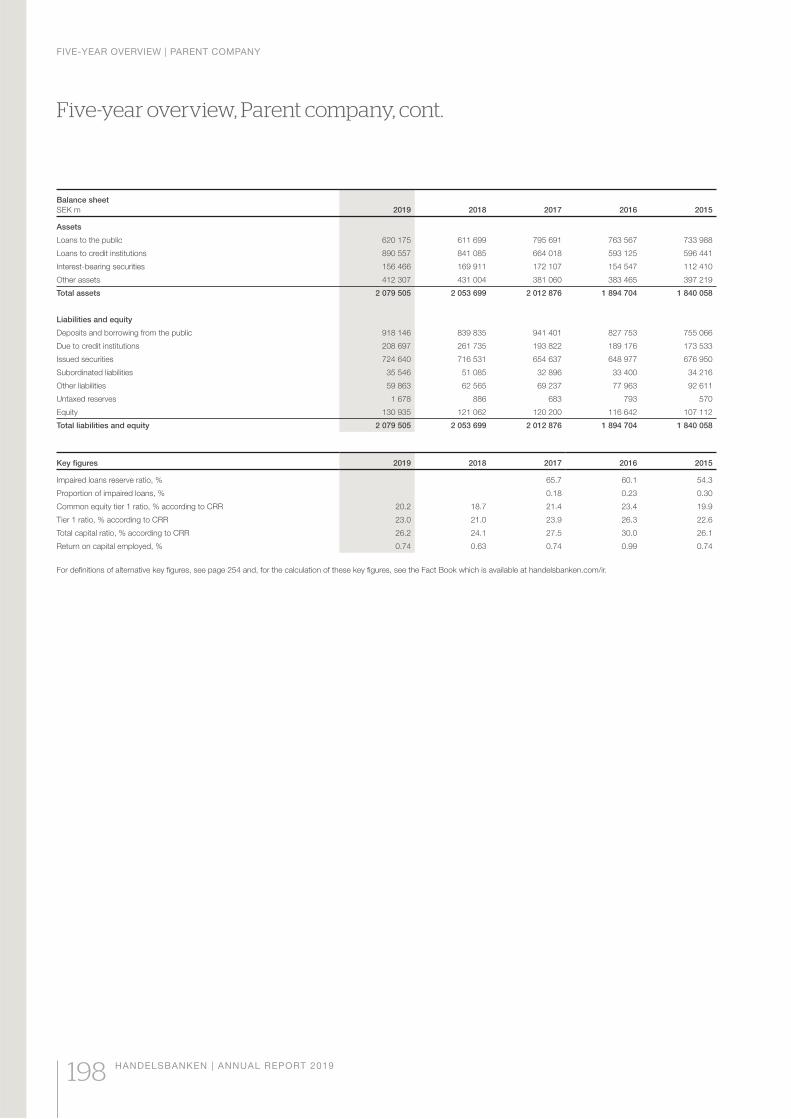
Balance sheet
SEK m 2019 2018 2017 2016 2015
Assets
Loans to the public 620 175 611 699 795 691 763 567 733 988
Loans to credit institutions 890 557 841 085 664 018 593 125 596 441
Interest-bearing securities 156 466 169 911 172 107 154 547 112 410
Other assets 412 307 431 004 381 060 383 465 397 219
Total assets 2 079 505 2 053 699 2 012 876 1 894 704 1 840 058
Liabilities and equity
Deposits and borrowing from the public 918 146 839 835 941 401 827 753 755 066
Due to credit institutions 208 697 261 735 193 822 189 176 173 533
Issued securities 724 640 716 531 654 637 648 977 676 950
Subordinated liabilities 35 546 51 085 32 896 33 400 34 216
Other liabilities 59 863 62 565 69 237 77 963 92 611
Untaxed reserves 1 678 886 683 793 570
Equity 130 935 121 062 120 200 116 642 107 112
Total liabilities and equity 2 079 505 2 053 699 2 012 876 1 894 704 1 840 058
Key figures 2019 2018 2017 2016 2015
Impaired loans reserve ratio, % 65.7 60.1 54.3
Proportion of impaired loans, % 0.18 0.23 0.30
Common equity tier 1 ratio, % according to CRR 20.2 18.7 21.4 23.4 19.9
Tier 1 ratio, % according to CRR 23.0 21.0 23.9 26.3 22.6
Total capital ratio, % according to CRR 26.2 24.1 27.5 30.0 26.1
Return on capital employed, % 0.74 0.63 0.74 0.99 0.74
For definitions of alternative key figures, see page 254 and, for the calculation of these key figures, see the Fact Book which is available at handelsbanken.com/ir.
Five-year overview, Parent company, cont.
FIVE-YEAR OVERVIEW | PARENT COMPANY
198 HANDELSBANKEN | ANNUAL REPORT 2019
Notes, Parent company P1 Accounting policies
Statement of compliance
The parent company’s annual report is prepared
in accordance with the Swedish Annual
Accounts Act for Credit Institutions and Securi-
ties Companies (1995:1559) and the regulations
and general guidelines issued by the Swedish
Financial Supervisory Authority, FFFS 2008:25,
on annual reports in credit institutions and secu-
rities companies. The parent company also
applies the Swedish Financial Reporting Board’s
recommendation RFR 2 Accounting for legal
entities and statements. In accordance with the
Financial Supervisory Authority’s general advice,
the parent company applies statutory IFRS. This
means that the international accounting stand-
ards and interpretations of these standards as
adopted by the EU have been applied to the
extent that is possible within the framework of
national laws and directives and the link
between accounting and taxation.
The relationship between the parent compa-
ny’s and the Group’s accounting policies
The parent company’s accounting policies cor-
respond largely to those of the Group. The fol-
lowing reports only on the areas where the par-
ent company’s policies differ from those of the
Group. In all other respects, reference is made
to the accounting policies in note G1.
Changed accounting policies
IFRS 16 Leases should be applied as of the
2019 financial year. The main change arising
from the new standard is that all lease contracts
(with the exception of short-term lease con-
tracts and lease contracts of low value) must be
recognised as an asset (right-of-use asset) and
as a liability on the lessee’s balance sheet. In the
income statement, the straight-line expense for
the operating lease is replaced by a charge for
depreciation on the leased asset and an interest
expense for the lease liability. In accordance
with the exemption in RFR 2 Accounting for Legal
Entities, under which the application of IFRS 16 is
not mandatory in legal entities, the Bank does not
apply IFRS 16 in the parent company.
Presentation
The parent company applies the presentation
models for the income statement and balance
sheet in compliance with the Annual Accounts
Act for Credit Institutions and Securities Com-
panies and the Swedish Financial Supervisory
Authority’s regulations. This mainly implies the
following differences relative to the presentation
models used by the Group:
• Claims on central banks that are immediately
available upon demand are reported as Loans
to credit institutions in the parent company’s
balance sheet. These are reported under
Other loans to central banks in the Group.
• Broker and stock exchange costs are
reported in the parent company as commis-
sion expenses.
• Dividends received are reported on a sepa-
rate line in the parent company’s income
statement.
• The gain/loss arising when divesting prop-
erty, equipment and intangible non-current
assets in the parent company is reported as
other income or expenses.
• Untaxed reserves are reported as a separate
balance sheet item in the parent company.
These are split into an equity share and a tax
liability in the Group.
Assets and liabilities in foreign currencies
Loans in the parent company which are hedging
net investments in foreign operations are meas-
ured at the historical rate of exchange.
Assets held for sale and
discontinued operations
Net profit after tax from discontinued operations is
not recognised separately in the parent company’s
income statement. Assets held for sale are also
not presented separately on the balance sheet.
Shares in subsidiaries and
associated companies
Shares in subsidiaries and associated compa-
nies are measured at cost. All holdings are tested
on each balance sheet date in order to assess
whether they require impairment. If a value has
decreased, impairment is recognised to adjust
the value to the consolidated value. Any impair-
ment costs are classified as Impairment loss on
financial assets in the income statement. Divi-
dends on shares in subsidiaries and associated
companies are recognised as income in profit or
loss under Dividends received.
Financial guarantees
Financial guarantees, in the form of guarantee
commitments on behalf of subsidiaries and
associated companies, are recognised in the
parent company as a provision on the balance
sheet, where the parent company has an exist-
ing commitment and payment will probably be
required to settle this commitment.
Intangible assets
In the parent company, acquisition assets and
other intangible assets with an indefinite useful
life are amortised in compliance with the provi-
sions of the above-mentioned Annual Accounts
Act. According to experience, the customer
relations that the acquisitions have led to are
very long, and consequently the useful life of
goodwill on acquisitions. The amortisation
period has been set at 20 years.
Leases
The Bank as lessor
The parent company recognises finance leases
as operating leases. Accordingly, the assets
are reported as lease assets with depreciation
recognised within Depreciation, amortisation
and impairments of property, equipment and
intangible assets in the income statement.
Rental income is recognised as a lease fee in
Net interest income in the income statement.
Lease assets mainly consist of vehicles and
machinery. Lease assets are depreciated during
the term of the lease agreement according to
the annuity method.
The Bank as lessee
The parent company recognises lease fees as
expenses on a straight-line basis over the term
of the lease.
Dividends
The item Dividends received comprises all divi-
dends received in the parent company including
dividends from subsidiaries and associated com-
panies, and Group contributions received. Antici-
pated dividends are recognised only if the parent
company has the right to decide the amount of
the dividend and the decision has been taken
before the financial reports were published.
Accounting for pensions
The parent company does not apply the provi-
sions of IAS 19 concerning accounting for
defined benefit plans. Instead, pension costs are
calculated on an actuarial basis in the parent
company in accordance with the provisions of
the Act on Safeguarding Pension Obligations
and the Swedish Financial Supervisory Authori-
ty’s regulations. This mainly means that there are
differences regarding how the discount rate is
established and that the calculation of the future
commitment does not take into account assump-
tions of future salary increases. The recognised
net cost of pensions is calculated as the sum
total of disbursed pensions, pension premiums
and an allocation to the pension foundation, with
a deduction for any compensation from the pen-
sion foundation. The net pension cost for the
year is reported under Staff costs in the parent
company’s income statement.
Excess amounts as a result of the value of
the plan assets exceeding the estimated pen-
sion obligations are not recognised as an asset
in the parent company’s balance sheet. Deficits
are recognised as a liability.
Taxes
In the parent company, untaxed reserves are
recognised as a separate item in the balance
sheet. Untaxed reserves comprise one compo-
nent consisting of deferred tax liabilities and
one component consisting of equity.
NOTES | PARENT COMPANY
HANDELSBANKEN | ANNUAL REPORT 2019 199
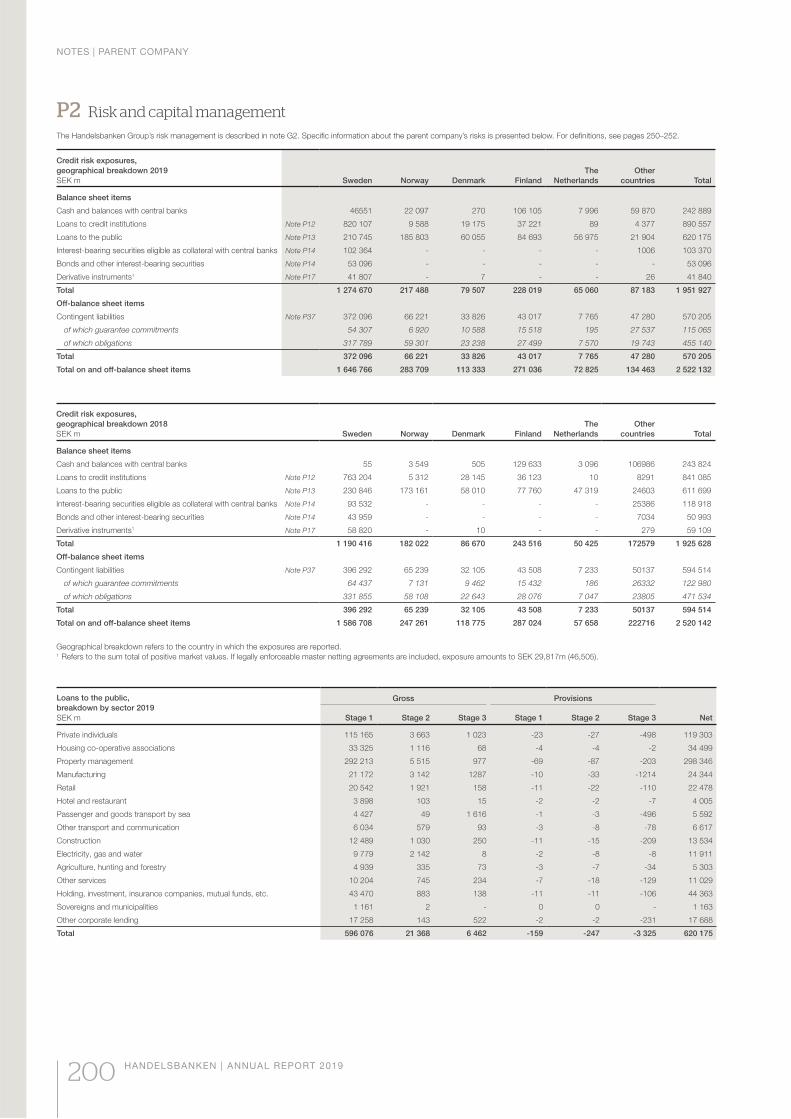
P2 Risk and capital management
The Handelsbanken Group’s risk management is described in note G2. Specific information about the parent company’s risks is presented below. For definitions, see pages 250–252.
Credit risk exposures,
geographical breakdown 2019
SEK m Sweden Norway Denmark Finland
The
Netherlands
Other
countries Total
Balance sheet items
Cash and balances with central banks 46551 22 097 270 106 105 7 996 59 870 242 889
Loans to credit institutions Note P12 820 107 9 588 19 175 37 221 89 4 377 890 557
Loans to the public Note P13 210 745 185 803 60 055 84 693 56 975 21 904 620 175
Interest-bearing securities eligible as collateral with central banks Note P14 102 364 - - - - 1006 103 370
Bonds and other interest-bearing securities Note P14 53 096 - - - - - 53 096
Derivative instruments1 Note P17 41 807 - 7 - - 26 41 840
Total 1 274 670 217 488 79 507 228 019 65 060 87 183 1 951 927
Off-balance sheet items
Contingent liabilities Note P37 372 096 66 221 33 826 43 017 7 765 47 280 570 205
of which guarantee commitments 54 307 6 920 10 588 15 518 195 27 537 115 065
of which obligations 317 789 59 301 23 238 27 499 7 570 19 743 455 140
Total 372 096 66 221 33 826 43 017 7 765 47 280 570 205
Total on and off-balance sheet items 1 646 766 283 709 113 333 271 036 72 825 134 463 2 522 132
Credit risk exposures,
geographical breakdown 2018
SEK m Sweden Norway Denmark Finland
The
Netherlands
Other
countries Total
Balance sheet items
Cash and balances with central banks 55 3 549 505 129 633 3 096 106986 243 824
Loans to credit institutions Note P12 763 204 5 312 28 145 36 123 10 8291 841 085
Loans to the public Note P13 230 846 173 161 58 010 77 760 47 319 24603 611 699
Interest-bearing securities eligible as collateral with central banks Note P14 93 532 - - - - 25386 118 918
Bonds and other interest-bearing securities Note P14 43 959 - - - - 7034 50 993
Derivative instruments1 Note P17 58 820 - 10 - - 279 59 109
Total 1 190 416 182 022 86 670 243 516 50 425 172579 1 925 628
Off-balance sheet items
Contingent liabilities Note P37 396 292 65 239 32 105 43 508 7 233 50137 594 514
of which guarantee commitments 64 437 7 131 9 462 15 432 186 26332 122 980
of which obligations 331 855 58 108 22 643 28 076 7 047 23805 471 534
Total 396 292 65 239 32 105 43 508 7 233 50137 594 514
Total on and off-balance sheet items 1 586 708 247 261 118 775 287 024 57 658 222716 2 520 142
Geographical breakdown refers to the country in which the exposures are reported. 1 Refers to the sum total of positive market values. If legally enforceable master netting agreements are included, exposure amounts to SEK 29,817m (46,505).
Loans to the public,
breakdown by sector 2019
SEK m
Gross Provisions
Stage 1 Stage 2 Stage 3 Stage 1 Stage 2 Stage 3 Net
Private individuals 115 165 3 663 1 023 -23 -27 -498 119 303
Housing co-operative associations 33 325 1 116 68 -4 -4 -2 34 499
Property management 292 213 5 515 977 -69 -87 -203 298 346
Manufacturing 21 172 3 142 1287 -10 -33 -1214 24 344
Retail 20 542 1 921 158 -11 -22 -110 22 478
Hotel and restaurant 3 898 103 15 -2 -2 -7 4 005
Passenger and goods transport by sea 4 427 49 1 616 -1 -3 -496 5 592
Other transport and communication 6 034 579 93 -3 -8 -78 6 617
Construction 12 489 1 030 250 -11 -15 -209 13 534
Electricity, gas and water 9 779 2 142 8 -2 -8 -8 11 911
Agriculture, hunting and forestry 4 939 335 73 -3 -7 -34 5 303
Other services 10 204 745 234 -7 -18 -129 11 029
Holding, investment, insurance companies, mutual funds, etc. 43 470 883 138 -11 -11 -106 44 363
Sovereigns and municipalities 1 161 2 - 0 0 - 1 163
Other corporate lending 17 258 143 522 -2 -2 -231 17 688
Total 596 076 21 368 6 462 -159 -247 -3 325 620 175
NOTES | PARENT COMPANY
200 HANDELSBANKEN | ANNUAL REPORT 2019
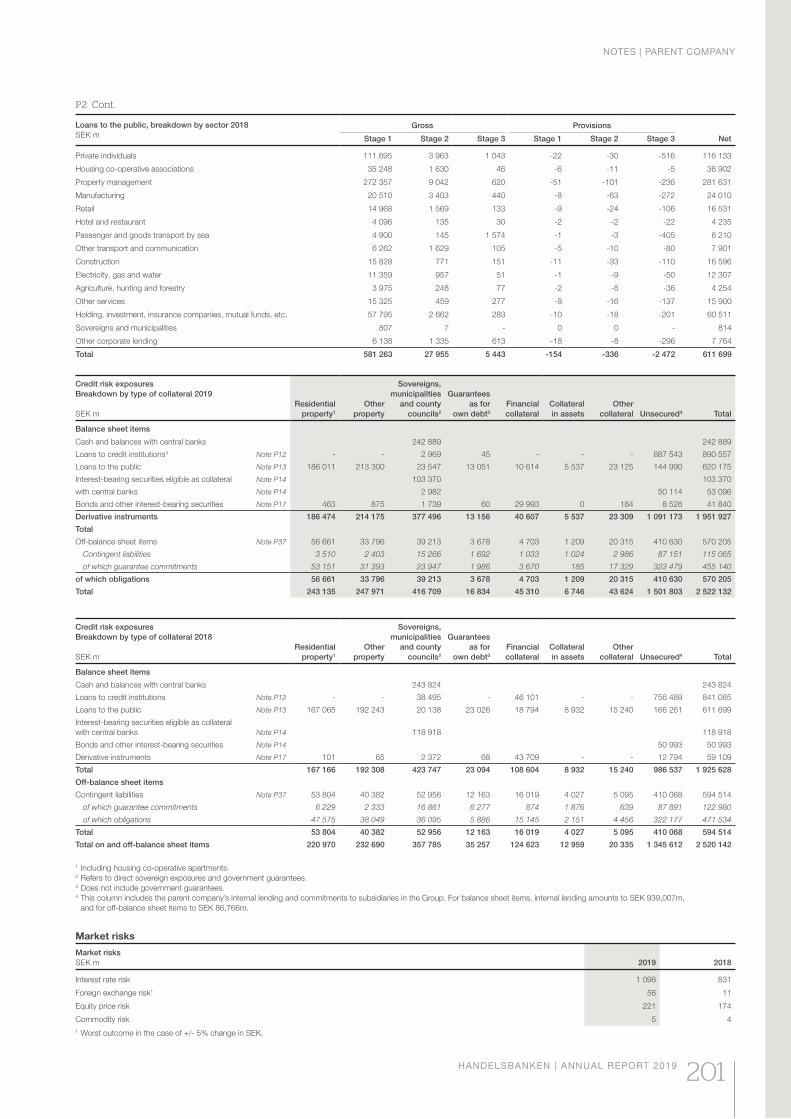
Market risks
Market risks
SEK m 2019 2018
Interest rate risk 1 098 831
Foreign exchange risk1 56 11
Equity price risk 221 174
Commodity risk 5 4
1 Worst outcome in the case of +/- 5% change in SEK.
Credit risk exposures
Breakdown by type of collateral 2019
SEK m
Residential
property1
Other
property
Sovereigns,
municipalities
and county
councils2
Guarantees
as for
own debt3
Financial
collateral
Collateral
in assets
Other
collateral Unsecured4 Total
Balance sheet items
Cash and balances with central banks 242 889 242 889
Loans to credit institutions5 Note P12 - - 2 969 45 - - - 887 543 890 557
Loans to the public Note P13 186 011 213 300 23 547 13 051 10 614 5 537 23 125 144 990 620 175
Interest-bearing securities eligible as collateral Note P14 103 370 103 370
with central banks Note P14 2 982 50 114 53 096
Bonds and other interest-bearing securities Note P17 463 875 1 739 60 29 993 0 184 8 526 41 840
Derivative instruments 186 474 214 175 377 496 13 156 40 607 5 537 23 309 1 091 173 1 951 927
Total
Off-balance sheet items Note P37 56 661 33 796 39 213 3 678 4 703 1 209 20 315 410 630 570 205
Contingent liabilities 3 510 2 403 15 266 1 692 1 033 1 024 2 986 87 151 115 065
of which guarantee commitments 53 151 31 393 23 947 1 986 3 670 185 17 329 323 479 455 140
of which obligations 56 661 33 796 39 213 3 678 4 703 1 209 20 315 410 630 570 205
Total 243 135 247 971 416 709 16 834 45 310 6 746 43 624 1 501 803 2 522 132
Credit risk exposures
Breakdown by type of collateral 2018
SEK m
Residential
property1
Other
property
Sovereigns,
municipalities
and county
councils2
Guarantees
as for
own debt3
Financial
collateral
Collateral
in assets
Other
collateral Unsecured4 Total
Balance sheet items
Cash and balances with central banks 243 824 243 824
Loans to credit institutions Note P12 - - 38 495 - 46 101 - - 756 489 841 085
Loans to the public Note P13 167 065 192 243 20 138 23 026 18 794 8 932 15 240 166 261 611 699
Interest-bearing securities eligible as collateral
with central banks Note P14 118 918 118 918
Bonds and other interest-bearing securities Note P14 50 993 50 993
Derivative instruments Note P17 101 65 2 372 68 43 709 - - 12 794 59 109
Total 167 166 192 308 423 747 23 094 108 604 8 932 15 240 986 537 1 925 628
Off-balance sheet items
Contingent liabilities Note P37 53 804 40 382 52 956 12 163 16 019 4 027 5 095 410 068 594 514
of which guarantee commitments 6 229 2 333 16 861 6 277 874 1 876 639 87 891 122 980
of which obligations 47 575 38 049 36 095 5 886 15 145 2 151 4 456 322 177 471 534
Total 53 804 40 382 52 956 12 163 16 019 4 027 5 095 410 068 594 514
Total on and off-balance sheet items 220 970 232 690 357 785 35 257 124 623 12 959 20 335 1 345 612 2 520 142
1 Including housing co-operative apartments. 2 Refers to direct sovereign exposures and government guarantees. 3 Does not include government guarantees. 4 This column includes the parent company’s internal lending and commitments to subsidiaries in the Group. For balance sheet items, internal lending amounts to SEK 939,007m,
and for off-balance sheet items to SEK 86,766m.
P2 Cont.
Loans to the public, breakdown by sector 2018
SEK mGross Provisions
Stage 1 Stage 2 Stage 3 Stage 1 Stage 2 Stage 3 Net
Private individuals 111 695 3 963 1 043 -22 -30 -516 116 133
Housing co-operative associations 35 248 1 630 46 -6 -11 -5 36 902
Property management 272 357 9 042 620 -51 -101 -236 281 631
Manufacturing 20 510 3 403 440 -8 -63 -272 24 010
Retail 14 968 1 569 133 -9 -24 -106 16 531
Hotel and restaurant 4 096 135 30 -2 -2 -22 4 235
Passenger and goods transport by sea 4 900 145 1 574 -1 -3 -405 6 210
Other transport and communication 6 262 1 629 105 -5 -10 -80 7 901
Construction 15 828 771 151 -11 -33 -110 16 596
Electricity, gas and water 11 359 957 51 -1 -9 -50 12 307
Agriculture, hunting and forestry 3 975 248 77 -2 -8 -36 4 254
Other services 15 325 459 277 -8 -16 -137 15 900
Holding, investment, insurance companies, mutual funds, etc. 57 795 2 662 283 -10 -18 -201 60 511
Sovereigns and municipalities 807 7 - 0 0 - 814
Other corporate lending 6 138 1 335 613 -18 -8 -296 7 764
Total 581 263 27 955 5 443 -154 -336 -2 472 611 699
NOTES | PARENT COMPANY
HANDELSBANKEN | ANNUAL REPORT 2019 201
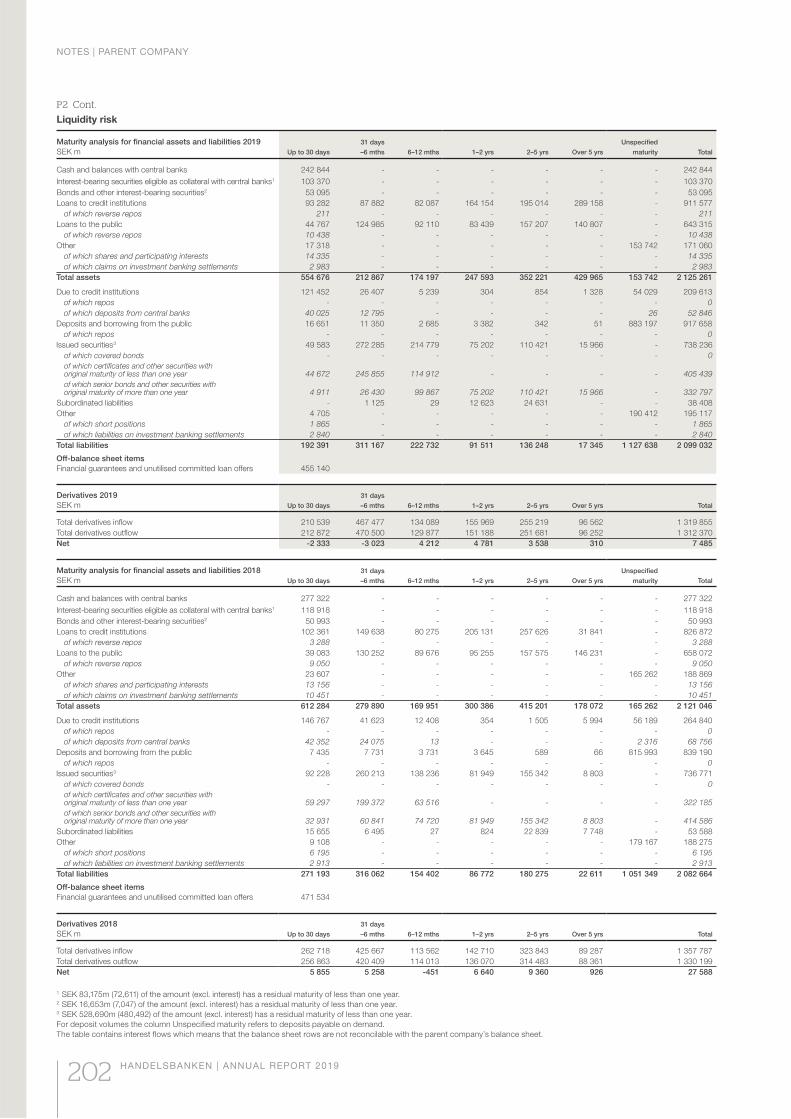
Liquidity risk
Maturity analysis for financial assets and liabilities 2019
SEK m Up to 30 days
31 days
–6 mths 6–12 mths 1–2 yrs 2–5 yrs Over 5 yrs
Unspecified
maturity Total
Cash and balances with central banks 242 844 - - - - - - 242 844
Interest-bearing securities eligible as collateral with central banks1 103 370 - - - - - - 103 370
Bonds and other interest-bearing securities2 53 095 - - - - - - 53 095
Loans to credit institutions 93 282 87 882 82 087 164 154 195 014 289 158 - 911 577
of which reverse repos 211 - - - - - - 211
Loans to the public 44 767 124 985 92 110 83 439 157 207 140 807 - 643 315
of which reverse repos 10 438 - - - - - - 10 438
Other 17 318 - - - - - 153 742 171 060
of which shares and participating interests 14 335 - - - - - - 14 335
of which claims on investment banking settlements 2 983 - - - - - - 2 983
Total assets 554 676 212 867 174 197 247 593 352 221 429 965 153 742 2 125 261
Due to credit institutions 121 452 26 407 5 239 304 854 1 328 54 029 209 613
of which repos - - - - - - - 0
of which deposits from central banks 40 025 12 795 - - - - 26 52 846
Deposits and borrowing from the public 16 651 11 350 2 685 3 382 342 51 883 197 917 658
of which repos - - - - - - - 0
Issued securities3 49 583 272 285 214 779 75 202 110 421 15 966 - 738 236
of which covered bonds - - - - - - - 0
of which certificates and other securities with original maturity of less than one year 44 672 245 855 114 912 - - - - 405 439
of which senior bonds and other securities with original maturity of more than one year 4 911 26 430 99 867 75 202 110 421 15 966 - 332 797
Subordinated liabilities - 1 125 29 12 623 24 631 - - 38 408
Other 4 705 - - - - - 190 412 195 117
of which short positions 1 865 - - - - - - 1 865
of which liabilities on investment banking settlements 2 840 - - - - - - 2 840
Total liabilities 192 391 311 167 222 732 91 511 136 248 17 345 1 127 638 2 099 032
Off-balance sheet items
Financial guarantees and unutilised committed loan offers 455 140
Derivatives 2019
SEK m Up to 30 days
31 days
–6 mths 6–12 mths 1–2 yrs 2–5 yrs Over 5 yrs Total
Total derivatives inflow 210 539 467 477 134 089 155 969 255 219 96 562 1 319 855
Total derivatives outflow 212 872 470 500 129 877 151 188 251 681 96 252 1 312 370
Net -2 333 -3 023 4 212 4 781 3 538 310 7 485
Maturity analysis for financial assets and liabilities 2018
SEK m Up to 30 days
31 days
–6 mths 6–12 mths 1–2 yrs 2–5 yrs Over 5 yrs
Unspecified
maturity Total
Cash and balances with central banks 277 322 - - - - - - 277 322
Interest-bearing securities eligible as collateral with central banks1 118 918 - - - - - - 118 918
Bonds and other interest-bearing securities2 50 993 - - - - - - 50 993
Loans to credit institutions 102 361 149 638 80 275 205 131 257 626 31 841 - 826 872
of which reverse repos 3 288 - - - - - - 3 288
Loans to the public 39 083 130 252 89 676 95 255 157 575 146 231 - 658 072
of which reverse repos 9 050 - - - - - - 9 050
Other 23 607 - - - - - 165 262 188 869
of which shares and participating interests 13 156 - - - - - - 13 156
of which claims on investment banking settlements 10 451 - - - - - - 10 451
Total assets 612 284 279 890 169 951 300 386 415 201 178 072 165 262 2 121 046
Due to credit institutions 146 767 41 623 12 408 354 1 505 5 994 56 189 264 840
of which repos - - - - - - - 0
of which deposits from central banks 42 352 24 075 13 - - - 2 316 68 756
Deposits and borrowing from the public 7 435 7 731 3 731 3 645 589 66 815 993 839 190
of which repos - - - - - - - 0
Issued securities3 92 228 260 213 138 236 81 949 155 342 8 803 - 736 771
of which covered bonds - - - - - - - 0
of which certificates and other securities with original maturity of less than one year 59 297 199 372 63 516 - - - - 322 185
of which senior bonds and other securities with original maturity of more than one year 32 931 60 841 74 720 81 949 155 342 8 803 - 414 586
Subordinated liabilities 15 655 6 495 27 824 22 839 7 748 - 53 588
Other 9 108 - - - - - 179 167 188 275
of which short positions 6 195 - - - - - - 6 195
of which liabilities on investment banking settlements 2 913 - - - - - - 2 913
Total liabilities 271 193 316 062 154 402 86 772 180 275 22 611 1 051 349 2 082 664
Off-balance sheet items
Financial guarantees and unutilised committed loan offers 471 534
Derivatives 2018
SEK m Up to 30 days
31 days
–6 mths 6–12 mths 1–2 yrs 2–5 yrs Over 5 yrs Total
Total derivatives inflow 262 718 425 667 113 562 142 710 323 843 89 287 1 357 787
Total derivatives outflow 256 863 420 409 114 013 136 070 314 483 88 361 1 330 199
Net 5 855 5 258 -451 6 640 9 360 926 27 588
1 SEK 83,175m (72,611) of the amount (excl. interest) has a residual maturity of less than one year. 2 SEK 16,653m (7,047) of the amount (excl. interest) has a residual maturity of less than one year. 3 SEK 528,690m (480,492) of the amount (excl. interest) has a residual maturity of less than one year.
For deposit volumes the column Unspecified maturity refers to deposits payable on demand.
The table contains interest flows which means that the balance sheet rows are not reconcilable with the parent company’s balance sheet.
P2 Cont.
NOTES | PARENT COMPANY
202 HANDELSBANKEN | ANNUAL REPORT 2019
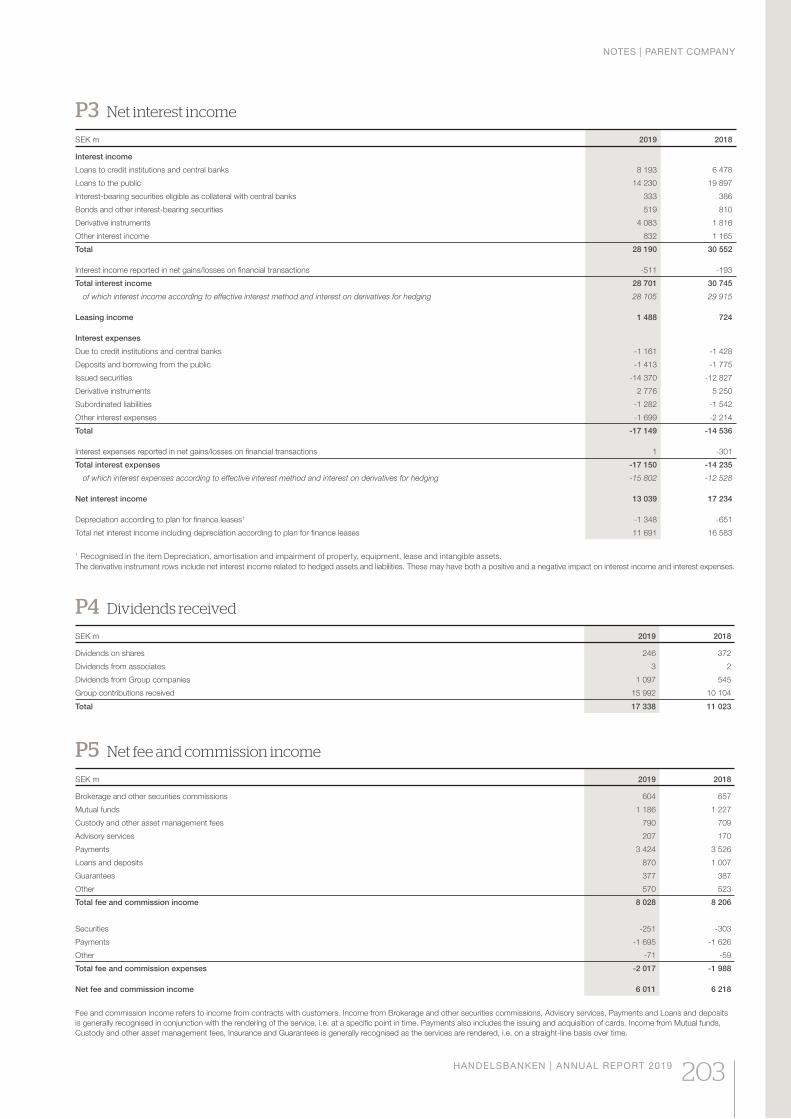
P4 Dividends received
SEK m 2019 2018
Dividends on shares 246 372
Dividends from associates 3 2
Dividends from Group companies 1 097 545
Group contributions received 15 992 10 104
Total 17 338 11 023
P3 Net interest income
SEK m 2019 2018
Interest income
Loans to credit institutions and central banks 8 193 6 478
Loans to the public 14 230 19 897
Interest-bearing securities eligible as collateral with central banks 333 386
Bonds and other interest-bearing securities 519 810
Derivative instruments 4 083 1 816
Other interest income 832 1 165
Total 28 190 30 552
Interest income reported in net gains/losses on financial transactions -511 -193
Total interest income 28 701 30 745
of which interest income according to effective interest method and interest on derivatives for hedging 28 105 29 915
Leasing income 1 488 724
Interest expenses
Due to credit institutions and central banks -1 161 -1 428
Deposits and borrowing from the public -1 413 -1 775
Issued securities -14 370 -12 827
Derivative instruments 2 776 5 250
Subordinated liabilities -1 282 -1 542
Other interest expenses -1 699 -2 214
Total -17 149 -14 536
Interest expenses reported in net gains/losses on financial transactions 1 -301
Total interest expenses -17 150 -14 235
of which interest expenses according to effective interest method and interest on derivatives for hedging -15 802 -12 528
Net interest income 13 039 17 234
Depreciation according to plan for finance leases1 -1 348 -651
Total net interest income including depreciation according to plan for finance leases 11 691 16 583
1 Recognised in the item Depreciation, amortisation and impairment of property, equipment, lease and intangible assets.
The derivative instrument rows include net interest income related to hedged assets and liabilities. These may have both a positive and a negative impact on interest income and interest expenses.
P5 Net fee and commission income
SEK m 2019 2018
Brokerage and other securities commissions 604 657
Mutual funds 1 186 1 227
Custody and other asset management fees 790 709
Advisory services 207 170
Payments 3 424 3 526
Loans and deposits 870 1 007
Guarantees 377 387
Other 570 523
Total fee and commission income 8 028 8 206
Securities -251 -303
Payments -1 695 -1 626
Other -71 -59
Total fee and commission expenses -2 017 -1 988
Net fee and commission income 6 011 6 218
Fee and commission income refers to income from contracts with customers. Income from Brokerage and other securities commissions, Advisory services, Payments and Loans and deposits
is generally recognised in conjunction with the rendering of the service, i.e. at a specific point in time. Payments also includes the issuing and acquisition of cards. Income from Mutual funds,
Custody and other asset management fees, Insurance and Guarantees is generally recognised as the services are rendered, i.e. on a straight-line basis over time.
NOTES | PARENT COMPANY
HANDELSBANKEN | ANNUAL REPORT 2019 203
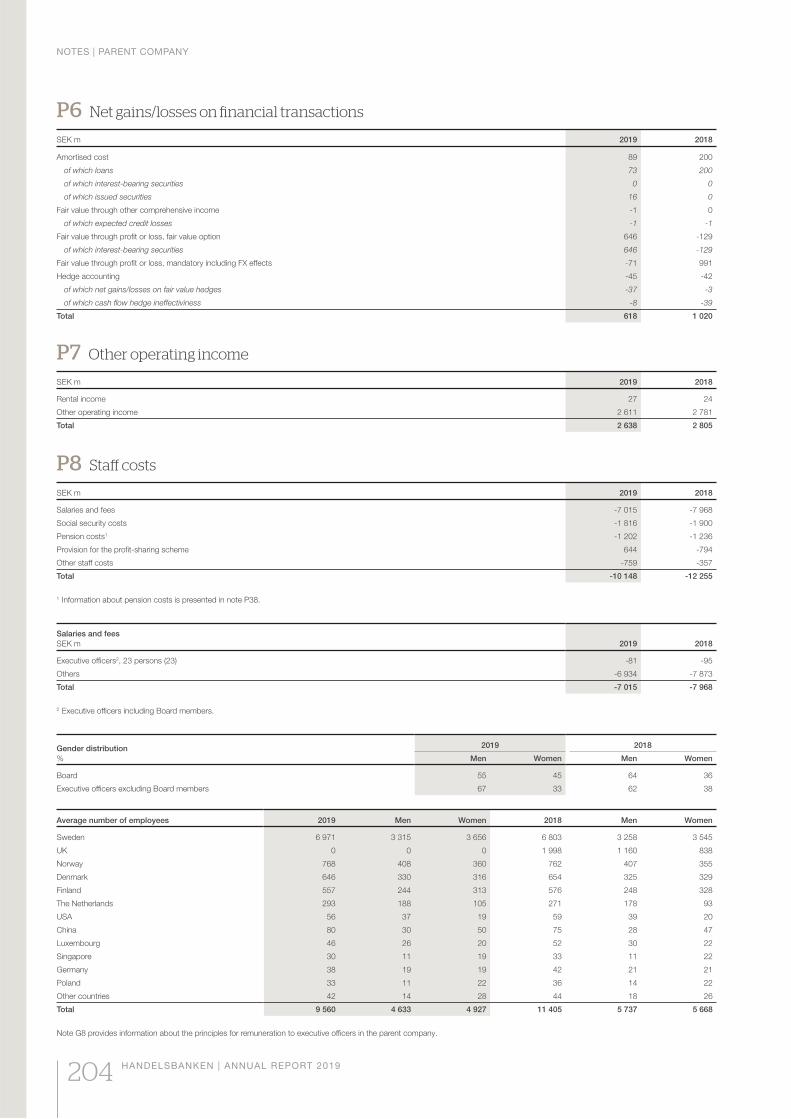
P6 Net gains/losses on financial transactions
SEK m 2019 2018
Amortised cost 89 200
of which loans 73 200
of which interest-bearing securities 0 0
of which issued securities 16 0
Fair value through other comprehensive income -1 0
of which expected credit losses -1 -1
Fair value through profit or loss, fair value option 646 -129
of which interest-bearing securities 646 -129
Fair value through profit or loss, mandatory including FX effects -71 991
Hedge accounting -45 -42
of which net gains/losses on fair value hedges -37 -3
of which cash flow hedge ineffectiviness -8 -39
Total 618 1 020
P7 Other operating income
SEK m 2019 2018
Rental income 27 24
Other operating income 2 611 2 781
Total 2 638 2 805
Average number of employees 2019 Men Women 2018 Men Women
Sweden 6 971 3 315 3 656 6 803 3 258 3 545
UK 0 0 0 1 998 1 160 838
Norway 768 408 360 762 407 355
Denmark 646 330 316 654 325 329
Finland 557 244 313 576 248 328
The Netherlands 293 188 105 271 178 93
USA 56 37 19 59 39 20
China 80 30 50 75 28 47
Luxembourg 46 26 20 52 30 22
Singapore 30 11 19 33 11 22
Germany 38 19 19 42 21 21
Poland 33 11 22 36 14 22
Other countries 42 14 28 44 18 26
Total 9 560 4 633 4 927 11 405 5 737 5 668
Note G8 provides information about the principles for remuneration to executive officers in the parent company.
P8 Staff costs
SEK m 2019 2018
Salaries and fees -7 015 -7 968
Social security costs -1 816 -1 900
Pension costs1 -1 202 -1 236
Provision for the profit-sharing scheme 644 -794
Other staff costs -759 -357
Total -10 148 -12 255
1 Information about pension costs is presented in note P38.
Salaries and fees
SEK m 2019 2018
Executive officers2, 23 persons (23) -81 -95
Others -6 934 -7 873
Total -7 015 -7 968
2 Executive officers including Board members.
Gender distribution
%
2019 2018
Men Women Men Women
Board 55 45 64 36
Executive officers excluding Board members 67 33 62 38
NOTES | PARENT COMPANY
204 HANDELSBANKEN | ANNUAL REPORT 2019
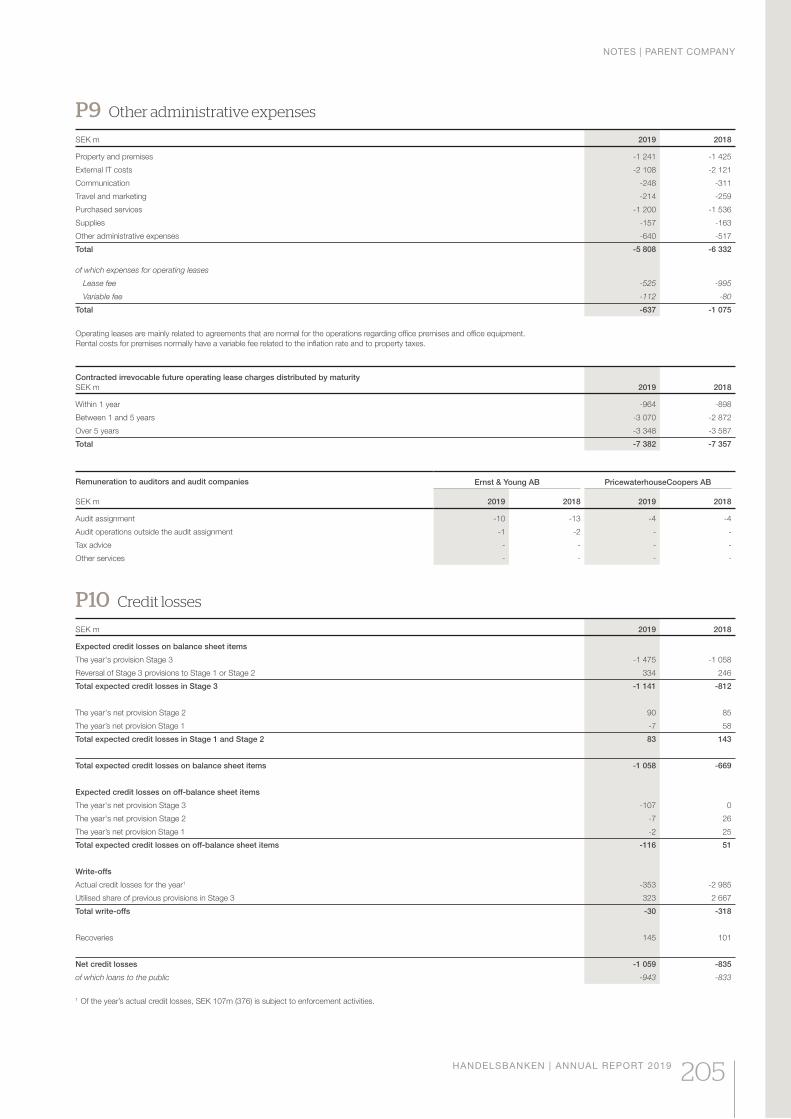
P10 Credit losses
SEK m 2019 2018
Expected credit losses on balance sheet items
The year's provision Stage 3 -1 475 -1 058
Reversal of Stage 3 provisions to Stage 1 or Stage 2 334 246
Total expected credit losses in Stage 3 -1 141 -812
The year's net provision Stage 2 90 85
The year’s net provision Stage 1 -7 58
Total expected credit losses in Stage 1 and Stage 2 83 143
Total expected credit losses on balance sheet items -1 058 -669
Expected credit losses on off-balance sheet items
The year's net provision Stage 3 -107 0
The year's net provision Stage 2 -7 26
The year’s net provision Stage 1 -2 25
Total expected credit losses on off-balance sheet items -116 51
Write-offs
Actual credit losses for the year1 -353 -2 985
Utilised share of previous provisions in Stage 3 323 2 667
Total write-offs -30 -318
Recoveries 145 101
Net credit losses -1 059 -835
of which loans to the public -943 -833
1 Of the year’s actual credit losses, SEK 107m (376) is subject to enforcement activities.
P9 Other administrative expenses
SEK m 2019 2018
Property and premises -1 241 -1 425
External IT costs -2 108 -2 121
Communication -248 -311
Travel and marketing -214 -259
Purchased services -1 200 -1 536
Supplies -157 -163
Other administrative expenses -640 -517
Total -5 808 -6 332
of which expenses for operating leases
Lease fee -525 -995
Variable fee -112 -80
Total -637 -1 075
Operating leases are mainly related to agreements that are normal for the operations regarding office premises and office equipment.
Rental costs for premises normally have a variable fee related to the inflation rate and to property taxes.
Contracted irrevocable future operating lease charges distributed by maturity
SEK m 2019 2018
Within 1 year -964 -898
Between 1 and 5 years -3 070 -2 872
Over 5 years -3 348 -3 587
Total -7 382 -7 357
Remuneration to auditors and audit companies
SEK m
Ernst & Young AB PricewaterhouseCoopers AB
2019 2018 2019 2018
Audit assignment -10 -13 -4 -4
Audit operations outside the audit assignment -1 -2 - -
Tax advice - - - -
Other services - - - -
NOTES | PARENT COMPANY
HANDELSBANKEN | ANNUAL REPORT 2019 205
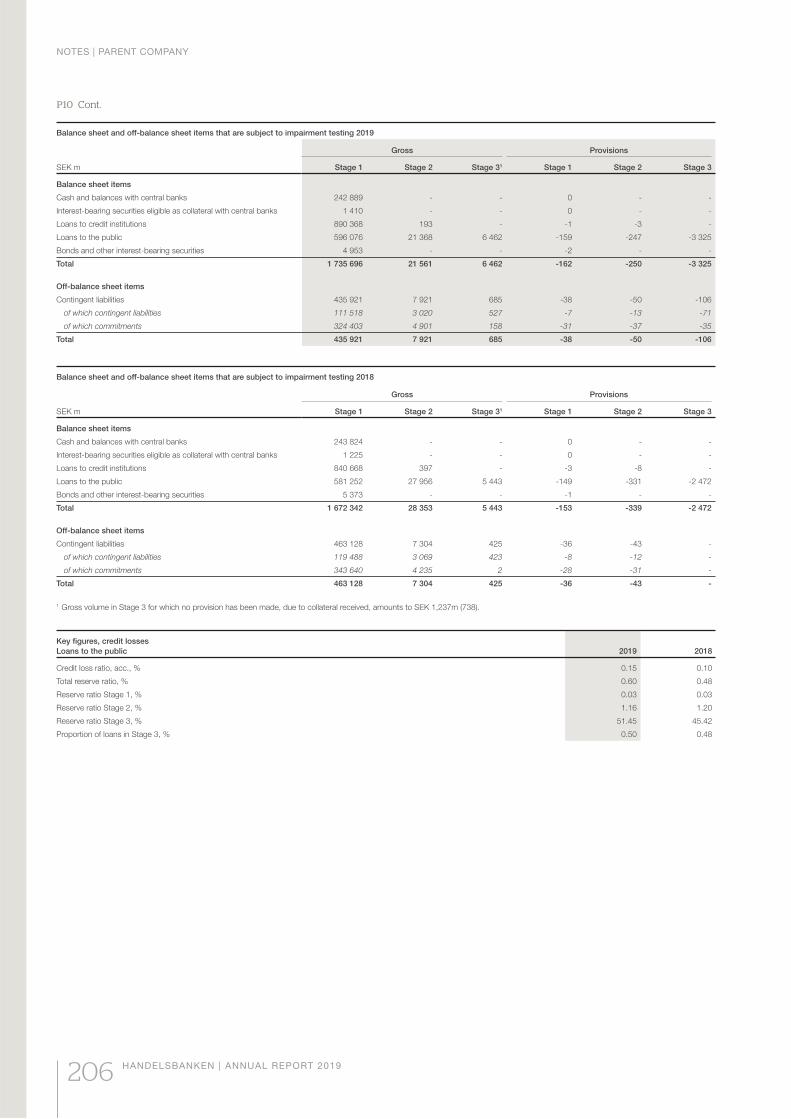
Balance sheet and off-balance sheet items that are subject to impairment testing 2019
SEK m
Gross Provisions
Stage 1 Stage 2 Stage 31 Stage 1 Stage 2 Stage 3
Balance sheet items
Cash and balances with central banks 242 889 - - 0 - -
Interest-bearing securities eligible as collateral with central banks 1 410 - - 0 - -
Loans to credit institutions 890 368 193 - -1 -3 -
Loans to the public 596 076 21 368 6 462 -159 -247 -3 325
Bonds and other interest-bearing securities 4 953 - - -2 - -
Total 1 735 696 21 561 6 462 -162 -250 -3 325
Off-balance sheet items
Contingent liabilities 435 921 7 921 685 -38 -50 -106
of which contingent liabilities 111 518 3 020 527 -7 -13 -71
of which commitments 324 403 4 901 158 -31 -37 -35
Total 435 921 7 921 685 -38 -50 -106
Balance sheet and off-balance sheet items that are subject to impairment testing 2018
SEK m
Gross Provisions
Stage 1 Stage 2 Stage 31 Stage 1 Stage 2 Stage 3
Balance sheet items
Cash and balances with central banks 243 824 - - 0 - -
Interest-bearing securities eligible as collateral with central banks 1 225 - - 0 - -
Loans to credit institutions 840 668 397 - -3 -8 -
Loans to the public 581 252 27 956 5 443 -149 -331 -2 472
Bonds and other interest-bearing securities 5 373 - - -1 - -
Total 1 672 342 28 353 5 443 -153 -339 -2 472
Off-balance sheet items
Contingent liabilities 463 128 7 304 425 -36 -43 -
of which contingent liabilities 119 488 3 069 423 -8 -12 -
of which commitments 343 640 4 235 2 -28 -31 -
Total 463 128 7 304 425 -36 -43 -
1 Gross volume in Stage 3 for which no provision has been made, due to collateral received, amounts to SEK 1,237m (738).
Key figures, credit losses
Loans to the public 2019 2018
Credit loss ratio, acc., % 0.15 0.10
Total reserve ratio, % 0.60 0.48
Reserve ratio Stage 1, % 0.03 0.03
Reserve ratio Stage 2, % 1.16 1.20
Reserve ratio Stage 3, % 51.45 45.42
Proportion of loans in Stage 3, % 0.50 0.48
P10 Cont.
NOTES | PARENT COMPANY
206 HANDELSBANKEN | ANNUAL REPORT 2019
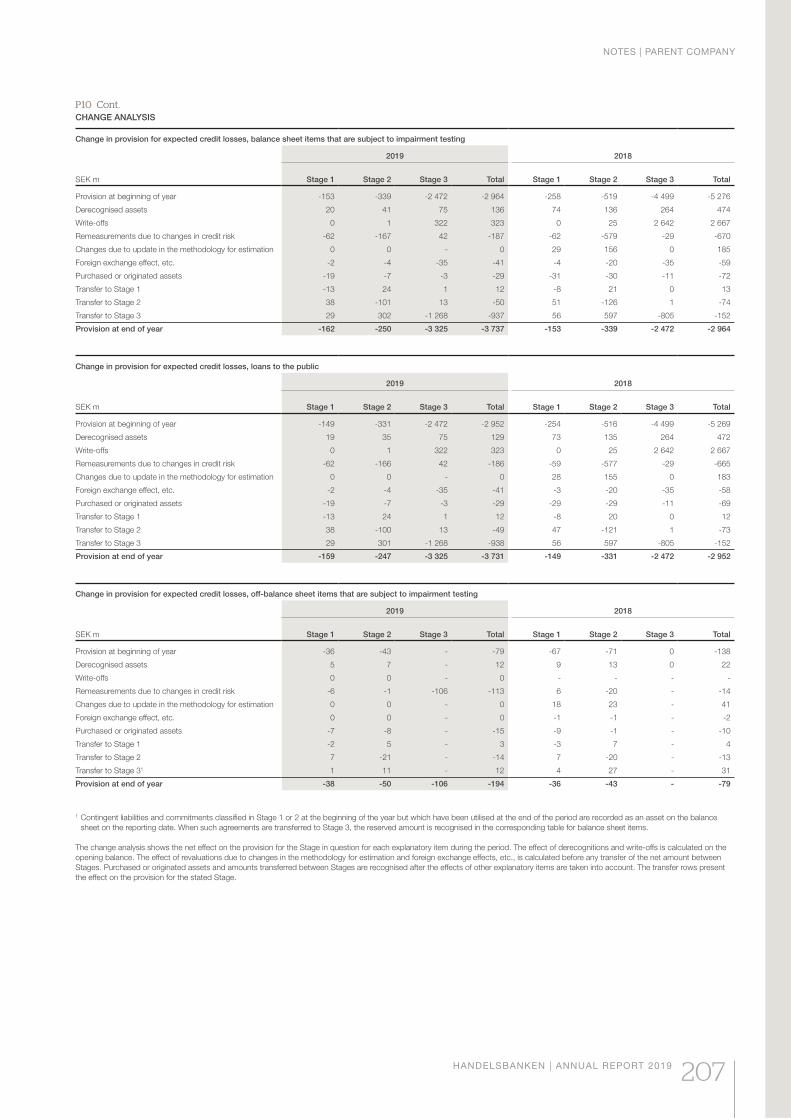
CHANGE ANALYSIS
Change in provision for expected credit losses, balance sheet items that are subject to impairment testing
2019 2018
SEK m Stage 1 Stage 2 Stage 3 Total Stage 1 Stage 2 Stage 3 Total
Provision at beginning of year -153 -339 -2 472 -2 964 -258 -519 -4 499 -5 276
Derecognised assets 20 41 75 136 74 136 264 474
Write-offs 0 1 322 323 0 25 2 642 2 667
Remeasurements due to changes in credit risk -62 -167 42 -187 -62 -579 -29 -670
Changes due to update in the methodology for estimation 0 0 - 0 29 156 0 185
Foreign exchange effect, etc. -2 -4 -35 -41 -4 -20 -35 -59
Purchased or originated assets -19 -7 -3 -29 -31 -30 -11 -72
Transfer to Stage 1 -13 24 1 12 -8 21 0 13
Transfer to Stage 2 38 -101 13 -50 51 -126 1 -74
Transfer to Stage 3 29 302 -1 268 -937 56 597 -805 -152
Provision at end of year -162 -250 -3 325 -3 737 -153 -339 -2 472 -2 964
Change in provision for expected credit losses, loans to the public
2019 2018
SEK m Stage 1 Stage 2 Stage 3 Total Stage 1 Stage 2 Stage 3 Total
Provision at beginning of year -149 -331 -2 472 -2 952 -254 -516 -4 499 -5 269
Derecognised assets 19 35 75 129 73 135 264 472
Write-offs 0 1 322 323 0 25 2 642 2 667
Remeasurements due to changes in credit risk -62 -166 42 -186 -59 -577 -29 -665
Changes due to update in the methodology for estimation 0 0 - 0 28 155 0 183
Foreign exchange effect, etc. -2 -4 -35 -41 -3 -20 -35 -58
Purchased or originated assets -19 -7 -3 -29 -29 -29 -11 -69
Transfer to Stage 1 -13 24 1 12 -8 20 0 12
Transfer to Stage 2 38 -100 13 -49 47 -121 1 -73
Transfer to Stage 3 29 301 -1 268 -938 56 597 -805 -152
Provision at end of year -159 -247 -3 325 -3 731 -149 -331 -2 472 -2 952
Change in provision for expected credit losses, off-balance sheet items that are subject to impairment testing
2019 2018
SEK m Stage 1 Stage 2 Stage 3 Total Stage 1 Stage 2 Stage 3 Total
Provision at beginning of year -36 -43 - -79 -67 -71 0 -138
Derecognised assets 5 7 - 12 9 13 0 22
Write-offs 0 0 - 0 - - - -
Remeasurements due to changes in credit risk -6 -1 -106 -113 6 -20 - -14
Changes due to update in the methodology for estimation 0 0 - 0 18 23 - 41
Foreign exchange effect, etc. 0 0 - 0 -1 -1 - -2
Purchased or originated assets -7 -8 - -15 -9 -1 - -10
Transfer to Stage 1 -2 5 - 3 -3 7 - 4
Transfer to Stage 2 7 -21 - -14 7 -20 - -13
Transfer to Stage 31 1 11 - 12 4 27 - 31
Provision at end of year -38 -50 -106 -194 -36 -43 - -79
1 Contingent liabilities and commitments classified in Stage 1 or 2 at the beginning of the year but which have been utilised at the end of the period are recorded as an asset on the balance
sheet on the reporting date. When such agreements are transferred to Stage 3, the reserved amount is recognised in the corresponding table for balance sheet items.
The change analysis shows the net effect on the provision for the Stage in question for each explanatory item during the period. The effect of derecognitions and write-offs is calculated on the
opening balance. The effect of revaluations due to changes in the methodology for estimation and foreign exchange effects, etc., is calculated before any transfer of the net amount between
Stages. Purchased or originated assets and amounts transferred between Stages are recognised after the effects of other explanatory items are taken into account. The transfer rows present
the effect on the provision for the stated Stage.
P10 Cont.
NOTES | PARENT COMPANY
HANDELSBANKEN | ANNUAL REPORT 2019 207
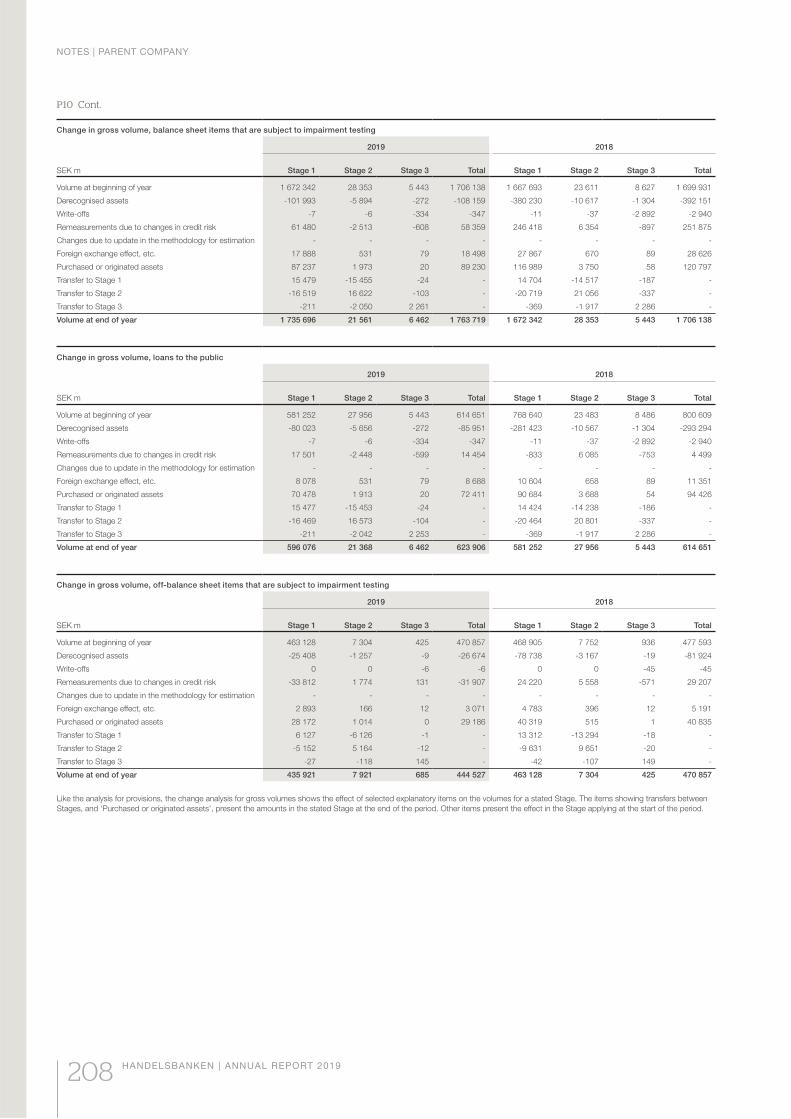
P10 Cont.
Change in gross volume, balance sheet items that are subject to impairment testing
2019 2018
SEK m Stage 1 Stage 2 Stage 3 Total Stage 1 Stage 2 Stage 3 Total
Volume at beginning of year 1 672 342 28 353 5 443 1 706 138 1 667 693 23 611 8 627 1 699 931
Derecognised assets -101 993 -5 894 -272 -108 159 -380 230 -10 617 -1 304 -392 151
Write-offs -7 -6 -334 -347 -11 -37 -2 892 -2 940
Remeasurements due to changes in credit risk 61 480 -2 513 -608 58 359 246 418 6 354 -897 251 875
Changes due to update in the methodology for estimation - - - - - - - -
Foreign exchange effect, etc. 17 888 531 79 18 498 27 867 670 89 28 626
Purchased or originated assets 87 237 1 973 20 89 230 116 989 3 750 58 120 797
Transfer to Stage 1 15 479 -15 455 -24 - 14 704 -14 517 -187 -
Transfer to Stage 2 -16 519 16 622 -103 - -20 719 21 056 -337 -
Transfer to Stage 3 -211 -2 050 2 261 - -369 -1 917 2 286 -
Volume at end of year 1 735 696 21 561 6 462 1 763 719 1 672 342 28 353 5 443 1 706 138
Change in gross volume, loans to the public
2019 2018
SEK m Stage 1 Stage 2 Stage 3 Total Stage 1 Stage 2 Stage 3 Total
Volume at beginning of year 581 252 27 956 5 443 614 651 768 640 23 483 8 486 800 609
Derecognised assets -80 023 -5 656 -272 -85 951 -281 423 -10 567 -1 304 -293 294
Write-offs -7 -6 -334 -347 -11 -37 -2 892 -2 940
Remeasurements due to changes in credit risk 17 501 -2 448 -599 14 454 -833 6 085 -753 4 499
Changes due to update in the methodology for estimation - - - - - - - -
Foreign exchange effect, etc. 8 078 531 79 8 688 10 604 658 89 11 351
Purchased or originated assets 70 478 1 913 20 72 411 90 684 3 688 54 94 426
Transfer to Stage 1 15 477 -15 453 -24 - 14 424 -14 238 -186 -
Transfer to Stage 2 -16 469 16 573 -104 - -20 464 20 801 -337 -
Transfer to Stage 3 -211 -2 042 2 253 - -369 -1 917 2 286 -
Volume at end of year 596 076 21 368 6 462 623 906 581 252 27 956 5 443 614 651
Change in gross volume, off-balance sheet items that are subject to impairment testing
2019 2018
SEK m Stage 1 Stage 2 Stage 3 Total Stage 1 Stage 2 Stage 3 Total
Volume at beginning of year 463 128 7 304 425 470 857 468 905 7 752 936 477 593
Derecognised assets -25 408 -1 257 -9 -26 674 -78 738 -3 167 -19 -81 924
Write-offs 0 0 -6 -6 0 0 -45 -45
Remeasurements due to changes in credit risk -33 812 1 774 131 -31 907 24 220 5 558 -571 29 207
Changes due to update in the methodology for estimation - - - - - - - -
Foreign exchange effect, etc. 2 893 166 12 3 071 4 783 396 12 5 191
Purchased or originated assets 28 172 1 014 0 29 186 40 319 515 1 40 835
Transfer to Stage 1 6 127 -6 126 -1 - 13 312 -13 294 -18 -
Transfer to Stage 2 -5 152 5 164 -12 - -9 631 9 651 -20 -
Transfer to Stage 3 -27 -118 145 - -42 -107 149 -
Volume at end of year 435 921 7 921 685 444 527 463 128 7 304 425 470 857
Like the analysis for provisions, the change analysis for gross volumes shows the effect of selected explanatory items on the volumes for a stated Stage. The items showing transfers between
Stages, and ‘Purchased or originated assets’, present the amounts in the stated Stage at the end of the period. Other items present the effect in the Stage applying at the start of the period.
NOTES | PARENT COMPANY
208 HANDELSBANKEN | ANNUAL REPORT 2019
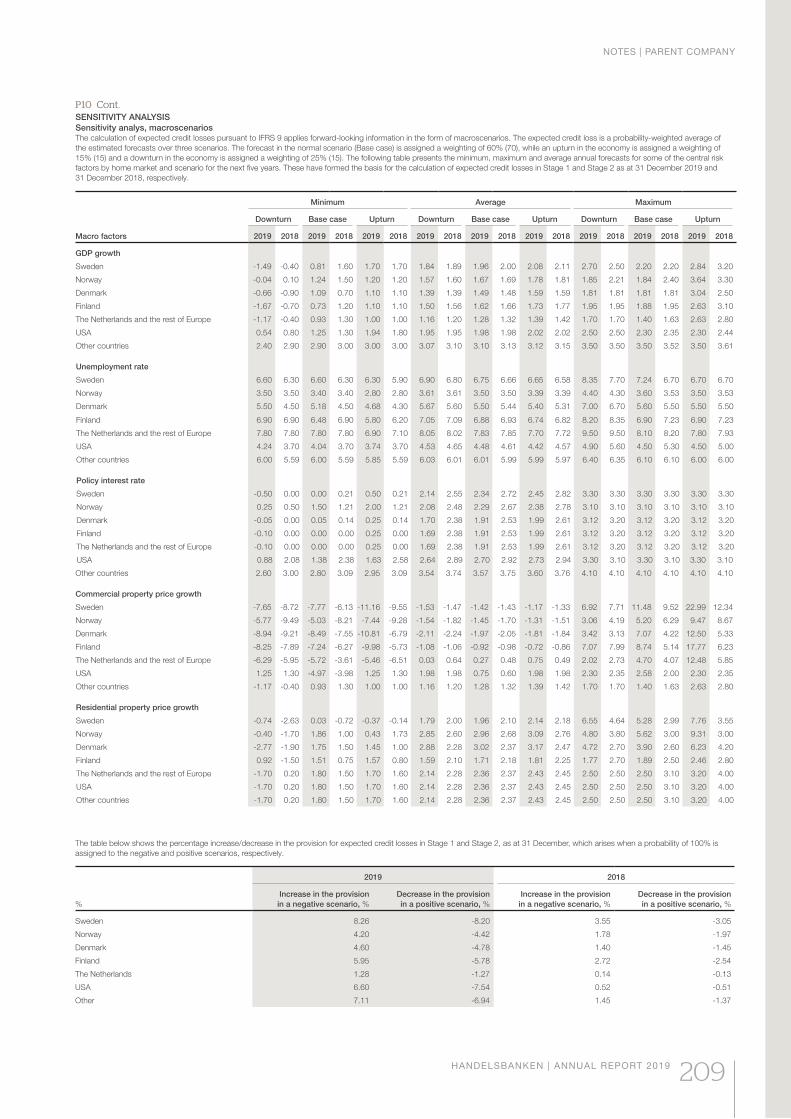
SENSITIVITY ANALYSIS
Sensitivity analys, macroscenariosThe calculation of expected credit losses pursuant to IFRS 9 applies forward-looking information in the form of macroscenarios. The expected credit loss is a probability-weighted average of
the estimated forecasts over three scenarios. The forecast in the normal scenario (Base case) is assigned a weighting of 60% (70), while an upturn in the economy is assigned a weighting of
15% (15) and a downturn in the economy is assigned a weighting of 25% (15). The following table presents the minimum, maximum and average annual forecasts for some of the central risk
factors by home market and scenario for the next five years. These have formed the basis for the calculation of expected credit losses in Stage 1 and Stage 2 as at 31 December 2019 and
31 December 2018, respectively.
Macro factors
Minimum Average Maximum
Downturn Base case Upturn Downturn Base case Upturn Downturn Base case Upturn
2019 2018 2019 2018 2019 2018 2019 2018 2019 2018 2019 2018 2019 2018 2019 2018 2019 2018
GDP growth
Sweden -1.49 -0.40 0.81 1.60 1.70 1.70 1.84 1.89 1.96 2.00 2.08 2.11 2.70 2.50 2.20 2.20 2.84 3.20
Norway -0.04 0.10 1.24 1.50 1.20 1.20 1.57 1.60 1.67 1.69 1.78 1.81 1.85 2.21 1.84 2.40 3.64 3.30
Denmark -0.66 -0.90 1.09 0.70 1.10 1.10 1.39 1.39 1.49 1.48 1.59 1.59 1.81 1.81 1.81 1.81 3.04 2.50
Finland -1.67 -0.70 0.73 1.20 1.10 1.10 1.50 1.56 1.62 1.66 1.73 1.77 1.95 1.95 1.88 1.95 2.63 3.10
The Netherlands and the rest of Europe -1.17 -0.40 0.93 1.30 1.00 1.00 1.16 1.20 1.28 1.32 1.39 1.42 1.70 1.70 1.40 1.63 2.63 2.80
USA 0.54 0.80 1.25 1.30 1.94 1.80 1.95 1.95 1.98 1.98 2.02 2.02 2.50 2.50 2.30 2.35 2.30 2.44
Other countries 2.40 2.90 2.90 3.00 3.00 3.00 3.07 3.10 3.10 3.13 3.12 3.15 3.50 3.50 3.50 3.52 3.50 3.61
Unemployment rate
Sweden 6.60 6.30 6.60 6.30 6.30 5.90 6.90 6.80 6.75 6.66 6.65 6.58 8.35 7.70 7.24 6.70 6.70 6.70
Norway 3.50 3.50 3.40 3.40 2.80 2.80 3.61 3.61 3.50 3.50 3.39 3.39 4.40 4.30 3.60 3.53 3.50 3.53
Denmark 5.50 4.50 5.18 4.50 4.68 4.30 5.67 5.60 5.50 5.44 5.40 5.31 7.00 6.70 5.60 5.50 5.50 5.50
Finland 6.90 6.90 6.48 6.90 5.80 6.20 7.05 7.09 6.88 6.93 6.74 6.82 8.20 8.35 6.90 7.23 6.90 7.23
The Netherlands and the rest of Europe 7.80 7.80 7.80 7.80 6.90 7.10 8.05 8.02 7.83 7.85 7.70 7.72 9.50 9.50 8.10 8.20 7.80 7.93
USA 4.24 3.70 4.04 3.70 3.74 3.70 4.53 4.65 4.48 4.61 4.42 4.57 4.90 5.60 4.50 5.30 4.50 5.00
Other countries 6.00 5.59 6.00 5.59 5.85 5.59 6.03 6.01 6.01 5.99 5.99 5.97 6.40 6.35 6.10 6.10 6.00 6.00
Policy interest rate
Sweden -0.50 0.00 0.00 0.21 0.50 0.21 2.14 2.55 2.34 2.72 2.45 2.82 3.30 3.30 3.30 3.30 3.30 3.30
Norway 0.25 0.50 1.50 1.21 2.00 1.21 2.08 2.48 2.29 2.67 2.38 2.78 3.10 3.10 3.10 3.10 3.10 3.10
Denmark -0.05 0.00 0.05 0.14 0.25 0.14 1.70 2.38 1.91 2.53 1.99 2.61 3.12 3.20 3.12 3.20 3.12 3.20
Finland -0.10 0.00 0.00 0.00 0.25 0.00 1.69 2.38 1.91 2.53 1.99 2.61 3.12 3.20 3.12 3.20 3.12 3.20
The Netherlands and the rest of Europe -0.10 0.00 0.00 0.00 0.25 0.00 1.69 2.38 1.91 2.53 1.99 2.61 3.12 3.20 3.12 3.20 3.12 3.20
USA 0.88 2.08 1.38 2.38 1.63 2.58 2.64 2.89 2.70 2.92 2.73 2.94 3.30 3.10 3.30 3.10 3.30 3.10
Other countries 2.60 3.00 2.80 3.09 2.95 3.09 3.54 3.74 3.57 3.75 3.60 3.76 4.10 4.10 4.10 4.10 4.10 4.10
Commercial property price growth
Sweden -7.65 -8.72 -7.77 -6.13 -11.16 -9.55 -1.53 -1.47 -1.42 -1.43 -1.17 -1.33 6.92 7.71 11.48 9.52 22.99 12.34
Norway -5.77 -9.49 -5.03 -8.21 -7.44 -9.28 -1.54 -1.82 -1.45 -1.70 -1.31 -1.51 3.06 4.19 5.20 6.29 9.47 8.67
Denmark -8.94 -9.21 -8.49 -7.55 -10.81 -6.79 -2.11 -2.24 -1.97 -2.05 -1.81 -1.84 3.42 3.13 7.07 4.22 12.50 5.33
Finland -8.25 -7.89 -7.24 -6.27 -9.98 -5.73 -1.08 -1.06 -0.92 -0.98 -0.72 -0.86 7.07 7.99 8.74 5.14 17.77 6.23
The Netherlands and the rest of Europe -6.29 -5.95 -5.72 -3.61 -5.46 -6.51 0.03 0.64 0.27 0.48 0.75 0.49 2.02 2.73 4.70 4.07 12.48 5.85
USA 1.25 1.30 -4.97 -3.98 1.25 1.30 1.98 1.98 0.75 0.60 1.98 1.98 2.30 2.35 2.58 2.00 2.30 2.35
Other countries -1.17 -0.40 0.93 1.30 1.00 1.00 1.16 1.20 1.28 1.32 1.39 1.42 1.70 1.70 1.40 1.63 2.63 2.80
Residential property price growth
Sweden -0.74 -2.63 0.03 -0.72 -0.37 -0.14 1.79 2.00 1.96 2.10 2.14 2.18 6.55 4.64 5.28 2.99 7.76 3.55
Norway -0.40 -1.70 1.86 1.00 0.43 1.73 2.85 2.60 2.96 2.68 3.09 2.76 4.80 3.80 5.62 3.00 9.31 3.00
Denmark -2.77 -1.90 1.75 1.50 1.45 1.00 2.88 2.28 3.02 2.37 3.17 2.47 4.72 2.70 3.90 2.60 6.23 4.20
Finland 0.92 -1.50 1.51 0.75 1.57 0.80 1.59 2.10 1.71 2.18 1.81 2.25 1.77 2.70 1.89 2.50 2.46 2.80
The Netherlands and the rest of Europe -1.70 0.20 1.80 1.50 1.70 1.60 2.14 2.28 2.36 2.37 2.43 2.45 2.50 2.50 2.50 3.10 3.20 4.00
USA -1.70 0.20 1.80 1.50 1.70 1.60 2.14 2.28 2.36 2.37 2.43 2.45 2.50 2.50 2.50 3.10 3.20 4.00
Other countries -1.70 0.20 1.80 1.50 1.70 1.60 2.14 2.28 2.36 2.37 2.43 2.45 2.50 2.50 2.50 3.10 3.20 4.00
P10 Cont.
The table below shows the percentage increase/decrease in the provision for expected credit losses in Stage 1 and Stage 2, as at 31 December, which arises when a probability of 100% is
assigned to the negative and positive scenarios, respectively.
2019 2018
%
Increase in the provision
in a negative scenario, %
Decrease in the provision
in a positive scenario, %
Increase in the provision
in a negative scenario, %
Decrease in the provision
in a positive scenario, %
Sweden 8.26 -8.20 3.55 -3.05
Norway 4.20 -4.42 1.78 -1.97
Denmark 4.60 -4.78 1.40 -1.45
Finland 5.95 -5.78 2.72 -2.54
The Netherlands 1.28 -1.27 0.14 -0.13
USA 6.60 -7.54 0.52 -0.51
Other 7.11 -6.94 1.45 -1.37
NOTES | PARENT COMPANY
HANDELSBANKEN | ANNUAL REPORT 2019 209
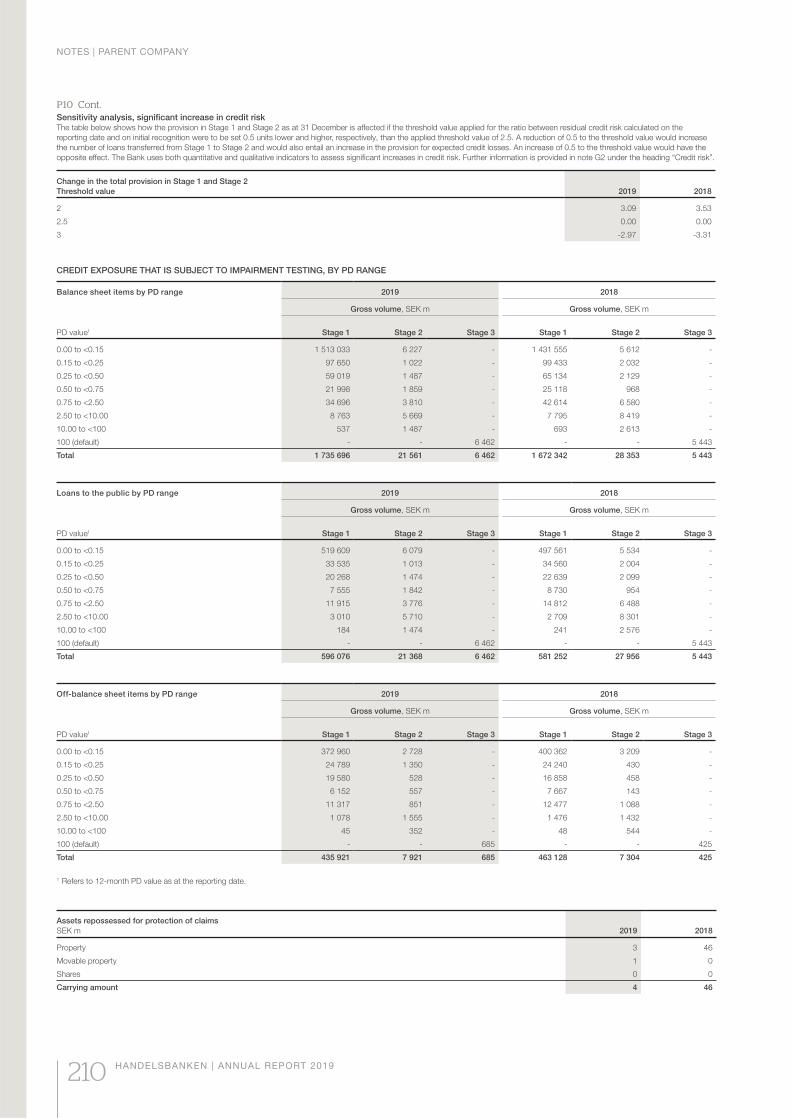
P10 Cont.Sensitivity analysis, significant increase in credit riskThe table below shows how the provision in Stage 1 and Stage 2 as at 31 December is affected if the threshold value applied for the ratio between residual credit risk calculated on the
reporting date and on initial recognition were to be set 0.5 units lower and higher, respectively, than the applied threshold value of 2.5. A reduction of 0.5 to the threshold value would increase
the number of loans transferred from Stage 1 to Stage 2 and would also entail an increase in the provision for expected credit losses. An increase of 0.5 to the threshold value would have the
opposite effect. The Bank uses both quantitative and qualitative indicators to assess significant increases in credit risk. Further information is provided in note G2 under the heading “Credit risk”.
Change in the total provision in Stage 1 and Stage 2
Threshold value 2019 2018
2 3.09 3.53
2.5 0.00 0.00
3 -2.97 -3.31
Assets repossessed for protection of claims
SEK m 2019 2018
Property 3 46
Movable property 1 0
Shares 0 0
Carrying amount 4 46
CREDIT EXPOSURE THAT IS SUBJECT TO IMPAIRMENT TESTING, BY PD RANGE
Balance sheet items by PD range 2019 2018
Gross volume, SEK m Gross volume, SEK m
PD value1 Stage 1 Stage 2 Stage 3 Stage 1 Stage 2 Stage 3
0.00 to <0.15 1 513 033 6 227 - 1 431 555 5 612 -
0.15 to <0.25 97 650 1 022 - 99 433 2 032 -
0.25 to <0.50 59 019 1 487 - 65 134 2 129 -
0.50 to <0.75 21 998 1 859 - 25 118 968 -
0.75 to <2.50 34 696 3 810 - 42 614 6 580 -
2.50 to <10.00 8 763 5 669 - 7 795 8 419 -
10.00 to <100 537 1 487 - 693 2 613 -
100 (default) - - 6 462 - - 5 443
Total 1 735 696 21 561 6 462 1 672 342 28 353 5 443
Loans to the public by PD range 2019 2018
Gross volume, SEK m Gross volume, SEK m
PD value1 Stage 1 Stage 2 Stage 3 Stage 1 Stage 2 Stage 3
0.00 to <0.15 519 609 6 079 - 497 561 5 534 -
0.15 to <0.25 33 535 1 013 - 34 560 2 004 -
0.25 to <0.50 20 268 1 474 - 22 639 2 099 -
0.50 to <0.75 7 555 1 842 - 8 730 954 -
0.75 to <2.50 11 915 3 776 - 14 812 6 488 -
2.50 to <10.00 3 010 5 710 - 2 709 8 301 -
10.00 to <100 184 1 474 - 241 2 576 -
100 (default) - - 6 462 - - 5 443
Total 596 076 21 368 6 462 581 252 27 956 5 443
Off-balance sheet items by PD range 2019 2018
Gross volume, SEK m Gross volume, SEK m
PD value1 Stage 1 Stage 2 Stage 3 Stage 1 Stage 2 Stage 3
0.00 to <0.15 372 960 2 728 - 400 362 3 209 -
0.15 to <0.25 24 789 1 350 - 24 240 430 -
0.25 to <0.50 19 580 528 - 16 858 458 -
0.50 to <0.75 6 152 557 - 7 667 143 -
0.75 to <2.50 11 317 851 - 12 477 1 088 -
2.50 to <10.00 1 078 1 555 - 1 476 1 432 -
10.00 to <100 45 352 - 48 544 -
100 (default) - - 685 - - 425
Total 435 921 7 921 685 463 128 7 304 425
1 Refers to 12-month PD value as at the reporting date.
NOTES | PARENT COMPANY
210 HANDELSBANKEN | ANNUAL REPORT 2019
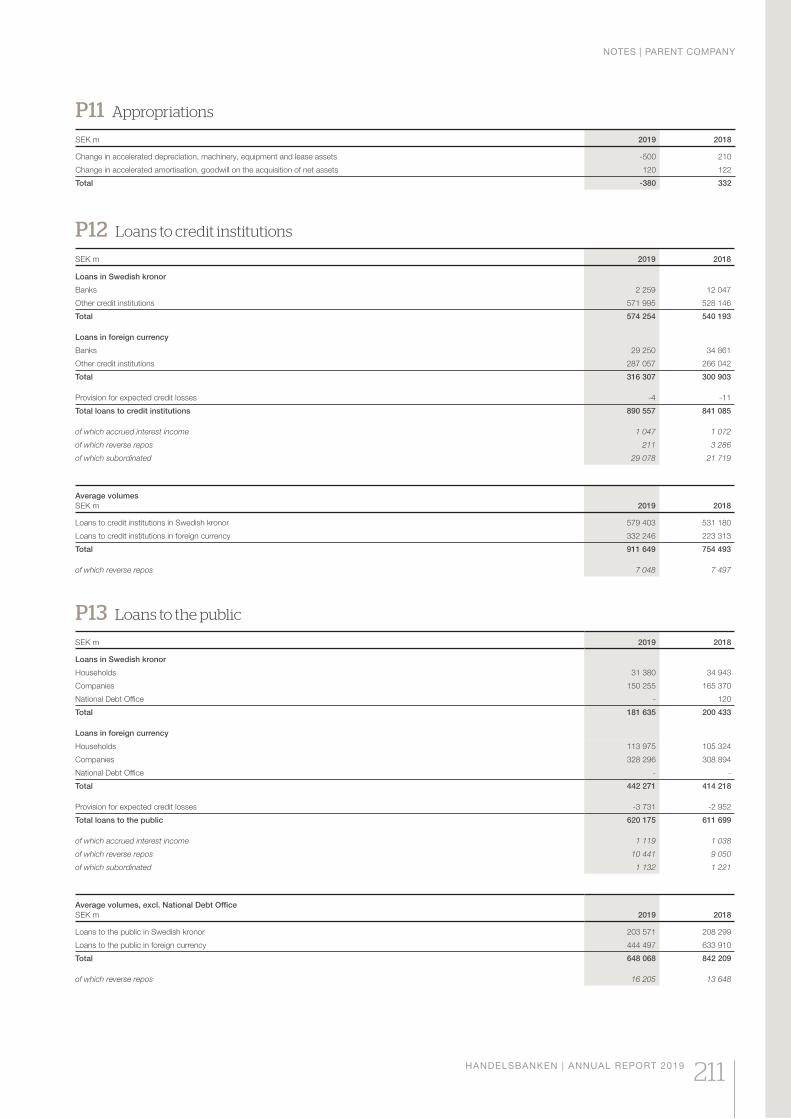
P13 Loans to the public
SEK m 2019 2018
Loans in Swedish kronor
Households 31 380 34 943
Companies 150 255 165 370
National Debt Office - 120
Total 181 635 200 433
Loans in foreign currency
Households 113 975 105 324
Companies 328 296 308 894
National Debt Office - -
Total 442 271 414 218
Provision for expected credit losses -3 731 -2 952
Total loans to the public 620 175 611 699
of which accrued interest income 1 119 1 038
of which reverse repos 10 441 9 050
of which subordinated 1 132 1 221
Average volumes, excl. National Debt Office
SEK m 2019 2018
Loans to the public in Swedish kronor 203 571 208 299
Loans to the public in foreign currency 444 497 633 910
Total 648 068 842 209
of which reverse repos 16 205 13 648
P12 Loans to credit institutions
SEK m 2019 2018
Loans in Swedish kronor
Banks 2 259 12 047
Other credit institutions 571 995 528 146
Total 574 254 540 193
Loans in foreign currency
Banks 29 250 34 861
Other credit institutions 287 057 266 042
Total 316 307 300 903
Provision for expected credit losses -4 -11
Total loans to credit institutions 890 557 841 085
of which accrued interest income 1 047 1 072
of which reverse repos 211 3 286
of which subordinated 29 078 21 719
Average volumes
SEK m 2019 2018
Loans to credit institutions in Swedish kronor 579 403 531 180
Loans to credit institutions in foreign currency 332 246 223 313
Total 911 649 754 493
of which reverse repos 7 048 7 497
P11 Appropriations
SEK m 2019 2018
Change in accelerated depreciation, machinery, equipment and lease assets -500 210
Change in accelerated amortisation, goodwill on the acquisition of net assets 120 122
Total -380 332
NOTES | PARENT COMPANY
HANDELSBANKEN | ANNUAL REPORT 2019 211
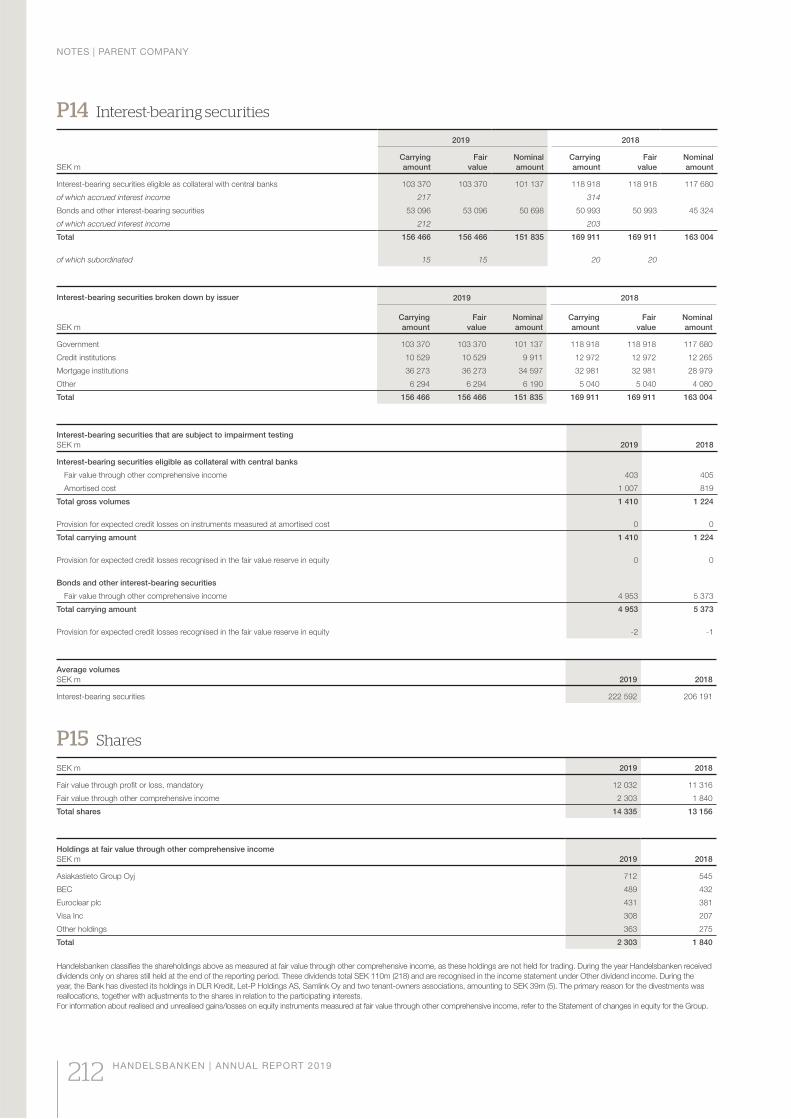
P14 Interest-bearing securities
SEK m
2019 2018
Carrying
amount
Fair
value
Nominal
amount
Carrying
amount
Fair
value
Nominal
amount
Interest-bearing securities eligible as collateral with central banks 103 370 103 370 101 137 118 918 118 918 117 680
of which accrued interest income 217 314
Bonds and other interest-bearing securities 53 096 53 096 50 698 50 993 50 993 45 324
of which accrued interest income 212 203
Total 156 466 156 466 151 835 169 911 169 911 163 004
of which subordinated 15 15 20 20
Interest-bearing securities broken down by issuer
SEK m
2019 2018
Carrying
amount
Fair
value
Nominal
amount
Carrying
amount
Fair
value
Nominal
amount
Government 103 370 103 370 101 137 118 918 118 918 117 680
Credit institutions 10 529 10 529 9 911 12 972 12 972 12 265
Mortgage institutions 36 273 36 273 34 597 32 981 32 981 28 979
Other 6 294 6 294 6 190 5 040 5 040 4 080
Total 156 466 156 466 151 835 169 911 169 911 163 004
Interest-bearing securities that are subject to impairment testing
SEK m 2019 2018
Interest-bearing securities eligible as collateral with central banks
Fair value through other comprehensive income 403 405
Amortised cost 1 007 819
Total gross volumes 1 410 1 224
Provision for expected credit losses on instruments measured at amortised cost 0 0
Total carrying amount 1 410 1 224
Provision for expected credit losses recognised in the fair value reserve in equity 0 0
Bonds and other interest-bearing securities
Fair value through other comprehensive income 4 953 5 373
Total carrying amount 4 953 5 373
Provision for expected credit losses recognised in the fair value reserve in equity -2 -1
Average volumes
SEK m 2019 2018
Interest-bearing securities 222 592 206 191
P15 Shares
SEK m 2019 2018
Fair value through profit or loss, mandatory 12 032 11 316
Fair value through other comprehensive income 2 303 1 840
Total shares 14 335 13 156
Holdings at fair value through other comprehensive income
SEK m 2019 2018
Asiakastieto Group Oyj 712 545
BEC 489 432
Euroclear plc 431 381
Visa Inc 308 207
Other holdings 363 275
Total 2 303 1 840
Handelsbanken classifies the shareholdings above as measured at fair value through other comprehensive income, as these holdings are not held for trading. During the year Handelsbanken received
dividends only on shares still held at the end of the reporting period. These dividends total SEK 110m (218) and are recognised in the income statement under Other dividend income. During the
year, the Bank has divested its holdings in DLR Kredit, Let-P Holdings AS, Samlink Oy and two tenant-owners associations, amounting to SEK 39m (5). The primary reason for the divestments was
reallocations, together with adjustments to the shares in relation to the participating interests.
For information about realised and unrealised gains/losses on equity instruments measured at fair value through other comprehensive income, refer to the Statement of changes in equity for the Group.
NOTES | PARENT COMPANY
212 HANDELSBANKEN | ANNUAL REPORT 2019
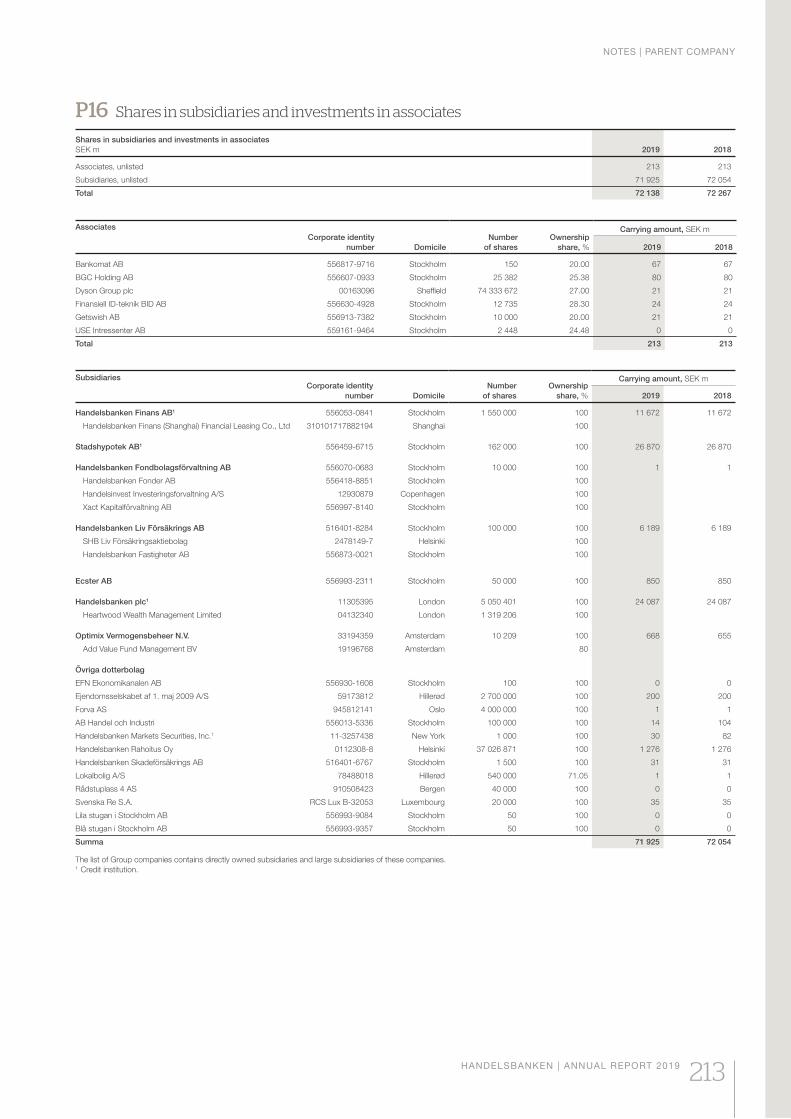
P16 Shares in subsidiaries and investments in associates
Shares in subsidiaries and investments in associates
SEK m 2019 2018
Associates, unlisted 213 213
Subsidiaries, unlisted 71 925 72 054
Total 72 138 72 267
Associates
Corporate identity
number Domicile
Number
of shares
Ownership
share, %
Carrying amount, SEK m
2019 2018
Bankomat AB 556817-9716 Stockholm 150 20.00 67 67
BGC Holding AB 556607-0933 Stockholm 25 382 25.38 80 80
Dyson Group plc 00163096 Sheffield 74 333 672 27.00 21 21
Finansiell ID-teknik BID AB 556630-4928 Stockholm 12 735 28.30 24 24
Getswish AB 556913-7382 Stockholm 10 000 20.00 21 21
USE Intressenter AB 559161-9464 Stockholm 2 448 24.48 0 0
Total 213 213
SubsidiariesCorporate identity
number Domicile
Number
of shares
Ownership
share, %
Carrying amount, SEK m
2019 2018
Handelsbanken Finans AB1 556053-0841 Stockholm 1 550 000 100 11 672 11 672
Handelsbanken Finans (Shanghai) Financial Leasing Co., Ltd 310101717882194 Shanghai 100
Stadshypotek AB1 556459-6715 Stockholm 162 000 100 26 870 26 870
Handelsbanken Fondbolagsförvaltning AB 556070-0683 Stockholm 10 000 100 1 1
Handelsbanken Fonder AB 556418-8851 Stockholm 100
Handelsinvest Investeringsforvaltning A/S 12930879 Copenhagen 100
Xact Kapitalförvaltning AB 556997-8140 Stockholm 100
Handelsbanken Liv Försäkrings AB 516401-8284 Stockholm 100 000 100 6 189 6 189
SHB Liv Försäkringsaktiebolag 2478149-7 Helsinki 100
Handelsbanken Fastigheter AB 556873-0021 Stockholm 100
Ecster AB 556993-2311 Stockholm 50 000 100 850 850
Handelsbanken plc1 11305395 London 5 050 401 100 24 087 24 087
Heartwood Wealth Management Limited 04132340 London 1 319 206 100
Optimix Vermogensbeheer N.V. 33194359 Amsterdam 10 209 100 668 655
Add Value Fund Management BV 19196768 Amsterdam 80
Övriga dotterbolag
EFN Ekonomikanalen AB 556930-1608 Stockholm 100 100 0 0
Ejendomsselskabet af 1. maj 2009 A/S 59173812 Hillerød 2 700 000 100 200 200
Forva AS 945812141 Oslo 4 000 000 100 1 1
AB Handel och Industri 556013-5336 Stockholm 100 000 100 14 104
Handelsbanken Markets Securities, Inc.1 11-3257438 New York 1 000 100 30 82
Handelsbanken Rahoitus Oy 0112308-8 Helsinki 37 026 871 100 1 276 1 276
Handelsbanken Skadeförsäkrings AB 516401-6767 Stockholm 1 500 100 31 31
Lokalbolig A/S 78488018 Hillerød 540 000 71.05 1 1
Rådstuplass 4 AS 910508423 Bergen 40 000 100 0 0
Svenska Re S.A. RCS Lux B-32053 Luxembourg 20 000 100 35 35
Lila stugan i Stockholm AB 556993-9084 Stockholm 50 100 0 0
Blå stugan i Stockholm AB 556993-9357 Stockholm 50 100 0 0
Summa 71 925 72 054
The list of Group companies contains directly owned subsidiaries and large subsidiaries of these companies.1 Credit institution.
NOTES | PARENT COMPANY
HANDELSBANKEN | ANNUAL REPORT 2019 213
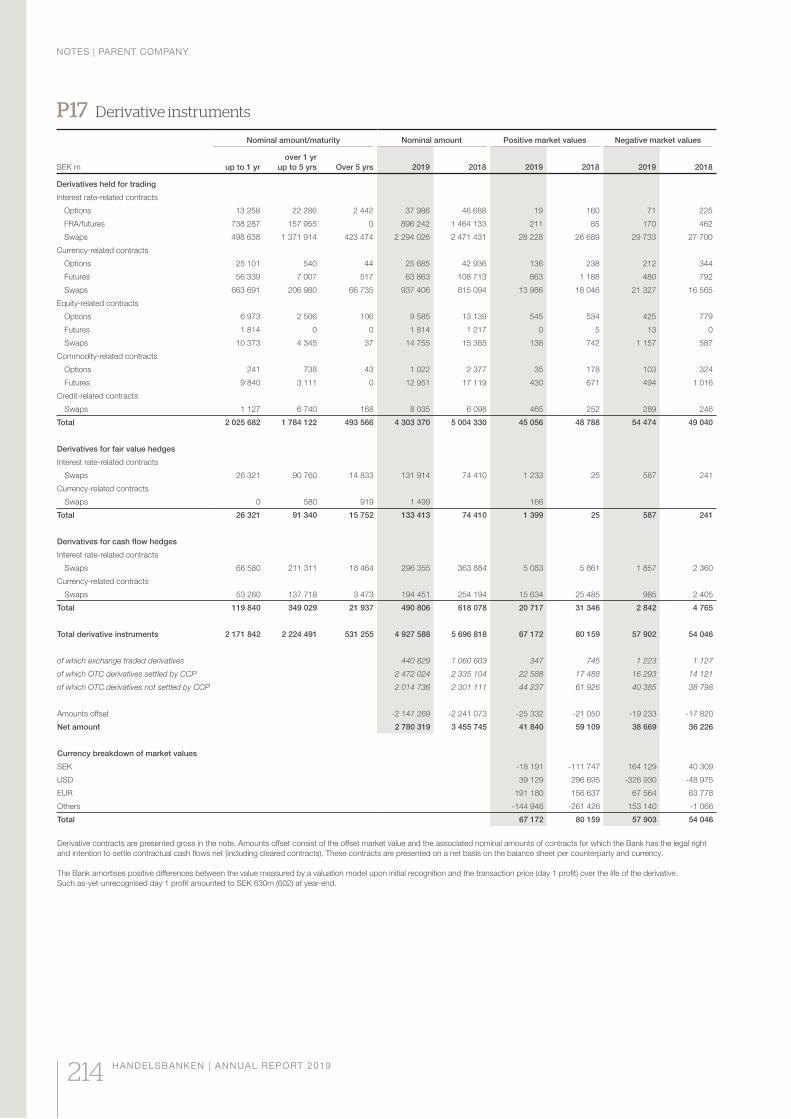
P17 Derivative instruments
SEK m
Nominal amount/maturity Nominal amount Positive market values Negative market values
up to 1 yr
over 1 yr
up to 5 yrs Over 5 yrs 2019 2018 2019 2018 2019 2018
Derivatives held for trading
Interest rate-related contracts
Options 13 258 22 286 2 442 37 986 46 688 19 160 71 225
FRA/futures 738 287 157 955 0 896 242 1 464 133 211 85 170 462
Swaps 498 638 1 371 914 423 474 2 294 026 2 471 431 28 228 26 689 29 733 27 700
Currency-related contracts
Options 25 101 540 44 25 685 42 936 136 238 212 344
Futures 56 339 7 007 517 63 863 108 713 863 1 188 480 792
Swaps 663 691 206 980 66 735 937 406 815 094 13 986 18 046 21 327 16 565
Equity-related contracts
Options 6 973 2 506 106 9 585 13 139 545 534 425 779
Futures 1 814 0 0 1 814 1 217 0 5 13 0
Swaps 10 373 4 345 37 14 755 15 385 138 742 1 157 587
Commodity-related contracts
Options 241 738 43 1 022 2 377 35 178 103 324
Futures 9 840 3 111 0 12 951 17 119 430 671 494 1 016
Credit-related contracts
Swaps 1 127 6 740 168 8 035 6 098 465 252 289 246
Total 2 025 682 1 784 122 493 566 4 303 370 5 004 330 45 056 48 788 54 474 49 040
Derivatives for fair value hedges
Interest rate-related contracts
Swaps 26 321 90 760 14 833 131 914 74 410 1 233 25 587 241
Currency-related contracts
Swaps 0 580 919 1 499 166
Total 26 321 91 340 15 752 133 413 74 410 1 399 25 587 241
Derivatives for cash flow hedges
Interest rate-related contracts
Swaps 66 580 211 311 18 464 296 355 363 884 5 083 5 861 1 857 2 360
Currency-related contracts
Swaps 53 260 137 718 3 473 194 451 254 194 15 634 25 485 985 2 405
Total 119 840 349 029 21 937 490 806 618 078 20 717 31 346 2 842 4 765
Total derivative instruments 2 171 842 2 224 491 531 255 4 927 588 5 696 818 67 172 80 159 57 902 54 046
of which exchange traded derivatives 440 829 1 060 603 347 745 1 223 1 127
of which OTC derivatives settled by CCP 2 472 024 2 335 104 22 588 17 488 16 293 14 121
of which OTC derivatives not settled by CCP 2 014 736 2 301 111 44 237 61 926 40 385 38 798
Amounts offset -2 147 269 -2 241 073 -25 332 -21 050 -19 233 -17 820
Net amount 2 780 319 3 455 745 41 840 59 109 38 669 36 226
Currency breakdown of market values
SEK -18 191 -111 747 164 129 40 309
USD 39 129 296 695 -326 930 -48 975
EUR 191 180 156 637 67 564 63 778
Others -144 946 -261 426 153 140 -1 066
Total 67 172 80 159 57 903 54 046
Derivative contracts are presented gross in the note. Amounts offset consist of the offset market value and the associated nominal amounts of contracts for which the Bank has the legal right
and intention to settle contractual cash flows net (including cleared contracts). These contracts are presented on a net basis on the balance sheet per counterparty and currency.
The Bank amortises positive differences between the value measured by a valuation model upon initial recognition and the transaction price (day 1 profit) over the life of the derivative.
Such as-yet-unrecognised day 1 profit amounted to SEK 630m (602) at year-end.
NOTES | PARENT COMPANY
214 HANDELSBANKEN | ANNUAL REPORT 2019
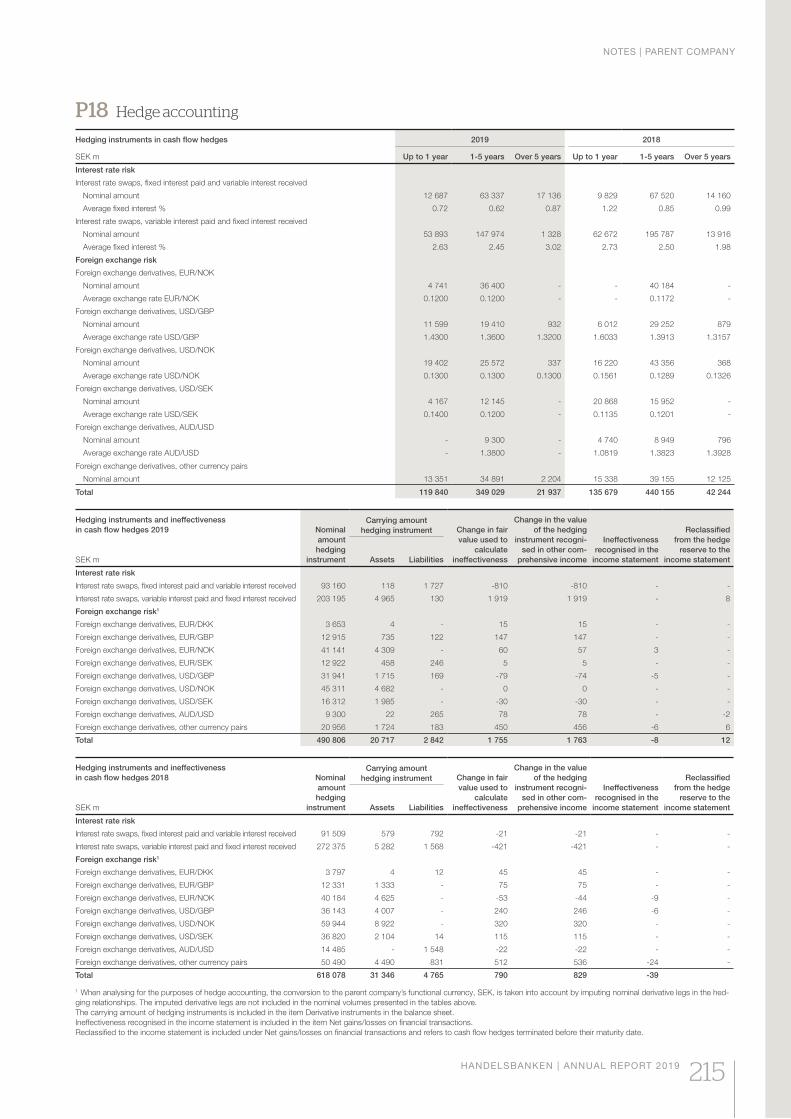
P18 Hedge accounting
Hedging instruments in cash flow hedges 2019 2018
SEK m Up to 1 year 1-5 years Over 5 years Up to 1 year 1-5 years Over 5 years
Interest rate risk
Interest rate swaps, fixed interest paid and variable interest received
Nominal amount 12 687 63 337 17 136 9 829 67 520 14 160
Average fixed interest % 0.72 0.62 0.87 1.22 0.85 0.99
Interest rate swaps, variable interest paid and fixed interest received
Nominal amount 53 893 147 974 1 328 62 672 195 787 13 916
Average fixed interest % 2.63 2.45 3.02 2.73 2.50 1.98
Foreign exchange risk
Foreign exchange derivatives, EUR/NOK
Nominal amount 4 741 36 400 - - 40 184 -
Average exchange rate EUR/NOK 0.1200 0.1200 - - 0.1172 -
Foreign exchange derivatives, USD/GBP
Nominal amount 11 599 19 410 932 6 012 29 252 879
Average exchange rate USD/GBP 1.4300 1.3600 1.3200 1.6033 1.3913 1.3157
Foreign exchange derivatives, USD/NOK
Nominal amount 19 402 25 572 337 16 220 43 356 368
Average exchange rate USD/NOK 0.1300 0.1300 0.1300 0.1561 0.1289 0.1326
Foreign exchange derivatives, USD/SEK
Nominal amount 4 167 12 145 - 20 868 15 952 -
Average exchange rate USD/SEK 0.1400 0.1200 - 0.1135 0.1201 -
Foreign exchange derivatives, AUD/USD
Nominal amount - 9 300 - 4 740 8 949 796
Average exchange rate AUD/USD - 1.3800 - 1.0819 1.3823 1.3928
Foreign exchange derivatives, other currency pairs
Nominal amount 13 351 34 891 2 204 15 338 39 155 12 125
Total 119 840 349 029 21 937 135 679 440 155 42 244
Hedging instruments and ineffectiveness
in cash flow hedges 2019
SEK m
Nominal
amount
hedging
instrument
Carrying amount
hedging instrument Change in fair
value used to
calculate
ineffectiveness
Change in the value
of the hedging
instrument recogni-
sed in other com-
prehensive income
Ineffectiveness
recognised in the
income statement
Reclassified
from the hedge
reserve to the
income statementAssets Liabilities
Interest rate risk
Interest rate swaps, fixed interest paid and variable interest received 93 160 118 1 727 -810 -810 - -
Interest rate swaps, variable interest paid and fixed interest received 203 195 4 965 130 1 919 1 919 - 8
Foreign exchange risk1
Foreign exchange derivatives, EUR/DKK 3 653 4 - 15 15 - -
Foreign exchange derivatives, EUR/GBP 12 915 735 122 147 147 - -
Foreign exchange derivatives, EUR/NOK 41 141 4 309 - 60 57 3 -
Foreign exchange derivatives, EUR/SEK 12 922 458 246 5 5 - -
Foreign exchange derivatives, USD/GBP 31 941 1 715 169 -79 -74 -5 -
Foreign exchange derivatives, USD/NOK 45 311 4 682 - 0 0 - -
Foreign exchange derivatives, USD/SEK 16 312 1 985 - -30 -30 - -
Foreign exchange derivatives, AUD/USD 9 300 22 265 78 78 - -2
Foreign exchange derivatives, other currency pairs 20 956 1 724 183 450 456 -6 6
Total 490 806 20 717 2 842 1 755 1 763 -8 12
Hedging instruments and ineffectiveness
in cash flow hedges 2018
SEK m
Nominal
amount
hedging
instrument
Carrying amount
hedging instrument Change in fair
value used to
calculate
ineffectiveness
Change in the value
of the hedging
instrument recogni-
sed in other com-
prehensive income
Ineffectiveness
recognised in the
income statement
Reclassified
from the hedge
reserve to the
income statementAssets Liabilities
Interest rate risk
Interest rate swaps, fixed interest paid and variable interest received 91 509 579 792 -21 -21 - -
Interest rate swaps, variable interest paid and fixed interest received 272 375 5 282 1 568 -421 -421 - -
Foreign exchange risk1
Foreign exchange derivatives, EUR/DKK 3 797 4 12 45 45 - -
Foreign exchange derivatives, EUR/GBP 12 331 1 333 - 75 75 - -
Foreign exchange derivatives, EUR/NOK 40 184 4 625 - -53 -44 -9 -
Foreign exchange derivatives, USD/GBP 36 143 4 007 - 240 246 -6 -
Foreign exchange derivatives, USD/NOK 59 944 8 922 - 320 320 - -
Foreign exchange derivatives, USD/SEK 36 820 2 104 14 115 115 - -
Foreign exchange derivatives, AUD/USD 14 485 - 1 548 -22 -22 - -
Foreign exchange derivatives, other currency pairs 50 490 4 490 831 512 536 -24 -
Total 618 078 31 346 4 765 790 829 -39
1 When analysing for the purposes of hedge accounting, the conversion to the parent company’s functional currency, SEK, is taken into account by imputing nominal derivative legs in the hed-
ging relationships. The imputed derivative legs are not included in the nominal volumes presented in the tables above.
The carrying amount of hedging instruments is included in the item Derivative instruments in the balance sheet.
Ineffectiveness recognised in the income statement is included in the item Net gains/losses on financial transactions.
Reclassified to the income statement is included under Net gains/losses on financial transactions and refers to cash flow hedges terminated before their maturity date.
NOTES | PARENT COMPANY
HANDELSBANKEN | ANNUAL REPORT 2019 215
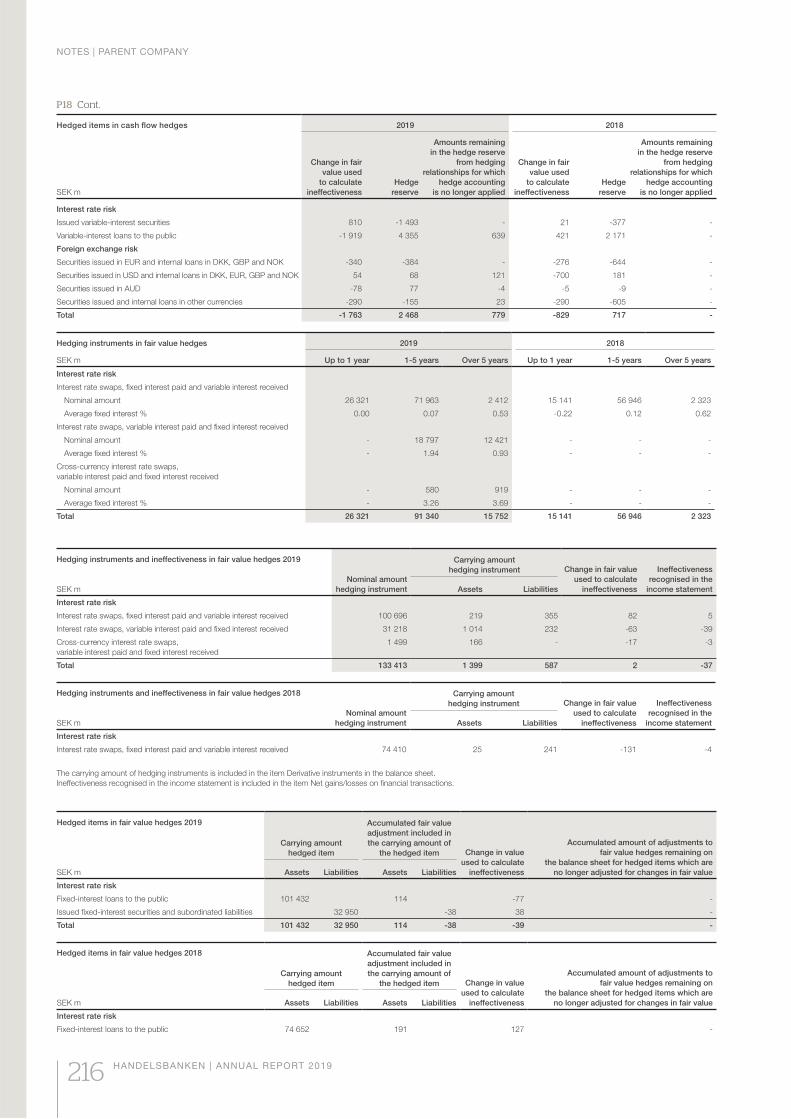
Hedged items in cash flow hedges 2019 2018
SEK m
Change in fair
value used
to calculate
ineffectiveness
Hedge
reserve
Amounts remaining
in the hedge reserve
from hedging
relationships for which
hedge accounting
is no longer applied
Change in fair
value used
to calculate
ineffectiveness
Hedge
reserve
Amounts remaining
in the hedge reserve
from hedging
relationships for which
hedge accounting
is no longer applied
Interest rate risk
Issued variable-interest securities 810 -1 493 - 21 -377 -
Variable-interest loans to the public -1 919 4 355 639 421 2 171 -
Foreign exchange risk
Securities issued in EUR and internal loans in DKK, GBP and NOK -340 -384 - -276 -644 -
Securities issued in USD and internal loans in DKK, EUR, GBP and NOK 54 68 121 -700 181 -
Securities issued in AUD -78 77 -4 -5 -9 -
Securities issued and internal loans in other currencies -290 -155 23 -290 -605 -
Total -1 763 2 468 779 -829 717 -
Hedging instruments in fair value hedges 2019 2018
SEK m Up to 1 year 1-5 years Over 5 years Up to 1 year 1-5 years Over 5 years
Interest rate risk
Interest rate swaps, fixed interest paid and variable interest received
Nominal amount 26 321 71 963 2 412 15 141 56 946 2 323
Average fixed interest % 0.00 0.07 0.53 -0.22 0.12 0.62
Interest rate swaps, variable interest paid and fixed interest received
Nominal amount - 18 797 12 421 - - -
Average fixed interest % - 1.94 0.93 - - -
Cross-currency interest rate swaps,
variable interest paid and fixed interest received
Nominal amount - 580 919 - - -
Average fixed interest % - 3.26 3.69 - - -
Total 26 321 91 340 15 752 15 141 56 946 2 323
Hedging instruments and ineffectiveness in fair value hedges 2019
SEK m
Nominal amount
hedging instrument
Carrying amount
hedging instrument Change in fair value
used to calculate
ineffectiveness
Ineffectiveness
recognised in the
income statementAssets Liabilities
Interest rate risk
Interest rate swaps, fixed interest paid and variable interest received 100 696 219 355 82 5
Interest rate swaps, variable interest paid and fixed interest received 31 218 1 014 232 -63 -39
Cross-currency interest rate swaps,
variable interest paid and fixed interest received
1 499 166 - -17 -3
Total 133 413 1 399 587 2 -37
Hedging instruments and ineffectiveness in fair value hedges 2018
SEK m
Nominal amount
hedging instrument
Carrying amount
hedging instrument Change in fair value
used to calculate
ineffectiveness
Ineffectiveness
recognised in the
income statementAssets Liabilities
Interest rate risk
Interest rate swaps, fixed interest paid and variable interest received 74 410 25 241 -131 -4
The carrying amount of hedging instruments is included in the item Derivative instruments in the balance sheet.
Ineffectiveness recognised in the income statement is included in the item Net gains/losses on financial transactions.
P18 Cont.
Hedged items in fair value hedges 2019
SEK m
Carrying amount
hedged item
Accumulated fair value
adjustment included in
the carrying amount of
the hedged item Change in value
used to calculate
ineffectiveness
Accumulated amount of adjustments to
fair value hedges remaining on
the balance sheet for hedged items which are
no longer adjusted for changes in fair valueAssets Liabilities Assets Liabilities
Interest rate risk
Fixed-interest loans to the public 101 432 114 -77 -
Issued fixed-interest securities and subordinated liabilities 32 950 -38 38 -
Total 101 432 32 950 114 -38 -39 -
Hedged items in fair value hedges 2018
SEK m
Carrying amount
hedged item
Accumulated fair value
adjustment included in
the carrying amount of
the hedged item Change in value
used to calculate
ineffectiveness
Accumulated amount of adjustments to
fair value hedges remaining on
the balance sheet for hedged items which are
no longer adjusted for changes in fair valueAssets Liabilities Assets Liabilities
Interest rate risk
Fixed-interest loans to the public 74 652 191 127 -
NOTES | PARENT COMPANY
216 HANDELSBANKEN | ANNUAL REPORT 2019
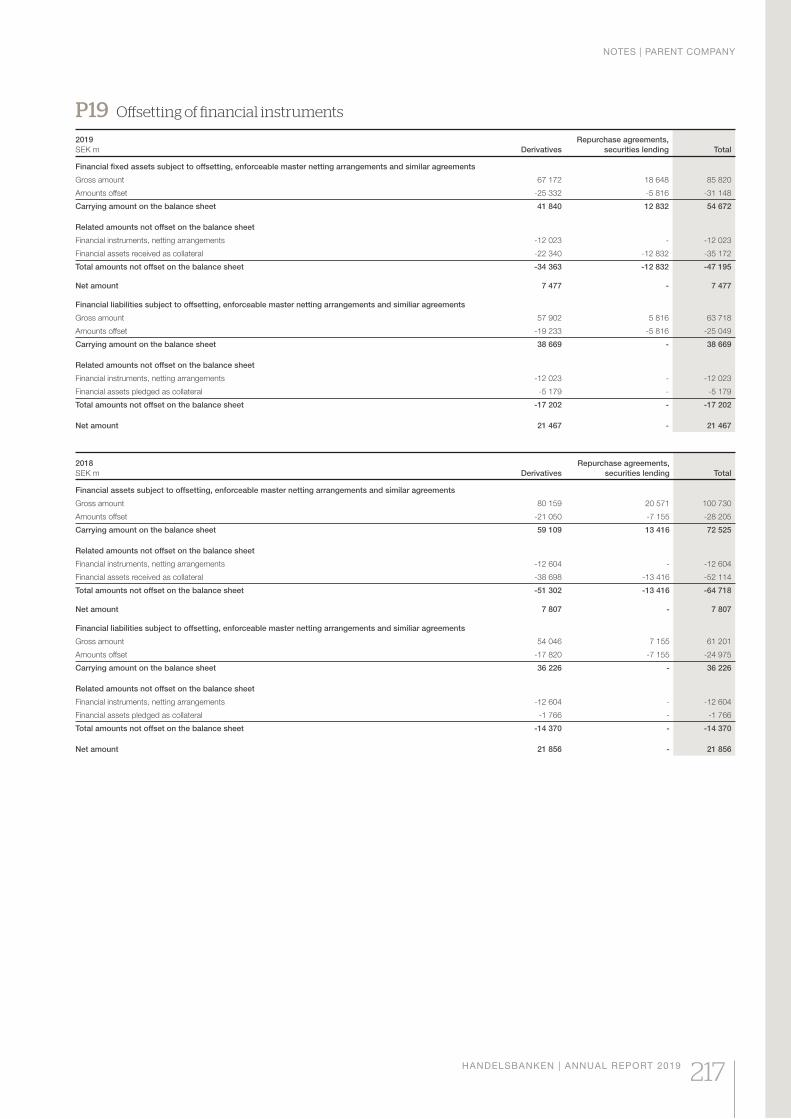
P19 Offsetting of financial instruments
2019
SEK m Derivatives
Repurchase agreements,
securities lending Total
Financial fixed assets subject to offsetting, enforceable master netting arrangements and similar agreements
Gross amount 67 172 18 648 85 820
Amounts offset -25 332 -5 816 -31 148
Carrying amount on the balance sheet 41 840 12 832 54 672
Related amounts not offset on the balance sheet
Financial instruments, netting arrangements -12 023 - -12 023
Financial assets received as collateral -22 340 -12 832 -35 172
Total amounts not offset on the balance sheet -34 363 -12 832 -47 195
Net amount 7 477 - 7 477
Financial liabilities subject to offsetting, enforceable master netting arrangements and similiar agreements
Gross amount 57 902 5 816 63 718
Amounts offset -19 233 -5 816 -25 049
Carrying amount on the balance sheet 38 669 - 38 669
Related amounts not offset on the balance sheet
Financial instruments, netting arrangements -12 023 - -12 023
Financial assets pledged as collateral -5 179 - -5 179
Total amounts not offset on the balance sheet -17 202 - -17 202
Net amount 21 467 - 21 467
2018
SEK m Derivatives
Repurchase agreements,
securities lending Total
Financial assets subject to offsetting, enforceable master netting arrangements and similar agreements
Gross amount 80 159 20 571 100 730
Amounts offset -21 050 -7 155 -28 205
Carrying amount on the balance sheet 59 109 13 416 72 525
Related amounts not offset on the balance sheet
Financial instruments, netting arrangements -12 604 - -12 604
Financial assets received as collateral -38 698 -13 416 -52 114
Total amounts not offset on the balance sheet -51 302 -13 416 -64 718
Net amount 7 807 - 7 807
Financial liabilities subject to offsetting, enforceable master netting arrangements and similiar agreements
Gross amount 54 046 7 155 61 201
Amounts offset -17 820 -7 155 -24 975
Carrying amount on the balance sheet 36 226 - 36 226
Related amounts not offset on the balance sheet
Financial instruments, netting arrangements -12 604 - -12 604
Financial assets pledged as collateral -1 766 - -1 766
Total amounts not offset on the balance sheet -14 370 - -14 370
Net amount 21 856 - 21 856
NOTES | PARENT COMPANY
HANDELSBANKEN | ANNUAL REPORT 2019 217

P21 Property, equipment and lease assets
Property, equipment and lease assets
SEK m 2019 2018
Equipment 624 545
Property 133 140
Lease assets 7 385 4 704
Property repossessed for protection of claims 3 45
Total 8 145 5 434
Property repossessed for protection of claims contains properties which are regularly measured at fair value in accordance with the Group’s accounting policies for assets repossessed to protect
claims. See note G1. The fair value of properties which are regularly measured at fair value is SEK 3m (45). Unrealised value changes on these properties had an impact of SEK 0m (0) on the year’s
profit. The valuation of private housing is essentially based on market observations of comparable property purchases in the location in question. The valuation of commercial properties is based
on discounting future cash flows using assumptions such as rents, vacancy levels, operating and maintenance costs, yield requirement and calculation interest rates. The valuation is also based
on the condition of the property, its location and alternative areas of use. The Bank’s principle is always to use an independent authorised valuer for valuing commercial and office buildings, and
industrial properties. Valuations which are only based on market observations SEK 0m (43) are classified as level 2 in the valuation hierarchy described in note G1. Valuations where own assump-
tions are used to a material extent SEK 2m (2) are classified as level 3 in the valuation hierarchy. Unrealised value changes in level 3 relating to properties which are regularly measured at fair value
have affected the year’s profit by SEK 0m (0). The year’s sale of properties which are regularly measured at fair value amounts to SEK 47m (49) of which SEK 2m (1) was classified as level 3 before
the sale. The value of new properties added during the year is SEK 2m (2), with SEK 2m (0) of this classified as level 3.
Equipment
SEK m 2019 2018
Cost of acquisition at beginning of year 1 617 2 032
Cost of additional acquisition for the year 373 342
Changes due to business combination during the year 22 -531
Disposals and retirements -484 -275
Foreign exchange effect -1 49
Cost of acquisition at end of year 1 527 1 617
Accumulated depreciation and impairment at beginning of year -1 072 -1 267
Accumulated depreciation due to business combinations during the year -5 270
Depreciation for the year according to plan -316 -316
Disposals and retirements 483 272
Foreign exchange effect 7 -31
Accumulated depreciation and impairment at end of year -903 -1 072
Carrying amount 624 545
P20 Intangible assets
2019
SEK m
Acquisition
assets
Internally
developed software
Total
2019
Cost of acquisition at beginning of year 2 383 3 239 5 622
Cost of acquisition of additional intangible assets - 894 894
Disposals and retirements - -3 -3
Foreign exchange effect 51 2 53
Cost of acquisition at end of year 2 434 4 132 6 566
Accumulated amortisation and impairment at beginning of year -2 108 -742 -2 850
Disposals and retirements - 3 3
Amortisation for the year according to plan -126 -329 -455
Impairment for the year - -30 -30
Foreign exchange effect -43 -1 -44
Accumulated amortisation and impairment at end of year -2 277 -1 099 -3 376
Carrying amount 157 3 033 3 190
In 2019, development costs amounting to SEK 1,395 m (1,609) have been recognised as expenses.
2018
SEK m
Acquisition
assets
Internally
developed software
Total
2018
Cost of acquisition at beginning of year 2 298 2 819 5 117
Cost of acquisition of additional intangible assets - 658 658
Disposals and retirements - -241 -241
Foreign exchange effect 85 3 88
Cost of acquisition at end of year 2 383 3 239 5 622
Accumulated amortisation and impairment at beginning of year -1 912 -595 -2 507
Disposals and retirements - 104 104
Amortisation for the year according to plan -128 -245 -373
Impairment for the year - -4 -4
Foreign exchange effect -68 -2 -70
Accumulated amortisation and impairment at end of year -2 108 -742 -2 850
Carrying amount 275 2 497 2 772
NOTES | PARENT COMPANY
218 HANDELSBANKEN | ANNUAL REPORT 2019
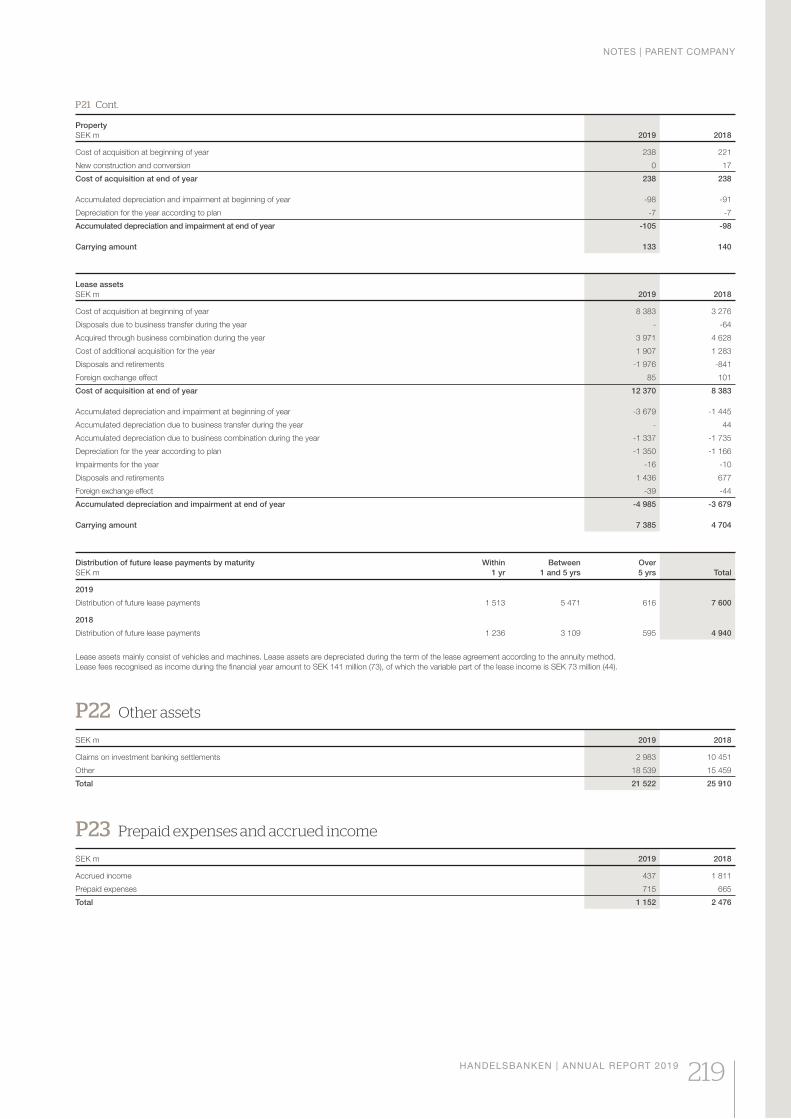
Property
SEK m 2019 2018
Cost of acquisition at beginning of year 238 221
New construction and conversion 0 17
Cost of acquisition at end of year 238 238
Accumulated depreciation and impairment at beginning of year -98 -91
Depreciation for the year according to plan -7 -7
Accumulated depreciation and impairment at end of year -105 -98
Carrying amount 133 140
Lease assets
SEK m 2019 2018
Cost of acquisition at beginning of year 8 383 3 276
Disposals due to business transfer during the year - -64
Acquired through business combination during the year 3 971 4 628
Cost of additional acquisition for the year 1 907 1 283
Disposals and retirements -1 976 -841
Foreign exchange effect 85 101
Cost of acquisition at end of year 12 370 8 383
Accumulated depreciation and impairment at beginning of year -3 679 -1 445
Accumulated depreciation due to business transfer during the year - 44
Accumulated depreciation due to business combination during the year -1 337 -1 735
Depreciation for the year according to plan -1 350 -1 166
Impairments for the year -16 -10
Disposals and retirements 1 436 677
Foreign exchange effect -39 -44
Accumulated depreciation and impairment at end of year -4 985 -3 679
Carrying amount 7 385 4 704
Distribution of future lease payments by maturity
SEK m
Within
1 yr
Between
1 and 5 yrs
Over
5 yrs Total
2019
Distribution of future lease payments 1 513 5 471 616 7 600
2018
Distribution of future lease payments 1 236 3 109 595 4 940
Lease assets mainly consist of vehicles and machines. Lease assets are depreciated during the term of the lease agreement according to the annuity method.
Lease fees recognised as income during the financial year amount to SEK 141 million (73), of which the variable part of the lease income is SEK 73 million (44).
P22 Other assets
SEK m 2019 2018
Claims on investment banking settlements 2 983 10 451
Other 18 539 15 459
Total 21 522 25 910
P23 Prepaid expenses and accrued income
SEK m 2019 2018
Accrued income 437 1 811
Prepaid expenses 715 665
Total 1 152 2 476
P21 Cont.
NOTES | PARENT COMPANY
HANDELSBANKEN | ANNUAL REPORT 2019 219

P24 Due to credit institutions
SEK m 2019 2018
Due in Swedish kronor
Banks 28 251 43 174
Other credit institutions 32 005 30 409
Total 60 256 73 583
Due in foreign currency
Banks 108 954 140 403
Other credit institutions 39 487 47 749
Total 148 441 188 152
Total due to credit institutions 208 697 261 735
of which accrued interest expenses -68 212
Average volumes
SEK m 2019 2018
Due to credit institutions in Swedish kronor 71 299 78 728
Due to credit institutions in foreign currency 187 932 176 224
Total 259 231 254 952
of which repos 84 237
P25 Deposits and borrowing from the public
Deposits from the public
SEK m 2019 2018
Deposits in Swedish kronor
Households 376 202 351 450
Companies 258 687 229 046
National Debt Office - -
Total 634 889 580 496
Deposits in foreign currency
Households 75 928 64 995
Companies 181 306 163 678
National Debt Office - -
Total 257 234 228 673
Total deposits from the public 892 123 809 169
Borrowing from the public
SEK m 2019 2018
Borrowing in Swedish kronor 15 066 21 306
Borrowing in foreign currency 10 957 9 360
Total borrowing from the public 26 023 30 666
Total deposits and borrowing from the public 918 146 839 835
of which accrued interest expenses 498 767
Average volumes
SEK m 2019 2018
Deposits from the public
Deposits from the public in Swedish kronor 619 620 568 313
Deposits from the public in foreign currency 263 585 385 349
Total 883 205 953 662
Borrowing from the public
Borrowing from the public in Swedish kronor 33 072 31 863
Borrowing from the public in foreign currency 42 309 82 674
Total 75 381 114 537
of which repos 10 976 12 239
NOTES | PARENT COMPANY
220 HANDELSBANKEN | ANNUAL REPORT 2019
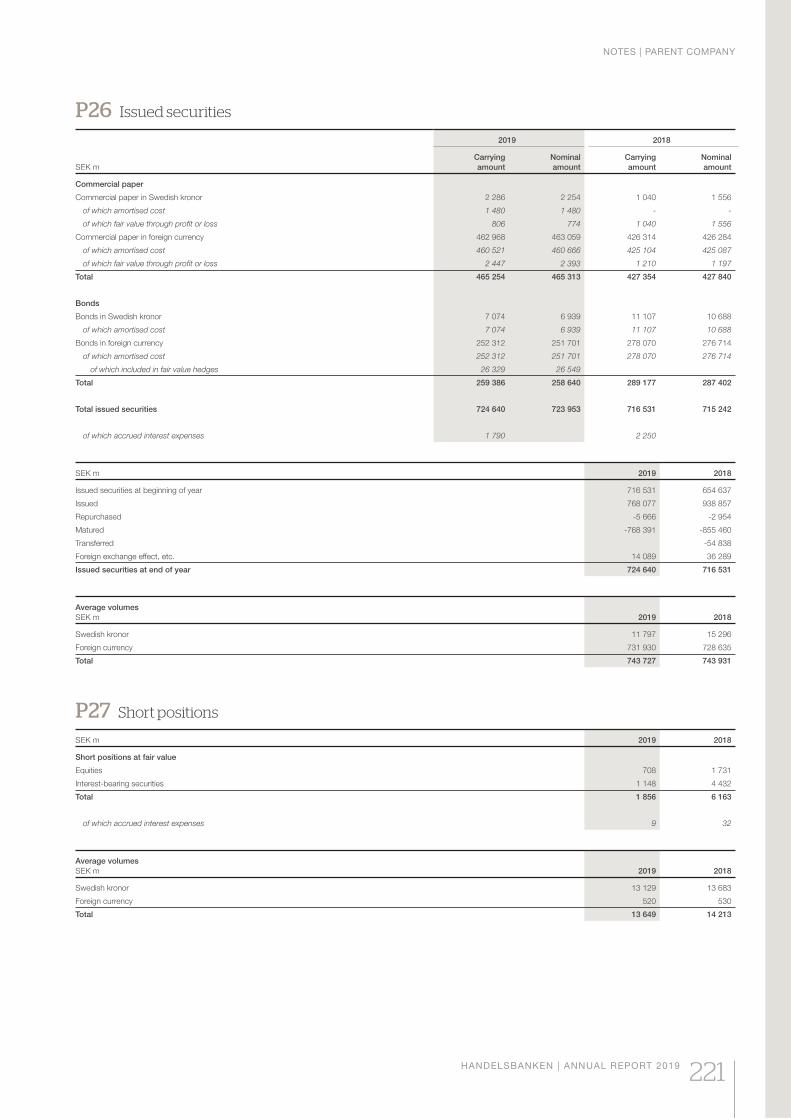
P26 Issued securities
2019 2018
SEK m
Carrying
amount
Nominal
amount
Carrying
amount
Nominal
amount
Commercial paper
Commercial paper in Swedish kronor 2 286 2 254 1 040 1 556
of which amortised cost 1 480 1 480 - -
of which fair value through profit or loss 806 774 1 040 1 556
Commercial paper in foreign currency 462 968 463 059 426 314 426 284
of which amortised cost 460 521 460 666 425 104 425 087
of which fair value through profit or loss 2 447 2 393 1 210 1 197
Total 465 254 465 313 427 354 427 840
Bonds
Bonds in Swedish kronor 7 074 6 939 11 107 10 688
of which amortised cost 7 074 6 939 11 107 10 688
Bonds in foreign currency 252 312 251 701 278 070 276 714
of which amortised cost 252 312 251 701 278 070 276 714
of which included in fair value hedges 26 329 26 549
Total 259 386 258 640 289 177 287 402
Total issued securities 724 640 723 953 716 531 715 242
of which accrued interest expenses 1 790 2 250
SEK m 2019 2018
Issued securities at beginning of year 716 531 654 637
Issued 768 077 938 857
Repurchased -5 666 -2 954
Matured -768 391 -855 460
Transferred -54 838
Foreign exchange effect, etc. 14 089 36 289
Issued securities at end of year 724 640 716 531
Average volumes
SEK m 2019 2018
Swedish kronor 11 797 15 296
Foreign currency 731 930 728 635
Total 743 727 743 931
P27 Short positions
SEK m 2019 2018
Short positions at fair value
Equities 708 1 731
Interest-bearing securities 1 148 4 432
Total 1 856 6 163
of which accrued interest expenses 9 32
Average volumes
SEK m 2019 2018
Swedish kronor 13 129 13 683
Foreign currency 520 530
Total 13 649 14 213
NOTES | PARENT COMPANY
HANDELSBANKEN | ANNUAL REPORT 2019 221
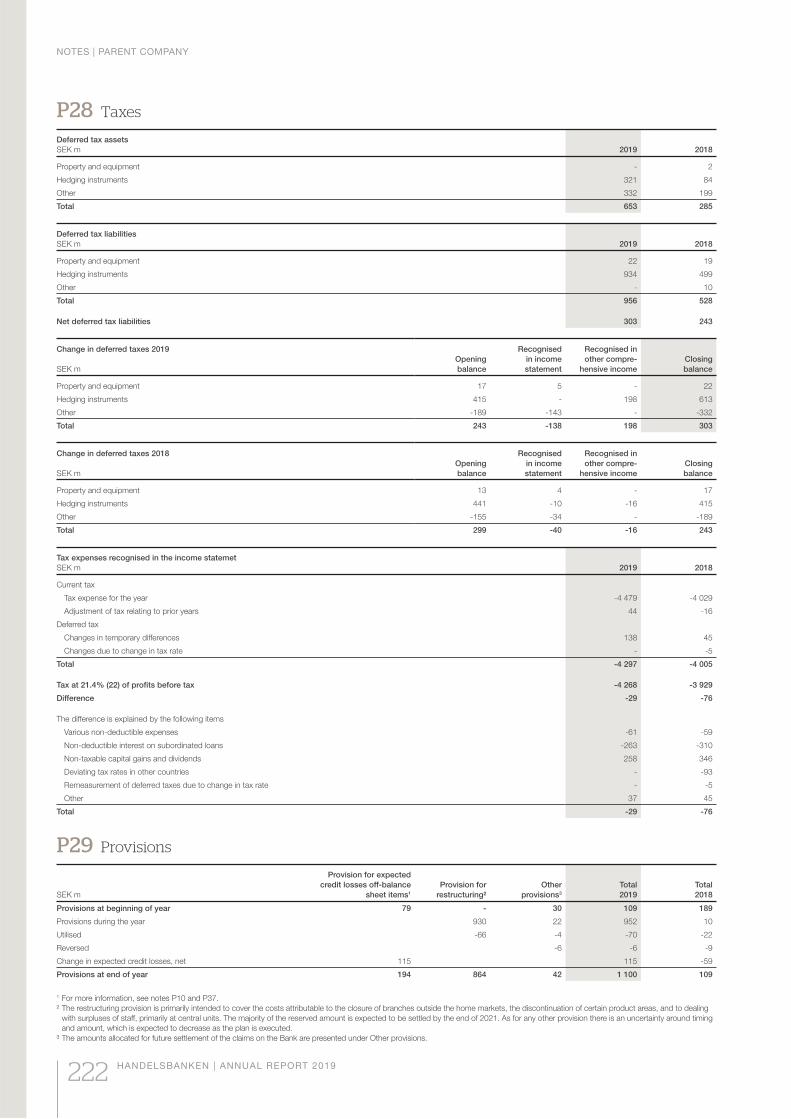
P28 Taxes
Deferred tax assets
SEK m 2019 2018
Property and equipment - 2
Hedging instruments 321 84
Other 332 199
Total 653 285
Deferred tax liabilities
SEK m 2019 2018
Property and equipment 22 19
Hedging instruments 934 499
Other - 10
Total 956 528
Net deferred tax liabilities 303 243
Change in deferred taxes 2019
SEK m
Opening
balance
Recognised
in income
statement
Recognised in
other compre-
hensive income
Closing
balance
Property and equipment 17 5 - 22
Hedging instruments 415 - 198 613
Other -189 -143 - -332
Total 243 -138 198 303
Change in deferred taxes 2018
SEK m
Opening
balance
Recognised
in income
statement
Recognised in
other compre-
hensive income
Closing
balance
Property and equipment 13 4 - 17
Hedging instruments 441 -10 -16 415
Other -155 -34 - -189
Total 299 -40 -16 243
Tax expenses recognised in the income statemet
SEK m 2019 2018
Current tax
Tax expense for the year -4 479 -4 029
Adjustment of tax relating to prior years 44 -16
Deferred tax
Changes in temporary differences 138 45
Changes due to change in tax rate - -5
Total -4 297 -4 005
Tax at 21.4% (22) of profits before tax -4 268 -3 929
Difference -29 -76
The difference is explained by the following items
Various non-deductible expenses -61 -59
Non-deductible interest on subordinated loans -263 -310
Non-taxable capital gains and dividends 258 346
Deviating tax rates in other countries - -93
Remeasurement of deferred taxes due to change in tax rate - -5
Other 37 45
Total -29 -76
P29 Provisions
SEK m
Provision for expected
credit losses off-balance
sheet items1
Provision for
restructuring²
Other
provisions3
Total
2019
Total
2018
Provisions at beginning of year 79 - 30 109 189
Provisions during the year 930 22 952 10
Utilised -66 -4 -70 -22
Reversed -6 -6 -9
Change in expected credit losses, net 115 115 -59
Provisions at end of year 194 864 42 1 100 109
1 For more information, see notes P10 and P37.
² The restructuring provision is primarily intended to cover the costs attributable to the closure of branches outside the home markets, the discontinuation of certain product areas, and to dealing
with surpluses of staff, primarily at central units. The majority of the reserved amount is expected to be settled by the end of 2021. As for any other provision there is an uncertainty around timing
and amount, which is expected to decrease as the plan is executed.
³ The amounts allocated for future settlement of the claims on the Bank are presented under Other provisions.
NOTES | PARENT COMPANY
222 HANDELSBANKEN | ANNUAL REPORT 2019
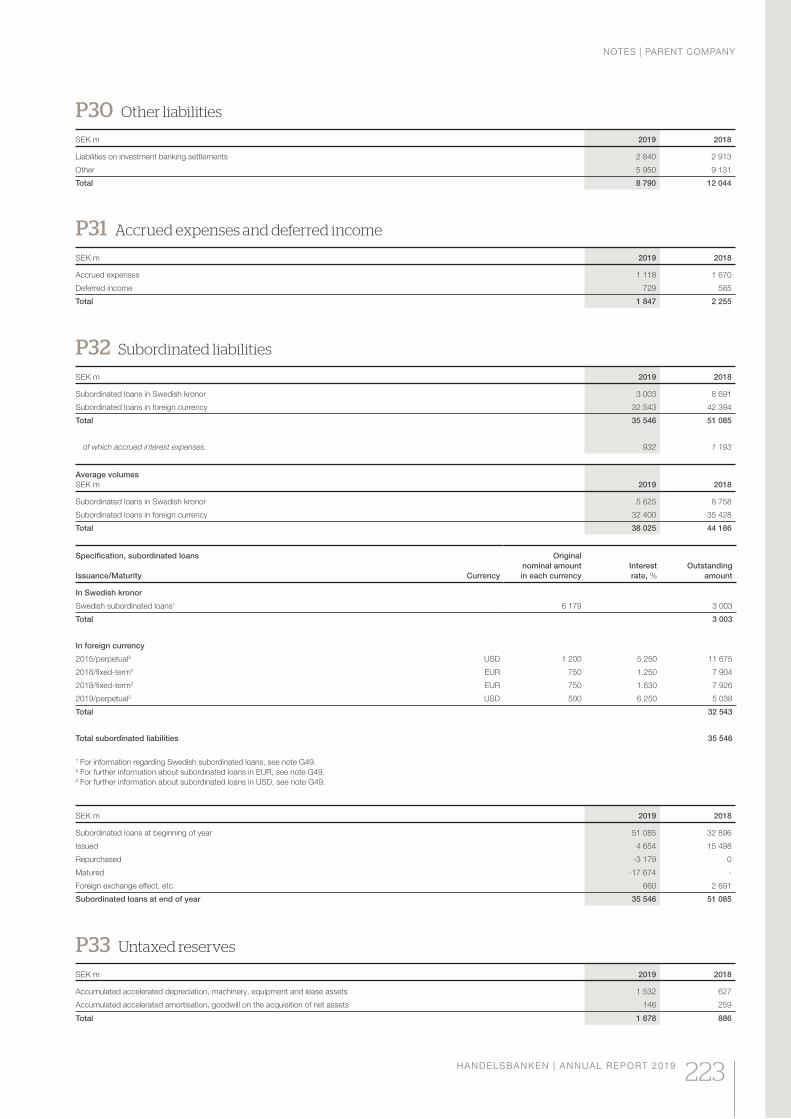
P31 Accrued expenses and deferred income
SEK m 2019 2018
Accrued expenses 1 118 1 670
Deferred income 729 585
Total 1 847 2 255
P30 Other liabilities
SEK m 2019 2018
Liabilities on investment banking settlements 2 840 2 913
Other 5 950 9 131
Total 8 790 12 044
P32 Subordinated liabilities
SEK m 2019 2018
Subordinated loans in Swedish kronor 3 003 8 691
Subordinated loans in foreign currency 32 543 42 394
Total 35 546 51 085
of which accrued interest expenses 932 1 193
Average volumes
SEK m 2019 2018
Subordinated loans in Swedish kronor 5 625 8 758
Subordinated loans in foreign currency 32 400 35 428
Total 38 025 44 186
Specification, subordinated loans
Issuance/Maturity Currency
Original
nominal amount
in each currency
Interest
rate, %
Outstanding
amount
In Swedish kronor
Swedish subordinated loans1 6 179 3 003
Total 3 003
In foreign currency
2015/perpetual3 USD 1 200 5.250 11 675
2018/fixed-term2 EUR 750 1.250 7 904
2018/fixed-term2 EUR 750 1.630 7 926
2019/perpetual3 USD 500 6.250 5 038
Total 32 543
Total subordinated liabilities 35 546
1 For information regarding Swedish subordinated loans, see note G49.2 For further information about subordinated loans in EUR, see note G49. 3 For further information about subordinated loans in USD, see note G49.
SEK m 2019 2018
Subordinated loans at beginning of year 51 085 32 896
Issued 4 654 15 498
Repurchased -3 179 0
Matured -17 674 -
Foreign exchange effect, etc. 660 2 691
Subordinated loans at end of year 35 546 51 085
P33 Untaxed reserves
SEK m 2019 2018
Accumulated accelerated depreciation, machinery, equipment and lease assets 1 532 627
Accumulated accelerated amortisation, goodwill on the acquisition of net assets 146 259
Total 1 678 886
NOTES | PARENT COMPANY
HANDELSBANKEN | ANNUAL REPORT 2019 223
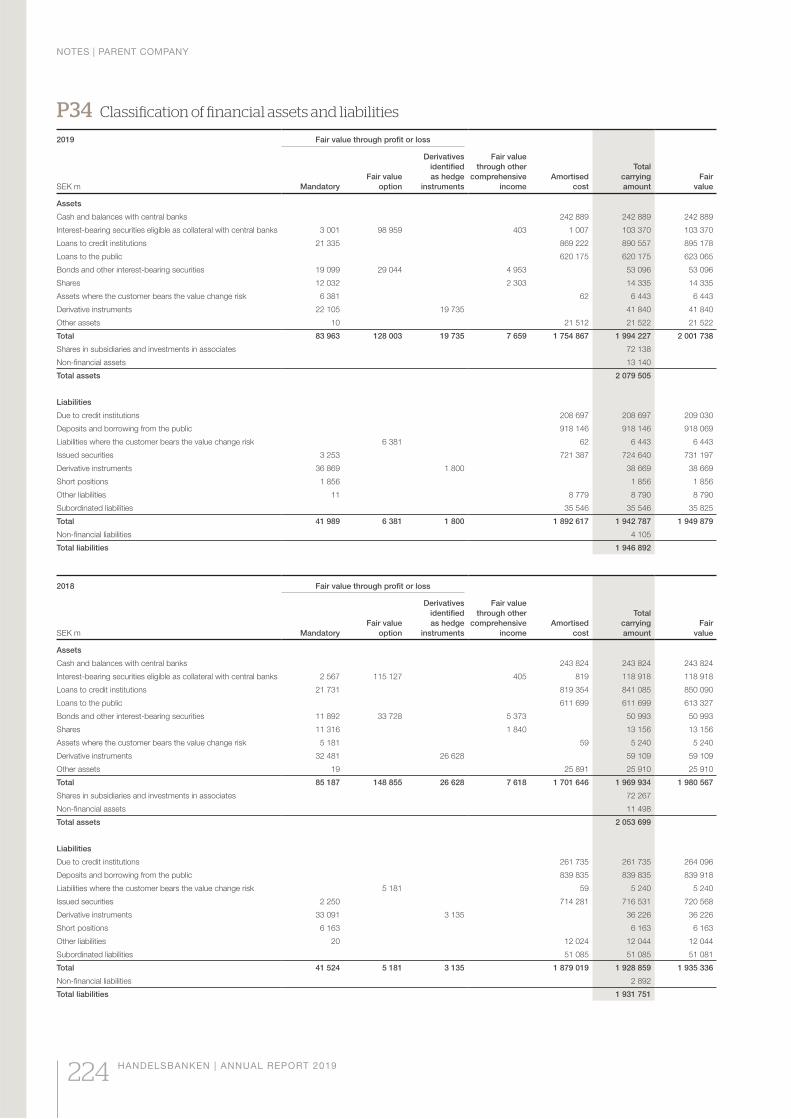
P34 Classification of financial assets and liabilities
2019 Fair value through profit or loss
Fair value
through other
comprehensive
income
Amortised
cost
Total
carrying
amount
Fair
valueSEK m Mandatory
Fair value
option
Derivatives
identified
as hedge
instruments
Assets
Cash and balances with central banks 242 889 242 889 242 889
Interest-bearing securities eligible as collateral with central banks 3 001 98 959 403 1 007 103 370 103 370
Loans to credit institutions 21 335 869 222 890 557 895 178
Loans to the public 620 175 620 175 623 065
Bonds and other interest-bearing securities 19 099 29 044 4 953 53 096 53 096
Shares 12 032 2 303 14 335 14 335
Assets where the customer bears the value change risk 6 381 62 6 443 6 443
Derivative instruments 22 105 19 735 41 840 41 840
Other assets 10 21 512 21 522 21 522
Total 83 963 128 003 19 735 7 659 1 754 867 1 994 227 2 001 738
Shares in subsidiaries and investments in associates 72 138
Non-financial assets 13 140
Total assets 2 079 505
Liabilities
Due to credit institutions 208 697 208 697 209 030
Deposits and borrowing from the public 918 146 918 146 918 069
Liabilities where the customer bears the value change risk 6 381 62 6 443 6 443
Issued securities 3 253 721 387 724 640 731 197
Derivative instruments 36 869 1 800 38 669 38 669
Short positions 1 856 1 856 1 856
Other liabilities 11 8 779 8 790 8 790
Subordinated liabilities 35 546 35 546 35 825
Total 41 989 6 381 1 800 1 892 617 1 942 787 1 949 879
Non-financial liabilities 4 105
Total liabilities 1 946 892
2018 Fair value through profit or loss
Fair value
through other
comprehensive
income
Amortised
cost
Total
carrying
amount
Fair
valueSEK m Mandatory
Fair value
option
Derivatives
identified
as hedge
instruments
Assets
Cash and balances with central banks 243 824 243 824 243 824
Interest-bearing securities eligible as collateral with central banks 2 567 115 127 405 819 118 918 118 918
Loans to credit institutions 21 731 819 354 841 085 850 090
Loans to the public 611 699 611 699 613 327
Bonds and other interest-bearing securities 11 892 33 728 5 373 50 993 50 993
Shares 11 316 1 840 13 156 13 156
Assets where the customer bears the value change risk 5 181 59 5 240 5 240
Derivative instruments 32 481 26 628 59 109 59 109
Other assets 19 25 891 25 910 25 910
Total 85 187 148 855 26 628 7 618 1 701 646 1 969 934 1 980 567
Shares in subsidiaries and investments in associates 72 267
Non-financial assets 11 498
Total assets 2 053 699
Liabilities
Due to credit institutions 261 735 261 735 264 096
Deposits and borrowing from the public 839 835 839 835 839 918
Liabilities where the customer bears the value change risk 5 181 59 5 240 5 240
Issued securities 2 250 714 281 716 531 720 568
Derivative instruments 33 091 3 135 36 226 36 226
Short positions 6 163 6 163 6 163
Other liabilities 20 12 024 12 044 12 044
Subordinated liabilities 51 085 51 085 51 081
Total 41 524 5 181 3 135 1 879 019 1 928 859 1 935 336
Non-financial liabilities 2 892
Total liabilities 1 931 751
NOTES | PARENT COMPANY
224 HANDELSBANKEN | ANNUAL REPORT 2019
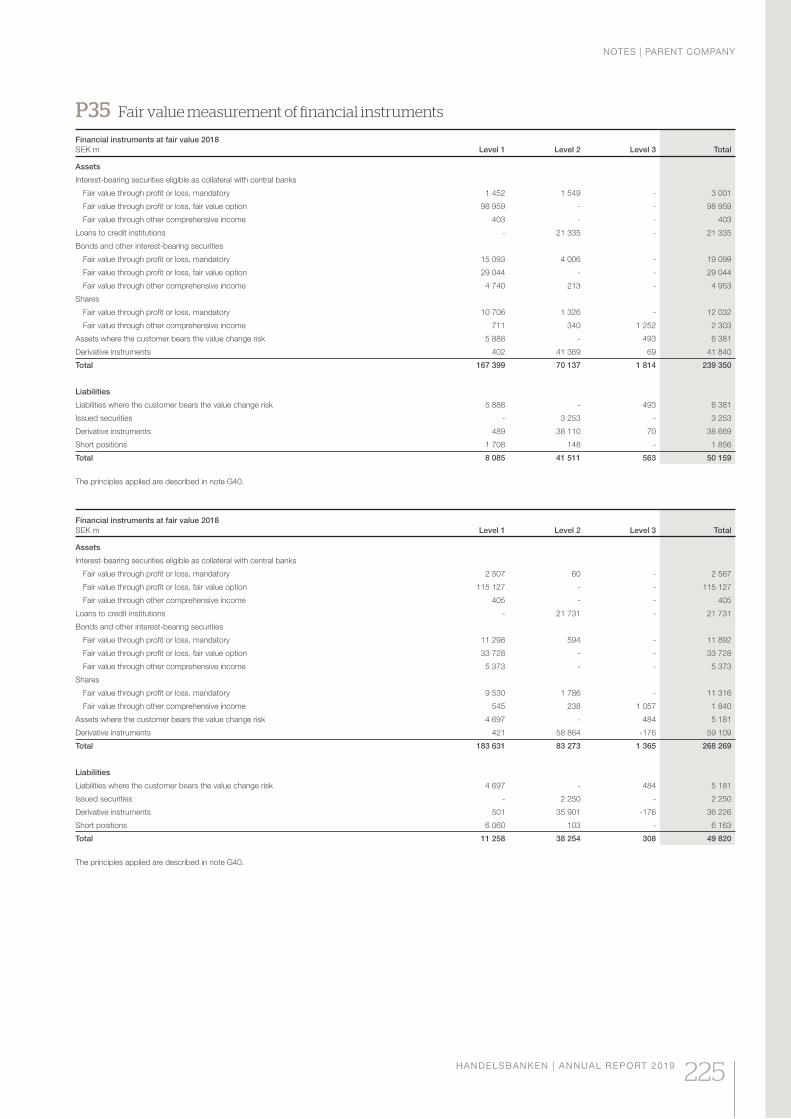
P35 Fair value measurement of financial instruments
Financial instruments at fair value 2018
SEK m Level 1 Level 2 Level 3 Total
Assets
Interest-bearing securities eligible as collateral with central banks
Fair value through profit or loss, mandatory 1 452 1 549 - 3 001
Fair value through profit or loss, fair value option 98 959 - - 98 959
Fair value through other comprehensive income 403 - - 403
Loans to credit institutions - 21 335 - 21 335
Bonds and other interest-bearing securities
Fair value through profit or loss, mandatory 15 093 4 006 - 19 099
Fair value through profit or loss, fair value option 29 044 - - 29 044
Fair value through other comprehensive income 4 740 213 - 4 953
Shares
Fair value through profit or loss, mandatory 10 706 1 326 - 12 032
Fair value through other comprehensive income 711 340 1 252 2 303
Assets where the customer bears the value change risk 5 888 - 493 6 381
Derivative instruments 402 41 369 69 41 840
Total 167 399 70 137 1 814 239 350
Liabilities
Liabilities where the customer bears the value change risk 5 888 - 493 6 381
Issued securities - 3 253 - 3 253
Derivative instruments 489 38 110 70 38 669
Short positions 1 708 148 - 1 856
Total 8 085 41 511 563 50 159
The principles applied are described in note G40.
Financial instruments at fair value 2018
SEK m Level 1 Level 2 Level 3 Total
Assets
Interest-bearing securities eligible as collateral with central banks
Fair value through profit or loss, mandatory 2 507 60 - 2 567
Fair value through profit or loss, fair value option 115 127 - - 115 127
Fair value through other comprehensive income 405 - - 405
Loans to credit institutions - 21 731 - 21 731
Bonds and other interest-bearing securities
Fair value through profit or loss, mandatory 11 298 594 - 11 892
Fair value through profit or loss, fair value option 33 728 - - 33 728
Fair value through other comprehensive income 5 373 - - 5 373
Shares
Fair value through profit or loss, mandatory 9 530 1 786 - 11 316
Fair value through other comprehensive income 545 238 1 057 1 840
Assets where the customer bears the value change risk 4 697 - 484 5 181
Derivative instruments 421 58 864 -176 59 109
Total 183 631 83 273 1 365 268 269
Liabilities
Liabilities where the customer bears the value change risk 4 697 - 484 5 181
Issued securities - 2 250 - 2 250
Derivative instruments 501 35 901 -176 36 226
Short positions 6 060 103 - 6 163
Total 11 258 38 254 308 49 820
The principles applied are described in note G40.
NOTES | PARENT COMPANY
HANDELSBANKEN | ANNUAL REPORT 2019 225
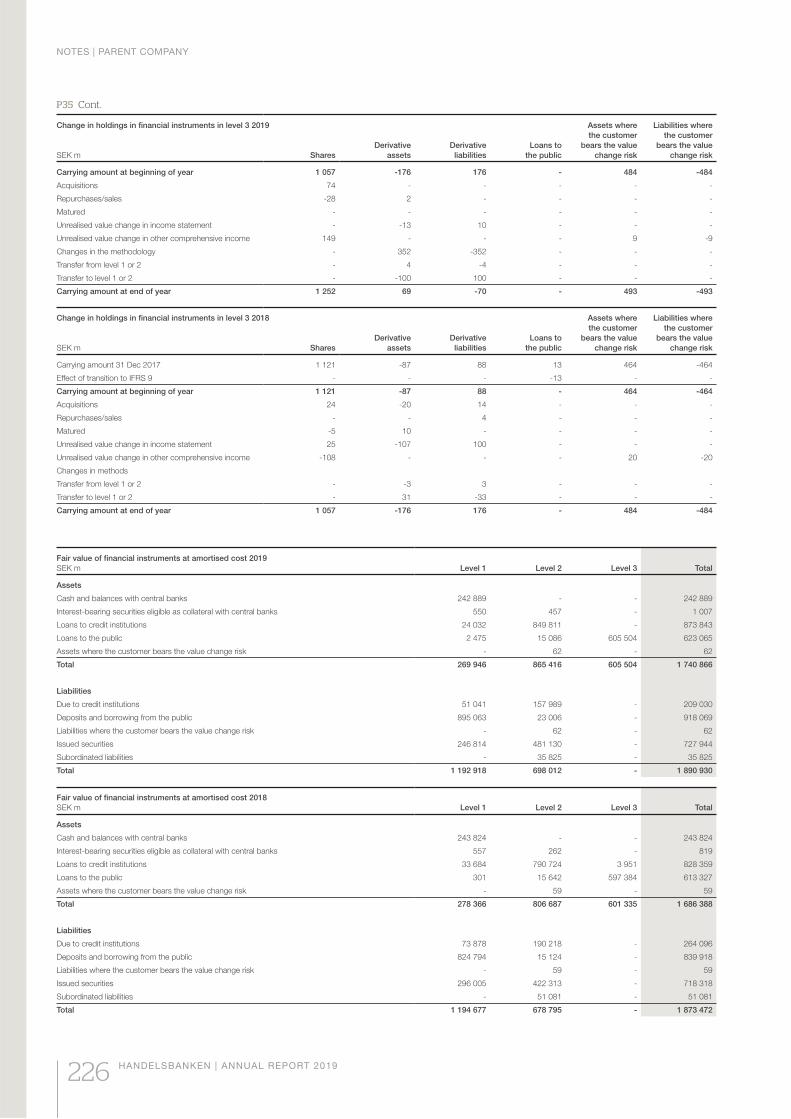
Change in holdings in financial instruments in level 3 2019
Derivative
assets
Derivative
liabilities
Loans to
the public
Assets where
the customer
bears the value
change risk
Liabilities where
the customer
bears the value
change riskSEK m Shares
Carrying amount at beginning of year 1 057 -176 176 - 484 -484
Acquisitions 74 - - - - -
Repurchases/sales -28 2 - - - -
Matured - - - - - -
Unrealised value change in income statement - -13 10 - - -
Unrealised value change in other comprehensive income 149 - - - 9 -9
Changes in the methodology - 352 -352 - - -
Transfer from level 1 or 2 - 4 -4 - - -
Transfer to level 1 or 2 - -100 100 - - -
Carrying amount at end of year 1 252 69 -70 - 493 -493
Change in holdings in financial instruments in level 3 2018
Derivative
assets
Derivative
liabilities
Loans to
the public
Assets where
the customer
bears the value
change risk
Liabilities where
the customer
bears the value
change riskSEK m Shares
Carrying amount 31 Dec 2017 1 121 -87 88 13 464 -464
Effect of transition to IFRS 9 - - - -13 - -
Carrying amount at beginning of year 1 121 -87 88 - 464 -464
Acquisitions 24 -20 14 - - -
Repurchases/sales - - 4 - - -
Matured -5 10 - - - -
Unrealised value change in income statement 25 -107 100 - - -
Unrealised value change in other comprehensive income -108 - - - 20 -20
Changes in methods
Transfer from level 1 or 2 - -3 3 - - -
Transfer to level 1 or 2 - 31 -33 - - -
Carrying amount at end of year 1 057 -176 176 - 484 -484
Fair value of financial instruments at amortised cost 2019
SEK m Level 1 Level 2 Level 3 Total
Assets
Cash and balances with central banks 242 889 - - 242 889
Interest-bearing securities eligible as collateral with central banks 550 457 - 1 007
Loans to credit institutions 24 032 849 811 - 873 843
Loans to the public 2 475 15 086 605 504 623 065
Assets where the customer bears the value change risk - 62 - 62
Total 269 946 865 416 605 504 1 740 866
Liabilities
Due to credit institutions 51 041 157 989 - 209 030
Deposits and borrowing from the public 895 063 23 006 - 918 069
Liabilities where the customer bears the value change risk - 62 - 62
Issued securities 246 814 481 130 - 727 944
Subordinated liabilities - 35 825 - 35 825
Total 1 192 918 698 012 - 1 890 930
Fair value of financial instruments at amortised cost 2018
SEK m Level 1 Level 2 Level 3 Total
Assets
Cash and balances with central banks 243 824 - - 243 824
Interest-bearing securities eligible as collateral with central banks 557 262 - 819
Loans to credit institutions 33 684 790 724 3 951 828 359
Loans to the public 301 15 642 597 384 613 327
Assets where the customer bears the value change risk - 59 - 59
Total 278 366 806 687 601 335 1 686 388
Liabilities
Due to credit institutions 73 878 190 218 - 264 096
Deposits and borrowing from the public 824 794 15 124 - 839 918
Liabilities where the customer bears the value change risk - 59 - 59
Issued securities 296 005 422 313 - 718 318
Subordinated liabilities - 51 081 - 51 081
Total 1 194 677 678 795 - 1 873 472
P35 Cont.
NOTES | PARENT COMPANY
226 HANDELSBANKEN | ANNUAL REPORT 2019
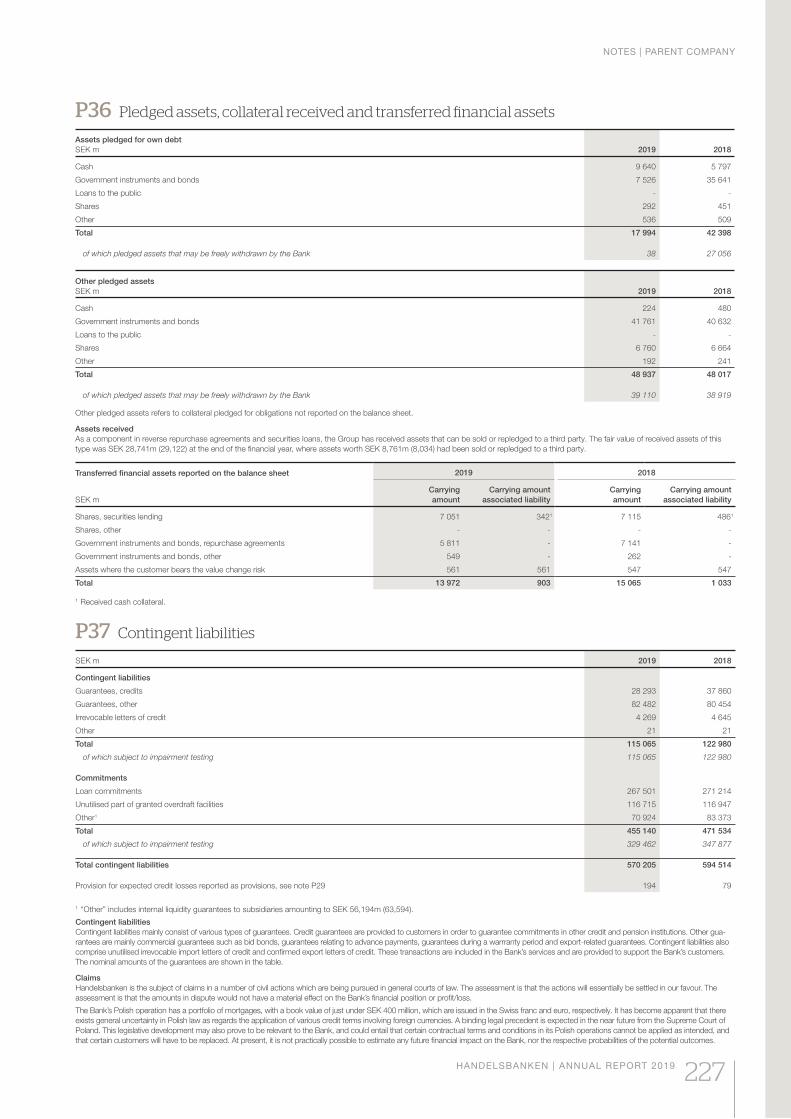
P36 Pledged assets, collateral received and transferred financial assets
Assets pledged for own debt
SEK m 2019 2018
Cash 9 640 5 797
Government instruments and bonds 7 526 35 641
Loans to the public - -
Shares 292 451
Other 536 509
Total 17 994 42 398
of which pledged assets that may be freely withdrawn by the Bank 38 27 056
Other pledged assets
SEK m 2019 2018
Cash 224 480
Government instruments and bonds 41 761 40 632
Loans to the public - -
Shares 6 760 6 664
Other 192 241
Total 48 937 48 017
of which pledged assets that may be freely withdrawn by the Bank 39 110 38 919
Other pledged assets refers to collateral pledged for obligations not reported on the balance sheet.
Assets received
As a component in reverse repurchase agreements and securities loans, the Group has received assets that can be sold or repledged to a third party. The fair value of received assets of this
type was SEK 28,741m (29,122) at the end of the financial year, where assets worth SEK 8,761m (8,034) had been sold or repledged to a third party.
Transferred financial assets reported on the balance sheet
SEK m
2019 2018
Carrying
amount
Carrying amount
associated liability
Carrying
amount
Carrying amount
associated liability
Shares, securities lending 7 051 3421 7 115 4861
Shares, other - - - -
Government instruments and bonds, repurchase agreements 5 811 - 7 141 -
Government instruments and bonds, other 549 - 262 -
Assets where the customer bears the value change risk 561 561 547 547
Total 13 972 903 15 065 1 033
1 Received cash collateral.
P37 Contingent liabilities
SEK m 2019 2018
Contingent liabilities
Guarantees, credits 28 293 37 860
Guarantees, other 82 482 80 454
Irrevocable letters of credit 4 269 4 645
Other 21 21
Total 115 065 122 980
of which subject to impairment testing 115 065 122 980
Commitments
Loan commitments 267 501 271 214
Unutilised part of granted overdraft facilities 116 715 116 947
Other1 70 924 83 373
Total 455 140 471 534
of which subject to impairment testing 329 462 347 877
Total contingent liabilities 570 205 594 514
Provision for expected credit losses reported as provisions, see note P29 194 79
1 “Other” includes internal liquidity guarantees to subsidiaries amounting to SEK 56,194m (63,594).
Contingent liabilities
Contingent liabilities mainly consist of various types of guarantees. Credit guarantees are provided to customers in order to guarantee commitments in other credit and pension institutions. Other gua-
rantees are mainly commercial guarantees such as bid bonds, guarantees relating to advance payments, guarantees during a warrranty period and export-related guarantees. Contingent liabilities also
comprise unutilised irrevocable import letters of credit and confirmed export letters of credit. These transactions are included in the Bank’s services and are provided to support the Bank’s customers.
The nominal amounts of the guarantees are shown in the table.
Claims
Handelsbanken is the subject of claims in a number of civil actions which are being pursued in general courts of law. The assessment is that the actions will essentially be settled in our favour. The
assessment is that the amounts in dispute would not have a material effect on the Bank’s financial position or profit/loss.
The Bank’s Polish operation has a portfolio of mortgages, with a book value of just under SEK 400 million, which are issued in the Swiss franc and euro, respectively. It has become apparent that there
exists general uncertainty in Polish law as regards the application of various credit terms involving foreign currencies. A binding legal precedent is expected in the near future from the Supreme Court of
Poland. This legislative development may also prove to be relevant to the Bank, and could entail that certain contractual terms and conditions in its Polish operations cannot be applied as intended, and
that certain customers will have to be replaced. At present, it is not practically possible to estimate any future financial impact on the Bank, nor the respective probabilities of the potential outcomes.
NOTES | PARENT COMPANY
HANDELSBANKEN | ANNUAL REPORT 2019 227
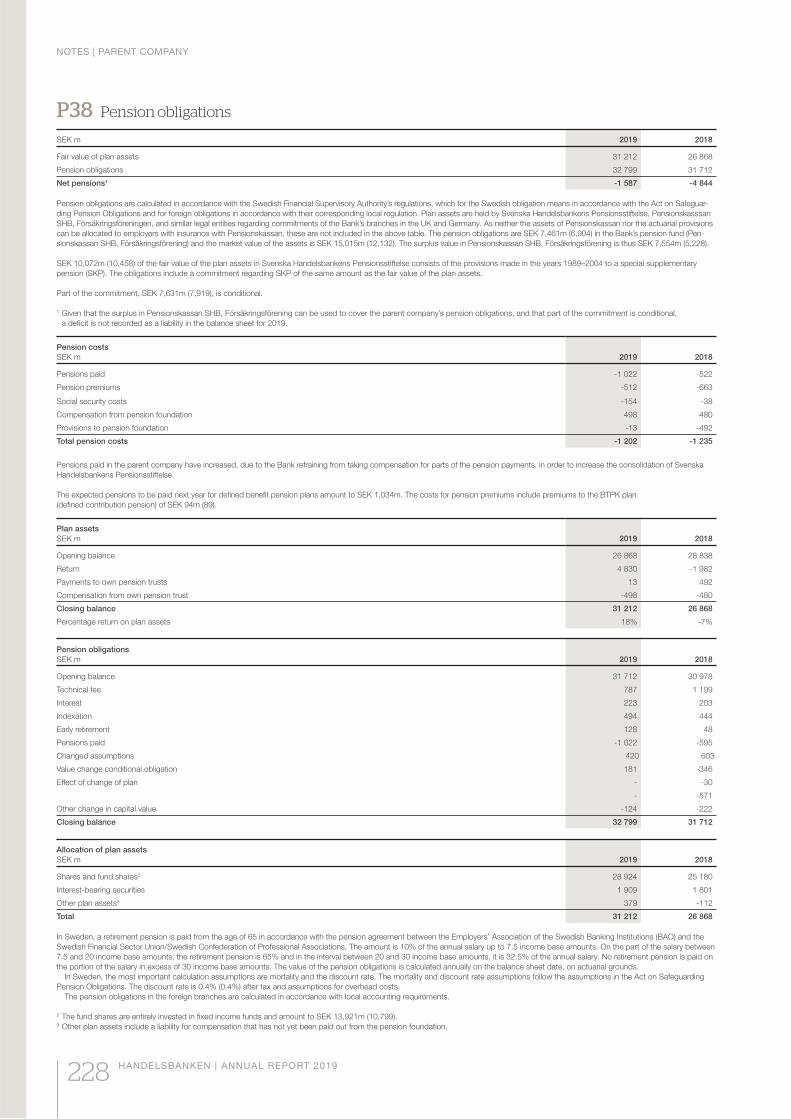
P38 Pension obligations
SEK m 2019 2018
Fair value of plan assets 31 212 26 868
Pension obligations 32 799 31 712
Net pensions1 -1 587 -4 844
Pension obligations are calculated in accordance with the Swedish Financial Supervisory Authority’s regulations, which for the Swedish obligation means in accordance with the Act on Safeguar-
ding Pension Obligations and for foreign obligations in accordance with their corresponding local regulation. Plan assets are held by Svenska Handelsbankens Pensionsstiftelse, Pensionskasssan
SHB, Försäkringsföreningen, and similar legal entities regarding commitments of the Bank’s branches in the UK and Germany. As neither the assets of Pensionskassan nor the actuarial provisions
can be allocated to employers with insurance with Pensionskassan, these are not included in the above table. The pension obligations are SEK 7,461m (6,904) in the Bank’s pension fund (Pen-
sionskassan SHB, Försäkringsförening) and the market value of the assets is SEK 15,015m (12,132). The surplus value in Pensionskassan SHB, Försäkringsförening is thus SEK 7,554m (5,228).
SEK 10,072m (10,458) of the fair value of the plan assets in Svenska Handelsbankens Pensionsstiftelse consists of the provisions made in the years 1989–2004 to a special supplementary
pension (SKP). The obligations include a commitment regarding SKP of the same amount as the fair value of the plan assets.
Part of the commitment, SEK 7,631m (7,919), is conditional.
1 Given that the surplus in Pensionskassan SHB, Försäkringsförening can be used to cover the parent company’s pension obligations, and that part of the commitment is conditional,
a deficit is not recorded as a liability in the balance sheet for 2019.
Pension costs
SEK m 2019 2018
Pensions paid -1 022 -522
Pension premiums -512 -663
Social security costs -154 -38
Compensation from pension foundation 498 480
Provisions to pension foundation -13 -492
Total pension costs -1 202 -1 235
Pensions paid in the parent company have increased, due to the Bank refraining from taking compensation for parts of the pension payments, in order to increase the consolidation of Svenska
Handelsbankens Pensionsstiftelse.
The expected pensions to be paid next year for defined benefit pension plans amount to SEK 1,034m. The costs for pension premiums include premiums to the BTPK plan
(defined contribution pension) of SEK 94m (89).
Plan assets
SEK m 2019 2018
Opening balance 26 868 28 838
Return 4 830 -1 982
Payments to own pension trusts 13 492
Compensation from own pension trust -498 -480
Closing balance 31 212 26 868
Percentage return on plan assets 18% -7%
Pension obligations
SEK m 2019 2018
Opening balance 31 712 30 978
Technical fee 787 1 199
Interest 223 203
Indexation 494 444
Early retirement 128 48
Pensions paid -1 022 -595
Changed assumptions 420 603
Value change conditional obligation 181 -346
Effect of change of plan - -30
- -571
Other change in capital value -124 -222
Closing balance 32 799 31 712
Allocation of plan assets
SEK m 2019 2018
Shares and fund shares2 28 924 25 180
Interest-bearing securities 1 909 1 801
Other plan assets3 379 -112
Total 31 212 26 868
In Sweden, a retirement pension is paid from the age of 65 in accordance with the pension agreement between the Employers’ Association of the Swedish Banking Institutions (BAO) and the
Swedish Financial Sector Union/Swedish Confederation of Professional Associations. The amount is 10% of the annual salary up to 7.5 income base amounts. On the part of the salary between
7.5 and 20 income base amounts, the retirement pension is 65% and in the interval between 20 and 30 income base amounts, it is 32.5% of the annual salary. No retirement pension is paid on
the portion of the salary in excess of 30 income base amounts. The value of the pension obligations is calculated annually on the balance sheet date, on actuarial grounds.
In Sweden, the most important calculation assumptions are mortality and the discount rate. The mortality and discount rate assumptions follow the assumptions in the Act on Safeguarding
Pension Obligations. The discount rate is 0.4% (0.4%) after tax and assumptions for overhead costs.
The pension obligations in the foreign branches are calculated in accordance with local accounting requirements.
2 The fund shares are entirely invested in fixed income funds and amount to SEK 13,921m (10,799).3 Other plan assets include a liability for compensation that has not yet been paid out from the pension foundation.
NOTES | PARENT COMPANY
228 HANDELSBANKEN | ANNUAL REPORT 2019
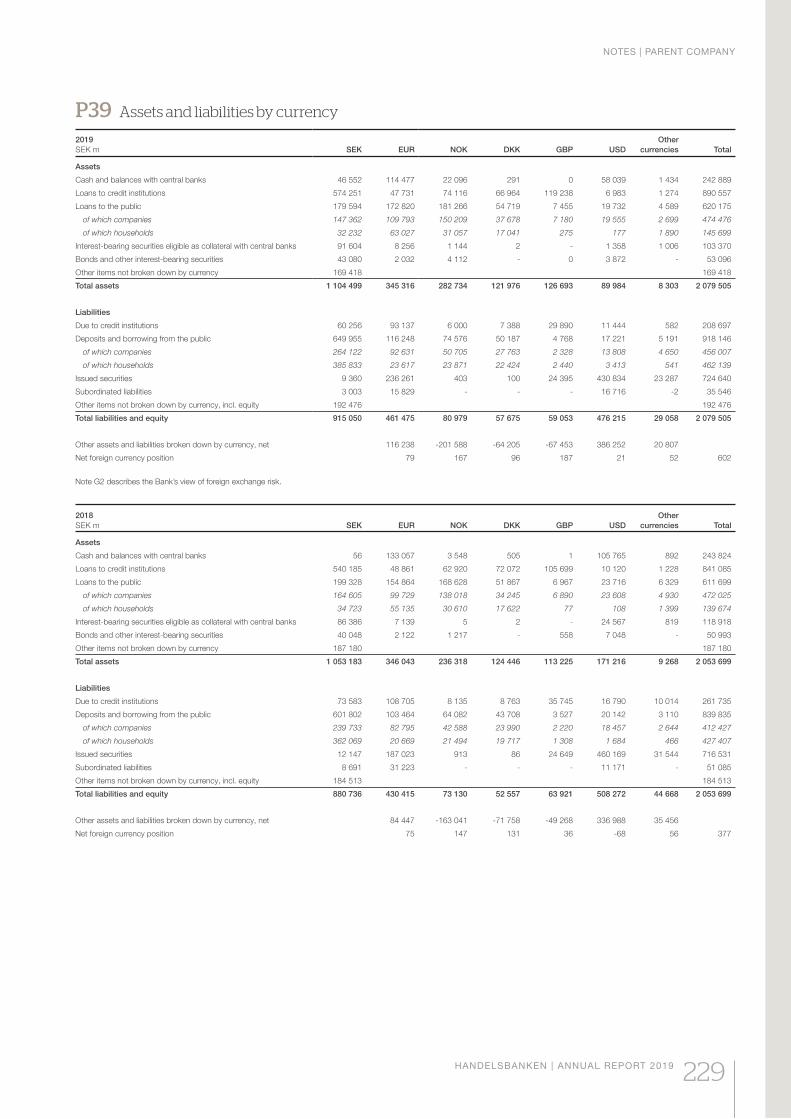
P39 Assets and liabilities by currency
2019
SEK m SEK EUR NOK DKK GBP USD
Other
currencies Total
Assets
Cash and balances with central banks 46 552 114 477 22 096 291 0 58 039 1 434 242 889
Loans to credit institutions 574 251 47 731 74 116 66 964 119 238 6 983 1 274 890 557
Loans to the public 179 594 172 820 181 266 54 719 7 455 19 732 4 589 620 175
of which companies 147 362 109 793 150 209 37 678 7 180 19 555 2 699 474 476
of which households 32 232 63 027 31 057 17 041 275 177 1 890 145 699
Interest-bearing securities eligible as collateral with central banks 91 604 8 256 1 144 2 - 1 358 1 006 103 370
Bonds and other interest-bearing securities 43 080 2 032 4 112 - 0 3 872 - 53 096
Other items not broken down by currency 169 418 169 418
Total assets 1 104 499 345 316 282 734 121 976 126 693 89 984 8 303 2 079 505
Liabilities
Due to credit institutions 60 256 93 137 6 000 7 388 29 890 11 444 582 208 697
Deposits and borrowing from the public 649 955 116 248 74 576 50 187 4 768 17 221 5 191 918 146
of which companies 264 122 92 631 50 705 27 763 2 328 13 808 4 650 456 007
of which households 385 833 23 617 23 871 22 424 2 440 3 413 541 462 139
Issued securities 9 360 236 261 403 100 24 395 430 834 23 287 724 640
Subordinated liabilities 3 003 15 829 - - - 16 716 -2 35 546
Other items not broken down by currency, incl. equity 192 476 192 476
Total liabilities and equity 915 050 461 475 80 979 57 675 59 053 476 215 29 058 2 079 505
Other assets and liabilities broken down by currency, net 116 238 -201 588 -64 205 -67 453 386 252 20 807
Net foreign currency position 79 167 96 187 21 52 602
Note G2 describes the Bank’s view of foreign exchange risk.
2018
SEK m SEK EUR NOK DKK GBP USD
Other
currencies Total
Assets
Cash and balances with central banks 56 133 057 3 548 505 1 105 765 892 243 824
Loans to credit institutions 540 185 48 861 62 920 72 072 105 699 10 120 1 228 841 085
Loans to the public 199 328 154 864 168 628 51 867 6 967 23 716 6 329 611 699
of which companies 164 605 99 729 138 018 34 245 6 890 23 608 4 930 472 025
of which households 34 723 55 135 30 610 17 622 77 108 1 399 139 674
Interest-bearing securities eligible as collateral with central banks 86 386 7 139 5 2 - 24 567 819 118 918
Bonds and other interest-bearing securities 40 048 2 122 1 217 - 558 7 048 - 50 993
Other items not broken down by currency 187 180 187 180
Total assets 1 053 183 346 043 236 318 124 446 113 225 171 216 9 268 2 053 699
Liabilities
Due to credit institutions 73 583 108 705 8 135 8 763 35 745 16 790 10 014 261 735
Deposits and borrowing from the public 601 802 103 464 64 082 43 708 3 527 20 142 3 110 839 835
of which companies 239 733 82 795 42 588 23 990 2 220 18 457 2 644 412 427
of which households 362 069 20 669 21 494 19 717 1 308 1 684 466 427 407
Issued securities 12 147 187 023 913 86 24 649 460 169 31 544 716 531
Subordinated liabilities 8 691 31 223 - - - 11 171 - 51 085
Other items not broken down by currency, incl. equity 184 513 184 513
Total liabilities and equity 880 736 430 415 73 130 52 557 63 921 508 272 44 668 2 053 699
Other assets and liabilities broken down by currency, net 84 447 -163 041 -71 758 -49 268 336 988 35 456
Net foreign currency position 75 147 131 36 -68 56 377
NOTES | PARENT COMPANY
HANDELSBANKEN | ANNUAL REPORT 2019 229
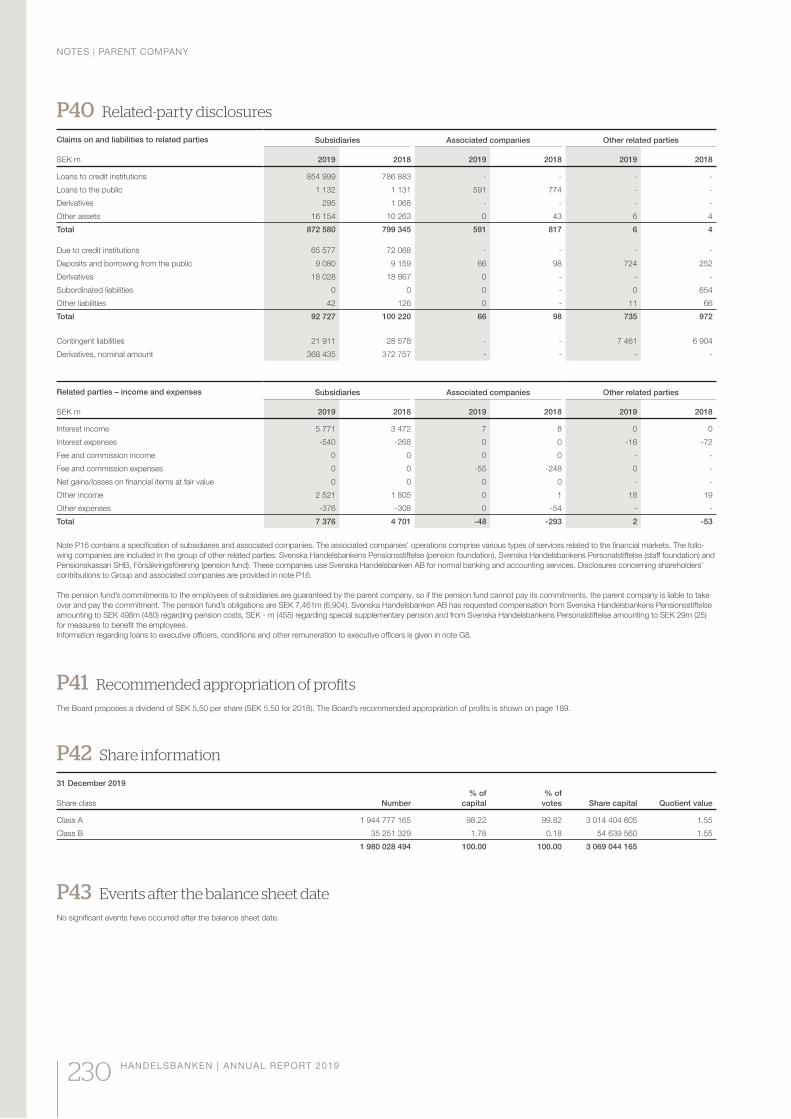
P40 Related-party disclosures
Claims on and liabilities to related parties
SEK m
Subsidiaries Associated companies Other related parties
2019 2018 2019 2018 2019 2018
Loans to credit institutions 854 999 786 883 - - - -
Loans to the public 1 132 1 131 591 774 - -
Derivatives 295 1 068 - - - -
Other assets 16 154 10 263 0 43 6 4
Total 872 580 799 345 591 817 6 4
Due to credit institutions 65 577 72 068 - - - -
Deposits and borrowing from the public 9 080 9 159 66 98 724 252
Derivatives 18 028 18 867 0 - - -
Subordinated liabilities 0 0 0 - 0 654
Other liabilities 42 126 0 - 11 66
Total 92 727 100 220 66 98 735 972
Contingent liabilities 21 911 28 578 - - 7 461 6 904
Derivatives, nominal amount 368 435 372 757 - - - -
Related parties – income and expenses
SEK m
Subsidiaries Associated companies Other related parties
2019 2018 2019 2018 2019 2018
Interest income 5 771 3 472 7 8 0 0
Interest expenses -540 -268 0 0 -16 -72
Fee and commission income 0 0 0 0 - -
Fee and commission expenses 0 0 -55 -248 0 -
Net gains/losses on financial items at fair value 0 0 0 0 - -
Other income 2 521 1 805 0 1 18 19
Other expenses -376 -308 0 -54 - -
Total 7 376 4 701 -48 -293 2 -53
Note P16 contains a specification of subsidiaries and associated companies. The associated companies’ operations comprise various types of services related to the financial markets. The follo-
wing companies are included in the group of other related parties: Svenska Handelsbankens Pensionsstiftelse (pension foundation), Svenska Handelsbankens Personalstiftelse (staff foundation) and
Pensionskassan SHB, Försäkringsförening (pension fund). These companies use Svenska Handelsbanken AB for normal banking and accounting services. Disclosures concerning shareholders’
contributions to Group and associated companies are provided in note P16.
The pension fund’s commitments to the employees of subsidiaries are guaranteed by the parent company, so if the pension fund cannot pay its commitments, the parent company is liable to take
over and pay the commitment. The pension fund’s obligations are SEK 7,461m (6,904). Svenska Handelsbanken AB has requested compensation from Svenska Handelsbankens Pensionsstiftelse
amounting to SEK 498m (480) regarding pension costs, SEK - m (455) regarding special supplementary pension and from Svenska Handelsbankens Personalstiftelse amounting to SEK 29m (25)
for measures to benefit the employees.
Information regarding loans to executive officers, conditions and other remuneration to executive officers is given in note G8.
P41 Recommended appropriation of profits
The Board proposes a dividend of SEK 5,50 per share (SEK 5.50 for 2018). The Board’s recommended appropriation of profits is shown on page 189.
P42 Share information
31 December 2019
Share class Number
% of
capital
% of
votes Share capital Quotient value
Class A 1 944 777 165 98.22 99.82 3 014 404 605 1.55
Class B 35 251 329 1.78 0.18 54 639 560 1.55
1 980 028 494 100.00 100.00 3 069 044 165
P43 Events after the balance sheet date
No significant events have occurred after the balance sheet date.
NOTES | PARENT COMPANY
230 HANDELSBANKEN | ANNUAL REPORT 2019
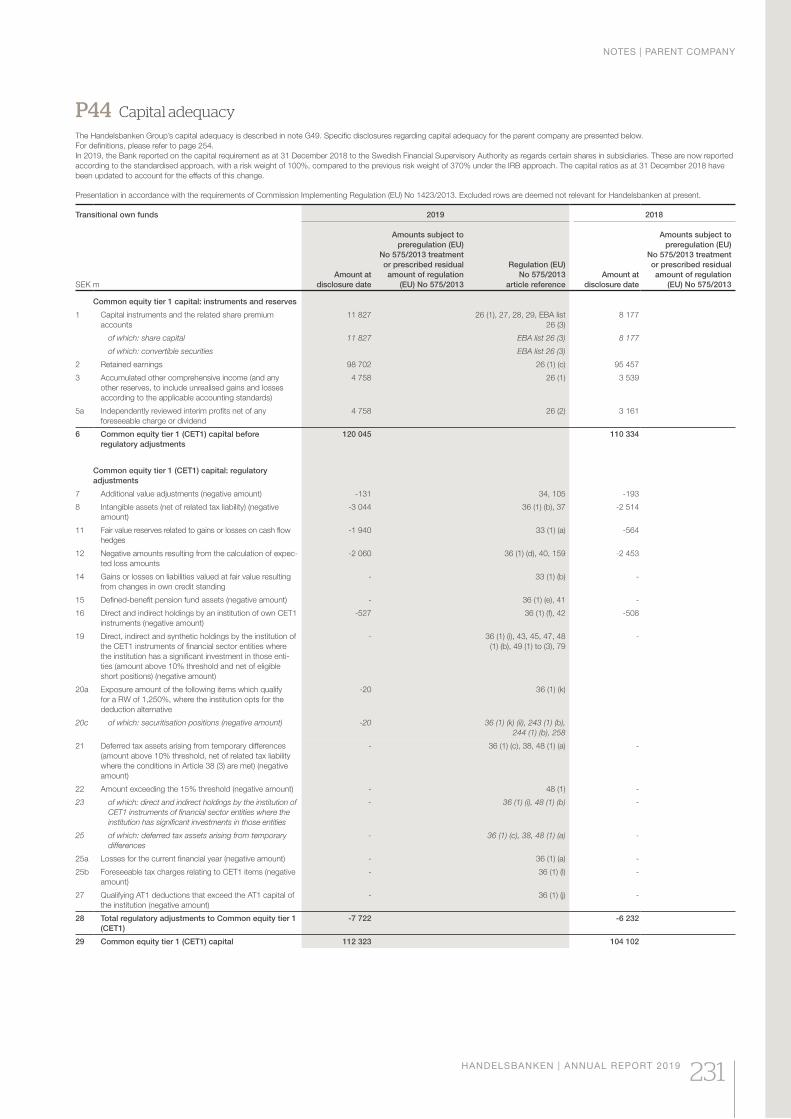
P44 Capital adequacy
The Handelsbanken Group’s capital adequacy is described in note G49. Specific disclosures regarding capital adequacy for the parent company are presented below.
For definitions, please refer to page 254.
In 2019, the Bank reported on the capital requirement as at 31 December 2018 to the Swedish Financial Supervisory Authority as regards certain shares in subsidiaries. These are now reported
according to the standardised approach, with a risk weight of 100%, compared to the previous risk weight of 370% under the IRB approach. The capital ratios as at 31 December 2018 have
been updated to account for the effects of this change.
Presentation in accordance with the requirements of Commission Implementing Regulation (EU) No 1423/2013. Excluded rows are deemed not relevant for Handelsbanken at present.
Transitional own funds
SEK m
2019 2018
Amount at
disclosure date
Amounts subject to
preregulation (EU)
No 575/2013 treatment
or prescribed residual
amount of regulation
(EU) No 575/2013
Regulation (EU)
No 575/2013
article reference
Amount at
disclosure date
Amounts subject to
preregulation (EU)
No 575/2013 treatment
or prescribed residual
amount of regulation
(EU) No 575/2013
Common equity tier 1 capital: instruments and reserves
1 Capital instruments and the related share premium
accounts
11 827 26 (1), 27, 28, 29, EBA list
26 (3)
8 177
of which: share capital 11 827 EBA list 26 (3) 8 177
of which: convertible securities EBA list 26 (3)
2 Retained earnings 98 702 26 (1) (c) 95 457
3 Accumulated other comprehensive income (and any
other reserves, to include unrealised gains and losses
according to the applicable accounting standards)
4 758 26 (1) 3 539
5a Independently reviewed interim profits net of any
foreseeable charge or dividend
4 758 26 (2) 3 161
6 Common equity tier 1 (CET1) capital before
regulatory adjustments
120 045 110 334
Common equity tier 1 (CET1) capital: regulatory
adjustments
7 Additional value adjustments (negative amount) -131 34, 105 -193
8 Intangible assets (net of related tax liability) (negative
amount)
-3 044 36 (1) (b), 37 -2 514
11 Fair value reserves related to gains or losses on cash flow
hedges
-1 940 33 (1) (a) -564
12 Negative amounts resulting from the calculation of expec-
ted loss amounts
-2 060 36 (1) (d), 40, 159 -2 453
14 Gains or losses on liabilities valued at fair value resulting
from changes in own credit standing
- 33 (1) (b) -
15 Defined-benefit pension fund assets (negative amount) - 36 (1) (e), 41 -
16 Direct and indirect holdings by an institution of own CET1
instruments (negative amount)
-527 36 (1) (f), 42 -508
19 Direct, indirect and synthetic holdings by the institution of
the CET1 instruments of financial sector entities where
the institution has a significant investment in those enti-
ties (amount above 10% threshold and net of eligible
short positions) (negative amount)
- 36 (1) (i), 43, 45, 47, 48
(1) (b), 49 (1) to (3), 79
-
20a Exposure amount of the following items which qualify
for a RW of 1,250%, where the institution opts for the
deduction alternative
-20 36 (1) (k)
20c of which: securitisation positions (negative amount) -20 36 (1) (k) (ii), 243 (1) (b),
244 (1) (b), 258
21 Deferred tax assets arising from temporary differences
(amount above 10% threshold, net of related tax liability
where the conditions in Article 38 (3) are met) (negative
amount)
- 36 (1) (c), 38, 48 (1) (a) -
22 Amount exceeding the 15% threshold (negative amount) - 48 (1) -
23 of which: direct and indirect holdings by the institution of
CET1 instruments of financial sector entities where the
institution has significant investments in those entities
- 36 (1) (i), 48 (1) (b) -
25 of which: deferred tax assets arising from temporary
differences
- 36 (1) (c), 38, 48 (1) (a) -
25a Losses for the current financial year (negative amount) - 36 (1) (a) -
25b Foreseeable tax charges relating to CET1 items (negative
amount)
- 36 (1) (l) -
27 Qualifying AT1 deductions that exceed the AT1 capital of
the institution (negative amount)
- 36 (1) (j) -
28 Total regulatory adjustments to Common equity tier 1
(CET1)
-7 722 -6 232
29 Common equity tier 1 (CET1) capital 112 323 104 102
NOTES | PARENT COMPANY
HANDELSBANKEN | ANNUAL REPORT 2019 231
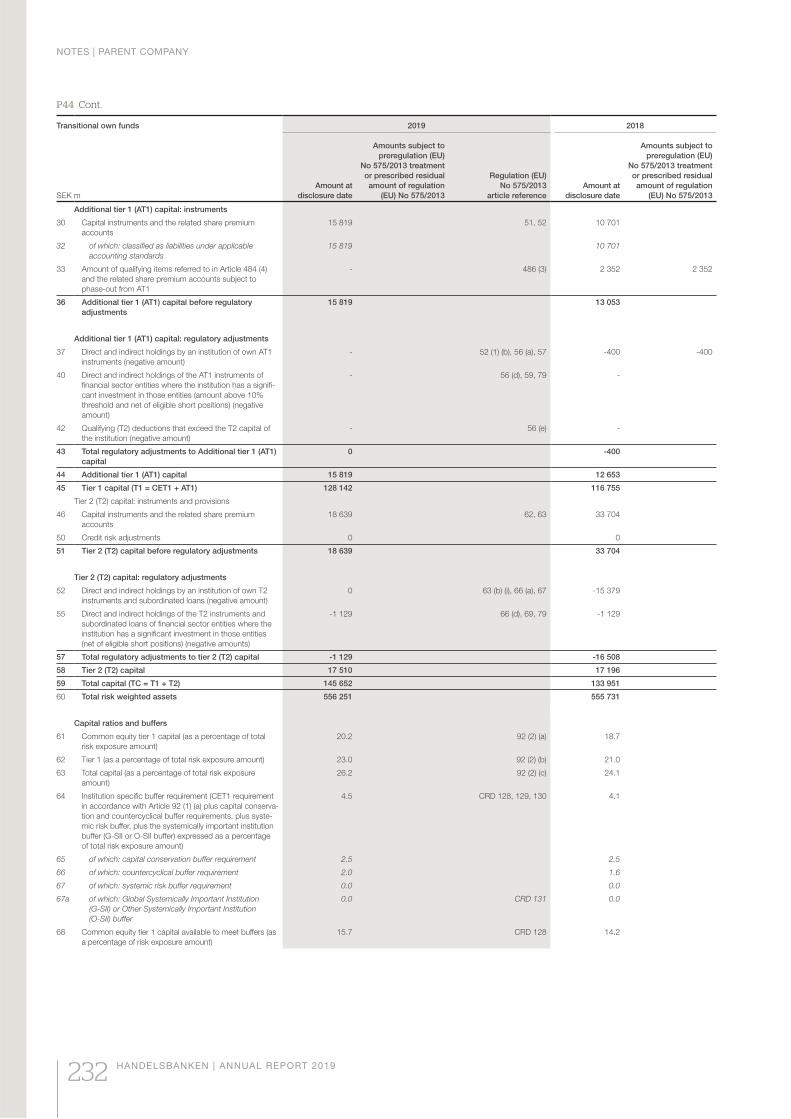
P44 Cont.
Transitional own funds
SEK m
2019 2018
Amount at
disclosure date
Amounts subject to
preregulation (EU)
No 575/2013 treatment
or prescribed residual
amount of regulation
(EU) No 575/2013
Regulation (EU)
No 575/2013
article reference
Amount at
disclosure date
Amounts subject to
preregulation (EU)
No 575/2013 treatment
or prescribed residual
amount of regulation
(EU) No 575/2013
Additional tier 1 (AT1) capital: instruments
30 Capital instruments and the related share premium
accounts
15 819 51, 52 10 701
32 of which: classified as liabilities under applicable
accounting standards
15 819 10 701
33 Amount of qualifying items referred to in Article 484 (4)
and the related share premium accounts subject to
phase-out from AT1
- 486 (3) 2 352 2 352
36 Additional tier 1 (AT1) capital before regulatory
adjustments
15 819 13 053
Additional tier 1 (AT1) capital: regulatory adjustments
37 Direct and indirect holdings by an institution of own AT1
instruments (negative amount)
- 52 (1) (b), 56 (a), 57 -400 -400
40 Direct and indirect holdings of the AT1 instruments of
financial sector entities where the institution has a signifi-
cant investment in those entities (amount above 10%
threshold and net of eligible short positions) (negative
amount)
- 56 (d), 59, 79 -
42 Qualifying (T2) deductions that exceed the T2 capital of
the institution (negative amount)
- 56 (e) -
43 Total regulatory adjustments to Additional tier 1 (AT1)
capital
0 -400
44 Additional tier 1 (AT1) capital 15 819 12 653
45 Tier 1 capital (T1 = CET1 + AT1) 128 142 116 755
Tier 2 (T2) capital: instruments and provisions
46 Capital instruments and the related share premium
accounts
18 639 62, 63 33 704
50 Credit risk adjustments 0 0
51 Tier 2 (T2) capital before regulatory adjustments 18 639 33 704
Tier 2 (T2) capital: regulatory adjustments
52 Direct and indirect holdings by an institution of own T2
instruments and subordinated loans (negative amount)
0 63 (b) (i), 66 (a), 67 -15 379
55 Direct and indirect holdings of the T2 instruments and
subordinated loans of financial sector entities where the
institution has a significant investment in those entities
(net of eligible short positions) (negative amounts)
-1 129 66 (d), 69, 79 -1 129
57 Total regulatory adjustments to tier 2 (T2) capital -1 129 -16 508
58 Tier 2 (T2) capital 17 510 17 196
59 Total capital (TC = T1 + T2) 145 652 133 951
60 Total risk weighted assets 556 251 555 731
Capital ratios and buffers
61 Common equity tier 1 capital (as a percentage of total
risk exposure amount)
20.2 92 (2) (a) 18.7
62 Tier 1 (as a percentage of total risk exposure amount) 23.0 92 (2) (b) 21.0
63 Total capital (as a percentage of total risk exposure
amount)
26.2 92 (2) (c) 24.1
64 Institution specific buffer requirement (CET1 requirement
in accordance with Article 92 (1) (a) plus capital conserva-
tion and countercyclical buffer requirements, plus syste-
mic risk buffer, plus the systemically important institution
buffer (G-SII or O-SII buffer) expressed as a percentage
of total risk exposure amount)
4.5 CRD 128, 129, 130 4.1
65 of which: capital conservation buffer requirement 2.5 2.5
66 of which: countercyclical buffer requirement 2.0 1.6
67 of which: systemic risk buffer requirement 0.0 0.0
67a of which: Global Systemically Important Institution
(G-SII) or Other Systemically Important Institution
(O-SII) buffer
0.0 CRD 131 0.0
68 Common equity tier 1 capital available to meet buffers (as
a percentage of risk exposure amount)
15.7 CRD 128 14.2
NOTES | PARENT COMPANY
232 HANDELSBANKEN | ANNUAL REPORT 2019
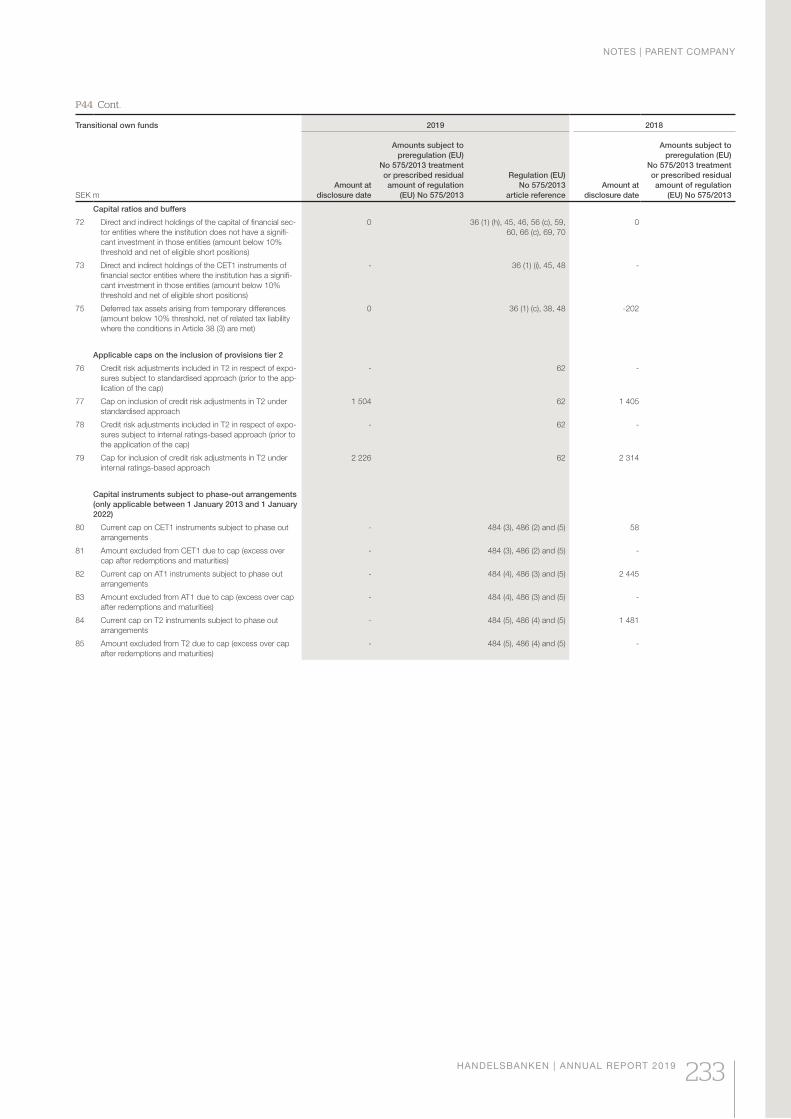
Transitional own funds
SEK m
2019 2018
Amount at
disclosure date
Amounts subject to
preregulation (EU)
No 575/2013 treatment
or prescribed residual
amount of regulation
(EU) No 575/2013
Regulation (EU)
No 575/2013
article reference
Amount at
disclosure date
Amounts subject to
preregulation (EU)
No 575/2013 treatment
or prescribed residual
amount of regulation
(EU) No 575/2013
Capital ratios and buffers
72 Direct and indirect holdings of the capital of financial sec-
tor entities where the institution does not have a signifi-
cant investment in those entities (amount below 10%
threshold and net of eligible short positions)
0 36 (1) (h), 45, 46, 56 (c), 59,
60, 66 (c), 69, 70
0
73 Direct and indirect holdings of the CET1 instruments of
financial sector entities where the institution has a signifi-
cant investment in those entities (amount below 10%
threshold and net of eligible short positions)
- 36 (1) (i), 45, 48 -
75 Deferred tax assets arising from temporary differences
(amount below 10% threshold, net of related tax liability
where the conditions in Article 38 (3) are met)
0 36 (1) (c), 38, 48 -202
Applicable caps on the inclusion of provisions tier 2
76 Credit risk adjustments included in T2 in respect of expo-
sures subject to standardised approach (prior to the app-
lication of the cap)
- 62 -
77 Cap on inclusion of credit risk adjustments in T2 under
standardised approach
1 504 62 1 405
78 Credit risk adjustments included in T2 in respect of expo-
sures subject to internal ratings-based approach (prior to
the application of the cap)
- 62 -
79 Cap for inclusion of credit risk adjustments in T2 under
internal ratings-based approach
2 226 62 2 314
Capital instruments subject to phase-out arrangements
(only applicable between 1 January 2013 and 1 January
2022)
80 Current cap on CET1 instruments subject to phase out
arrangements
- 484 (3), 486 (2) and (5) 58
81 Amount excluded from CET1 due to cap (excess over
cap after redemptions and maturities)
- 484 (3), 486 (2) and (5) -
82 Current cap on AT1 instruments subject to phase out
arrangements
- 484 (4), 486 (3) and (5) 2 445
83 Amount excluded from AT1 due to cap (excess over cap
after redemptions and maturities)
- 484 (4), 486 (3) and (5) -
84 Current cap on T2 instruments subject to phase out
arrangements
- 484 (5), 486 (4) and (5) 1 481
85 Amount excluded from T2 due to cap (excess over cap
after redemptions and maturities)
- 484 (5), 486 (4) and (5) -
P44 Cont.
NOTES | PARENT COMPANY
HANDELSBANKEN | ANNUAL REPORT 2019 233
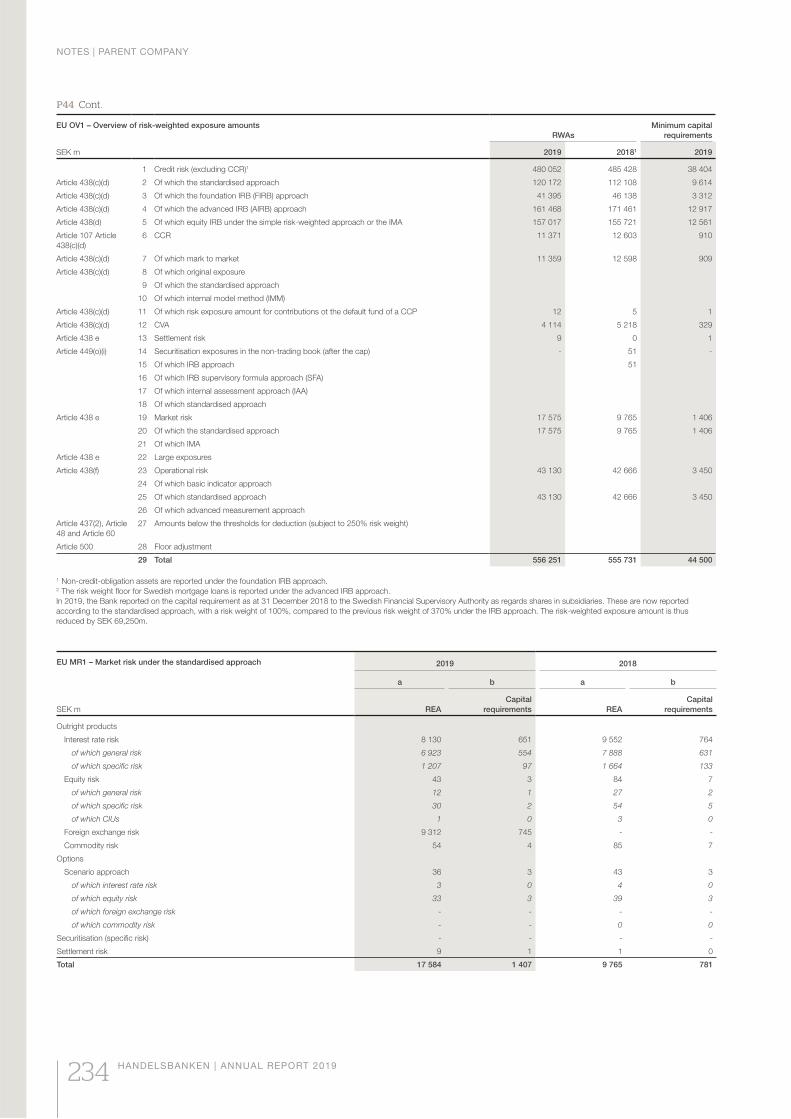
EU MR1 – Market risk under the standardised approach
SEK m
2019 2018
a b a b
REA
Capital
requirements REA
Capital
requirements
Outright products
Interest rate risk 8 130 651 9 552 764
of which general risk 6 923 554 7 888 631
of which specific risk 1 207 97 1 664 133
Equity risk 43 3 84 7
of which general risk 12 1 27 2
of which specific risk 30 2 54 5
of which CIUs 1 0 3 0
Foreign exchange risk 9 312 745 - -
Commodity risk 54 4 85 7
Options
Scenario approach 36 3 43 3
of which interest rate risk 3 0 4 0
of which equity risk 33 3 39 3
of which foreign exchange risk - - - -
of which commodity risk - - 0 0
Securitisation (specific risk) - - - -
Settlement risk 9 1 1 0
Total 17 584 1 407 9 765 781
EU OV1 – Overview of risk-weighted exposure amounts
RWAs
Minimum capital
requirements
SEK m 2019 20181 2019
1 Credit risk (excluding CCR)1 480 052 485 428 38 404
Article 438(c)(d) 2 Of which the standardised approach 120 172 112 108 9 614
Article 438(c)(d) 3 Of which the foundation IRB (FIRB) approach 41 395 46 138 3 312
Article 438(c)(d) 4 Of which the advanced IRB (AIRB) approach 161 468 171 461 12 917
Article 438(d) 5 Of which equity IRB under the simple risk-weighted approach or the IMA 157 017 155 721 12 561
Article 107 Article
438(c)(d)
6 CCR 11 371 12 603 910
Article 438(c)(d) 7 Of which mark to market 11 359 12 598 909
Article 438(c)(d) 8 Of which original exposure
9 Of which the standardised approach
10 Of which internal model method (IMM)
Article 438(c)(d) 11 Of which risk exposure amount for contributions ot the default fund of a CCP 12 5 1
Article 438(c)(d) 12 CVA 4 114 5 218 329
Article 438 e 13 Settlement risk 9 0 1
Article 449(o)(i) 14 Securitisation exposures in the non-trading book (after the cap) - 51 -
15 Of which IRB approach 51
16 Of which IRB supervisory formula approach (SFA)
17 Of which internal assessment approach (IAA)
18 Of which standardised approach
Article 438 e 19 Market risk 17 575 9 765 1 406
20 Of which the standardised approach 17 575 9 765 1 406
21 Of which IMA
Article 438 e 22 Large exposures
Article 438(f) 23 Operational risk 43 130 42 666 3 450
24 Of which basic indicator approach
25 Of which standardised approach 43 130 42 666 3 450
26 Of which advanced measurement approach
Article 437(2), Article
48 and Article 60
27 Amounts below the thresholds for deduction (subject to 250% risk weight)
Article 500 28 Floor adjustment
29 Total 556 251 555 731 44 500
1 Non-credit-obligation assets are reported under the foundation IRB approach.2 The risk weight floor for Swedish mortgage loans is reported under the advanced IRB approach.
In 2019, the Bank reported on the capital requirement as at 31 December 2018 to the Swedish Financial Supervisory Authority as regards shares in subsidiaries. These are now reported
accor ding to the standardised approach, with a risk weight of 100%, compared to the previous risk weight of 370% under the IRB approach. The risk-weighted exposure amount is thus
r educed by SEK 69,250m.
P44 Cont.
NOTES | PARENT COMPANY
234 HANDELSBANKEN | ANNUAL REPORT 2019
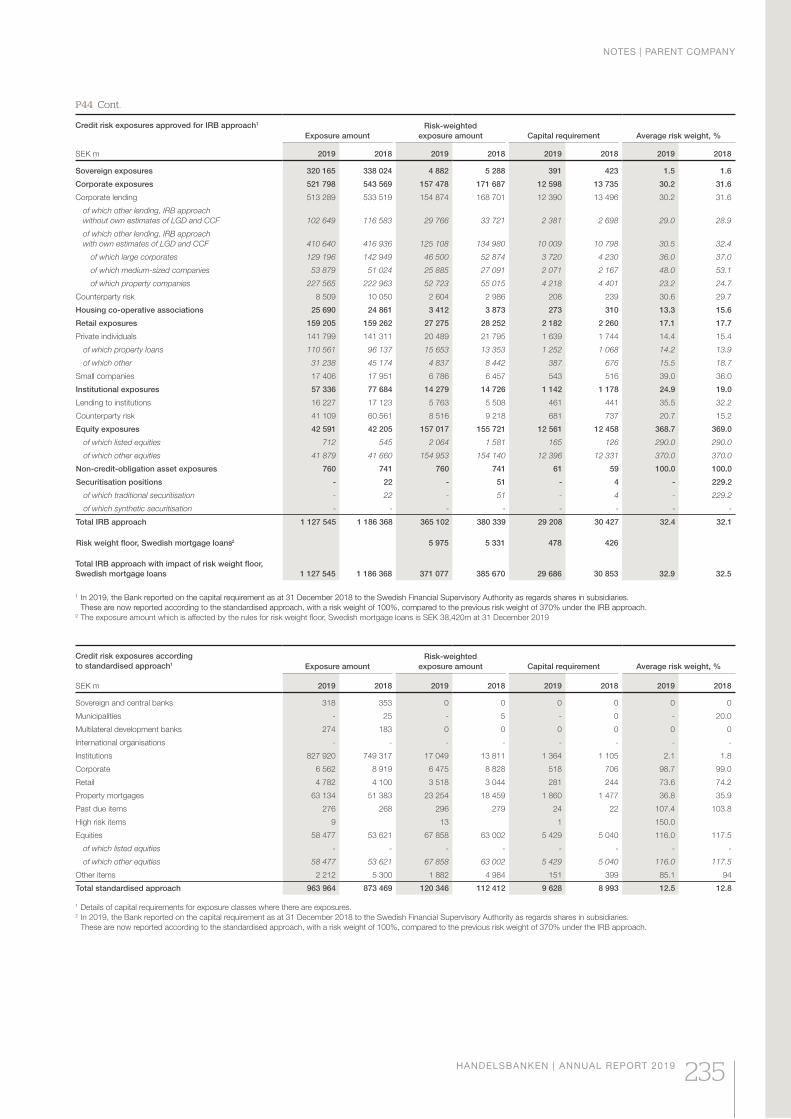
Credit risk exposures approved for IRB approach1
SEK m
Exposure amount
Risk-weighted
exposure amount Capital requirement Average risk weight, %
2019 2018 2019 2018 2019 2018 2019 2018
Sovereign exposures 320 165 338 024 4 882 5 288 391 423 1.5 1.6
Corporate exposures 521 798 543 569 157 478 171 687 12 598 13 735 30.2 31.6
Corporate lending 513 289 533 519 154 874 168 701 12 390 13 496 30.2 31.6
of which other lending, IRB approach
without own estimates of LGD and CCF 102 649 116 583 29 766 33 721 2 381 2 698 29.0 28.9
of which other lending, IRB approach
with own estimates of LGD and CCF 410 640 416 936 125 108 134 980 10 009 10 798 30.5 32.4
of which large corporates 129 196 142 949 46 500 52 874 3 720 4 230 36.0 37.0
of which medium-sized companies 53 879 51 024 25 885 27 091 2 071 2 167 48.0 53.1
of which property companies 227 565 222 963 52 723 55 015 4 218 4 401 23.2 24.7
Counterparty risk 8 509 10 050 2 604 2 986 208 239 30.6 29.7
Housing co-operative associations 25 690 24 861 3 412 3 873 273 310 13.3 15.6
Retail exposures 159 205 159 262 27 275 28 252 2 182 2 260 17.1 17.7
Private individuals 141 799 141 311 20 489 21 795 1 639 1 744 14.4 15.4
of which property loans 110 561 96 137 15 653 13 353 1 252 1 068 14.2 13.9
of which other 31 238 45 174 4 837 8 442 387 676 15.5 18.7
Small companies 17 406 17 951 6 786 6 457 543 516 39.0 36.0
Institutional exposures 57 336 77 684 14 279 14 726 1 142 1 178 24.9 19.0
Lending to institutions 16 227 17 123 5 763 5 508 461 441 35.5 32.2
Counterparty risk 41 109 60 561 8 516 9 218 681 737 20.7 15.2
Equity exposures 42 591 42 205 157 017 155 721 12 561 12 458 368.7 369.0
of which listed equities 712 545 2 064 1 581 165 126 290.0 290.0
of which other equities 41 879 41 660 154 953 154 140 12 396 12 331 370.0 370.0
Non-credit-obligation asset exposures 760 741 760 741 61 59 100.0 100.0
Securitisation positions - 22 - 51 - 4 - 229.2
of which traditional securitisation - 22 - 51 - 4 - 229.2
of which synthetic securitisation - - - - - - - -
Total IRB approach 1 127 545 1 186 368 365 102 380 339 29 208 30 427 32.4 32.1
Risk weight floor, Swedish mortgage loans2 5 975 5 331 478 426
Total IRB approach with impact of risk weight floor,
Swedish mortgage loans 1 127 545 1 186 368 371 077 385 670 29 686 30 853 32.9 32.5
1 In 2019, the Bank reported on the capital requirement as at 31 December 2018 to the Swedish Financial Supervisory Authority as regards shares in subsidiaries.
These are now reported accor ding to the standardised approach, with a risk weight of 100%, compared to the previous risk weight of 370% under the IRB approach.2 The exposure amount which is affected by the rules for risk weight floor, Swedish mortgage loans is SEK 38,420m at 31 December 2019
Credit risk exposures according
to standardised approach1
SEK m
Exposure amount
Risk-weighted
exposure amount Capital requirement Average risk weight, %
2019 2018 2019 2018 2019 2018 2019 2018
Sovereign and central banks 318 353 0 0 0 0 0 0
Municipalities - 25 - 5 - 0 - 20.0
Multilateral development banks 274 183 0 0 0 0 0 0
International organisations - - - - - - - -
Institutions 827 920 749 317 17 049 13 811 1 364 1 105 2.1 1.8
Corporate 6 562 8 919 6 475 8 828 518 706 98.7 99.0
Retail 4 782 4 100 3 518 3 044 281 244 73.6 74.2
Property mortgages 63 134 51 383 23 254 18 459 1 860 1 477 36.8 35.9
Past due items 276 268 296 279 24 22 107.4 103.8
High risk items 9 13 1 150.0
Equities 58 477 53 621 67 858 63 002 5 429 5 040 116.0 117.5
of which listed equities - - - - - - - -
of which other equities 58 477 53 621 67 858 63 002 5 429 5 040 116.0 117.5
Other items 2 212 5 300 1 882 4 984 151 399 85.1 94
Total standardised approach 963 964 873 469 120 346 112 412 9 628 8 993 12.5 12.8
1 Details of capital requirements for exposure classes where there are exposures. 2 In 2019, the Bank reported on the capital requirement as at 31 December 2018 to the Swedish Financial Supervisory Authority as regards shares in subsidiaries.
These are now reported accor ding to the standardised approach, with a risk weight of 100%, compared to the previous risk weight of 370% under the IRB approach.
P44 Cont.
NOTES | PARENT COMPANY
HANDELSBANKEN | ANNUAL REPORT 2019 235
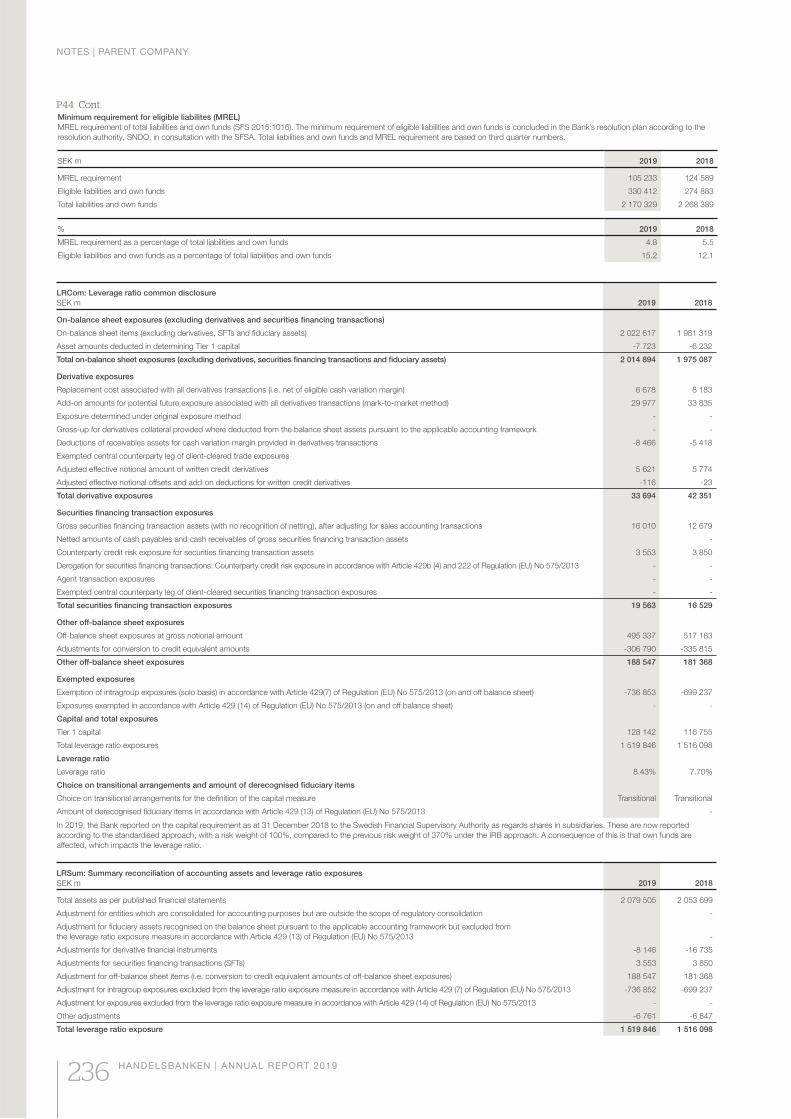
P44 Cont.
LRSum: Summary reconciliation of accounting assets and leverage ratio exposures
SEK m 2019 2018
Total assets as per published financial statements 2 079 505 2 053 699
Adjustment for entities which are consolidated for accounting purposes but are outside the scope of regulatory consolidation -
Adjustment for fiduciary assets recognised on the balance sheet pursuant to the applicable accounting framework but excluded from
the leverage ratio exposure measure in accordance with Article 429 (13) of Regulation (EU) No 575/2013 -
Adjustments for derivative financial instruments -8 146 -16 735
Adjustments for securities financing transactions (SFTs) 3 553 3 850
Adjustment for off-balance sheet items (i.e. conversion to credit equivalent amounts of off-balance sheet exposures) 188 547 181 368
Adjustment for intragroup exposures excluded from the leverage ratio exposure measure in accordance with Article 429 (7) of Regulation (EU) No 575/2013 -736 852 -699 237
Adjustment for exposures excluded from the leverage ratio exposure measure in accordance with Article 429 (14) of Regulation (EU) No 575/2013 - -
Other adjustments -6 761 -6 847
Total leverage ratio exposure 1 519 846 1 516 098
LRCom: Leverage ratio common disclosure
SEK m 2019 2018
On-balance sheet exposures (excluding derivatives and securities financing transactions)
On-balance sheet items (excluding derivatives, SFTs and fiduciary assets) 2 022 617 1 981 319
Asset amounts deducted in determining Tier 1 capital -7 723 -6 232
Total on-balance sheet exposures (excluding derivatives, securities financing transactions and fiduciary assets) 2 014 894 1 975 087
Derivative exposures
Replacement cost associated with all derivatives transactions (i.e. net of eligible cash variation margin) 6 678 8 183
Add-on amounts for potential future exposure associated with all derivatives transactions (mark-to-market method) 29 977 33 835
Exposure determined under original exposure method - -
Gross-up for derivatives collateral provided where deducted from the balance sheet assets pursuant to the applicable accounting framework - -
Deductions of receivables assets for cash variation margin provided in derivatives transactions -8 466 -5 418
Exempted central counterparty leg of client-cleared trade exposures
Adjusted effective notional amount of written credit derivatives 5 621 5 774
Adjusted effective notional offsets and add-on deductions for written credit derivatives -116 -23
Total derivative exposures 33 694 42 351
Securities financing transaction exposures
Gross securities financing transaction assets (with no recognition of netting), after adjusting for sales accounting transactions 16 010 12 679
Netted amounts of cash payables and cash receivables of gross securities financing transaction assets -
Counterparty credit risk exposure for securities financing transaction assets 3 553 3 850
Derogation for securities financing transactions: Counterparty credit risk exposure in accordance with Article 429b (4) and 222 of Regulation (EU) No 575/2013 - -
Agent transaction exposures - -
Exempted central counterparty leg of client-cleared securities financing transaction exposures - -
Total securities financing transaction exposures 19 563 16 529
Other off-balance sheet exposures
Off-balance sheet exposures at gross notional amount 495 337 517 183
Adjustments for conversion to credit equivalent amounts -306 790 -335 815
Other off-balance sheet exposures 188 547 181 368
Exempted exposures
Exemption of intragroup exposures (solo basis) in accordance with Article 429(7) of Regulation (EU) No 575/2013 (on and off balance sheet) -736 853 -699 237
Exposures exempted in accordance with Article 429 (14) of Regulation (EU) No 575/2013 (on and off balance sheet) - -
Capital and total exposures
Tier 1 capital 128 142 116 755
Total leverage ratio exposures 1 519 846 1 516 098
Leverage ratio
Leverage ratio 8.43% 7.70%
Choice on transitional arrangements and amount of derecognised fiduciary items
Choice on transitional arrangements for the definition of the capital measure Transitional Transitional
Amount of derecognised fiduciary items in accordance with Article 429 (13) of Regulation (EU) No 575/2013 -
In 2019, the Bank reported on the capital requirement as at 31 December 2018 to the Swedish Financial Supervisory Authority as regards shares in subsidiaries. These are now reported
accor ding to the standardised approach, with a risk weight of 100%, compared to the previous risk weight of 370% under the IRB approach. A consequence of this is that own funds are
affected, which impacts the leverage ratio.
Minimum requirement for eligible liabilites (MREL)
MREL requirement of total liabilities and own funds (SFS 2015:1016). The minimum requirement of eligible liabilities and own funds is concluded in the Bank’s resolution plan according to the
resolution authority, SNDO, in consultation with the SFSA. Total liabilities and own funds and MREL requirement are based on third quarter numbers.
SEK m 2019 2018
MREL requirement 105 233 124 589
Eligible liabilities and own funds 330 412 274 883
Total liabilities and own funds 2 170 329 2 268 389
% 2019 2018
MREL requirement as a percentage of total liabilities and own funds 4.8 5.5
Eligible liabilities and own funds as a percentage of total liabilities and own funds 15.2 12.1
NOTES | PARENT COMPANY
236 HANDELSBANKEN | ANNUAL REPORT 2019
STOCKHOLM, 4 FEBRUARY 2020
Pär Boman Fredrik Lundberg
Chairman of the Board Vice Chairman
Jon Fredrik Baksaas Hans Biörck Kerstin Hessius
Board Member Board Member Board Member
Jan-Erik Höög Ole Johansson Lise Kaae
styrelseledamot Board Member Board Member
Bente Rathe Charlotte Skog
Board Member Board Member
Carina Åkerström
President and Group Chief Executive
Signatures of the Board and the Group Chief Executive
We hereby declare that the consolidated accounts were prepared in accordance with international financial reporting
standards as referred to in the Regulation (EC) No 1606/2002 of the European Parliament and of the Council of 19
July 2002 on the application of international accounting standards, that the parent company’s annual accounts were
prepared in accordance with sound accounting practices for stock market companies, that the annual accounts and
consolidated accounts give a fair presentation of the Group’s and the parent company’s financial position and
performance, and that the statutory administration report provides a fair view of the parent company’s and Group’s
operations, financial position and performance and describes material risks and uncertainties to which the parent
company and other companies in the Group are exposed.
SIGNATURES OF THE BOARD AND THE GROUP CHIEF EXECUTIVE
HANDELSBANKEN | ANNUAL REPORT 2019 237
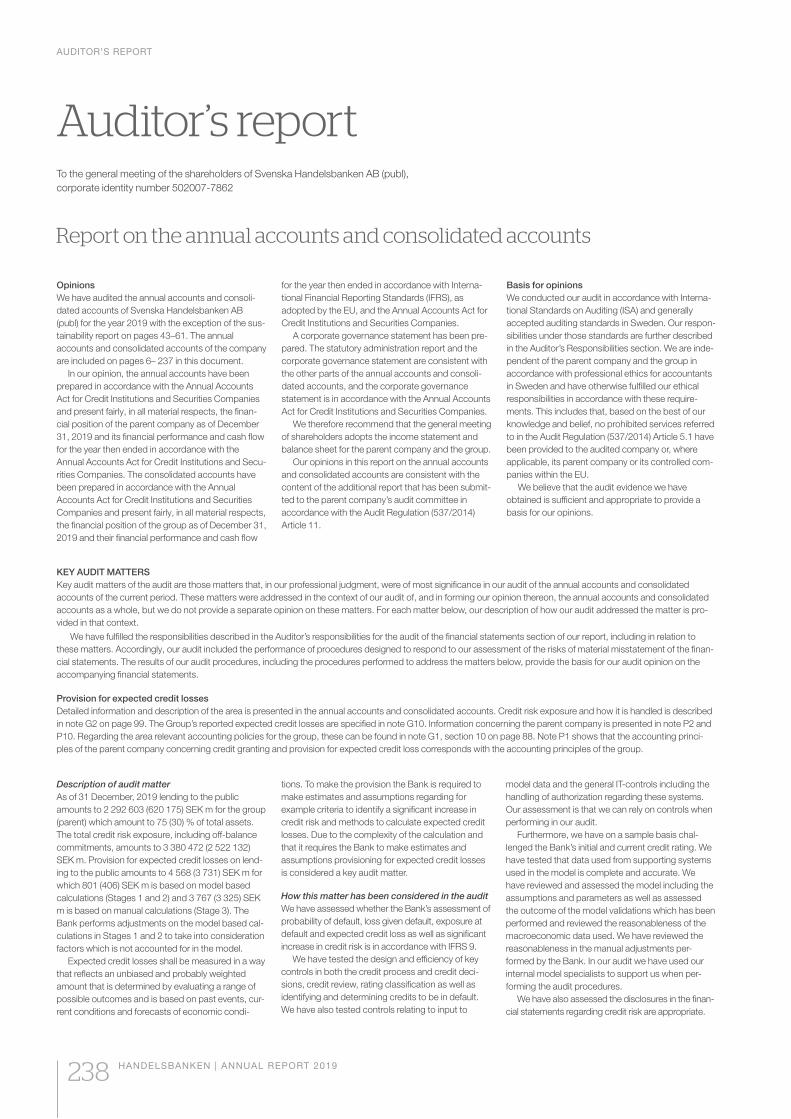
Auditor’s report
Opinions
We have audited the annual accounts and consoli-
dated accounts of Svenska Handelsbanken AB
(publ) for the year 2019 with the exception of the sus-
tainability report on pages 43–61. The annual
accounts and consolidated accounts of the company
are included on pages 6– 237 in this document.
In our opinion, the annual accounts have been
prepared in accordance with the Annual Accounts
Act for Credit Institutions and Securities Companies
and present fairly, in all material respects, the finan-
cial position of the parent company as of December
31, 2019 and its financial performance and cash flow
for the year then ended in accordance with the
Annual Accounts Act for Credit Institutions and Secu-
rities Companies. The consolidated accounts have
been prepared in accordance with the Annual
Accounts Act for Credit Institutions and Securities
Companies and present fairly, in all material respects,
the financial position of the group as of December 31,
2019 and their financial performance and cash flow
for the year then ended in accordance with Interna-
tional Financial Reporting Standards (IFRS), as
adopted by the EU, and the Annual Accounts Act for
Credit Institutions and Securities Companies.
A corporate governance statement has been pre-
pared. The statutory administration report and the
corporate governance statement are consistent with
the other parts of the annual accounts and consoli-
dated accounts, and the corporate governance
statement is in accordance with the Annual Accounts
Act for Credit Institutions and Securities Companies.
We therefore recommend that the general meeting
of shareholders adopts the income statement and
balance sheet for the parent company and the group.
Our opinions in this report on the annual accounts
and consolidated accounts are consistent with the
content of the additional report that has been submit-
ted to the parent company’s audit committee in
accordance with the Audit Regulation (537/2014)
Article 11.
Basis for opinions
We conducted our audit in accordance with Interna-
tional Standards on Auditing (ISA) and generally
accepted auditing standards in Sweden. Our respon-
sibilities under those standards are further described
in the Auditor’s Responsibilities section. We are inde-
pendent of the parent company and the group in
accordance with professional ethics for accountants
in Sweden and have otherwise fulfilled our ethical
responsibilities in accordance with these require-
ments. This includes that, based on the best of our
knowledge and belief, no prohibited services referred
to in the Audit Regulation (537/2014) Article 5.1 have
been provided to the audited company or, where
applicable, its parent company or its controlled com-
panies within the EU.
We believe that the audit evidence we have
obtained is sufficient and appropriate to provide a
basis for our opinions.
To the general meeting of the shareholders of Svenska Handelsbanken AB (publ),
corporate identity number 502007-7862
KEY AUDIT MATTERS
Key audit matters of the audit are those matters that, in our professional judgment, were of most significance in our audit of the annual accounts and consolidated
accounts of the current period. These matters were addressed in the context of our audit of, and in forming our opinion thereon, the annual accounts and consolidated
accounts as a whole, but we do not provide a separate opinion on these matters. For each matter below, our description of how our audit addressed the matter is pro-
vided in that context.
We have fulfilled the responsibilities described in the Auditor’s responsibilities for the audit of the financial statements section of our report, including in relation to
these matters. Accordingly, our audit included the performance of procedures designed to respond to our assessment of the risks of material misstatement of the finan-
cial statements. The results of our audit procedures, including the procedures performed to address the matters below, provide the basis for our audit opinion on the
accompanying financial statements.
Provision for expected credit losses
Detailed information and description of the area is presented in the annual accounts and consolidated accounts. Credit risk exposure and how it is handled is described
in note G2 on page 99. The Group’s reported expected credit losses are specified in note G10. Information concerning the parent company is presented in note P2 and
P10. Regarding the area relevant accounting policies for the group, these can be found in note G1, section 10 on page 88. Note P1 shows that the accounting princi-
ples of the parent company concerning credit granting and provision for expected credit loss corresponds with the accounting principles of the group.
Description of audit matter
As of 31 December, 2019 lending to the public
amounts to 2 292 603 (620 175) SEK m for the group
(parent) which amount to 75 (30) % of total assets.
The total credit risk exposure, including off-balance
commitments, amounts to 3 380 472 (2 522 132)
SEK m. Provision for expected credit losses on lend-
ing to the public amounts to 4 568 (3 731) SEK m for
which 801 (406) SEK m is based on model based
calculations (Stages 1 and 2) and 3 767 (3 325) SEK
m is based on manual calculations (Stage 3). The
Bank performs adjustments on the model based cal-
culations in Stages 1 and 2 to take into consideration
factors which is not accounted for in the model.
Expected credit losses shall be measured in a way
that reflects an unbiased and probably weighted
amount that is determined by evaluating a range of
possible outcomes and is based on past events, cur-
rent conditions and forecasts of economic condi-
tions. To make the provision the Bank is required to
make estimates and assumptions regarding for
example criteria to identify a significant increase in
credit risk and methods to calculate expected credit
losses. Due to the complexity of the calculation and
that it requires the Bank to make estimates and
assumptions provisioning for expected credit losses
is considered a key audit matter.
How this matter has been considered in the audit
We have assessed whether the Bank’s assessment of
probability of default, loss given default, exposure at
default and expected credit loss as well as significant
increase in credit risk is in accordance with IFRS 9.
We have tested the design and efficiency of key
controls in both the credit process and credit deci-
sions, credit review, rating classification as well as
identifying and determining credits to be in default.
We have also tested controls relating to input to
model data and the general IT-controls including the
handling of authorization regarding these systems.
Our assessment is that we can rely on controls when
performing in our audit.
Furthermore, we have on a sample basis chal-
lenged the Bank’s initial and current credit rating. We
have tested that data used from supporting systems
used in the model is complete and accurate. We
have reviewed and assessed the model including the
assumptions and parameters as well as assessed
the outcome of the model validations which has been
performed and reviewed the reasonableness of the
macroeconomic data used. We have reviewed the
reasonableness in the manual adjustments per-
formed by the Bank. In our audit we have used our
internal model specialists to support us when per-
forming the audit procedures.
We have also assessed the disclosures in the finan-
cial statements regarding credit risk are appropriate.
Report on the annual accounts and consolidated accounts
AUDITOR’S REPORT
238 HANDELSBANKEN | ANNUAL REPORT 2019
Description of audit matter
The Bank has financial instruments where market
price is missing, thus fair value is determined using
valuation models based on market data. These finan-
cial instruments are categorized as level 2 under IFRS
fair value valuation hierarchy. Also, Svenska Handels-
banken has, to some extent, financial instruments
whose valuation to fair value is determined using val-
uation models for which the value is affected by the
input data that cannot be verified by external market
data. These financial instruments are categorized as
level 3 under IFRS fair value valuation hierarchy.
The group (parent company) has financial assets
and financial liabilities in level 2 of 49 331 (70 137) SEK
m and 24 308 (41 511) SEK m respectively. Financial
assets and liabilities in level 3 amounts to 1 870 (1 814)
SEK m and 563 (563) SEK m respectively.
The main part of the financial instruments in level
2 is made out of derivative contracts, among them
interest rate swaps and various types of linear cur-
rency derivatives, and business bonds. Corporate
bonds and derivative contracts in level 2 are valued
by valuation models based on market rates and other
market prices. Financial instruments in level 3 primar-
ily consist of unlisted shares in joint ventures, invest-
ments in the insurance business as well as certain
derivative contracts valued by non-observable data.
Due to the complexity when calculating and as it
requires the Bank to make assessments valuation of
financial instruments with no market prices are
deemed to be a key audit matter.
How this matter has been considered in the audit
We have assessed whether the Banks method for
valuating financial instruments with no market prices
available including the classification in the valuation
hierarchy is in accordance with IFRS 13.
We have tested the key controls in the valuation
process, including the bank’s assessment and
approving of assumptions and methods used in
model-based calculation, control of data quality as
well as handling of change regarding internal valua-
tion models. We have also tested the general IT-con-
trols including the handling of authorization regarding
these systems. Our assessment is that these key
controls are designed, implemented and operative
effective and hence we have determined that we can
rely on these key controls in our audit.
Further, we have evaluated the methods and
assumptions made when valuating financial instru-
ments with no market prices available. We have com-
pared the valuation models with valuation guidelines
and appropriate industry practice. We have com-
pared assumptions and price sources and examined
any significant deviations. We have also checked the
accuracy of the estimations by conducted sample
tests and performed our own independent valuations.
We have engaged our internal valuation specialists to
support us when performing our audit procedures.
We have also assessed the disclosures in the
financial statements regarding valuation of financial
instruments to fair value are appropriate.
Other information than annual accounts
and consolidated accounts
This document also contains other information than
the annual accounts and consolidated accounts and
is found on pages 1-5 and 242-256. The Board of
Directors and the Managing Director are responsible
for this other information.
Our opinion on the annual accounts and consoli-
dated accounts does not cover this other information
and we do not express any form of assurance con-
clusion regarding this other information.
In connection with our audit of the annual
accounts and consolidated accounts, our responsi-
bility is to read the information identified above and
consider whether the information is materially incon-
sistent with the annual accounts and consolidated
accounts. In this procedure we also take into account
our knowledge otherwise obtained in the audit and
assess whether the information otherwise appears to
be materially misstated.
If we, based on the work performed concerning this
information, conclude that there is a material misstate-
ment of this other information, we are required to report
that fact. We have nothing to report in this regard.
Responsibilities of the Board of Directors
and the Managing Director
The Board of Directors and the Managing Director are
responsible for the preparation of the annual accounts
and consolidated accounts and that they give a fair
presentation in accordance with the Annual Accounts
Act and, concerning the consolidated accounts, in
accordance with IFRS as adopted by the EU. The
Board of Directors and the Managing Director are also
responsible for such internal control as they determine
is necessary to enable the preparation of annual
accounts and consolidated accounts that are free from
material misstatement, whether due to fraud or mistake.
In preparing the annual accounts and consolidated
accounts, The Board of Directors and the Managing
Director are responsible for the assessment of the
company’s and the group’s ability to continue as a
going concern. They disclose, as applicable, matters
related to going concern and using the going concern
basis of accounting. The going concern basis of
accounting is however not applied if the Board of
Directors and the Managing Director intends to liqui-
date the company, to cease operations, or has no
realistic alternative but to do so.
The Audit Committee shall, without prejudice to the
Board of Director’s responsibilities and tasks in gen-
eral, among other things oversee the company’s finan-
cial reporting process.
Auditor’s responsibility
Our objectives are to obtain reasonable assurance
about whether the annual accounts and consolidated
accounts as a whole are free from material misstate-
ment, whether due to fraud or mistake, and to issue
an auditor’s report that includes our opinions. Rea-
sonable assurance is a high level of assurance, but is
not a guarantee that an audit conducted in accord-
ance with ISAs and generally accepted auditing
standards in Sweden will always detect a material
misstatement when it exists. Misstatements can arise
from fraud or mistake and are considered material if,
individually or in the aggregate, they could reasonably
be expected to influence the economic decisions of
users taken on the basis of these annual accounts
and consolidated accounts.
As part of an audit in accordance with ISAs, we
exercise professional judgment and maintain profes-
sional skepticism throughout the audit. We also:
• Identify and assess the risks of material misstate-
ment of the annual accounts and consolidated
accounts, whether due to fraud or error, design
and perform audit procedures responsive to those
risks, and obtain audit evidence that is sufficient
and appropriate to provide a basis for our opin-
ions. The risk of not detecting a material misstate-
ment resulting from fraud is higher than for one
resulting from error, as fraud may involve collusion,
forgery, intentional omissions, misrepresentations,
or the override of internal control.
• Obtain an understanding of the company’s internal
control relevant to our audit in order to design
audit procedures that are appropriate in the cir-
cumstances, but not for the purpose of express-
ing an opinion on the effectiveness of the compa-
ny’s internal control.
• Evaluate the appropriateness of accounting poli-
cies used and the reasonableness of accounting
estimates and related disclosures made by the
Board of Directors and the Managing Director.
• Conclude on the appropriateness of the Board of
Directors’ and the Managing Director’s use of the
going concern basis of accounting in preparing
the annual accounts and consolidated accounts.
We also draw a conclusion, based on the audit
evidence obtained, as to whether any material
uncertainty exists related to events or conditions
that may cast significant doubt on the company’s
and the group’s ability to continue as a going con-
cern. If we conclude that a material uncertainty
exists, we are required to draw attention in our
auditor’s report to the related disclosures in the
annual accounts and consolidated accounts or, if
such disclosures are inadequate, to modify our
opinion about the annual accounts and consoli-
dated accounts. Our conclusions are based on
the audit evidence obtained up to the date of our
auditor’s report. However, future events or condi-
tions may cause a company and a group to cease
to continue as a going concern.
• Evaluate the overall presentation, structure and
content of the annual accounts and consolidated
accounts, including the disclosures, and whether
the annual accounts and consolidated accounts
represent the underlying transactions and events
in a manner that achieves fair presentation.
• Obtain sufficient and appropriate audit evidence
regarding the financial information of the entities or
business activities within the group to express an
opinion on the consolidated accounts. We are
responsible for the direction, supervision and per-
formance of the group audit. We remain solely
responsible for our opinions.
We must inform the Board of Directors of, among
other matters, the planned scope and timing of the
audit. We must also inform of significant audit find-
ings during our audit, including any significant defi-
ciencies in internal control that we identified.
We must also provide the Board of Directors with
a statement that we have complied with relevant ethi-
cal requirements regarding independence, and to
communicate with them all relationships and other
matters that may reasonably be thought to bear on
our independence, and where applicable, related
safeguards.
From the matters communicated with the Board of
Directors, we determine those matters that were of
most significance in the audit of the annual accounts
and consolidated accounts, including the most impor-
tant assessed risks for material misstatement, and are
therefore the key audit matters. We describe these
matters in the auditor’s report unless law or regulation
precludes disclosure about the matter or when, in
extremely rare circumstances, we determine that a
matter should not be communicated in the auditor’s
report because the adverse consequences of doing
so would reasonably be expected to outweigh the
public interest benefits of such communication.
Fair value measurement of financial instrument with no market prices available
Detailed information and description of the key audit matter is provided in the annual accounts and consolidated accounts. Financial instruments measured at fair value
are described in note G40 for the group and P35 for the parent company. Relevant accounting principles for the group are described in note G1, section 9 on page 88.
Note P1 shows that the parent company’s accounting principles for financial instruments measured at fair value is consistent with the group’s accounting principles.
AUDITOR’S REPORT
HANDELSBANKEN | ANNUAL REPORT 2019 239
Opinions
In addition to our audit of the annual accounts
and consolidated accounts, we have also
audited the administration of the Board of Direc-
tors and the Managing Director of Svenska
Handelsbanken AB (publ) for the year 2019 and
the proposed appropriations of the company’s
profit or loss.
We recommend to the general meeting of
shareholders that the profit be appropriated
(loss be dealt with) in accordance with the pro-
posal in the statutory administration report and
that the members of the Board of Directors and
the Managing Director be discharged from liabil-
ity for the financial year.
Basis for opinions
We conducted the audit in accordance with
generally accepted auditing standards in Swe-
den. Our responsibilities under those standards
are further described in the Auditor’s Responsi-
bilities section. We are independent of the par-
ent company and the group in accordance with
professional ethics for accountants in Sweden
and have otherwise fulfilled our ethical responsi-
bilities in accordance with these requirements.
We believe that the audit evidence we have
obtained is sufficient and appropriate to provide
a basis for our opinions.
Responsibilities of the Board of Directors
and Managing Director
The Board of Directors is responsible for the
proposal for appropriations of the company’s
profit or loss. At the proposal of a dividend, this
includes an assessment of whether the dividend
is justifiable considering the requirements which
the company’s and the group’s type of opera-
tions, size and risks place on the size of the par-
ent company’s and the group’s equity, consoli-
dation requirements, liquidity and position in
general.
The Board of Directors is responsible for the
company’s organization and the administration
of the company’s affairs. This includes among
other things continuous assessment of the
company’s and the group’s financial situation
and ensuring that the company’s organization is
designed so that the accounting, management
of assets and the company’s financial affairs
otherwise are controlled in a reassuring manner.
The Managing Director shall manage the ongo-
ing administration according to the Board of
Directors’ guidelines and instructions and
among other matters take measures that are
necessary to fulfill the company’s accounting in
accordance with law and handle the manage-
ment of assets in a reassuring manner.
Auditor’s responsibility
Our objective concerning the audit of the
administration, and thereby our opinion about
discharge from liability, is to obtain audit evi-
dence to assess with a reasonable degree of
assurance whether any member of the Board of
Directors or the Managing Director in any mate-
rial respect:
• has undertaken any action or been guilty of
any omission which can give rise to liability to
the company, or
• in any other way has acted in contravention
of the Companies Act, the Banking and
Financing Business Act, the Annual Accounts
Act for Credit Institutions and Securities
Companies or the Articles of Association.
Our objective concerning the audit of the pro-
posed appropriations of the company’s profit or
loss, and thereby our opinion about this, is to
assess with reasonable degree of assurance
whether the proposal is in accordance with the
Companies Act.
Reasonable assurance is a high level of
assurance, but is not a guarantee that an audit
conducted in accordance with generally
accepted auditing standards in Sweden will
always detect actions or omissions that can
give rise to liability to the company, or that the
proposed appropriations of the company’s
profit or loss are not in accordance with the
Companies Act.
As part of an audit in accordance with gener-
ally accepted auditing standards in Sweden, we
exercise professional judgment and maintain
professional skepticism throughout the audit.
The examination of the administration and the
proposed appropriations of the company’s
profit or loss is based primarily on the audit of
the accounts. Additional audit procedures per-
formed are based on our professional judgment
with starting point in risk and materiality. This
means that we focus the examination on such
actions, areas and relationships that are mate-
rial for the operations and where deviations and
violations would have particular importance for
the company’s situation. We examine and test
decisions undertaken, support for decisions,
actions taken and other circumstances that are
relevant to our opinion concerning discharge
from liability. As a basis for our opinion on the
Board of Directors’ proposed appropriations of
the company’s profit or loss we examined the
Board of Directors’ reasoned statement and a
selection of supporting evidence in order to be
able to assess whether the proposal is in
accordance with the Companies Act.
The auditor´s opinion regarding
the statutory sustainability report
The Board of Directors is responsible for the
statutory sustainability report on pages 43–61,
and that it is prepared in accordance with the
Annual Accounts Act.
Our examination has been conducted in
accordance with FAR’s auditing standard RevR
12 The auditor´s opinion regarding the statutory
sustainability report. This means that our exami-
nation of the statutory sustainability report is dif-
ferent and substantially less in scope than an
audit conducted in accordance with Interna-
tional Standards on Auditing and generally
accepted auditing standards in Sweden. We
believe that the examination has provided us
with sufficient basis for our opinion.
A statutory sustainability report has been
prepared.
Ernst & Young AB, Jakobsbergsgatan 24,
111 24 Stockholm, was appointed auditor of
Svenska Handelsbanken AB by the general
meeting of the shareholders on the March 27,
2019 and has been the company’s auditor since
April 28, 1998.
PricewaterhouseCoopers AB, Torsgatan 21,
113 97 Stockhom, was appointed auditor of
Svenska Handelsbanken AB by the general
meeting of the shareholders on March 27, 2019
and has been the company’s auditor since
March, 29 2017.
Stockholm February 12, 2020
Ernst & Young AB PricewaterhouseCoopers AB
Jesper Nilsson Johan Rippe
Auktoriserad revisor Auktoriserad revisor
Report on other legal and regulatory requirements
AUDITOR’S REPORT
240 HANDELSBANKEN | ANNUAL REPORT 2019
Auditor’s Limited Assurance Report on Svenska Handelsbanken AB (publ)’s Sustainability Report and the Statutory Sustainability Report
INTRODUCTION
We have been engaged by the Board of Directors
of Svenska Handelsbanken AB (publ) (Handels-
banken) to undertake a limited assurance
engagement of Handelsbanken´s Sustainability
Report for the year 2019 on pages 43–61 in
Handelsbanken’s annual report and the sepa-
rate Sustainability Report on pages 4–72 for
the year 2019. We refer to these publications
collectively as the “Sustainability Report”.
RESPONSIBILITIES OF
THE BOARD OF DIRECTORS AND
THE EXECUTIVE MANAGEMENT
FOR THE SUSTAINABILITY REPORT
The Board of Directors and the Executive
Management are responsible for the preparation
of the Sustainability Report in accordance with
the applicable criteria, which are explained on
page 70 in the separate Sustainability Report
and are the parts of the Sustainability Reporting
Guidelines published by GRI (The Global
Reporting Initiative) that are applicable to the
Sustainability Report, as well as the accounting
and calculation principles that the Company
has developed. This responsibility also includes
the internal control relevant to the preparation
of a Sustainability Report that is free from mate-
rial misstatements, whether due to fraud or
mistake.
RESPONSIBILITIES OF THE AUDITOR
Our responsibility is to express a conclusion on
the Sustainability Report based on the limited
assurance procedures we have performed and
provide an opinion on the statutory sustainability
report.
We conducted our limited assurance engage-
ment in accordance with ISAE 3000 Assurance
engagements other than audits or reviews of
historical financial information, with the applica-
tion of RevR 6 Assurance of Sustainability
Reports issued by FAR. A limited assurance
engagement consists of making inquiries, pri-
marily of persons responsible for the prepara-
tion of the Sustainability Report, and applying
analytical and other limited assurance proce-
dures. The procedures performed in a limited
assurance engagement vary in nature from,
and are less in scope than for, a reasonable
assurance engagement conducted in accord-
ance with IAASB’s Standards on Auditing and
other generally accepted auditing standards.
The firm applies ISQC 1 (International Standard
on Quality Control) and accordingly maintains
a comprehensive system of quality control
including documented policies and procedures
regarding compliance with ethical requirements,
professional standards and applicable legal and
regulatory requirements. We are independent
of Handelsbanken´s in accordance with profes-
sional ethics for accountants in Sweden and
have otherwise fulfilled our ethical responsibili-
ties in accordance with these requirements.
Consequently, the procedures performed
as part of a limited review do not enable us to
obtain assurance that we would become aware
of all significant matters that might be identified
in a reasonable assurance engagement.
Accordingly, we do not express a reasonable
assurance conclusion.
Our procedures performed in the limited
assurance engagement are based on the
criteria defined by the Board of Directors and
the Executive Management as described
above. We consider these criteria suitable for
the preparation of the Sustainability Report.
We believe that the evidence we have obtained
is sufficient and appropriate to provide a basis
for our conclusion below.
CONCLUSIONS
Based on the limited assurance procedures
we have performed, nothing has come to our
attention that causes us to believe that the
Sustainability Report is not prepared, in all
material respects, in accordance with the
criteria defined by the Board of Directors and
Executive Management.
To Svenska Handelsbanken AB (publ), corporate, identity number 502007-7862
This is the translation of the auditor’s report in Swedish.
Stockholm, 12 February 2020
Ernst & Young AB
Jesper Nilsson
Authorised Public Accountant
Marianne Förander
Expert Member of FAR
AUDITOR’S REPORT ON THE SUSTAINABILITY REPORTING AND STATUTORY SUSTAINABILITY REPORT
HANDELSBANKEN | ANNUAL REPORT 2019 241

Contact details
HEAD OFFICES IN HOME MARKETS, REGIONAL BANKS AND BUSINESS DEVELOPMENT
Northern Sweden 245
Central Sweden 245
Stockholm 245
Western Sweden 245
South East Sweden 245
Business Development Sweden 245
Head Office UK 245
North West UK 245
Yorkshire &North East UK 245
Central UK 245
South West UK 245
London & South East UK 245
Norway 245
Denmark 245
Finland 245
The Netherlands 245
BRANCHES AND BRANCH MANAGERS
Sweden 246
UK 248
Norway 251
Denmark 251
Finland 252
The Netherlands 252
Outside the Nordic countries, the UK and the Netherlands 253
Representative offices 253
Boards of subsidiaries 253
CONTENTS
CENTRAL HEAD OFFICE 244
HANDELSBANKEN’S BOARD 244
UNITS AND STAFF FUNCTIONSAT CENTRAL HEAD OFFICE
Capital Markets 244
Group Audit 244
Group Communications & Sustainability 244
Group Compliance 244
Group Credits 244
Group Finance 244
Group Financial Crime Prevention 244
Group HR 244
Group IT 244
Group IT Operations & Development 244
Group Legal 244
Group Risk Control 244
BUSINESS AREAS
Asset Management 244
Retail & E-services 244
Handelsbanken International 244
Markets 244
Pension & Life 244
Stadshypotek 244
SUBSIDIARIES
Ecster AB 244
EFN 244
Handelsbanken Finans 244
Handelsbanken Fonder 244
Handelsbanken Liv 244
Handelsbanken plc 244
Optimix 245
Stadshypotek 245
Xact Kapitalförvaltning 245
243

CONTACT DETAILS
244 HANDELSBANKEN | ANNUAL REPORT 2019
CENTRAL HEAD OFFICE
Carina Åkerström, Group Chief Executive
Mikael Hallåker, Central Head Office
Kungsträdgårdsgatan 2
SE-106 70 Stockholm
+46 (0)8-701 10 00
handelsbanken.com
Corporate identity no.: 502007-7862
HANDELSBANKEN’S BOARD
Martin Wasteson, Company Secretary
Kungsträdgårdsgatan 2
106 70 Stockholm
+46 (0)8-701 10 00
UNITS AND STAFF FUNCTIONS
AT CENTRAL HEAD OFFICE
CAPITAL MARKETS
Dan Lindwall, Head
Blasieholmstorg 11
SE-106 70 Stockholm
+46 (0)8-701 10 00
GROUP AUDIT
Tord Jonerot, Head
Blasieholmstorg 12
SE-106 70 Stockholm
+46 (0)8-701 10 00
GROUP COMMUNICATIONS
& SUSTAINABILITY
Maria Nordin Wessman, Acting Head
Jan Larsson, Permanent Head from January 2020
Kungsträdgårdsgatan 2
SE-106 70 Stockholm
+46 (0)8-701 10 00
GROUP COMPLIANCE
Maria Tornell, Acting Head
Martin Noréus, Permanent Head from May 2020
Kungsträdgårdsgatan 2
SE-106 70 Stockholm
+46 (0)8-701 10 00
GROUP CREDITS
Per Beckman, CCO
Kungsträdgårdsgatan 2
SE-106 70 Stockholm
+46 (0)8-701 10 00
GROUP FINANCE
Rolf Marquardt, CFO
Kungsträdgårdsgatan 2
SE-106 70 Stockholm
+46 (0)8-701 10 00
GROUP FINANCIAL CRIME PREVENTION
Hannu Saari, Head
Torsgatan 14
SE-106 35 Stockholm
+46 (0)8-701 10 00
GROUP HR
Magnus Ericson, Head
Kungsträdgårdsgatan 2
SE-106 70 Stockholm
+46 (0)8-701 10 00
GROUP IT
Juha Rantamaa, Acting CIO
Mattias Forsberg, Permanent CIO from
February 2020
Torsgatan 14
SE-106 35 Stockholm
+46 (0)8-701 10 00
GROUP IT OPERATIONS & DEVELOPMENT
Lena Sörensen, Acting Head
Värtavägen 73
SE-115 82 Stockholm
+46 (0)8-701 10 00
GROUP LEGAL
Martin Wasteson, Head
Kungsträdgårdsgatan 2
SE-106 70 Stockholm
+46 (0)8-701 10 00
GROUP RISK CONTROL
Maria Hedin, CRO
Kungsträdgårdsgatan 2
SE-106 70 Stockholm
+46 (0)8-701 10 00
BUSINESS AREAS
ASSET MANAGEMENT
Carl Cederschiöld, Head
Blasieholmstorg 11
SE-106 70 Stockholm
+46 (0)8-701 10 00
RETAIL & E-SERVICES
Yonnie Bergqvist, Head
Valhallavägen 195
SE-115 53 Stockholm
+46 (0)8-701 10 00
HANDELSBANKEN INTERNATIONAL
Richard Johnson, Head
Blasieholmstorg 11
SE-106 70 Stockholm
+46 (0)8-701 10 00
MARKETS
Pål Bergström, Head
Christina Nyman, Head of Economic Research
Blasieholmstorg 11
SE-106 70 Stockholm
+46 (0)8-701 10 00
PENSION & LIFE
Louise Sander, Head
Blasieholmstorg 12
Box 1325
SE-111 83 Stockholm
+46 (0)8-701 71 00
STADSHYPOTEK
Göran Stille, Head
Torsgatan 12
SE-106 35 Stockholm
+46 (0)8-701 54 00
SUBSIDIARIES
ECSTER AB
Yonnie Bergqvist, Head
Valhallavägen 195
SE-115 53 Stockholm
+46 (0)8-701 46 67
Corporate identity no.: 556993-2311
EFN
Mikaela Strand, Head
Blasieholmstorg 12
SE-106 70 Stockholm
+46 (0)8-701 10 00
efn.se
Corporate identity no.: 556930-1608
HANDELSBANKEN FINANS
Magnus Sternbrink, Head
Torsgatan 12–14
SE-106 35 Stockholm
+46 (0)8-701 46 00
Corporate identity no.: 556053-0841
HANDELSBANKEN FONDER
Magdalena Wahlqvist Alveskog, Head
Blasieholmstorg 12
SE-106 70 Stockholm
+46 (0)8-701 10 00
Corporate identity no.: 556418-8851
HANDELSBANKEN LIV
Louise Sander, Head
Blasieholmstorg 12
Box 1325
SE-111 83 Stockholm
+46 (0)8-701 71 00
Corporate identity no.: 516401-8284
HANDELSBANKEN PLC
Mikael Sørensen, Head
3 Thomas More Square
London E1W 1WY, UK
+44 (0)20 757 880 00
handelsbanken.co.uk
Contact details Website: handelsbanken.com unless otherwise stated.
CONTACT DETAILS
HANDELSBANKEN | ANNUAL REPORT 2019 245
HEAD OFFICE UK
Mikael Sørensen, Head
3 Thomas More Square
London E1W 1WY, UK
+44 (0)20 757 880 00
handelsbanken.co.uk
NORTH WEST UK
Ingela Forsberg, Head
101 Barbirolli Square
Manchester M2 3BG, UK
+44 (0)16 160 202 00
handelsbanken.co.uk
YORKSHIRE & NORTH EAST UK
Suzanne Minifie, Head
No. 1 Whitehall Riverside, 4th floor
Leeds LS1 4BN, UK
+44 (0)11 338 601 00
handelsbanken.co.uk
CENTRAL UK
Graham Turner, Head
Two Colmore Square
38 Colmore Circus, 3rd floor
Queensway
Birmingham B4 6BN, UK
+44 (0)12 166 525 00
handelsbanken.co.uk
SOUTH WEST UK
Chris Teasdale, Head
1100 Parkway North
Stoke Gifford
Bristol BS34 8YU, UK
+44 (0)11 793 110 08
handelsbanken.co.uk
LONDON & SOUTH EAST UK
John Hodson, Head
3 Thomas More Square
London E1W 1WY, UK
+44 (0)20 757 880 00
handelsbanken.co.uk
NORWAY
Dag Tjernsmo, Head
Tjuvholmen Allé 11
Postboks 1342 Vika
NO-0113 Oslo, Norway
+47 (0)22 39 70 00
handelsbanken.no
DENMARK
Lars Moesgaard, Head
Havneholmen 29
DK-1561 Copenhagen V, Denmark
+45 (0)46 79 12 00
handelsbanken.dk
FINLAND
Hanne Katrama, Acting Head
Itämerenkatu 11–13
FI-00180 Helsinki, Finland
+358 (0)10 444 11
handelsbanken.fi
THE NETHERLANDS
Roland van Pooij, Acting Head
Kantoorgebouw Vesta
Herikerbergweg 181
NL-1101 CN Amsterdam, The Netherlands
+31 (0)204 127 600
handelsbanken.nl
OPTIMIX
Ton Schoemaker, Head
Jaap Westerling, Head
Johannes Vermeerstraat 14
1071 DR Amsterdam, The Netherlands
+31 (0)20 570 30 30
Corporate identity no.: 33194359
STADSHYPOTEK
Göran Stille, Head
Torsgatan 12
SE-106 35 Stockholm
+46 (0)8-701 54 00
Corporate identity no.: 556459-6715
XACT KAPITALFÖRVALTNING
Pär Nürnberg, Head
Blasieholmstorg 12
SE-106 70 Stockholm
+46 (0)8-701 10 00
Corporate identity no.: 556997-8140
HEAD OFFICES IN HOME
MARKETS, REGIONAL BANKS
AND BUSINESS DEVELOPMENT
NORTHERN SWEDEN
Johanna Lundberg, Head
Storgatan 48
Box 1002
SE-901 20 Umeå
+46 (0)90-15 45 00
CENTRAL SWEDEN
Pontus Åhlund, Head
Nygatan 20
Box 196
SE-801 03 Gävle
+46 (0)26-17 20 60
STOCKHOLM
Michael Green, Head
Arsenalsgatan 9
SE-106 70 Stockholm
+46 (0)8-701 10 00
WESTERN SWEDEN
Mikael Romert, Head
Södra Hamngatan 35
SE-405 40 Gothenburg
+46 (0)31-774 80 00
SOUTH EAST SWEDEN
Anders Fagerdahl, Head
Södergatan 10
SE-205 40 Malmö
+46 (0)40-24 50 00
BUSINESS DEVELOPMENT SWEDEN
Katarina Ljungqvist, Head
Kungsträdgårdsgatan 2
SE-106 70 Stockholm
+46 (0)8-701 10 00
BRANCHES AND BRANCH MANAGERS
246 HANDELSBANKEN | ANNUAL REPORT 2019
(E)*= employee representative
HANDELSBANKEN NORTHERN SWEDEN
BoardBob Persson Frösön, Chair
Richard Bergfors Stockholm
Johanna Lundberg Umeå
Annika Högström Luleå
Ulf Larsson Sundsvall
Markus Skog Olsson Umeå
Agneta Marell Umeå
Anna Mattsson Luleå, (E)*
HeadJohanna Lundberg Umeå
Branches and branch managers
HANDELSBANKEN CENTRAL SWEDEN
BoardUlf Bergkvist Insjön, Chair
Torsten Engwall Gävle
Peter Larson Gävle
Monica Oldenstedt Västerås
Arne Skoglund Uppsala
Morgan Särnblad Orsa, (E)*
Pontus Åhlund Gävle
HeadPontus Åhlund Gävle
Branch/branch managerArvidsjaur Therese Scott
Bjurholm Sofie Jakobsson
Boden Ellinor Lundström
Bredbyn Kari Pessa
Bräcke Per Stålhandske
Burträsk Gustav Hansson
Byske Ulrika Sehlstedt, Acting
Delsbo Örjan Källman
Dorotea Thomas Rönnberg
Gällivare Johan Larsson
Hammarstrand Linda Nordvall
Haparanda Maria Mörk
Hede Mattias Sundt
Holmsund Alexander Bagrov, Acting
Hudiksvall Thony Nylund
Husum Mats Hållberg, Acting
Härnösand Åsa Starfelt Nilsson
Jokkmokk Johan Larsson
Järpen Jenny Strand
Järvsö Mikael Stridh
Kalix Maria Mörk
Kiruna Lisbeth Aidanpää
Kramfors Thomas Kassman
Krokom Henrik Lindqvist
Kvissleby Niclas Södergren
Liden Erik Martinsson
Lit Henrik Lindqvist
Ljusdal Mikael Stridh
Luleå
Gammelstad Fredrik Karlsson
Storgatan Jimmy Vikström
Lycksele Anna Karin Öhnerud
Matfors Per Pettersson
Nordanstig Rose-Marie Hildingsson
Nordingrå Thomas Kassman
Nordmaling Mats Hållberg, Acting
Norsjö Anna Karin Öhnerud
Pajala Maria Grym
Piteå Stefan Uddström
Ramsele Sofia Bodin
Robertsfors Gustav Hansson
Råneå Fredrik Karlsson
Skellefteå Ulrika Sehlstedt, Acting
Skönsberg Per Pettersson
Sollefteå Sofia Bodin
Storuman Anna-Karin Öhnerud
Strömsund Lars-Erik Olsén
Sundsvall Owe Sundin
Sveg Jörgen Andersson
Svenstavik Bengt Nilzén
Sävar Alexander Bagrov, Acting
Timrå Erik Martinsson
Ullånger Thomas Kassman
Umeå
City Anders Sundström
Teg Alexander Bagrov, Acting
Västra Henrik Lundström
Vilhelmina Thomas Rönnberg
Vindeln Sofie Jakobsson
Vännäs Sofie Jakobsson
Ånge Per Stålhandske
Åre Jenny Strand
Åsele Thomas Rönnberg
Älvsbyn Katarina Rutberg
Örnsköldsvik Kari Pessa
Östersund Petter Dahlin
Övertorneå Maria Grym
Meeting placesArvidsjaur
Malå Therese Scott
Sorsele Therese Scott
Övertorneå
Överkalix Maria Grym
Branch/branch managerAlfta Annika Wikström
Arboga Larry Andersson
Avesta Andreas Borgefors
Bergby Anna Ternstedt
Bollnäs Anna Ekström
Borlänge Henrik Bergenström
Bålsta Susanne Lund
Edsbyn Annika Wikström
Enköping Lars Olsson
Eskilstuna Johan Gustavsson
Fagersta Sara Runeberg
Falun Henrik Ragnarsson
Fjugesta Anders Hedvall
Flen Robert Dalhammer
Frövi Mikael Jansson
Gagnef Anders Rehn
Grängesberg Andreas Byrén
Gävle City Svante Larsson
Hallsberg Mats Kagerup
Hallstavik Catarina Lyshag
Hedemora Jonas Lund
Hedesunda Erik Mattsson
Insjön Jenny Åkerström
Katrineholm Robert Dalhammer
Kilafors Pernilla Flink Westh
Knivsta Agneta Sturesson
Kolbäck Niklas Johansson
Kopparberg Lena Ragnarsson Vöks
Kumla Michael Johnsson
Kungsör Marco Crantz
Köping Anette Holmsten
Leksand Anders Ekström
Lima Camilla Enqvist
Lindesberg Maria Ekdahl
Ludvika Andreas Abraham
Malung Fredrik Hallkvist
Mora Jürgen Smolle
Norberg Håkan Bjurling
Norrtälje Mats Sagström
Ockelbo Johan Björk
Orsa Anette Skoglund
Pålsboda Mats Kagerup
Rimbo Helena Kolström
Rättvik Magnus Johansson
Sala-Heby Helen Emnerud Wilhelmsson
Sandviken Fredrik Nordkvist
Sigtuna Jonas Wåhlstedt
Skinnskatteberg Petter Andersson, Acting
Skultuna Terese Ahl Lejderud
Skutskär Magnus Sjökvist
Skärplinge Susanne Kontturi
Stora Tuna Susanne Jansson
Storvik Jonas Thunman
Strängnäs Katharina Schramm Hellmark
Säter Patrik Nylén
Söderhamn Thomas Frykberg
Tierp Anders Estman
Torsåker Pernilla Strömberg
Uppsala
Boländerna Magnus Ternstedt
City Micael Lindström
Luthagen Ann-Sofie Sivander
Rosendal Kristina Carlsson
Vansbro Fredrik Hallqvist
Västerås
City Therese Massaro
Emausgatan Terese Ahl Lejderud
Köpingsvägen Mats Söderlund
Östermälarstrand Marie Strandberg, Acting
Örebro
Drottningparken Anders Forsgren
Ekersgatan Kristina Dahl
Stortorget Kenneth Vallin
Österbybruk Ann Robertsson
Östervåla Thomas Forsgren
Östhammar Anna Lydell Bjälmén
Meeting placesHallsberg
Askersund Mats Kagerup
Knivsta
Alsike Agneta Sturesson
Lindesberg
Nora Maria Ekdahl
Lima
Sälen Camilla Enqvist
Mora
Älvdalen Jürgen Smolle
Sala-Heby
Heby Helen Emnerud Wilhelmsson
Strängnäs
Mariefred Katharina Schramm Hellmark
BRANCHES AND BRANCH MANAGERS
HANDELSBANKEN | ANNUAL REPORT 2019 247
(E)*= employee representative
HANDELSBANKEN WESTERN SWEDEN
BoardClaes Larsson Gothenburg, Chair
Peter Claesson Kullavik
Camilla Hansson Alingsås, (E)*
Carin Kindbom Västra Frölunda
Håkan Larsson Gothenburg
Mikael Romert Gothenburg
Vilhelm Schottenius Varberg
M Johan Widerberg Gothenburg
Kina Wileke Gothenburg
HeadMikael Romert Gothenburg
HANDELSBANKEN STOCKHOLM
BoardUlf Lundahl Lidingö, Chair
Johnny Alvarsson Hägersten
Ingalill Berglund Solna
Katarina Martinson Stockholm
Lena Renström Stockholm, (E)*
Michael Green Stockholm
HeadMichael Green Stockholm
Branch/branch managerAle Anna-Lisa Jansson
Alingsås Jonas Sandberg
Arvika Peter Johansson
Bollebygd Anders Roos
Borås
Borås City Joakim Antonsson
Viared Caroline Fensby
Falkenberg Kristian Gårdenfelt
Falköping Andreas Blick
Filipstad Martin Olsson
Gislaved Per Risberg
Gothenburg
Almedal Anna-Lena Ranhög
Avenyn Veronica Wallin Johansson
City Martin Henriksson
Eriksberg Christian Pennert
Frölunda Patrik Niklasson
Första Långgatan Anders Olausson
Gårda Marie Erlandson
Lilla Bommen Anna Fägersten
Lindholmen Jonas Almhöjd
Sisjön Christian Sjöberg
Torslanda Johan Zachrisson
Volvo Emelie Tisell
Örgryte Linda Hellsten
Övre Husargatan Anna Ekstrand
Halmstad Magnus Landbring
Herrljunga Ulf Carrick
Hjo Niklas Standar
Huskvarna Cecilia Antonsson
Jönköping Jens Claesson
Karlskoga Kristin Pettersson
Karlstad Fredrik Ekenberg
Kristinehamn Torbjörn Läth
Kungsbacka Anders Blomqvist
Kungälv Lena Gillholm
Laholm Magnus Jurvin
Landvetter Anna Lundgren
Lerum Annika Eriksson
Lidköping Magnus Kvarnmarker
Lilla Edet Ann Bengtsson
Ljungby Maria Larsson
Markaryd Maria Larsson
Mariestad Katarina Lindholm
Mölndal Johan Martinsson
Mölnlycke Lena Uhrlander
Partille Sara Larsson
Skara Anna-Lena Andersson
Skövde Niklas Standar
Stenungsund Maria Lager
Strömstad Johan Rosengren
Sunne Dennis Göransson
Svenljunga Therese Ekelund
Säffle Stefan Ejnesjö
Tidaholm Andreas Blick
Torsby Anna Bengtsson
Tranemo Therese Ekelund
Trollhättan Ingela Karlsson
Uddevalla Marie Kaptein
Ulricehamn Martin Ekman
Vaggeryd Inger Ågren
Vara Maj Rudell
Varberg Alexander Turesson
Vårgårda David Wiklund, Acting
Vänersborg Magdalena Gunnarsson
Värnamo Jonas Flink
Åmål Stefan Ejnesjö
Årjäng Peter Johansson
Älvsborg Allison Åsblom
Meeting placesKungsbacka
Kungsporten Anders Blomqvist
Branch/branch managerAlviks Torg Malin Meijer
Arbetargatan Ulrika Staffas Nordqvist
Brommaplan Charlotta Hallqvist Lindström
Dalarö Anna Brannefalk
Djursholm Fredrik Enander
Ekerö Patrik Lönnstad
Farsta Camilla Sandgren Esgård
Gamla Stan Linda Unger
Globen Lena Stenmark
Gnesta Asta Beyerl
Gustav Adolfs Torg Anders Lindegren
Gärdet Petra Wahlberg
Götgatsbacken Anna Andersson
Hammarby Sara Hellström
Haninge Maria Sjöstedt
Hemse Helena Leoj
Hornsberg Marika Hedblom
Hornsgatan Tommie Jonsson
Huddinge Helene Ferlin, Acting
Humlegården AnneMarie Dahlstedt
Hägersten Sofia Eldebrink
Hässelby Gård Sofie Ehrström
Högalid Mårten Larsson
Jakobsberg Tobias Grundell
Järna Anna Zickert Söderström
Karlaplan Cecilia Carlberg
Karlavägen Eric Markne Lartén
Kista Hans Lundin
Kungsholmstorg Anders Friman
Kungsträdgården Johan Palm
Kungsängen Karin Åkerblom Lingois
Kärrtorp Jessica Nirvin
Lidingö
Centrum Mikael Gustafson
Larsberg Mikael Gustafson, Acting
Marieberg Lotta Adestam
Marievik Nahir Oussi
Märsta Johanna Estman Larsson
Mörby Centrum Daniel Spangenberg
Nacka Forum Anki Lenksjö
Norrmalmstorg Maria Wedholm
Nyköping Jens Fransson
Nynäshamn Åsa Wenngren
Näsby Park Cecilia Sonntag
Odengatan Catarina Thunstedt
Odenplan Tommie Jonsson
Renstiernas Gata Martin Nordfeldt
S:t Eriksplan Jesper Ringblom
Salem Malin Cederlund
Saltsjö-Boo Johanna Lagerbäck
Skanstull Johan Hilmersson
Skärholmen Marcus Axelsson
Slite Helena Leoj
Sollentuna Fredrik Andersson
Solna
Arenastaden Lisa Spangenberg
Frösunda Richard Sköllersten
Solna Centrum Mats Liebgott
Solna Strand Martin Björgell
Spånga Agneta Gustafsson
Stockholm Sergel Maria Hellberg
Storgatan Tommie Jonsson
Strandvägen Carl-Magnus Gustafsson
Stureplan Peter Sturesson
Stuvsta Kristin Elofsson
Sundbyberg Jan Larsson
Sveavägen Anna Karlsson
Södertälje Niclas Landbergsson
Tessinparken Lars Eberson
Torsgatan Torsten Johansson
Trosa Jens Fransson
Trångsund Mattias Lindmark
Tullinge Kristina Jansenberger
Tyresö Kjell Andersson
Täby Centrum Johan Grahn
Upplands Väsby Carl-Fredrik Boija
Vallentuna Stina Andersen
Vanadisplan Stina Marklund
Vasagatan Christer Örtegren
Vaxholm Jennie Widlund
Visby
Adelsgatan Linda Ewald
Öster Carl Oscar Sjöström
Vällingby Eric Nolerstedt
Värmdö Ulrika Kallur
Västerhaninge Mats Nordling
Åkersberga Per Karlsson
Årsta Linda Norman Monteil
Älvsjö Jesper Hellström
Östermalmstorg Jan Larsson
Östra Station Forrest Humphries
Meeting placesGärdet
Norra Djurgårdsstaden Petra Wahlberg
Hemse
Klintehamn Helena Leoj
Slite
Fårösund Helena Leoj
BRANCHES AND BRANCH MANAGERS
248 HANDELSBANKEN | ANNUAL REPORT 2019
HANDELSBANKEN NORTH WEST UK
The operations are part of Handelsbanken plc.
BoardMikael Sørensen London,
CEO Handelsbanken UK, Chair
Ingela Forsberg Manchester
Mikael Hallåker Sundbyberg
HeadIngela Forsberg Manchester
Branch/branch managerAberdeen Neil Clark
Altrincham John Burke
Blackburn Philip Skupski
Bolton Sean Greenhalgh
Burnley Phil Skupski
Bury Rachel Farnan
Carlisle Jason Smith
Chester David Barker
Dundee Ben Honeyman
Dunfermline Jim Donnelly
Edinburgh
Charlotte Square Lesley Dunlop
West End Iain Henderson
Glasgow
Finnieston Gillian Baxter
City David Waddell
Heswall Liz Cotton
Inverness Hamish Boag
Kendal Mike Fell
Lancaster Alison Norfolk
Liverpool
Duke Street Stephen Jones
Exchange Station John Williams
Lytham Kevin Sanderson
Manchester
Barbirolli Philip Basten
Spinningfields Adam Short
Trafford Neil McLoughlin
Trinity Way Anthony Flynn
Oldham Scott Parkinson
Penrith Jason Smith
Preston Keith Lowe
Southport Andrew Pearson
Stirling Jim Donnelly
Stockport Lisa Dobson
Warrington James Barron
Wigan Cath Joynt
Wilmslow Sarah Hunter
(E)*= employee representative
HANDELSBANKEN SOUTH EAST SWEDEN
BoardCharlotta Falvin Genarp, Chair
Santhe Dahl Växjö
Anders Fagerdahl Malmö
Pia Håkansson Ystad, (E)*
Bengt Kjell Helsingborg
Johan Mattsson Tomelilla
Anders Ohlner Malmö
Sten Peterson Katrineholm
Mikael Roos Malmö
HeadAnders Fagerdahl Malmö
Branch/branch managerAlvesta Patrick Carlsson
Borensberg Henrik Thörnblad
Borgholm Thomas Svensson
Båstad Lars-Olof Ottosson
Eksjö Anna Gyllenhammar
Emmaboda Beatrice Granlöf
Eslöv David Möller
Finspång Håkan Samuelsson
Färjestaden Christin Abrahamsson
Helsingborg
Norr Erik de la Motte
Stortorget Erik de la Motte
Hultsfred Marie-Louise Mobelius
Hässleholm Jonas Bondesson
Höganäs Gunilla Voss
Högsby Jonas Petersson
Höllviken Cecilia Wahlberg
Höör David Möller
Kalmar Johan Lorentzon
Karlshamn Maria Önell
Karlskrona Peter Andersson
Klippan Alexandra Paulsson
Kristianstad Rebecca Thörnqvist
Kävlinge Dag Olsson
Lammhult Maj-Lis Pettersson
Landskrona Per-Ove Kamlund
Linköping
City Michael Sterne
Tornby Anders Spång
Lomma Erik Hultgren
Lund
City Peter Andersson
Ideon Cecilia Leijgård
Malmö
City Erik Bredberg
Fosie Anders Persson
Fridhem Göran Camitz
Hyllie Anders Persson
Limhamn Roger Håkansson
Stortorget Pernilla Hanserup
Triangeln Jonas Darte
Öster Magnus Björk
Mjölby Karl Gustafsson
Motala Henrik Thörnblad
Mönsterås Jonas Petersson
Norrköping
Drottninggatan Cicki Törnell
Fjärilsgatan Marika Ronnerheim
Nybro Beatrice Granlöf
Nässjö Malin Häggström
Osby Fredrik Roghner
Oskarshamn Jonas Petersson
Ronneby Kati Gidlöf
Simrishamn Pontus Hansson Cederberg
Sjöbo Thomas Hansson
Skanör Maria Hägerström
Staffanstorp Mårten Edlund
Svedala Isabel Almqvist
Sävsjö Jörgen Asp
Söderköping Caroline Bragner
Sölvesborg Anita Svensson Barba
Tingsryd Annelie Johansson
Tomelilla Mia Kristell
Torsås Johan Lorentzon
Tranås Fredrik Lundgren
Trelleborg Katerina Bosevska
Vadstena Henrik Thörnblad
Veberöd Hans-Åke Mårtensson
Vellinge Cecilia Wahlberg
Vetlanda Jörgen Asp
Vimmerby Marie-Louise Mobelius
Virserum Malin Zeilon
Vollsjö Thomas Hansson
Västervik Thomas Rörstrand
Växjö Maj-Lis Pettersson
Ystad Mia Kristell
Åhus Matz Nilsson
Åseda Malin Zeilon
Åtvidaberg Michael Sterne
Älmhult Fredrik Roghner
Ängelholm Irene Andersson
BRANCHES AND BRANCH MANAGERS
HANDELSBANKEN | ANNUAL REPORT 2019 249
HANDELSBANKEN YORKSHIRE & NORTH EAST UK
The operations are part of Handelsbanken plc.
BoardMikael Sørensen London,
CEO Handelsbanken UK, Chair
Mikael Hallåker Sundbyberg
Suzanne Minifie Leeds
HeadSuzanne Minifie Leeds
Branch/branch managerBarnsley Peter Gray
Beverley Anna Adcock
Bradford Andy Cook
Castleford Amy Walker
Chesterfield Phil Walker
Darlington Sarah Martinson
Doncaster Sarah Smith
Durham David Allenson
Gateshead Brian Foreman
Grimsby Di Jones
Halifax Andy Cook
Harrogate James Cornell
Hexham David Wilson
Huddersfield Tony Jones
Hull
Hesslewood Tim Kitching
Marina Court Tim Kitching
Ilkley Andrew Shakeshaft
Leeds
The Embankment David Brady
Lawnswood Andrew Lowther
Wellington Street Ian Noke
Middlesbrough Tom Ramshaw
Morpeth David Elliot
Newcastle upon Tyne Brian Foreman
Northallerton David Thompson
Rotherham Claire Ibbotson
Scarborough Steve Halliday
Sheffield
Barker’s Pool Stephen Tweedle
St Paul’s Oliver Dean
Stockton-on-Tees John Martinson
Sunderland Nicola Boardman
Tynemouth Mark Humphreys
Wakefield Paul Drysdale
Wetherby Sue Toulson
York Christopher Ibbotson
Meeting placesScunthorpe Sarah Smith
Branch/branch managerBanbury Paul Graham
Bedford Mick Valerio
Birmingham
Newhall St David Hastings
Temple Row Stephen Ellis
Bromsgrove Mark Turner
Burton-on-Trent Paul Thacker
Bury St Edmunds Martin Fish
Cambridge
Milton Road Paul Smith
Hills Road David Rundle
Colwyn Bay Gareth Jones
Coventry Andy McCabe
Crewe Sharon Wooliscroft
Derby Ian Morris
Edgbaston Michael Alldread
Hitchin Graham Pigott
Ipswich Andrew Pike
Leamington Spa Dani Coe
Leicester John Clay
Lincoln John Gell
Loughborough Emma Donson
Luton Philip Bidwell
Mansfield Darryn Evans
Milton Keynes Derek Bell
Northampton Mark Charteress
Norwich Ian Hall
Nottingham
Ropewalk Larick Walker
West Bridgford Ian Davys
Peterborough Julian Turner
Rugby Brett Salisbury
Shrewsbury Lindsay Pearson
Solihull Martin Randall
Stafford Helen Yates
Stourbridge Adam Pearson
Stratford-upon-Avon Richard Blount
Stoke-on-Trent Steve Cox
Tamworth Andrew Mair
Walsall Stephen Breen
Wolverhampton Paul Jones
Worcester Andrew Smith
Wrexham Vicky Varley
HANDELSBANKEN CENTRAL UK
The operations are part of Handelsbanken plc.
BoardMikael Sørensen London,
CEO Handelsbanken UK, Chair
Mikael Hallåker Sundbyberg
Graham Turner Birmingham
HeadGraham Turner Birmingham
BRANCHES AND BRANCH MANAGERS
250 HANDELSBANKEN | ANNUAL REPORT 2019
HANDELSBANKEN LONDON & SOUTH EAST UK
The operations are part of Handelsbanken plc.
BoardMikael Sørensen London,
CEO Handelsbanken UK, Chair
Mikael Hallåker Sundbyberg
John Hodson London
HeadJohn Hodson London
Branch/branch managerAshford Andy Davies
Bishop’s Stortford Stephen Hills
Brighton Simon Nicholson
Bromley Chris Pye
Canterbury Andy Davies
Chatham Gavin Coleman
Chelmsford Tim Paddon
Colchester Russell Felstead
Crawley Simon Briggs
Croydon Mike O’Neill
Dartford Trevor Adams
Ealing Chris Ttouli
Eastbourne Neil Hooper
Enfield Adrian Bennett
Epsom Phil Hunt
Harrow Anthony Fogden
Haywards Heath David Barden
Hertford Debbie Chilton
Hove Niky Hunt
Islington Paul Cooledge
Kingston Mark Lobo
London
Blackheath Raff Gallo
Chelsea Steven MacDonald
Chiswick Dermot Jordan
Clapham Jason May
Finchley Steve Smith
Hampstead Matthew Ireland, Acting
Holborn Jonathan Croney
Kensington Steven MacDonald
Large Corporates Toni Virtanen
Liverpool Street Mark Earlam
London Bridge Mark Lilliott
Marylebone Andrew Rowlands
Mayfair Andrew Rowlands
Moorgate Ross Simmons
Queen’s Park Chris Ttouli
Stratford Kirti Mistry
West End Roy Budgett
Maidstone Jeremy Brett
Redhill Clive Martin
Richmond Neil Higgs
Romford Andy Walker
Sevenoaks Nick Brooker
Southend-on-Sea Phil Clark
Staines-upon-Thames Carol Albert
St Albans Bill Whittemore
Tunbridge Wells Nick Green
Watford Andrew Samarasinghe
Weybridge Geoff Harrison
Wimbledon Michelle Groome
Meeting placesLondon
Belgravia Steven MacDonald
London Blackheath
Canary Wharf Raff Gallo
HANDELSBANKEN SOUTH WEST UK
The operations are part of Handelsbanken plc.
BoardMikael Sørensen London,
CEO Handelsbanken UK, Chair
Mikael Hallåker Sundbyberg
Chris Teasdale Bristol
HeadChris Teasdale Bristol
Branch/branch managerAbingdon David Cook
Ascot Richard Payton
Aylesbury Faisal Khan
Barnstaple Barry Lessiter
Basingstoke Julie Hurst
Bath Simon Cropper
Bodmin Leon Sargeant
Bournemouth Jeremy Tollworthy
Bridgend Illtyd Francis
Bristol
Bristol Aztec West Steve Howell
Clifton Jo Norton
Queen Square Martin Bidgood
Cardiff Neil Humphreys
Cheltenham Stephanie Hughston
Chichester Jonathan Hughes
Chippenham Shaun Bradshaw
Cirencester Shaun Bradshaw
Dorchester Andrew Denning
Exeter Jim Durrant
Farnham Kevin Heppell
Frimley Kenny McColl
Gloucester Emma Gray
Guildford Richard James
Henley-on-Thames Kerry Martin
Hereford David Cleaves
High Wycombe Sarah Dean
Newbury Geoff Dann
Newport Craig Wyer
Oxford
West Way Graham Beith
Parkway Bob Wood
Petersfield John Gornall
Plymouth Darren Edwards
Poole Mark Robertson
Portishead Steve Carter
Portsmouth Phil Dedman
Reading Jack Miller
Salisbury Graham Renshaw
Southampton Andy Taylor
Swansea Martin Griffiths
Swindon Jon Hemming
Taunton Peter Kirby
Truro Elizabeth Stansfield
Wells Martin Williams
Winchester John Gornall
Windsor Mark Bradbury
Yeovil Andrew Denning
BRANCHES AND BRANCH MANAGERS
HANDELSBANKEN | ANNUAL REPORT 2019 251
(E)*= employee representative
HANDELSBANKEN DENMARK
The operations are part of Svenska Handelsbanken, Copenhagen branch.
BoardCFO John Vestergaard Ikast, Chair
Lars Moesgaard Hellerup
Helle Rank Aalborg, (E)*
Sanne Weidner Aarhus
Lise Westphal Copenhagen
Carsten Gørtz Petersen
Højbjerg (Aarhus)
HeadLars Moesgaard Hellerup
n, Copenhagen branch.
Branch/branch managerAalborg
City Ole Dahl Nielsen
Syd Kristian Mark Pedersen
Aarhus
Aarhus City Morten Andersen
Aarhus Nord Lars Graugaard
Aarhus Syd Jacob Balling
Allerød Jens Karlsson
Amager Jakob Pilegaard Hansen
Aulum Gerda Kviesgaard
Ballerup Flemming Rumler
Birkerød Steen Hirschsprung
Brande Henrik Overgaard
Charlottenlund Michael Petersen
Copenhagen
City Gorm Ejmefors-Bjørkmann
Large Corporates Knud Jacobsen
Vest Jan Arup
Østerbro Martin Wibskov
Esbjerg Jan Plantener
Fredensborg Kjeld Aunstrup
Fredericia Brian Sørensen
Frederiksberg
Frederiksberg Jan Rasmussen
Frederiksberg Vest Carina Falck Hansen
Frederikssund Michael Tøgersen
Frederiksværk Alan Nielsen
Furesø Jeanett Schultz Brix
Give Kathrine Vesterager Andersen
Grindsted Kathrine Vesterager Andersen
Hammerum Vibeke Hestbek
Helsinge Mimi Boed
Helsingør Michael Hartoft
Herlev Morten Rotvit
Herning
City Arnth Stougaard
Fredhøj Bruno Hansen
Hillerød Dennis Grouleff
Holstebro Helle Bjerre
Horsens Martin Skovgaard Larsen
Hørsholm Allan Kandrup
Ikast Kenneth Kristiansen
Karup Kenneth Kristiansen
Kgs. Lyngby Preben Bjerrekær
Kibæk Nadja Schack Fucke
Kolding Carsten Johansen
Køge Kasper Bæk
Lemvig Poul Bakkegaard
Lynge Hatice Bakke
Odense Klaus Rydal
Roskilde Steen Hansen
Sdr. Felding Frank Jensen
Silkeborg Stefan Brochmann
Slagelse Mette Lund Raagart
Slangerup Ida Riisberg Mikkelsen
Stenløse Mie Jarman
Struer Poul Bakkegaard
Sunds Lars Christian Lauth Hansen
Vejle Lars Hoffmann
Viborg Henrik Toft Mathiasen
Videbæk Michael Frisk Sørensen
HANDELSBANKEN NORWAY
The operations are part of Svenska Handelsbanken, Oslo branch.
BoardBjørn Flatgård Kolbotn, Chair
Linda Bernander Silseth Nesøya
Christer Enersen Slemmestad, (E)*
Ivar Rusdal Egersund
Dag Tangevald-Jensen Oslo
Dag Tjernsmo Oslo
HeadDag Tjernsmo Oslo
Branch/branch managerArendal Vidar Akselsen
Asker Kirsti Jensås
Bergen
Fana Kristian H. Knudsen
Fyllingsdalen Gottlieb Gullaksen
Kokstad Jarle Hundven
Minde Margunn Kolle
Sentrum Geir Flaa
Vest Tore Svein Nese
Åsane Mette Skauge
Bodø Tore Halvorsen
Drammen Hege Kristiansen
Fredrikstad Tove Anita R Torp
Halden Espen Lerkerød
Hamar Lars Erik Jevanord
Haugesund Paal Tollefsen, Acting
Jessheim Inger Kyhen
Kolbotn Hanne Bjørnå Berntsen
Kongsberg Håvard Røed Langerud
Kristiansand Vidar Akselsen
Larvik Bodil Hansen
Lillehammer Thomas Næstad Moe
Lillestrøm Helene Molund, Acting
Lysaker Glenn Steinbø
Mo i Rana Svenn Harald Johannesen
Molde Jørund Alme
Moss Willy Fossum
Oslo
Grev Wedels plass Thomas B. Tresselt
Large Corporates Harald Søreide
Majorstuen Jannike Johansen
Nydalen Marius Bretteville
Olav Vs gate Eirik Arnesen
Bryn Ole Hellevik
Skøyen Thomas Stousland
Økern Ronny Myreng
Sandefjord Hans Jørgen Ormar
Sandnes Sindre Bergsagel
Sandvika Cecilie Tvedt
Sarpsborg Tormod Sørum
Ski Geir Anders Sundnes
Skien Mårten Jacobsson
Stavanger
Sentrum Rolf Inge Knudsen
Straen Ole Henry Slette
Tromsø Raymond Brendeløkken
Trondheim
Leangen Ole-Martin Smedseng
Søndregate Ola Grøtte
Tønsberg Arild Gjørvad, Acting
Ålesund Steinar Krøvel
lo branch.
BRANCHES AND BRANCH MANAGERS
252 HANDELSBANKEN | ANNUAL REPORT 2019
(E)*= employee representative
HANDELSBANKEN THE NETHERLANDS
The operations are part of Svenska Handelsbanken AB, The Netherlands branch.
BoardGöran Stille Stockholm, Chair
Per Jansson Stockholm
Roland van Pooij Driebruggen
Acting HeadRoland van Pooij Driebruggen
Branch/branch managerAlkmaar Ronald Smit
Alphen aan den Rijn Rens Ramakers
Amersfoort Jeroen Ammerdorffer
Amsterdam
Amstel Lars Vissers
Centrum Jasper Klok
Zuid Daniël van Til
Apeldoorn Jeroen Altena
Arnhem Patricia Schwalbach
Bergen op Zoom Jeroen Wiertz
Breda Edwin Boonk
Den Haag Marc de Brey
Drenthe Norbert van de Lande
Eindhoven Pieter van de Koolwijk
Groningen Erwin van der Steur
Haarlem Nicole Broersma
Het Gooi Laurens de Jong
Laren Sharon Peeters
Leeuwarden Tammo Oosterhof
Maastricht Tim Neu
Rijnmond Zuid Wim Tieleman
Roermond Luc Geisen
Rotterdam Riewing van Eerden, Acting
Schiphol Caroline Mesters
’s-Hertogenbosch Nicole van Rijmenam
Tilburg Erik de Beer
Twente Martijn Peters
Utrecht Robert van der Kolk
Zwolle Peter Hulsbergen
Meeting placesSchiphol
Amstelveen Sebastiaan
van den Berkmortel
HANDELSBANKEN FINLAND
The operations are part of Svenska Handelsbanken, Helsinki branch.
BoardTapio Hakakari Hyvinkää, Chair
Hanne Katrama Helsinki
Esa Korvenmaa Helsinki
Pirjo Repo Helsinki
Leena Saarinen Helsinki
Pekka Vasankari Vantaa, (E)*
Acting HeadHanne Katrama Helsinki
Branch/branch managerEspoo
Tapiola Harri Tuohimaa
Matinkylä Juha-Lassi Laisi
Etelä-Karjala Arto Valjakka
Helsinki
Aleksi Risto Vihula
Pasila Risto Mäkeläinen
Ruoholahti Outi Vesanto
Herttoniemi Hanna Kuvaja
Kamppi Sami Hoffrén
Large Corporates Riitta Hallila
Munkkiniemi Jarkko Pöysti
Hyvinkää Henri Uronen
Hämeenlinna Auli Lehtomäki
Joensuu Mauri Kujanen
Jyväskylä Jesse Järvinen
Keski-Uusimaa Ilkka Arenius
Kokkola Mikael Wiklund
Kuopio Jesse Järvinen, Acting
Kymenlaakso Joonas Heinonen
Lahti Jaana Repo-Kemppinen
Mikkeli Jussi Myllymäki
Oulu Jari Itkonen
Pietarsaari Jörgen Blomqvist
Porvoo Pasi Sirola
Rovaniemi Sami Hiltunen
Satakunta Lauri Leinonen
Seinäjoki Jaana Meritähti
Tammisaari Anders Sandbacka
Tampere
Kuninkaankatu Tarja Suvisalmi
Kyttälä Ilari Tyrkkö
Tornio Matti Tapio
Turku
Kauppatori Teemu Alanko
Kupittaa Teemu Alanko
Vaasa Frej Björses
Vantaa
Aviapolis Mari Govenius
Tikkurila Pauli Ranta
Meeting placesKymenlaakso
Kouvola Joonas Heinonen
sinki branch.
BOARDS OF SUBSIDIARIES
HANDELSBANKEN | ANNUAL REPORT 2019 253
(E)*= employee representative
** For the complete name of the company, see note P16.
ECSTER**
BoardKatarina Ljungqvist Stockholm, Chair
Yonnie Bergqvist Täby
Eva Eldebrink Strängnäs, (E)*
Benny Johansson Stockholm
Agneta Lilja Drottningholm
Chief Executive Ecster
Yonnie Bergqvist
EFN**
BoardKatarina Ljungqvist Stockholm, Chair
Magnus Berglund Saltsjöbaden
Carl Bjurling Enskede
Ann Öberg Vaxholm
Ulf Köping-Höggård Lidingö
Chief Executive EFN
Mikaela Strand
HANDELSBANKEN FINANS**
Board Hans Winge Gothenburg, Chair
Nicklas Grip Värmdö
Marie Järvås Hägersten, (E)*
Erik de la Motte Helsingborg
Chief Executive Handelsbanken Finans
Magnus Sternbrink
HANDELSBANKEN FONDER**
Board Michael Green Stockholm, Chair
Helen Fasth Gillstedt Djursholm
Malin Hedman Björkmo Lidingö
Robert Lundin Stockholm, (E)*
Lars Seiz Antibes, France
Göran Stille Stockholm
Chief Executive Handelsbanken Fonder
Magdalena Wahlqvist Alveskog
HANDELSBANKEN LIV**
Board Mikael Hallåker Sundbyberg, Chair
Katarina Berner Frösdal Stockholm
Viveca Classon Stockholm
Anna Hjelmberg Järfälla, (E)*
Tobias Lindhe Uppsala
Anders Ohlner Malmö
Chief Executive Handelsbanken Liv
Louise Sander
HANDELSBANKEN PLC**
Board Mikael Hallåker Sundbyberg, Chair
CFO Martin Björnberg London
Non-executive Director Tanya Castell Inverness-shire
Non-executive Director John Ellacott West Yorkshire
Non-executive Director Maureen Laurie East Sussex
Non-executive Director Agneta Lilja Drottningholm
CEO Mikael Sørensen London
Chief Executive Handelsbanken plc
Mikael Sørensen
OPTIMIX**
Board Edwin van Essen Almere, Acting Chair
Gert van Wakeren Soest
STADSHYPOTEK**
Board Katarina Berner Frösdal Stockholm, Chair
Michael Bertorp Stockholm
Mikael Hallåker Sundbyberg
Helena Håkansson Färjestaden, (E)*
Jörgen Nilsson Nacka
Helena Öström Nimander Enebyberg
Chief Executive Stadshypotek
Göran Stille
XACT KAPITALFÖRVALTNING**
Board Per Beckman Lidingö, Chair
Michael Bertorp Stockholm
Gunnar Båtelsson Sandviken
Maria Lönnqvist Bromma, (E)*
Åsa Magnusson Stockholm
Lena Munkhammar Solna
Chief Executive XACT Kapitalförvaltning
Pär Nürnberg
OUTSIDE THE NORDIC COUNTRIES, THE UK AND THE NETHERLANDS
Operations are conducted in Svenska Handelsbanken with branches in each country.
REPRESENTATIVE OFFICES
BOARDS OF SUBSIDIARIES
Estonia
General Manager Annika Nordström
Tallinn Jan Nurminen
France
General Manager Peggy Paul
Nice Anna Jansson-Clauzier
China
General Manager Mikael Westerback
Hong Kong David Haqvinsson
Shanghai Mikael Westerback
Beijing
Representative Joakim Hedhill
Kuala Lumpur
Representative Abhinash Murukesvan
Latvia
General Manager Annika Nordström
Riga Martins Freibergs
Lithuania
General Manager Annika Nordström
Vilnius Paulius Zagurskis
Luxembourg
General Manager Peggy Paul
Marbella
Representative Vibeke Toustrup Bonne
Mumbai
Representative Ashish Gupta
Poland
General Manager Marzena Zahlin
Singapore
General Manager Robert Radway
Germany
General Manager Annika Brunnéd
USA
General Manager Martin Blåvarg
Taipei
Representative Amy Chen
Zürich
Representative Andreas Wedar
DEFINITIONS AND EXPLANATIONS
254 HANDELSBANKEN | ANNUAL REPORT 2019
Definitions and explanations
ALTERNATIVE PERFORMANCE
MEASURES
The Bank’s financial reports contain alternative
performance measures which Handelsbanken
considers to provide valuable information to the
reader, since they are used by executive man-
agement for internal financial control and follow-
up of performance and also for comparison
between reporting periods.
Alternative Performance Measures (APMs)
are financial measures of performance, financial
position or cash flow that are neither defined in
IFRS nor the capital requirement regulations.
These need not be comparable with similar key
figures (performance measures) presented by
other companies. Calculations of certain perfor-
mance measures are reported in the Fact Book
which is available at handelsbanken.com.
ADJUSTED EQUITY PER SHARE
Equity at the end of the year reduced by the
equity effect of cash flow hedges and the
minority share of equity. Adjusted equity is
then divided by the number of ordinary shares
at the year-end reduced by buybacks. Where
applicable, the dilution effect is taken into
account.
C/I RATIO
Total expenses in relation to total income. In
segment reporting, profit allocation is included
in total income.
CREDIT LOSS RATIO
Credit losses on loans to the public in relation to
loans to the public at the beginning of the year.
EARNINGS PER SHARE
The profit for the year attributable to holders of
ordinary shares divided by the average number
of outstanding shares. Where applicable, the
dilution effect is taken into account.
ECONOMIC CAPITAL
Economic capital is a model for calculating eco-
nomic capital which, in one measurement, iden-
tifies the Group’s overall risks and indicates the
capital which, with very high probability, will
cover unexpected losses or decreases in value.
INTEREST RATE MARGIN
Net interest income for the period calculated for
the full year, in relation to average total assets.
P/E RATIO
The share price at year-end divided by earnings
per share.
PROPORTION OF LOANS IN STAGE 3
Net loans to the public in Stage 3 in relation to
gross loans to the public.
RESERVE RATIO STAGE 1
Provisions in Stage 1 for loans to the public in
relation to gross loans to the public in Stage 1.
RESERVE RATIO STAGE 2
Provisions in Stage 2 for loans to the public in
relation to gross loans to the public in Stage 2.
RESERVE RATIO STAGE 3
Provisions in Stage 3 for loans to the public in
relation to gross loans to the public in Stage 3.
RETURN ON ALLOCATED CAPITAL
The segment’s operating profit after profit allo-
cation, calculated using a tax rate of 22 per
cent, in relation to the average capital allocated
quarterly during the year.
RETURN ON EQUITY
The year’s profit in relation to average equity.
Average equity for the last four quarters is
adjusted for value changes on financial assets
classified as available for sale, derivatives in
cash flow hedges, revaluation effects from
defined benefit pension plans and a weighted
average of new share issues, dividends, and
repurchases of own shares.
RETURN ON TOTAL ASSETS
The year’s profit in relation to the average of total
assets for the past five quarters.
TOTAL RESERVE RATIO
Total provisions for loans to the public in relation
to gross loans to the public.
TOTAL RETURN
The total of the year’s change in share price and
paid dividend per share divided by the share
price at the end of the previous year.
DEFINITIONS AND EXPLANATIONS
HANDELSBANKEN | ANNUAL REPORT 2019 255
KEY FIGURES DEFINED IN THE CAPITAL
REQUIREMENTS REGULATION
ADDITIONAL TIER 1 CAPITAL
Additional tier 1 capital comprises perpetual
subordinated loans which meet the require-
ments stated in Regulation (EU) No 575/2013
and can therefore be included in the tier 1 capital.
CAPITAL REQUIREMENT
The statutory capital requirement means that
an institution which is subject to CRR must have
a common equity tier 1 ratio of at least 4.5 per
cent, a tier 1 ratio of at least 6 per cent and a
total capital ratio of at least 8 per cent. This
means that own funds for the respective ratio
must be at least the stated percentage of the
risk exposure amount. For definitions of the
respective own funds amounts, see Common
equity tier 1 capital, Tier 1 capital and Total
capital. In addition to the general requirements,
the supervisory authority may add institution-
specific requirements in accordance with Pillar 2
of the regulations.
COMMON EQUITY TIER 1 CAPITAL
Common equity tier 1 capital is one of the com-
ponents of own funds and mainly comprises
equity. Deductions are made for dividends gen-
erated, goodwill and other intangible assets etc.
and also for the difference between an expected
loss and provisions made for probable credit
losses.
COMMON EQUITY TIER 1 RATIO
Common equity tier 1 capital in relation to total
risk exposure amount.
COMMON EQUITY TIER 1 RATIO AVAILABLE
FOR USE AS A BUFFER
The common equity tier 1 ratio after a deduction
for the part of common equity tier 1 capital
required to comply with all formal capital
requirements.
CREDIT CONVERSION FACTOR (CCF)
The factor that is used when calculating the
exposure amount for unutilised overdraft facili-
ties, committed loan offers, guarantees and
other off-balance-sheet commitments.
CREDIT VALUATION
ADJUSTMENT RISK (CVA)
Credit valuation adjustment risk (CVA) measures
the risk that the market value of a derivative will
decrease as a result of the creditworthiness of
the counterparty weakening. The credit valua-
tion adjustment is a component in the regula-
tions for valuation of derivatives. The adjustment
of the value is based on the counterparty’s
creditworthiness. An exposure to a counterparty
with weaker creditworthiness must have a lower
carrying amount than the equivalent exposure
to a counterparty with better creditworthiness.
In this context, credit risk means that if a given
counterparty’s creditworthiness weakens, the
balance sheet values of all derivative transactions
with this counterparty with a positive market
value decrease – and thus the Bank’s equity
decreases. To factor in this risk in the capital
adequacy, the credit valuation adjustment risk
has been introduced as part of the capital
adequacy regulations.
EXPOSURE AMOUNT
The exposure amount (exposure at default) is
the amount which is subject to capital adequacy
requirements. It is calculated inclusive of interest
and fees. Amounts for off-balance-sheet items
are recalculated with the credit conversion factor
(CCF). For derivatives, the exposure amount is
calculated as positive MTM (mark-to-market)
plus value change risk, i.e. the nominal amount
multiplied by the upward adjustment factor.
EXPOSURE VALUE
Exposure value is the same as exposure
amount. The exposure value concept is used
in the standardised approach for credit risk.
LEVERAGE RATIO
Tier 1 capital in relation to total assets, including
certain off-balance sheet items recalculated
with conversion factors defined in the standard-
ised approach and regulatory adjustments from
own funds.
LIQUIDITY COVERAGE RATIO (LCR)
High-quality liquid assets in relation to an esti-
mated net outflow of liquidity over a period of
30 days.
OWN FUNDS/TOTAL ASSETS
Own funds are the sum of tier 1 and tier 2 capital.
RISK EXPOSURE AMOUNT
The capital requirement in accordance with
CRR, multiplied by 12.5. The risk exposure
amount is used in conjunction with market risk
and operational risk.
RISK WEIGHT
A measure to describe the level of risk an expo-
sure is expected to have according to the capi-
tal adequacy regulations.
RISK-WEIGHTED EXPOSURE AMOUNT
Exposure amount multiplied by risk weight.
Risk-weighted exposure amount is used in con-
junction with credit risk and counterparty risk.
TIER 1 CAPITAL
Common equity tier 1 capital including additional
tier 1 capital.
TIER 1 RATIO
Tier 1 capital in relation to total risk exposure
amount.
TIER 2 CAPITAL
Tier 2 capital is a sub-component of own funds
and mainly comprises subordinated loans which
meet the requirements stated in Regulation (EU)
No 575/2013 and can therefore be included in
tier 2 capital.
TOTAL CAPITAL RATIO
Total capital in relation to total risk exposure
amount.
TOTAL RISK-WEIGHTED
EXPOSURE AMOUNT
Total risk exposure amount is the sum of risk
exposure amount and risk-weighted exposure
amount.
DEFINITIONS AND EXPLANATIONS
256 HANDELSBANKEN | ANNUAL REPORT 2019
EXPLANATIONS
BENCHMARK EFFECT
The benchmark effect refers to differences
between the interest-fixing periods of lending
and funding that result when Stadshypotek’s
issues mature at nine-month intervals while new
lending to customers occurs daily. The effect
varies from quarter to quarter but approaches
zero over the long term.
CRR
CRR is the EU capital requirements regulation
for credit institutions and investment firms:
Regulation (EU) No 575/2013 on prudential
requirements for credit institutions and invest-
ment firms.
ELIGIBLE LIABILITIES AND OWN FUNDS
The sum total of qualifying eligible senior liabili-
ties according to the Swedish Resolution Act
(SFS 2015:1016) and own funds.
ITRAXX
ITRAXX Financials is an index of CDS spreads
(credit default swaps) for the 25 largest bond
issuers in the European bank and insurance
sector. It describes the average premium that
an investor requires in order to accept credit risk
on the companies.
MREL SPECIFICATIONS
Minimum requirement regarding eligible liabili-
ties and own funds. The requirement is deter-
mined annually by the Swedish National Debt
Office, the resolution authority pursuant to the
Swedish Resolution Act (SFS 2015:1016).
NON-RECURRING ITEMS
Non-recurring items are items which Handels-
banken deems to be of a one-off nature. These
are specified in Handelsbanken’s Fact Book,
which is available at handelsbanken.com/ir.
OTC DERIVATIVES
Over-the-counter derivatives are uncleared
tailor-made derivatives.
PREMIUMS WRITTEN
A concept used within the Bank’s insurance
operations denoting mainly the total of insur-
ance premiums paid in during the year.
RISK RESULT
A concept used in the Bank’s insurance opera-
tions. The year’s risk result is the difference
between the fees the company charges to
cover the insurance risks (mortality, life expec-
tancy, disability and accident) and the actual
cost of the insurance events.
SOCIAL SECURITY COSTS
Fees for financing social security systems. This
comprises employers’ contributions and special
payroll tax in Sweden and equivalent taxes and
charges elsewhere.
SOLVENCY RATIO
A concept used in insurance operations. The
solvency ratio equals own funds divided by the
solvency capital requirement and is a measure
of the margin the company has to meet its
commitments. The ratio for a demutualised,
profit-distributing life insurance company
cannot be compared with the ratio for a mutual
life insurance company.
SPECIAL ITEMS
Special items are items which tend to vary
between financial reporting periods, such as
provisions to the Oktogonen profit-sharing
foundation, and which Handelsbanken has
specified in detail to facilitate comparison of
financial performance.
TOTAL LIABILITIES AND OWN FUNDS
The sum total of the Bank’s total liabilities and
capital base.
YIELD SPLIT
When the total yield exceeds the guaranteed
return for insurance with a guaranteed return,
the insurance company will receive 10 per cent
of the total yield as its share in the yield split.


handelsbanken.com | +46 (0)8 701 10 00 | SE-106 70 Stockholm, Sweden
Recommended