7/30/2019 Applied Energy 100 2012 187 192
http://slidepdf.com/reader/full/applied-energy-100-2012-187-192 1/6
Silver recovery and chemical oxygen demand (COD) removal from waste
fixer solutions
Wei-Ting Chen a, Chin-Chi Ma b, Ming-Hsun Lee a, Yung-Chuan Chu a, Lung-Chang Tsai b, Chi-Min Shu b,⇑
a Graduate School of Engineering Science and Technology, National Yunlin University of Science and Technology (YunTech), Douliou, Yunlin 64002, Taiwanb Department of Safety, Health, and Environmental Engineering, YunTech, Douliou, Yunlin 64002, Taiwan
h i g h l i g h t s
" This study focused on the Ag recovery from waste fixer solutions by electrolysis.
" 99.55% of silver recovery was obtained with electric current of 3 A during 2.5 h.
" The purity of silver was 98.62% with electric current of 3 A.
" Higher removal efficiency of COD by employing distillation was obtained.
a r t i c l e i n f o
Article history:
Received 17 February 2012
Received in revised form 24 April 2012
Accepted 8 June 2012
Available online 12 July 2012
Keywords:Silver recovery
Waste fixer solutions
Electrolysis
Chemical oxygen demand (COD)
Distillation
a b s t r a c t
This study focused on the silver recovery from waste fixer solutions by electrolysis under different exper-
imental conditions. During an 8 h electrolysis procedure, the silver recovery efficiencies were 10.57%,
11.75%, 45.5%, 62.68%, and 83.88% for electric currents of 0.1 A, 0.3 A, 0.5 A, 0.7 A, and 0.9 A, respectively.
Thus, the most efficient recovery factor of silver was found for a current of 0.9 A. Additionally, the pH
values of the waste fixer solutions were adjusted prior to treatment by electrolysis, and the silver recov-
ery was 100% for a solution with pH 8 that underwent electrolysis for 8 h at an electric current of 0.9 A.
The recovery efficiency of silver was 88.64% for an electric current of 3 A and a duration of 3.5 h, but therecovery efficiency of silver decreased to 83.72% for an electrolytic time of 6 h. Furthermore, the recovery
efficiency of silver increased to 99.55% with a decreased electrolysis time of 2.5 h when the solution was
adjusted to pH 8 at an electric current of 3 A. These results suggest that the most suitable experimental
conditions were an electric current of 3 A, pH 8, and2.5 h of electrolysis. Thetreated waste fixer solutions
still had high concentrations of chemical oxygen demand (COD) after electrolysis. The addition of 30 mL
of sulfuric acid to 1000 mL of waste fixer solution resulted in a COD removal efficiency of 42%. Further-
more, when the waste fixer solutions were treated by distillation to remove COD, the removal efficiency
of COD was 99.3%. Although a higher COD removal efficiency was obtained by employing distillation, the
cost of the distillation treatment was more expensive.
Ó 2012 Elsevier Ltd. All rights reserved.
1. Introduction
The demand for energy is increasing because of rapid industri-
alization and societal growth. Conventional primary energy
sources, such as coal, oil, and natural gas, have limited reserves
that are not expected to last for an extended period of time. Addi-
tionally, the environmental problems associated with these con-
ventional energy sources continue to affect the global ecosystem.
To reduce fossil fuel consumption and alleviate environmental
problems, renewable energy resources are expected to play a key
role in future energy consumption [1]. There are many previous
studies of energy recovery from waste sources and materials, such
as waste heat [2,3], waste tyres [4], and waste solutions. For each
of these processes, waste energy can be recovered and reused,
and this study evaluates a recovery process to recycle silver from
waste fixer solutions.
Because of their high photosensitivity, beginning in 1837, silver
halides were employed in the photographic fixing process using
ammonium thiosulfate (ATS) and sodium thiosulfate solutions
(STSs) as fixing baths [5]. Because of the extensive usage of silver
halides, photographic manufacturing processes resulted in enor-
mous amounts of waste fixer solutions. According to the disposal
estimation of waste fixer solutions from the Environmental Protec-
tion Administration, Executive Yuan (Taiwan), approximately
36,310 tons of waste fixer solutions are generated per year from
0306-2619/$ - see front matter Ó 2012 Elsevier Ltd. All rights reserved.http://dx.doi.org/10.1016/j.apenergy.2012.06.026
⇑ Corresponding author. Tel.: +886 5 534 2601; fax: +886 5 531 2069.
E-mail address: [email protected] (C.-M. Shu).
Applied Energy 100 (2012) 187–192
Contents lists available at SciVerse ScienceDirect
Applied Energy
j o u r n a l h o m e p a g e : w w w . e l s e v i e r . c o m / l o c a t e / a p e n e r g y
7/30/2019 Applied Energy 100 2012 187 192
http://slidepdf.com/reader/full/applied-energy-100-2012-187-192 2/6
photographic manufacturing [6]. These waste fixers contain high
levels of silver (Ag), where concentrations are typically in the range
of 5000–10,000 mg/L. Furthermore, the waste fixer solutions con-
tain substantial quantities of components that can be both toxic
and valuable depending on the quality of the raw materials [7].
Thus, for both economic and environmental reasons, it is important
to recover valuable components (such as Ag) from waste fixer
solutions. Conventional fixing of silver compounds (AgX) in photo-
graphic and medical X-ray films has been extensively used by the
photo-industry for more than two centuries. The fixing of silver
halides by thiosulfates and thiocyanates is usually rapid and does
not need any catalytic influence. Silver halides are highly soluble
in these lixiviants and are considered to be thermodynamically
stable at a slightly alkaline pH. The simplified mechanisms for
the dissolution of AgCl in thiosulfate solutions are shown in Eqs.
(1) and (2) [8].
AgClðsÞ þ 2ðNH4Þ2S2O3ðaqÞ () ðNH4Þ3½AgðS2O2ÞðaqÞ þ NH4ClðaqÞ ð1Þ
AgClðsÞ þ 2Na2S2O3ðaqÞ () Na3½AgðS2O2ÞðaqÞ þ NaClðaqÞ ð2Þ
ATS and STS are commonly used as preservatives, hardeners,
and buffers in fixing baths, which perform various functions inthe photographic fixing process [8]. This process leads to waste
fixer solutions that have high levels of silver, which can be recov-
ered using many conventional methods, including electrolysis [9],
oxygenation reduction [10,11], and sulfide precipitation [12]. The
treated waste fixer solutions contain high concentrations of chem-
ical oxygen demand (COD) after electrolysis, so it is necessary to
remove the high COD concentrations before disposing of the solu-
tions. This study evaluates the recovery of Ag from waste fixer
solutions, as well as the removal efficiency of COD from the treated
waste fixer solutions.
2. Experimental
2.1. Materials
The waste fixer solutions, which were obtained from a photo-
graphic shop (Kodak) in Douliou, Yunlin, Taiwan, did not receive
any pre-treatment, such as electrolysis [9], oxygenation, reduction
[10,11], sulfide precipitation [12], or ion exchange [13], and they
were not mixed with any other chemicals. The concentration of
Ag in the waste fixer solutions was measured by Inductively
Coupled Plasma-Atomic Emission Spectroscopy (ICP-AES) (Optima,
5100 DV) or Atomic Absorption Spectroscopy (AA) (Perkin Elmer,
5100), and the concentrations of Ag were found to be in the range
of 2700–3300 mg/L. Additionally, the waste fixer solutions con-
tained a variety of organic and inorganic materials, including as
chelating-agents such as EDTA, acetate, thiosulfate, metabisulfite,
and ammonium compounds. These materials account for the high
COD concentration of 88,654 mg/L in the solution, excluding the
concentration of Ag. EDTA and acetate were the primary cause of
the acidic pH of the waste fixer solutions, which had a pH of
6.09.
2.2. Analysis of component elements
The component elements in the waste fixer solutions were ana-
lyzed by ICP-AES or AA, whichwereused to determine the metalion
concentration in the aqueous phase and to analyze the ores. Equal
volumes (10 mL) of the aqueous and organic phases were shaken
at roomtemperature (25 ± 3 °C) for 5 min to ensurecomplete equil-
ibration. The two phases were separated, and a suitable aliquot of
the aqueous phase was assayed for the metal ion concentration.
Three tests indicated that the value of 95% extraction for the metal
ion was associated with a variation coefficient of ±3% [14].
2.3. Electrolysis procedures
Electrolysis was used to recover silver from the waste fixer solu-
tions, where the cathode plate and the anode plate were made of
stainless steel and graphite, respectively. To determine the most
suitable electrolysis efficiency, the electrolysis process was evalu-
ated over a range of settings for a variety of parameters, such as
pH, electric current, and electrolysis time.
0
10
20
30
40
50
60
70
80
90
100
0
500
1,000
1,500
2,000
2,500
3,000
3,500
0 1 2 3 4 5 6 7 8
0.1 A SIC
0.3 A SIC
0.5 A SIC
0.7 A SIC
0.9 A SIC
0.1 A SRE
0.3 A SRE
0.5 A SRE
0.7 A SRE
0.9 A SRE S i l v e r i o n c o n c e n t r a t i o n ( m g / L )
Electrolysis time (h)
R e c o v e r y e f f i c i e n c y ( % )
Fig. 1. The silver recovery from waste fixer solutions by electrolysis with lowelectric currents.
0
10
20
30
40
50
60
70
80
90
100
0
500
1,000
1,500
2,000
2,500
3,000
3,500
0 1 2 3 4 5 6 7 8
pH3 SIC
pH4 SIC
pH5 SIC
pH6 SIC
pH7 SIC
pH8 SIC
pH9 SIC
pH10 SIC
pH3 SRE
pH4 SRE
pH5 SRE
pH6 SRE
pH7 SRE
pH8 SRE
pH9 SRE
pH10 SRE
Electrolysis time (h)
S i l v e r i o n c o n c e n t r a
t i o n ( m g / L )
R e c o v e r y e f f i c i e n c y ( % )
Fig. 2. Silver recoveries with an electric current of 0.9 A at various pH values.
0
10
20
30
40
50
60
70
80
90
100
0
500
1,000
1,500
2,000
2,500
3,000
3,500
0 0.5 1 1.5 2 2.5 3 3.5 4 4.5 5 5.5 6
SIC
SRE
Electrolysis time (h)
R e c o v e r y e f f i c i e n c y ( % )
S i l v e r i o n c o n c e n t r a t i o n ( m g / L )
Fig. 3. The silver recovery with an electric current of 3 A.
188 W.-T. Chen et al./ Applied Energy 100 (2012) 187–192
7/30/2019 Applied Energy 100 2012 187 192
http://slidepdf.com/reader/full/applied-energy-100-2012-187-192 3/6
2.4. Removal efficiency of COD
The COD test is commonly used to indirectly measure the con-centration of organic compounds in a water sample, and it provides
a useful index of the amount of organic pollutants that are present.
Most applications of the COD test are intended to determine the
amount of organic pollutants found in a surface water (e.g., lakes
and rivers), which makes COD a useful measure of water quality.
COD is typically expressed in milligrams per liter (mg/L), which
indicates the mass of oxygen consumed per liter of solution,
although older references may express COD as parts per million
(ppm) [15]. We did not use conventional COD removal methods,
such as activated sludge processes [16], aerobic and anaerobic
treatment processes, or coagulation treatment. Instead, we used
acid leaching and distillation treatments to remove COD.
3. Results and discussion
3.1. Electrolysis of waste fixer solutions at a low electric current
To obtain the proper electric current for electrolysis, 1000 mL of
waste fixer solution was treated at a low electric current. We eval-
uated the process at different electric currents (0.1 A, 0.3 A, 0.5 A,
0.7 A, and 0.9 A), and samples were collected at hourly intervals
throughout the duration of the electrolysis procedure. Following
this procedure, we used the proper electric current to determine
the most suitable pH value for electrolysis by varying the pH of
the waste fixer solution (with set pH values of 3, 4, 5, 7, 8, 9, and
10), where the original pH of the waste fixer solution was 6.
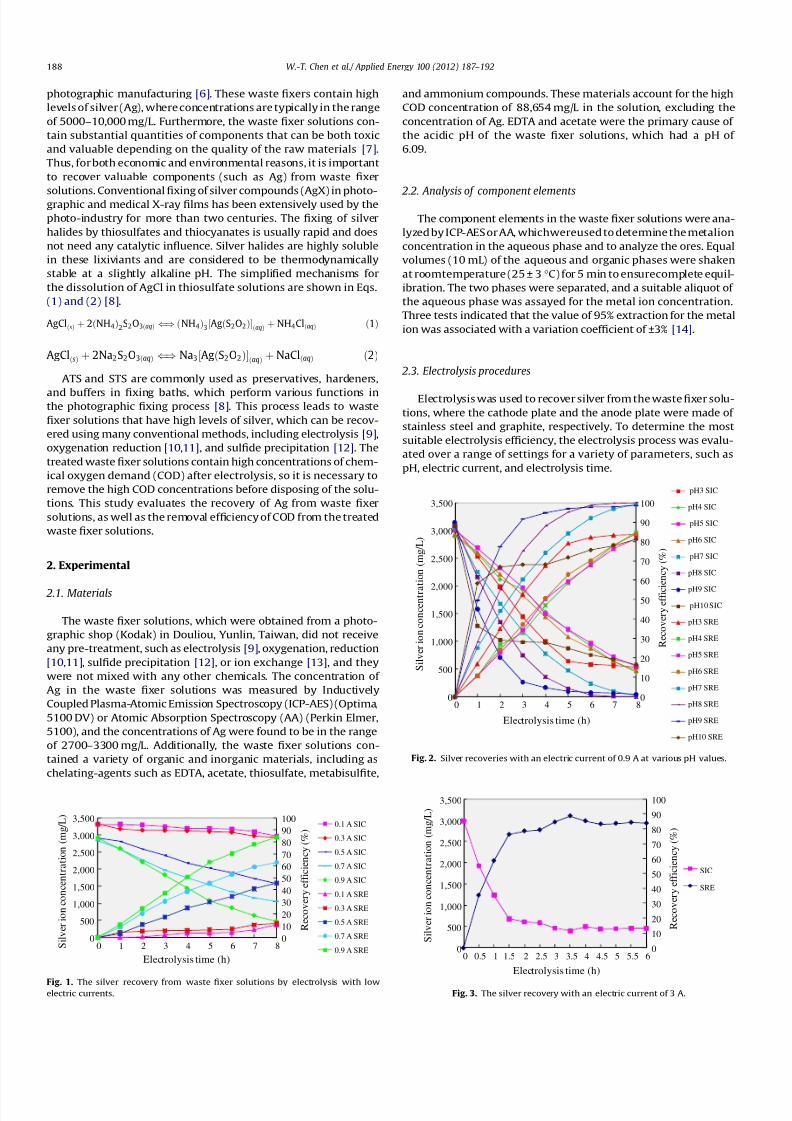
Fig. 1 shows that the recovery of silver increases for a specificelectric current as the electrolysis time is increased. The recovery
efficiencies of silver during the 8 h electrolysis procedure at
0.1 A, 0.3 A, 0.5 A, 0.7 A, and 0.9 A were 10.57%, 11.75%, 45.50%,62.68%, and 83.88%, respectively. These results show that the most
suitable electric current is 0.9 A. We obtained the most suitable pH
value for the waste fixer solutions from the experiment shown in
Fig. 2, which used an electric current of 0.9 A for solutions at varied
pH values. The recovery efficiencies of silver at pH 3, 4, 5, 6, 7, 8, 9,
and 10 were 83.65%, 84.66%, 81.54%, 83.88%, 99.09%, 100%, 98.63%,
and 81.20%, respectively. These results show that the most suitable
pH value is pH 8. These experiments demonstrate that the most
suitable recovery efficiency of silver is 100% at 0.9 A and pH 8.
The recovery efficiency of silver at pH 9 or pH 10 was less than
the recovery efficiency at pH 8 because a portion of the metal ions
were deposited while the pH of the waste fixer solutions was ad-
justed to 9. Furthermore, the phenomenon of metal ion deposition
becomes obvious when the pH value is adjusted to pH 10. Theco-precipitation of metal ions during electrolysis resulted in a
0
10
20
30
40
50
60
70
80
90
100
0
500
1,000
1,500
2,000
2,500
3,000
3,500
0 0.5 1 1.5 2 2.5 3 3.5
SIC
S i l v e r i o
n c o n c e n t r a t i o n ( m g / L )
Electrolysis time (h)
R e c o v e r y e f f i c i e n c y ( % )
SRE
Fig. 4. The silver recovery with an electric current of 3 A at pH 8.
0
10
20
30
40
50
60
70
80
90
100
0
1,000
2,000
3,000
4,000
5,000
6,000
7,000
8,000
9,000
10,000
0 10 20 30 40 50 60 80 100 1 20 150 180 210 240
SIC
SRE
R e c o v e r y e f f i c i e n c y ( % )
Electrolysis time (min)
S i l v e r i o n c o n c e n t
r a t i o n ( m g / L )
Fig. 5. The purification of silver by electrolysis with an electric current of 0.9 A.
Fig. 6. The appearance of the silver metal.
0
10,000
20,000
30,000
40,000
50,000
60,000
70,000
80,00090,000
100,000
0 1 2 3 4 5 C O D c o n c e n t r a t i o n ( m g
/ L )
Mass volume (%)
HCl
H2SO4
HNO 3
Fig. 7. The COD removal efficiency of waste fixer solutions with 1–5% of various
acids.
Table 1The COD removal efficiency of waste fixer solutions with 1–5% of various acids.
Acid
volume
(%)
COD concentration
after mixed with
H2SO4 (mg/L)
COD concentration
after mixed with
HNO3 (mg/L)
COD concentration
after mixed with
HCl (mg/L)
0 88,654 88,654 88,654
1 81,693 87,166 83,948
2 65,667 80,130 79,846
3 51,205 74,267 78,897
4 54,332 64,495 77,307
5 53,550 57,850 76,717
W.-T. Chen et al./ Applied Energy 100 (2012) 187–192 189

7/30/2019 Applied Energy 100 2012 187 192
http://slidepdf.com/reader/full/applied-energy-100-2012-187-192 4/6
decrease in the recovery efficiency of silver. Conclusively, we can
obtain the most suitable recovery efficiency of silver by employing
these suitable experimental parameters for the electrolysis
procedure.
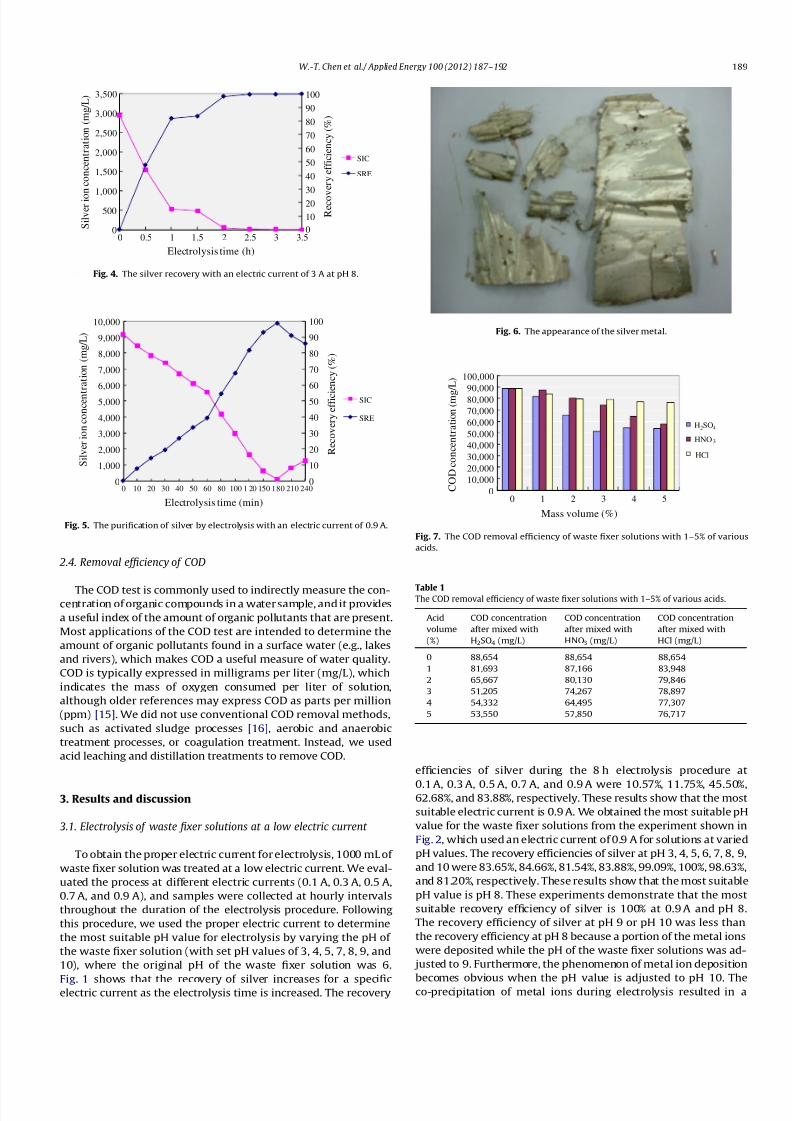
3.2. Electrolysis of waste fixer solutions at a high electric current (3 A)
We employed a high electric current (3 A) instead of the low
electric currents previously evaluated (0.1 A, 0.3 A, 0.5 A, 0.7 A,
and 0.9 A) to lessen the electrolysis time, as shown in Figs. 3 and4. A maximum silver recovery efficiency of 88.64% was obtained
for the electrolysis procedure with a current of 3 A and a duration
of 3.5 h. The recovery efficiency did not increase with additional
electrolysis time, and the proper electrolysis time is therefore
3.5 h, as shown in Fig. 3. Fig. 4 shows that when we adjusted the
waste fixer solutions to pH 8 and then used an electric current of
3 A, the electrolysis time decreased from 3.5 h to 2.5 h, and the
recovery efficiency of silver increased from 88.64% to 99.55%. Addi-
tionally, the purity of silver was 98.31% and 98.62% for an electric
current of 0.9 A and 3 A, respectively.
3.3. The purification of silver
The silver in the waste fixer solutions formed a metal coating onthe stainless steel plate during the electrolysis procedures, and we
scraped this silver metal from the plate in order to obtain purified
silver after an additional purification procedure. The silver metal
that was scraped off of the plate was dissolved in a high concentra-
tion solution of nitric acid, and we applied an electric current of
0.9 A to obtain high purity silver via electrolysis. Fig. 5 shows that
as the electrolysis time increased, the silver concentration in the
waste fixer solution decreased and the silver recovery efficiency in-
creased. The recovery efficiency of silver reached 98.85% after 3 h
of electrolysis, but then decreased for durations of electrolysis
greater than 3 h. The reason for this decrease in recovery efficiency
is that the stainless steel plate was coated with too much silver
metal to allow for additional silver metal to coat the plate. The pur-
ity of the silver metal reached 99.9% from the purification process,and the appearance of the silver metal is shown in Fig. 6.
Fig. 8. The deposits from waste fixer solutions mixed with H2SO4.
Table 2
The COD removal efficiency of waste fixer solutions mixed with H2SO4 at an electric
current of 10 A.
Electrolysis
time (h)
Without H2SO4 With H2SO4
COD
concentration
(mg/L)
COD
recovery
efficiency
(%)
COD
concentration
(mg/L)
COD
recovery
efficiency
(%)
0 90,313 0 84,196 0
1 65,330 27.6 44,459 47.2
2 58,830 34.8 44,259 47.1
3 55,320 38.7 44,065 47.6
4 52,130 42.2 33,442 60.3
5 49,250 45.4 33,836 59.8
6 45,810 49.2 32,655 61.2
7 46,520 48.5 33,049 60.7
8 47,320 47.6 33,442 60.3
0
10
20
30
40
50
60
70
80
90
100
0
10,000
20,000
30,000
40,000
50,000
60,000
70,000
80,000
90,000
100,000
0 1 2 3 4 5 6 7 8
C O D c o n c e n t r a t i o n ( m g / L )
Electrolysis time (h)
C O D r e m o v a l e f f i c i e n c y ( % )
COD with
H2SO4
COD RE
COD without
H2SO4
COD RE
without H2SO4
with H2SO4
Fig. 9. The COD removal efficiency of waste fixer solutions mixed with H2SO4 with
an electric current of 10 A.
-50
-40
-30
-20
-10
0
10
20
30
40
0
10,000
20,000
30,000
40,000
50,000
60,000
70,000
80,000
0 1 2 3 4 5 6
COD 5A
COD 7A
COD 8A
COD 10A
COD 15A
COD RE 5A
COD RE 7A
COD RE 8A
COD RE 10A
COD RE 15A
Electrolysis time (h)
C O D r e m o v a l e f f i c i e n c y ( % )
C O D c o n c e n t r a t i
o n ( m g / L )
Fig. 10. The CODremoval efficiencyof waste fixer solutions mixed with H2SO4 with
various electric currents.
190 W.-T. Chen et al./ Applied Energy 100 (2012) 187–192

7/30/2019 Applied Energy 100 2012 187 192
http://slidepdf.com/reader/full/applied-energy-100-2012-187-192 5/6
3.4. The efficiency of COD removal
Continuous-flow activatedsludge reactorswere usedto treat the
photoprocessing wastewaters from two commonly used photopro-
cesses: Kodak Flexicolor Process C-41 (film processing) and Kodak
Ektacolor Process RA-4 (paper processing). Simulated wastewaters
were fed to laboratory-scale reactors at a loading level of 10% (v/v)
along witha syntheticbase feed. Thebiodegradationof the basefeedwas not affected by the photoprocessing wastewaters. In addition,
more than 36% of the photoeffluent-derived COD was destroyed,
primarily as a result of sulfite and thiosulfate oxidation. Therefore,
the efficiency of COD removal by the continuous-flow activated
sludge reactors was not suitable [17]. Furthermore, Lin and Yang
[18] found that photoprocessing wastewaters that were treated by
an electrochemical method resulted in a high efficiency of COD
removal (approximately95% of COD) butthat thecost of thiselectro-
chemical treatment was too expensive to use. However, we used
acid leaching anddistillation forCOD removal andfound this meth-
od to be an ideal approach to remove COD.
3.4.1. Acid leaching for COD removal
Small volumes (1–5 mL) of various inorganic acids (hydrochlo-
ric acid (HCl), nitric acid (HNO3), and sulfuric acid (H2SO4)) were
added to 100 mL of waste fixer solution in order to remove COD.
Fig. 7 and Table 1 show that the efficiency of COD removal was
the best for the H2SO4 treatment. In addition, the COD concentra-
tion decreased from 88,654 mg/L to 81,693 mg/L after being mixed
with 1 mL of H2SO4 and from 88,654 mg/L to 51,205 mg/L after
being mixed with 3 mL of H2SO4. The suitable efficiency of COD re-
moval was found to be 42.24% for the case where 3 mL of H2SO4
was used. A 1000 mL waste fixer solution that received the addi-
tion of 30 mL of H2SO4 resulted in the deposits shown in Fig. 8,
and the deposits were assessed to be thiosulfate or organic sulfide.
We separated the deposits and the waste fixer solutions beforeconducting electrolysis at an electric current of 10 A. Table 2 and
Fig. 9 show that the efficiency of COD removal froma mixture with
H2SO4 is better than the efficiency of COD removal without H2SO4
because the hydrogen ions in the mixing solutions are affected by
electrolysis. Therefore, the waste fixer solutions mixed with H2SO4
resulted in proper efficiency of COD removal. Furthermore, various
electric currents (5 A, 7 A, 8 A, 10 A, and 15 A) were applied via
electrolysis to remove COD. The proper efficiencies of COD removal
under 5 A, 7 A, 8 A, 10 A, and 15A were 26.94%, 27.12%, 35%,
32.52%, and 11.45%, respectively (see Fig. 10). Most of the waste
fixer solutions would vaporize under an applied current of 15 A,
resulting in the concentration of the organic materials present in
the waste fixer solution. This occurrence resulted in an abnormal
phenomenon, where the efficiency of COD removal did not in-crease with the increased electric currents.
3.4.2. Enhancement of concentration by distillation for COD removal
After the silver recovery processes, 1000 mL of treated waste
fixer solution was distilled and concentrated using a condenser
for COD removal, and the distillation water and waste sludge were
separated, as shown in Fig. 11. The COD concentration of the waste
fixer solutions decreased from 88,657.3 mg/L to 579.9 mg/L, and
the efficiency of COD removal was 99.3%, as shown in Table 3.
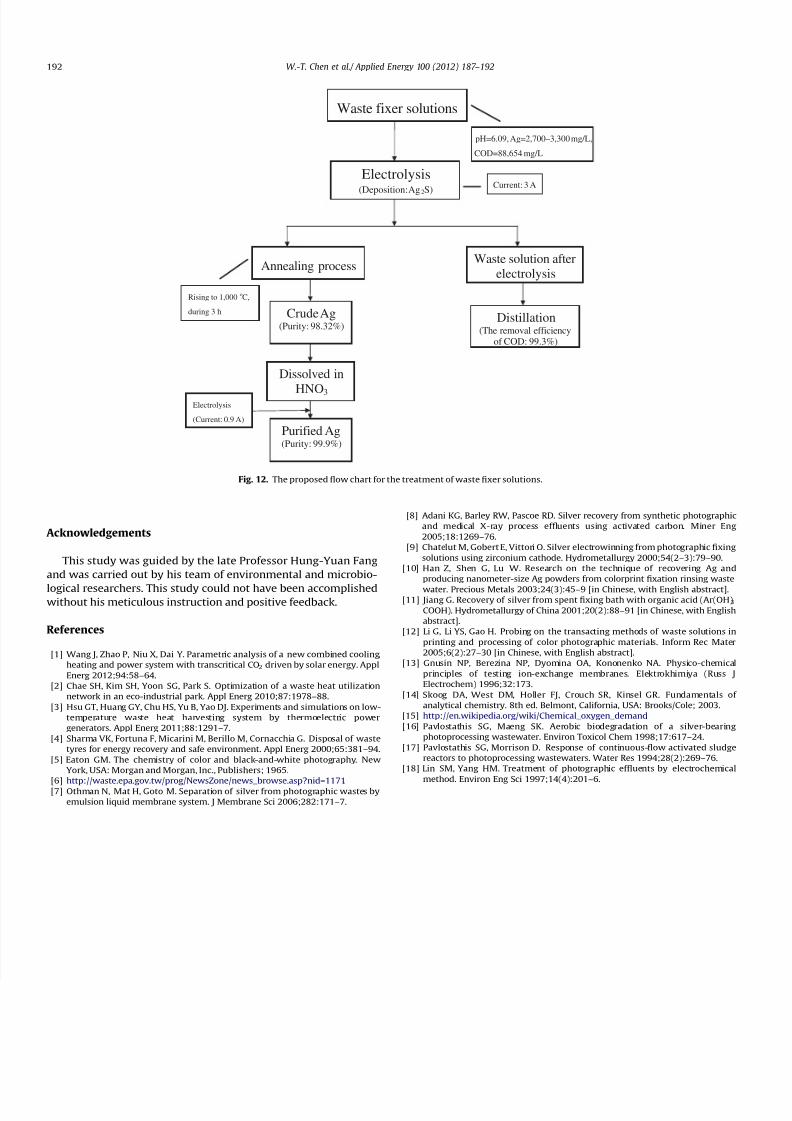
4. Conclusions
Samples of waste fixer solution (1000 mL) with a silver concen-
tration of 3000 mg/L underwent an 8 h electrolysis procedure at
low electric currents. For an electric current of 0.9 A, the silver
recovery was 83.88%, which was better than the silver recovery
for any of the other electric currents that were studied (0.1 A,
0.3 A, 0.5 A, and 0.7 A). In addition, when the solution was
adjusted to pH 8 and then underwent 8 h of electrolysis at an
electric current of 0.9 A, the silver recovery increased from
83.88% to 100%. When the electric current was increased to
3 A for a 3.5 h period, the silver recovery was 88.64%. Addition-
ally, when the solution was adjusted to pH8 and an electric cur-
rent of 3 A was applied for 2.5 h, the silver recovery reached99.55% purity. The purity of silver was found to be 98.31% and
98.62% for an electric current of 0.9 A and 3 A, respectively, not-
withstanding the recovered silver, which could obtain 99.9%
purity after being dissolved in nitric acid and undergoing elec-
trolysis. The proposed flow chart for the treatment of waste
fixer solutions is shown in Fig. 12.
The efficiency of COD removal for waste fixer solutions mixed
with H2SO4 (100 mL of waste fixer solution and 1 mL of
H2SO4) is better than the efficiency of COD removal of waste
fixer solutions mixed with other acids. The COD concentration
decreased from 88,654 mg/L to 51,205 mg/L after being mixed
with 3 mL of H2SO4. The proper efficiency of COD removal for
the 3 mL H2SO4 mixture was 42.24%.
The waste fixer solutions mixed with H2SO4 resulted in a properefficiency of COD removal. Electric currents at 5 A, 7 A, 8 A, 10 A,
and 15 A were applied during an electrolysis procedure to
remove COD, and an electric current of 8 A provided the most
suitable COD removal efficiency.
Higher COD removal efficiencies were obtained by employing
distillation, but the cost of the distillation treatment is more
expensive.
Fig. 11. The distillation water and waste sludge following distillation.
Table 3
The COD removal efficiency by distillation of the waste fixer solution.
COD concentration (mg/
L)
COD removal efficiency
(%)
Waste fixer
solution
88,657.3 0
Cooling water 579.9 99.3
W.-T. Chen et al./ Applied Energy 100 (2012) 187–192 191
7/30/2019 Applied Energy 100 2012 187 192
http://slidepdf.com/reader/full/applied-energy-100-2012-187-192 6/6
Acknowledgements
This study was guided by the late Professor Hung-Yuan Fang
and was carried out by his team of environmental and microbio-
logical researchers. This study could not have been accomplishedwithout his meticulous instruction and positive feedback.
References
[1] Wang J, Zhao P, Niu X, Dai Y. Parametric analysis of a new combined cooling,
heating and power system with transcritical CO2 driven by solar energy. Appl
Energ 2012;94:58–64.
[2] Chae SH, Kim SH, Yoon SG, Park S. Optimization of a waste heat utilization
network in an eco-industrial park. Appl Energ 2010;87:1978–88.
[3] Hsu GT, Huang GY, Chu HS, Yu B, Yao DJ. Experiments and simulations on low-
temperature waste heat harvesting system by thermoelectric power
generators. Appl Energ 2011;88:1291–7.
[4] Sharma VK, Fortuna F, Micarini M, Berillo M, Cornacchia G. Disposal of waste
tyres for energy recovery and safe environment. Appl Energ 2000;65:381–94.
[5] Eaton GM. The chemistry of color and black-and-white photography. New
York, USA: Morgan and Morgan, Inc., Publishers; 1965.
[6] http://waste.epa.gov.tw/prog/NewsZone/news_browse.asp?nid=1171.
[7] Othman N, Mat H, Goto M. Separation of silver from photographic wastes by
emulsion liquid membrane system. J Membrane Sci 2006;282:171–7.
[8] Adani KG, Barley RW, Pascoe RD. Silver recovery from synthetic photographic
and medical X-ray process effluents using activated carbon. Miner Eng
2005;18:1269–76.
[9] Chatelut M, Gobert E, Vittori O. Silver electrowinning from photographic fixing
solutions using zirconium cathode. Hydrometallurgy 2000;54(2–3):79–90.
[10] Han Z, Shen G, Lu W. Research on the technique of recovering Ag and
producing nanometer-size Ag powders from colorprint fixation rinsing waste
water. Precious Metals 2003;24(3):45–9 [in Chinese, with English abstract].[11] Jiang G. Recovery of silver from spent fixing bath with organic acid (Ar(OH)3
COOH). Hydrometallurgy of China 2001;20(2):88–91 [in Chinese, with English
abstract].
[12] Li G, Li YS, Gao H. Probing on the transacting methods of waste solutions in
printing and processing of color photographic materials. Inform Rec Mater
2005;6(2):27–30 [in Chinese, with English abstract].
[13] Gnusin NP, Berezina NP, Dyomina OA, Kononenko NA. Physico-chemical
principles of testing ion-exchange membranes. Elektrokhimiya (Russ J
Electrochem) 1996;32:173.
[14] Skoog DA, West DM, Holler FJ, Crouch SR, Kinsel GR. Fundamentals of
analytical chemistry. 8th ed. Belmont, California, USA: Brooks/Cole; 2003.
[15] http://en.wikipedia.org/wiki/Chemical_oxygen_demand.
[16] Pavlostathis SG, Maeng SK. Aerobic biodegradation of a silver-bearing
photoprocessing wastewater. Environ Toxicol Chem 1998;17:617–24.
[17] Pavlostathis SG, Morrison D. Response of continuous-flow activated sludge
reactors to photoprocessing wastewaters. Water Res 1994;28(2):269–76.
[18] Lin SM, Yang HM. Treatment of photographic effluents by electrochemical
method. Environ Eng Sci 1997;14(4):201–6.
Waste fixer solutions
Electrolysis(Deposition: Ag2S)
pH=6.09, Ag=2,700–3,300 mg/L,
COD=88,654 mg/L
Annealing processWaste solution after
electrolysis
Dissolved in
HNO3
Crude Ag(Purity: 98.32%)
Rising to 1,000oC,
during 3 hDistillation
(The removal efficiencyof COD: 99.3%)
Current: 3 A
Purified Ag(Purity: 99.9%)
Electrolysis
(Current: 0.9 A)
Fig. 12. The proposed flow chart for the treatment of waste fixer solutions.
192 W.-T. Chen et al./ Applied Energy 100 (2012) 187–192
Recommended