#TNBestforAll
© 2021 Tennessee Department of Education
SPRING 2021 TCAP RELEASEAugust 2021

S T U D E N T R E A D I N E S S
TENNESSEE PUBLIC SCHOOLS WILL BE EQUIPPED TO SERVE THE ACADEMIC AND NON-ACADEMIC NEEDS OF ALL
STUDENTS IN THEIR CAREER PATHWAYS
A C A D E M I C S
ALL TENNESSEE STUDENTS WILL HAVE ACCESS TO A HIGH-QUALITY EDUCATION,
NO MATTER WHERE THEY LIVE
E D U C AT O R S
TENNESSEE WILL SET A NEW PATH FOR THE EDUCATION PROFESSION AND BE
THE TOP STATE TO BECOME AND REMAINA TEACHER AND LEADER FOR ALL
We will set all students on a path to success.

Special Recognition Thank you to Governor Bill Lee, state legislators, districts,schools, teachers, partners, families and communities for being proactive in making education a priority in Tennessee.
Tennessee has led the nation and already put strategic measures in motion to combat predicted negative impacts resulting from the COVID-19 pandemic.
Together, educators and families have made tremendous efforts to support children and keep on pace. While it will take time to see the full payoffs of these efforts, Tennesseans have demonstrated their commitment to accelerating student achievement.
Now is the time for all Tennesseans to keep focused on doing what it takes to support our students and set them on a path to success.

Table of Contents
PART I: TCAP Administration and State Data
PART II: Academic Impact
PART III: Response, Recovery and the Path Forward

© 2021 Tennessee Department of Education
PART ITCAP Administration and State Data

Districts and schools across Tennessee worked incredibly hard during the pandemic to provide services to our students.
Both schools and families demonstrated a shared commitment to finding out how our students are performing by achieving a 95% student participation rate on the statewide Spring 2021 TCAP.
Disruptions to education as a result of the pandemic have led to expected declines in academic proficiency in the state, across all subjects and grade bands. These declines were mitigated as a direct result of the hard work of our educators and families.
While declines in proficiency were expected, families, school systems, and the public need access to information that will help drive strategic decision-making to support accelerating student achievement in the years to come.
TCAP Results Demonstrate Urgent Need
Tennessee is well-prepared and will continue to focus on doing what’s best for our kids.

The Tennessee Department of Education will operate with a forward-looking, proactive, and optimistic lens, based on what is possible for students. The state response is firmly rooted in our strategic plan for education, Best for All.
State Framework for Response
A C A D E M I C SA strong focus on early literacy
and math, with additional learning time delivered through high-dosage tutoring and summer
programming.
S T U D E N T R E A D I N E S SProviding students with the pathways and supports they
need through innovative high schools and access to advanced courses and non-
academic supports.
E D U C AT O R SEliminate teacher vacancies
and support strong professional growth and
learning through Grow Your Own programs and
opportunities.

TCAP Administration Successes
SPRING 2019
Successful paper-based EOC
administration with new
assessment vendor.
FALL 2019
Successful high school EOC administration, despite COVID
challenges.
Spring 2020 testing was
suspended for all grades.
FALL 2020
SPRING 2021
Smooth full TCAP administration.
Smooth online administration
of high school End of Course (EOC)
and science exams.
Successful full TCAP administration.
Strong 95% statewide student participation rate
due to testing flexibilities and the efforts of schools
and districts.
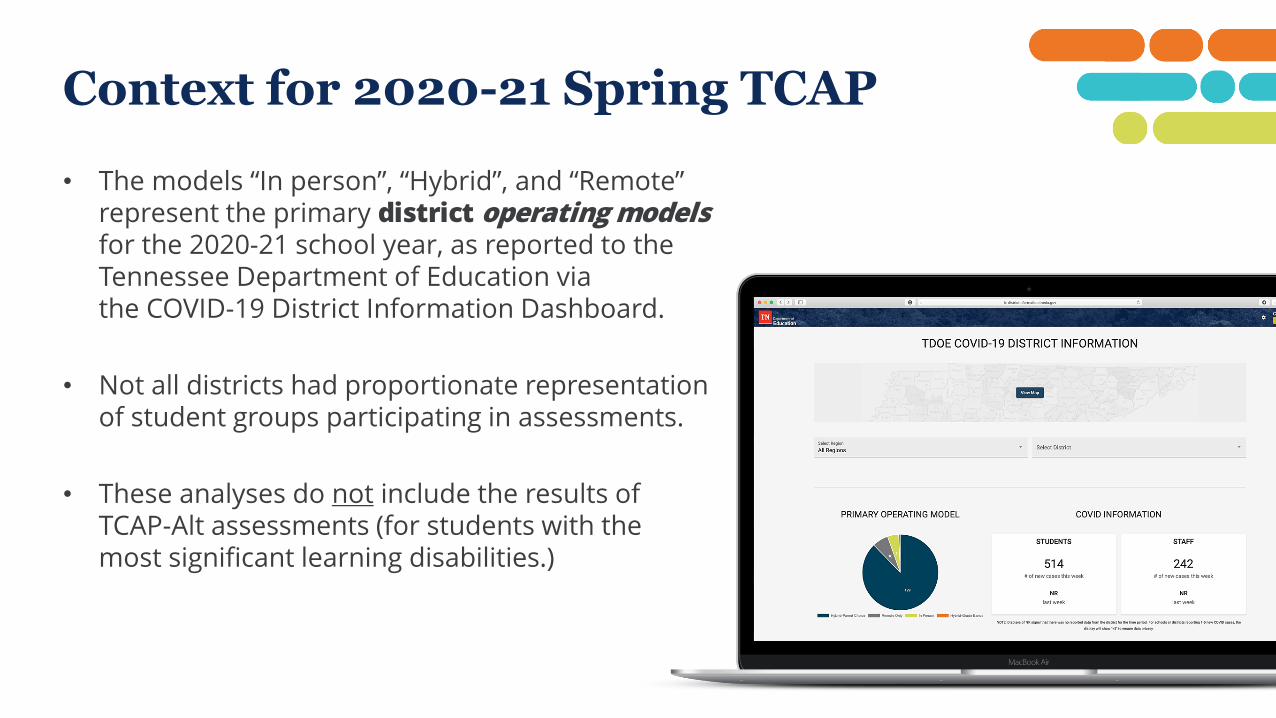
• The models “In person”, “Hybrid”, and “Remote” represent the primary district operating models for the 2020-21 school year, as reported to the Tennessee Department of Education via the COVID-19 District Information Dashboard.
• Not all districts had proportionate representation of student groups participating in assessments.
• These analyses do not include the results of TCAP-Alt assessments (for students with the most significant learning disabilities.)
Context for 2020-21 Spring TCAP

Efforts to Maximize Student Participation in TCAP Offered flexibility in test administration as a result of the disruptions due to COVID-19
• Expanded available use of off-site testing locations • Increased flexibility for local testing schedules• Provided guidance to support a larger number of assessment proctors• Enhanced guidance on Medical Exemptions for COVID-impacted students
Dramatically increased choice within expanded test administration windows• Expanded TCAP window options, with three times more calendar days to work with than any prior year• Provided for student make-ups across testing windows, for greater flexibility and access• Allowed extensions and provided additional testing options for all state tests, including WIDA and ACT
Maintained robust customer service, including guides and resources to support districts• Supported maximizing participation through toolkits and checklists documents • Provided peer support and highlighted profiles of real-time district solutions• Developed sample communications and social media tools• Hosted daily webinars, office hours, weekly updates, virtual trainings to support districts
Worked with many districts to set and meet clear participation rate goals• Increased communications with parents• Set clear goals and tactics, customized by school and community• Co-created ways to incorporate positivity, joy, and celebrations surrounding testing activities

100% of DISTRICTSMET THE 80%
“hold harmless” target
*Breakdown of data in Appendix
Student Participation
95%
State TCAP PARTICIPATION RATE
SOURCE: Tennessee Department of Education, 2021
OVERVIEW: ALL STUDENTS, GRADES & SUBJECTS
COMBINED PROFICIENCY
KEY TAKE-AWAYS
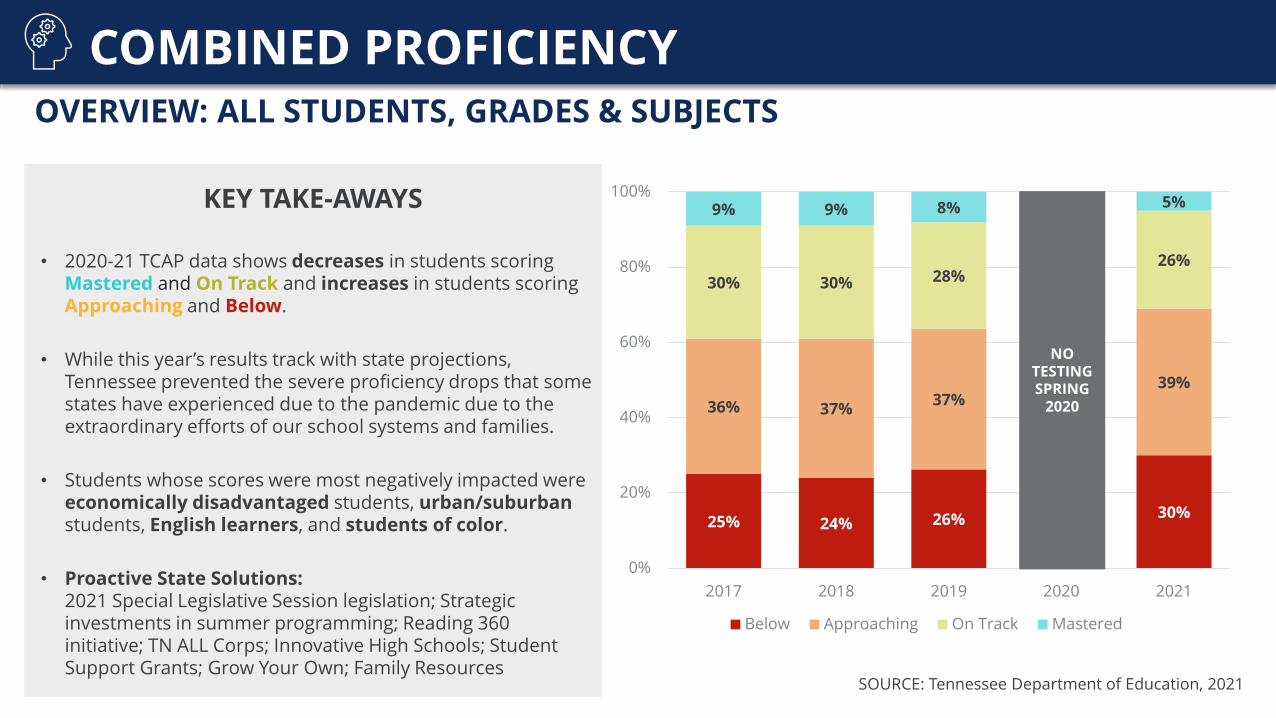
• 2020-21 TCAP data shows decreases in students scoring Mastered and On Track and increases in students scoring Approaching and Below.
• While this year’s results track with state projections, Tennessee prevented the severe proficiency drops that some states have experienced due to the pandemic due to the extraordinary efforts of our school systems and families.
• Students whose scores were most negatively impacted were economically disadvantaged students, urban/suburbanstudents, English learners, and students of color.
• Proactive State Solutions:2021 Special Legislative Session legislation; Strategic investments in summer programming; Reading 360 initiative; TN ALL Corps; Innovative High Schools; Student Support Grants; Grow Your Own; Family Resources
25% 24% 26% 30%
36% 37% 37%39%
30% 30% 28%26%
9% 9% 8% 5%
0%
20%
40%
60%
80%
100%
2017 2018 2019 2020 2021
Below Approaching On Track Mastered
NOTESTINGSPRING
2020
COMBINED PROFICIENCYRESULTS BY STUDENT GROUP
BLACK or AFRICAN AMERICANASIAN WHITEHISPANIC
12 10 11 12
40 38 41 4937 35 39 45 44 37 41 46
32 30 33 37
61 57 63 60
19 19 20 22
24 25 25 28
38 41 3938
39 42 4040 37 42 39
40
39 41 4041
28 3229 31
35 36 37 39
38 40 3941
19 18 17 1321 20 18 14 17 18 17 13
24 23 23 199 9 7 7
35 35 33 3226 25 26 18
1 1 1 3 3 3 1 2 1 1 1 5 5 5 3 2 2 1 212 11 10 7
0%
20%
40%
60%
80%
100%
2017 18 19 21 2017 18 19 21 2017 18 19 21 2017 18 19 21 2017 18 19 21 2017 18 19 21 2017 18 19 21
Below Approaching On Track Mastered
STUDENTSWITH DISABILITIES
ENGLISH LEARNERS
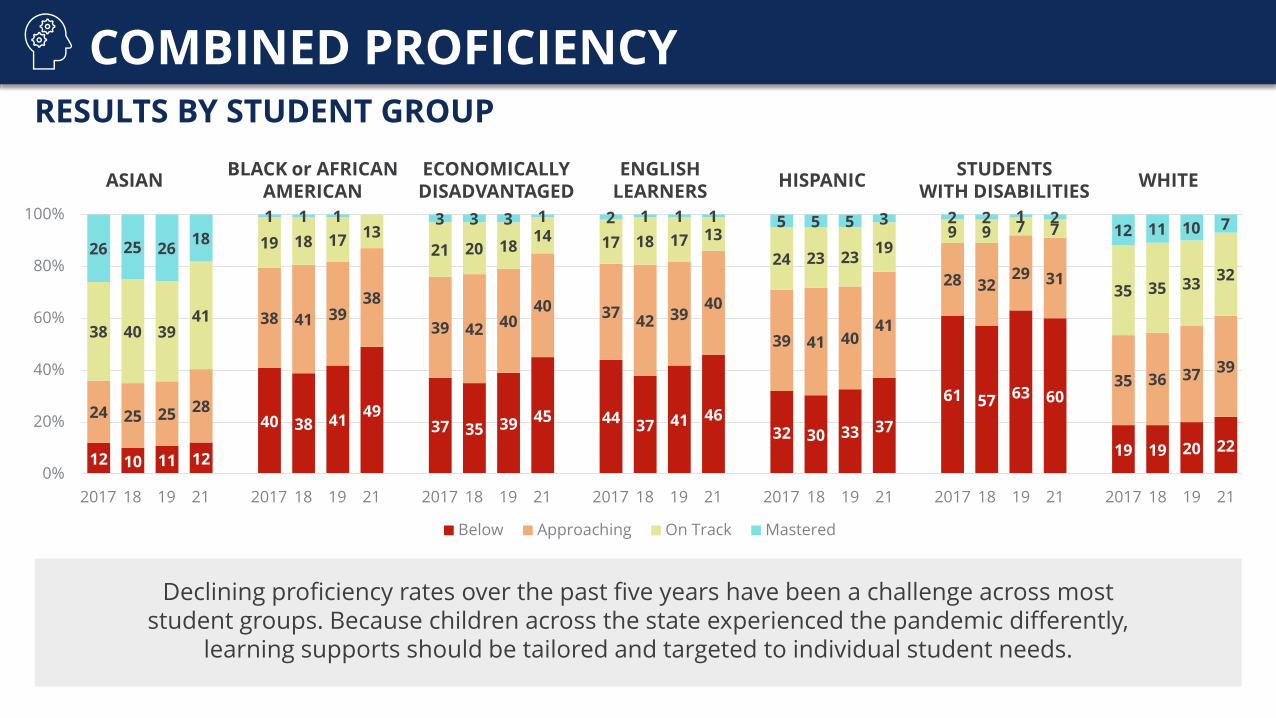
Declining proficiency rates over the past five years have been a challenge across most student groups. Because children across the state experienced the pandemic differently,
learning supports should be tailored and targeted to individual student needs.
ECONOMICALLY DISADVANTAGED
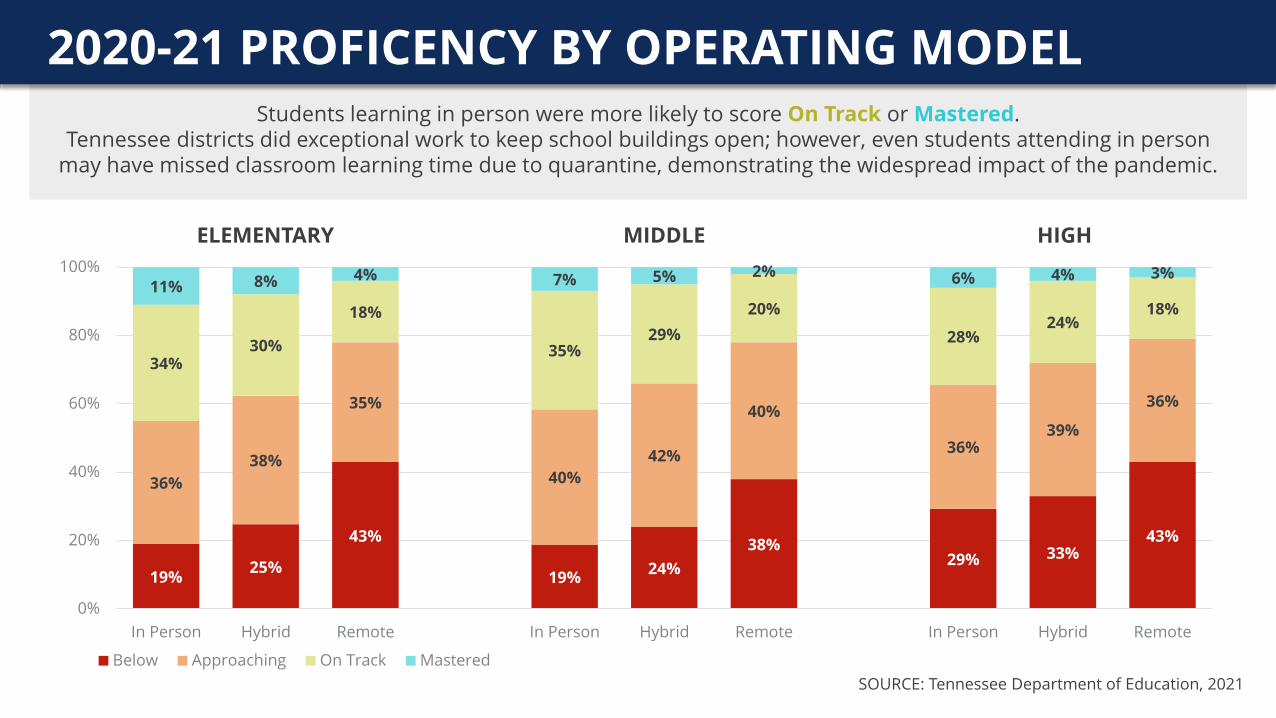
Students learning in person were more likely to score On Track or Mastered. Tennessee districts did exceptional work to keep school buildings open; however, even students attending in person
may have missed classroom learning time due to quarantine, demonstrating the widespread impact of the pandemic.
SOURCE: Tennessee Department of Education, 2021
2020-21 PROFICENCY BY OPERATING MODEL
ELEMENTARY MIDDLE HIGH
19% 25%
43%
19% 24%38%
29% 33%43%
36%38%
35%
40%42%
40%
36%39%
36%
34%30%
18%
35%29%
20%
28%24%
18%11% 8% 4% 7% 5% 2% 6% 4% 3%
0%
20%
40%
60%
80%
100%
In Person Hybrid Remote In Person Hybrid Remote In Person Hybrid Remote
Below Approaching On Track Mastered

KEY TAKE-AWAYS
3 in 10 Tennessee students are meeting grade level expectationsin English Language Arts (ELA).
Overall proficiency in ELA dropped 5 points from 2019.
Proactive State Solutions:Summer Programming; TN Literacy Success Act and Reading360; TN ALL Corps; personalized reading supports with district networks
ALL STUDENTS OVERVIEW
ELA
SOURCE: Tennessee Department of Education, 2021
26%20% 19% 19% 21%
43%46% 48% 46%
50%
23% 28% 28% 29%26%
8% 6% 5% 6% 3%
0%
20%
40%
60%
80%
100%
2016 2017 2018 2019 2021
Below Approaching On Track Mastered
KEY TAKE-AWAYS
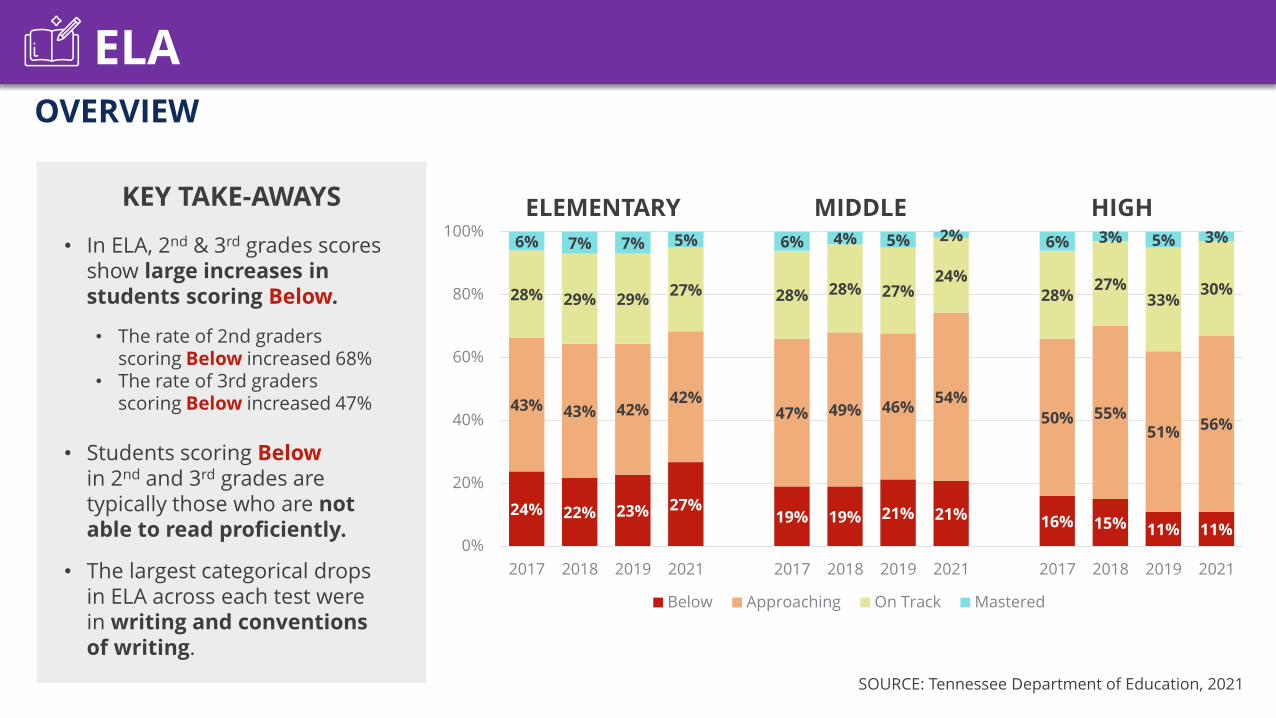
• In ELA, 2nd & 3rd grades scores show large increases in students scoring Below.
• The rate of 2nd graders scoring Below increased 68%
• The rate of 3rd graders scoring Below increased 47%
• Students scoring Belowin 2nd and 3rd grades are typically those who are not able to read proficiently.
• The largest categorical drops in ELA across each test were in writing and conventions of writing.
OVERVIEW
ELA
SOURCE: Tennessee Department of Education, 2021
ELEMENTARY MIDDLE HIGH
24% 22% 23% 27%19% 19% 21% 21% 16% 15% 11% 11%
43% 43% 42%42%
47% 49% 46% 54%50% 55%
51% 56%
28% 29% 29% 27% 28% 28% 27%24%
28%27%
33%30%
6% 7% 7% 5% 6% 4% 5% 2% 6% 3% 5% 3%
0%
20%
40%
60%
80%
100%
2017 2018 2019 2021 2017 2018 2019 2021 2017 2018 2019 2021
Below Approaching On Track Mastered

KEY TAKE-AWAYS
1 in 7 economically
disadvantaged students is meeting grade level expectations in English
Language Arts.
ECONOMICALLY DISADVANTAGED
ALL OTHER STUDENTS
RESULTS BY INCOME
ELA
SOURCE: Tennessee Department of Education, 2021
32% 30% 31% 33%
13% 14% 14% 14%
50% 52% 50%53%
44% 46% 44% 48%
17% 17% 17% 13%
35% 34% 35%33%
2% 1% 2% 1%8% 6% 8% 4%
0%
20%
40%
60%
80%
100%
2017 2018 2019 2021 2017 2018 2019 2021
Below Approaching On Track Mastered

RESULTS BY STUDENT GROUPS
ELA
SOURCE: Tennessee Department of Education, 2021
BLACK or AFRICAN AMERICANASIAN WHITEHISPANIC
10 9 8 8
32 31 32 35 42 37 35 3828 27 25 27
58 56 56 55
15 14 14 14
32 34 32 36
50 51 49 5146 48 49 51
49 51 50 53
36 38 37 40
45 47 44 49
40 43 4345
16 16 17 13 12 13 14 1120 20 22 19
6 6 6 5
33 34 34 32
18 15 18 112 2 2 1 2 2 3 2 3 1 1 7 6 7 4
0%
20%
40%
60%
80%
100%
2017 18 19 21 2017 18 19 21 2017 18 19 21 2017 18 19 21 2017 18 19 21 2017 18 19 21
Below Approaching On Track Mastered
STUDENTSWITH DISABILITIES
ENGLISH LEARNERS
KEY TAKE-AWAYS
ELA proficiency rates dropped 4 - 6 points across racial and ethnic lines.
Achievement gaps present before the pandemic have persisted or widened.
SOURCE: Tennessee Department of Education, 2021
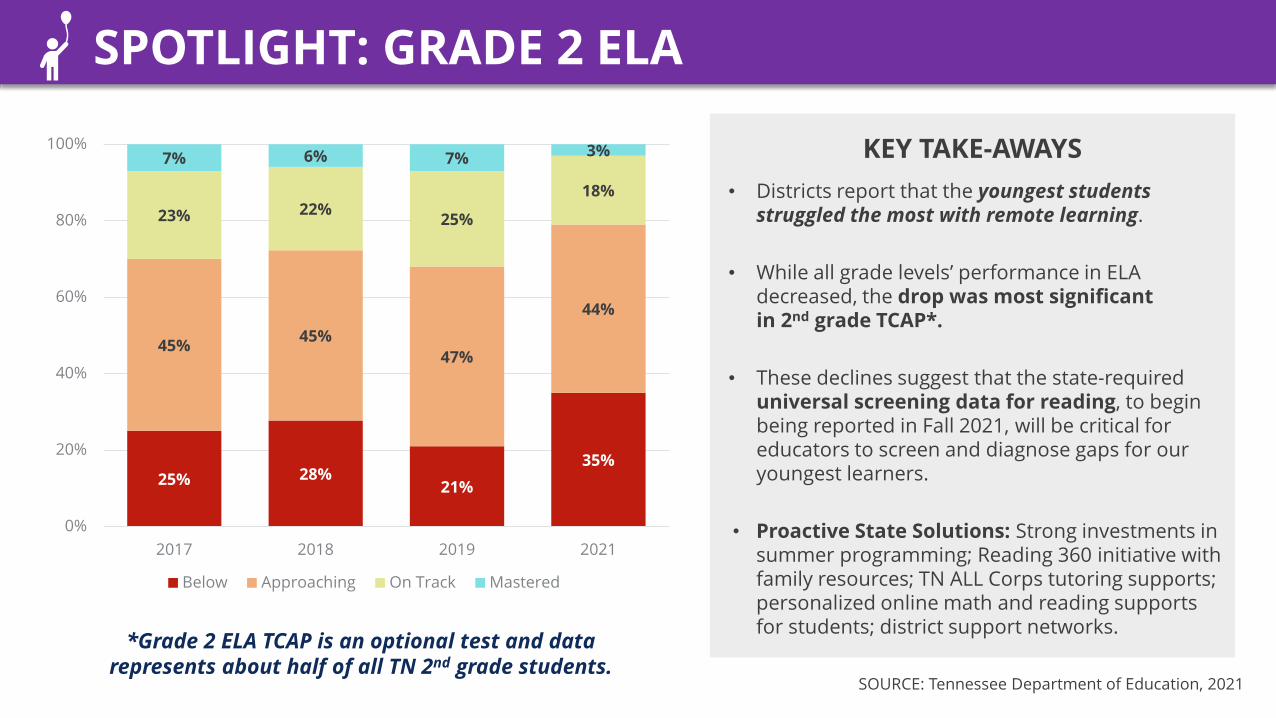
SPOTLIGHT: GRADE 2 ELA
*Grade 2 ELA TCAP is an optional test and datarepresents about half of all TN 2nd grade students.
25% 28%21%
35%
45% 45%47%
44%
23% 22% 25%
18%
7% 6% 7% 3%
0%
20%
40%
60%
80%
100%
2017 2018 2019 2021
Below Approaching On Track Mastered
KEY TAKE-AWAYS• Districts report that the youngest students
struggled the most with remote learning.
• While all grade levels’ performance in ELA decreased, the drop was most significant in 2nd grade TCAP*.
• These declines suggest that the state-required universal screening data for reading, to begin being reported in Fall 2021, will be critical for educators to screen and diagnose gaps for our youngest learners.
• Proactive State Solutions: Strong investments in summer programming; Reading 360 initiative with family resources; TN ALL Corps tutoring supports; personalized online math and reading supports for students; district support networks.

ALL STUDENTS OVERVIEW
MATH
SOURCE: Tennessee Department of Education, 2021
33% 36% 31%44%
34% 32%32%
30%
26% 24% 27%
19%
7% 9% 10% 6%
0%
20%
40%
60%
80%
100%
2017 2018 2019 2021
Below Approaching On Track Mastered
KEY TAKE-AWAYS
1 in 4 Tennessee studentsis meeting grade level expectations in math.
• Consistent with national trends, math saw the sharpest declines of any subject area besides science, as projected. Overall proficiency dropped 12 points from 2019.
• The greatest drops across subject areas were understanding and using mathematical notation to describe quantitative relationships and situations.
• Proactive State Solutions: Investments in math adoption and instructional resources; TN ALL Corps tutoring supports; personalized online math and reading supports for students.
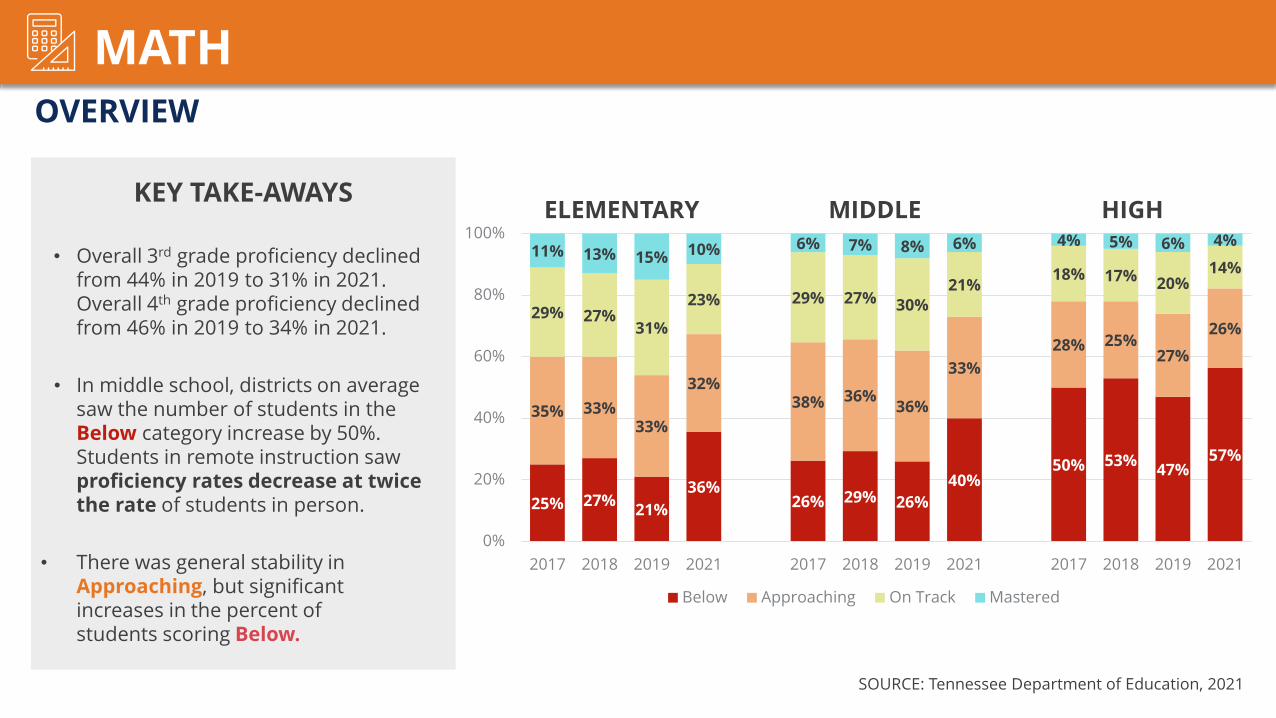
OVERVIEW
MATH
SOURCE: Tennessee Department of Education, 2021
KEY TAKE-AWAYS
• Overall 3rd grade proficiency declined from 44% in 2019 to 31% in 2021. Overall 4th grade proficiency declined from 46% in 2019 to 34% in 2021.
• In middle school, districts on average saw the number of students in the Below category increase by 50%. Students in remote instruction saw proficiency rates decrease at twice the rate of students in person.
• There was general stability in Approaching, but significant increases in the percent of students scoring Below.
ELEMENTARY MIDDLE HIGH
25% 27% 21%36%
26% 29% 26%40%
50% 53% 47%57%
35% 33%33%
32%38% 36% 36%
33%28% 25%
27%26%
29% 27%31%
23% 29% 27% 30%21% 18% 17% 20%
14%11% 13% 15% 10% 6% 7% 8% 6% 4% 5% 6% 4%
0%
20%
40%
60%
80%
100%
2017 2018 2019 2021 2017 2018 2019 2021 2017 2018 2019 2021
Below Approaching On Track Mastered

SOURCE: Tennessee Department of Education, 2021
RESULTS BY INCOME
MATH
NON-ECONOMICALLY DISADVANTAGED
ECONOMICALLY DISADVANTAGED
KEY TAKE-AWAYS
1 in 10economically
disadvantaged studentsis meeting grade level expectations in math.
47% 49% 44%
61%
26% 29% 25%36%
35% 33%35%
27%
33% 31%31%
32%
16% 15% 18%10%
31% 28%31%
24%
2% 3% 3% 2%10% 11% 13% 9%
0%
20%
40%
60%
80%
100%
2017 2018 2019 2021 2017 2018 2019 2021
Below Approaching On Track Mastered
ASIAN BLACK or AFRICAN AMERICAN WHITE
14 15 12 19
52 53 46
6747 47 44
6040 42 37
5369 72 68 76
26 28 2434
24 22 2025
32 3033
24
34 32 32
27
36 3434
30
23 20 2318
34 32 32
3336 34
35
32
14 14 178 16 16 19
1020 19 23
147 6 8 5
30 29 3124
27 29 3323
2 3 4 1 3 4 5 3 4 5 6 3 1 2 1 1 9 11 12 8
0%
20%
40%
60%
80%
100%
2017 18 19 21 2017 18 19 21 2017 18 19 21 2017 18 19 21 2017 18 19 21 2017 18 19 21
Below Approaching On Track Mastered
HISPANIC
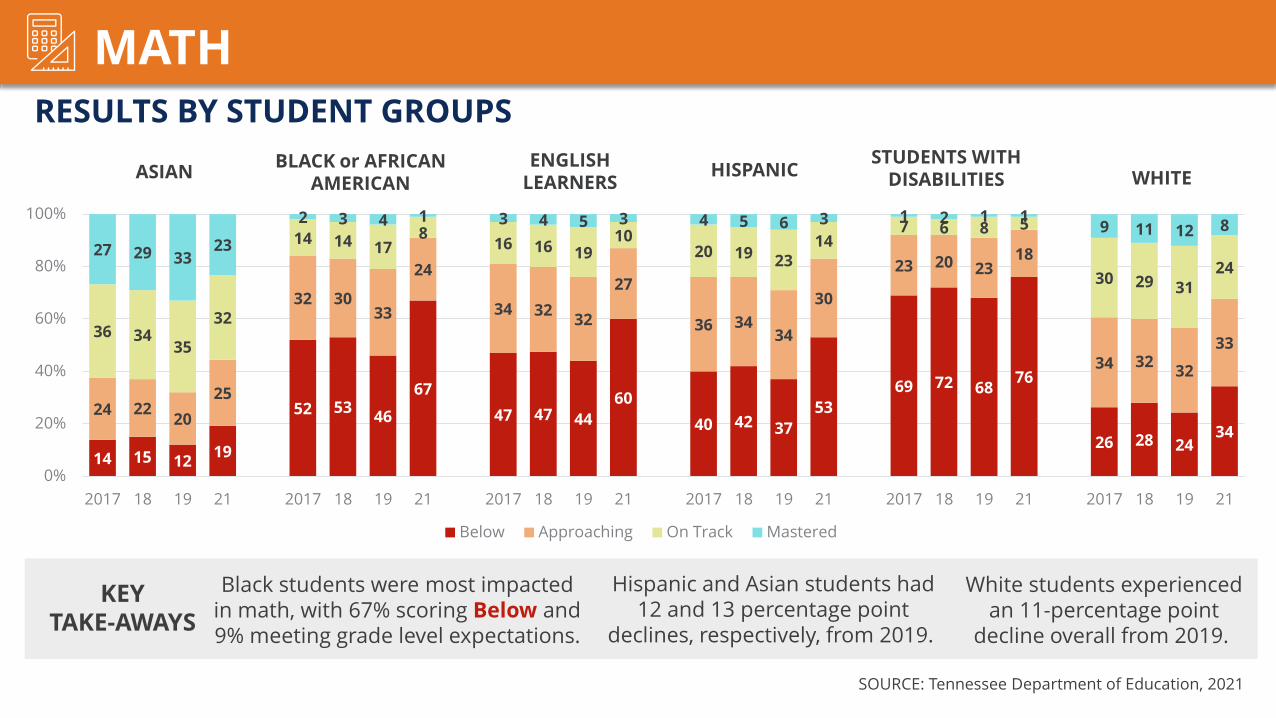
RESULTS BY STUDENT GROUPS
MATH
SOURCE: Tennessee Department of Education, 2021
Black students were most impacted in math, with 67% scoring Below and 9% meeting grade level expectations.
White students experienced an 11-percentage point
decline overall from 2019.
Hispanic and Asian students had 12 and 13 percentage point
declines, respectively, from 2019.
KEYTAKE-AWAYS
ENGLISH LEARNERS
STUDENTS WITH DISABILITIES
SOURCE: Tennessee Department of Education, 2021
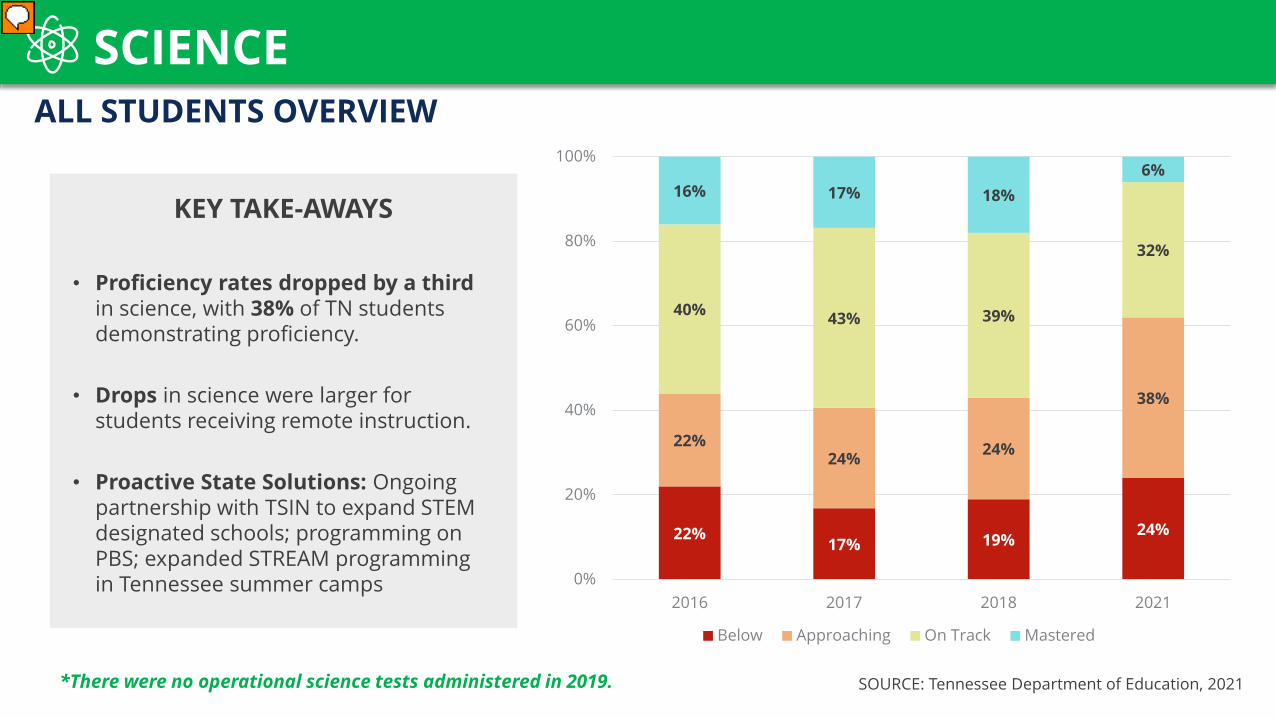
ALL STUDENTS OVERVIEW
SCIENCE
*There were no operational science tests administered in 2019.
KEY TAKE-AWAYS
• Proficiency rates dropped by a third in science, with 38% of TN students demonstrating proficiency.
• Drops in science were larger for students receiving remote instruction.
• Proactive State Solutions: Ongoing partnership with TSIN to expand STEM designated schools; programming on PBS; expanded STREAM programming in Tennessee summer camps
22%17% 19% 24%
22%24% 24%
38%
40% 43% 39%
32%
16% 17% 18%6%
0%
20%
40%
60%
80%
100%
2016 2017 2018 2021
Below Approaching On Track Mastered

SOURCE: Tennessee Department of Education, 2021
OVERVIEW
SCIENCE
KEY TAKE-AWAYS
• Proficiency rates dropped by 30% in elementary, 40% in middle and 18% in high school.
• The largest decline was in middle school, which decreased from 62% to 36% of students performing at On Track or Mastered between 2017 and 2021.
• Proactive State Solutions:Ongoing partnership with TSIN to expand STEM designated schools; programming on PBS; expanded STREAM programming in Tennessee summer camps.
ELEMENTARY MIDDLE HIGH
18% 23% 25%17% 17% 23% 17% 23% 25%
23%21%
36%
21% 23%
41%
24%27%
34%
45% 41%
32%
42% 41%
31%
42%32%
36%
13% 15%7%
20% 19%5%
18% 18%5%
0%
20%
40%
60%
80%
100%
2017 2018 2021 2017 2018 2021 2017 2018 2021
Below Approaching On Track Mastered
*There were no operational science tests administered in 2019.

8 8 9
31 3342
28 3038 38 37 38
24 26 30
51 55 48
11 13 1612 13
26
29 30
40
28 29
4229 28
44
26 27
43
27 26 38
19 21
3641 38
47
33 31
16
36 33
1928 29
17
38 36
24 18 16 12
47 43
4039 42
187 7 2 8 8 1 5 6 1
11 113 3 3 2
23 238
0%
20%
40%
60%
80%
100%
2017 18 21 2017 18 21 2017 18 21 2017 18 21 2017 18 21 2017 18 21 2017 18 21
Below Approaching On Track Mastered
SOURCE: Tennessee Department of Education, 2021
RESULTS BY STUDENT GROUPS
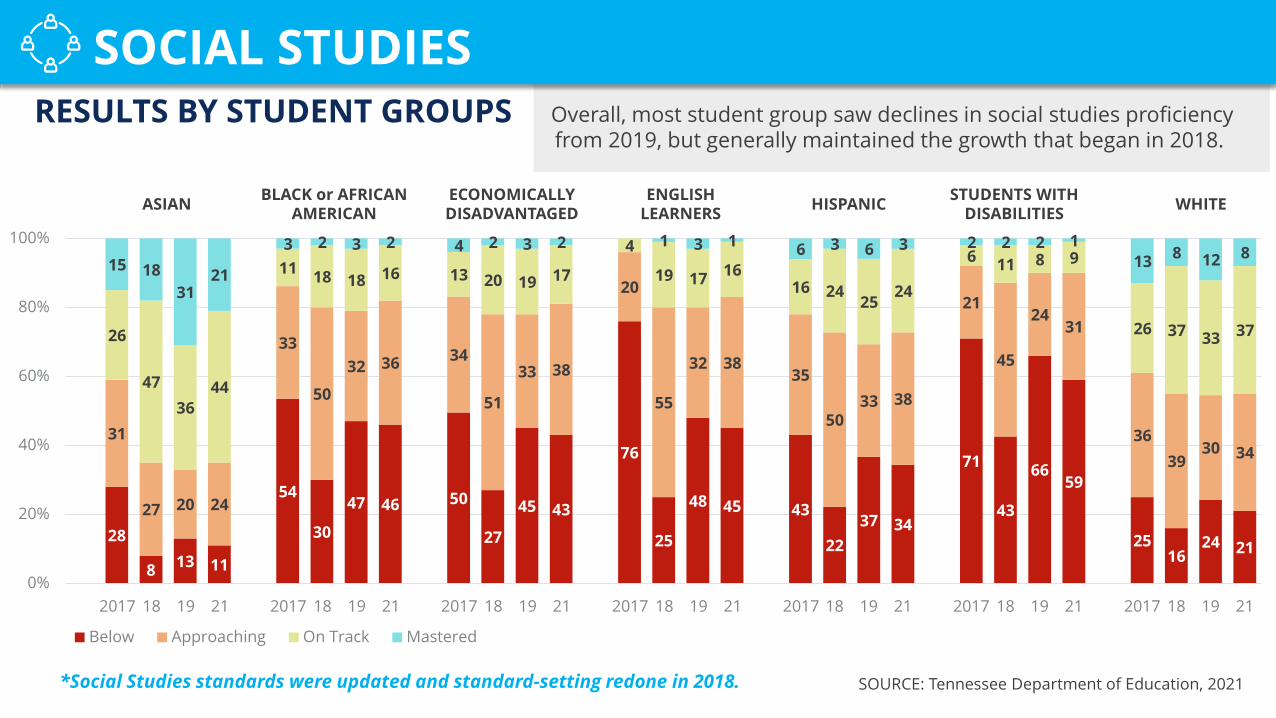
SCIENCEOverall, every student group saw declines in science proficiency from 2019. Black, Hispanic, and economically disadvantaged students and
English Learners saw large proficiency declines from 2017.
ECONOMICALLYDISADVANTAGED
BLACK or AFRICAN AMERICAN WHITEHISPANICENGLISH
LEARNERSSTUDENTS WITH
DISABILITIESASIAN
*There were no operational science tests administered in 2019.
SOURCE: Tennessee Department of Education, 2021
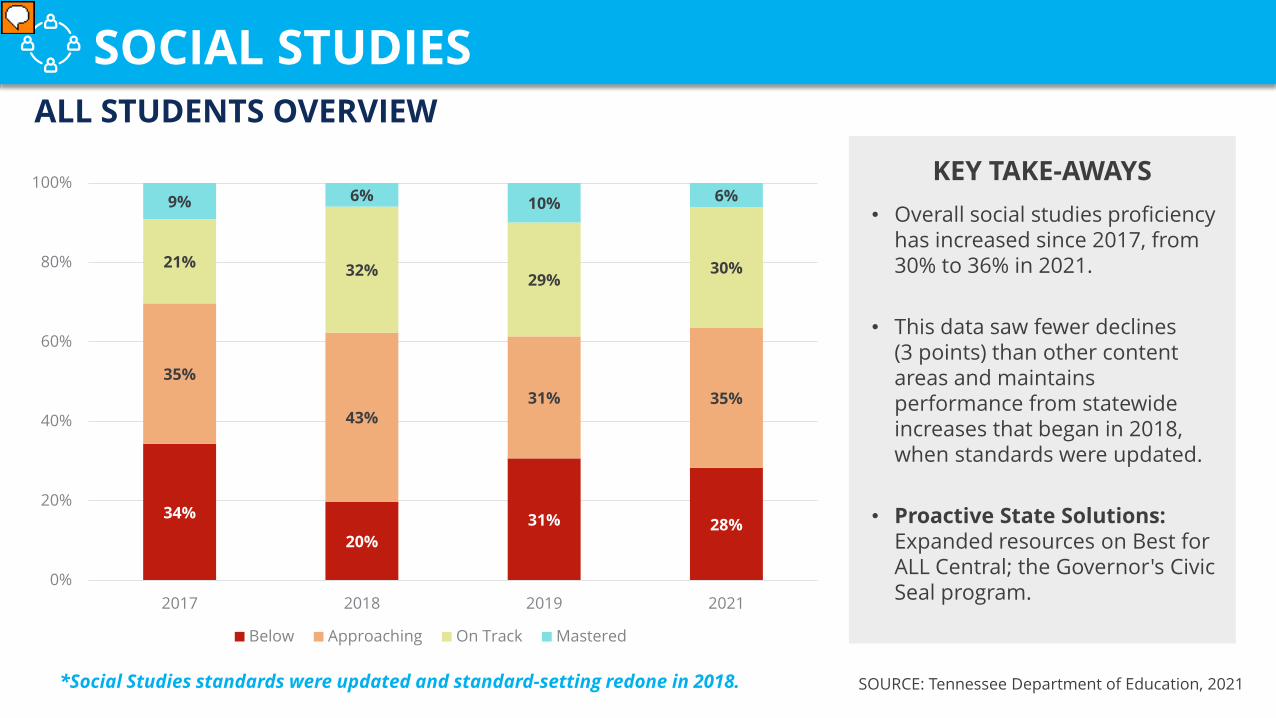
ALL STUDENTS OVERVIEW
SOCIAL STUDIES
34%
20%31% 28%
35%
43%31% 35%
21% 32% 29%30%
9% 6% 10% 6%
0%
20%
40%
60%
80%
100%
2017 2018 2019 2021
Below Approaching On Track Mastered
KEY TAKE-AWAYS• Overall social studies proficiency
has increased since 2017, from 30% to 36% in 2021.
• This data saw fewer declines (3 points) than other content areas and maintains performance from statewide increases that began in 2018, when standards were updated.
• Proactive State Solutions: Expanded resources on Best for ALL Central; the Governor's Civic Seal program.
*Social Studies standards were updated and standard-setting redone in 2018.

SOURCE: Tennessee Department of Education, 2021
OVERVIEW
KEY TAKE-AWAYS
• Proficiency rates dropped by 4 percentage points in middle school social studies.
• Proficiency rates increased by 4 percentage points in high school.
• Proactive State Solutions:Expanded resources on Best for ALL Central; the Governor's Civic Seal program.
MIDDLE HIGH
67%
30% 29% 28% 34% 37% 35% 33%
17%
30% 30% 35%35% 35% 36% 34%
11%
30% 31%31% 21% 20% 21% 25%
6% 9% 10% 6% 9% 8% 8% 8%
0%
20%
40%
60%
80%
100%
2017 2018 2019 2021 2017 2018 2019 2021
Below Approaching On Track Mastered
SOCIAL STUDIES
*Social Studies standards were updated and standard-setting redone in 2018.
ECONOMICALLYDISADVANTAGED
BLACK or AFRICAN AMERICAN WHITE
28
8 13 11
54
30
47 46 50
27
45 43
76
25
48 45 43
2237 34
71
43
6659
2516
24 21
31
27 20 24
33
50
32 36 34
51
33 38
20
55
32 3835
5033 38
21
45
2431
3639
30 34
26
4736
44
11 18 18 16 13 20 19 17
4
19 17 1616 24
2524
6 11 8 9
26 37 33 37
15 1831
21
3 2 3 2 4 2 3 2 1 3 1 6 3 6 3 2 2 2 113 8 12 8
0%
20%
40%
60%
80%
100%
2017 18 19 21 2017 18 19 21 2017 18 19 21 2017 18 19 21 2017 18 19 21 2017 18 19 21 2017 18 19 21
Below Approaching On Track Mastered
HISPANICENGLISH LEARNERS
STUDENTS WITHDISABILITIES
SOCIAL STUDIESRESULTS BY STUDENT GROUPS Overall, most student group saw declines in social studies proficiency
from 2019, but generally maintained the growth that began in 2018.
SOURCE: Tennessee Department of Education, 2021
ASIAN
*Social Studies standards were updated and standard-setting redone in 2018.
© 2021 Tennessee Department of Education
PART IIAcademic Impact
How to Use the Data This data provides a state-level overview of student performance. Every district is different,
and trends may vary at the local level. Any interpretation of state level data should reflect a consideration for variations in local context, district participation rates, as well as other assessment data and performance indicators that will be available.*
The expected declines noted as a result of disruptions caused by the pandemic should create a sense of urgency in every district and school to consider the academic interventions necessary to support students. This data can be used to help communities reflect on strategic investments in student achievement and support necessary revisions to a district’s needs assessment for the purposes of planning federal recovery (ESSER) funding.
School systems, teachers, and families should use this and other relevant student data to develop individualized plans for every student who may require additional support to reach grade-level proficiency, or to maintain the rate of acceleration she or he would otherwise have had.
* The TDOE utilizes longitudinal, state-level data from a state level because of our strong participation rate. For some districts, these types of longitudinal comparisons may not be appropriate, given a larger difference in participation year-to-year.

Academic Projections& Recovery
SOURCE: Tennessee Department of Education, 2021
• Original projections of the academic impact were provided in fall of 2020.* Those projections are generally reflected in the current data.
• 20-21 TCAP data show sharp declines in math, but typically, math proficiency results fall-- and climb--faster than ELA.**
• The effects of falling behind are most pronounced in the youngest grades, especially in ELA.***
• Economically disadvantaged students feel the effects of learning loss more acutely.****
• Recovery and acceleration will take time, but collaborative, proactive solutions are already underway.
0
5
10
15
20
25
30
35
40
45
Elem & Middle ELA Elem & Middle Math
2017 2018 2019 Projected Learning Loss Actual 2021
* Tennessee Releases Data Showing Significant Learning Loss Among K-12 Students
**Collaborative-Brief_Covid19-Slide-APR20.pdf (nwea.org); The Effects of Summer Vacation on Achievement Test Scores: A Narrative and Meta-Analytic Review on JSTOR
***The Potential Impact of COVID‐19 on Student Learning and How Schools Can Respond - Wyse -2020 - Educational Measurement: Issues and Practice - Wiley Online Library)
****Introduction (harvard.edu)
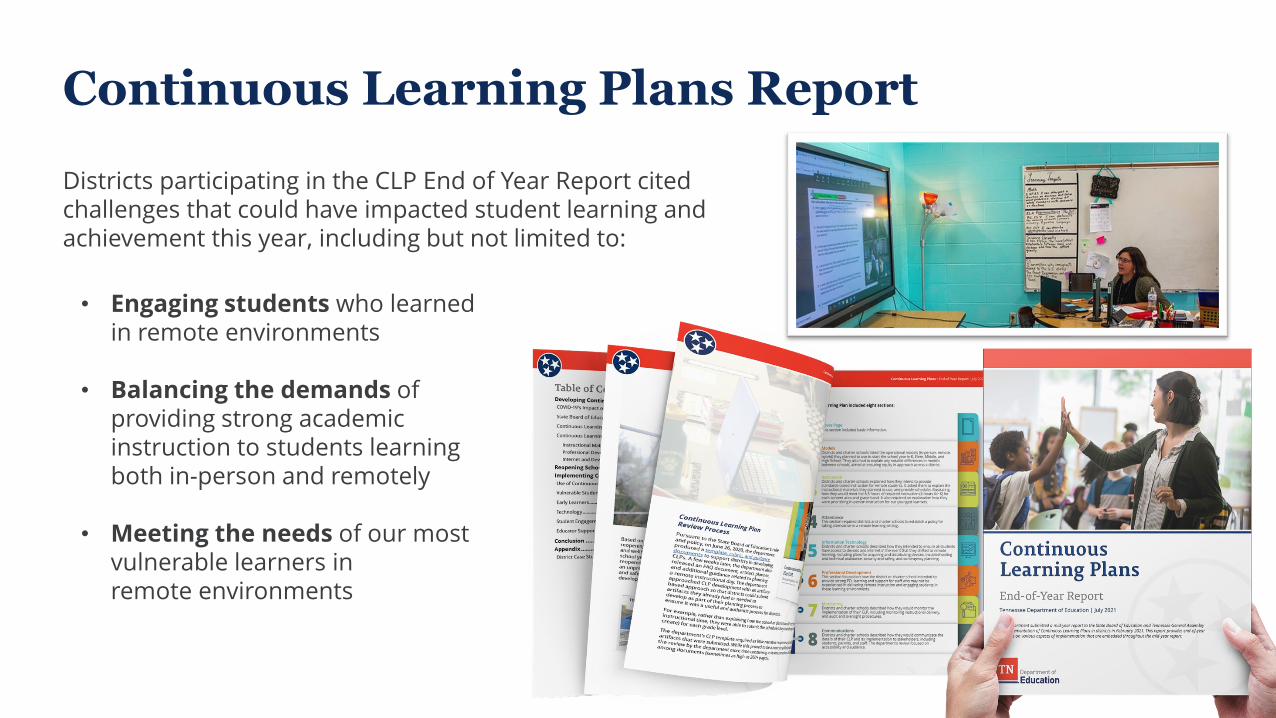
Continuous Learning Plans Report
• Engaging students who learned in remote environments
• Balancing the demands of providing strong academic instruction to students learning both in-person and remotely
• Meeting the needs of our most vulnerable learners in remote environments
Districts participating in the CLP End of Year Report cited challenges that could have impacted student learning and achievement this year, including but not limited to:
Early Elementary Reading/ELA is an area of concern, especially in those grades that do not have assessments or where public data is not shared. Significant declines are likely in kindergarten, 1st and 2nd grade reading, which creates more urgency in providing these students with additional literacy supports to ensure they are on-track to reading proficiently by 3rd grade.
While math overall is a concern, middle school math is especially problematic. In 2020-21, fewer students demonstrated readiness for Algebra I (in addition to fewer students taking the Algebra I assessment), and these declines will potentially create long-term challenges with other high school courses that require a strong foundation in Algebra as well as ACT performance (therefore scholarship eligibility and post-secondary readiness).
Widening achievement gaps between student groups are clear, exacerbating a historical gap that has not significantly closed even as the state had seen performance increases. Specifically, economically disadvantaged students saw significant declines in proficiency, which has traditionally been more difficult to recover from. Students with Disabilities and English learners also reflected increased challenges as a result of the pandemic disruptions.
Priority Areas of Concern Statewide
© 2021 Tennessee Department of Education
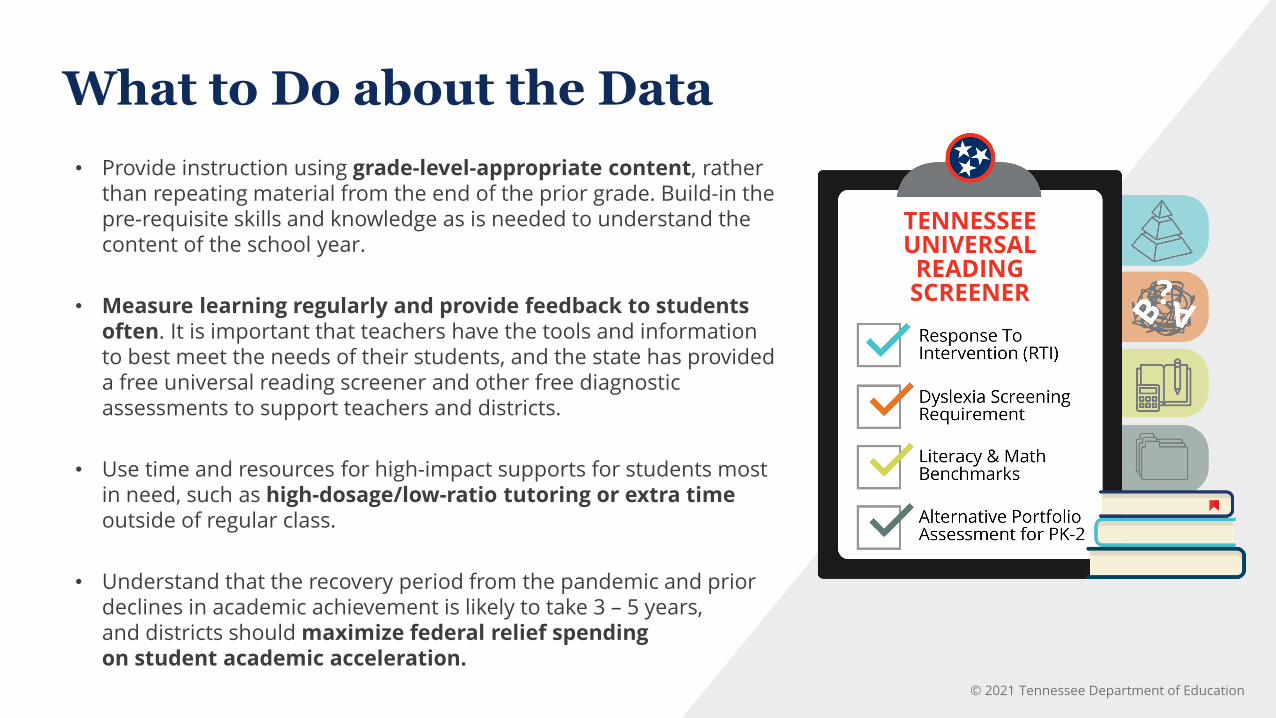
What to Do about the Data• Provide instruction using grade-level-appropriate content, rather
than repeating material from the end of the prior grade. Build-in the pre-requisite skills and knowledge as is needed to understand the content of the school year.
• Measure learning regularly and provide feedback to students often. It is important that teachers have the tools and information to best meet the needs of their students, and the state has provided a free universal reading screener and other free diagnostic assessments to support teachers and districts.
• Use time and resources for high-impact supports for students most in need, such as high-dosage/low-ratio tutoring or extra time outside of regular class.
• Understand that the recovery period from the pandemic and prior declines in academic achievement is likely to take 3 – 5 years, and districts should maximize federal relief spending on student academic acceleration.
TENNESSEE UNIVERSAL
READING SCREENER

ENGAGING FAMILIES: TCAP FAMILY PORTAL
TCAP Family Portal is a free, online resource to help families and students understand their TCAP results. Specifically, the portal provides families with access to:
• Test history features to track progress over time
• TCAP scale scores and performance levels by subject
• Parent guides and resources• Individualized recommendations
for improvements
Families can access this resource by registering at familyreport.tnedu.gov.

Data Timelines and Requests
DATA AVAILABILITY
Official data used for accountability reporting is subject to a district appeals process and embargo period.
ACCOUNTABILITY TIMELINE
The accountability timeline is available to districts within
the accountability application.
DATA REQUESTS PROCESS
Specific additional data requests should be submitted via the Data Request Form on the
department’s website.
© 2021 Tennessee Department of Education
PART IIIResponse, Recovery, and the Path Forward
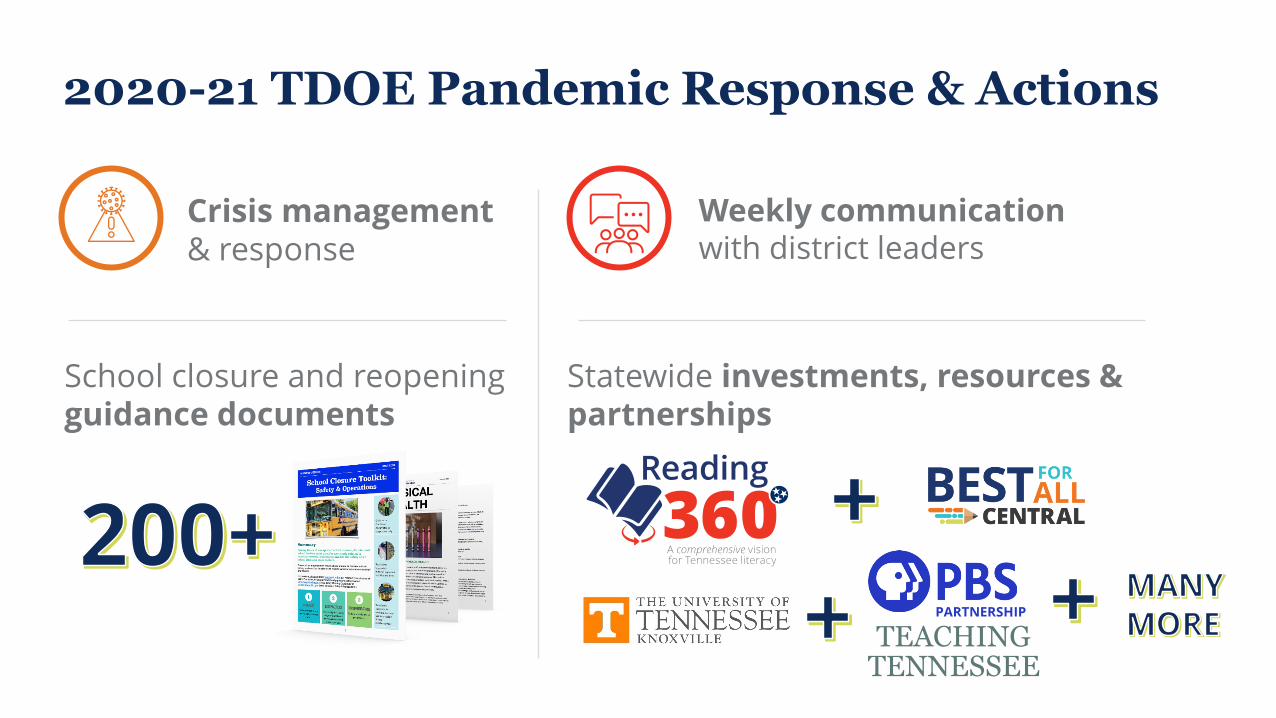
2020-21 TDOE Pandemic Response & Actions
PARTNERSHIP
Weekly communication with district leaders
School closure and reopening guidance documents
Statewide investments, resources & partnerships
Crisis management& response
TEACHINGTENNESSEE

The January 2021 special session addressed accountability, learning loss, literacy, and teacher pay
Tennessee Governor Bill Lee called aSpecial Legislative Session on Education
“We know that the COVID-19 pandemic has caused immense disruption for Tennessee’s students, educators, and districts, and the challenges they face must be addressed urgently.” - Governor Bill Lee

• During the special session, the Tennessee General Assembly passed the Tennessee Learning Loss Remediation and Student Acceleration Act, which set forward a path for students to receive additional instructional time and supports through summer programming opportunities beginning in summer 2021.
• During the Accelerating TN 2021 Tour, Commissioner Schwinn, department staff, state and local elected officials, and community partners connected directly with students, educators, and stakeholders this summer to learn more about how schools are accelerating student achievement and where additional supports and resources could be helpful.
Summer Programming Actions
2,600TOTAL MILES
50 DISTRICTS
15 ROUNDTABLES
43 SUMMER LEARNING SCHOOL VISITS
2 EARLY READINGTRAININGS

Historic Federal Funds for K-12 Education
Tennessee public schools will receive over $4.5 BILLION in federal relief funding for use between spring 2020 & fall 2024.
Over $150M in Coronavirus Relief Funds (CRF), including PPE
Over $45M in competitive federal grants for literacy, CCTE, and mental health resources
Over $126M in GEER (Governor’s discretionary relief funding)
Over $385M in ESSER (SEA discretionary relief funding)
...in addition to over $3.58 billion passed directly to LEAs
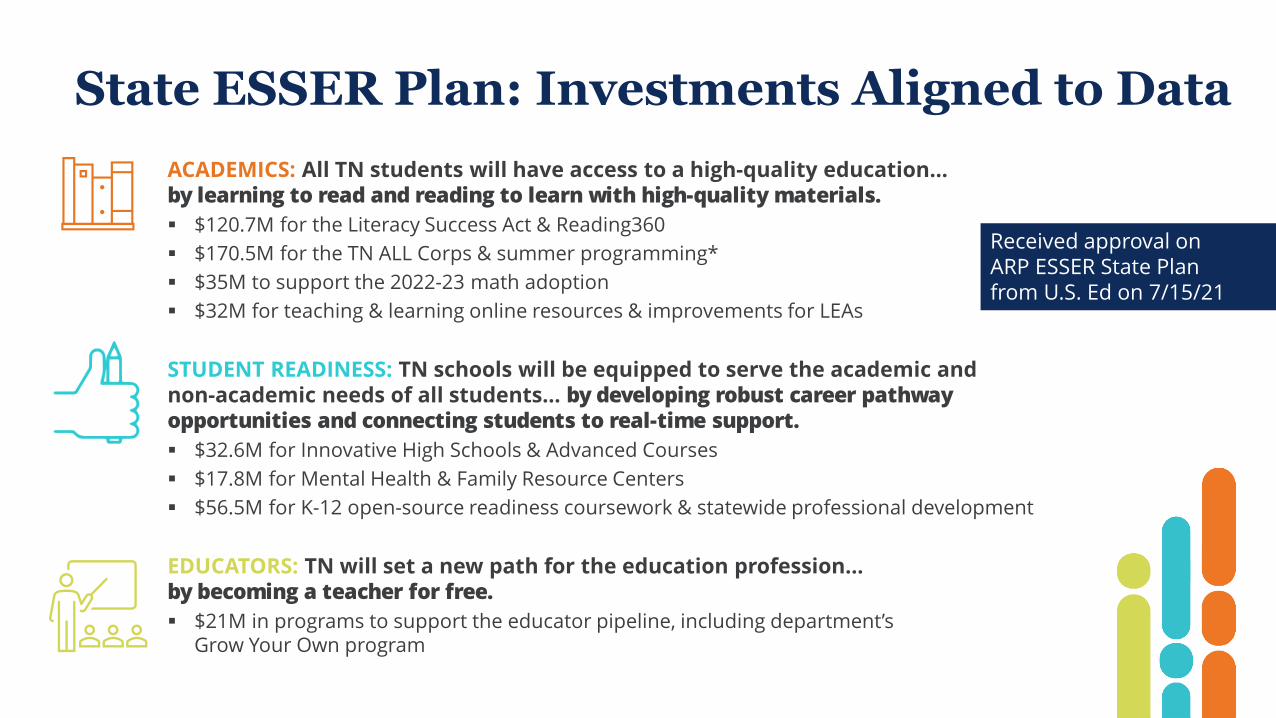
State ESSER Plan: Investments Aligned to DataACADEMICS: All TN students will have access to a high-quality education… by learning to read and reading to learn with high-quality materials. $120.7M for the Literacy Success Act & Reading360 $170.5M for the TN ALL Corps & summer programming* $35M to support the 2022-23 math adoption $32M for teaching & learning online resources & improvements for LEAs
STUDENT READINESS: TN schools will be equipped to serve the academic and non-academic needs of all students… by developing robust career pathway opportunities and connecting students to real-time support. $32.6M for Innovative High Schools & Advanced Courses $17.8M for Mental Health & Family Resource Centers $56.5M for K-12 open-source readiness coursework & statewide professional development
EDUCATORS: TN will set a new path for the education profession… by becoming a teacher for free. $21M in programs to support the educator pipeline, including department’s
Grow Your Own program
Received approval on ARP ESSER State Plan from U.S. Ed on 7/15/21
© 2021 Tennessee Department of Education
Investing to Address the DataACADEMICS
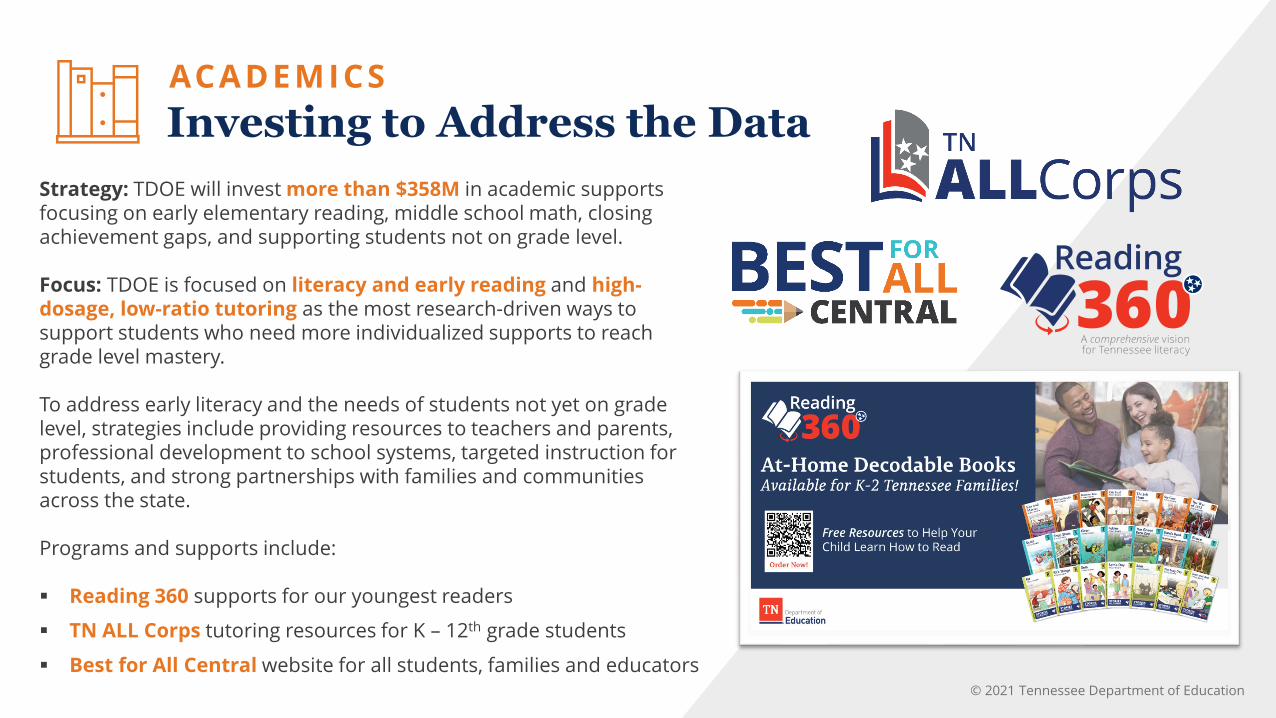
Strategy: TDOE will invest more than $358M in academic supports focusing on early elementary reading, middle school math, closing achievement gaps, and supporting students not on grade level.
Focus: TDOE is focused on literacy and early reading and high-dosage, low-ratio tutoring as the most research-driven ways to support students who need more individualized supports to reach grade level mastery.
To address early literacy and the needs of students not yet on grade level, strategies include providing resources to teachers and parents, professional development to school systems, targeted instruction for students, and strong partnerships with families and communities across the state.
Programs and supports include:
Reading 360 supports for our youngest readers
TN ALL Corps tutoring resources for K – 12th grade students
Best for All Central website for all students, families and educators
© 2021 Tennessee Department of Education
Investing to Address the DataSTUDENT READINESS
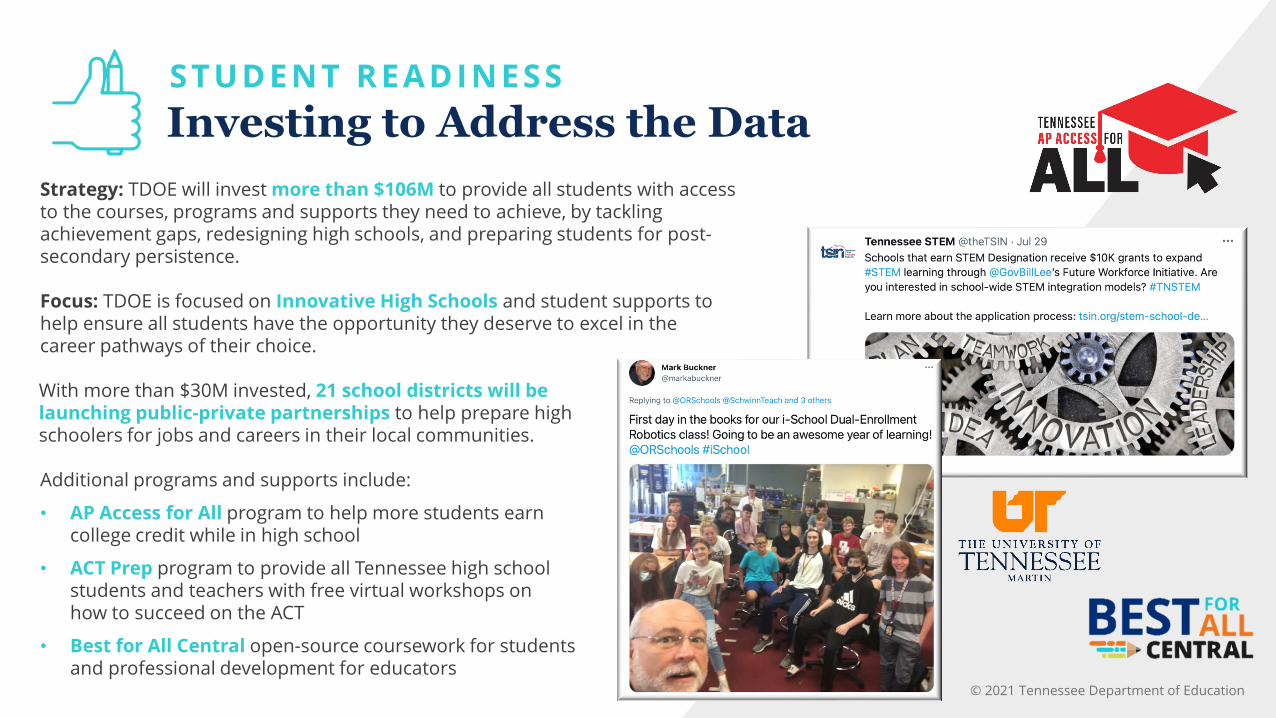
Strategy: TDOE will invest more than $106M to provide all students with access to the courses, programs and supports they need to achieve, by tackling achievement gaps, redesigning high schools, and preparing students for post-secondary persistence.
Focus: TDOE is focused on Innovative High Schools and student supports to help ensure all students have the opportunity they deserve to excel in the career pathways of their choice.
With more than $30M invested, 21 school districts will be launching public-private partnerships to help prepare high schoolers for jobs and careers in their local communities.
Additional programs and supports include:
• AP Access for All program to help more students earn college credit while in high school
• ACT Prep program to provide all Tennessee high school students and teachers with free virtual workshops on how to succeed on the ACT
• Best for All Central open-source coursework for students and professional development for educators

© 2021 Tennessee Department of Education
Investing to Address the Data
Additional Grow Your Own strategies include:
Expanding SPED and ESL endorsements for existing teachers
Cultivating Aspiring Assistant Principal and Diverse Leaders Networks to become an administrator for free
Pursuing innovative emerging work related to apprenticeships
EDUCATORS
Strategy: TDOE will invest more than $20M to address shortages of credentialed teachers and professional development for our educators to ensure all students can get the supports they need.
Focus: Grow Your Own programs create pathways to become a teacher for free— enabling future teachers to earn their degree, serve their home communities, maintain employment, and begin Day 1 in with real-world classroom experience.
With $6.5M invested in over 63 local partnerships, more than 1,000 future educators and leaders will all earn their credentials for free through Grow Your Own.
Upcoming Research Work
Reading 360 Research
Center
ACT Preliminary
Research
Tennessee Educator
Survey Findings
National ESSER Research Steering
Committee

District ESSER Reporting RequirementsTDOE’s School Model & Attendance Dashboard• Report Learning model (by district)• Report Learning model (by school)• Student groups identified by USDOE
Health & Safety Data• Report by student group
and grade level
Federal Relief Planning• Include meaningful engagement
with the community in plans• Utilize a Needs Assessment• Publicly report on strategic
investments of all federal relief funding
Academics Data• Report all ESSER-funded activities
by student group, grade level, input and outcome data
Student Readiness Data• Report all ESSER-funded activities
by student group, grade level, input and outcome data
Educators Data• Report all ESSER-funded activities
by student group, grade level, input and outcome data

Local Planning & Urgency
Understandwhat is needed for students to
access grade-level content over the
next 3 years.
Ascertainthe academic
and other needs to students and staff.
Designa multi-year
LEA recovery plan aligned to
maximizing the funds to boost
academic achievement.
Implementthe plan with a
strong focus on a few large,
high-quality initiatives with
clear processes for data collection.
Monitor, Evaluate and Adjust
based on the results of
data collection and feedback from students
and staff.

Best for All Recognition Program
What is a Best For All District (or charter school)?
Best For All Districts are those organizations that have strategically planned for and invested in ways that are likely to accelerate student achievement.
How do you qualify to become a Best For All District (or charter school)?
To qualify, districts must complete basic application assurances that the district will:
– Participate in the TN ALL Corps for at least 2 of the 3 years
– Spend 50% of the district’s ESSER 3.0 award amount on proven/research-based strategies to raise student academic achievement (inclusive of TN ALL Corps and demonstrated on the district’s public ESSER plan)
Tennessee has a once-in-a-lifetime opportunity to strategically invest in our students, and urgent academic needs to address on behalf of our children. The department understands the importance of rewarding investments in mission-critical initiatives that are most likely to benefit students.

Next Steps & Recommendations• TCAP results demonstrate an urgent need to support Tennessee’s students and
continue the incredible efforts demonstrated throughout the pandemic.
• Districts, school boards, principals, teachers, elected officials, community partners, and parents and families-- review your TCAP assessment data to identify any strategies to use at home in addition to additional supports provided at the school level.
• Tennessee is well-prepared and will continue to work hard to accelerate academic achievement and ensure the best for all our kids.
© 2021 Tennessee Department of Education
Thank You!
@TennesseeEducation
@Tnedu
@TNDeptOfEDU
@TNDeptofEducation
Tennessee Department of Education710 James Robertson ParkwayNashville, TN 37243
tn.gov/education
#TNBestforAll

© 2021 Tennessee Department of Education
Appendix: Data Slides
ELEMENTARY SCHOOL
ELA
SOURCE: Tennessee Department of Education, 2021
GRADE
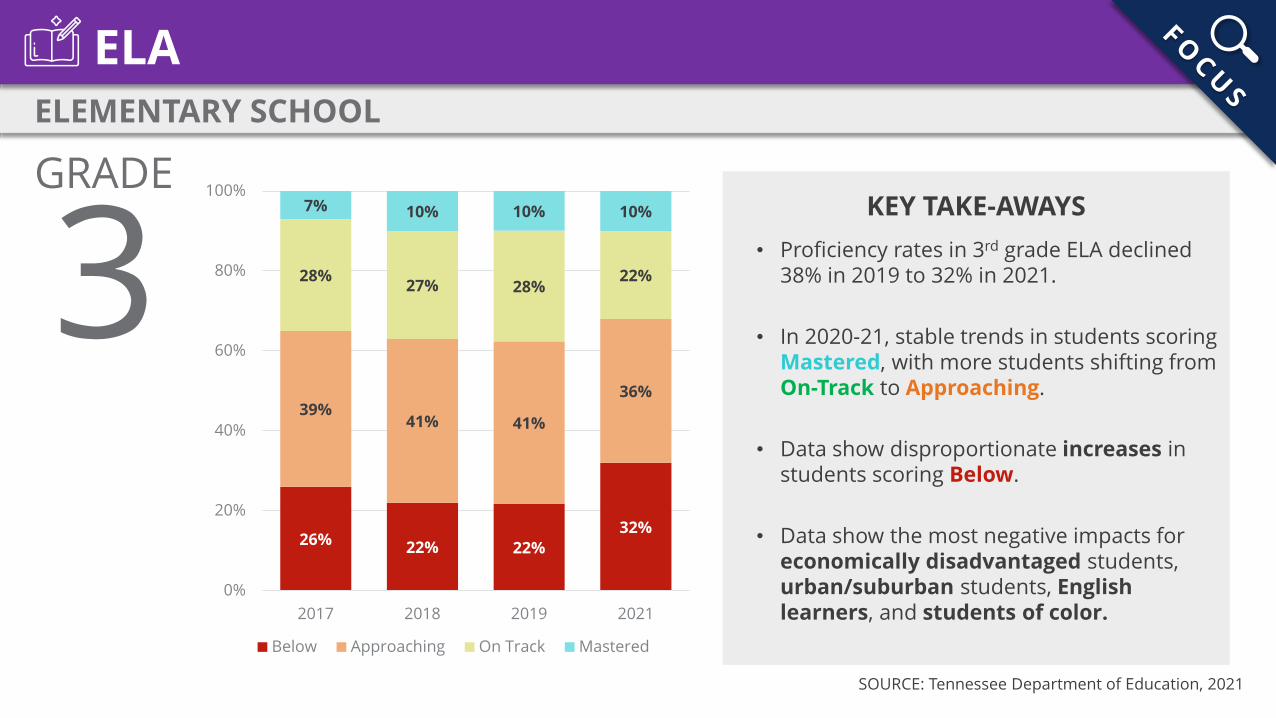
326% 22% 22%
32%
39%41% 41%
36%
28% 27% 28%22%
7% 10% 10% 10%
0%
20%
40%
60%
80%
100%
2017 2018 2019 2021
Below Approaching On Track Mastered
KEY TAKE-AWAYS• Proficiency rates in 3rd grade ELA declined
38% in 2019 to 32% in 2021.
• In 2020-21, stable trends in students scoring Mastered, with more students shifting from On-Track to Approaching.
• Data show disproportionate increases in students scoring Below.
• Data show the most negative impacts for economically disadvantaged students, urban/suburban students, English learners, and students of color.

ELEMENTARY SCHOOL
ELA
SOURCE: Tennessee Department of Education, 2021
GRADE
419% 19% 20% 18%
44% 43% 46% 49%
32% 32% 29% 31%
5% 6% 5% 2%
0%
20%
40%
60%
80%
100%
2017 2018 2019 2021
Below Approaching On Track Mastered
KEY TAKE-AWAYS• Proficiency rates in 4th grade ELA declined
from 34% in 2019 to 33% in 2021.
• Slight declines in students scoring Mastered, however this has traditionally been a low percentage of students. These students shifted to On-Track.
• There was general stability in Approaching and Below.
• Low-income students, urban/suburban students, English learners, and students of colorwere most negatively impacted.

ELEMENTARY SCHOOL
ELA
SOURCE: Tennessee Department of Education, 2021
GRADE
525% 24% 26% 30%
44% 43% 38%41%
26% 29% 30%27%
5% 4% 6% 2%
0%
20%
40%
60%
80%
100%
2017 2018 2019 2021
Below Approaching On Track Mastered
KEY TAKE-AWAYS• Proficiency rates in 5th grade ELA declined
from 36% in 2019 to 29% in 2021.
• Slight declines in students scoring Mastered, however this has traditionally been a low percentage of students. These students shifted to On-Track.
• There was general stability in Approaching and Below.
• Low-income students, urban/suburban students, English learners, and students of colorwere most negatively impacted.

MIDDLE SCHOOL
ELA
SOURCE: Tennessee Department of Education, 2021
GRADE
619% 19% 20% 19%
47% 46% 46% 54%
28% 31% 28%25%
6% 4% 5% 2%
0%
20%
40%
60%
80%
100%
2017 2018 2019 2021
Below Approaching On Track Mastered
KEY TAKE-AWAYS• Proficiency rates in 6th grade ELA declined
from 33% in 2019 to 27% in 2021.
• 2% of students scored at Mastered. Declines observed in students scoring On-Track, with those students shifting to Approaching.
• There was a significant increase in students scoring at Approaching, with Belowrelatively unchanged.
• Low-income students, urban/suburbanstudents, English learners, and students of color were most negatively impacted.
MIDDLE SCHOOL
ELA
SOURCE: Tennessee Department of Education, 2021
GRADE
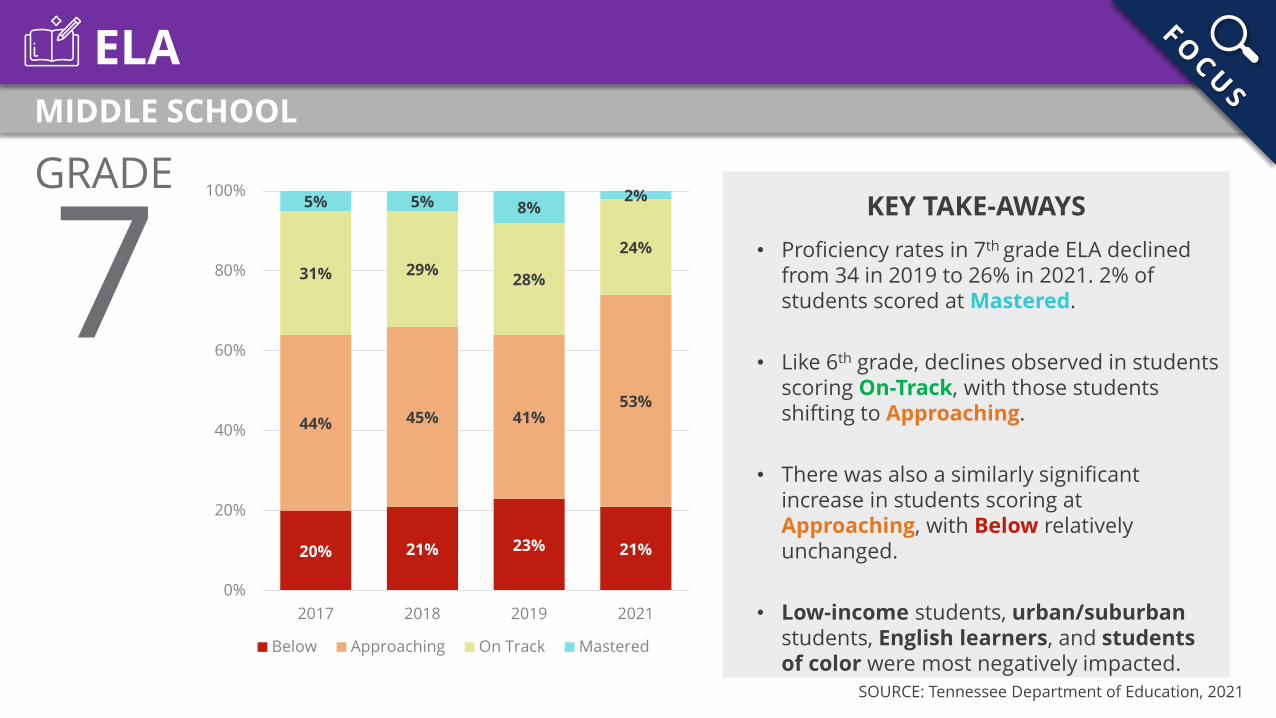
720% 21% 23% 21%
44% 45% 41%53%
31% 29% 28%
24%
5% 5% 8%2%
0%
20%
40%
60%
80%
100%
2017 2018 2019 2021
Below Approaching On Track Mastered
KEY TAKE-AWAYS• Proficiency rates in 7th grade ELA declined
from 34 in 2019 to 26% in 2021. 2% of students scored at Mastered.
• Like 6th grade, declines observed in students scoring On-Track, with those students shifting to Approaching.
• There was also a similarly significant increase in students scoring at Approaching, with Below relatively unchanged.
• Low-income students, urban/suburbanstudents, English learners, and students of color were most negatively impacted.

MIDDLE SCHOOL
ELA
SOURCE: Tennessee Department of Education, 2021
GRADE
817% 18% 20% 23%
52% 55% 52%54%
25%24% 25%
22%
6% 3% 3% 1%
0%
20%
40%
60%
80%
100%
2017 2018 2019 2021
Below Approaching On Track Mastered
KEY TAKE-AWAYS• Proficiency rates in 8th grade ELA declined from
28% in 2019 to 23% in 2021.
• 1% of students scored at Mastered, after consistent declines over the last 5 years. Slight declines reflected in students scoring On-Track.
• There was a slight increase in students scoring at Approaching, with further increases in students scoring at Below.
• Low-income students, urban/suburbanstudents, English learners, and students of color were most negatively impacted.
HIGH SCHOOL END OF COURSE
ELA
SOURCE: Tennessee Department of Education, 2021
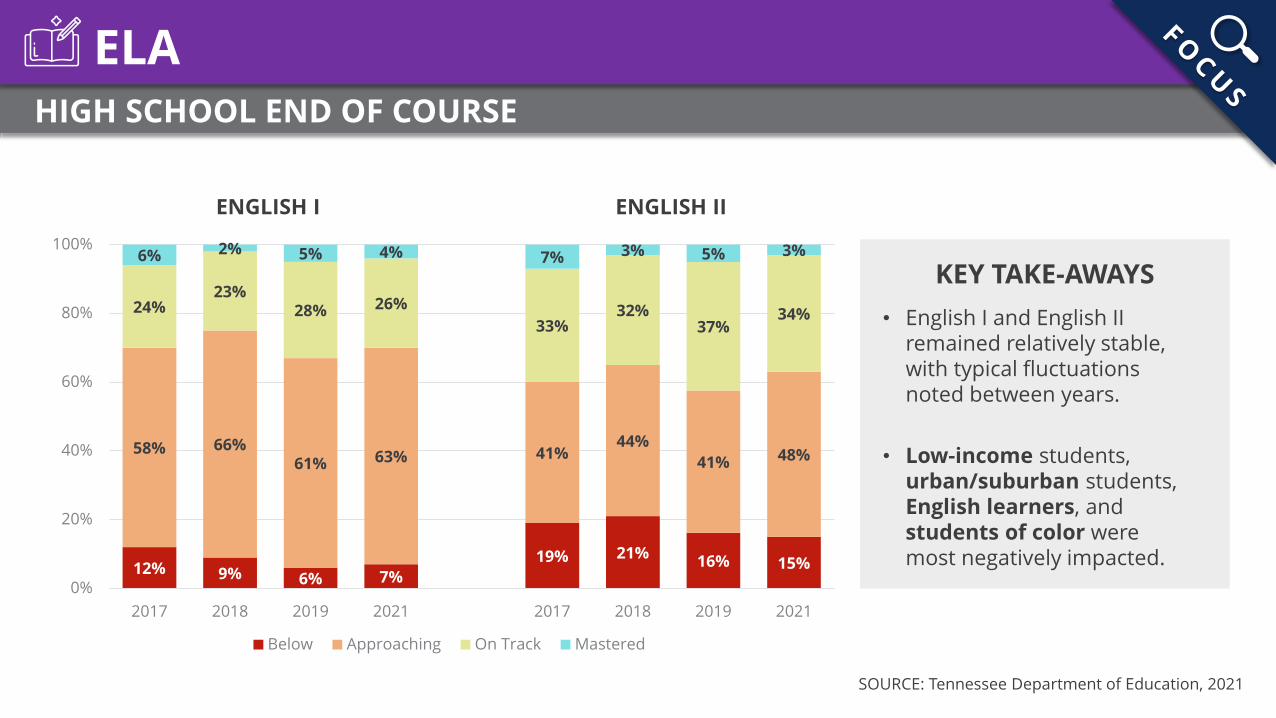
ENGLISH I ENGLISH II
12% 9% 6% 7%19% 21% 16% 15%
58% 66%61% 63% 41%
44%41% 48%
24%23%
28% 26%33%
32%37%
34%
6% 2% 5% 4% 7% 3% 5% 3%
0%
20%
40%
60%
80%
100%
2017 2018 2019 2021 2017 2018 2019 2021
Below Approaching On Track Mastered
KEY TAKE-AWAYS• English I and English II
remained relatively stable, with typical fluctuations noted between years.
• Low-income students, urban/suburban students, English learners, and students of color were most negatively impacted.
SOURCE: Tennessee Department of Education, 2021
ELEMENTARY SCHOOL
GRADE
3MATH
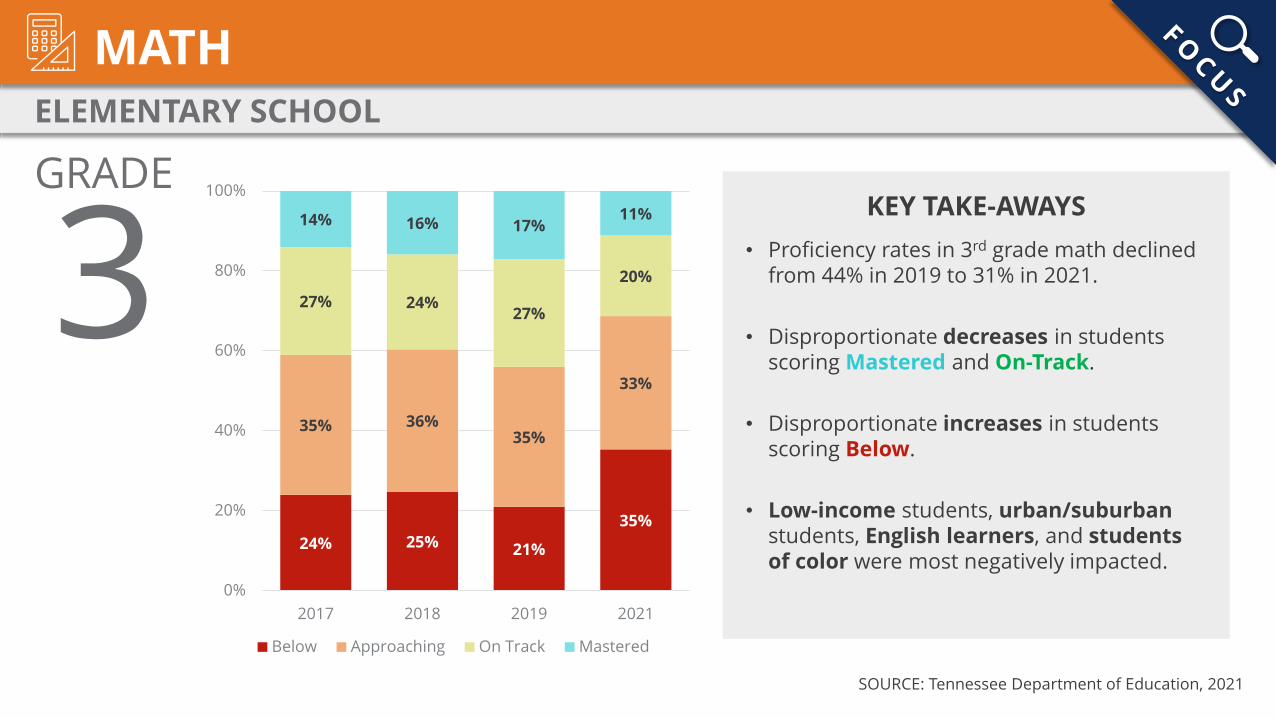
24% 25% 21%
35%
35% 36%35%
33%
27% 24%27%
20%
14% 16% 17%11%
0%
20%
40%
60%
80%
100%
2017 2018 2019 2021
Below Approaching On Track Mastered
KEY TAKE-AWAYS• Proficiency rates in 3rd grade math declined
from 44% in 2019 to 31% in 2021.
• Disproportionate decreases in students scoring Mastered and On-Track.
• Disproportionate increases in students scoring Below.
• Low-income students, urban/suburbanstudents, English learners, and students of color were most negatively impacted.

SOURCE: Tennessee Department of Education, 2021
ELEMENTARY SCHOOL
GRADE
4MATH
25% 28% 23%
37%
34% 32%31%
30%
32% 31%34%
27%
9% 10% 12% 7%
0%
20%
40%
60%
80%
100%
2017 2018 2019 2021
Below Approaching On Track Mastered
KEY TAKE-AWAYS• Proficiency rates in 4th grade math declined
from 46% in 2019 to 34% in 2021.
• There were declines in students scoring Mastered with significant declines in those scoring On-Track.
• There was general stability in Approaching, but significant increases in the percent of students scoring Below.
• Low-income students, urban/suburbanstudents, English learners, and students of color were most negatively impacted.

SOURCE: Tennessee Department of Education, 2021
ELEMENTARY SCHOOL
GRADE
5MATH
27% 27%20%
36%
35% 33%34%
32%
28% 26%31%
20%
11% 14% 15% 11%
0%
20%
40%
60%
80%
100%
2017 2018 2019 2021
Below Approaching On Track Mastered
KEY TAKE-AWAYS• Proficiency rates in 5th grade math declined
from 46% in 2019 to 31% in 2021.
• There were declines in students scoring Mastered, with significant declines in those scoring On-Track.
• There was general stability in Approaching, but significant increases in the percent of students scoring Below.
• Low-income students, urban/suburbanstudents, English learners, and students of color were most negatively impacted.
SOURCE: Tennessee Department of Education, 2021
MIDDLE SCHOOL
MATH
GRADE
625% 29% 28%
43%
36%36%
32%
31%
33% 30%34%
23%
6% 5% 6% 4%
0%
20%
40%
60%
80%
100%
2017 2018 2019 2021
Below Approaching On Track Mastered
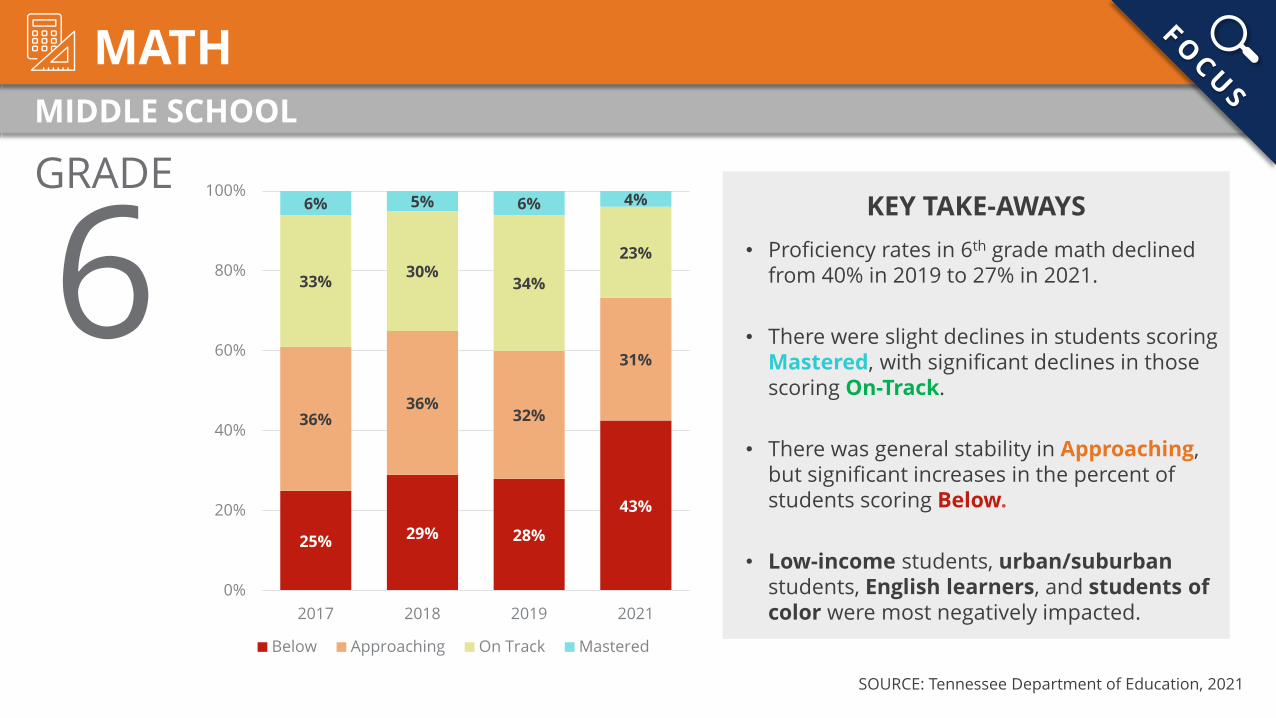
KEY TAKE-AWAYS• Proficiency rates in 6th grade math declined
from 40% in 2019 to 27% in 2021.
• There were slight declines in students scoring Mastered, with significant declines in those scoring On-Track.
• There was general stability in Approaching, but significant increases in the percent of students scoring Below.
• Low-income students, urban/suburbanstudents, English learners, and students of color were most negatively impacted.

KEY TAKE-AWAYS• Proficiency rates in 7th grade math declined from
34% in 2019 to 24% of 7th graders in 2021, which is a significant concern related to Algebra-readiness.
• There were slight declines in students scoring Mastered, with significant declines in those scoring On-Track.
• There was no change in Approaching and significant declines in Below, which reflects that more grade-level instruction is needed.
• Low-income students, urban/suburbanstudents, English learners, and students of color were most negatively impacted.
SOURCE: Tennessee Department of Education, 2021
MIDDLE SCHOOL
MATH
GRADE
724% 27% 24%
35%
44% 42%42%
42%
27% 24% 27%19%
5% 7% 7% 5%
0%
20%
40%
60%
80%
100%
2017 2018 2019 2021
Below Approaching On Track Mastered

SOURCE: Tennessee Department of Education, 2021
MIDDLE SCHOOL
MATH
GRADE
8KEY TAKE-AWAYS
• In 8th grade math, there were significant declines in On-Track and increases in students scoring Below.
• Note: Fewer students took the Algebra I assessment, which reflects a higher concentration of historically high-performing students. Even then, there were still declines in overall proficiency.
8TH GRADERS TAKING 8TH GRADE MATH
8TH GRADERS TAKING ALGEBRA (ADVANCED MATH)
34% 36%30%
47%
12% 8% 6% 11%
35% 32%35%
29%
25%21%
18%21%
25% 25% 27%19%
39%
38%38%
36%
6% 7% 8% 5%
24%34% 38%
32%
0%
20%
40%
60%
80%
100%
2017 2018 2019 2021 2017 2018 2019 2021
Below Approaching On Track Mastered

HIGH SCHOOL END OF COURSE
SOURCE: Tennessee Department of Education, 2021
MATH
1st HS MATH COURSE(Algebra 1/Integrated Math 1)
57% 60% 54%68%
50% 49%41% 47% 44%
50% 46%58%
27% 24%26%
21%
24% 24%27%
31% 33% 25%28%
24%
12% 12% 15%9%
20% 20% 24%17% 21% 20% 21%
15%
4% 4% 5% 2% 5% 7% 8% 5% 2% 4% 6% 3%
0%
20%
40%
60%
80%
100%
2017 2018 2019 2021 2017 2018 2019 2021 2017 2018 2019 2021
Below Approaching On Track Mastered
2ND HS MATH COURSE(Geometry/Integrated Math 2)
3rd HS MATH COURSE(Algebra 2/Integrated Math 3)

ELEMENTARY SCHOOL
SCIENCE
SOURCE: Tennessee Department of Education, 2021
KEY TAKE-AWAYS
In elementary science, proficiency rates dropped from 56% in 2018 to 39% in 2021.
• There were declines in students scoring Mastered and On Track.
• There was an increase in students scoring Approaching and a slight increase in students scoring Below.
18% 23% 25%
23%21%
36%
45% 41%
32%
13% 15%7%
0%
20%
40%
60%
80%
100%
2017 2018 2021
Below Approaching On Track Mastered
*There were no operational science tests administered in 2019.
MIDDLE SCHOOL
SCIENCE
SOURCE: Tennessee Department of Education, 2021
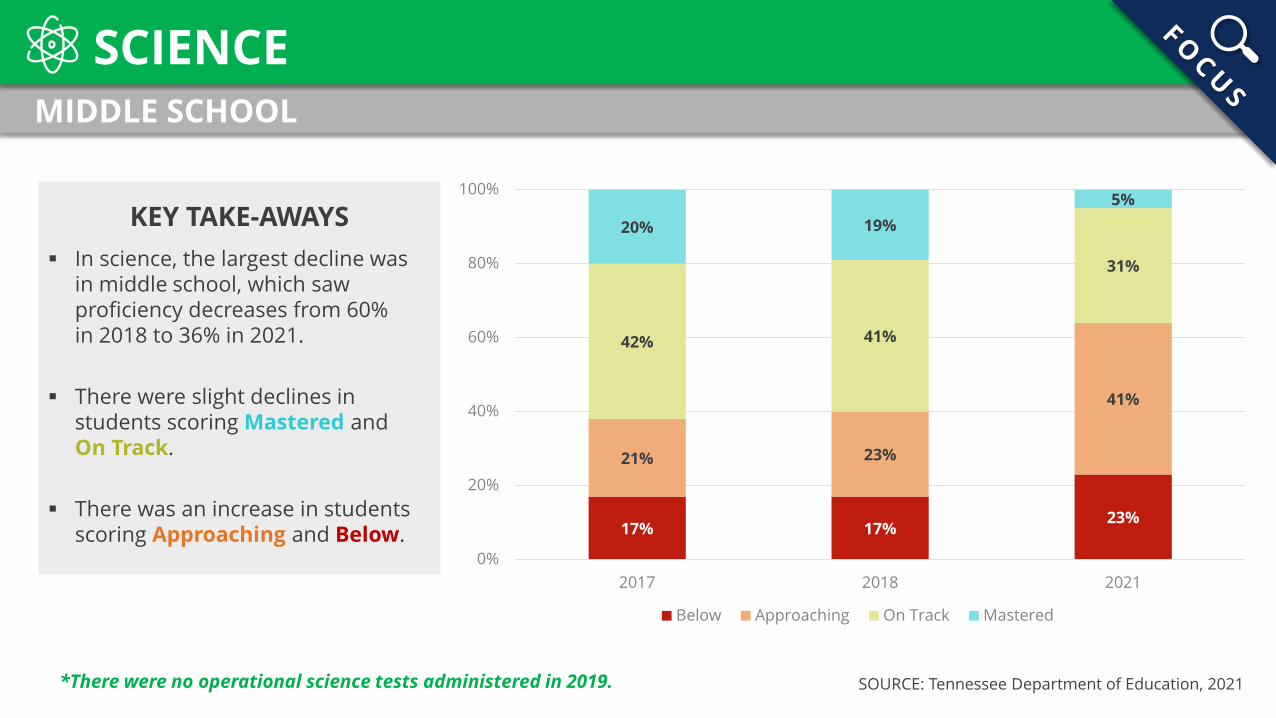
KEY TAKE-AWAYS In science, the largest decline was
in middle school, which saw proficiency decreases from 60% in 2018 to 36% in 2021.
There were slight declines in students scoring Mastered and On Track.
There was an increase in students scoring Approaching and Below. 17% 17%
23%
21% 23%
41%
42% 41%
31%
20% 19%5%
0%
20%
40%
60%
80%
100%
2017 2018 2021
Below Approaching On Track Mastered
*There were no operational science tests administered in 2019.
HIGH SCHOOL
SCIENCE
SOURCE: Tennessee Department of Education, 2021
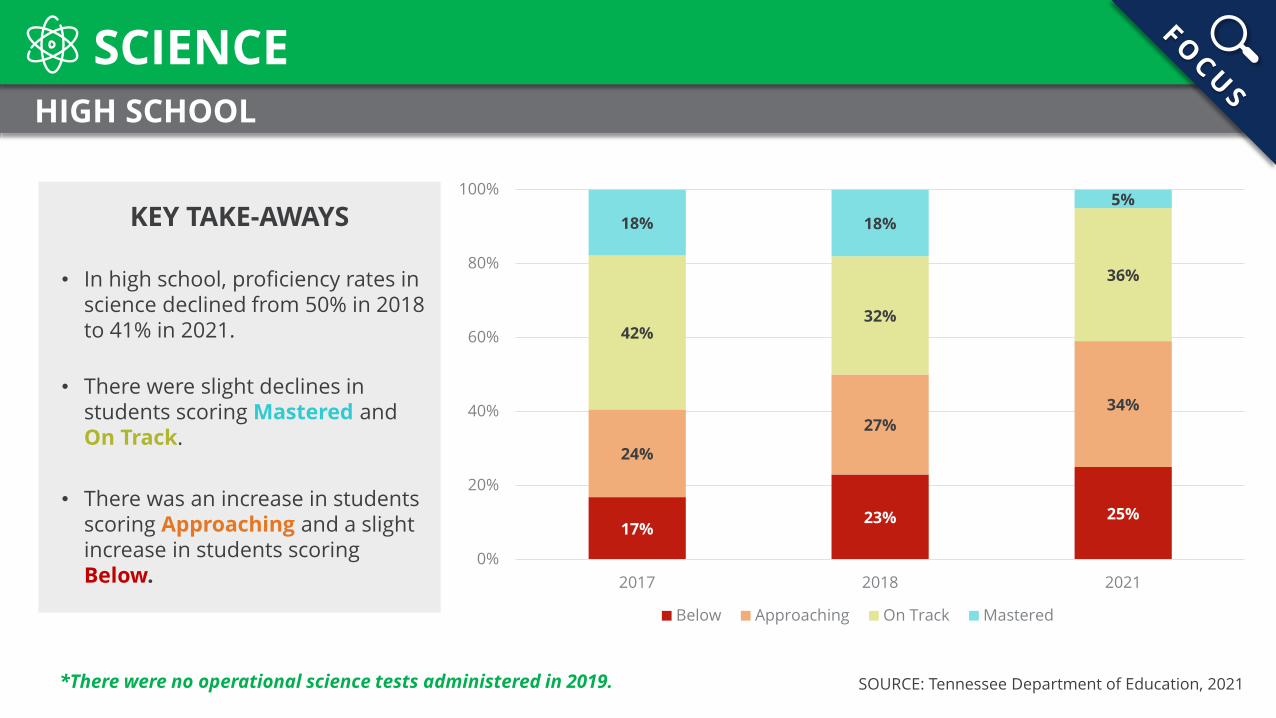
KEY TAKE-AWAYS
• In high school, proficiency rates in science declined from 50% in 2018 to 41% in 2021.
• There were slight declines in students scoring Mastered and On Track.
• There was an increase in students scoring Approaching and a slight increase in students scoring Below.
17%23% 25%
24%
27%34%
42%32%
36%
18% 18%5%
0%
20%
40%
60%
80%
100%
2017 2018 2021
Below Approaching On Track Mastered
*There were no operational science tests administered in 2019.
MIDDLE SCHOOL
SOURCE: Tennessee Department of Education, 2021
SOCIAL STUDIES
67%
30% 29% 28%
17%
30% 30% 35%
11%
30% 31%31%
6% 9% 10% 6%
0%
20%
40%
60%
80%
100%
2017 2018 2019 2021
Below Approaching On Track Mastered
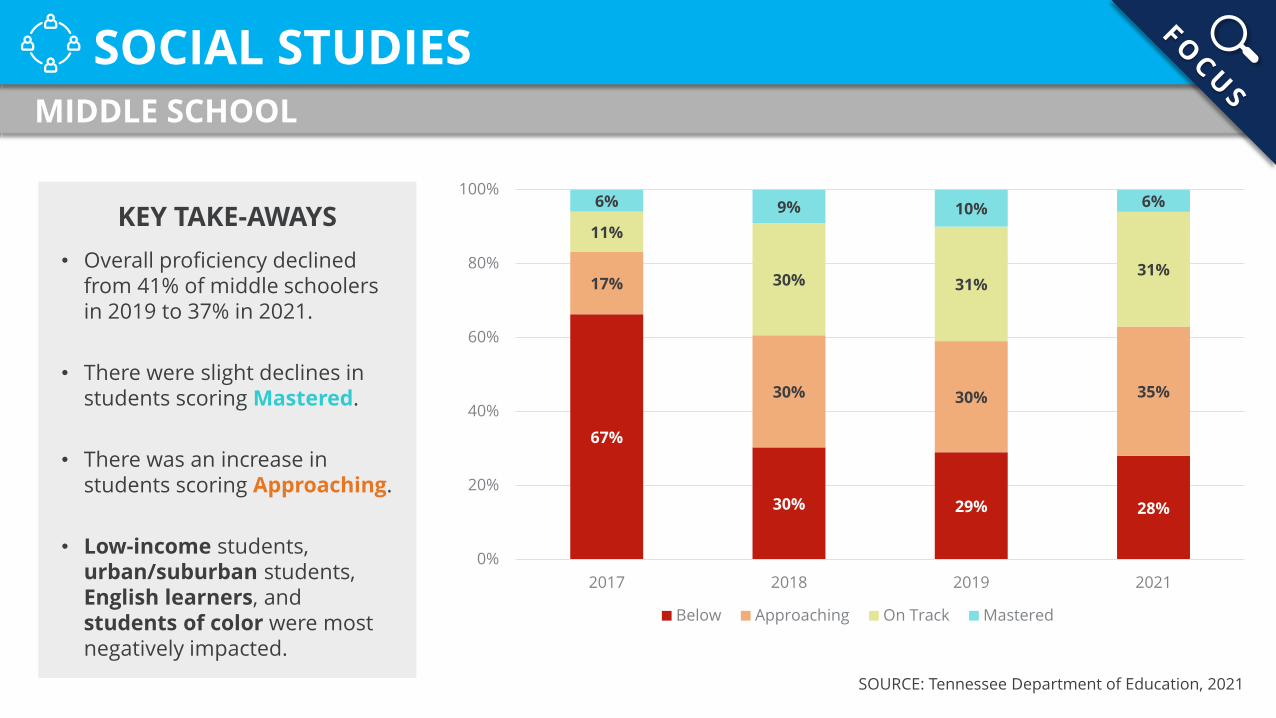
KEY TAKE-AWAYS• Overall proficiency declined
from 41% of middle schoolers in 2019 to 37% in 2021.
• There were slight declines in students scoring Mastered.
• There was an increase in students scoring Approaching.
• Low-income students, urban/suburban students, English learners, and students of color were most negatively impacted.

HIGH SCHOOL
SOURCE: Tennessee Department of Education, 2021
SOCIAL STUDIES
34% 37% 35% 33%
35% 35% 36%34%
21% 20% 21% 25%
9% 8% 8% 8%
0%
20%
40%
60%
80%
100%
2017 2018 2019 2021
Below Approaching On Track Mastered
KEY TAKE-AWAYS• Overall proficiency increased
from 29% of high schoolers in 2019 to 33% in 2021.
• The increases were exclusively for those students scoring On Track.
• There was a 2-point decrease in students scoring both Approaching and Below.

% A
bove
or
Belo
w S
tate
Stu
dent
Par
ticip
atio
nStudent Participation Breakdown
-5%
-4%
-3%
-2%
-1%
0%
1%
2%
3%City Rural Suburb Town
Asian
Black or African American
Hispanic/Latino
White
Economically Disadvantaged
Students with Disabilities
English Learners with Transitional 1-4
95%
State TCAP PARTICIPATION
RATE
Recommended


![G60a Best Practices for Business Analyst Appendix A v1 · best practices for business analyst appendix b a template of business analysis work plan with sample contents [g60b] version:](https://img.pdfslide.net/doc/110x75/5ac85c027f8b9a40728caf7e/g60a-best-practices-for-business-analyst-appendix-a-v1-practices-for-business-analyst.jpg)