BI-FUNCTIONAL NANOSTRUCTURED NOVEL CATALYSTS
FOR DIMETHYL ETHER SYNTHESIS
A THESIS SUBMITTED TO
THE GRADUATE SCHOOL OF NATURAL AND APPLIED SCIENCES
OF
MIDDLE EAST TECHNICAL UNIVERSITY
BY
GÖKHAN ÇELİK
IN PARTIAL FULFILLMENT OF THE REQUIREMENTS
FOR
THE DEGREE OF MASTER OF SCIENCE
IN
CHEMICAL ENGINEERING
JULY 2012
Approval of the thesis:
BI-FUNCTIONAL NANOSTRUCTURED NOVEL CATALYSTS
FOR DIMETHYL ETHER SYNTHESIS
submitted by GÖKHAN ÇELİK in partial fulfillment of the requirements for the
degree of Master of Science in Chemical Engineering Department, Middle East
Technical University by,
Prof. Dr. Canan Özgen ____________________
Dean, Graduate School of Natural and Applied Sciences
Prof. Dr. Deniz Üner ____________________
Head of Department, Chemical Engineering
Prof. Dr. Timur Doğu ____________________
Supervisor, Chemical Engineering Dept., METU
Prof. Dr. H. Önder Özbelge ____________________
Co-Supervisor, Chemical Engineering Dept., METU
Examining Committee Members:
Prof. Dr. Göknur Bayram ____________________
Chemical Engineering Dept., METU
Prof. Dr. Timur Doğu ____________________
Chemical Engineering Dept., METU
Prof. Dr. H. Önder Özbege ____________________
Chemical Engineering Dept., METU
Prof. Dr. Pınar Çalık ____________________
Chemical Engineering Dept., METU
Assist. Prof. Dr. Dilek Varışlı ____________________
Advanced Technologies, Gazi University
Date: 20.07.2012

iii
I hereby declare that all information in this document has been obtained and
presented in accordance with academic rules and ethical conduct. I also declare
that, as required by these rules and conduct, I have fully cited and referenced
all material and results that are not original to this work.
Name, Last name: GÖKHAN ÇELİK
Signature:
iv
ABSTRACT
BI-FUNCTIONAL NANOSTRUCTURED NOVEL CATALYSTS FOR
DIMETHYL ETHER SYNTHESIS
Çelik, Gökhan
M.Sc., Department of Chemical Engineering
Supervisor : Prof. Dr. Timur Doğu
Co-Supervisor : Prof. Dr. H. Önder Özbelge
July 2012, 196 pages
Excessive use of fossil fuels shall result in the significant energy problems in the
coming century and causes global warming by CO2 emission. Use of petroleum in
transportation constitutes the dominant part of total petroleum use. Researches on
non-petroleum based, environmentally friendly alternative fuels have been ascended
in last decades. Among the alternative fuels, DME has been considered as an
attractive fuel alternate due to high cetane number, low PM (particulate matter) and
low NOx emission. Synthesis of DME is possible with gasification of biowastes or
coal and steam reforming of natural gas. DME is produced in two different methods.
In the first method, methanol is formed from the synthesis gas, followed by methanol
dehydration to DME. In the second method, called as direct synthesis of DME from
synthesis gas, methanol formation and dehydration occurs simultaneously at the
same location within the reactor. For the direct synthesis of DME, bi-functional
catalysts must be used; one site is responsible for methanol synthesis and other site is
responsible for methanol dehydration.
Throughout this thesis work, several catalysts were prepared to be used as methanol
synthesis component or methanol dehydration component of bi-functional direct
v
DME synthesis catalyst and bi-functional catalysts were also prepared for the direct
synthesis of DME from synthesis gas. Materials were characterized by XRD, EDS,
SEM, N2 physisorption, and DRIFTS characterization techniques. Activity tests were
conducted in a high pressure, fixed bed flow reactor at 50 bar and for the feed gas
compositions of H2:CO=50:50 and H2:CO: CO2=50:40:10.
Addition of zirconia and alumina promoters, long aging time, calcination
temperature of 550 °C and reduction at 250 °C were found to be beneficial in
methanol synthesis from the equimolar composition of CO and H2. Precipitated
catalysts were usually active and selective to methanol. However, bi-functional co-
precipitated catalyst was not successful in situ conversion of methanol into dimethyl
ether. Furthermore, tungstosilisic acid impregnated SBA-15 was physically mixed
with commercial methanol reforming catalyst and activity results revealed that high
DME yield and selectivity were obtained.
By physically mixing commercial methanol synthesis and reforming catalysts with γ-
Al2O3 and TRC-75(L) in appropriate proportions or by preparing the reactor bed in a
sequential arrangement, very high DME yields were obtained and superiority of
direct synthesis to conventional two step synthesis was proven. Presence of CO2 in
the feed stream not only enhanced the catalytic activity but also utilization of the
most important greenhouse gas was accomplished. It was seen that synthesized
catalysts are very promising in the direct synthesis of dimethyl ether from synthesis
gas.
Keywords: Dimethyl ether, Methanol synthesis and dehydration, Bi-functional
catalysts, Direct synthesis, Co-precipitated catalysts
vi
ÖZ
DİMETİL ETER SENTEZİ İÇİN ÇİFT FONKSİYONLU
NANOYAPILI YENİ KATALİZÖRLER
Çelik, Gökhan
Yüksek Lisans, Kimya Mühendisliği Bölümü
Tez Yöneticisi : Prof. Dr. Timur Doğu
Ortak Tez Yöneticisi : Prof. Dr. H. Önder Özbelge
Temmuz 2012, 196 sayfa
Fosil yakıtlarının aşırı kullanımı önümüzdeki yüzyılda önemli enerji yokluğu
problemlerine yol açabilir ve CO2 salınımıyla küresel ısınmaya neden olmaktadır.
Ulaşımdaki petrol kullanımı, toplam petrol kullanımının en büyük yüzdesini
oluşturmaktadır. Petrol dışı kaynaklardan çevre dostu alternatif motorlu taşıt
yakıtlarının geliştirilmesine yönelik çalışmalar son on yıllarda artmıştır. Araştırılan
alternatif yakıtlar içerisinde dimetil eter (DME); yüksek setan sayısı, partikül ve hava
kirletici gazların emisyonu açısından üstün özelliklere sahip olması sayesinde öne
çıkmıştır. Biyo-atıklar veya kömürün gazlaştırılması ya da doğal gazın
reformlanmasıyla elde edilen sentez gazından başlayarak DME üretimi mümkün
olabilmektedir. DME sentezi iki farklı yöntemle gerçekleştirilmektedir. Bunlardan
birincisinde önce sentez gazından metanol sentezi ve ardından üretilen metanolün
dehidrasyonu ile DME oluşumu söz konusudur. İkinci yöntemde ise methanol sentez
ve dehidrasyonlarının tek bir reaktörde aynı anda gerçekleştiği, DME‟in doğrudan
sentez gazından tek aşamada sentezi ile eldesidir. Doğrudan sentez prosesi için hem
metanol sentez hem de dehidrasyon özellikleri olan iki fonksiyonlu katalizörlere
ihtiyaç duyulmaktadır.
vii
Bu tez çalışmasında, iki basamaklı dimetil eter sentezinin metanol sentez ve
dehidrasyon fonksiyonlarında kullanılması amacıyla ve sentez gazından doğrudan
dimetil eter eldesi için iki fonksiyonlu katalizörler sentezlenmiştir. Sentezlenen
malzemelerin dışında ticari katalizörler ile de çalışmalar yürütülmüştür. Katallitik
malzemeler XRD, EDS, SEM, azot adsorplanmasıyla yüzey karakterizasyonu ve
DRIFTS teknikleri ile karakterize edilmiştir. Aktivite testleri, yüksek basınçlı sabit
yataklı akış reaktör sisteminde 50 bar basıncında ve H2:CO=50:50 ve H2:CO:
CO2=50:40:10 besleme gazı kompozisyonlarında test edilmiştir.
Zirkonyum ve alüminyum promotörleri eklenmesi, uzun bekletme süresi, 550 °C‟de
kalsinasyon sıcaklığı ve 250 °C‟de indirgenme sıcaklığı eşit kompozisyonlu CO ve
H2 içeren sentez gazından metanol eldesinde aktiviteyi artırmıştır. Çöktürme
katalizörleri genel olarak yüksek aktivite göstermişlerdir. Çöktürme yöntemiyle
hazırlanan çift fonksiyonlu katalizör, oluşan metanolü dimetil etere az oranda
dönüştürmüştür. Silikotungstik asit emdirilmiş SBA-15‟in ticari metanol reformlama
katalizörü ile karıştırılmış olarak aktivitesine bakıldığında yüksek seçicilikte dimetil
eter elde edildiği görülmüştür.
Ticari metanol sentez ve dehidrasyon katalizörlerin ve silikotungstik asit esaslı
mezogözenekli TRC-75(L) katalizörünün uygun oranda karıştırarak veya sıralı
olarak hazırlanan reaktörler ile yapılan aktivite testlerinde çok yüksek DME verimi
elde edilmiştir ve yapılan deneylerle doğrudan sentezin iki basamaklı senteze olan
üstünlüğü ispatlanmıştır. Sentez gazı içinde CO2 bulunması sadece DME verimini
artırmakla kalmamış, aynı zamanda da en önemli sera gazı olan CO2‟in kullanımında
başarılı olunmuştur. Çalışma kapsamında sentezlenen katalizörlerin sentez gazından
DME sentezinde çok umut verici oldukları görülmüştür.
Anahtar Kelimeler: Dimetil Eter, Metanol sentezi ve dehidrasyonu, İki fonksiyonlu
katalizör, Doğrudan sentez, Birlikte çöktürme katalizörleri

viii
To My Family
ix
ACKNOWLEDGEMENTS
I would like to present my sincere thanks to my supervisor Prof. Dr. Timur Doğu for
his inspiring guidance, endless support, and continuous encouragement. I also want
to thank him for his understanding and kindly attitude in every aspect. He is an
example to follow for all graduate students.
I am very grateful to my co-supervisor Prof. Dr. H. Önder Özbelge for his great help,
motivation and suggestions not only for my research but also about my future life. I
have learned very important things and got a life philosophy from him. If I was far
away from his advices for the last five years, I would have very different life style.
I would like to offer my sincere thanks to Prof. Dr. Gülşen Doğu and Prof. Dr. Tülay
Özbelge for their positive manner and support for this study. I would like to also
thank Dr. Dilek Varışlı for her early studies about DME.
I cannot pass without presenting my sincere thanks to Canan Şener. I felt her
motivation and support at any time. I want to thank my lab friend Seval Gündüz for
her helps and friendship during my studies and research colleagues Arzu Aslan,
Orkide Akgün, Ayşegül Bayat and Birce Pekmezci. Working in such an environment
was a great experience for me.
I would like to thank my friends Okan Özkök, İlker Tezsevin, Duygu Gerçeker and
Caner Hocaoğlu for their valuable friendship during my studies.
I would like to thank METU Chemical Engineering department staff; Nevzat Bekçi,
Turgut Aksakal, İsa Çağlar, Yavuz Güngör, Süleyman Nazif Kuşhan, Kemal
Yıldırım, Murtaza Oral, Mahmut Akdağ and Arap İşleyen for their endless support
x
and positive attitude. I would also like to thank METU Central Laboratory and
technical staff for the characterization analyses.
I owe special thanks to my family. It is very difficult to express in words for all the
support and encouragement they have given to me. They deserve my special and
sincerely gratitude. My very special thanks are due to my mother Serbes Çelik, my
father Ramazan Çelik and my lovely brother Volkan Çelik.
METU Scientific Research Coordination is also acknowledged for the financial
support with the research fund BAP-03-04-2011-008.
The Scientific and Technological Research Council of Turkey (TÜBİTAK) is also
acknowledged for the partial financial support under graduate scholarship of
TÜBİTAK BİDEB (2228).
xi
TABLE OF CONTENTS
ABSTRACT ................................................................................................................ iv
ÖZ ............................................................................................................................... vi
ACKNOWLEDGEMENTS ........................................................................................ ix
TABLE OF CONTENTS ............................................................................................ xi
LIST OF FIGURES ................................................................................................... xv
LIST OF TABLES .................................................................................................. xxiii
NOMENCLATURE ................................................................................................ xxvi
CHAPTERS
1. INTRODUCTION ................................................................................................... 1
2. DIMETHYL ETHER AS A CHEMICAL ............................................................... 3
3. SYNTHESIS OF DIMETHYL ETHER .................................................................. 9
3.1. DIRECT SYNTHESIS OF DIMETHYL ETHER FROM SYNTHESIS GAS 9
3.2. METHANOL SYNTHESIS ............................................................................ 13
3.3. METHANOL DEHYDRATION .................................................................... 18
4. THERMODYNAMIC ANALYSIS ....................................................................... 22
5. CATALYTIC MATERIALS ................................................................................. 30
5.1. CATALYST PREPARATION METHODS ................................................... 30
5.1.1. Precipitation and co-precipitation ............................................................. 30
5.1.2. Impregnation ............................................................................................. 34
5.1.3. Ordered mesoporous materials ................................................................. 35
5.2. CATALYST TREATMENTS ......................................................................... 38
5.2.1. Hydrothermal transformations .................................................................. 38
5.2.2. Washing .................................................................................................... 39
5.2.3. Drying ....................................................................................................... 39
5.2.4. Calcination ................................................................................................ 39
5.3. CHARACTERIZATION METHODS ............................................................ 40
xii
5.3.1. X-Ray Diffraction (XRD) ......................................................................... 40
5.3.2. Nitrogen Physisorption ............................................................................. 41
5.3.3. Scanning Electron Microscopy (SEM) ..................................................... 41
5.3.4. Energy Dispersive Spectroscopy (EDS) ................................................... 41
5.3.5. Diffuse Reflectance Infrared Fourier Transform Spectroscopy (DRIFTS
FTIR) .................................................................................................................. 42
6. EXPERIMENTAL ................................................................................................. 43
6.1. CATALYST SYNTHESIS .............................................................................. 43
6.1.1. Synthesis of Co-Precipitated Catalysts ..................................................... 43
6.1.2. Synthesis of SBA-15 and Impregnation of STA ...................................... 48
6.1.3. Dry-Physical Mixing and Sequenced Catalysts ........................................ 51
6.2. CHARACTERIZATION TECHNIQUES ...................................................... 52
6.2.1. X-Ray Diffraction (XRD) ......................................................................... 52
6.2.2. Nitrogen Physisorption ............................................................................. 52
6.2.3. Scanning Electron Microscopy (SEM) ..................................................... 53
6.2.4. Energy Dispersive Spectroscopy (EDS) ................................................... 53
6.2.5. Diffuse Reflectance Infrared Fourier Transform Spectroscopy (Drifts) Of
Pyridine Adsorption ............................................................................................ 53
6.3. REACTION SET-UP ...................................................................................... 53
7. CHARACTERIZATION RESULTS ..................................................................... 59
7.1. CHARACTERIZATION RESULTS OF CO-PRECIPITATED CATALYSTS
................................................................................................................................ 59
7.1.1. X-Ray Diffraction (XRD) ......................................................................... 59
7.1.2. Nitrogen Physisorption ............................................................................. 68
7.1.3. Energy Dispersive Spectroscopy (EDS) ................................................... 74
7.1.4. Scanning Electron Microscopy (SEM) ..................................................... 76
7.1.5. Diffuse reflectance infrared fourier transform spectroscopy of pyridine
adsorption............................................................................................................ 82
7.2. CHARACTERIZATION RESULTS OF STA IMPREGNATED SBA-15 .... 83
7.2.1. X-Ray Diffraction (XRD) ......................................................................... 83
7.2.2. Nitrogen Physisorption ............................................................................. 85
xiii
7.2.3. Diffuse reflectance infrared fourier transform spectroscopy of pyridine
adsorption............................................................................................................ 87
7.3. CHARACTERIZATION RESULTS OF COMMERCIAL γ-Al2O3
CATALYST ........................................................................................................... 87
7.3.1. X-Ray Diffraction ..................................................................................... 87
7.3.2. Nitrogen Physisorption ............................................................................. 88
7.3.3. Energy Dispersive Spectroscopy (EDS) ................................................... 89
7.3.4. Scanning Electron Microscopy (SEM) ..................................................... 90
7.3.5. Diffuse reflectance infrared fourier transform spectroscopy of pyridine
adsorption............................................................................................................ 90
7.4. CHARACTERIZATION RESULTS OF COMMERCIAL METHANOL
REFORMING CATALYST, MRC, AND METHANOL SYNTHESIS
CATALYST, MSC ................................................................................................. 91
7.4.1. X-Ray Diffraction (XRD) ......................................................................... 91
7.4.2. Nitrogen Physisorption ............................................................................. 92
7.4.3. Energy Dispersive Spectroscopy (EDS) ................................................... 94
7.4.4. Scanning Electron Microscopy (SEM) ..................................................... 94
7.4.5. Diffuse reflectance infrared fourier transform spectroscopy of pyridine
adsorption............................................................................................................ 95
8. ACTIVITY RESULTS .......................................................................................... 96
8.1. ACTIVITY RESULTS OF COMMERCIAL CATALYSTS ......................... 96
8.1.1. Activity results of MRC from Mixture-1 (CO:H2=50:50) ........................ 96
8.1.2. Activity results of MRC from Mixture-2 (CO:CO2:H2=40:10:50) ......... 100
8.1.3. Activity results of MSC from Mixture-1 (CO:H2=50:50) ...................... 104
8.2. ACTIVITY RESULTS OF PHYSICALLY MIXED CATALYSTS ............ 106
8.2.1. Activity results of TRC-75(L)-C from Mixture-1 (CO:H2=50:50) ........ 107
8.2.2. Activity results of TRC-75(L)-C from Mixture-2 (CO:CO2:H2=40:10:50)
.......................................................................................................................... 111
8.2.3. Activity results of HF-AL-C from Mixture-2 (CO:CO2:H2=40:10:50) .. 115
8.3. ACTIVITY RESULTS OF REACTOR ARRANGEMENTS ...................... 123
8.4. ACTIVITY RESULTS OF CO-PRECIPITATED CATALYSTS ................ 125
8.4.1. Activity results of co-precipitated catalysts from Mixture 1(CO:H2=50:50)
.......................................................................................................................... 125
xiv
8.4.2. Activity results of bi-functional co-precipitated catalyst, H-CZA-TOYO,
from Mixture-1 (CO:H2=50:50) ....................................................................... 153
8.5. ACTIVITY RESULTS OF STA IMPREGNATED SBA-15 ....................... 156
9. CONCLUSIONS .................................................................................................. 159
REFERENCES ......................................................................................................... 163
APPENDICES ......................................................................................................... 171
A. FUGACITY COEFFICIENTS OF SPECIES INVOLVED IN DME
SYNTHESIS ........................................................................................................ 172
B. CONVERSION AND SELECTIVITY CALCULATION .............................. 178
B1. ACTIVITY RESULTS OF TRC-75(L)-C from mixture-1 (50% H2, 50%
CO).................................................................................................................... 178
B2. ACTIVITY RESULTS OF TRC-75(L)-C FROM MIXTURE-1 (50% H2,
40% CO, 10% CO2) .......................................................................................... 182
C. PARTICLE SIZE CALCULATIONS ............................................................. 189
D. ADSORPTION-DESORPTION ISOTHERMS .............................................. 191
xv
LIST OF FIGURES
FIGURES
Figure 1. Fuels comparisons with respect to fuel quality and cleanness ..................... 6
Figure 2. The equilibrium conversion curves for reaction-3 (CO + 2H2 → CH3OH)
with respect to temperature and pressure for a feed ratio of H2:CO=1:1 ................... 26
Figure 3. The equilibrium conversion curves for reaction-1 (3CO + 3H2 →
CH3OCH3 + CO2) with respect to temperature and pressure for a feed ratio of
H2:CO=1:1 ................................................................................................................. 27
Figure 4. The equilibrium conversion curves for Reaction-2 (2CO + 4H2 →
CH3OCH3 + H2O) with respect to temperature and pressure for a feed ratio of
H2:CO=1:1 ................................................................................................................. 27
Figure 5. The equilibrium conversion curves for Reaction-1, 2, and 3 at 50 bars with
respect to temperature for a feed ratio of H2:CO=1:1 ................................................ 28
Figure 6. Preparation scheme for precipitated catalysts............................................. 31
Figure 7. Liquid crystal templating (LCT) mechanism representing two possible
formation routes of MCM-41 [57] ............................................................................. 37
Figure 8. Experimental procedure for the co-precipitated catalysts .......................... 46
Figure 9. Experimental procedure for the bi-functional............................................. 47
Figure 10. Experimental procedure for ordered mesoporous material SBA-15 ........ 49
Figure 11. Experimental procedure for STA impregnation to ................................... 50
Figure 12. High pressure experimental set-up ........................................................... 55
Figure 13. X-Ray diffraction pattern of copper and zinc containing co-precipitated
catalyst, CZ ................................................................................................................ 60
Figure 14. X-Ray diffraction patterns of copper, zinc and promoter containing co-
precipitated catalysts; CZ, without promoter; CZA, Alumina promoter; CZCe, Ceria
promoter; CZZr, Zirconia promoter. .......................................................................... 61
Figure 15. X-Ray diffraction patterns of copper, zinc and alumina containing co-
precipitated catalysts for different aging time; CZA-1 hr, aged for one hour; CZA-3
hr, aged for three hours; CZA-6hr, aged for six hours. .............................................. 63
Figure 16. X-Ray diffraction patterns of copper, zinc and alumina containing co-
precipitated catalysts for different washing conditions; CZA-Hot, washed with hot
water; CZA-Cold, washed with cold water. ............................................................... 64
Figure 17. X-Ray diffraction patterns of copper, zinc and alumina containing co-
precipitated catalysts for different calcination temperature; CZA-C550, calcined at
550 °C; CZA-C350, calcined at 350°......................................................................... 65
xvi
Figure 18. X-Ray diffraction patterns of copper, zinc and alumina containing co-
precipitated catalysts for different reduction temperature; CZA, no reduction; CZA-
R225, reduced at 225 °C; CZA-R250, reduced at 250°C; ......................................... 66
Figure 19. X-Ray diffraction patterns of bi-functional co-precipitated catalyst H-
CZA-TOYO with comparison of CZA and TOYO catalysts ..................................... 68
Figure 20. Adsorption-desorption isotherm of ........................................................... 70
Figure 21. Adsorption-Desorption Isotherm of bi-functional copper, zinc, and
alumina containing catalyst, H-CZA-TOYO. ............................................................ 73
Figure 22. Pore size distribution of bi-functional copper, zinc, and alumina
containing catalyst, H-CZA-TOYO. .......................................................................... 74
Figure 23. SEM images of copper and zinc containing co-precipitated catalyst, CZ 76
Figure 24. SEM images of copper, zinc, and alumina containing co-precipitated
catalyst, CZA.............................................................................................................. 77
Figure 25. SEM images of copper, zinc, and zirconia containing co-precipitated
catalyst, CZZr ............................................................................................................. 77
Figure 26. SEM images of copper, zinc, and ceria containing co-precipitated catalyst,
CZCe .......................................................................................................................... 78
Figure 27. SEM images of copper, zinc, and alumina containing co-precipitated
catalyst calcined at 550 °C, CZA-C550 ..................................................................... 78
Figure 28. SEM images of copper, zinc, and alumina containing co-precipitated
catalyst reduced at 225 °C, CZA-R225 ...................................................................... 79
Figure 29. SEM images of copper, zinc, and alumina containing co-precipitated
catalyst reduced at 250 °C, CZA-R250 ...................................................................... 79
Figure 30. SEM images of copper, zinc, and alumina containing co-precipitated
catalyst aged for 6 hours, CZA-6 hr ........................................................................... 80
Figure 31. SEM images of copper, zinc, and alumina containing co-precipitated
catalyst aged for 1 hour, CZA-1 hr ............................................................................ 81
Figure 32. SEM images of copper, zinc, and alumina containing co-precipitated
catalyst washed with hot water, CZA-Hot ................................................................. 81
Figure 33. SEM images of bi-functional, copper, zinc, and alumina containing co-
precipitated catalyst, H-CZA-TOYO ......................................................................... 82
Figure 34. DRIFTS spectra of CZ, CZA, and H-CZA-TOYO catalysts.................... 83
Figure 35. Low angle XRD pattern of SBA-15 ......................................................... 84
Figure 36. High angle XRD pattern of STA impregnated SBA-15. .......................... 84
Figure 37. Adsorption- desorption isotherm of SBA-15 ............................................ 86
Figure 38. Adsorption- desorption isotherm of STA@SBA-15 ................................ 86
Figure 39. DRIFTS spectra of STA impregnated SBA-15 catalyst (STA@SBA-15) 87
Figure 40. X-Ray diffraction pattern of commercial methanol.................................. 88
Figure 41. Pore size distributions of methanol dehydration catalyst TOYO ............. 89
xvii
Figure 42. Adsorption–desorption isotherm of methanol dehydration catalyst TOYO
.................................................................................................................................... 89
Figure 43. SEM images of methanol dehydration catalyst TOYO ............................ 90
Figure 44. DRIFTS spectra of methanol dehydration catalyst TOYO....................... 91
Figure 45. X-Ray diffraction patterns of methanol reforming catalyst, MRC, and
methanol synthesis catalysts, MSC. ........................................................................... 92
Figure 46. Adsorption-Desorption isotherm of commercial catalysts MRC and MSC
.................................................................................................................................... 93
Figure 47. SEM images of commercial methanol reforming catalyst, MRC............. 94
Figure 48. SEM images of commercial methanol synthesis catalyst, MSC .............. 95
Figure 49. DRIFTS spectra of commercial methanol synthesis catalyst, MSC, and
methanol reforming catalyst, MRC. ........................................................................... 95
Figure 50. Carbon monoxide conversion values obtained with methanol reforming
catalyst, MRC, (Space time of 0.24 s.gr/cc, catalyst amount: 0.2 gr, Mixture-1 feed
stream: 50% CO + 50% H2) ....................................................................................... 97
Figure 51. Product distribution obtained with methanol reforming catalyst, MRC,
(Space time of 0.24 s.gr/cc, catalyst amount: 0.2 gr, Mixture-1 feed stream: 50% CO
+ 50% H2) ................................................................................................................... 98
Figure 52. Comparison of carbon monoxide conversion values obtained with
methanol reforming catalyst, MRC, for reactant gas flow rate of 25 cc/min and 50
cc/min. (catalyst amount: 0.2 gr, Mixture-1 feed stream: 50% CO + 50% H2) ......... 99
Figure 53. Product distribution obtained with methanol reforming catalyst, MRC, for
reactant gas flow rate of 25 cc/min (Space time of 0.48 s.gr/cc, catalyst amount: 0.2
gr, Mixture-1 feed stream: 50% CO + 50% H2) ...................................................... 100
Figure 54. Comparison of carbon monoxide conversion values obtained with
methanol reforming catalyst, MRC, for the mixture-1 (50% CO + 50% H2) and
mixture-2 (40% CO, 10% CO2, 50% H2) (Space time of 0.24 s.gr/cc, catalyst
amount: 0.2 gr) ......................................................................................................... 101
Figure 55. Carbon dioxide conversion values obtained with methanol reforming
catalyst, MRC, (Space time of 0.24 s.gr/cc, catalyst amount: 0.2 gr, Mixture-2 feed
stream: 40% CO, 10% CO2, 50% H2) ...................................................................... 102
Figure 56. Product distribution obtained with methanol reforming catalyst, MRC,
which were calculated with respect to carbon monoxide at a space time of 0.24
s.gr/cc for Mixture-2: 40% CO, 10% CO2, 50% H2) ............................................... 103
Figure 57. Comparison of carbon monoxide conversion values obtained with
methanol reforming catalyst (MRC) and methanol synthesis catalyst (MSC) (space
time of 0.48 s.gr/cc, catalyst amount: 0.2 gr, mixture-1 feed stream: 50% CO + 50%
H2) ............................................................................................................................ 104
xviii
Figure 58. Product distribution obtained with methanol synthesis catalyst (MSC)
(space time of 0.48 s.gr/cc, catalyst amount: 0.2 gr, Mixture-1 feed stream: 50% CO
+ 50% H2) ................................................................................................................. 105
Figure 59. Comparison of methanol selectivities obtained with methanol reforming
catalyst (MRC) and methanol synthesis catalyst (MSC) (space time of 0.48 s.gr/cc,
catalyst amount: 0.2 gr, mixture-1 feed stream: 50% CO + 50% H2) ...................... 106
Figure 60. Carbon monoxide conversion values obtained with TRC-75(L)-C (space
time of 0.24 s.gr/cc, catalyst amount: 0.2 gr, Mixture-1 feed stream: 50% CO + 50%
H2) ............................................................................................................................ 107
Figure 61. Comparison of carbon monoxide conversion values obtained with TRC-
75(L)-C and methanol reforming catalyst (MRC) (space time of 0.24 s.gr/cc, catalyst
amount: 0.2 gr, Mixture-1 feed stream: 50% CO + 50% H2) .................................. 108
Figure 62. Product Distribution obtained with TRC-75(L)-C (space time of 0.48
s.gr/cc, catalyst amount: 0.2 gr, Mixture-1 feed stream: 50% CO + 50% H2) ......... 109
Figure 63. Comparison of carbon monoxide conversion values obtained with TRC-
75(L)-C and methanol reforming catalyst(MRC) (space time of 0.24 s.gr/cc, catalyst
amount: 0.2 gr, Mixture-1 feed stream: 50% CO + 50% H2) .................................. 111
Figure 64. Carbon dioxide conversion values obtained with TRC-75(L)-C (space
time of 0.24 s.gr/cc, catalyst amount: 0.2 gr, Mixture-2 feed stream: 40% CO + 10%
CO2 + 50% H2) ......................................................................................................... 112
Figure 65. Carbon monoxide conversion values obtained with TRC-75(L)-C (space
time of 0.24 s.gr/cc, catalyst amount: 0.2 gr, Mixture-2 feed stream: 40% CO+ 10%
CO2 + 50% H2) ......................................................................................................... 113
Figure 66. Product distribution obtained with TRC-75(L)-C (space time of 0.24
s.gr/cc, catalyst amount: 0.2 gr, Mixture-2 feed stream: 40% CO + 10% CO2 + 50%
H2) ............................................................................................................................ 114
Figure 67. Comparison of product distributions obtained with TRC-75(L)-C for
Mixture-1( 50% CO + 50% H2) and Mixture-2 (40% CO + 10% CO2 + 50% H2)
(space time of 0.24 s.gr/cc, catalyst amount: 0.2 gr)................................................ 115
Figure 68. Carbon monoxide conversion values obtained with HF-AL-C (space time
of 0.24 s.gr/cc, catalyst amount: 0.2 gr, Mixture-2 feed stream: 40% CO + 10% CO2
+ 50% H2) ................................................................................................................. 116
Figure 69. Product distributions obtained with HF-AL-C (space time of 0.24 s.gr/cc,
catalyst amount: 0.2 gr, Mixture-2 feed stream: 40% CO + 10% CO2 + 50% H2) .. 117
Figure 70. Comparison of carbon monoxide conversion values obtained with acidity
increased catalyst (HF(40)-AL(60)-C) and equally weighted catalyst (HF(50)-
AL(50)-C) (space time of 0.24 s.gr/cc, catalyst amount: 0.2 gr, Mixture-2 feed
stream: 40% CO + 10% CO2 + 50% H2) .................................................................. 118
xix
Figure 71. Carbon dioxide conversion values obtained with HF(40)-AL(60)-C (space
time of 0.24 s.gr/cc, catalyst amount: 0.2 gr, Mixture-2 feed stream: 40% CO + 10%
CO2 + 50% H2) ......................................................................................................... 119
Figure 72. Product distributions obtained with acidity increased HF(40)-AL(60)-C
catalyst (space time of 0.24 s.gr/cc, catalyst amount: 0.2 gr, Mixture 2 Feed Stream:
40% CO + 10% CO2 + 50% H2) ............................................................................... 120
Figure 73. Overall product distributions defined with respect to converted CO&CO2
to products and obtained with acidity increased HF(40)-AL(60)-C catalyst (space
time of 0.24 s.gr/cc, catalyst amount: 0.2 gr, Mixture-2 Feed stream: 40% CO + 10%
CO2 + 50% H2) ......................................................................................................... 121
Figure 74. Comparison of DME selectivities obtained with acidity increased HF(40)-
AL(60)-C catalyst and equally weighted catalyst HF(50)-AL(50)-C (space time of
0.24 s.gr/cc, catalyst amount: 0.2 gr, Mixture-2 Feed stream: 40% CO + 10% CO2 +
50% H2) .................................................................................................................... 122
Figure 75. Comparison of CO conversions obtained with acidity increased HF(40)-
AL(60)-C catalyst and equally weighted catalyst HF(50)-AL(50)-C (space time of
0.24 s.gr/cc, catalyst amount: 0.2 gr, Mixture-2 Feed stream: 40% CO + 10% CO2 +
50% H2) .................................................................................................................... 122
Figure 76. Comparison of carbon monoxide conversion values obtained with mixed
reactor bed (TRC-75(L)-C) and sequential reactor bed (TRC-75(L)-S) (space time of
0.24 s.gr/cc, catalyst amount: 0.2 gr, Mixture-2 feed stream: 40% CO + 10% CO2 +
50% H2) .................................................................................................................... 124
Figure 77. Comparison of DME selectivities obtained with mixed reactor bed (TRC-
75(L)-C) and sequential reactor bed (TRC-75(L)-S) (space time of 0.24 s.gr/cc,
catalyst amount: 0.2 gr, Mixture-2 feed stream: 40% CO + 10% CO2 + 50% H2) .. 125
Figure 78. Carbon monoxide conversion values obtained with copper and zinc
containing co-precipitated catalyst, CZ, (Space time of 0.48 s.gr/cc, catalyst amount:
0.2 gr, Mixture-1 feed stream: 50% CO + 50% H2) ................................................ 126
Figure 79. Product distribution obtained with copper zinc containing co-precipitated
catalyst, CZ, (Space time of 0.48 s.gr/cc, catalyst amount: 0.2 gr, Mixture-1 feed
stream: 50% CO + 50% H2) ..................................................................................... 127
Figure 80. The equilibrium conversion curve for reaction-13 (2CO → CO2 + C(s))
with respect to temperature at 50 bar ....................................................................... 128
Figure 81. Comparison of carbon monoxide conversion values obtained with copper,
zinc and promoter containing co-precipitated catalyst; CZ, without promoter; CZA,
Aluminum promoter; CZCe, Ceria promoter; CZZr, Zirconia promoter. (Space time
of 0.48 s.gr/cc, catalyst amount: 0.2 gr, Mixture-1 feed stream: 50% CO + 50% H2)
.................................................................................................................................. 129
xx
Figure 82. Product distribution obtained with copper, zinc, and zirconium containing
co-precipitated catalyst, CZZr, (Space time of 0.48 s.gr/cc, catalyst amount: 0.2 gr,
Mixture-1 feed stream: 50% CO + 50% H2) ............................................................ 130
Figure 83. Methanol and CO2 selectivity changes of copper, zinc, and zirconium
containing co-precipitated catalyst, CZZr with respect to time at 200 °C (Space time
of 0.48 s.gr/cc, catalyst amount: 0.2 gr, Mixture-1 feed stream: 50% CO + 50% H2)
.................................................................................................................................. 131
Figure 84. Product distribution obtained with copper, zinc, and aluminum containing
co-precipitated catalyst, CZA, (Space time of 0.48 s.gr/cc, catalyst amount: 0.2 gr,
Mixture-1 feed stream: 50% CO + 50% H2) ............................................................ 132
Figure 85. Product distribution obtained with copper, zinc, and ceria containing co-
precipitated catalyst, CZCe, (Space time of 0.48 s.gr/cc, catalyst amount:0.2 gr,
Mixture-1 feed stream: 50% CO + 50% H2) ............................................................ 133
Figure 86. Comparison of carbon monoxide conversions obtained with CZA aged for
1 hour, 3 hours and 6 hours, (Space time of 0.48 s.gr/cc, catalyst amount:0.2 gr,
Mixture-1 feed stream: 50% CO + 50% H2) ............................................................ 135
Figure 87. Product distribution obtained with CZA aged for 1 hour (Space time of
0.48 s.gr/cc, catalyst amount: 0.2 gr, Mixture-1 feed stream: 50% CO + 50% H2) . 136
Figure 88. Product distribution obtained with CZA aged for 6 hours (Space time of
0.48 s.gr/cc, catalyst amount: 0.2 gr, Mixture-1 feed stream: 50% CO + 50% H2) . 137
Figure 89. Comparison of methanol selectivities obtained with CZA aged for 1 hour,
3 hours and 6 hours, (Space time of 0.48 s.gr/cc, catalyst amount:0.2 gr, Mixture-1
feed stream: 50% CO + 50% H2) ............................................................................. 138
Figure 90. Comparison of carbon monoxide conversions obtained with CZA catalyst
washed with hot deionized water (CZA-Hot) and washed with cold deionized water
(CZA-Cold) (Space time of 0.48 s.gr/cc, catalyst amount:0.2 gr, Mixture-1 feed
stream: 50% CO + 50% H2) ..................................................................................... 140
Figure 91. Product distribution obtained with CZA catalyst washed with hot
deionized water (CZA-Hot) (Space time of 0.48 s.gr/cc, catalyst amount: 0.2 gr,
Mixture-1 feed stream: 50% CO + 50% H2) ............................................................ 141
Figure 92. Comparison of methanol selectivities obtained with CZA catalyst washed
with hot deionized water (CZA-Hot) and washed with cold deionized water (CZA-
Cold) (Space time of 0.48 s.gr/cc, catalyst amount:0.2 gr, Mixture-1 feed stream:
50% CO + 50% H2) .................................................................................................. 142
Figure 93. Comparison of carbon monoxide conversions obtained with CZA catalyst
calcined at 550 °C (CZA-C550) and at 350 °C (CZA-C350). (Space time of 0.48
s.gr/cc, catalyst amount: 0.2 gr, Mixture-1 feed stream: 50% CO + 50% H2) ......... 143
Figure 94. Product distribution obtained with CZA calcined at 550 °C (CZA-C550)
(Space time of 0.48 s.gr/cc, catalyst amount: 0.2 gr, Mixture-1 feed stream: 50% CO
+ 50% H2) ................................................................................................................. 144
xxi
Figure 95. Comparison of methanol selectivities obtained with CZA catalyst calcined
at 550 °C (CZA-C550) and at 350 °C (CZA-C350). (Space time of 0.48 s.gr/cc,
catalyst amount: 0.2 gr, Mixture-1 feed stream: 50% CO + 50% H2) ..................... 145
Figure 96. Comparison of carbon monoxide conversions obtained with CZA catalyst
reduced at 250 °C (CZA-R550) and no-reduced catalyst (Space time of 0.48 s.gr/cc,
catalyst amount:0.2 gr, Mixture-1 feed stream: 50% CO + 50% H2) ...................... 147
Figure 97. Product distribution obtained with CZA catalyst reduced at 250 °C (CZA-
R550) (Space time of 0.48 s.gr/cc, catalyst amount: 0.2 gr, Mixture-1 feed stream:
50% CO + 50% H2) .................................................................................................. 148
Figure 98. Comparison of methanol selectivities obtained with CZA catalyst reduced
at 250 °C (CZA-R550) and no-reduced catalyst (Space time of 0.48 s.gr/cc, catalyst
amount:0.2 gr, Mixture-1 feed stream: 50% CO + 50% H2) ................................... 149
Figure 99. Comparison of carbon monoxide conversions obtained with co-
precipitated catalyst and commercial methanol synthesis catalyst (MSC) (Space time
of 0.48 s.gr/cc, catalyst amount: 0.2 gr, Mixture-1 feed stream: 50% CO + 50% H2)
.................................................................................................................................. 150
Figure 100. Variation of methanol selectivities over co-precipitated catalysts and
commercial methanol synthesis catalyst (MSC) (Space time of 0.48 s.gr/cc, catalyst
amount: 0.2 gr, Mixture-1 feed stream: 50% CO + 50% H2) .................................. 151
Figure 101. Variation of methanol yields over co-precipitated catalysts and
commercial methanol synthesis catalyst (MSC) (Space time of 0.48 s.gr/cc, catalyst
amount: 0.2 gr, Mixture-1 feed stream: 50% CO + 50% H2) .................................. 152
Figure 102. Comparison of carbon monoxide conversions obtained with bi-functional
co-precipitated catalyst H-CZA-TOYO copper, zinc, and aluminum containing co-
precipitated catalyst CZA (Space time of 0.48 s.gr/cc, catalyst amount: 0.2 gr,
Mixture-1 feed stream: 50% CO + 50% H2) ............................................................ 153
Figure 103. Product distribution obtained with H-CZA-TOYO catalyst (Space time
of 0.48 s.gr/cc, catalyst amount: 0.2 gr, Mixture-1 feed stream: 50% CO + 50% H2)
.................................................................................................................................. 154
Figure 104. Comparison of carbon monoxide conversions obtained with methanol
reforming catalyst and STA impregnated SBA-15 catalyst, HF-STBA-C (space time
of 0.48 s.gr/cc, catalyst amount: 0.2 gr, Mixture-1 feed stream: 50%CO +50%H2) 156
Figure 105. Product distributions obtained with HF-STBA-C catalyst (space time of
0.48 s.gr/cc, catalyst amount: 0.2 gr, Mixture-1=50%CO +50%H2) ....................... 157
Figure 106. Adsorption desorption isotherm of copper and zinc containing co-
precipitated catalyst, CZ........................................................................................... 191
Figure 107. Adsorption desorption isotherm of copper, zinc, and alumina containing
co-precipitated catalyst, CZA................................................................................... 192
Figure 108. Adsorption desorption isotherm of copper, zinc, and zirconia containing
co-precipitated catalyst, CZZr .................................................................................. 192
xxii
Figure 109. Adsorption desorption isotherm of copper, zinc, and ceria containing co-
precipitated catalyst, CZCe ...................................................................................... 193
Figure 110. SEM images of copper, zinc, and alumina containing co-precipitated
catalyst calcined at 550 °C, CZA-C550 ................................................................... 193
Figure 111. Adsorption desorption isotherm of copper, zinc, and alumina containing
co-precipitated catalyst reduced at 225 °C, CZA-R225 ........................................... 194
Figure 112. Adsorption desorption isotherm of copper, zinc, and alumina containing
co-precipitated catalyst reduced at 250 °C, CZA-R250 ........................................... 194
Figure 113. Adsorption desorption isotherm of copper, zinc, and alumina containing
co-precipitated catalyst aged for 6 hours, CZA-6 hr ................................................ 195
Figure 114. Adsorption desorption isotherm of copper, zinc, and alumina containing
co-precipitated catalyst aged for 1 hour, CZA-1 hr ................................................. 195
Figure 115. Adsorption desorption isotherm of copper, zinc, and alumina containing
co-precipitated catalyst washed with hot water, CZA-Hot ...................................... 196
Figure 116. Adsorption desorption isotherm of bi-functional, copper, zinc, and
alumina containing co-precipitated catalyst, H-CZA-TOYO .................................. 196
xxiii
LIST OF TABLES
TABLES
Table 1. Comparison of Dimethyl Ether and Other Alternative Fuels‟ Physical
Properties ..................................................................................................................... 5
Table 2. The molar heat capacity coefficients of species........................................... 23
Table 3. Standard enthalpies and gibbs energies of formation at 298.15 K for one
mole of each substance from its elements in gas phase [49]...................................... 24
Table 4. The inlet flow rates and equilibrium composition ....................................... 25
Table 5. Nomenclature for co-precipitated catalysts.................................................. 48
Table 6. Temperature Program of Gas Chromatograph ............................................. 56
Table 7. Calibration Factors and Retention Times of Gas Chromatograph ............... 56
Table 8. Particle sizes of copper, zinc and promoter containing co-precipitated
catalysts; CZ, without promoter; CZA, Alumina promoter; CZCe, Ceria promoter;
CZZr, Zirconia promoter. ........................................................................................... 62
Table 9. Particle sizes of copper, zinc and alumina containing co-precipitated
catalysts for different aging time; CZA-1 hr, aged for one hour; CZA-3 hr, aged for
three hours; CZA-6hr, aged for six hours. ................................................................. 63
Table 10. Particle sizes of copper, zinc and alumina containing co-precipitated
catalysts for different calcination temperature; CZA-C550, calcined at 550 °C; CZA-
C350, calcined at 350 °C ............................................................................................ 65
Table 11. Particle sizes of copper, zinc and alumina containing co-precipitated
catalysts for different reduction temperature; CZA, no reduction; CZA-R225,
reduced at 225 °C; CZA-R250, reduced at 250°C. .................................................... 67
Table 12. Particle sizes of bi-functional co-precipitated catalyst H-CZA-TOYO ..... 68
Table 13. Nitrogen physisorption results of co-precipitated catalysts ....................... 69
Table 14. Nitrogen physisorption results of copper, zinc and promoter containing co-
precipitated catalysts; CZ, without promoter; CZA, Alumina promoter; CZCe, Ceria
promoter; CZZr, Zirconia promoter. .......................................................................... 70
Table 15. Nitrogen physisorption results of copper, zinc and alumina containing co-
precipitated catalysts for different aging time; CZA-1 hr, aged for one hour; CZA-3
hr, aged for three hours; CZA-6hr, aged for six hours. .............................................. 71
Table 16. Nitrogen physisorption results of copper, zinc and alumina containing co-
precipitated catalysts for different washing conditions; CZA-Hot, washed with hot
water; CZA-Cold, washed with cold water. ............................................................... 71
xxiv
Table 17. Nitrogen physisorption results of copper, zinc and alumina containing co-
precipitated catalysts for different calcination temperature; CZA-C550, calcined at
550 °C; CZA-C350, calcined at 350 °C ..................................................................... 72
Table 18. Nitrogen physisorption results of copper, zinc and alumina containing co-
precipitated catalysts for different reduction temperature; CZA, no reduction; CZA-
R225, reduced at 225 °C; CZA-R250, reduced at 250°C. ......................................... 73
Table 19. Energy dispersive spectroscopy results of co-precipitated catalysts ......... 75
Table 20. Nitrogen physisorption results of SBA-15 and STA@SBA-15 ................. 85
Table 21. Particle sizes of methanol reforming catalyst, MRC, and methanol
synthesis catalysts, MSC. ........................................................................................... 92
Table 22. Nitrogen physisorption results of MRC and MSC ..................................... 93
Table 23. EDS results of MRC and MSC .................................................................. 94
Table 24. Overall selectivities obtained with methanol reforming catalyst, MRC,
which were calculated with respect to converted CO&CO2 at temperature of 250 °C
and a space time of 0.24 s.gr/cc for Mixture-2: 40% CO, 10% CO2, 50% H2) ...... 103
Table 25. Comparison of carbon monoxide conversion, methanol selectivity and
methanol yield for co-precipitated catalysts at 250 °C and 275 °C (Space time of 0.48
s.gr/cc, catalyst amount: 0.2 gr, Mixture-1 feed stream: 50% CO + 50% H2) ......... 134
Table 26. Comparison of carbon monoxide conversion, methanol selectivity and
methanol yield for different time aged co-precipitated catalysts at 250 °C and 275°C
(Space time of 0.48 s.gr/cc, catalyst amount:0.2 gr, Mixture-1 feed stream: 50% CO
+ 50% H2) ................................................................................................................. 139
Table 27. Comparison of methanol yields obtained with copper, zinc and alumina
based co-precipitated catalyst calcined at 550 °C (CZA-C550) and at 350 °C (CZA-
C350). (Space time of 0.48 s.gr/cc, catalyst amount: 0.2 gr, Mixture-1 feed stream:
50% CO + 50% H2) .................................................................................................. 146
Table 28. Comparison of methanol yields obtained with CZA catalyst reduced at 250
°C (CZA-R550) and no-reduced catalyst (Space time of 0.48 s.gr/cc, catalyst
amount:0.2 gr, Mixture-1 feed stream: 50% CO + 50% H2) ................................... 149
Table 29. Fugacity coefficients of the species involved in DME synthesis calculated
by Peng Robinson equation of state at 1 bar ............................................................ 173
Table 30. Fugacity coefficients of the species involved in DME synthesis calculated
by Peng Robinson equation of state at 10 bar .......................................................... 174
Table 31. Fugacity coefficients of the species involved in DME synthesis calculated
by Peng Robinson equation of state at 30 bar .......................................................... 175
Table 32. Fugacity coefficients of the species involved in DME synthesis calculated
by Peng Robinson equation of state at 50 bar .......................................................... 176
Table 33. Fugacity coefficients of the species involved in DME synthesis calculated
by Peng Robinson equation of state at 70 bar .......................................................... 177
Table 34. Average area values of chemicals obtained from GC analyses ............... 179
xxv
Table 35. Respective mole numbers of chemicals obtained from GC analyses ...... 179
Table 36. Total numbers of CO fed to system and CO conversions ........................ 180
Table 37. Product selectivities defined with respect to ............................................ 181
Table 38. DME selectivity, conversion, and product yields .................................... 182
Table 39. Average area values of chemicals obtained from GC analyses ............... 183
Table 40. Respective mole numbers of chemicals obtained from GC analyses ...... 183
Table 41. Total numbers of carbon, CO, and CO2 fed to system ............................. 185
Table 42. Product selectivities defined with respect to ............................................ 186
Table 43. CO2 conversion with respect to temperature............................................ 186
Table 44. Product selectivities defined with respect to ............................................ 188
Table 45: Particle sizes for metals and metal oxides calculated from Scherrer‟s
equation .................................................................................................................... 190
xxvi
NOMENCLATURE
Cp: Heat Capacity (J/mol.K)
DME: Dimethyl Ether
DRIFTS: Diffuse Reflectance Infrared Fourier Transform Spectroscopy
EDS: Energy Dispersive Spectroscopy
ETOH: Ethanol
f: Fugacity (bar)
F: Molar flow rate (mol/hr)
FA: Formic Acid
G: Gibbs Free Energy (kJ/mol)
H: Enthalpy (kJ/mol)
IUPAC: International Union of Pure and Applied Chemistry
K: Equilibrium Constant
MW: Molecular weight (g/mol)
MCM: Mobil Composition of Matter
MeOH: Methanol
n: Mole
P: Pressure (bar)
Q: Volumetric flow rate (ml/min)
R: Gas constant (8.314 J/mol.K)
S: Selectivity
SBA: Santa Barbara Amorphous
SEM: Scanning Electron Microscopy
T: Temperature (°C)
X: Conversion
XRD: X-Ray Diffraction
y: Molar composition
Y:Yield
1
CHAPTER 1
INTRODUCTION
1. INTRODUCTION
Fossil fuels have been used extensively as our major energy source for the last
century. Their extensive use and fast depletion of reserves may lead to the energy
shortage in near future since they are not renewable in the human time scale [1].
Furthermore, carbon dioxide emission upon the fossil fuel use is of great importance
due to the global warming. Fast depletion of fossil fuels and global warming issues
have initiated new researches on non-petroleum based, environmentally friendly
alternative fuel. Dimethyl ether (DME) has attracted the attention of researchers due
to its benign characteristics.
DME is a benign chemical in terms of good burning characteristics and
environmentally friendly properties. It can be used for various important
applications. Physical and fuel properties of DME are given in Chapter 2. In this
Chapter, it has been compared with other alternate fuels such as alcohols (methanol,
ethanol), natural gas (methane), LPG (propane, butane), diesel, and gasoline.
Application areas of DME are also given in this chapter. On the other hand,
disadvantages of DME are mentioned and possible solutions are also proposed.
DME can be produced by two processes from the synthesis gas. In the first one,
methanol formation from the synthesis gas followed by methanol dehydration step.
In the second process, methanol synthesis and dehydration occur simultaneously
within the reactor at the same time. For this reason, bi-functional catalyst must have
two active sites. One site is responsible from methanol synthesis and copper and zinc
2
containing catalysts function very well in methanol synthesis. Other site is
responsible from methanol dehydration and acidic catalysts such as γ-Al2O3,
aluminum silicates, and zeolites function very well in methanol dehydration.
Information about the production routes and catalytic literature review are given in
Chapter 3.
In the DME synthesis, amount of produced methanol is very important since it will
be converted to DME. However, methanol synthesis is a highly exothermic reaction
with thermodynamical limitations. Therefore choice of operating parameters is very
significant. In Chapter 4, thermodynamic analyses are conducted to determine to
operating parameters. Equilibrium conversion of methanol synthesis reaction and
direct DME synthesis reactions are plotted with respect to temperature and pressure.
In Chapter 5, catalysts preparation methods, catalyst treatments and characterization
techniques are explained in principal. Precipitated catalysts, impregnated catalysts
and ordered molecular materials are basically reviewed. Importance of the catalyst
treatments emphasized with characterization methods.
Chapter 6 presents experimental procedures concerning the synthesis of novel
materials. Characterization instruments and operating procedures of characterization
techniques are presented. In addition, high pressure experimental set-up is explained
in detail with reactor properties.
In Chapter 7, activity results of synthesized and commercial catalysts are given and
in Chapter 8, activity results are illustrated. In the activity test results, conversions
and selectivities are investigated with respect to temperature. Finally, conclusions are
given in Chapter 9.
3
CHAPTER 2
DIMETHYL ETHER AS A CHEMICAL
2. DIMETHYL ETHER AS A CHEMICAL
The vast amount of energy needs of the Earth has been covered by the fossil fuels,
starting with coal, petroleum oil, and natural gas. These fossil fuels have been used in
the last century extensively resulting in the today‟s advanced world, technology and
prosperity. However, fossil fuels are not infinite and being depleted rapidly. Their
use is limited with what we have as resources since fossil fuels are not renewable on
the human time scale [1].
One of the most important problems with the fossil fuels is the carbon dioxide
emission. Since the fossil fuels are carbon containing materials, carbon dioxide
which is the major greenhouse gas contributing to the global warming is released to
atmosphere upon combustion. Among the fossil fuels, excessive use comes from
transportation. Transportation constitutes 57% of oil use in the world. At this rate of
use, rapid depletion for transportation can cease the synthesis of many of the oil
based petrochemical products. Oil is too valuable to be burned for transportation [2].
If humanity keeps excessive use of fossil fuels as their major energy source, fast
depletion can result in the significant shortage of energy problems in the coming
century. If current consumption rates continue, fossil fuels will be depleted to a large
extent. In addition to this, greenhouse effect due to the excessive carbon dioxide
emissions could result in devastating impacts on the world. For these reasons,
researches on seeking for non-petroleum based alternative fuels have started. Among
4
the alternative fuels that can replace petroleum based fuels, dimethyl ether (DME)
can be considered as the best candidate.
Dimethyl ether, also known as methoxy methane, is the simplest ether having a
chemical formula of CH3OCH3. DME is in the gas form at standard temperature and
pressure and can be liquefied at 6 atm or -25 °C. It is volatile but non-toxic, non-
carcinogenic, non-teratogenic, and non-mutagenic. It burns with a visible blue flame
and it has sweet ether like odor [3].
DME can be synthesized in at least two minimum steps. First step is converting fossil
fuels including natural gas or coal and renewable materials (biomass, waste and
agricultural products) into the synthesis gas. As it can be seen, there are several
feedstocks for the DME synthesis. Therefore, DME synthesis is not limited to the
one feedstock. Second step is transforming syngas to DME either by conventional
methanol synthesis and dehydration or by direct synthesis from syngas [3,4].
Synthesis gas is composed of carbon monoxide, carbon dioxide and hydrogen. Use
of carbon dioxide containing syngas in the DME synthesis is very promising since it
is an excellent solution candidate for global warming and depletion of oil reserves.
By this way, carbon dioxide can be converted to the valuable non-petroleum based
fuel DME [2].
For the fuel characteristics, which are given in Table 1, DME has a cetane number of
60 which is higher than the conventional diesel fuel whose cetane number is around
50. Cetane number is the combustion characteristic of diesel fuel indicating the auto
ignition property of the fuel under high temperature and high pressure. Ignition point
of DME is also very close to the ignition point of diesel fuel. High cetane number,
low boiling point of DME (-25 °C) and high oxygen content (35 wt%) are important
fuel characteristics allowing fast vaporization and smokeless operation. DME
combustion does not produce soot. In addition, DME fueled diesel engines are
quieter than the conventional diesel fuel fueled cars. There is no SOx emission
coming from DME use since DME is sulfur free chemical and NOx emission is also
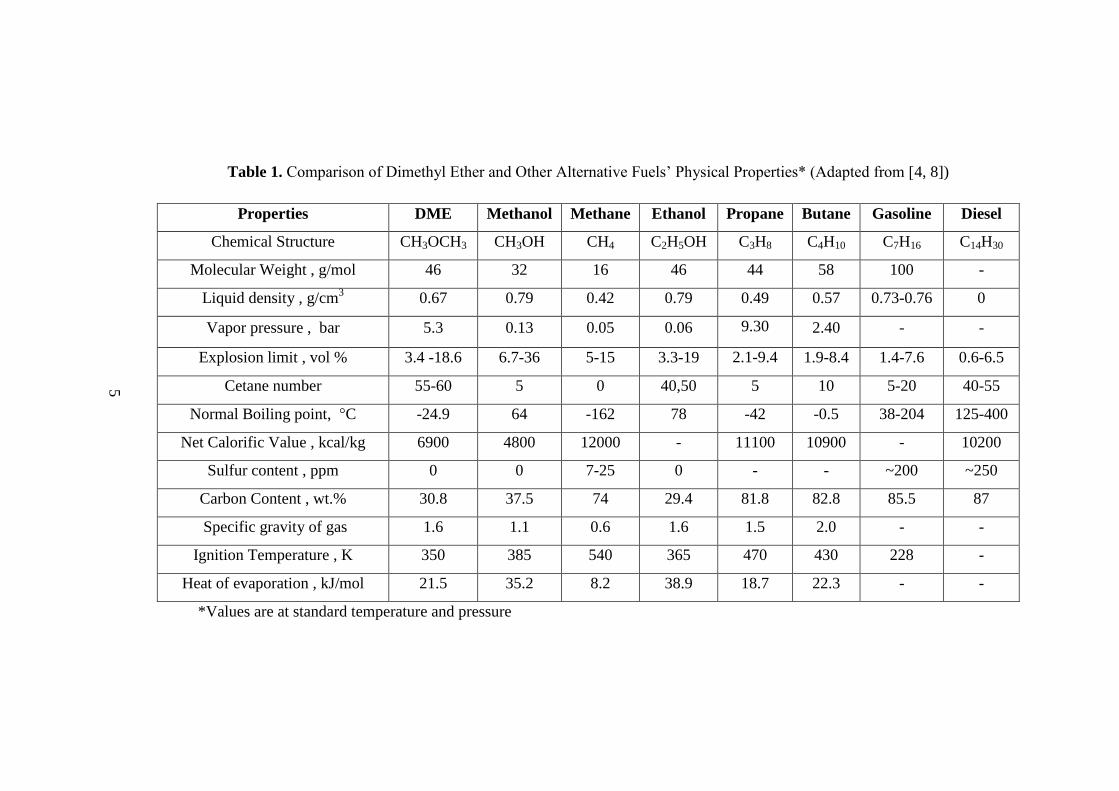
5
Table 1. Comparison of Dimethyl Ether and Other Alternative Fuels‟ Physical Properties* (Adapted from [4, 8])
Properties DME Methanol Methane Ethanol Propane Butane Gasoline Diesel
Chemical Structure CH3OCH3 CH3OH CH4 C2H5OH C3H8 C4H10 C7H16 C14H30
Molecular Weight , g/mol 46 32 16 46 44 58 100 -
Liquid density , g/cm3 0.67 0.79 0.42 0.79 0.49 0.57 0.73-0.76 0
Vapor pressure , bar 5.3 0.13 0.05 0.06 9.30 2.40 - -
Explosion limit , vol % 3.4 -18.6 6.7-36 5-15 3.3-19 2.1-9.4 1.9-8.4 1.4-7.6 0.6-6.5
Cetane number 55-60 5 0 40,50 5 10 5-20 40-55
Normal Boiling point, °C -24.9 64 -162 78 -42 -0.5 38-204 125-400
Net Calorific Value , kcal/kg 6900 4800 12000 - 11100 10900 - 10200
Sulfur content , ppm 0 0 7-25 0 - - ~200 ~250
Carbon Content , wt.% 30.8 37.5 74 29.4 81.8 82.8 85.5 87
Specific gravity of gas
1.6 1.1 0.6 1.6 1.5 2.0 - -
Ignition Temperature , K 350 385 540 365 470 430 228 -
Heat of evaporation , kJ/mol 21.5 35.2 8.2 38.9 18.7 22.3 - -
*Values are at standard temperature and pressure
aaaaaaaaaaaaaaaaaaaaaaaaaaaaaaaaaaaaaaaaaaaaaa
aaaaaaaaaaaaaaaaaaaaaaaaaaaaaaaaaaaaaaaaaaaaaa
5
6
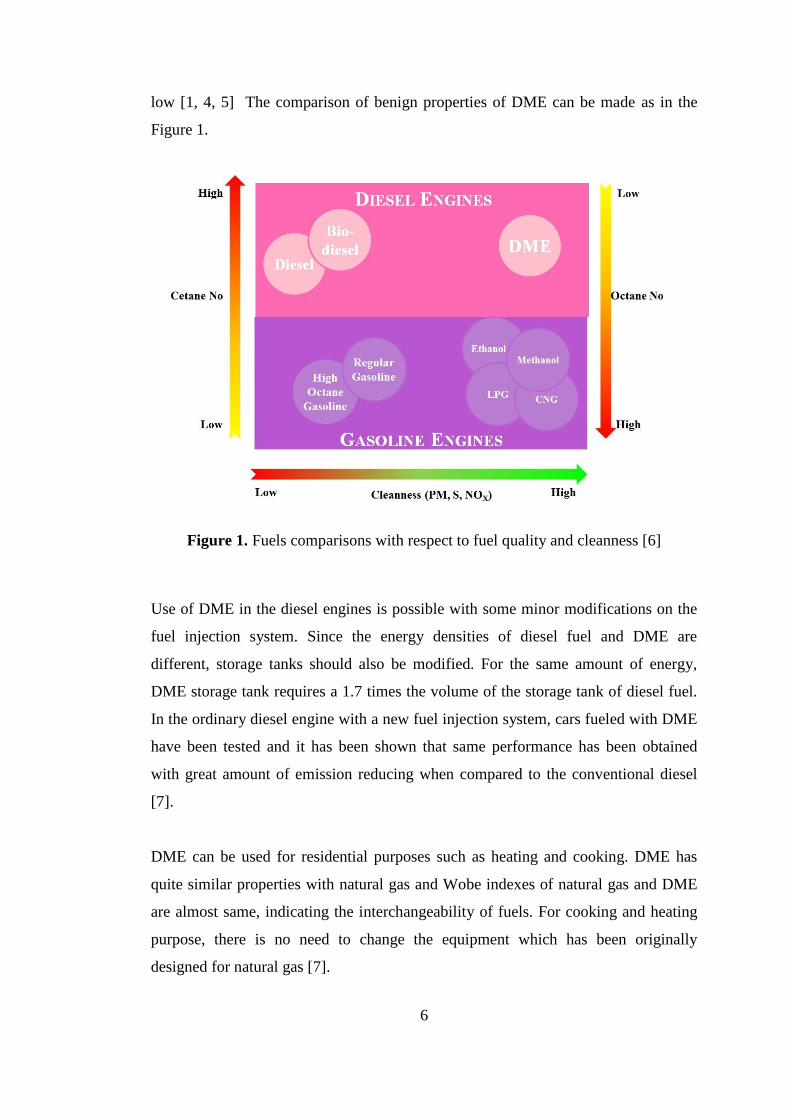
low [1, 4, 5] The comparison of benign properties of DME can be made as in the
Figure 1.
Figure 1. Fuels comparisons with respect to fuel quality and cleanness [6]
Use of DME in the diesel engines is possible with some minor modifications on the
fuel injection system. Since the energy densities of diesel fuel and DME are
different, storage tanks should also be modified. For the same amount of energy,
DME storage tank requires a 1.7 times the volume of the storage tank of diesel fuel.
In the ordinary diesel engine with a new fuel injection system, cars fueled with DME
have been tested and it has been shown that same performance has been obtained
with great amount of emission reducing when compared to the conventional diesel
[7].
DME can be used for residential purposes such as heating and cooking. DME has
quite similar properties with natural gas and Wobe indexes of natural gas and DME
are almost same, indicating the interchangeability of fuels. For cooking and heating
purpose, there is no need to change the equipment which has been originally
designed for natural gas [7].
7
There are several similar properties of DME with LPG. DME can be handled in a
safe manner as LPG and minor changes are necessary in the storage and distribution.
With these minor changes, there will be no need of investment on the infrastructure
since existing LPG refilling stations can also be used for DME refilling. This makes
the use of DME as economically feasible since building a new infrastructure requires
time and large amount of capital [4]. DME can also be blended with LPG (up to
20%) to use in the residential home heating and cooking without modifications to the
existing equipment and distribution [9].
Use of DME as a starting raw material for the synthesis of olefins is also possible in
which methanol has been already used since enthalpy of DME is lower than the
enthalpy of methanol. By this way, heat of reaction in which DME is raw material
could be lowered. In addition to this, transformation of DME into the olefins is
important since olefins are the basic raw materials of the petrochemical industry [1].
DME has been used as propellant in consumer applications such as personal care,
paints and finishes, insect control, etc. By these uses, DME has replaced the harmful
chloroluorocarbon gases which contribute to the ozone depletion in the upper
atmosphere [10].
DME can also be used in fuel cells and is considered to be one of the best alternate
fuels in portable fuel cells. Unlike the other liquid fuels, DME is free from the
disadvantages of low performance of ethanol, high corrosion of formic acid and
toxicity of methanol. In addition to these, DME has smaller dipole moment which
decreases the crossover of it from anode side to cathode side and complete oxidation
is possible with a minimum kinetic energy loss since there is no C-C bond in DME.
When DME is used as fuel in fuel cells, theoretical fuel requirements decreased since
DME has high electron transfer number [11].
DME possesses some drawback regarding to the physical characteristics. Viscosity
of the DME is lower than the commercial diesel by a factor of 20. This could result
in the leakage in fuel injectors and pumps. Lubrication issues are another handicap of

8
DME. In the solution of these problems, additives could be used to increase the
lubricity. Moreover, additives used in the commercial diesel fuels have been also
used in the DME as a lubricity enhancer [4].
9
CHAPTER 3
SYNTHESIS OF DIMETHYL ETHER
3. SYNTHESIS OF DIMETHYL ETHER
In this chapter, a literature survey on the production routes of dimethyl ether and
methanol is given with the highlights from the catalytic material development on
direct DME synthesis, methanol synthesis, and methanol dehydration.
3.1. DIRECT SYNTHESIS OF DIMETHYL ETHER FROM SYNTHESIS GAS
In dimethyl ether synthesis, two minimum steps are necessary. First step is
converting fossil fuels including natural gas, coal and renewable materials (biomass,
waste and agricultural products) into the synthesis gas. There are several feedstocks
for DME synthesis. Therefore, DME synthesis is not limited to the one feedstock [3].
After syngas is obtained, it is converted to DME. Conversion to DME could be
accomplished in two ways. One way is the conventional two-step process of DME
synthesis in which methanol is synthesized from synthesis gas, followed by methanol
dehydration at different reactor. Other way is the direct synthesis of DME in one step
from the synthesis gas. Direct synthesis of DME is gaining importance because of its
thermodynamical and economical properties [12].
In the direct synthesis of dimethyl ether from the synthesis gas, there are mainly two
overall reactions, reaction-1 and reaction-2. Methanol synthesis from the synthesis
gas is given with reaction-3 and methanol dehydration is given with reaction-4.
Reaction-1 is a combination of reactions 3, 4, and 5 and reaction-2 is a combination
10
of reactions 3 and 4 [13]. Reaction-5 is the water gas shift reaction which occurs very
fast on the copper-zinc based catalyst and overall direct synthesis of DME reaction
turns into reaction-1 [14].
3CO + 3H2 → CH3OCH3 + CO2 ΔHrxn = -246 kJ/mol [1]
2CO + 4H2 → CH3OCH3 + H2O ΔHrxn = -205 kJ/mol [2]
CO + 2H2 → CH3OH ΔHrxn = -90 kJ/mol [3]
2CH3OH → CH3OCH3 + H2O ΔHrxn = -25 kJ/mol [4]
CO + H2O → CO2 + H2 ΔHrxn = -41 kJ/mol [5]
Direct dimethyl ether synthesis reactors usually operate at a temperature range of 240
°C - 280 °C and at a pressure range of 30 bar – 70 bar. Due to the exothermic nature
of DME synthesis reactions, temperature control and heat removal are very important
to achieve high conversions [13].
Zhang et al. [14] studied dimethyl ether synthesis from CO hydrogenation on HY
zeolite and zeolites were modified by incorporation of several metals. Methanol
dehydration of synthesized catalysts was also tested. Activity tests were performed at
245 °C and 20 bar for a feed gas of H2/CO=1.5. They reported that dual catalyst must
be prepared by coupling the methanol synthesis and dehydration sites completely.
Modification of HY zeolites by Fe, Co, and Cr did not show stability due to the
carbon deposition. However, modification by Zr and Ni exhibited very high activity
and stability. Moreover, activity of dual catalyst can be changed with the ratio of
methanol synthesis component to methanol dehydration component. To produce
more methanol, fraction of methanol synthesis component could be increased.
Sun et al. [15] studied low temperature synthesis of DME from carbon dioxide
containing synthesis gas over Pd modified Cu-ZnO-Al2O3/HZSM5 catalyst. Activity
tests were conducted at 200 °C and 30 bar. Activity results indicated that palladium
addition to the catalyst hindered CO formation and selectivity of DME increased.
Lowest catalytic activities were attributed to the increase in the particle size of CuO
11
and ZnO. On the other hand, strong interactions at the interface could be the main
reason of high activity. This effect was called as synergistic effect.
Yoo et al. [16] studied the effect of solid acid catalyst on the direct synthesis of
DME. Different SAPO catalysts were prepared having different pore structures and
different acidities. Catalytic activity was tested in a fixed bed reactor operating at 42
bar and 260 °C from a feed mixture of H2/CO=1.5. Activity results revealed that
highest acidity materials exhibited very high initial activity whereas they were
exposed to high amount of coke formation within the pores and activity decreased
considerably. On the other hand, moderate acidic materials with desired pore
structures were more stable than the high acidic materials. In the activity tests of
direct synthesis of DME, hydrocarbon byproducts were hardly observed with any of
the catalysts. In the direct synthesis of DME, highest carbon monoxide conversion
was obtained as 55 % with a DME selectivity of nearly 63% for the admixed
catalyst, in which SAPO composition was 10% in weight.
Mao et al. [17] investigated the effect of sulfate content and calcination conditions on
the activity of the methanol dehydration component of hybrid catalyst. Impregnation
method was used in the incorporation of sulfate and sulfate content was altered up to
15%. Calcination temperature was varied in between 350 °C - 750 °C. Activity tests
were carried out in a fixed bed flow reactor operating at 40 bar and 260 °C for the
feed gas of H2:CO:CO2=66:30:4. Activity results showed that catalytic activity was
enhanced when calcination was carried at 550 °C instead of 350 °C. Formation of
CO2 was prevented when calcination was carried at 550 °C. With the further increase
in the calcination temperature, a sharp decline of CO conversion and DME
selectivity was observed. Moreover, with increase in the sulfate ratio, slight decrease
of DME selectivity was observed due to CO2 formation. However, CO conversion
also increased. Highest activity was obtained with 10% sulfate impregnated SO4-2
/γ-
Al2O3 sample which was calcined at 550 °C. Catalytic activity upon sulfate
impregnation was attributed to the number and strength of acid sites.
12
Sofianos and Sourrell et al. [18] investigated the activity of different methanol
dehydration components such as alumina, amorphous silica-alumina, Y zeolite,
mordenite, and ZSM-5 zeolites. By mixing the powders of methanol synthesis
component and methanol dehydration component, bi-functional catalyst beds were
prepared. Activity tests were conducted at 40 bar for H2:CO=2:1 feed gases and
small amount of CO2 was also added to feed gas. Results indicated that, in the
presence of suitable acidic methanol dehydration catalyst, methanol can be converted
to DME over γ-alumina, alumina-silica, and zeolite. Comparison between methanol
synthesis and direct DME synthesis was made and it was seen that DME synthesis
was more favored than the methanol synthesis, indicating thermodynamic advantage
of direct synthesis. Moreover, presence of CO2 in the feed stream was found to be
beneficial in CO conversion and DME selectivity.
Sun et al. [19] investigated the effect of surface properties on the catalytic
performance. Bi-functional catalysts which were composed of
CuO/ZnO/ZrO2/HZSM-5 were prepared by coprecipitating sedimentation and
modified by different ZrO2 content. Catalytic activity was tested at 30 bar for a feed
gas of CO:CO2:H2=30:3:67. Very high DME selectivity at around 83% and
reasonable CO conversion at around 73% were obtained. Catalytic activity was
attributed to the Cu+ species which were formed upon ZrO2 incorporation. In
addition, ZrO2 incorporation also increased the dispersion of active sites and
enhanced synergistic effect, which are beneficial in catalytic activity.
Regeneration study of the direct DME synthesis catalyst of CuO-ZnO-Al2O3/γ-
Al2O3 was made by Sierra et al. [20]. Regeneration of the catalysts could be achieved
by the oxygen and helium and regeneration temperature was 325 °C. Temperature
was reported to be important since copper could sinter at this temperature readily.
Deactivation of catalyst was due to coke formation and copper sintering, the latter
was irreversible. Although DME direct synthesis catalysts undergo fast deactivation,
initial activity of the catalyst could be achieved after regeneration. However,
sintering of copper which is an irreversible process can be prevented by adding
promoters such as alumina.
13
3.2. METHANOL SYNTHESIS
Methanol synthesis was first made by destructive distillation of wood. For this
reason; methanol is also called as wood alcohol. Methanol demand of 19th
century
was met by this method and methanol was used for lighting, heating and cooking
purposes [1]. High pressure operation was first conducted by BASF. Operating
parameters were in the range of 250 bar - 350 bar and 320 °C - 450 °C. The catalyst
was highly poison resistant, ZnO-Cr2O3 and this high pressure process was used for
45 years from the synthesis gas, which was obtained by German low quality
coal/lignite.
In the 1960s, Imperial Chemical Industries (ICI) was used copper in methanol
synthesis with Zn promoter, which was enhancing the dispersion of copper and
prevent agglomeration of it. By this catalyst, operating pressure was dropped to 35
bar - 55 bar, which is known as low pressure process [21].
In the methanol synthesis, three main reactions are involved. Reaction 3 and 6 are the
hydrogenation of carbon oxides to methanol and reaction-5 is the water gas shift
reaction which occurs over the copper-zinc based catalyst.
CO + 2H2 → CH3OH [3]
CO + H2O → CO2 + H2 [5]
CO2+ 3H2 → CH3OH + H2O [6]
While reactions 3, 6 and 5 are occurring, number of moles decrease. As a result,
volume is reduced to some extent. These reactions are also exothermic in nature. For
these reasons, high pressure and low temperature favor activity [22].
Although methanol is one of the top chemicals, there are still controversial points
about the catalytic behaviors of the methanol synthesis catalyst. Nature of active site,
formation mechanism and role of ZnO and other promoters are still in debate.
14
However, a consensus of methanol synthesis occurs via CO2 hydrogenation on
metallic copper of copper/zinc oxide catalyst has been reached by many authors [23].
Sintering of the copper is one of the most important reasons of catalyst deactivation.
Copper is one of the least stable metals and sintering may happen readily above 300
°C. Sintering also increases the particle size and XRD results of used catalyst
revealed that particle size could increase from 7 nm to 20 nm due to sintering [23,
24].
Arena et al. [25] has given basic evidents of methanol synthesis catalyst in his recent
study. In this study, methanol synthesis from CO2 was conducted due to importance
of CO2 as a greenhouse gas. Cu/ZnO/ZrO2 catalyst was chosen due to the water
adsorption capacity of ZrO2 with respect to γ-alumina which is highly hydrophilic.
Catalytic activity tests showed that methanol selectivity is highly dependent on the
reduction temperature. Results showed that Cuδ+
/Cu0 ratio was the key parameter to
obtain high selectivity.
Saito et al. [26] investigated the role of metal oxides such as Al2O3, Ga2O3, and
Cr2O3 for methanol synthesis from CO2 hydrogenation. Reaction conditions were 5
mPa and 523 K and catalysts were reduced in H2 flow at different temperatures.
Activity results indicated that Al2O3 and Zr2O3 metal oxides increased the copper
dispersion and improved copper surface area whereas it had no effect on catalytic
activity. On the other hand, Ga2O3 and Cr2O3 had no effect on copper dispersion but
increased catalytic activity. This increment in activity was a result of the Cu+/Cu
0
ratio which was optimized by Ga2O3 and Cr2O3 metal oxides. Catalyst activity was
decreasing with increase in pretreatment temperature due to sintering of copper.
However, it was seen that sintering of copper can be suppressed by the addition of
metal oxides.
Meshkini et al. [27] investigated the promoting effect of different metal oxide
additives of a co-precipitated methanol synthesis catalyst from syngas. Catalytic
activity tests were conducted in a stainless steel fixed bed reactor operating at 50 bar
15
and 513 K, from a reactant gas of gaseous mixture CO/CO2/H2=1/1/4.5 at gas hourly
space velocity of 12400 /hour. Among the studied promoters (Mn, Zr Mg, Cr, W, Ce,
Ba) Mn and Zr promoted catalysts were the most active catalysts. It was also
reported that addition of promoters also changed the copper dispersion and number
of active sites. For example, Mn-Zr promoted catalysts offered the Cu metal surface
area as 41.1 m2/gcat and copper dispersion was the highest in this catalyst.
Dai et al. [28] made XPS studies of methanol synthesis catalyst prepared by the
oxalate gel co-precipitation method for the feed mixture of CO2-H2 and CO2-CO-H2.
They have found that reduction by H2/Ar at 240 °C reduced copper to metallic state
and had no effect on the chemical state of zinc. This result indicated that copper and
zinc are 0 and +2 at the chemical valence states. Furthermore, they have shown that
carbon dioxide containing methanol synthesis catalyst undergoes partial oxidation to
Cuδ+
when exposed to pure carbon dioxide where 0<δ<1. This result was also
supported by another study of Spencer et al. [29]. In this study, Spencer reviewed the
benefits of zinc in methanol synthesis catalyst in addition to having copper as main
active component.
Ma et al. [30] prepared methanol synthesis catalyst from CO2 hydrogenation via
oxalate co-precipitation methanol by changing the solvent. They investigated the
properties of solvent on catalyst characterization and activity and concluded that
large viscosity and small surface tension solvent have given the best structure and
activity in oxalate co-precipitated catalysts. They conducted catalytic activity tests at
20 bar for a feed gas of CO2:H2 = 1:3 in a continuous tubular flow fixed bed
microreactor. Obtained CO2 conversions and methanol selectivity were in the range
of 18-20% and 35-45%.
Raudaskoski et al. [31] have studied the effect of aging time on copper, zinc and
zirconia co-precipitated catalyst via CO2 hydrogenation. They prepared catalysts by
conventional co-precipitation method by changing the aging time for 0.5 gr, 12 hr
and 24 hr. Methanol activity results which were conducted at pressure of 30 bar and
space velocity of 50 ml/min.gcat. Feed gas ratio was H2/CO2=3 and 1 gr catalyst was
16
loaded into reactor. Results showed that as aging time increased, methanol yields
increased. It was also seen that the catalyst which aged for 24 hours contain the least
amount of sodium. In catalytic activities, CO2 conversion as high as 20% and
methanol selectivities as high as 30% were obtained at 250 °C.
Zirconium takes attention from many researchers because of showing a good effect
for methanol synthesis from synthesis gas. Zirconia was investigated by Sun et al.
[32] using Cu-ZnO-ZrO2/HZSM-5 catalyst including different Zirconia amounts to
observe its catalytic performance for direct DME synthesis. According to results,
ZrO2 addition increased the formation and stabilization of Cu+ which is partly
responsible for methanol formation. ZrO2 provides a strong promoting effect on CO
conversion and DME yield.
Effect of zirconia on copper based catalysts was also investigated by Flores et al.
[33] and it was seen that zirconia addition increased the copper surface area. ZrO2
addition affected the copper dispersion and changed the morphology of copper
particles and increased the dispersion of Cu crystallites resulting more active sites
and higher conversions. According to Słoczynski et al. [34], incorporation of ZrO2
not only increased the catalytic activity but also decreased H2O adsorption capability.
As a result of this, methanol yield and catalytic performance increased. They also
reported that, when oxide additives, B, Ga, In, Gd, Y, Mg and Mn, introduced to the
Cu/ZnO/ZrO2 catalyst, highest methanol yield was obtained with catalyst Ga2O3 and
lowest activity was observed with In2O3.
Zhang et al. [14] studied the effect of zirconia impregnation on γ-alumina in
methanol synthesis from CO2 hydrogenation. They examined the effect of
temperature, space velocity and molar ratio of reactants and find out that high space
velocity and low temperature were the parameters to obtain high activity. In addition,
zirconia addition to γ-alumina enhanced the CuO dispersion and as a result, zirconia
addition increased the catalytic performance.
17
Ceria has been used as a promoter or doper to the copper zinc containing methanol
synthesis catalyst. Shen et al. [35] studied the methanol synthesis from the feed gas
of carbon monoxide and carbon dioxide over ceria supported copper catalyst and
found that ceria enhanced the dispersion of copper. They compared the activity
results with conventional copper zinc based catalyst and synthesized catalyst was
more active than the conventional one. In carbon monoxide hydrogenation,
Pokrovski et al. [36] investigated the effects of cerium incorporation into the
Cu/ZrO2 methanol synthesis catalyst. They showed that presence of ceria was
beneficial to increase the adsorption capacity of oxides and made the concentration
of methoxide species higher. For these reasons, ceria incorporation increased the
activity.
Another study conducted by Kaluza et al. [37] was about a novel promising
alternative to conventional process. Preparation of Cu/ZnO/Al2O3 catalyst was made
by using micromixer cascade as continuous catalyst. Continuous and consecutive
precipitation was achieved and by using spray dryer. Quenching was also achieved.
By this technique, homogeneity and reproducibility of the catalyst enhanced.
Furthermore, catalytic activity which was conducted at 60 bar and 250 °C for a gas
mixture of CO, CH4, CO2 and H2 has given 50% higher conversion than the
commercial catalyst.
Guo et al. [38] synthesized catalyst by glycine-nitrate combustion method and
examined the catalytic properties in the methanol synthesis from CO2 hydrogenation.
They have changed the amount of glycine which is the complexing agent for metal
ions in the methanol synthesis catalyst. They have conducted catalyst activity testing
at 30 bar and 493 K for the feed gas of CO2:H2 =1:3 and 12% CO2 conversion and
71.1% methanol selectivity was obtained for gas hourly space velocity of 3600 /hr.
As glycine amount increased, decreases were observed in BET surface areas and CO2
conversion. Methanol selectivity exhibited a volcanic trend with respect to glycine
amount.
18
3.3. METHANOL DEHYDRATION
The conventional method to obtain DME is the methanol dehydration. Since DME is
produced from the methanol, DME is more expensive than methanol in spite of being
relatively simple process [5]. Methanol dehydration for the synthesis of DME is the
conventional way of obtaining DME and synthesis can be accomplished by solid
acidic catalysts at atmospheric pressure. For this purpose, zeolites, aluminas,
aluminosilicates, mixed metal oxides, and impregnated materials of metal oxides as
nanocomposites have been used in methanol dehydration. Methanol dehydration
occurs via the following reaction-4.
2CH3OH → CH3OCH3 + H2O [4]
Kim et al. [39] studied DME synthesis and investigated the role of acidity in
methanol dehydration on Na-ZSM-5 and H-ZSM-5 catalysts with different Si/Al
ratios. Based on the activity and NH3-TPD results, highest dehydration rate was seen
on the catalyst with highest acidity. Optimal reaction parameters were also found in
this study and it was concluded that overall reaction rate of direct synthesis is
possible to control by lowering the acid strength of the catalyst and therefore, by
slowing down the dehydration rate.
Yaripour et al. [40] prepared γ-alumina and aluminum phosphate modified catalysts
with co-precipitation method to be used in the methanol dehydration to dimethyl
ether. Phosphorus modification affected the catalytic activity in a positive way.
Almost 100% DME selectivity and nearly 80% conversions was obtained at reaction
conditions of 573 K and 16 barg. Optimum phosphorus content was found to be as
Al/P=1.5 and they concluded that moderate acid sites were the best candidates for
activity in methanol dehydration reactions.
Methanol dehydration to dimethyl ether was also studied by the same group Yaripour
et al. [41]. They prepared silica-titania and aluminium phosphate catalysts and
conducted activity tests in a fixed bed reactor operating at temperature of 300 °C and
19
gas hourly space velocity of 15600 h-1
. Results showed that silica-titania catalyst had
no significant activity in methanol dehydration. However, phosphorus modified
aluminum catalysts were active DME as the major product with the formation of
methane as a byproduct. Formation of methane was attributed to the strong acidic
sites whereas medium acidity was claimed to be key factor to obtain high selectivity.
Khaleel [42] studied methanol dehydration to dimethyl ether over highly porous
xerogel alumina catalysts and investigated the flow rate effect on the catalytic
activity. Synthesis of mesoporous γ-alumina was achieved with high surface area and
catalytic activity was found to be highly dependent on the product distribution. High
flow rates of methanol favored DME formation whereas low flow rates caused
carbon dioxide and methane formation. Moreover, synthesized mesoporous alumina
was better than commercial γ-alumina.
Fu et al. [43] investigated the effect of surface acidity on the methanol dehydration to
dimethyl ether and prepared several catalysts such as H-ZSM-5 and steam de-
aluminated H-Y zeolite (SDY), γ-Al2O3 and Ti(SO4)2/γ-Al2O3. Methanol dehydration
reactions were carried out in a fix bed reactor operating in a temperature range of 400
K – 600 K with gas hourly space velocity of 3400 ml/gcat.h. Catalytic activities can
be ordered as H-ZSM-5 > SDY > Ti(SO4)2/γ-Al2O3 > γ-Al2O3 and highest activity
was obtained with H-ZSM-5 at 423 K. However, significant formation of coke was
observed and this could hinder the use of these catalysts in the direct synthesis of
DME from synthesis gas. On the other hand, titania modified alumina (Ti(SO4)2/γ-
Al2O3) had comparable acid sites with the H-ZMS-5 and carbon deposition was
absent for this catalyst. Therefore, this catalyst could be used in the direct synthesis
of DME from synthesis gas as methanol dehydration component.
Vishwanathan et al. [44] studied the dehydration of crude methanol to dimethyl ether
over sodium modified H-ZSM-5 catalysts. They altered the sodium content by
impregnation and conducted the activity test at 230 °C- 340 °C with a feed rate of 25
ml/min. From the activity results, it was seen that dimethyl ether selectivity increased
with a decrease in the surface acidity and decrease in the surface acidity was
20
achieved with increase in the sodium content. By changing the sodium content,
hydrocarbon formations as side products were prevented. This study was also
important in term of the purity of the feed since crude methanol was transformed to
DME instead of pure methanol, which is more expensive.
Methanol dehydration on aluminum impregnated SBA-15 was studied by Tokay et
al. [45]. They synthesized alumina impregnated one-pot hydrothermal synthesis of
SBA-15. Activity tests were conducted in a temperature range of 120 °C - 450 °C at
atmospheric pressure. According to the results, aluminum impregnation decreased
the pore volume and surface area of synthesized SBA-15. The reaction results show
that aluminum impregnated SBA-15 was highly active in methanol dehydration and
gave almost equilibrium conversions with DME selectivity values approaching 100%
at temperatures over 300 °C.
A comprehensive study was made by Xu et al. [46] in synthesis of DME from
methanol. They prepared several solid acid catalysts such as γ-Al2O3, H-ZSM5,
amorphous silica-alumina and titania modified alumina and zirconia. They conducted
the activity studies in a plug flow reactor operating at a range of temperatures around
280 °C and reported that all catalysts were active and selective in DME formation. γ-
Al2O3 catalyst exhibited 90% methanol conversion at 250 °C. However, effect of
presence of water in the product stream was examined by changing the water partial
pressure and methanol conversion decreased from 17.5% to 5.8% at 188 °C. Based
on this finding, direct synthesis of DME from synthesis gas was proposed to enhance
the catalytic activity since typical methanol synthesis catalyst Cu/ZnO/Al2O3
accelerates the water gas shift reaction. Hence, excess water could be eliminated and
catalytic activity could be enhanced. Zirconia addition to titania increased the
catalytic activity. Nevertheless, these catalysts suffered from the low acidity and low
conversion values were reported.
Çiftçi et al. [47] prepared mesoporous nafion-silica nanocomposites by one pot
acidic hydrothermal synthesis procedure and obtained well dispersion of nafion on
the support of silica with very high BET surface areas (600 m2/g - 800 m
2/g).
21
Activity of the nanocomposites was tested in dimethyl ether synthesis from methanol
dehydration in a temperature range of 120 °C – 300 °C. Activity results revelaed that
almost 100% DME selectivity was obtained with very high yields and optimal nafion
to silica ratio was found to be 0.15. At higher ratios, brönsted acidity decreased
together with catalytic activity. Another type of the methanol dehydration catalysts
was also made by Çiftçi et al. [48]. They synthesized nanocomposite catalysts by the
hydrothermal synthesis and silicotungstic acid was incorporated before hydrothermal
syntheses. They altered the W/Si ratio and conducted methanol dehydration studies
to obtain DME. Low temperature activities at 200 °C – 250 °C with very high DME
selectivities were obtained with the catalyst having the W/Si ratio 0.40 and this
catalyst was called as TRC-75(L). This catalyst was used also in this study as
methanol dehydration component of direct synthesis.
22
CHAPTER 4
THERMODYNAMIC ANALYSIS
4. THERMODYNAMIC ANALYSIS
Thermodynamic analysis of the reactions involved in DME synthesis is very
important to determine the operating parameters of the experiments. For DME
synthesis, high pressures (30 bar and above) and moderate temperatures (200 °C -
300 °C) are needed to achieve high conversion values. In this section,
thermodynamic analyses of the reactions 1, 2, and 3 are made considering equimolar
feed composition of carbon monoxide and hydrogen.
3CO + 3H2 → CH3OCH3 + CO2 [1]
2CO + 4H2 → CH3OCH3 + H2O [2]
CO + 2H2 → CH3OH [3]
For the methanol synthesis reaction (reaction-3), thermodynamic analysis can be
applied as follows:
For the thermodynamic analysis of this reaction, firstly, constant pressure heat
capacity values were taken from literature as a function of temperature [49]. Heat
capacity of any species can be represented by Equation 4.1.
[ ] ( )⁄ [ ] 4.1.
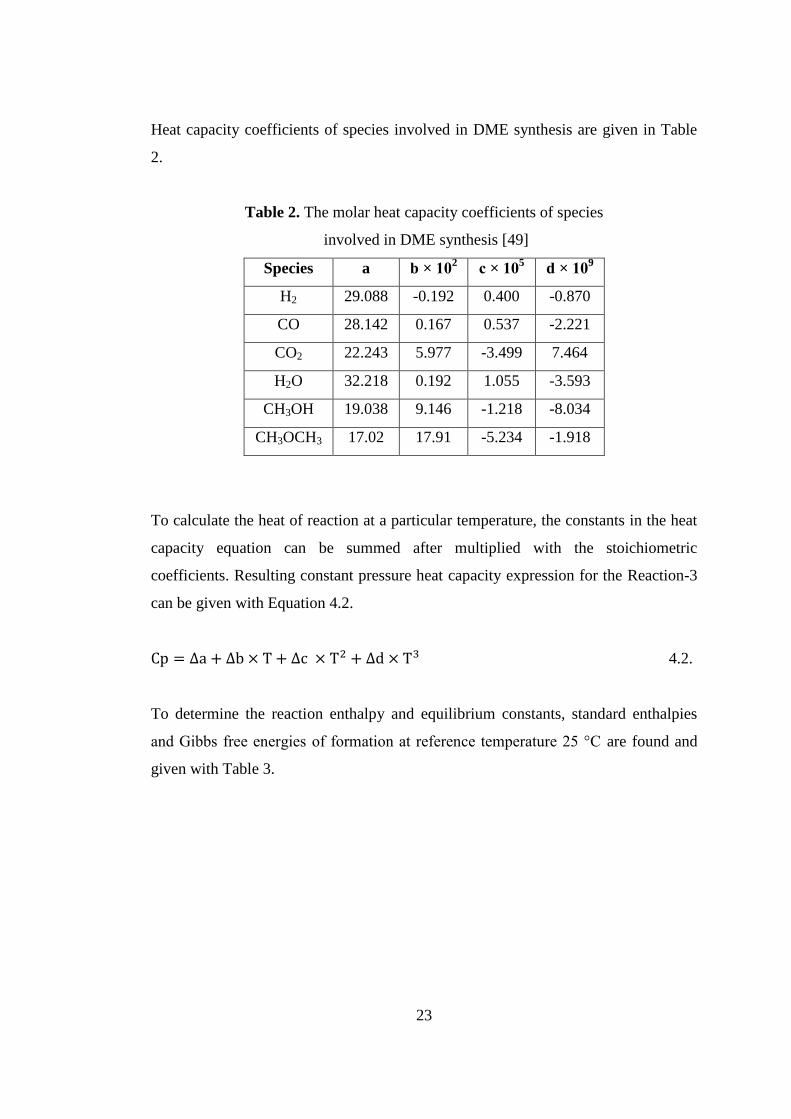
23
Heat capacity coefficients of species involved in DME synthesis are given in Table
2.
Table 2. The molar heat capacity coefficients of species
involved in DME synthesis [49]
Species a b × 102 c × 10
5 d × 10
9
H2 29.088 -0.192 0.400 -0.870
CO 28.142 0.167 0.537 -2.221
CO2 22.243 5.977 -3.499 7.464
H2O 32.218 0.192 1.055 -3.593
CH3OH 19.038 9.146 -1.218 -8.034
CH3OCH3 17.02 17.91 -5.234 -1.918
To calculate the heat of reaction at a particular temperature, the constants in the heat
capacity equation can be summed after multiplied with the stoichiometric
coefficients. Resulting constant pressure heat capacity expression for the Reaction-3
can be given with Equation 4.2.
4.2.
To determine the reaction enthalpy and equilibrium constants, standard enthalpies
and Gibbs free energies of formation at reference temperature 25 °C are found and
given with Table 3.
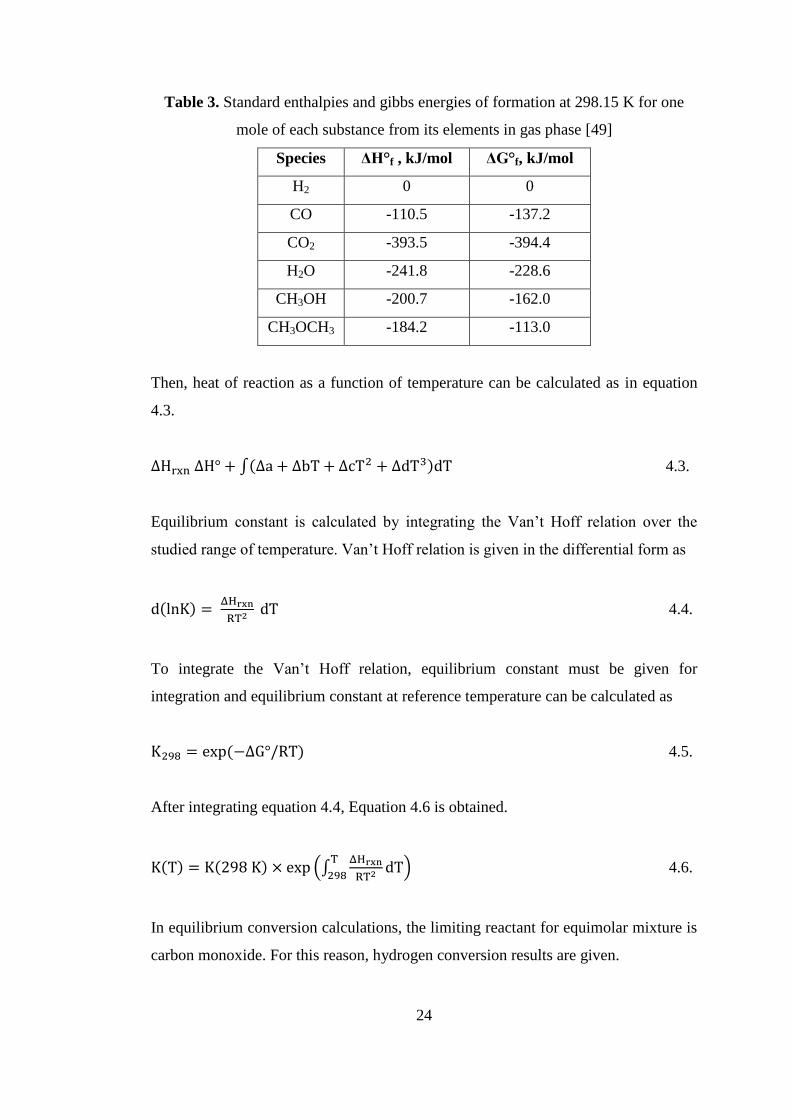
24
Table 3. Standard enthalpies and gibbs energies of formation at 298.15 K for one
mole of each substance from its elements in gas phase [49]
Species ΔH°f , kJ/mol ΔG°f, kJ/mol
H2 0 0
CO -110.5 -137.2
CO2 -393.5 -394.4
H2O -241.8 -228.6
CH3OH -200.7 -162.0
CH3OCH3 -184.2 -113.0
Then, heat of reaction as a function of temperature can be calculated as in equation
4.3.
∫( ) 4.3.
Equilibrium constant is calculated by integrating the Van‟t Hoff relation over the
studied range of temperature. Van‟t Hoff relation is given in the differential form as
( )
4.4.
To integrate the Van‟t Hoff relation, equilibrium constant must be given for
integration and equilibrium constant at reference temperature can be calculated as
( ) 4.5.
After integrating equation 4.4, Equation 4.6 is obtained.
( ) ( ) (∫
) 4.6.
In equilibrium conversion calculations, the limiting reactant for equimolar mixture is
carbon monoxide. For this reason, hydrogen conversion results are given.
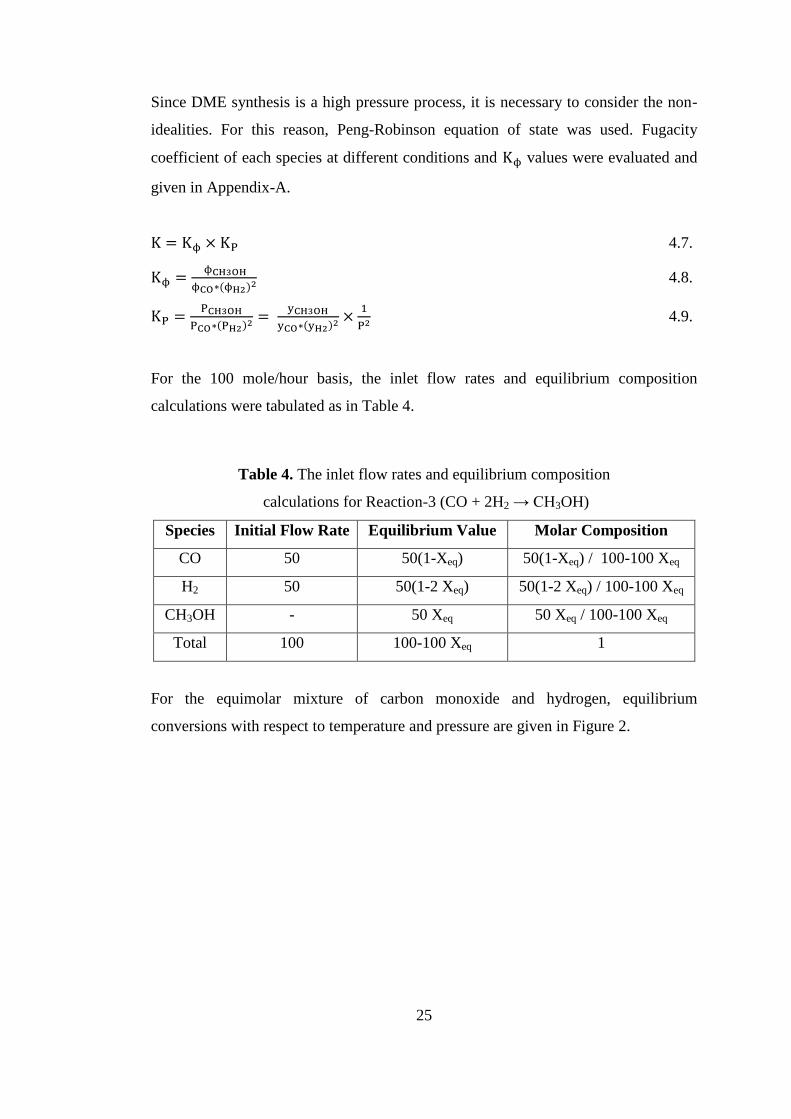
25
Since DME synthesis is a high pressure process, it is necessary to consider the non-
idealities. For this reason, Peng-Robinson equation of state was used. Fugacity
coefficient of each species at different conditions and values were evaluated and
given in Appendix-A.
4.7.
( ) 4.8.
( )
( )
4.9.
For the 100 mole/hour basis, the inlet flow rates and equilibrium composition
calculations were tabulated as in Table 4.
Table 4. The inlet flow rates and equilibrium composition
calculations for Reaction-3 (CO + 2H2 → CH3OH)
Species Initial Flow Rate Equilibrium Value Molar Composition
CO 50 50(1-Xeq) 50(1-Xeq) / 100-100 Xeq
H2 50 50(1-2 Xeq) 50(1-2 Xeq) / 100-100 Xeq
CH3OH - 50 Xeq 50 Xeq / 100-100 Xeq
Total 100 100-100 Xeq 1
For the equimolar mixture of carbon monoxide and hydrogen, equilibrium
conversions with respect to temperature and pressure are given in Figure 2.
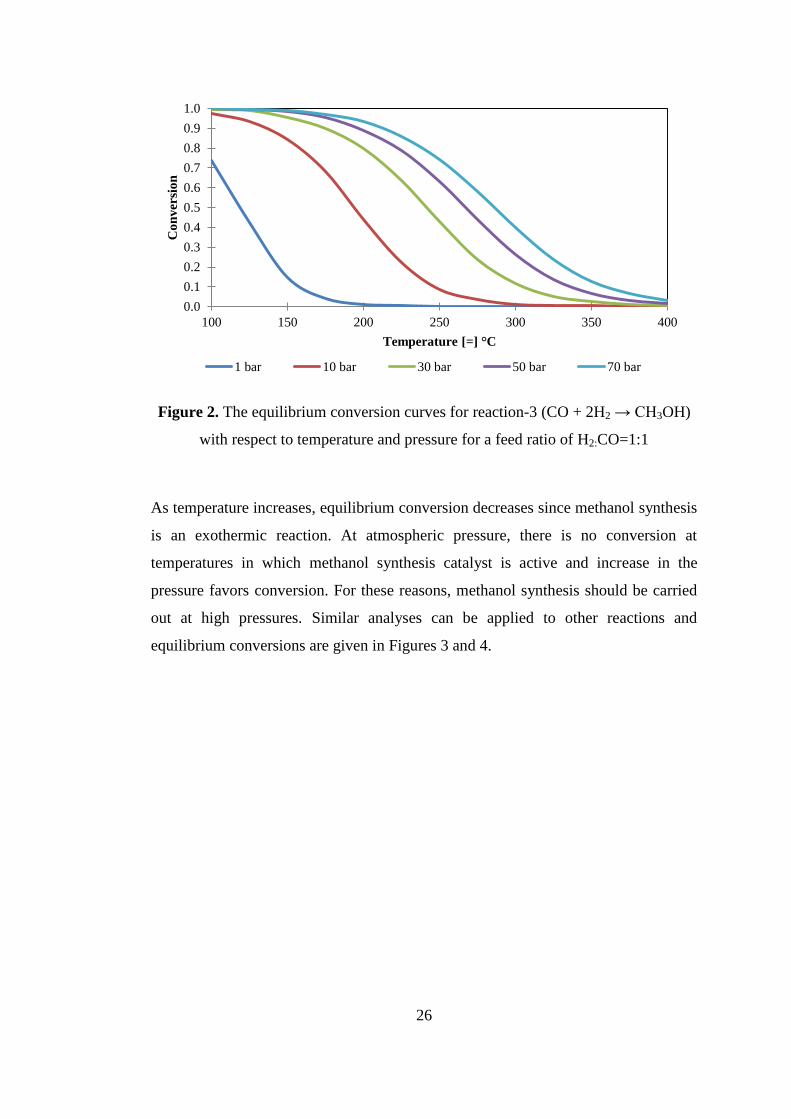
26
Figure 2. The equilibrium conversion curves for reaction-3 (CO + 2H2 → CH3OH)
with respect to temperature and pressure for a feed ratio of H2:CO=1:1
As temperature increases, equilibrium conversion decreases since methanol synthesis
is an exothermic reaction. At atmospheric pressure, there is no conversion at
temperatures in which methanol synthesis catalyst is active and increase in the
pressure favors conversion. For these reasons, methanol synthesis should be carried
out at high pressures. Similar analyses can be applied to other reactions and
equilibrium conversions are given in Figures 3 and 4.
0.0
0.1
0.2
0.3
0.4
0.5
0.6
0.7
0.8
0.9
1.0
100 150 200 250 300 350 400
Co
nv
ersi
on
Temperature [=] °C
1 bar 10 bar 30 bar 50 bar 70 bar
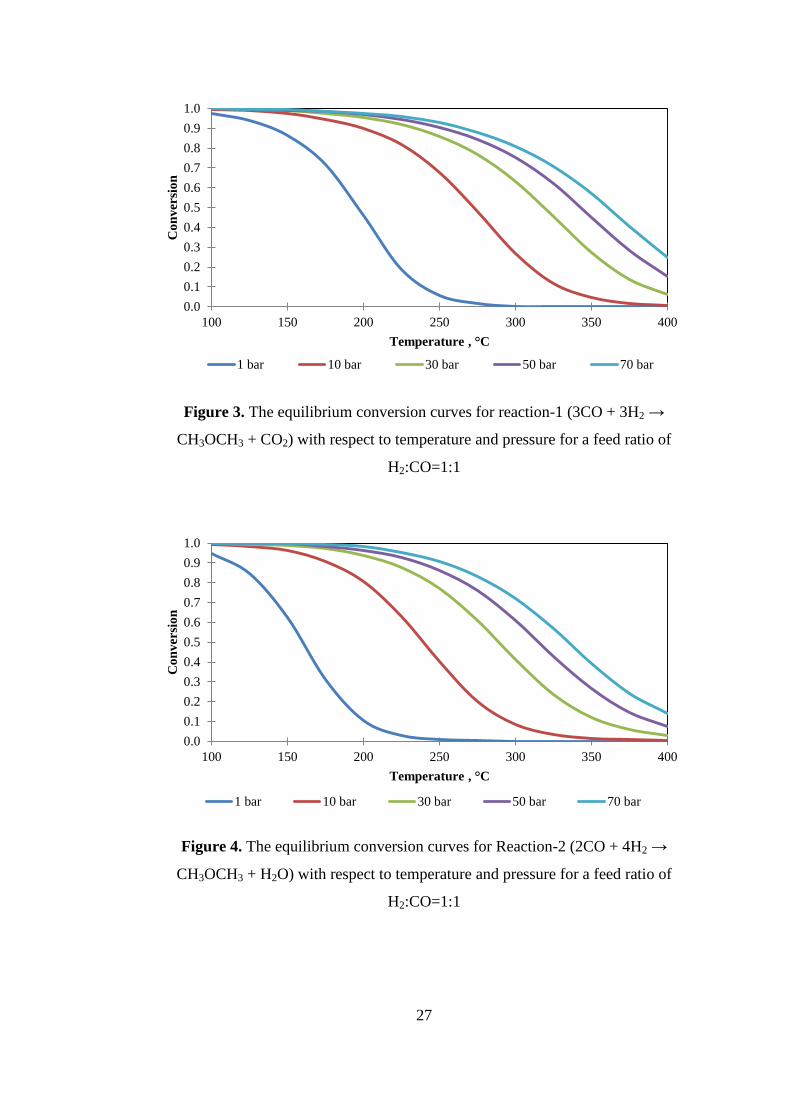
27
Figure 3. The equilibrium conversion curves for reaction-1 (3CO + 3H2 →
CH3OCH3 + CO2) with respect to temperature and pressure for a feed ratio of
H2:CO=1:1
Figure 4. The equilibrium conversion curves for Reaction-2 (2CO + 4H2 →
CH3OCH3 + H2O) with respect to temperature and pressure for a feed ratio of
H2:CO=1:1
0.0
0.1
0.2
0.3
0.4
0.5
0.6
0.7
0.8
0.9
1.0
100 150 200 250 300 350 400
Co
nv
ersi
on
Temperature , °C
1 bar 10 bar 30 bar 50 bar 70 bar
0.0
0.1
0.2
0.3
0.4
0.5
0.6
0.7
0.8
0.9
1.0
100 150 200 250 300 350 400
Co
nv
ersi
on
Temperature , °C
1 bar 10 bar 30 bar 50 bar 70 bar
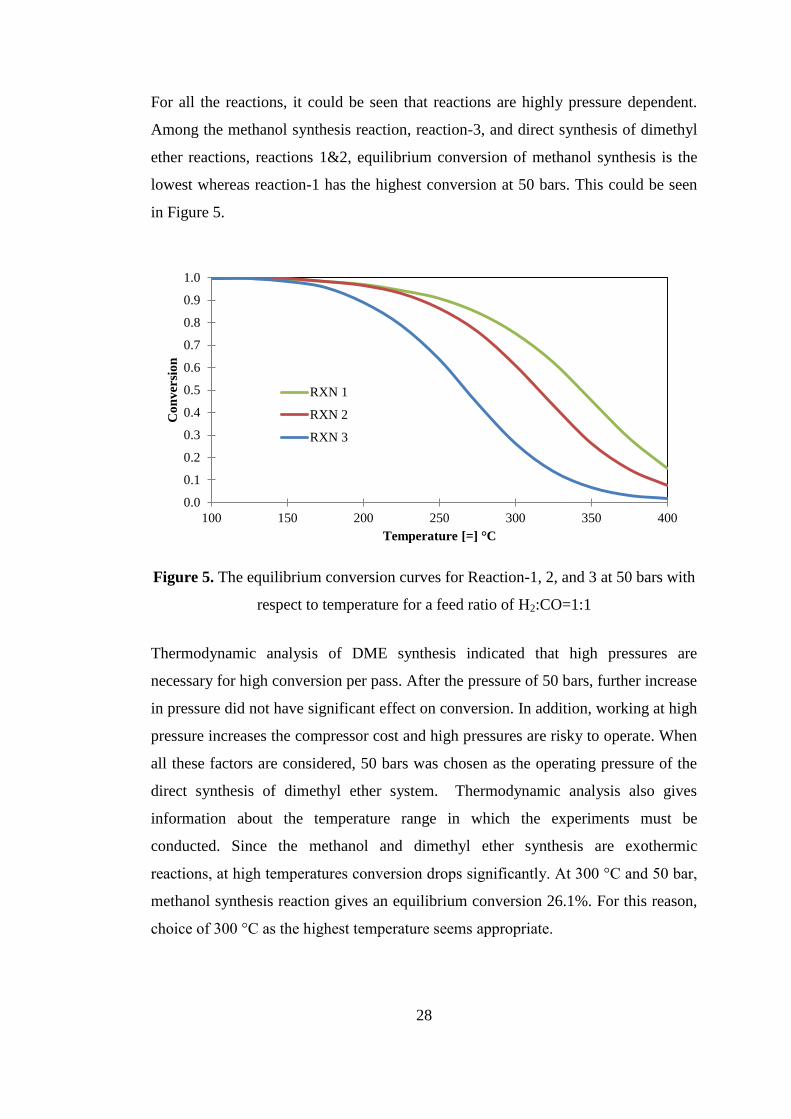
28
For all the reactions, it could be seen that reactions are highly pressure dependent.
Among the methanol synthesis reaction, reaction-3, and direct synthesis of dimethyl
ether reactions, reactions 1&2, equilibrium conversion of methanol synthesis is the
lowest whereas reaction-1 has the highest conversion at 50 bars. This could be seen
in Figure 5.
Figure 5. The equilibrium conversion curves for Reaction-1, 2, and 3 at 50 bars with
respect to temperature for a feed ratio of H2:CO=1:1
Thermodynamic analysis of DME synthesis indicated that high pressures are
necessary for high conversion per pass. After the pressure of 50 bars, further increase
in pressure did not have significant effect on conversion. In addition, working at high
pressure increases the compressor cost and high pressures are risky to operate. When
all these factors are considered, 50 bars was chosen as the operating pressure of the
direct synthesis of dimethyl ether system. Thermodynamic analysis also gives
information about the temperature range in which the experiments must be
conducted. Since the methanol and dimethyl ether synthesis are exothermic
reactions, at high temperatures conversion drops significantly. At 300 °C and 50 bar,
methanol synthesis reaction gives an equilibrium conversion 26.1%. For this reason,
choice of 300 °C as the highest temperature seems appropriate.
0.0
0.1
0.2
0.3
0.4
0.5
0.6
0.7
0.8
0.9
1.0
100 150 200 250 300 350 400
Co
nv
ersi
on
Temperature [=] °C
RXN 1
RXN 2
RXN 3

29
Based on the thermodynamic analysis, it is proven that direct synthesis reactions give
more conversion than the methanol synthesis reaction. This could be considered as
the thermodynamic advantage since conversion increases at the same operating
parameters.
30
CHAPTER 5
CATALYTIC MATERIALS
5. CATALYTIC MATERIALS
For the direct synthesis of dimethyl ether synthesis from the syngas, several catalysts
have been prepared including co-precipitated catalysts, ordered mesoporous
materials and impregnation catalysts. In this part, firstly catalyst preparation methods
including precipitation, impregnation and ordered molecular materials are given in
detail. Then, catalyst treatment steps such as hydrothermal synthesis, calcination,
drying and washing are mentioned. Finally, characterization methods applied in this
study are explained in detail.
5.1. CATALYST PREPARATION METHODS
5.1.1. Precipitation and co-precipitation
Precipitation refers to the obtaining a solid from a liquid solution. Typically, two or
more solutions and suspensions of materials which could cause precipitation of an
amorphous or crystalline precipitate or gel are mixed as a first step of precipitation.
In the preparation, precipitating solid is obtained due to the super saturation. By
either reducing the solubility or initiating a chemical reaction, solid formation is
induced [50, 51].
The demands for precipitated catalysts are very high since product separation after
precipitation is necessary and large volumes of metal salts solutions are used in
precipitation process. The main advantages of the precipitated catalysts are obtaining
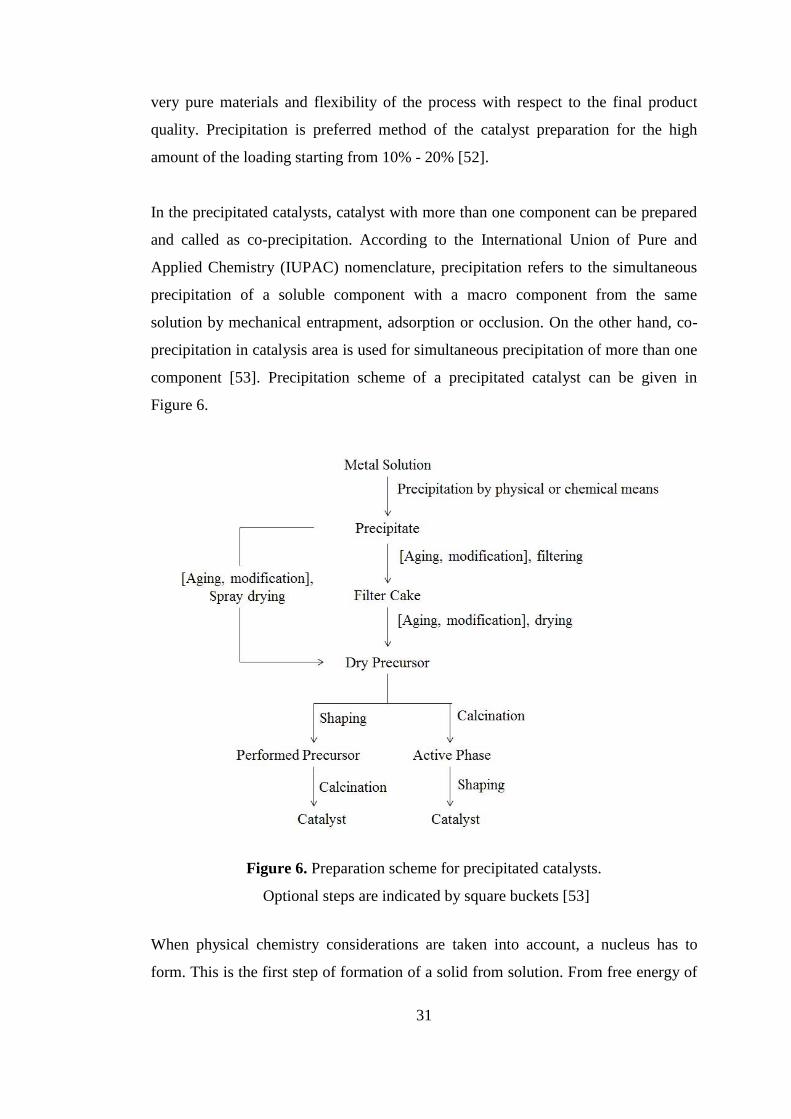
31
very pure materials and flexibility of the process with respect to the final product
quality. Precipitation is preferred method of the catalyst preparation for the high
amount of the loading starting from 10% - 20% [52].
In the precipitated catalysts, catalyst with more than one component can be prepared
and called as co-precipitation. According to the International Union of Pure and
Applied Chemistry (IUPAC) nomenclature, precipitation refers to the simultaneous
precipitation of a soluble component with a macro component from the same
solution by mechanical entrapment, adsorption or occlusion. On the other hand, co-
precipitation in catalysis area is used for simultaneous precipitation of more than one
component [53]. Precipitation scheme of a precipitated catalyst can be given in
Figure 6.
Figure 6. Preparation scheme for precipitated catalysts.
Optional steps are indicated by square buckets [53]
When physical chemistry considerations are taken into account, a nucleus has to
form. This is the first step of formation of a solid from solution. From free energy of
32
agglomerates of the constitutes of solutions, formation of the particles are governed.
Total free energy change due to agglomeration is determined by equation 5.1.
ΔG = ΔGbulk + ΔG interface + ΔGothers 5.1.
where ΔGbulk refers to the difference of the free energy between solution species and
solid species
ΔGinterface refers to the free energy change related to the formation of the
interface
ΔGothers refers to the all other contributions such as strains and impurities [53].
Bulk energy change is always negative. However, energy is needed to create an
interface, indicating that energy change is positive for the interface. Bulk energy
change is proportional to the volume of the particles whereas interface energy change
is proportional to the surface area. Therefore, there is a critical size of the
agglomerate from which bulk energy change dominates the total energy change and
interface energy change decreases upon the agglomeration of the particle. This
critical size is called as the size of nucleus. Nucleus formation occurs when precursor
concentration exceeds a critical threshold concentration. The nucleus is defined as
“smallest solid-phase aggregate of atoms, molecules or ions which is formed during a
precipitation and which is capable of spontaneous growth”. As long as concentration
of precursor is above the nucleation threshold, formation of new particle is possible.
When the precursor concentration decreases, then particle growth of the formed
particles becomes dominant [53].
For the success in the preparation methods, super saturation is necessary. To achieve
super saturation, physical and chemical treatments can be made. Some physical
treatments are changing the temperature of the reaction mixture and evaporating the
solvent. Chemical treatments are changing of the precipitating agent which changes
pH [52]. For co-precipitated catalysts, knowledge of relative solubilities of
precipitates is important since it could result in sequential precipitation.
33
Raw material can influence the final product characteristics. Choice of raw material
should be made as to having counter ions in decomposition to volatile products. By
changing the raw materials, morphologies, phases and sizes could change [53, 54].
By changing concentration and composition of the solutions, final product
characteristics could be altered. Usually, high concentrations are advantageous for
precipitation. High concentrations are also advantageous for fast production in plants
since high concentrations increase the space time by decreasing the vessel volume
for the same amount of precipitate. In precipitated catalysts high amount of solvents
are used and solvent type influences the product characteristics. Most of the time,
water has been used extensively since it is abundant and economically feasible.
Organic solvents could enhance the material properties and can give superior product
qualities. Nevertheless, use of them is limited due to the environmental regulations
and price difference with the conventional solvent water [53].
Temperature in which precipitation is conducted is one of the most important
parameter influencing the properties of the final product. Since nucleation rates are
highly temperature dependent, temperature plays a key role in tuning the crystallite
sizes, surface areas and formed phases. Although suitable precipitation temperature
should be determined experimentally, precipitation is usually conducted at high
temperatures around 100 °C which is beneficial to obtain super saturation. Aging
time has great influences on the catalyst properties. Aging time can be defined as the
time in which precipitate is left under the mother liquor solution at either
precipitation conditions or different conditions. While aging is taking place,
precipitated catalyst undergoes size increment by Ostwald ripening and
recrystallization which could directly affect the catalytic performance [53]. Although
pH effect on the catalyst performance and catalytic activity is not well studied, pH
directly affects the degree of the super saturation. Likewise temperature, optimal pH
should be determined experimentally [53]. In the precipitation, pH can be either kept
constant at a desired value or variable pH to desired end point [54].
34
5.1.2. Impregnation
One of the widely used catalytic materials preparation method is the impregnation of
an active component with its solution to the catalysts or porous support. In the
absence of specific interactions between support and components of impregnation,
the impregnation process steps are quite simple. In impregnation, a solution of active
component is slowly added to the suspension of catalysts or support with porous
structure. Adsorption depends on the concentration of the active component solution
and penetration of it into the support. After adsorption is completed, excess water in
the structure of the support should be removed so as to keep the active component
within the pores of the support. This step is important since water presence could
result in the migration of the metal salts to the exterior surface. Calcination should be
conducted to convert the metal salts to the metal oxides [50].
Uniformity is an important phenomenon in impregnated catalysts since the degree of
it depends on the adsorptive properties of the carrier and the solvent. If alcoholic
solutions are used as solvents, then different concentration distributions are obtained
than the aqueous solution. When the multicomponent impregnation is desired,
uneven distribution of the components could arise because of the chromatographic
effect. Depending on the adsorption capability, impregnation could be conducted in
different places. If the adsorption capability of the component is high, then the
adsorption occurs on the surface. If the adsorption capability of the component is
low, then penetration of the active components through the pores of the support
occurs. This could be prevented by keeping the impregnated catalysts in a moist state
for some time to enable the equilibrium [50].
Unless interactions between active components and support are strong, drying of the
impregnated supports leads to uneven distribution of the active components.
Moreover, crystallization occurs if saturation limit of the active component solution
is exceeded. For these reasons, water evaporation and drying must be done
spontaneously. If the evaporation rate is slow, soluble active materials migrate to the
smaller pores in which water evaporation rate is slow. Such a catalyst allows hardly
to the access of reactants to active components within the catalyst.
35
Impregnated catalysts are highly advantageous. Main advantage of impregnated
catalysts is their pore structure and surface area. Since supports at several desired
ranges of surface areas are commercially available, desired properties could be
obtained easily. Impregnated catalysts contain fewer amounts of active components
when compared to the precipitated catalysts and this can be considered as an
economical advantage. On the other hand, disadvantage of the impregnation comes
from the limited amount of material that can be incorporated into the support [50].
Impregnation can be achieved by different methods. In this study, two methods have
been used together.
Impregnation with an excess of solution: In this method, catalyst is exposed to the
excess solution and impregnation is slow and can take several hours to days. Excess
liquid is evaporated quickly. By this method, surface is restructured extensively and
distribution of the species can be controlled and very high dispersion values could be
obtained. This method could be considered as the best method among the others [51]
Co-impregnation: In a single step, incorporation of two or several active components
is done. In this method, it is difficult to obtain a high dispersion and segregation can
easily occur [51].
5.1.3. Ordered mesoporous materials
Ordered porous materials can be classified with respect to their pore size. According
to the IUPAC definition, porous solids are divided into three categories.
Microporous materials: Their pore size is smaller than 2 nm. Zeolites are the well-
known examples of microporous solids. Microporous materials have crystalline
network structure and as a result they offer extremely narrow pore size distribution
which is the key factor in guest-host chemistry and shape selective catalysis.
However, they suffer from the small pore openings due to mass transfer limitations.
36
Mesoporous materials: Their pore size is in between 2 -50 nm. Having a broad pore
size distribution allows the use of mesoporous materials in the place of zeolites since
mesoporous materials break the pore size constraints of microporous materials.
Famous examples of mesoporous materials are M41S family and aluminosilicate
molecular sieves
Macroporous materials: Their pore size is greater than the 50 nm. Alumina
membranes and porous glasses are the examples of macroporous materials [55].
Porous materials offer the advantage of tunable properties, high chemical, thermal,
and mechanical stabilities with high surface area and large pore volumes. Pore size
distribution flexibility is very important for size specific applications in which host-
guest interactions are quite strong. Ordered mesoporous materials were obtained by
the Mobil Corporation Scientists and MCM-41(Mobil Composition of Matter No.41)
exhibits a highly ordered hexagonal array of unidimensional cylindrical pores with a
narrow pore size distribution. These materials have long range order with a surface
area of above 1000 m2/g. These properties make them attractive catalyst supports.
The walls of MCM-41 are amorphous. There are also other types of mesoporous
materials such as MCM-48 which is in the cubic form and MCM-50 which is in the
lamellar structure [56].
Specific formation of pores with a predetermined size distribution is enabled by
liquid crystals forming template, which is the characteristic approach of MCM type
materials. Liquid crystal templating mechanism was proposed by Kresge et al. [57]
and two possible synthesis routes were proposed for the formation of the MCM-41 as
shown in Figure 7.
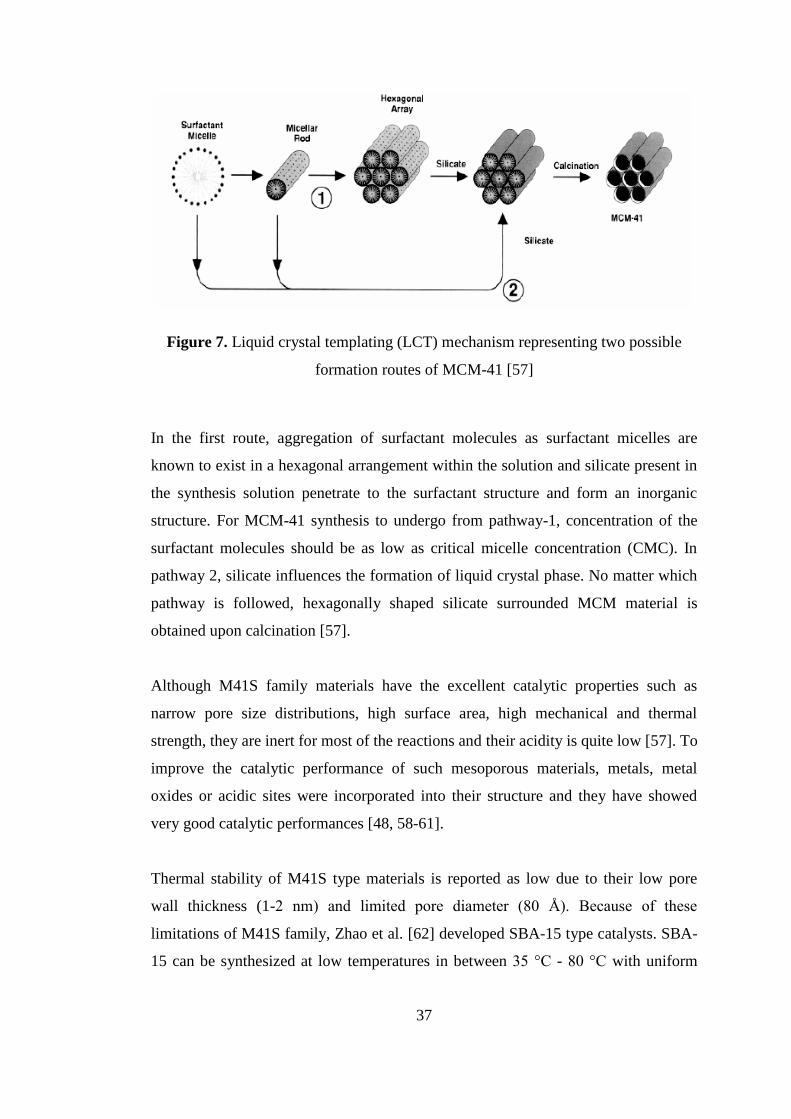
37
Figure 7. Liquid crystal templating (LCT) mechanism representing two possible
formation routes of MCM-41 [57]
In the first route, aggregation of surfactant molecules as surfactant micelles are
known to exist in a hexagonal arrangement within the solution and silicate present in
the synthesis solution penetrate to the surfactant structure and form an inorganic
structure. For MCM-41 synthesis to undergo from pathway-1, concentration of the
surfactant molecules should be as low as critical micelle concentration (CMC). In
pathway 2, silicate influences the formation of liquid crystal phase. No matter which
pathway is followed, hexagonally shaped silicate surrounded MCM material is
obtained upon calcination [57].
Although M41S family materials have the excellent catalytic properties such as
narrow pore size distributions, high surface area, high mechanical and thermal
strength, they are inert for most of the reactions and their acidity is quite low [57]. To
improve the catalytic performance of such mesoporous materials, metals, metal
oxides or acidic sites were incorporated into their structure and they have showed
very good catalytic performances [48, 58-61].
Thermal stability of M41S type materials is reported as low due to their low pore
wall thickness (1-2 nm) and limited pore diameter (80 Å). Because of these
limitations of M41S family, Zhao et al. [62] developed SBA-15 type catalysts. SBA-
15 can be synthesized at low temperatures in between 35 °C - 80 °C with uniform
38
pore sizes and pore wall thicknesses by using triblock copolymers as structure
directing agents. PEO-PPO-PEO is used as triblock copolymer due to its
mesostructural ordering properties, amphilic character, low cost, commercial
availability and biodegradability. It is reported that the synthesized SBA-15 has a
wall thickness larger than MCM-41 which makes SBA-15 hydrothermally more
stable. Zhao et al. also stated that the pore size and wall thickness of SBA-15
material can be adjusted by changing the heating temperature between 35 °C and 140
°C and by changing the aging time between 11 to 72 hours. Moreover, the effect of
boiling water on SBA-15 and MCM-41 is found out that MCM-41 became
amorphous after 6 hours whereas SBA-15 retained stable after 24 hours. SBA-15
could only be synthesized at strongly acidic conditions, pH<1. Higher pH values
results deformation of the material. Aktas et al. [63] investigated the importance of
pH for SBA-15 synthesis. SBA-15 and SBA-15 like materials are synthesized at
acidic conditions, pH<1 and pH>1, respectively. It is found that deformation of the
material increases and pore diameters decrease as the pH increases.
5.2. CATALYST TREATMENTS
5.2.1. Hydrothermal transformations
In the synthesis of ordered mesoporous materials and most of the zeolites,
hydrothermal synthesis has been used. Hydrothermal transformation is usually
carried out at low to moderate temperatures in the range of 100 °C – 300 °C in the
autoclaves. Mother liquor which is usually water was subjected to several structural
and textural transformations in the hydrothermal synthesis step. These
transformations can be given as
Small crystals and amorphous particles grow to large crystals and amorphous
particles
Amorphous particles are crystallized
Crystalline structures change to other crystalline structures
Pores of the gels shrink
39
These transformations tend to reach to the thermodynamic equilibrium, so there is a
decrease of the free energy of the system in the hydrothermal synthesis [52].
In the hydrothermal synthesis, several parameters such as the temperature, pressure,
pH, and concentration influence the final product properties as well as the
hydrothermal synthesis duration. It is possible to tune the catalyst properties by
changing these parameters. Resultant mixture from the hydrothermal synthesis must
be followed by filtration, washing, drying, and calcination [52].
5.2.2. Washing
Washing is used to remove the undesired and useless ions from the suspension of
product containing solution. In ordered mesoporous material, washing can remove
the surfactant to an extent. For some applications, hot washing water could increase
the efficiency of the washing by increasing the exchange rate of ions [52].
5.2.3. Drying
The main function of drying is the removal of solvent, which is usually water, from
the pores of the catalyst. Removal of solvent must be controlled since it can result in
the collapse of mesostructure, decrease the porosity, and loss of pore volume.
Therefore, drying affects the quality of the final product to a large extent. Collapse of
the structure could happen due to the internal pressure of water which remains in the
small pores of the catalyst after the water in the larger pores is removed. This
situation can be prevented by carrying out drying at low temperatures and in vacuum.
By this way, large capillary stresses can be prevented [52].
5.2.4. Calcination
Calcination is a heat treatment of the catalysts under the flow of fluid. Several fluids
can be used such as dry air, nitrogen, helium or mixture of these. The processes
occurring in the calcination can be described as follows, [50,52]
40
Chemically bonded water is removed.
Small crystals and particles grow to large crystals and particles
Structural modification, phase change, and generation of active phase occur
Mechanical properties are stabilized.
Thermally unstable compounds such as carbonates, nitrates, hydroxides, and
organic salts are converted to oxides.
5.3. CHARACTERIZATION METHODS
5.3.1. X-Ray Diffraction (XRD)
X-ray diffraction is one of the oldest, basic techniques for the characterization of
materials. Crystalline phases can be identified and particle sizes can be obtained by
the XRD. Atoms scatter the X-rays and direction of them is given by the Bragg‟s
law. Bragg‟s law is given in the equation 5.2 [64].
5.2.
where is the wavelength of the X-rays
d is the distance between two lattice planes
is the angle between the incoming X-rays
Calculated lattice spacings are characteristics for the particular compound and used
in the identifying the particle. By this characterization technique, mesoporous two-
dimensional hexagonal structure is also well demonstrated and it provides
information about the pore structure of the mesoporous materials. In a typical XRD
pattern of a mesoporous material, a major diffraction peak (100) and two to five
reflection peaks, i.e. (110), (200) and (210) are observed before 2θ value of 10o
which are caused by well-ordered two-dimensional hexagonal structure [65]. For
pure siliceous mesoporous materials, at higher degrees of 2θ values, no peaks are
observed, because the walls are composed of amorphous silica, the ordering lies in
the pore structure [55]. On the other hand, for the active site incorporated
mesoporous materials, at high angles, peaks of incorporated crystalline metal
structures are observed. This is also the case for the co-precipitated catalysts in
41
which mesoporous structure is absent. For this reason, only high angle X-ray
diffraction was applied for co-precipitated catalysts whereas high and low angle
diffraction was applied for the ordered mesoporous materials.
5.3.2. Nitrogen Physisorption
One of the primary methods for characterization of porous materials is physisorption.
Mainly, physisorption analysis is performed by cooling the material to a temperature
near the normal liquefaction point (77 K for nitrogen) and measuring the amount of
nitrogen is measured with changing nitrogen pressure. An isotherm is obtained by
this procedure and the pore structure information including pore sizes, surface area,
and pore size distribution are obtained. Different models have been developed to
calculate the pore size distribution such as BET (Bruanauer, Emmett, Teller) and
BJH ( Barrett, Joyner, Halenda) [66].
5.3.3. Scanning Electron Microscopy (SEM)
Scanning electron microscopy is a characterization technique used to obtain
information on morphology, crystallography, and chemical composition. Information
is obtained from electron beams which transmit the sample [64].
For the inspection of the surface morphology of the catalytic materials, scanning
electron microscopy is wildly used. It is analogous to scanning transmission electron
microscopy. This method involves detection of black-scattered and secondary
electrons as well as X-rays that are black-scattered from the sample. This technique
can be used on thick samples [55].
5.3.4. Energy Dispersive Spectroscopy (EDS)
An approximate composition of the bulk is obtained by energy dispersive
spectroscopy which is mounted to the SEM apparatus. It is based on collecting and
energy dispersion of characteristic X-rays. Relative amount of each element in the
catalyst is obtained by the resulting X-ray spectrum [55].
42
5.3.5. Diffuse Reflectance Infrared Fourier Transform Spectroscopy (DRIFTS
FTIR)
Acid sites of the catalysts can be determined by DRIFTS of pyridine adsorption.
Brönsted and lewis acid sites of the synthesized catalysts can be identified in this
technique. When light hits to the surface of a material, it is partially reflected and
transmitted. Moreover, light which has passed the material is absorbed and reflected
again. The sum of these radiations is the diffuse reflectance of the sample [67].
43
CHAPTER 6
EXPERIMENTAL
6. EXPERIMENTAL
In the present study, several catalysts were prepared for methanol synthesis,
methanol dehydration and direct synthesis of dimethyl ether from synthesis gas.
Several catalyst preparation methods, including co-precipitation, one-pot direct
synthesis and impregnation have been used. Moreover, bi-functional catalyst beds
were prepared by dry physical mixing. In this chapter, catalyst preparation methods
are explained in detail. Characterization results which have been applied for the
synthesized catalysts are also presented. Finally, high pressure reactive flow system,
which was constructed to carry out methanol synthesis, methanol dehydration, and
direct synthesis of DME is described in detail.
6.1. CATALYST SYNTHESIS
6.1.1. Synthesis of Co-Precipitated Catalysts
Co-precipitated catalysts were prepared by modifying the procedure of co-
precipitation method reported by Saito et al. [26]. For the synthesis of the co-
precipitated catalysts, following chemical reagents were used.
Source of Metals :Copper nitrate trihydrate, Cu(NO3)2.3H2O, Merck
Zinc nitrate tetrahydrate, Zn(NO3)2.4H2O, Merck
Cerium(III) nitrate hexahydrate, Ce(NO3)3.6H2O, Merck
Zirconyl nitrate monohydrate, ZrO(NO3)2.H2O, Aldrich
44
Aluminium nitrate nonahydrate, Al(NO3).9H2O, Merck
Source of Medium :Deionized water (Millipore Ultra-Pure Water System, Milli-
QPlus)
Source of precipitant: Sodium carbonate, Na2CO3, Merck
Synthesis of co-precipitated catalyst consists of five important steps: preparation of
synthesis solution, aging, washing, drying, and calcination.
In the synthesis 600 ml of deionized water was heated to the 70 ºC while mixing with
a magnetic stirrer. 1 M metal solution was prepared by dissolving the required
amounts of metal salts in water and 1.1 M precipitant solution was prepared by
dissolving the required amounts of sodium carbonate in water.
Precipitation of 1 M metal solutions was made with the 100 ml solution. Such a
solution requires the addition of 0.1 mole metals to the solution and metal ratio was
chosen as Cu:Zn:Al =6:3:1 in mole basis.
Metal and precipitant solutions were fed to burettes and simultaneous and dropwise
additions of the solutions were started. While simultaneous addition was taking
place, pH of the main solution was measured. pH of the solution changes by the
addition of solutions. Metal solution decreased the pH whereas carbonate solution
was increasing it. Choice of the pH is very important since it directly affects the
precipitation quality and it was determined to be kept constant at 7. For this reason,
flow rate of the metal salts and carbonate solutions were kept controlled and pH was
kept constant at 7.0-7.2 successfully. Time in which solutions were added to the
mixture was recorded and it took about 30 minutes for 100 ml of metal solution.
After metal and carbonate solutions were added, aging was started at 70ºC while
mixing the main solution. When aging was completed at different durations, main
solution was allowed to cool to room temperature.
45
Washing of the co-precipitated catalyst was done via the filtered washer with a
membrane filter having the porosity-4. During the washing step, solution was fed to
the washer and resultant precipitant was accumulated on the filter. After 2 liters of
deionized water was passed through the accumulated solid, it was taken to the beaker
and mixed with 500 ml of deionized water, for 30 minutes. After mixing, the solution
was again fed to the washer and solid accumulation was observed while all water
was filtered. Then, 3 liters of deionized water was passed again over the sample.
After the washing, drying was necessary and it was done in the oven at 120 °C. The
material was taken from the filter and placed in oven, which was at 120 °C. Drying
period was 24 hr.
For the calcination of the dried samples, catalyst was placed in a quartz tubular
reactor with a membrane filter of porosity-2. The main purpose of the membrane
filter was to prevent the removal of solid particles via air flow. The reactor was
placed into the middle of the tubular furnace and air was passed through the sample
at a rate of 1 dm3/min and at a pressure of 4 bar. Furnace was heated from the
ambient temperature to the final calcination temperature of 350 ºC at a rate of 1
ºC/min and kept at 350 ºC for 6 hr. The exit of the reactor was connected to the
ventilation system so that exhaust gas is sent to vent. After 6 hours was completed,
material was allowed to cool and air flow was continued until the furnace
temperature was decreased to nearly 80 ºC.
Several catalysts were prepared by the co-precipitation method. Experimental
procedure is depicted in Figure 8. Effect of promoter, promoter type, aging time,
washing water temperature, calcination temperature, and reduction temperature were
investigated by preparing different catalysts.
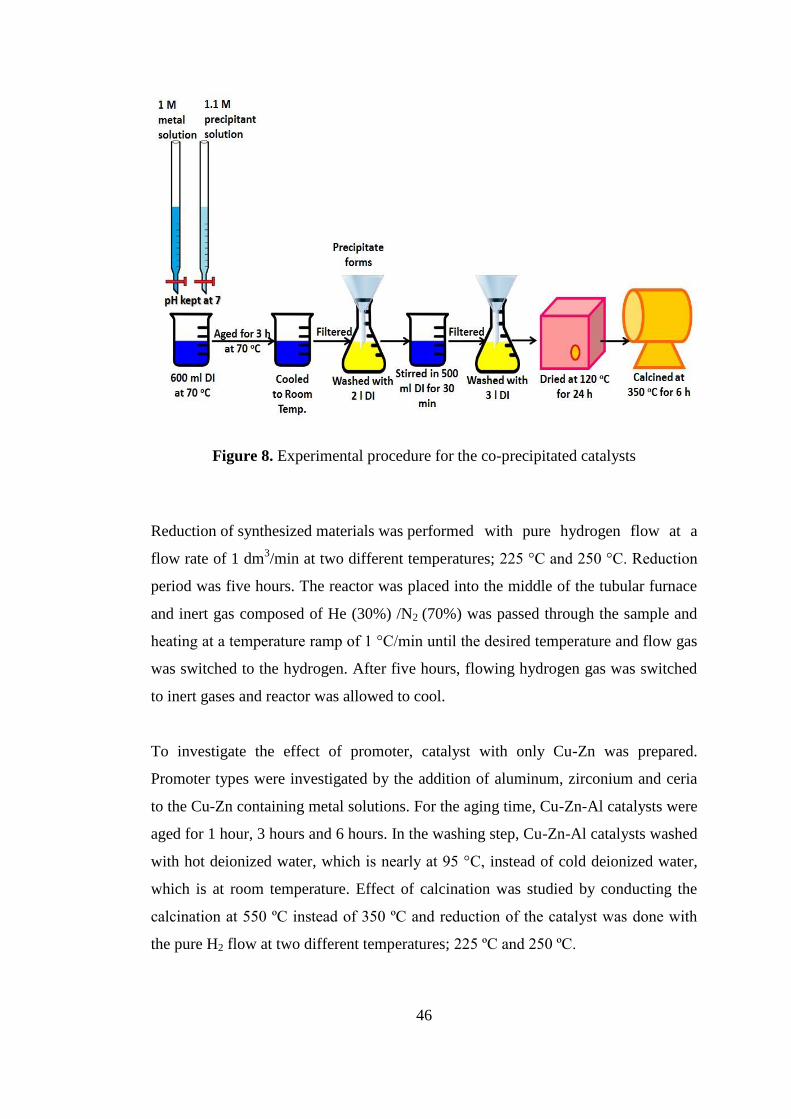
46
Figure 8. Experimental procedure for the co-precipitated catalysts
Reduction of synthesized materials was performed with pure hydrogen flow at a
flow rate of 1 dm3/min at two different temperatures; 225 °C and 250 °C. Reduction
period was five hours. The reactor was placed into the middle of the tubular furnace
and inert gas composed of He (30%) /N2 (70%) was passed through the sample and
heating at a temperature ramp of 1 °C/min until the desired temperature and flow gas
was switched to the hydrogen. After five hours, flowing hydrogen gas was switched
to inert gases and reactor was allowed to cool.
To investigate the effect of promoter, catalyst with only Cu-Zn was prepared.
Promoter types were investigated by the addition of aluminum, zirconium and ceria
to the Cu-Zn containing metal solutions. For the aging time, Cu-Zn-Al catalysts were
aged for 1 hour, 3 hours and 6 hours. In the washing step, Cu-Zn-Al catalysts washed
with hot deionized water, which is nearly at 95 °C, instead of cold deionized water,
which is at room temperature. Effect of calcination was studied by conducting the
calcination at 550 ºC instead of 350 ºC and reduction of the catalyst was done with
the pure H2 flow at two different temperatures; 225 ºC and 250 ºC.
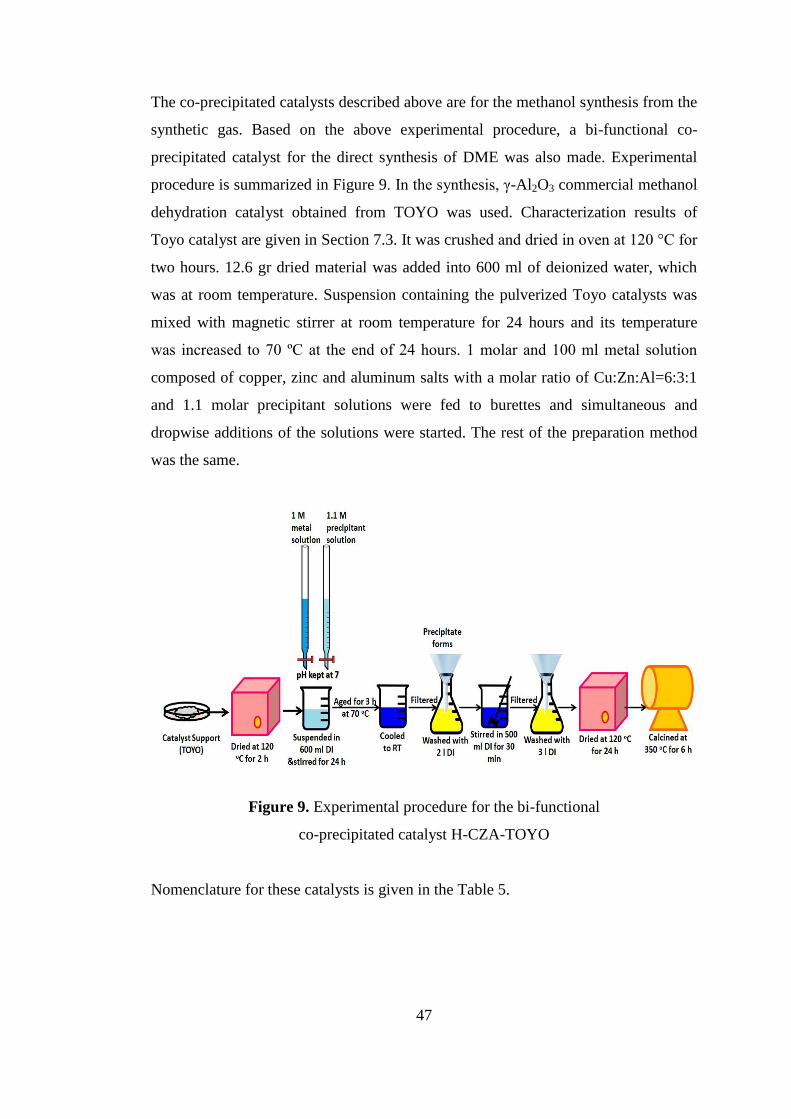
47
The co-precipitated catalysts described above are for the methanol synthesis from the
synthetic gas. Based on the above experimental procedure, a bi-functional co-
precipitated catalyst for the direct synthesis of DME was also made. Experimental
procedure is summarized in Figure 9. In the synthesis, γ-Al2O3 commercial methanol
dehydration catalyst obtained from TOYO was used. Characterization results of
Toyo catalyst are given in Section 7.3. It was crushed and dried in oven at 120 °C for
two hours. 12.6 gr dried material was added into 600 ml of deionized water, which
was at room temperature. Suspension containing the pulverized Toyo catalysts was
mixed with magnetic stirrer at room temperature for 24 hours and its temperature
was increased to 70 ºC at the end of 24 hours. 1 molar and 100 ml metal solution
composed of copper, zinc and aluminum salts with a molar ratio of Cu:Zn:Al=6:3:1
and 1.1 molar precipitant solutions were fed to burettes and simultaneous and
dropwise additions of the solutions were started. The rest of the preparation method
was the same.
Figure 9. Experimental procedure for the bi-functional
co-precipitated catalyst H-CZA-TOYO
Nomenclature for these catalysts is given in the Table 5.
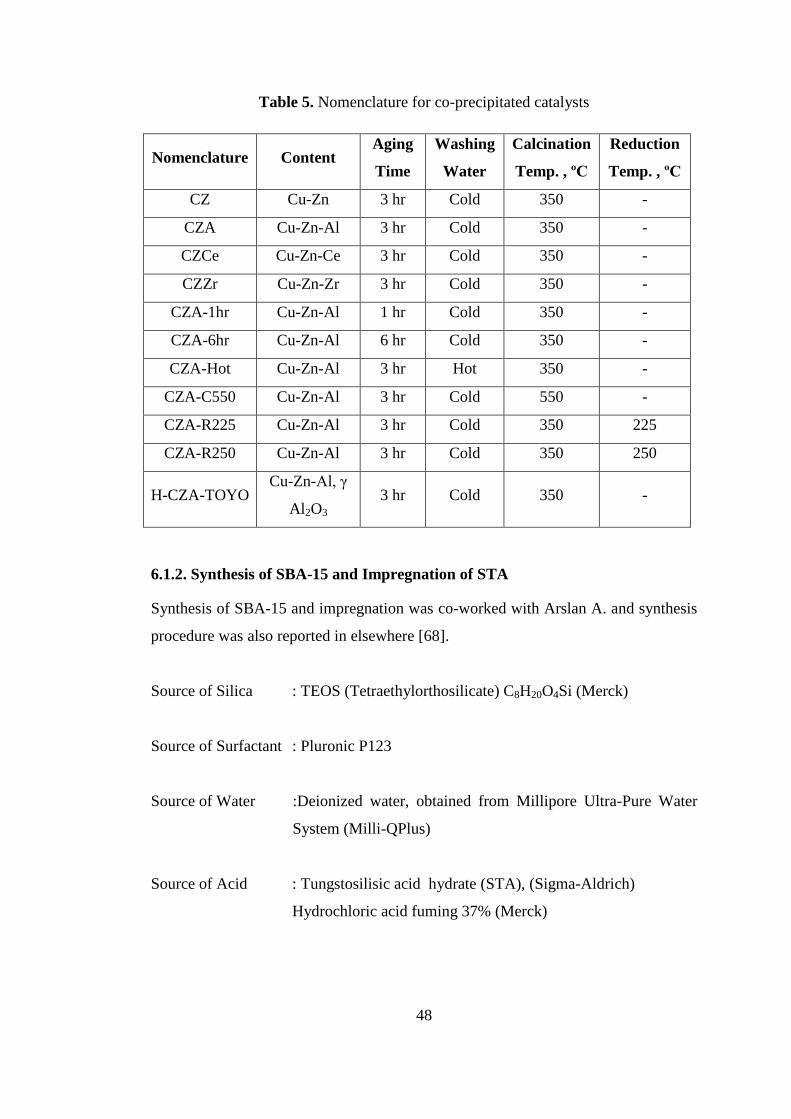
48
Table 5. Nomenclature for co-precipitated catalysts
Nomenclature Content Aging
Time
Washing
Water
Calcination
Temp. , ºC
Reduction
Temp. , ºC
CZ Cu-Zn 3 hr Cold 350 -
CZA Cu-Zn-Al 3 hr Cold 350 -
CZCe Cu-Zn-Ce 3 hr Cold 350 -
CZZr Cu-Zn-Zr 3 hr Cold 350 -
CZA-1hr Cu-Zn-Al 1 hr Cold 350 -
CZA-6hr Cu-Zn-Al 6 hr Cold 350 -
CZA-Hot Cu-Zn-Al 3 hr Hot 350 -
CZA-C550 Cu-Zn-Al 3 hr Cold 550 -
CZA-R225 Cu-Zn-Al 3 hr Cold 350 225
CZA-R250 Cu-Zn-Al 3 hr Cold 350 250
H-CZA-TOYO Cu-Zn-Al, γ
Al2O3 3 hr Cold 350 -
6.1.2. Synthesis of SBA-15 and Impregnation of STA
Synthesis of SBA-15 and impregnation was co-worked with Arslan A. and synthesis
procedure was also reported in elsewhere [68].
Source of Silica : TEOS (Tetraethylorthosilicate) C8H20O4Si (Merck)
Source of Surfactant : Pluronic P123
Source of Water :Deionized water, obtained from Millipore Ultra-Pure Water
System (Milli-QPlus)
Source of Acid : Tungstosilisic acid hydrate (STA), (Sigma-Aldrich)
Hydrochloric acid fuming 37% (Merck)
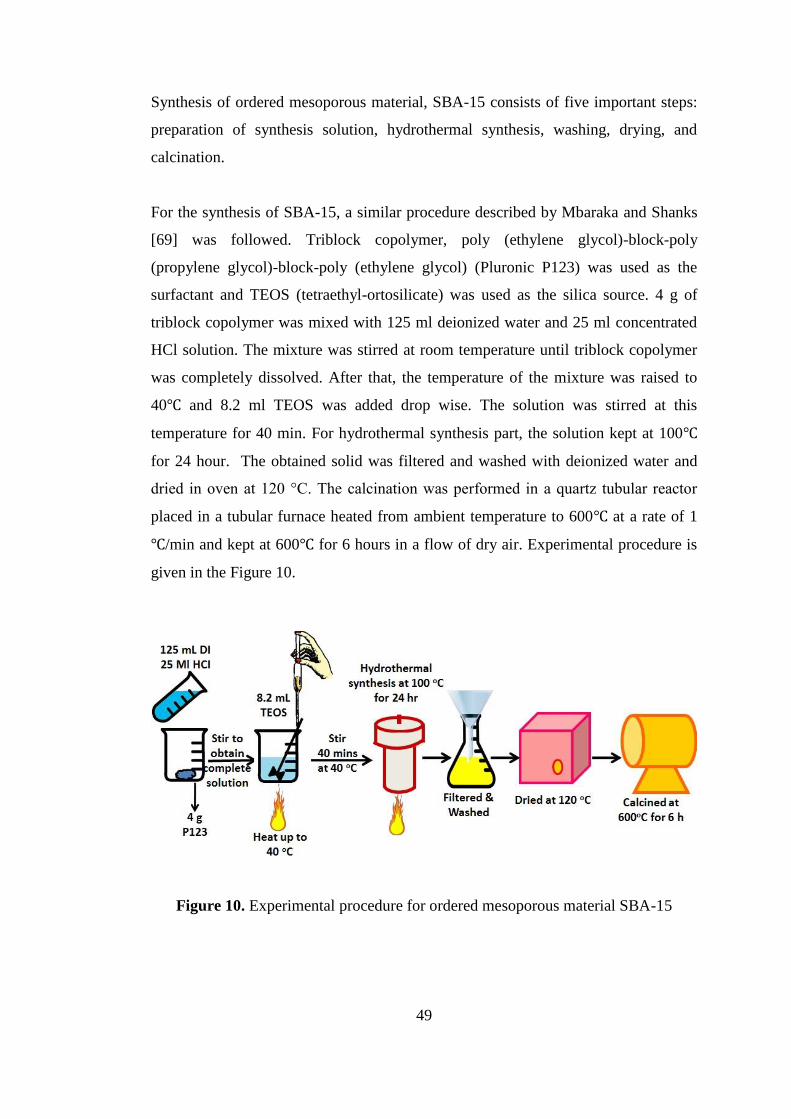
49
Synthesis of ordered mesoporous material, SBA-15 consists of five important steps:
preparation of synthesis solution, hydrothermal synthesis, washing, drying, and
calcination.
For the synthesis of SBA-15, a similar procedure described by Mbaraka and Shanks
[69] was followed. Triblock copolymer, poly (ethylene glycol)-block-poly
(propylene glycol)-block-poly (ethylene glycol) (Pluronic P123) was used as the
surfactant and TEOS (tetraethyl-ortosilicate) was used as the silica source. 4 g of
triblock copolymer was mixed with 125 ml deionized water and 25 ml concentrated
HCl solution. The mixture was stirred at room temperature until triblock copolymer
was completely dissolved. After that, the temperature of the mixture was raised to
40℃ and 8.2 ml TEOS was added drop wise. The solution was stirred at this
temperature for 40 min. For hydrothermal synthesis part, the solution kept at 100℃
for 24 hour. The obtained solid was filtered and washed with deionized water and
dried in oven at 120 °C. The calcination was performed in a quartz tubular reactor
placed in a tubular furnace heated from ambient temperature to 600℃ at a rate of 1
℃/min and kept at 600℃ for 6 hours in a flow of dry air. Experimental procedure is
given in the Figure 10.
Figure 10. Experimental procedure for ordered mesoporous material SBA-15
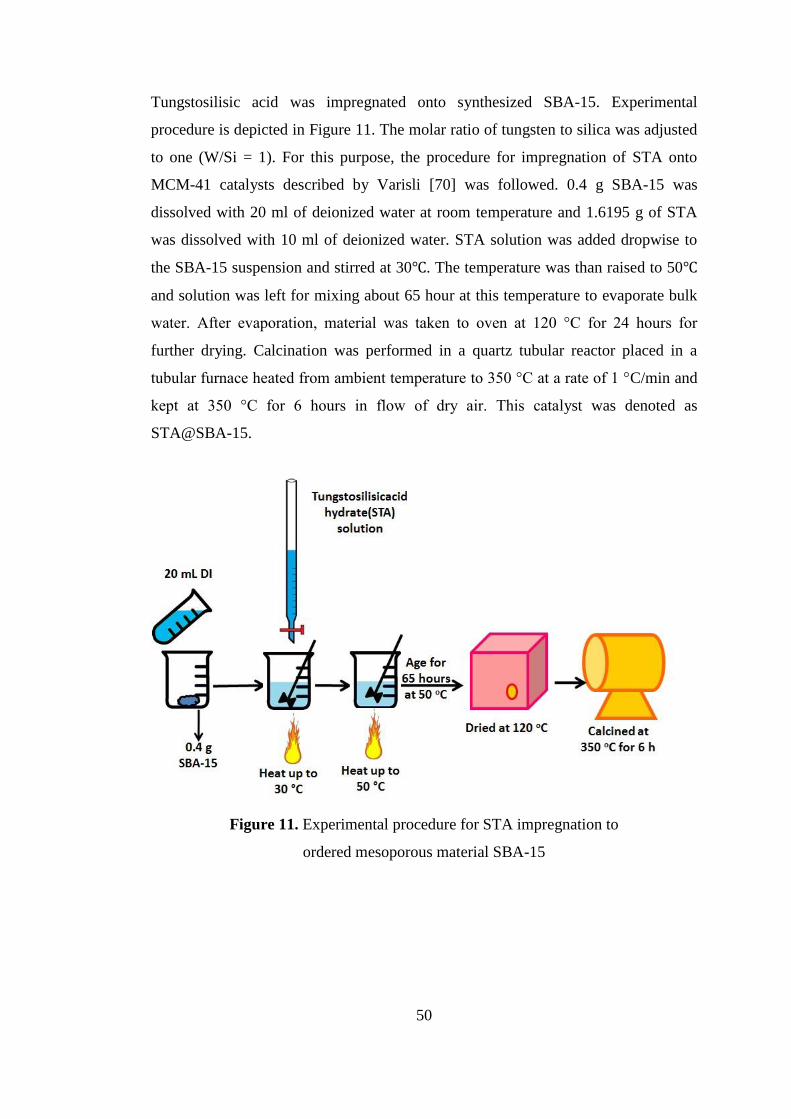
50
Tungstosilisic acid was impregnated onto synthesized SBA-15. Experimental
procedure is depicted in Figure 11. The molar ratio of tungsten to silica was adjusted
to one (W/Si = 1). For this purpose, the procedure for impregnation of STA onto
MCM-41 catalysts described by Varisli [70] was followed. 0.4 g SBA-15 was
dissolved with 20 ml of deionized water at room temperature and 1.6195 g of STA
was dissolved with 10 ml of deionized water. STA solution was added dropwise to
the SBA-15 suspension and stirred at 30℃. The temperature was than raised to 50℃
and solution was left for mixing about 65 hour at this temperature to evaporate bulk
water. After evaporation, material was taken to oven at 120 °C for 24 hours for
further drying. Calcination was performed in a quartz tubular reactor placed in a
tubular furnace heated from ambient temperature to 350 °C at a rate of 1 °C/min and
kept at 350 °C for 6 hours in flow of dry air. This catalyst was denoted as
STA@SBA-15.
Figure 11. Experimental procedure for STA impregnation to
ordered mesoporous material SBA-15
51
6.1.3. Dry-Physical Mixing and Sequenced Catalysts
In the direct synthesis of dimethyl ether, bi-functional catalysts containing methanol
synthesis and dehydration sites are required. One function is to synthesize methanol
from the synthetic gases whereas the other function is to convert synthesized
methanol into the dimethyl ether. For this purpose, several catalysts were prepared
and their preparation procedure and synthesis details were given in previous sections;
Section 6.1.1 and 6.1.2.
Among the synthesized catalysts, some of them are able to perform only methanol
synthesis and some of them are able to perform only methanol dehydration. An
alternative approach is physical dry mixing of two catalysts to obtain a hybrid bi-
functional catalyst. For this purpose, methanol reforming catalyst, Hifuel R120,
denoted as “MRC”, and commercial methanol synthesis catalyst, obtained from Alfa-
Aesar and denoted as “MSC”, were mixed with the methanol dehydration catalysts;
TOYO and TRC-75(L) type catalysts. TOYO catalyst was γ-Al2O3 based methanol
dehydration catalyst and obtained from Toyo Engineering Corporation. TRC-75(L) is
a novel solid acid methanol dehydration catalyst prepared by a one-pot hydrothermal
procedure. It was tungsten containing, silicate based, and in the structure of M41S
family. This catalyst was synthesized in our laboratory and details of the synthesis
procedure are given early publications of our group [48, 59]. It was shown that TRC-
75(L) catalyst functioned very well in methanol dehydration with very high
conversion and selectivity values. Characterization results of commercial catalysts
are given in Sections 7.3. and 7.4.
In addition to the physical mixing of catalysts, another type of catalyst bed was
prepared by placing catalysts in a sequential way. That is, firstly methanol synthesis
catalysts was placed into the reactor and after that methanol dehydration catalyst was
placed. By this way, reactant gases encountered with methanol synthesis catalysts
first and then methanol dehydration catalyst. This type of reactor bed arrangement is
important to see the effect of the one step DME synthesis over two step DME
synthesis since such a reactor bed behaves like two reactors in series; one of them is
52
operating for methanol synthesis whereas other was operating for methanol
dehydration.
For nomenclature, a letter “C” is added to the end of the catalyst name if the catalyst
within the reactor bed is a mixed catalyst and a letter “S” is added to the end of the
catalyst name if catalysts in the reactor bed are arranged in a sequenced way.
6.2. CHARACTERIZATION TECHNIQUES
Synthesized catalysts were characterized by using several techniques to understand
the physical and chemical structure of the catalysts. In the scope of this study, X-ray
diffraction, nitrogen physisorption, energy dispersive spectroscopy, scanning
electron microscopy, and diffuse reflectance infrared fourier transform spectroscopy
of pyridine adsorption were used.
6.2.1. X-Ray Diffraction (XRD)
For the X-ray diffraction analysis, XRD Rigaku Ultima-IV X-Ray diffractometer in
the METU-Central laboratory was used. In the device, CuK is the radiation source
with a 2θ scanning ranges of low angle ( 0.2° to 10°) and high angle (10° to 80°).
6.2.2. Nitrogen Physisorption
Nitrogen adsorption-desorption analyses were made by a Quantachrome Autosorb-1-
C/MS instrument in the METU Central Laboratory. Degassing was done at 120 °C
for 6 hours before the analyses and the analyses were performed at a relative pressure
range of 5x10⁻² to 0.99 at liquid nitrogen temperature. Multipoint BET surface area
values, BJH adsorption and desorption pore diameters and pore volumes of samples
were determined by this characterization technique. Nitrogen adsorption and
desorption isotherms were plotted and the pore size distributions were determined.
53
6.2.3. Scanning Electron Microscopy (SEM)
Scanning electron microscopy (SEM) analyses were done in the Middle East
Technical University (METU) Central Laboratory by a Quanta 400F field emission
SEM high resolution instrument. Before the analyses, samples were coated with a
gold-palladium alloy.
6.2.4. Energy Dispersive Spectroscopy (EDS)
For the energy dispersive spectroscopy (EDS), SEM instrument Quanta 400F in the
Middle East Technical University-Central Laboratory was used. Before the analyses,
samples were coated with a gold-palladium alloy.
6.2.5. Diffuse Reflectance Infrared Fourier Transform Spectroscopy (Drifts) Of
Pyridine Adsorption
Diffuse reflectance infrared fourier transform spectroscopy of pyridine adsorption
analyses were done at Kinetic Laboratory at Middle East Technical University.
Perkin Elmer Spectrum One instrument was used. 0.035 gr samples were covered
with 1 ml of pyridine. After pyridine covered samples were dried, a prescribed
amounts of pyridine covered and non-covered samples were mixed with KBr in an
amount of 40 times of the sample which is to be analyzed. A reference spectrum was
recorded with KBr. Acidic sites were determined by the subtraction of absorbance of
pyridine covered samples from the absorbance of non-covered samples.
6.3. REACTION SET-UP
The reaction set-up in our laboratory is a high pressure, continuous flow system used
for methanol synthesis and direct synthesis of DME. This experimental set-up was
first built by Arınan A. [8] and it was improved to a large extent in the duration of
this study. A schematic representation of experimental set-up is given in Figure 12.
The reactant gases of CO, CO2, and H2 are fed from the pressurized tanks and gas
flow rates are controlled by the Omega FMA-800A series mass flow controllers.
54
Before mass flow controllers, a vent system is placed for proper operation of flow
controllers. Pressures before the flow controllers are measured by gas regulators and
pressure gauges. Pressure of the controller inlet is adjusted to 10 bars higher of the
operating system pressure. There is a by-pass line near controllers to allow for
operations without the use of flow controllers. After the flow controllers, another
pressure gauge is placed to see the operating pressure of the reaction set-up. A
tubular furnace is placed to keep supply necessary heat to the reactor. After furnace,
a metering valve with an on- off valve and GO BP60 type back pressure regulator are
placed to keep the pressure of the reactive side constant and to arrange the flow rate
of the exhaust line. Before the reactor, pre-heating is achieved at 150 ºC and after the
reactor, heating is done at the same temperature to prevent condensation of products.
An online gas chromatography is present in the reaction set-up to analyze products
and unconverted gases. At the end of the reaction set-up, a soap bubble flow meter is
connected to measure the exit flow rate.
Products and unconverted gases were analyzed online by a SRI 3680 multigas #1 gas
chromatography (GC) equipped with Carbosphere column and a thermal
conductivity detector (TCD). The carrier gas of the GC is helium with a flow rate of
20 cc/min and at a pressure of 4 bar. In the GC, a temperature ramped program is
used and operation parameters are given in the Table 6. Calibration factors and
retention times of the GC are given in the Table 7.
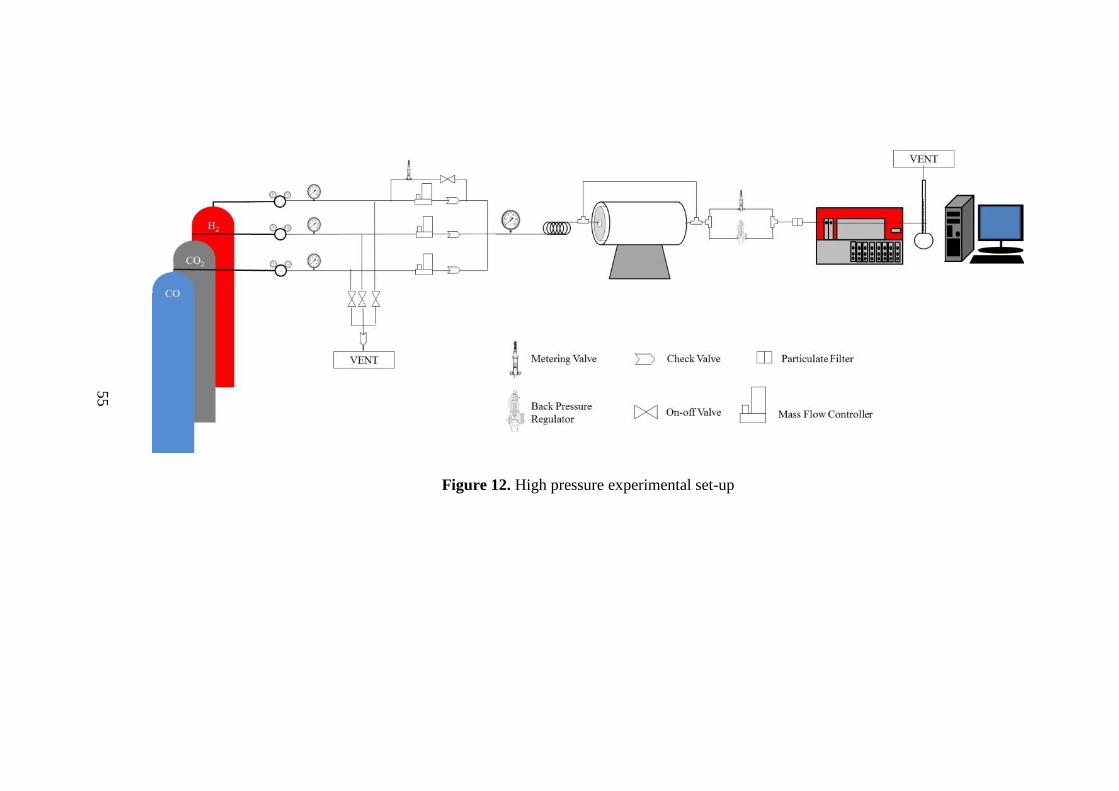
55
Figure 12. High pressure experimental set-up
55
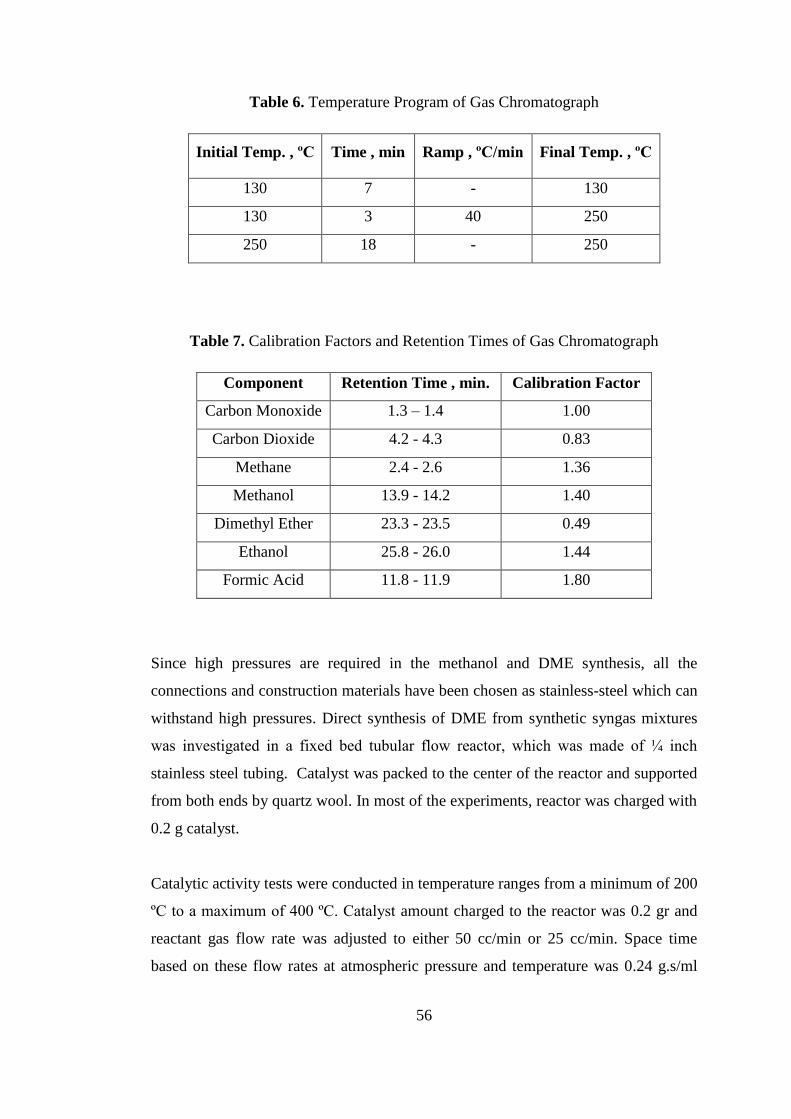
56
Table 6. Temperature Program of Gas Chromatograph
Initial Temp. , ºC Time , min Ramp , ºC/min Final Temp. , ºC
130 7 - 130
130 3 40 250
250 18 - 250
Table 7. Calibration Factors and Retention Times of Gas Chromatograph
Component Retention Time , min. Calibration Factor
Carbon Monoxide 1.3 – 1.4 1.00
Carbon Dioxide 4.2 - 4.3 0.83
Methane 2.4 - 2.6 1.36
Methanol 13.9 - 14.2 1.40
Dimethyl Ether 23.3 - 23.5 0.49
Ethanol 25.8 - 26.0 1.44
Formic Acid 11.8 - 11.9 1.80
Since high pressures are required in the methanol and DME synthesis, all the
connections and construction materials have been chosen as stainless-steel which can
withstand high pressures. Direct synthesis of DME from synthetic syngas mixtures
was investigated in a fixed bed tubular flow reactor, which was made of ¼ inch
stainless steel tubing. Catalyst was packed to the center of the reactor and supported
from both ends by quartz wool. In most of the experiments, reactor was charged with
0.2 g catalyst.
Catalytic activity tests were conducted in temperature ranges from a minimum of 200
ºC to a maximum of 400 ºC. Catalyst amount charged to the reactor was 0.2 gr and
reactant gas flow rate was adjusted to either 50 cc/min or 25 cc/min. Space time
based on these flow rates at atmospheric pressure and temperature was 0.24 g.s/ml
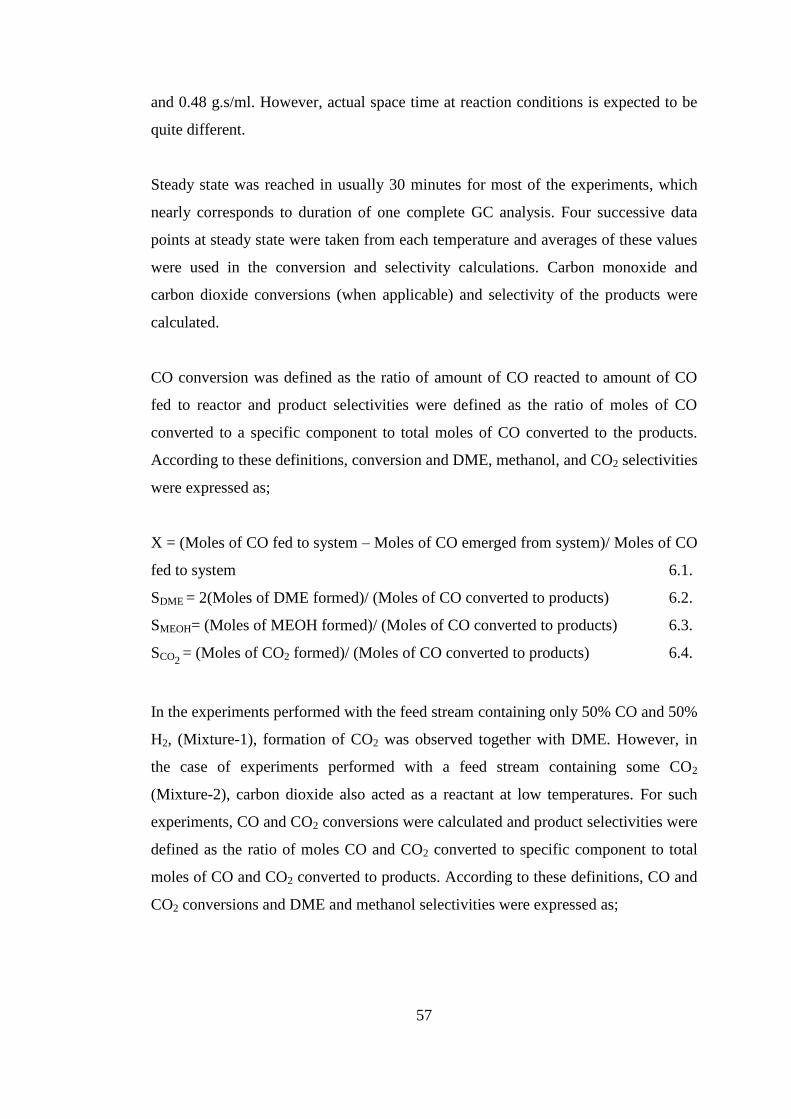
57
and 0.48 g.s/ml. However, actual space time at reaction conditions is expected to be
quite different.
Steady state was reached in usually 30 minutes for most of the experiments, which
nearly corresponds to duration of one complete GC analysis. Four successive data
points at steady state were taken from each temperature and averages of these values
were used in the conversion and selectivity calculations. Carbon monoxide and
carbon dioxide conversions (when applicable) and selectivity of the products were
calculated.
CO conversion was defined as the ratio of amount of CO reacted to amount of CO
fed to reactor and product selectivities were defined as the ratio of moles of CO
converted to a specific component to total moles of CO converted to the products.
According to these definitions, conversion and DME, methanol, and CO2 selectivities
were expressed as;
X = (Moles of CO fed to system – Moles of CO emerged from system)/ Moles of CO
fed to system 6.1.
SDME = 2(Moles of DME formed)/ (Moles of CO converted to products) 6.2.
SMEOH= (Moles of MEOH formed)/ (Moles of CO converted to products) 6.3.
SCO2 = (Moles of CO2 formed)/ (Moles of CO converted to products) 6.4.
In the experiments performed with the feed stream containing only 50% CO and 50%
H2, (Mixture-1), formation of CO2 was observed together with DME. However, in
the case of experiments performed with a feed stream containing some CO2
(Mixture-2), carbon dioxide also acted as a reactant at low temperatures. For such
experiments, CO and CO2 conversions were calculated and product selectivities were
defined as the ratio of moles CO and CO2 converted to specific component to total
moles of CO and CO2 converted to products. According to these definitions, CO and
CO2 conversions and DME and methanol selectivities were expressed as;
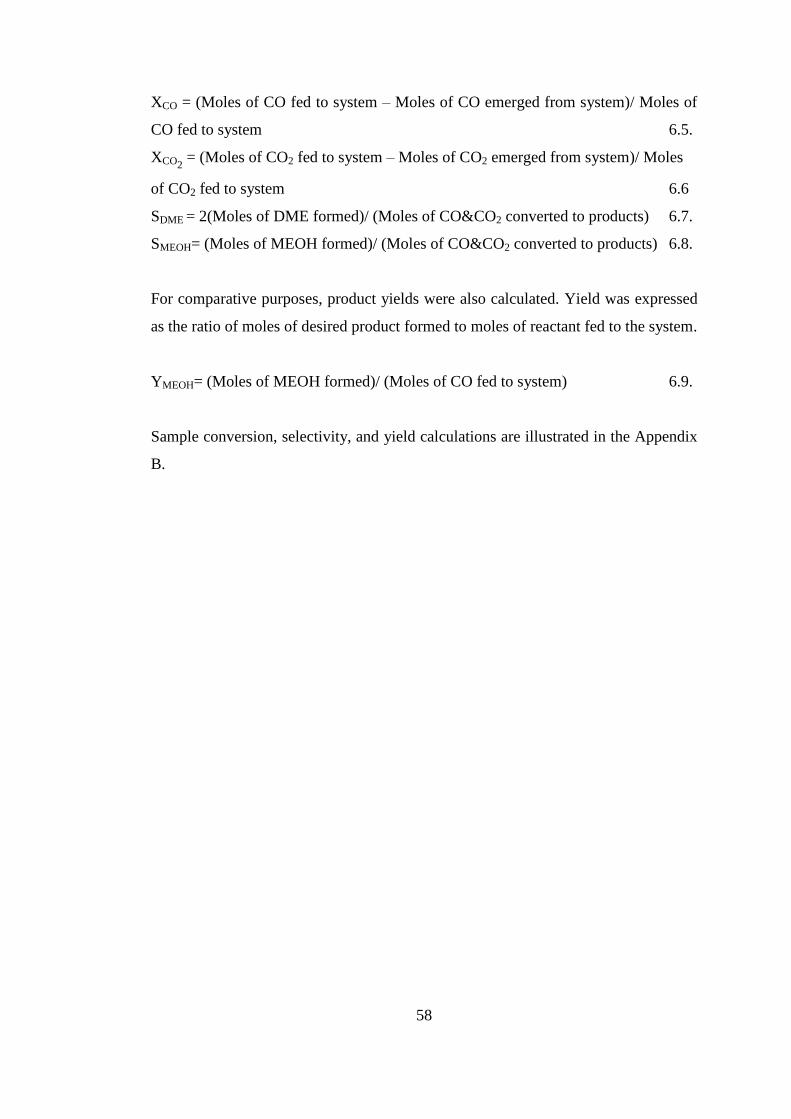
58
XCO = (Moles of CO fed to system – Moles of CO emerged from system)/ Moles of
CO fed to system 6.5.
XCO2 = (Moles of CO2 fed to system – Moles of CO2 emerged from system)/ Moles
of CO2 fed to system 6.6
SDME = 2(Moles of DME formed)/ (Moles of CO&CO2 converted to products) 6.7.
SMEOH= (Moles of MEOH formed)/ (Moles of CO&CO2 converted to products) 6.8.
For comparative purposes, product yields were also calculated. Yield was expressed
as the ratio of moles of desired product formed to moles of reactant fed to the system.
YMEOH= (Moles of MEOH formed)/ (Moles of CO fed to system) 6.9.
Sample conversion, selectivity, and yield calculations are illustrated in the Appendix
B.
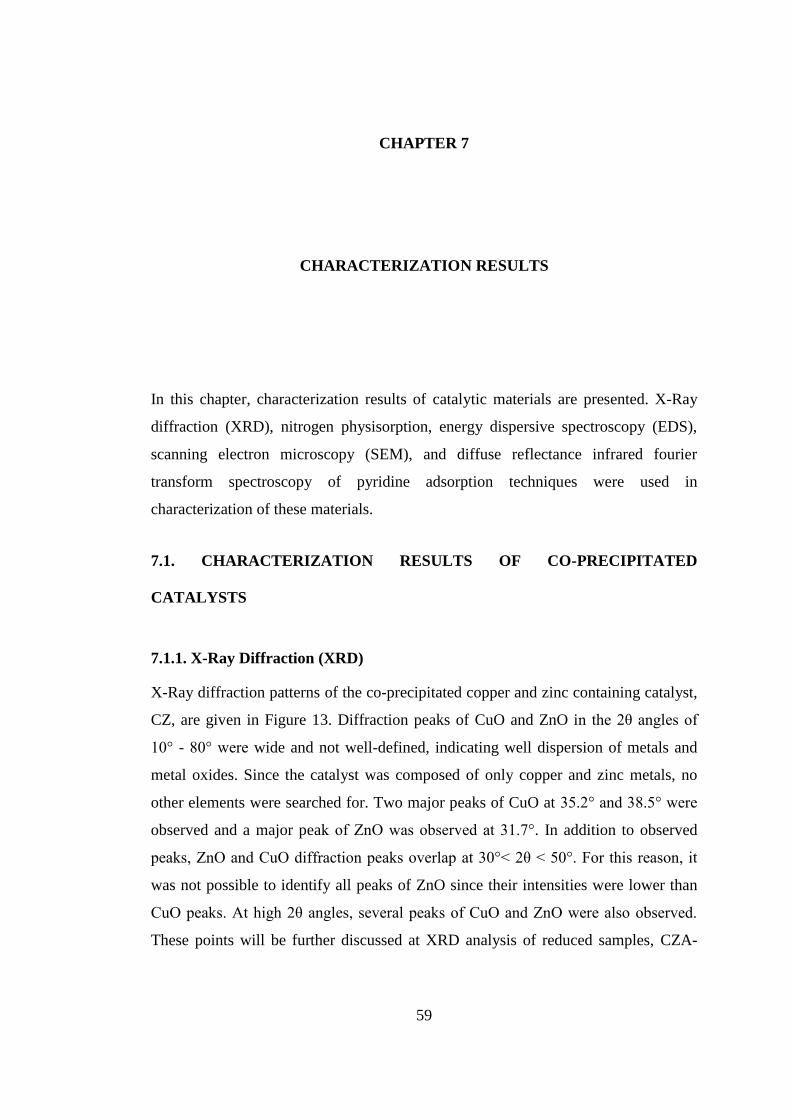
59
CHAPTER 7
CHARACTERIZATION RESULTS
7. CHARACTERIZATION RESULTS
In this chapter, characterization results of catalytic materials are presented. X-Ray
diffraction (XRD), nitrogen physisorption, energy dispersive spectroscopy (EDS),
scanning electron microscopy (SEM), and diffuse reflectance infrared fourier
transform spectroscopy of pyridine adsorption techniques were used in
characterization of these materials.
7.1. CHARACTERIZATION RESULTS OF CO-PRECIPITATED
CATALYSTS
7.1.1. X-Ray Diffraction (XRD)
X-Ray diffraction patterns of the co-precipitated copper and zinc containing catalyst,
CZ, are given in Figure 13. Diffraction peaks of CuO and ZnO in the 2θ angles of
10° - 80° were wide and not well-defined, indicating well dispersion of metals and
metal oxides. Since the catalyst was composed of only copper and zinc metals, no
other elements were searched for. Two major peaks of CuO at 35.2° and 38.5° were
observed and a major peak of ZnO was observed at 31.7°. In addition to observed
peaks, ZnO and CuO diffraction peaks overlap at 30°˂ 2θ ˂ 50°. For this reason, it
was not possible to identify all peaks of ZnO since their intensities were lower than
CuO peaks. At high 2θ angles, several peaks of CuO and ZnO were also observed.
These points will be further discussed at XRD analysis of reduced samples, CZA-
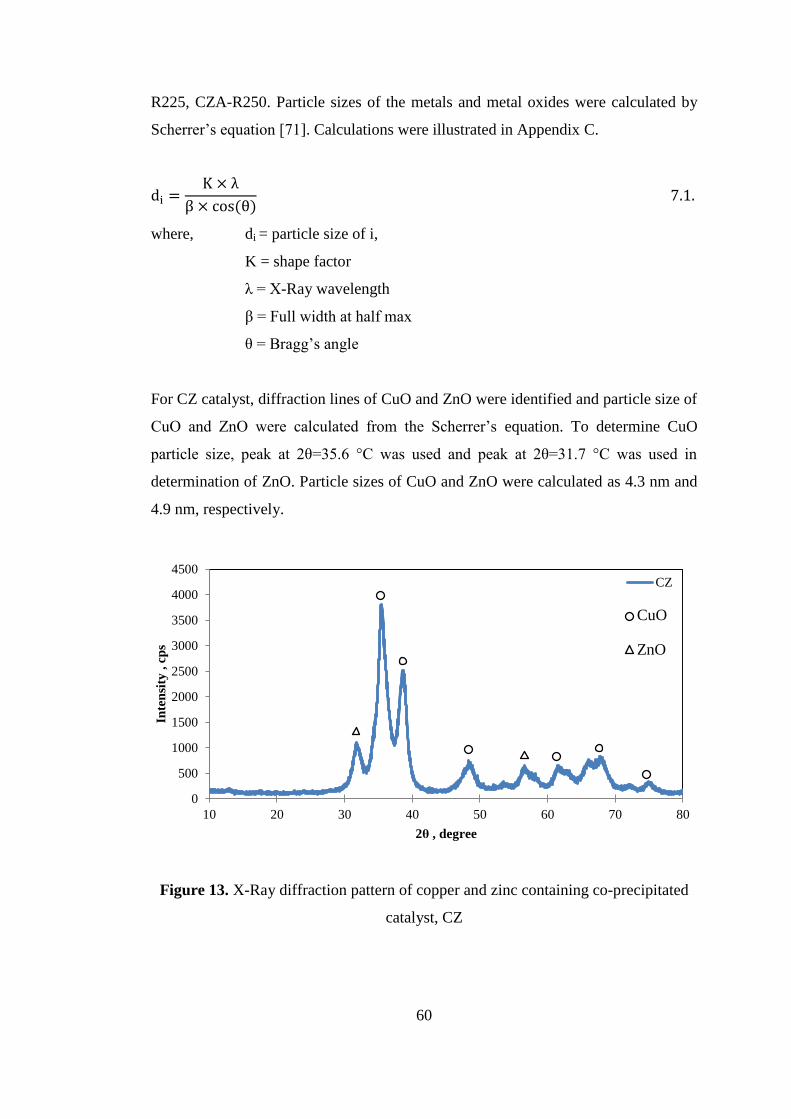
60
R225, CZA-R250. Particle sizes of the metals and metal oxides were calculated by
Scherrer‟s equation [71]. Calculations were illustrated in Appendix C.
( )
where, di = particle size of i,
K = shape factor
λ = X-Ray wavelength
β = Full width at half max
θ = Bragg‟s angle
For CZ catalyst, diffraction lines of CuO and ZnO were identified and particle size of
CuO and ZnO were calculated from the Scherrer‟s equation. To determine CuO
particle size, peak at 2θ=35.6 °C was used and peak at 2θ=31.7 °C was used in
determination of ZnO. Particle sizes of CuO and ZnO were calculated as 4.3 nm and
4.9 nm, respectively.
Figure 13. X-Ray diffraction pattern of copper and zinc containing co-precipitated
catalyst, CZ
0
500
1000
1500
2000
2500
3000
3500
4000
4500
10 20 30 40 50 60 70 80
Inte
nsi
ty ,
cp
s
2θ , degree
CZ
CuO
ZnO
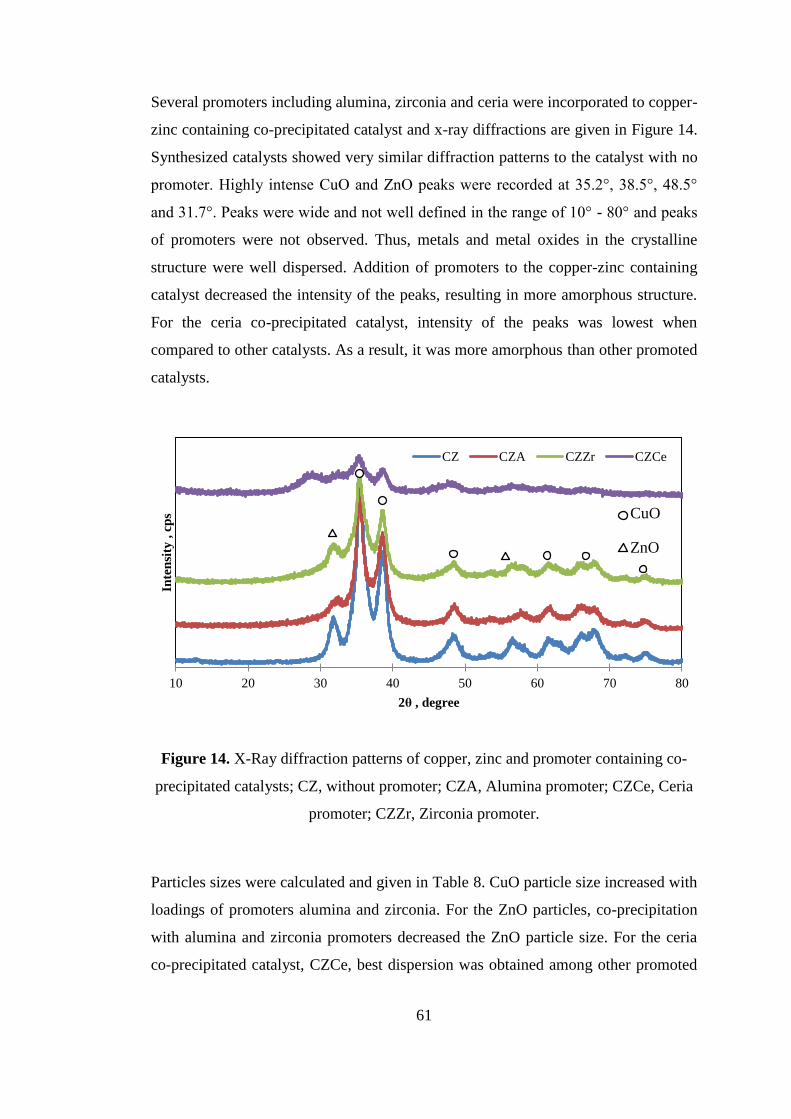
61
Several promoters including alumina, zirconia and ceria were incorporated to copper-
zinc containing co-precipitated catalyst and x-ray diffractions are given in Figure 14.
Synthesized catalysts showed very similar diffraction patterns to the catalyst with no
promoter. Highly intense CuO and ZnO peaks were recorded at 35.2°, 38.5°, 48.5°
and 31.7°. Peaks were wide and not well defined in the range of 10° - 80° and peaks
of promoters were not observed. Thus, metals and metal oxides in the crystalline
structure were well dispersed. Addition of promoters to the copper-zinc containing
catalyst decreased the intensity of the peaks, resulting in more amorphous structure.
For the ceria co-precipitated catalyst, intensity of the peaks was lowest when
compared to other catalysts. As a result, it was more amorphous than other promoted
catalysts.
Figure 14. X-Ray diffraction patterns of copper, zinc and promoter containing co-
precipitated catalysts; CZ, without promoter; CZA, Alumina promoter; CZCe, Ceria
promoter; CZZr, Zirconia promoter.
Particles sizes were calculated and given in Table 8. CuO particle size increased with
loadings of promoters alumina and zirconia. For the ZnO particles, co-precipitation
with alumina and zirconia promoters decreased the ZnO particle size. For the ceria
co-precipitated catalyst, CZCe, best dispersion was obtained among other promoted
10 20 30 40 50 60 70 80
Inte
nsi
ty ,
cp
s
2θ , degree
CZ CZA CZZr CZCe
CuO
ZnO
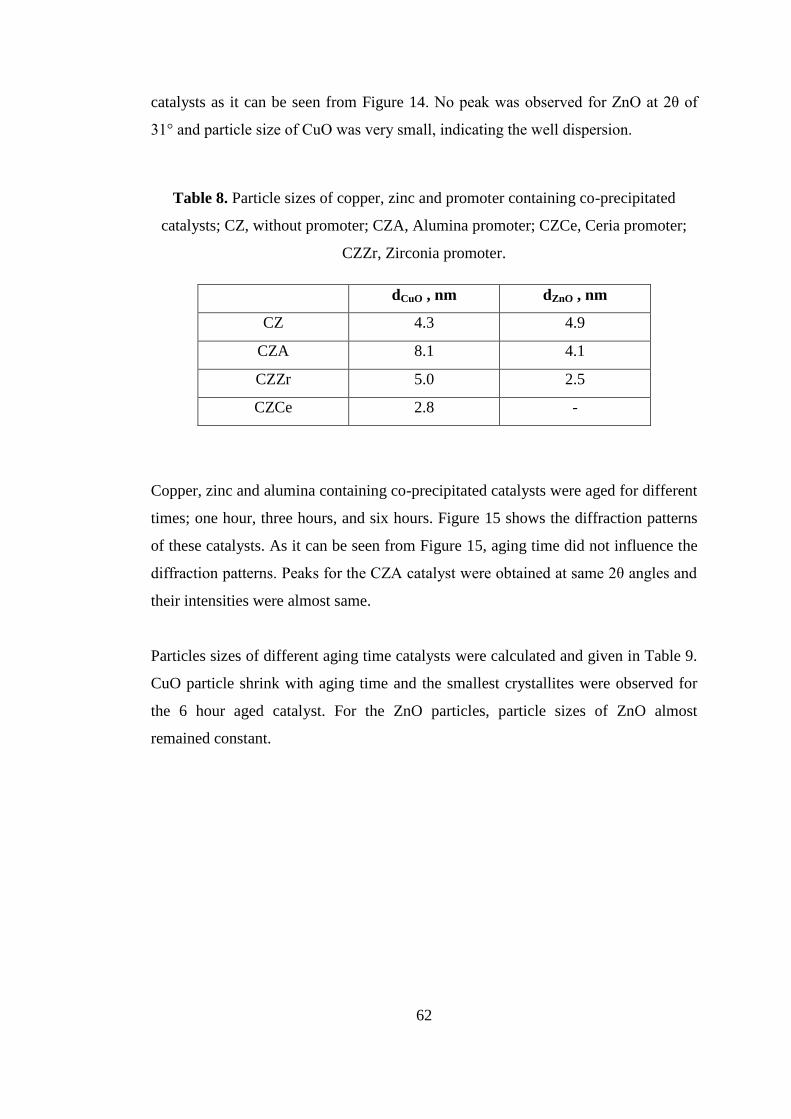
62
catalysts as it can be seen from Figure 14. No peak was observed for ZnO at 2θ of
31° and particle size of CuO was very small, indicating the well dispersion.
Table 8. Particle sizes of copper, zinc and promoter containing co-precipitated
catalysts; CZ, without promoter; CZA, Alumina promoter; CZCe, Ceria promoter;
CZZr, Zirconia promoter.
dCuO , nm dZnO , nm
CZ 4.3 4.9
CZA 8.1 4.1
CZZr 5.0 2.5
CZCe 2.8 -
Copper, zinc and alumina containing co-precipitated catalysts were aged for different
times; one hour, three hours, and six hours. Figure 15 shows the diffraction patterns
of these catalysts. As it can be seen from Figure 15, aging time did not influence the
diffraction patterns. Peaks for the CZA catalyst were obtained at same 2θ angles and
their intensities were almost same.
Particles sizes of different aging time catalysts were calculated and given in Table 9.
CuO particle shrink with aging time and the smallest crystallites were observed for
the 6 hour aged catalyst. For the ZnO particles, particle sizes of ZnO almost
remained constant.
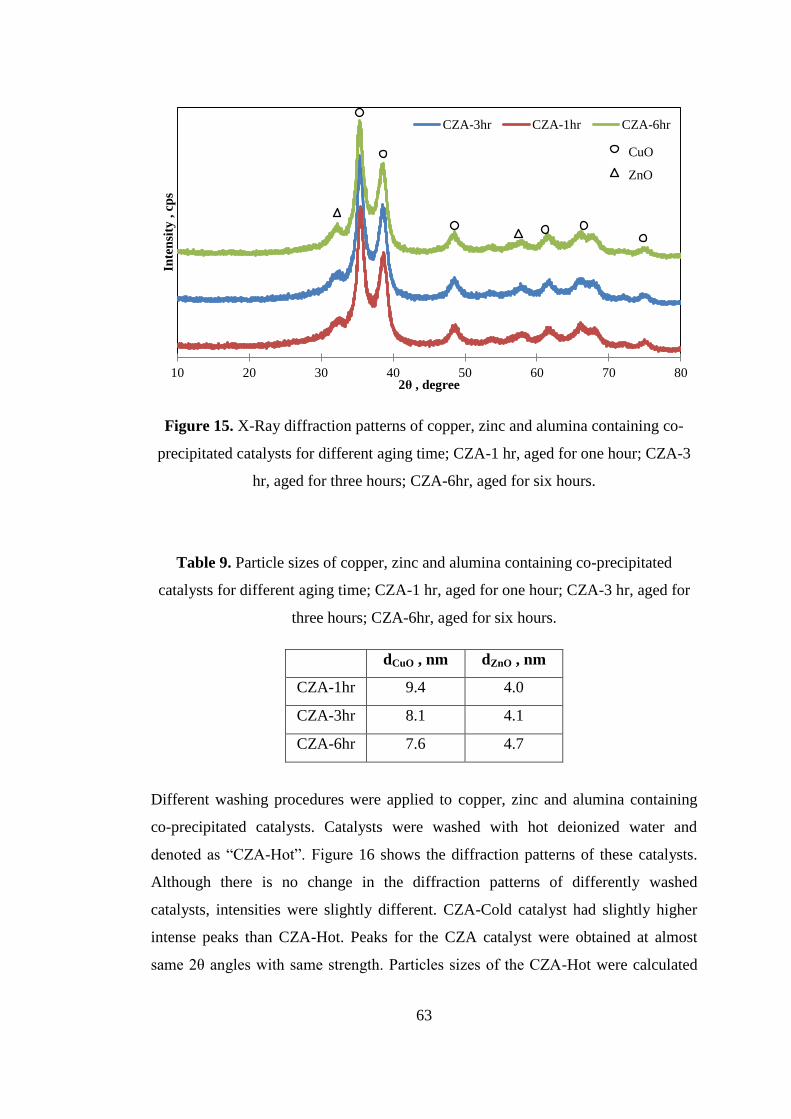
63
Figure 15. X-Ray diffraction patterns of copper, zinc and alumina containing co-
precipitated catalysts for different aging time; CZA-1 hr, aged for one hour; CZA-3
hr, aged for three hours; CZA-6hr, aged for six hours.
Table 9. Particle sizes of copper, zinc and alumina containing co-precipitated
catalysts for different aging time; CZA-1 hr, aged for one hour; CZA-3 hr, aged for
three hours; CZA-6hr, aged for six hours.
dCuO , nm dZnO , nm
CZA-1hr 9.4 4.0
CZA-3hr 8.1 4.1
CZA-6hr 7.6 4.7
Different washing procedures were applied to copper, zinc and alumina containing
co-precipitated catalysts. Catalysts were washed with hot deionized water and
denoted as “CZA-Hot”. Figure 16 shows the diffraction patterns of these catalysts.
Although there is no change in the diffraction patterns of differently washed
catalysts, intensities were slightly different. CZA-Cold catalyst had slightly higher
intense peaks than CZA-Hot. Peaks for the CZA catalyst were obtained at almost
same 2θ angles with same strength. Particles sizes of the CZA-Hot were calculated
10 20 30 40 50 60 70 80
Inte
nsi
ty ,
cp
s
2θ , degree
CZA-3hr CZA-1hr CZA-6hr
CuO
ZnO
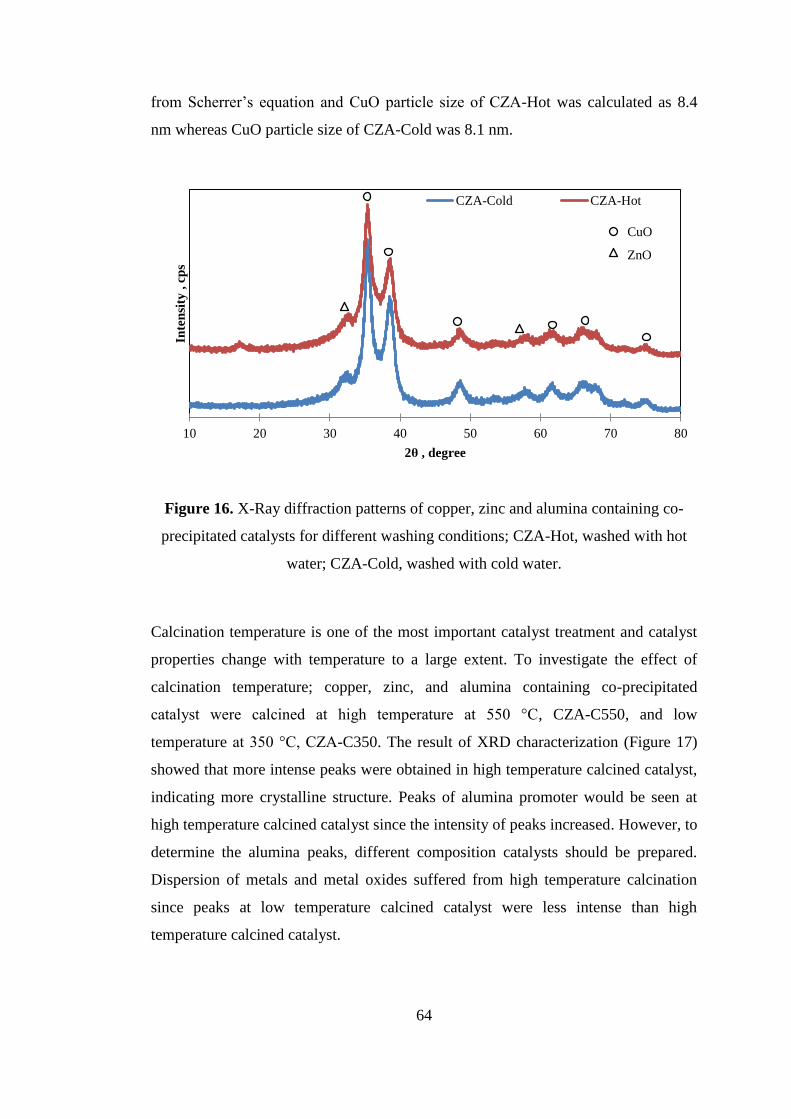
64
from Scherrer‟s equation and CuO particle size of CZA-Hot was calculated as 8.4
nm whereas CuO particle size of CZA-Cold was 8.1 nm.
Figure 16. X-Ray diffraction patterns of copper, zinc and alumina containing co-
precipitated catalysts for different washing conditions; CZA-Hot, washed with hot
water; CZA-Cold, washed with cold water.
Calcination temperature is one of the most important catalyst treatment and catalyst
properties change with temperature to a large extent. To investigate the effect of
calcination temperature; copper, zinc, and alumina containing co-precipitated
catalyst were calcined at high temperature at 550 °C, CZA-C550, and low
temperature at 350 °C, CZA-C350. The result of XRD characterization (Figure 17)
showed that more intense peaks were obtained in high temperature calcined catalyst,
indicating more crystalline structure. Peaks of alumina promoter would be seen at
high temperature calcined catalyst since the intensity of peaks increased. However, to
determine the alumina peaks, different composition catalysts should be prepared.
Dispersion of metals and metal oxides suffered from high temperature calcination
since peaks at low temperature calcined catalyst were less intense than high
temperature calcined catalyst.
10 20 30 40 50 60 70 80
Inte
nsi
ty ,
cp
s
2θ , degree
CZA-Cold CZA-Hot
CuO
ZnO
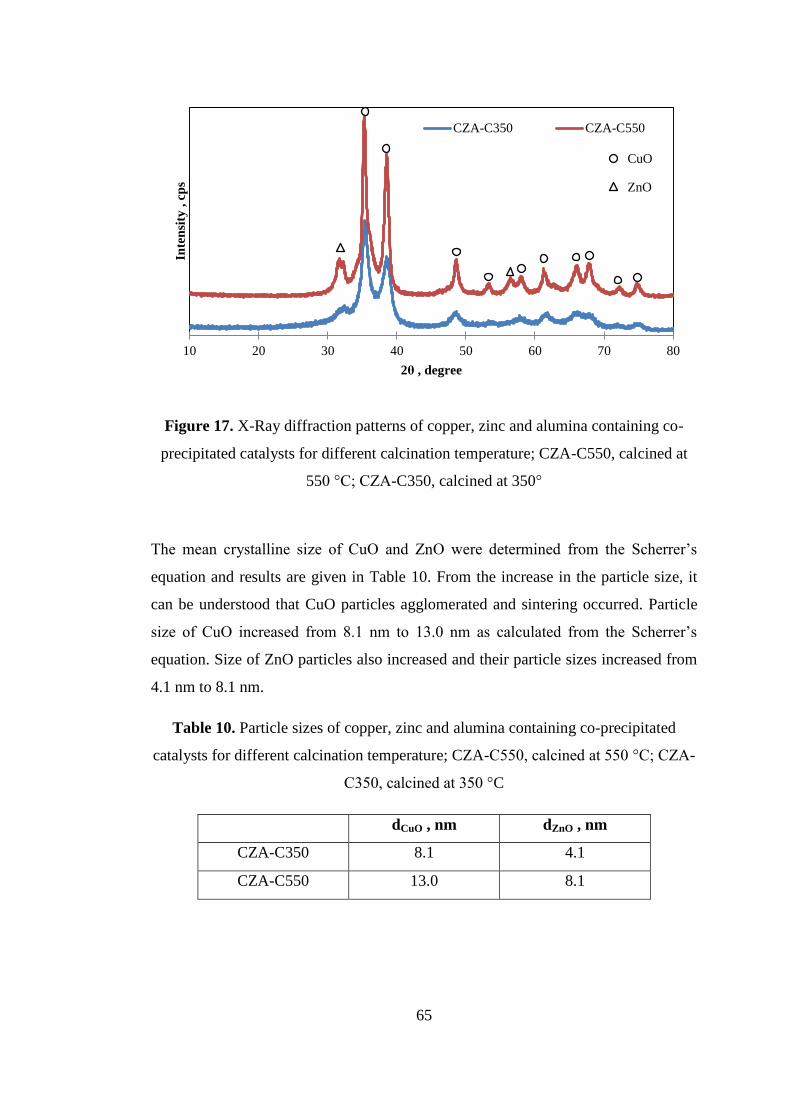
65
Figure 17. X-Ray diffraction patterns of copper, zinc and alumina containing co-
precipitated catalysts for different calcination temperature; CZA-C550, calcined at
550 °C; CZA-C350, calcined at 350°
The mean crystalline size of CuO and ZnO were determined from the Scherrer‟s
equation and results are given in Table 10. From the increase in the particle size, it
can be understood that CuO particles agglomerated and sintering occurred. Particle
size of CuO increased from 8.1 nm to 13.0 nm as calculated from the Scherrer‟s
equation. Size of ZnO particles also increased and their particle sizes increased from
4.1 nm to 8.1 nm.
Table 10. Particle sizes of copper, zinc and alumina containing co-precipitated
catalysts for different calcination temperature; CZA-C550, calcined at 550 °C; CZA-
C350, calcined at 350 °C
dCuO , nm dZnO , nm
CZA-C350 8.1 4.1
CZA-C550 13.0 8.1
10 20 30 40 50 60 70 80
Inte
nsi
ty ,
cp
s
2θ , degree
CZA-C350 CZA-C550
C
CuO
ZnO
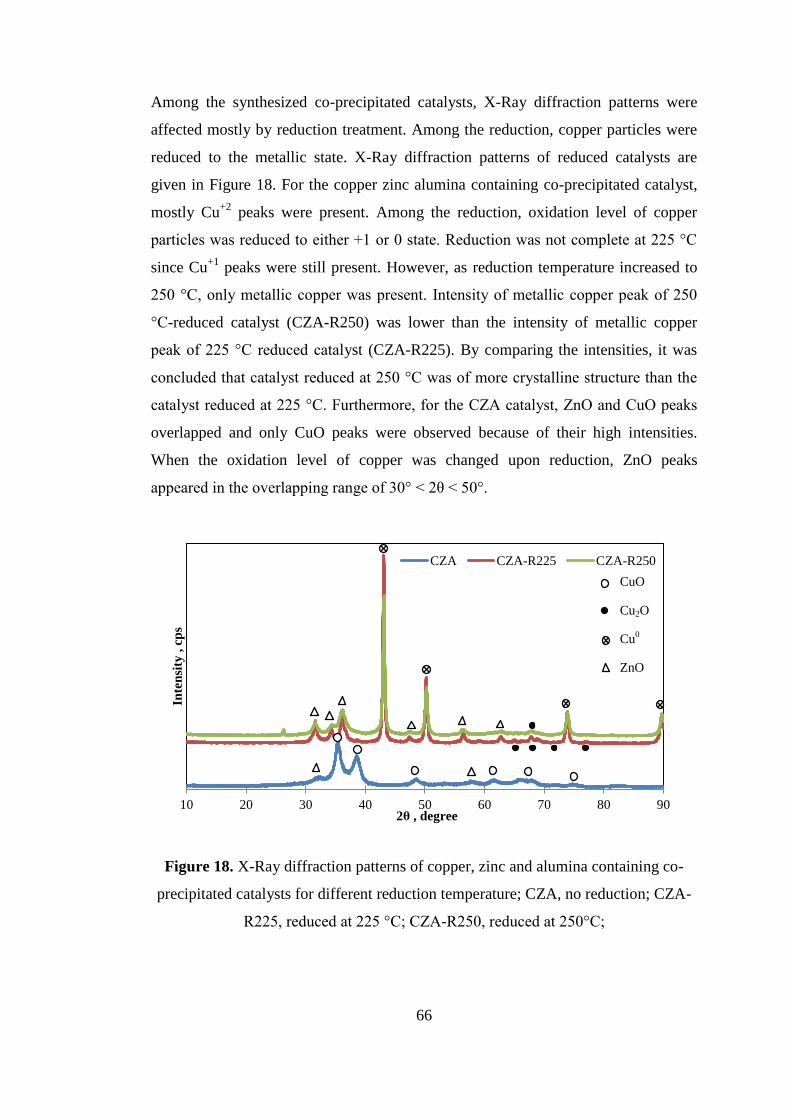
66
Among the synthesized co-precipitated catalysts, X-Ray diffraction patterns were
affected mostly by reduction treatment. Among the reduction, copper particles were
reduced to the metallic state. X-Ray diffraction patterns of reduced catalysts are
given in Figure 18. For the copper zinc alumina containing co-precipitated catalyst,
mostly Cu+2
peaks were present. Among the reduction, oxidation level of copper
particles was reduced to either +1 or 0 state. Reduction was not complete at 225 °C
since Cu+1
peaks were still present. However, as reduction temperature increased to
250 °C, only metallic copper was present. Intensity of metallic copper peak of 250
°C-reduced catalyst (CZA-R250) was lower than the intensity of metallic copper
peak of 225 °C reduced catalyst (CZA-R225). By comparing the intensities, it was
concluded that catalyst reduced at 250 °C was of more crystalline structure than the
catalyst reduced at 225 °C. Furthermore, for the CZA catalyst, ZnO and CuO peaks
overlapped and only CuO peaks were observed because of their high intensities.
When the oxidation level of copper was changed upon reduction, ZnO peaks
appeared in the overlapping range of 30° ˂ 2θ ˂ 50°.
Figure 18. X-Ray diffraction patterns of copper, zinc and alumina containing co-
precipitated catalysts for different reduction temperature; CZA, no reduction; CZA-
R225, reduced at 225 °C; CZA-R250, reduced at 250°C;
10 20 30 40 50 60 70 80 90
Inte
nsi
ty ,
cp
s
2θ , degree
CZA CZA-R225 CZA-R250
CuO
Cu2O
Cu0
ZnO
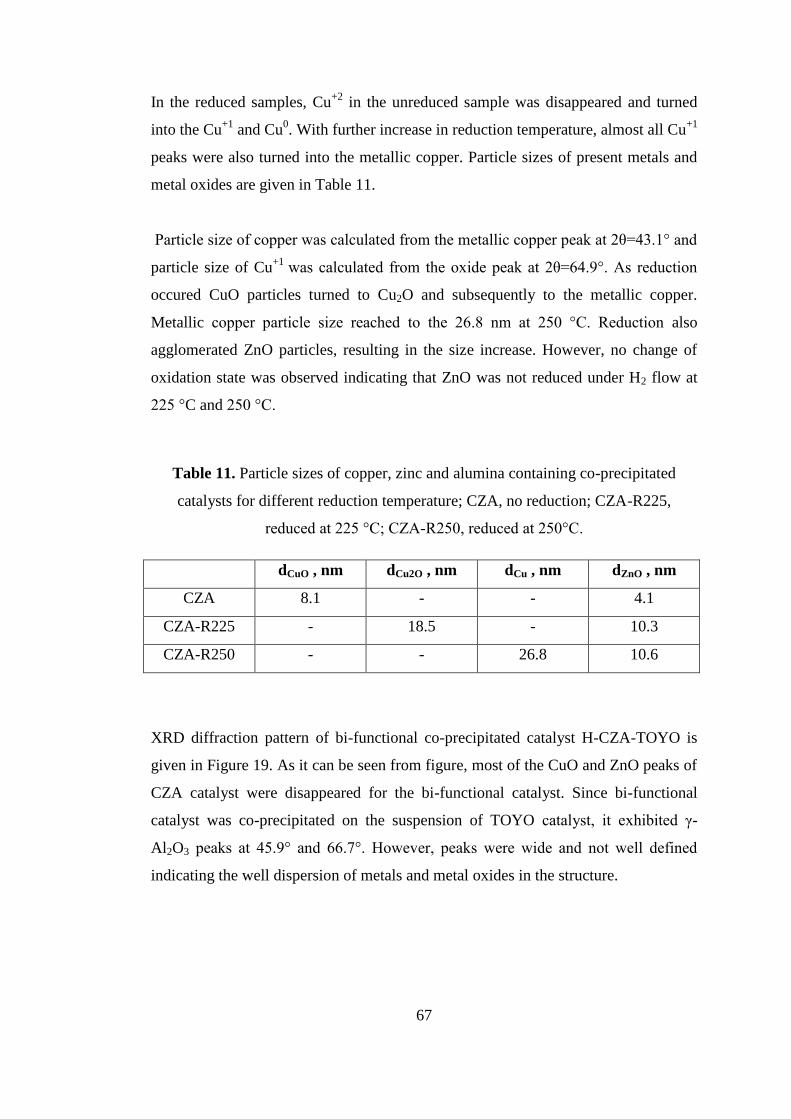
67
In the reduced samples, Cu+2
in the unreduced sample was disappeared and turned
into the Cu+1
and Cu0. With further increase in reduction temperature, almost all Cu
+1
peaks were also turned into the metallic copper. Particle sizes of present metals and
metal oxides are given in Table 11.
Particle size of copper was calculated from the metallic copper peak at 2θ=43.1° and
particle size of Cu+1
was calculated from the oxide peak at 2θ=64.9°. As reduction
occured CuO particles turned to Cu2O and subsequently to the metallic copper.
Metallic copper particle size reached to the 26.8 nm at 250 °C. Reduction also
agglomerated ZnO particles, resulting in the size increase. However, no change of
oxidation state was observed indicating that ZnO was not reduced under H2 flow at
225 °C and 250 °C.
Table 11. Particle sizes of copper, zinc and alumina containing co-precipitated
catalysts for different reduction temperature; CZA, no reduction; CZA-R225,
reduced at 225 °C; CZA-R250, reduced at 250°C.
dCuO , nm dCu2O , nm dCu , nm dZnO , nm
CZA 8.1 - - 4.1
CZA-R225 - 18.5 - 10.3
CZA-R250 - - 26.8 10.6
XRD diffraction pattern of bi-functional co-precipitated catalyst H-CZA-TOYO is
given in Figure 19. As it can be seen from figure, most of the CuO and ZnO peaks of
CZA catalyst were disappeared for the bi-functional catalyst. Since bi-functional
catalyst was co-precipitated on the suspension of TOYO catalyst, it exhibited γ-
Al2O3 peaks at 45.9° and 66.7°. However, peaks were wide and not well defined
indicating the well dispersion of metals and metal oxides in the structure.
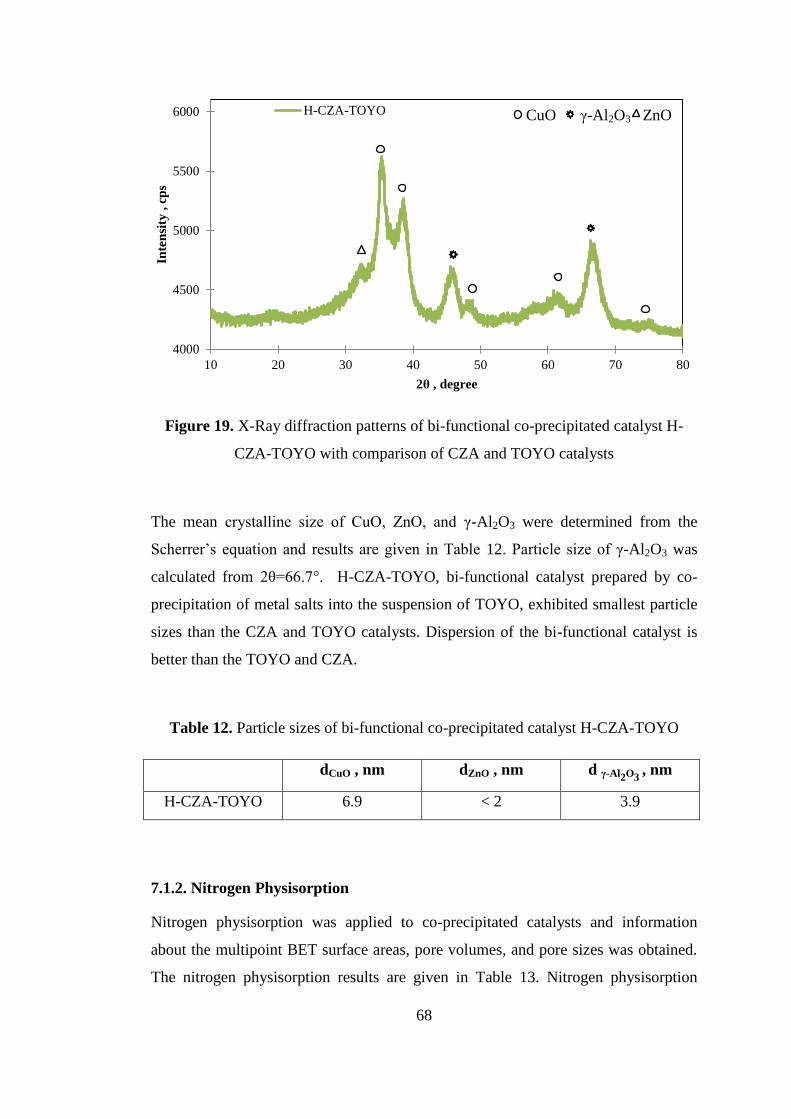
68
Figure 19. X-Ray diffraction patterns of bi-functional co-precipitated catalyst H-
CZA-TOYO with comparison of CZA and TOYO catalysts
The mean crystalline size of CuO, ZnO, and γ-Al2O3 were determined from the
Scherrer‟s equation and results are given in Table 12. Particle size of γ-Al2O3 was
calculated from 2θ=66.7°. H-CZA-TOYO, bi-functional catalyst prepared by co-
precipitation of metal salts into the suspension of TOYO, exhibited smallest particle
sizes than the CZA and TOYO catalysts. Dispersion of the bi-functional catalyst is
better than the TOYO and CZA.
Table 12. Particle sizes of bi-functional co-precipitated catalyst H-CZA-TOYO
dCuO , nm dZnO , nm d γ-Al2O3 , nm
H-CZA-TOYO 6.9 < 2 3.9
7.1.2. Nitrogen Physisorption
Nitrogen physisorption was applied to co-precipitated catalysts and information
about the multipoint BET surface areas, pore volumes, and pore sizes was obtained.
The nitrogen physisorption results are given in Table 13. Nitrogen physisorption
4000
4500
5000
5500
6000
10 20 30 40 50 60 70 80
Inte
nsi
ty ,
cp
s
2θ , degree
H-CZA-TOYO CuO γ-Al2O3 ZnO
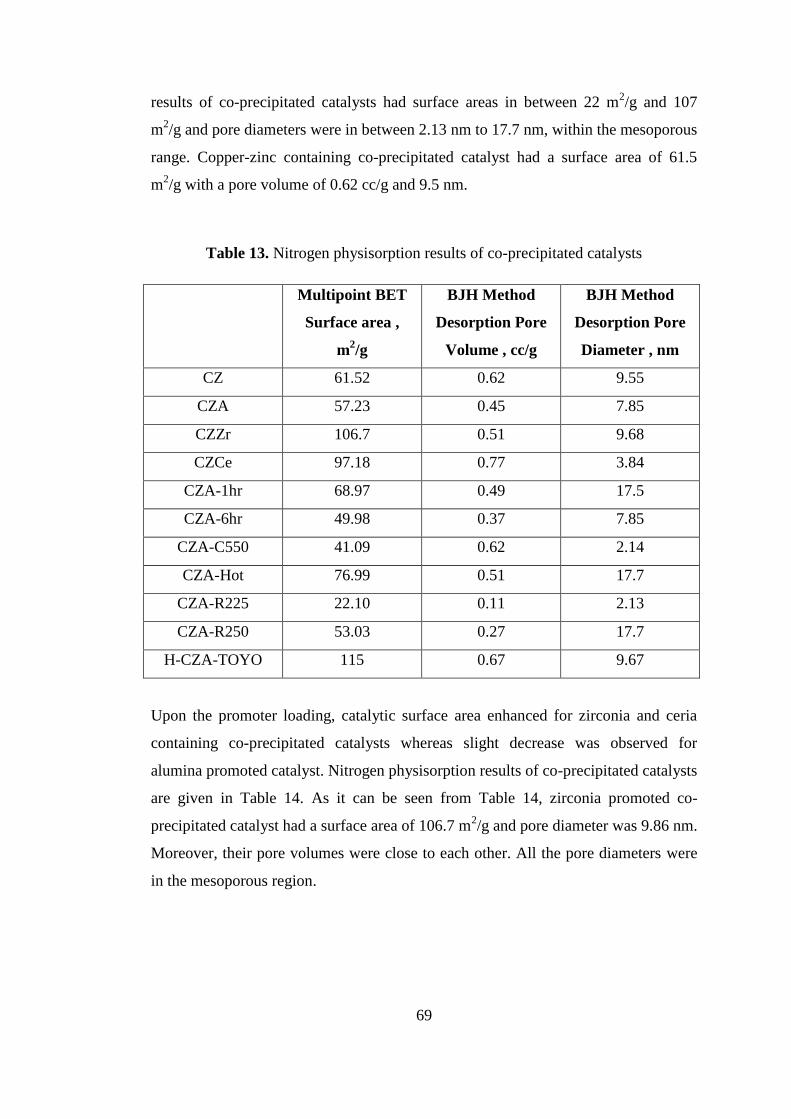
69
results of co-precipitated catalysts had surface areas in between 22 m2/g and 107
m2/g and pore diameters were in between 2.13 nm to 17.7 nm, within the mesoporous
range. Copper-zinc containing co-precipitated catalyst had a surface area of 61.5
m2/g with a pore volume of 0.62 cc/g and 9.5 nm.
Table 13. Nitrogen physisorption results of co-precipitated catalysts
Multipoint BET
Surface area ,
m2/g
BJH Method
Desorption Pore
Volume , cc/g
BJH Method
Desorption Pore
Diameter , nm
CZ 61.52 0.62 9.55
CZA 57.23 0.45 7.85
CZZr 106.7 0.51 9.68
CZCe 97.18 0.77 3.84
CZA-1hr 68.97 0.49 17.5
CZA-6hr 49.98 0.37 7.85
CZA-C550 41.09 0.62 2.14
CZA-Hot 76.99 0.51 17.7
CZA-R225 22.10 0.11 2.13
CZA-R250 53.03 0.27 17.7
H-CZA-TOYO 115 0.67 9.67
Upon the promoter loading, catalytic surface area enhanced for zirconia and ceria
containing co-precipitated catalysts whereas slight decrease was observed for
alumina promoted catalyst. Nitrogen physisorption results of co-precipitated catalysts
are given in Table 14. As it can be seen from Table 14, zirconia promoted co-
precipitated catalyst had a surface area of 106.7 m2/g and pore diameter was 9.86 nm.
Moreover, their pore volumes were close to each other. All the pore diameters were
in the mesoporous region.
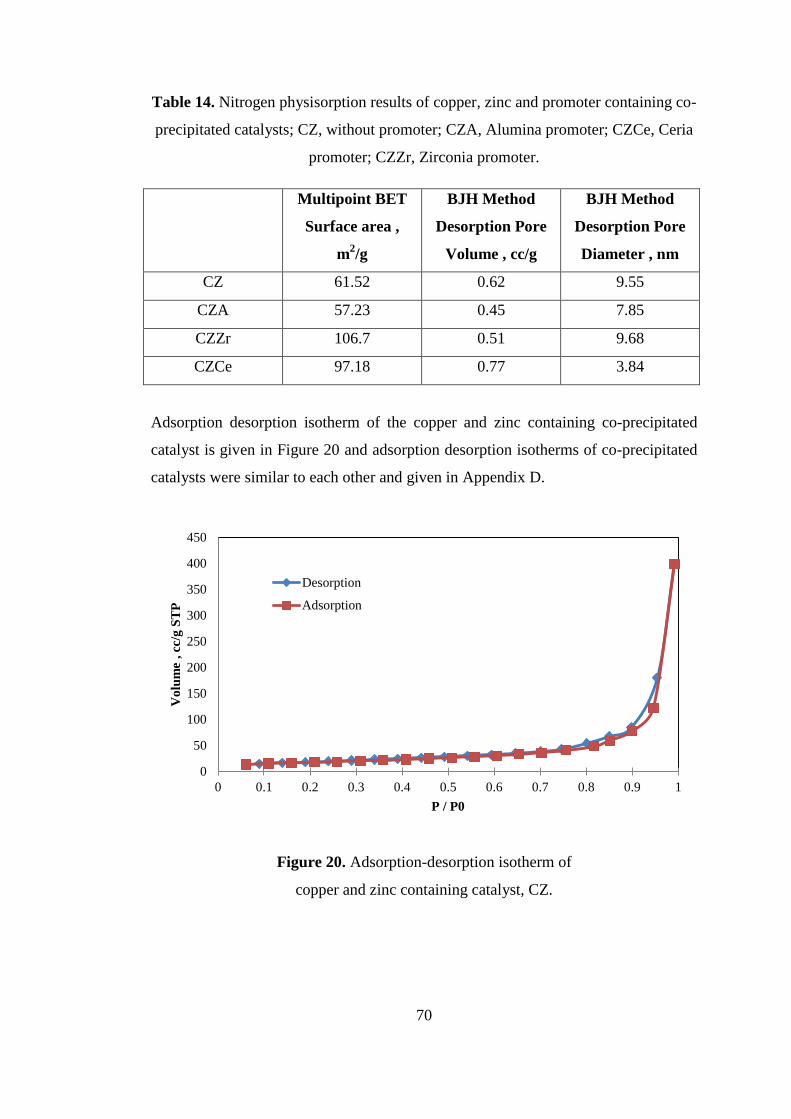
70
Table 14. Nitrogen physisorption results of copper, zinc and promoter containing co-
precipitated catalysts; CZ, without promoter; CZA, Alumina promoter; CZCe, Ceria
promoter; CZZr, Zirconia promoter.
Multipoint BET
Surface area ,
m2/g
BJH Method
Desorption Pore
Volume , cc/g
BJH Method
Desorption Pore
Diameter , nm
CZ 61.52 0.62 9.55
CZA 57.23 0.45 7.85
CZZr 106.7 0.51 9.68
CZCe 97.18 0.77 3.84
Adsorption desorption isotherm of the copper and zinc containing co-precipitated
catalyst is given in Figure 20 and adsorption desorption isotherms of co-precipitated
catalysts were similar to each other and given in Appendix D.
Figure 20. Adsorption-desorption isotherm of
copper and zinc containing catalyst, CZ.
0
50
100
150
200
250
300
350
400
450
0 0.1 0.2 0.3 0.4 0.5 0.6 0.7 0.8 0.9 1
Vo
lum
e , cc
/g S
TP
P / P0
Desorption
Adsorption
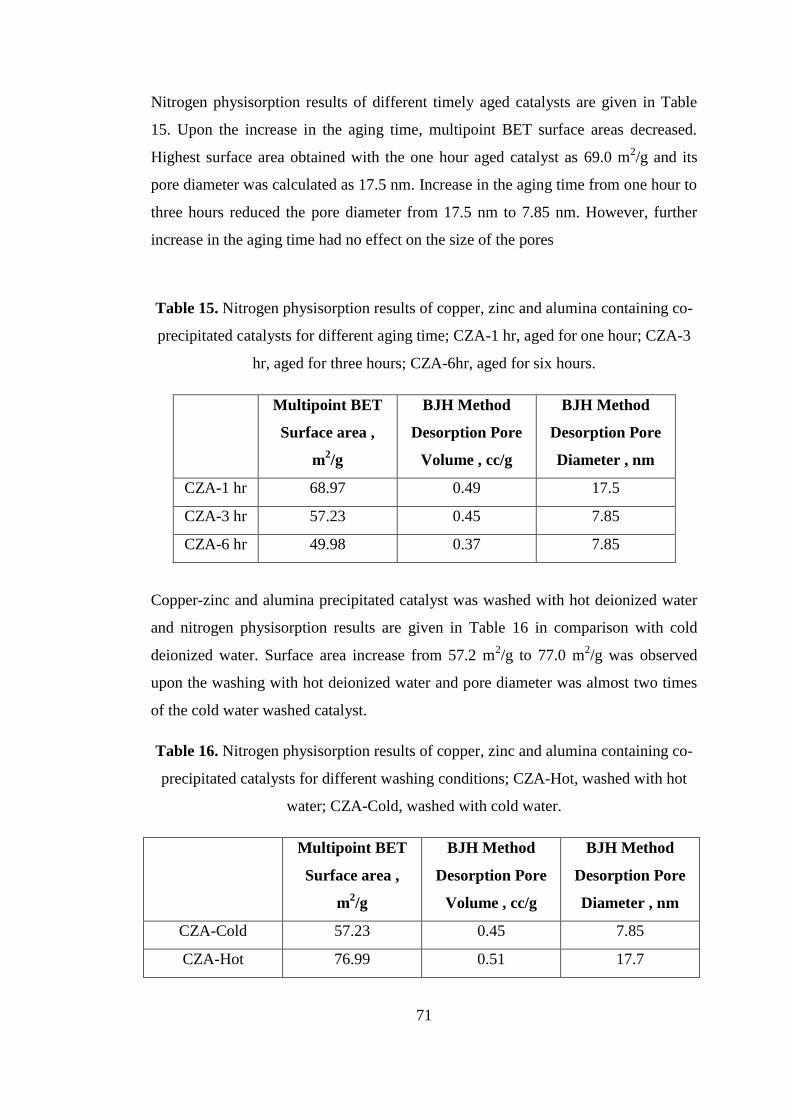
71
Nitrogen physisorption results of different timely aged catalysts are given in Table
15. Upon the increase in the aging time, multipoint BET surface areas decreased.
Highest surface area obtained with the one hour aged catalyst as 69.0 m2/g and its
pore diameter was calculated as 17.5 nm. Increase in the aging time from one hour to
three hours reduced the pore diameter from 17.5 nm to 7.85 nm. However, further
increase in the aging time had no effect on the size of the pores
Table 15. Nitrogen physisorption results of copper, zinc and alumina containing co-
precipitated catalysts for different aging time; CZA-1 hr, aged for one hour; CZA-3
hr, aged for three hours; CZA-6hr, aged for six hours.
Multipoint BET
Surface area ,
m2/g
BJH Method
Desorption Pore
Volume , cc/g
BJH Method
Desorption Pore
Diameter , nm
CZA-1 hr 68.97 0.49 17.5
CZA-3 hr 57.23 0.45 7.85
CZA-6 hr 49.98 0.37 7.85
Copper-zinc and alumina precipitated catalyst was washed with hot deionized water
and nitrogen physisorption results are given in Table 16 in comparison with cold
deionized water. Surface area increase from 57.2 m2/g to 77.0 m
2/g was observed
upon the washing with hot deionized water and pore diameter was almost two times
of the cold water washed catalyst.
Table 16. Nitrogen physisorption results of copper, zinc and alumina containing co-
precipitated catalysts for different washing conditions; CZA-Hot, washed with hot
water; CZA-Cold, washed with cold water.
Multipoint BET
Surface area ,
m2/g
BJH Method
Desorption Pore
Volume , cc/g
BJH Method
Desorption Pore
Diameter , nm
CZA-Cold 57.23 0.45 7.85
CZA-Hot 76.99 0.51 17.7
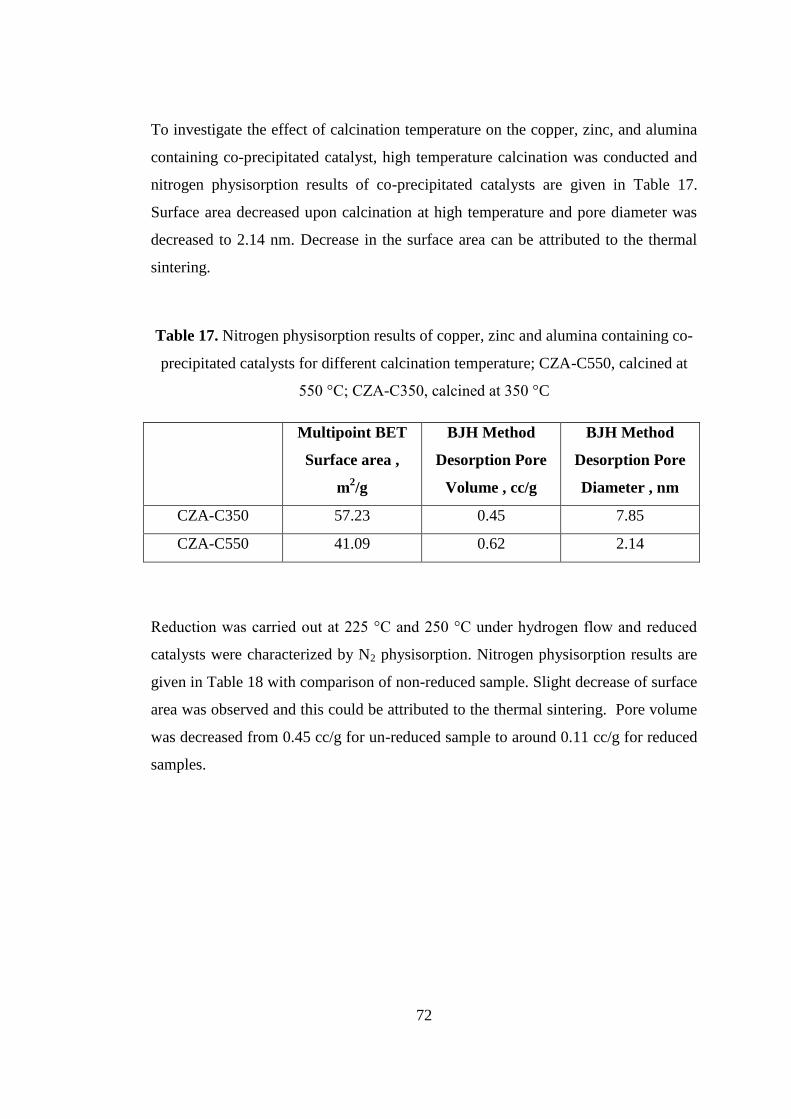
72
To investigate the effect of calcination temperature on the copper, zinc, and alumina
containing co-precipitated catalyst, high temperature calcination was conducted and
nitrogen physisorption results of co-precipitated catalysts are given in Table 17.
Surface area decreased upon calcination at high temperature and pore diameter was
decreased to 2.14 nm. Decrease in the surface area can be attributed to the thermal
sintering.
Table 17. Nitrogen physisorption results of copper, zinc and alumina containing co-
precipitated catalysts for different calcination temperature; CZA-C550, calcined at
550 °C; CZA-C350, calcined at 350 °C
Multipoint BET
Surface area ,
m2/g
BJH Method
Desorption Pore
Volume , cc/g
BJH Method
Desorption Pore
Diameter , nm
CZA-C350 57.23 0.45 7.85
CZA-C550 41.09 0.62 2.14
Reduction was carried out at 225 °C and 250 °C under hydrogen flow and reduced
catalysts were characterized by N2 physisorption. Nitrogen physisorption results are
given in Table 18 with comparison of non-reduced sample. Slight decrease of surface
area was observed and this could be attributed to the thermal sintering. Pore volume
was decreased from 0.45 cc/g for un-reduced sample to around 0.11 cc/g for reduced
samples.
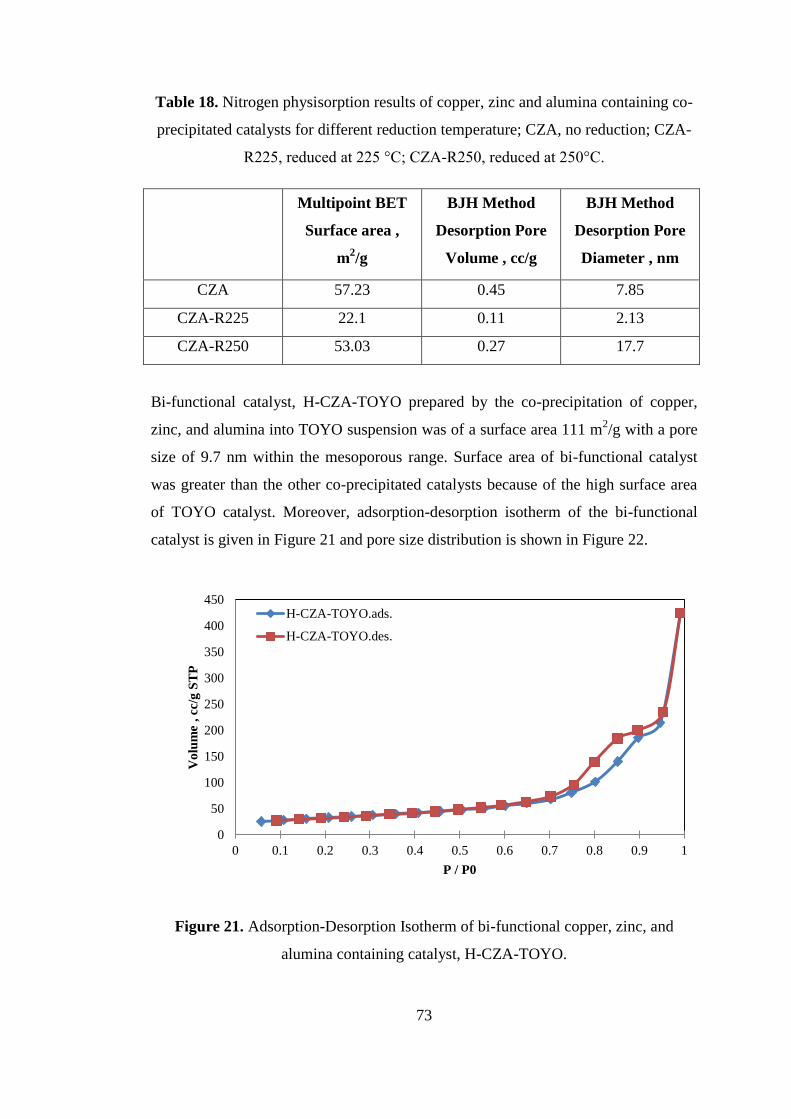
73
Table 18. Nitrogen physisorption results of copper, zinc and alumina containing co-
precipitated catalysts for different reduction temperature; CZA, no reduction; CZA-
R225, reduced at 225 °C; CZA-R250, reduced at 250°C.
Multipoint BET
Surface area ,
m2/g
BJH Method
Desorption Pore
Volume , cc/g
BJH Method
Desorption Pore
Diameter , nm
CZA 57.23 0.45 7.85
CZA-R225 22.1 0.11 2.13
CZA-R250 53.03 0.27 17.7
Bi-functional catalyst, H-CZA-TOYO prepared by the co-precipitation of copper,
zinc, and alumina into TOYO suspension was of a surface area 111 m2/g with a pore
size of 9.7 nm within the mesoporous range. Surface area of bi-functional catalyst
was greater than the other co-precipitated catalysts because of the high surface area
of TOYO catalyst. Moreover, adsorption-desorption isotherm of the bi-functional
catalyst is given in Figure 21 and pore size distribution is shown in Figure 22.
Figure 21. Adsorption-Desorption Isotherm of bi-functional copper, zinc, and
alumina containing catalyst, H-CZA-TOYO.
0
50
100
150
200
250
300
350
400
450
0 0.1 0.2 0.3 0.4 0.5 0.6 0.7 0.8 0.9 1
Vo
lum
e , cc
/g S
TP
P / P0
H-CZA-TOYO.ads.
H-CZA-TOYO.des.
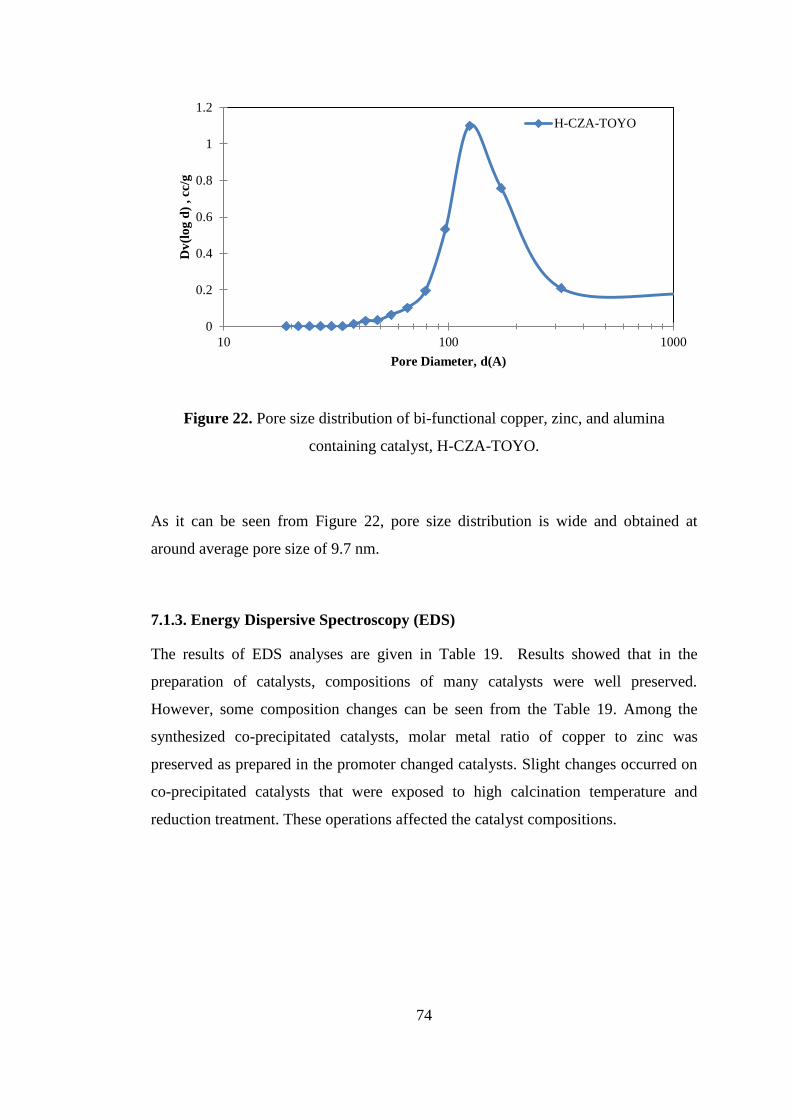
74
Figure 22. Pore size distribution of bi-functional copper, zinc, and alumina
containing catalyst, H-CZA-TOYO.
As it can be seen from Figure 22, pore size distribution is wide and obtained at
around average pore size of 9.7 nm.
7.1.3. Energy Dispersive Spectroscopy (EDS)
The results of EDS analyses are given in Table 19. Results showed that in the
preparation of catalysts, compositions of many catalysts were well preserved.
However, some composition changes can be seen from the Table 19. Among the
synthesized co-precipitated catalysts, molar metal ratio of copper to zinc was
preserved as prepared in the promoter changed catalysts. Slight changes occurred on
co-precipitated catalysts that were exposed to high calcination temperature and
reduction treatment. These operations affected the catalyst compositions.
0
0.2
0.4
0.6
0.8
1
1.2
10 100 1000
Dv
(lo
g d
) , cc
/g
Pore Diameter, d(A)
H-CZA-TOYO
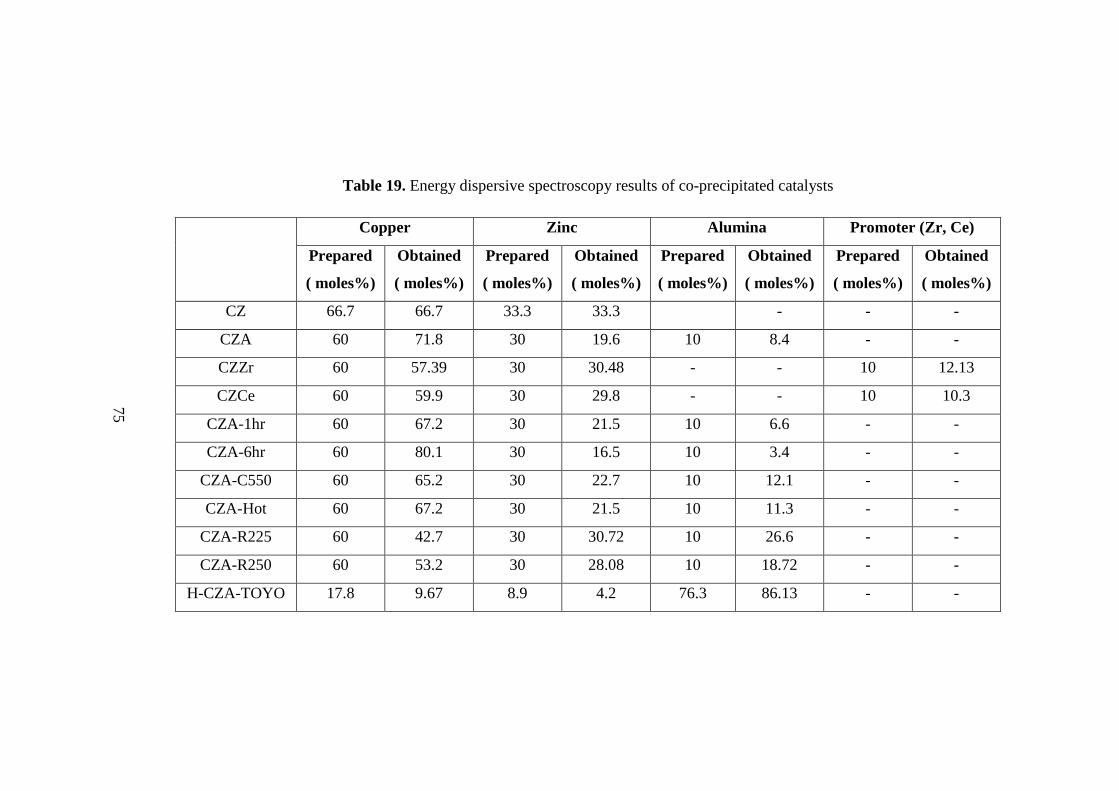
75
Table 19. Energy dispersive spectroscopy results of co-precipitated catalysts
Copper Zinc Alumina Promoter (Zr, Ce)
Prepared
( moles%)
Obtained
( moles%)
Prepared
( moles%)
Obtained
( moles%)
Prepared
( moles%)
Obtained
( moles%)
Prepared
( moles%)
Obtained
( moles%)
CZ 66.7 66.7 33.3 33.3 - - -
CZA 60 71.8 30 19.6 10 8.4 - -
CZZr 60 57.39 30 30.48 - - 10 12.13
CZCe 60 59.9 30 29.8 - - 10 10.3
CZA-1hr 60 67.2 30 21.5 10 6.6 - -
CZA-6hr 60 80.1 30 16.5 10 3.4 - -
CZA-C550 60 65.2 30 22.7 10 12.1 - -
CZA-Hot 60 67.2 30 21.5 10 11.3 - -
CZA-R225 60 42.7 30 30.72 10 26.6 - -
CZA-R250 60 53.2 30 28.08 10 18.72 - -
H-CZA-TOYO 17.8 9.67 8.9 4.2 76.3 86.13 - -
75
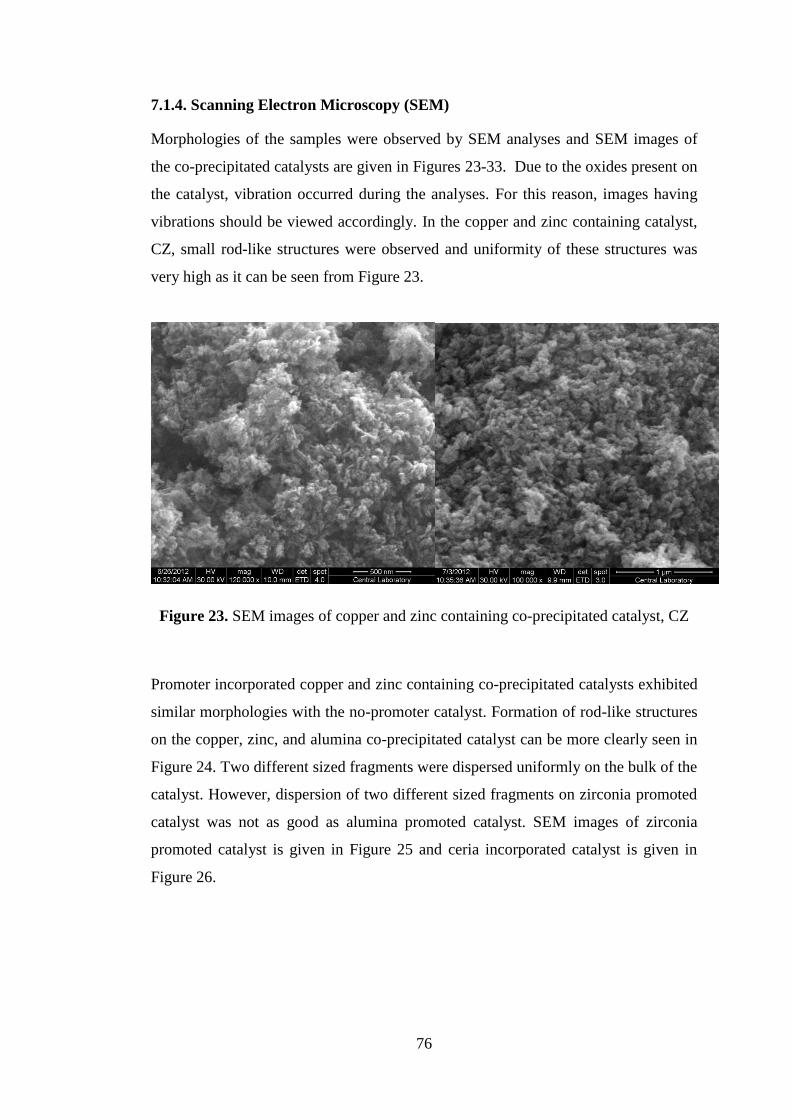
76
7.1.4. Scanning Electron Microscopy (SEM)
Morphologies of the samples were observed by SEM analyses and SEM images of
the co-precipitated catalysts are given in Figures 23-33. Due to the oxides present on
the catalyst, vibration occurred during the analyses. For this reason, images having
vibrations should be viewed accordingly. In the copper and zinc containing catalyst,
CZ, small rod-like structures were observed and uniformity of these structures was
very high as it can be seen from Figure 23.
Figure 23. SEM images of copper and zinc containing co-precipitated catalyst, CZ
Promoter incorporated copper and zinc containing co-precipitated catalysts exhibited
similar morphologies with the no-promoter catalyst. Formation of rod-like structures
on the copper, zinc, and alumina co-precipitated catalyst can be more clearly seen in
Figure 24. Two different sized fragments were dispersed uniformly on the bulk of the
catalyst. However, dispersion of two different sized fragments on zirconia promoted
catalyst was not as good as alumina promoted catalyst. SEM images of zirconia
promoted catalyst is given in Figure 25 and ceria incorporated catalyst is given in
Figure 26.
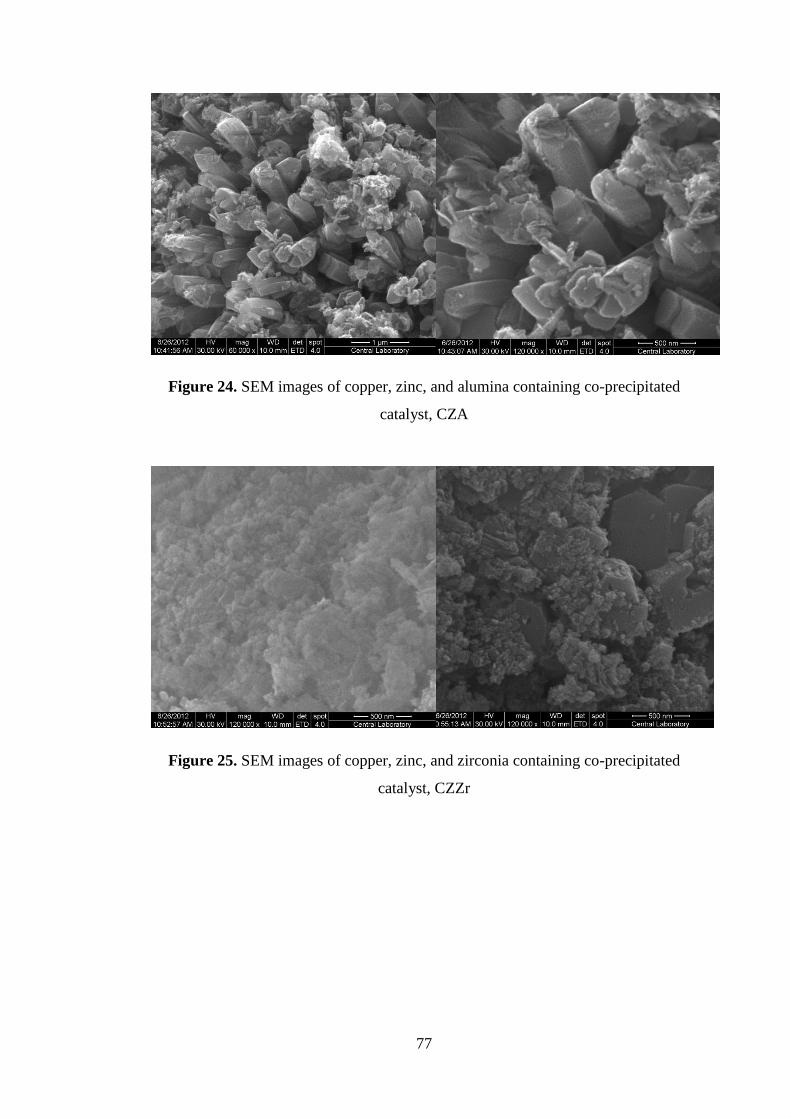
77
Figure 24. SEM images of copper, zinc, and alumina containing co-precipitated
catalyst, CZA
Figure 25. SEM images of copper, zinc, and zirconia containing co-precipitated
catalyst, CZZr
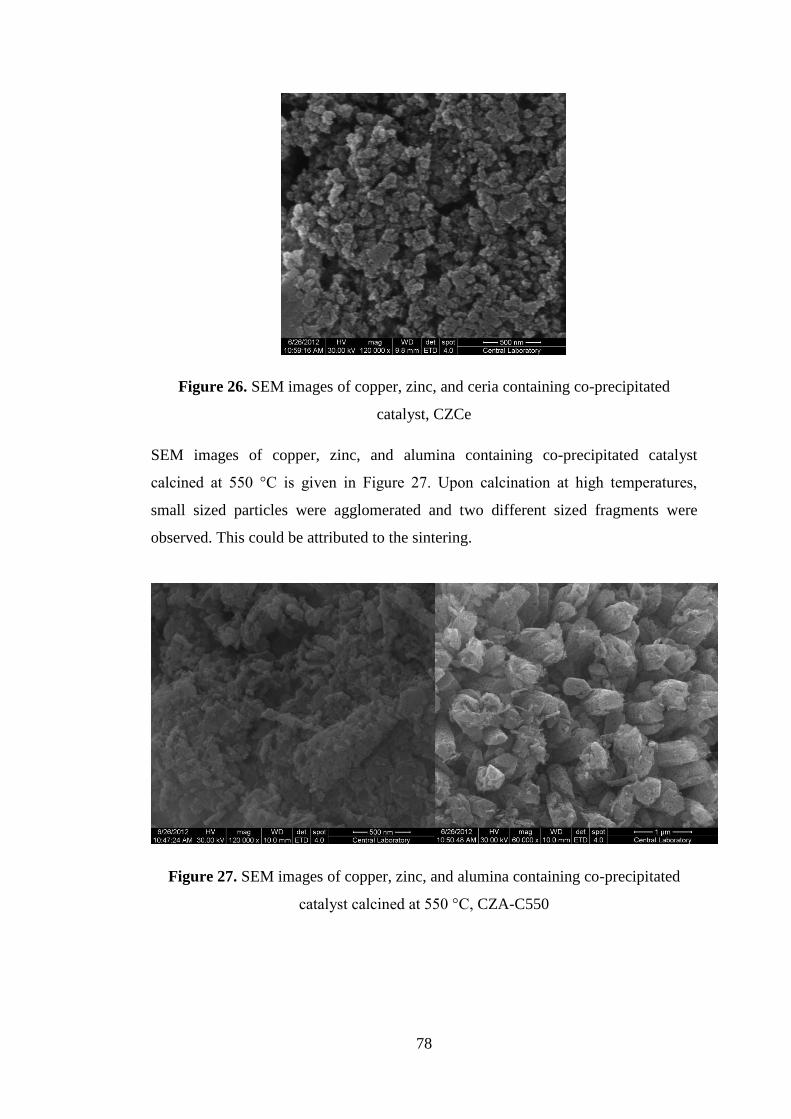
78
Figure 26. SEM images of copper, zinc, and ceria containing co-precipitated
catalyst, CZCe
SEM images of copper, zinc, and alumina containing co-precipitated catalyst
calcined at 550 °C is given in Figure 27. Upon calcination at high temperatures,
small sized particles were agglomerated and two different sized fragments were
observed. This could be attributed to the sintering.
Figure 27. SEM images of copper, zinc, and alumina containing co-precipitated
catalyst calcined at 550 °C, CZA-C550
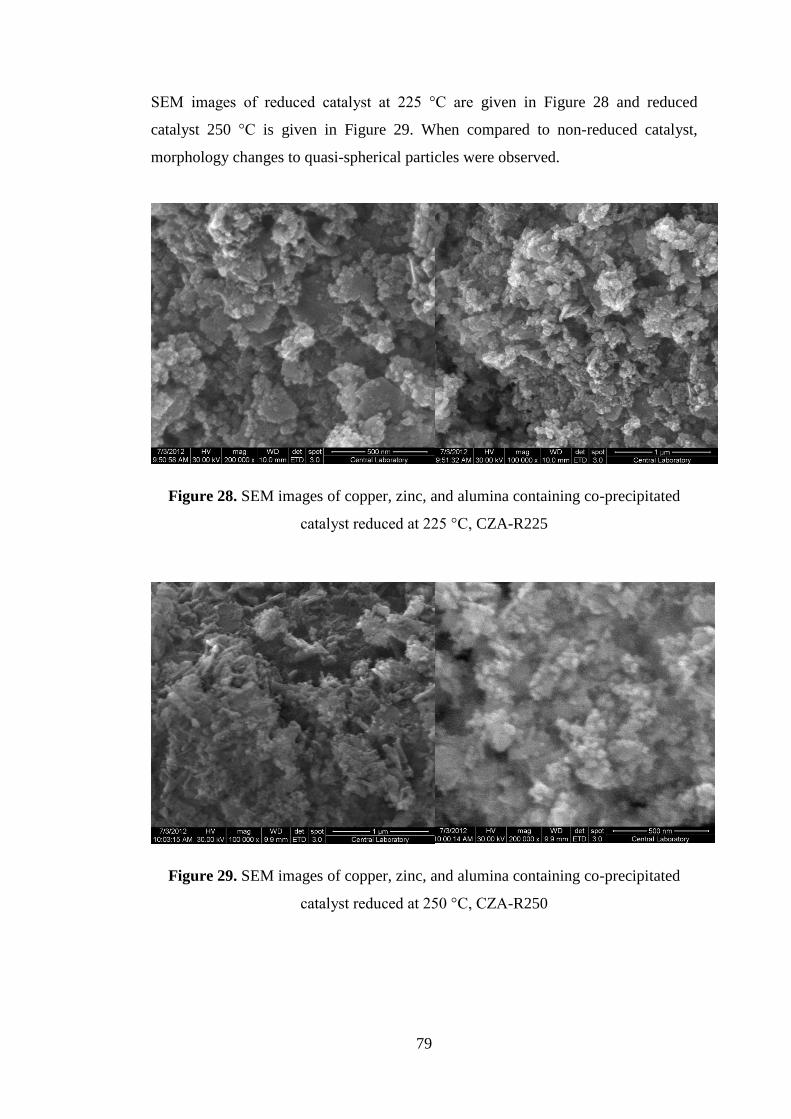
79
SEM images of reduced catalyst at 225 °C are given in Figure 28 and reduced
catalyst 250 °C is given in Figure 29. When compared to non-reduced catalyst,
morphology changes to quasi-spherical particles were observed.
Figure 28. SEM images of copper, zinc, and alumina containing co-precipitated
catalyst reduced at 225 °C, CZA-R225
Figure 29. SEM images of copper, zinc, and alumina containing co-precipitated
catalyst reduced at 250 °C, CZA-R250
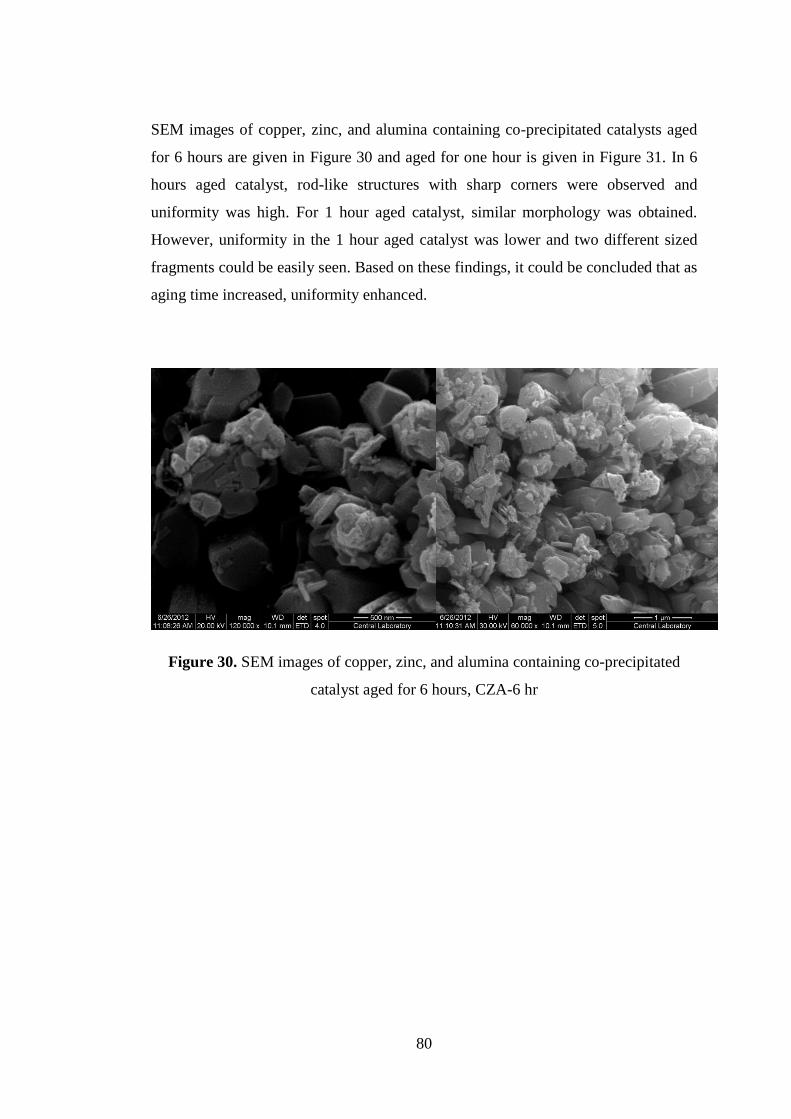
80
SEM images of copper, zinc, and alumina containing co-precipitated catalysts aged
for 6 hours are given in Figure 30 and aged for one hour is given in Figure 31. In 6
hours aged catalyst, rod-like structures with sharp corners were observed and
uniformity was high. For 1 hour aged catalyst, similar morphology was obtained.
However, uniformity in the 1 hour aged catalyst was lower and two different sized
fragments could be easily seen. Based on these findings, it could be concluded that as
aging time increased, uniformity enhanced.
Figure 30. SEM images of copper, zinc, and alumina containing co-precipitated
catalyst aged for 6 hours, CZA-6 hr
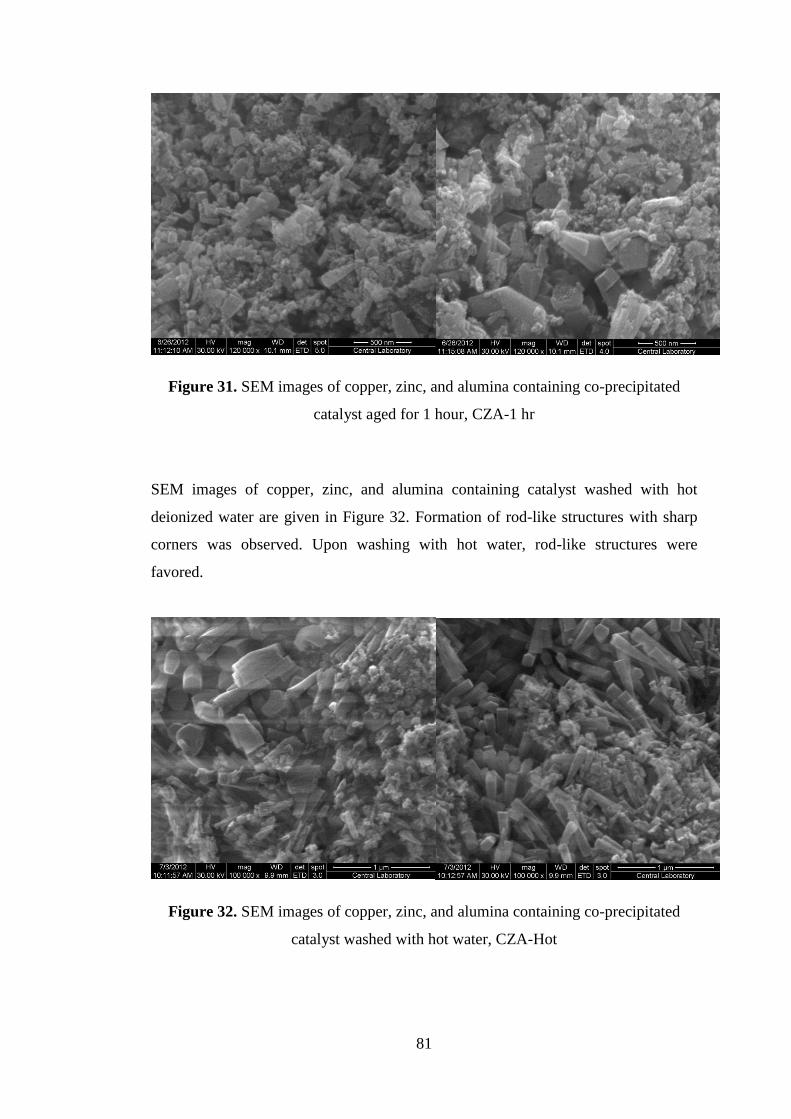
81
Figure 31. SEM images of copper, zinc, and alumina containing co-precipitated
catalyst aged for 1 hour, CZA-1 hr
SEM images of copper, zinc, and alumina containing catalyst washed with hot
deionized water are given in Figure 32. Formation of rod-like structures with sharp
corners was observed. Upon washing with hot water, rod-like structures were
favored.
Figure 32. SEM images of copper, zinc, and alumina containing co-precipitated
catalyst washed with hot water, CZA-Hot
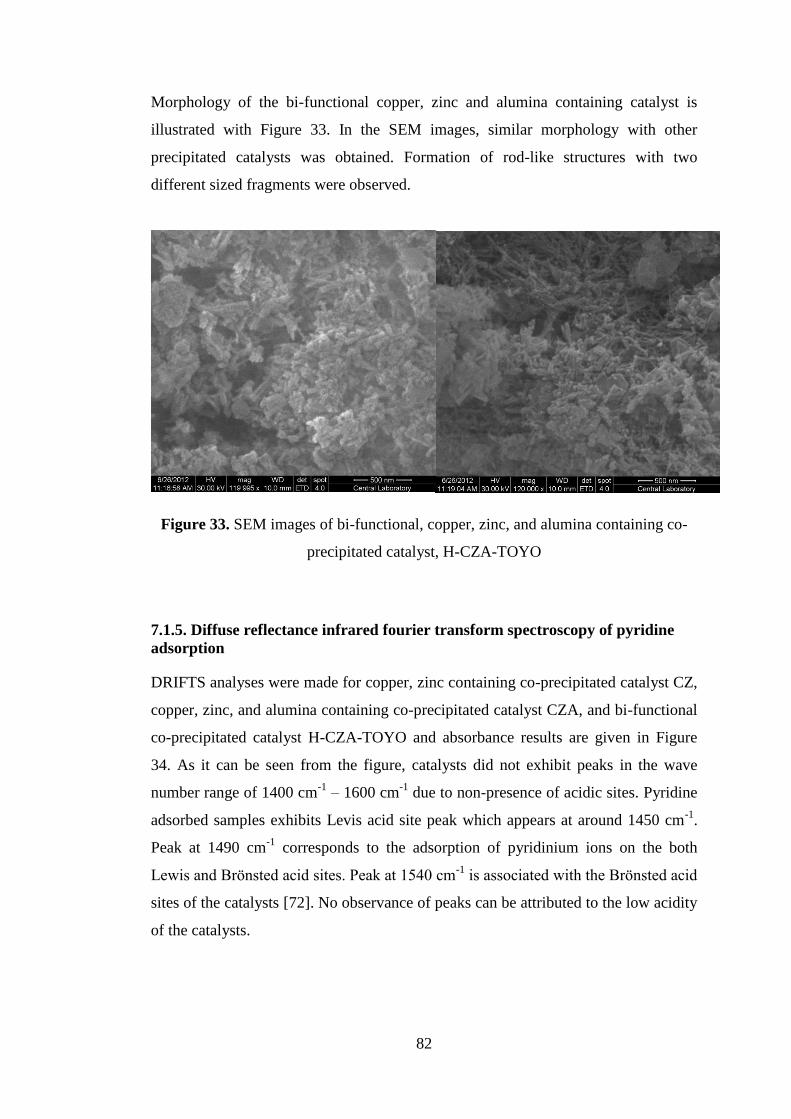
82
Morphology of the bi-functional copper, zinc and alumina containing catalyst is
illustrated with Figure 33. In the SEM images, similar morphology with other
precipitated catalysts was obtained. Formation of rod-like structures with two
different sized fragments were observed.
Figure 33. SEM images of bi-functional, copper, zinc, and alumina containing co-
precipitated catalyst, H-CZA-TOYO
7.1.5. Diffuse reflectance infrared fourier transform spectroscopy of pyridine
adsorption
DRIFTS analyses were made for copper, zinc containing co-precipitated catalyst CZ,
copper, zinc, and alumina containing co-precipitated catalyst CZA, and bi-functional
co-precipitated catalyst H-CZA-TOYO and absorbance results are given in Figure
34. As it can be seen from the figure, catalysts did not exhibit peaks in the wave
number range of 1400 cm-1
– 1600 cm-1
due to non-presence of acidic sites. Pyridine
adsorbed samples exhibits Levis acid site peak which appears at around 1450 cm-1
.
Peak at 1490 cm-1
corresponds to the adsorption of pyridinium ions on the both
Lewis and Brönsted acid sites. Peak at 1540 cm-1
is associated with the Brönsted acid
sites of the catalysts [72]. No observance of peaks can be attributed to the low acidity
of the catalysts.
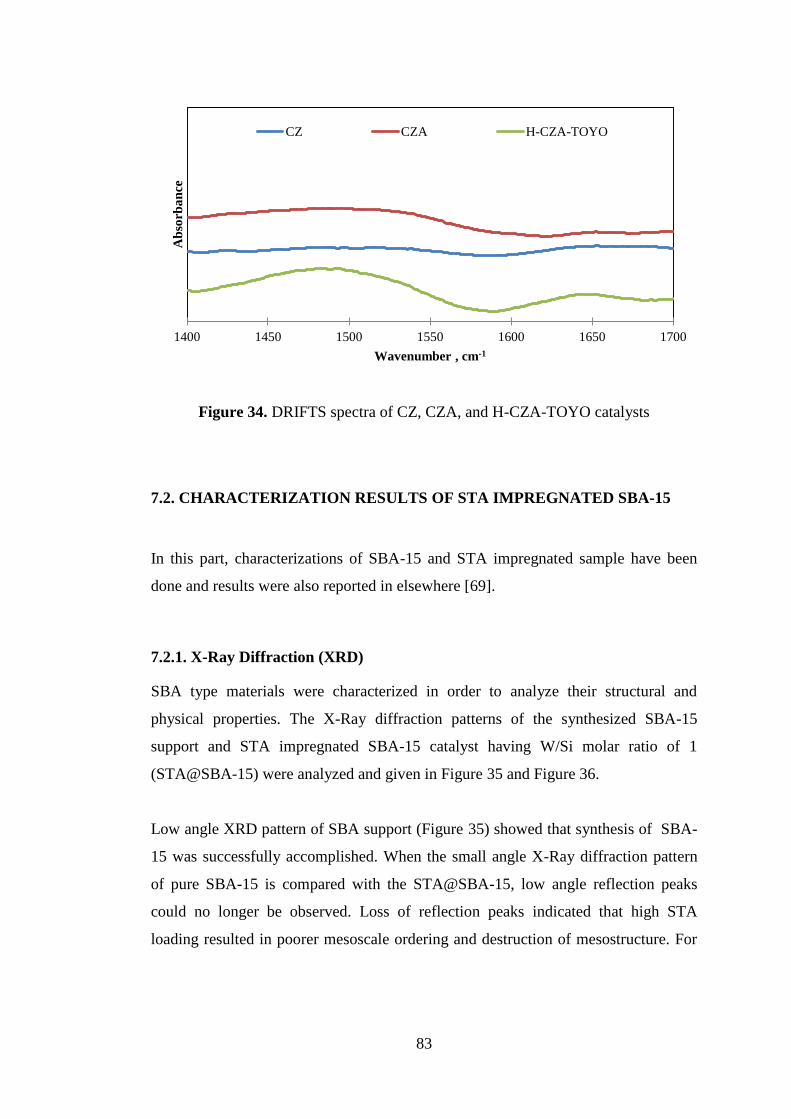
83
Figure 34. DRIFTS spectra of CZ, CZA, and H-CZA-TOYO catalysts
7.2. CHARACTERIZATION RESULTS OF STA IMPREGNATED SBA-15
In this part, characterizations of SBA-15 and STA impregnated sample have been
done and results were also reported in elsewhere [69].
7.2.1. X-Ray Diffraction (XRD)
SBA type materials were characterized in order to analyze their structural and
physical properties. The X-Ray diffraction patterns of the synthesized SBA-15
support and STA impregnated SBA-15 catalyst having W/Si molar ratio of 1
(STA@SBA-15) were analyzed and given in Figure 35 and Figure 36.
Low angle XRD pattern of SBA support (Figure 35) showed that synthesis of SBA-
15 was successfully accomplished. When the small angle X-Ray diffraction pattern
of pure SBA-15 is compared with the STA@SBA-15, low angle reflection peaks
could no longer be observed. Loss of reflection peaks indicated that high STA
loading resulted in poorer mesoscale ordering and destruction of mesostructure. For
1400 1450 1500 1550 1600 1650 1700
Ab
sorb
an
ce
Wavenumber , cm-1
CZ CZA H-CZA-TOYO
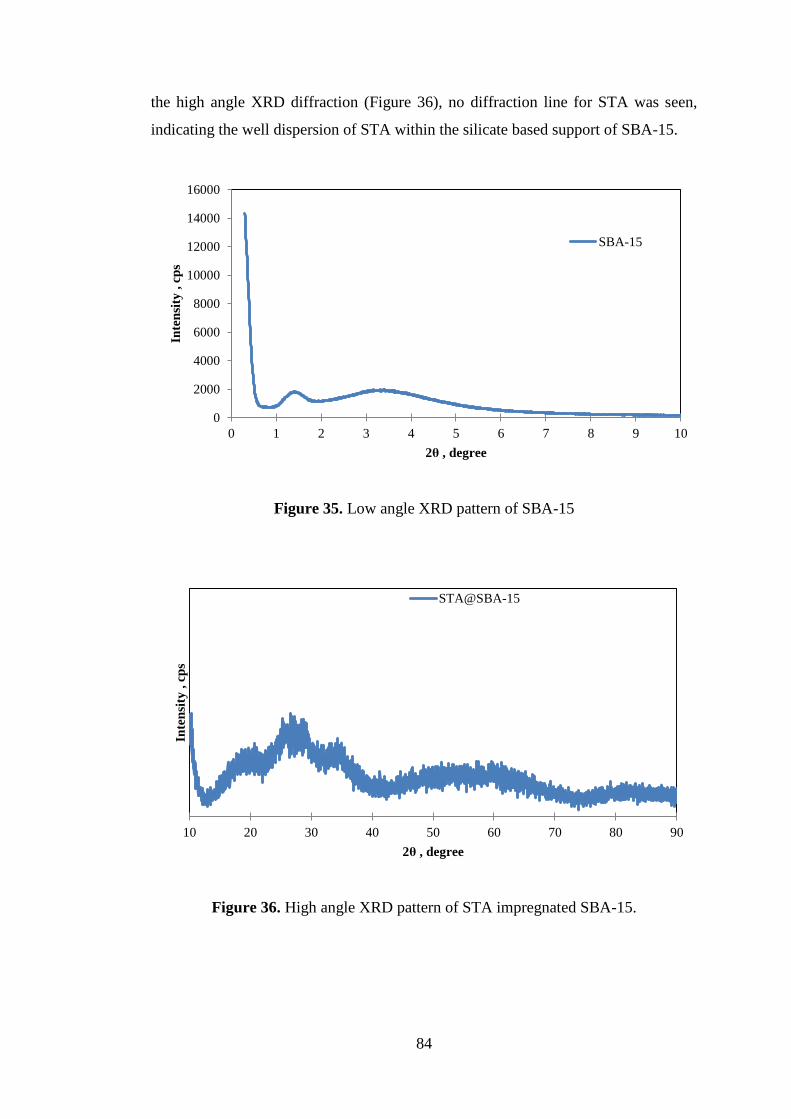
84
the high angle XRD diffraction (Figure 36), no diffraction line for STA was seen,
indicating the well dispersion of STA within the silicate based support of SBA-15.
Figure 35. Low angle XRD pattern of SBA-15
Figure 36. High angle XRD pattern of STA impregnated SBA-15.
0
2000
4000
6000
8000
10000
12000
14000
16000
0 1 2 3 4 5 6 7 8 9 10
Inte
nsi
ty ,
cp
s
2θ , degree
SBA-15
10 20 30 40 50 60 70 80 90
Inte
nsi
ty ,
cp
s
2θ , degree
STA@SBA-15
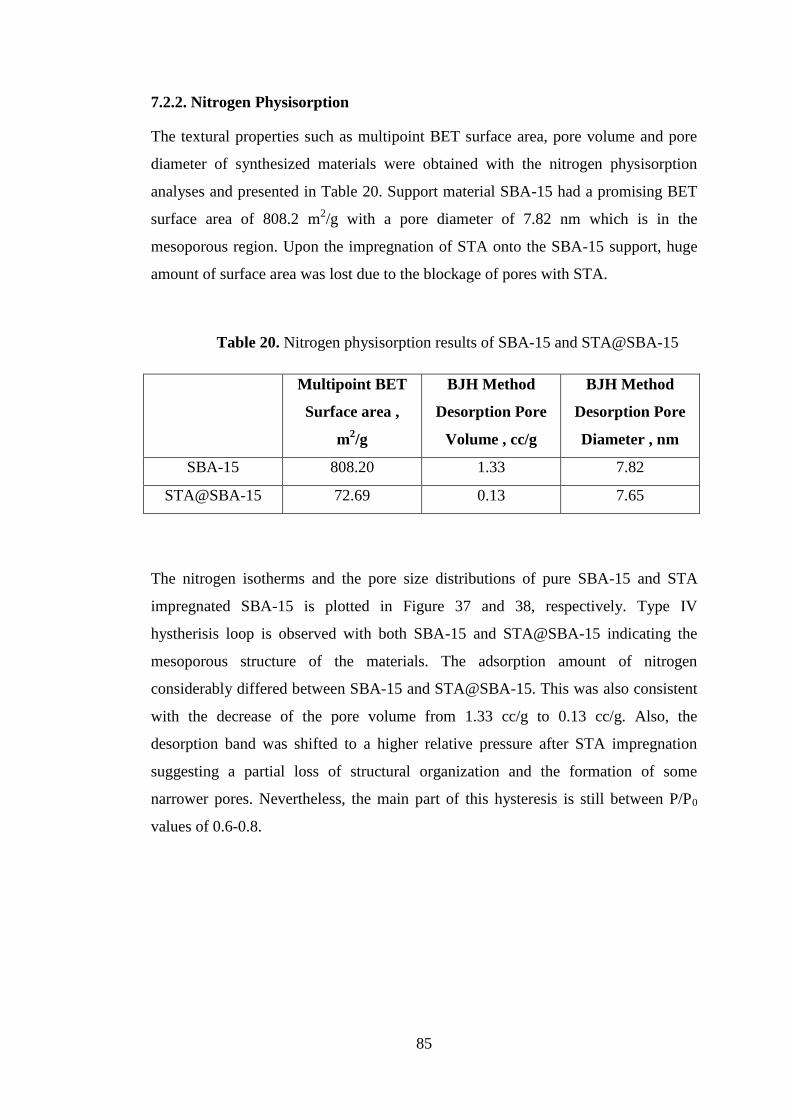
85
7.2.2. Nitrogen Physisorption
The textural properties such as multipoint BET surface area, pore volume and pore
diameter of synthesized materials were obtained with the nitrogen physisorption
analyses and presented in Table 20. Support material SBA-15 had a promising BET
surface area of 808.2 m2/g with a pore diameter of 7.82 nm which is in the
mesoporous region. Upon the impregnation of STA onto the SBA-15 support, huge
amount of surface area was lost due to the blockage of pores with STA.
Table 20. Nitrogen physisorption results of SBA-15 and STA@SBA-15
Multipoint BET
Surface area ,
m2/g
BJH Method
Desorption Pore
Volume , cc/g
BJH Method
Desorption Pore
Diameter , nm
SBA-15 808.20 1.33 7.82
STA@SBA-15 72.69 0.13 7.65
The nitrogen isotherms and the pore size distributions of pure SBA-15 and STA
impregnated SBA-15 is plotted in Figure 37 and 38, respectively. Type IV
hystherisis loop is observed with both SBA-15 and STA@SBA-15 indicating the
mesoporous structure of the materials. The adsorption amount of nitrogen
considerably differed between SBA-15 and STA@SBA-15. This was also consistent
with the decrease of the pore volume from 1.33 cc/g to 0.13 cc/g. Also, the
desorption band was shifted to a higher relative pressure after STA impregnation
suggesting a partial loss of structural organization and the formation of some
narrower pores. Nevertheless, the main part of this hysteresis is still between P/P0
values of 0.6-0.8.
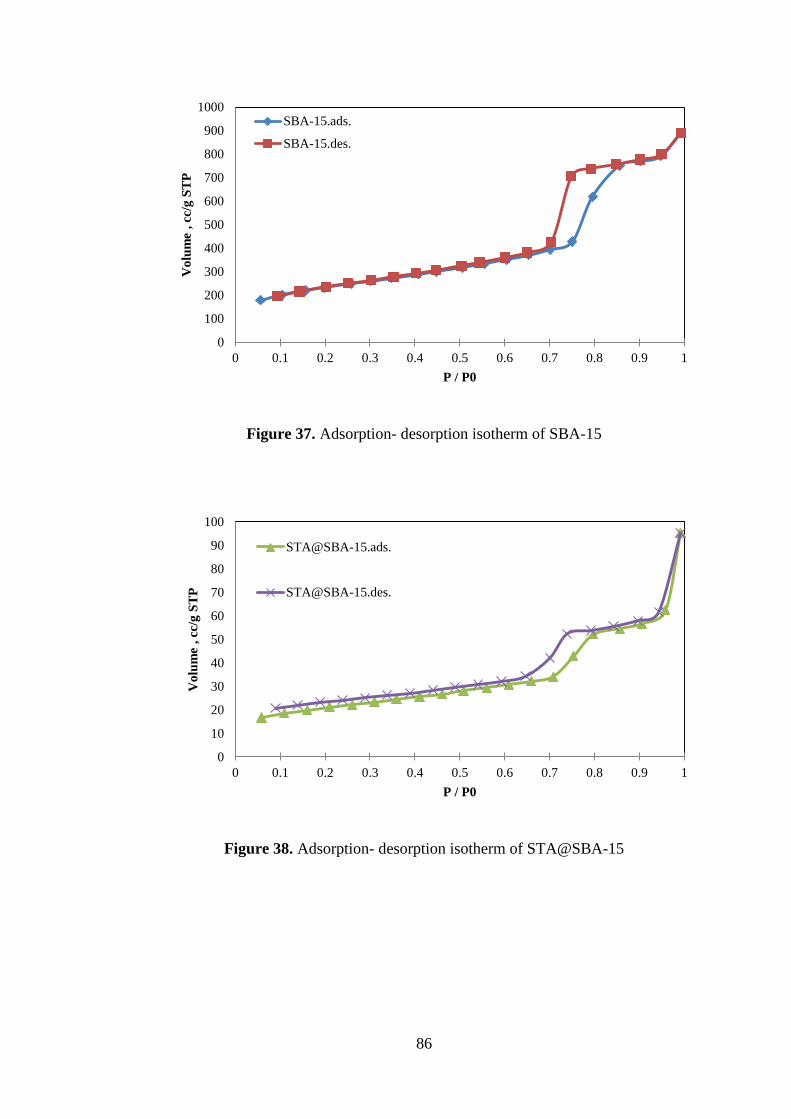
86
Figure 37. Adsorption- desorption isotherm of SBA-15
Figure 38. Adsorption- desorption isotherm of STA@SBA-15
0
100
200
300
400
500
600
700
800
900
1000
0 0.1 0.2 0.3 0.4 0.5 0.6 0.7 0.8 0.9 1
Vo
lum
e , cc
/g S
TP
P / P0
SBA-15.ads.
SBA-15.des.
0
10
20
30
40
50
60
70
80
90
100
0 0.1 0.2 0.3 0.4 0.5 0.6 0.7 0.8 0.9 1
Vo
lum
e , cc
/g S
TP
P / P0
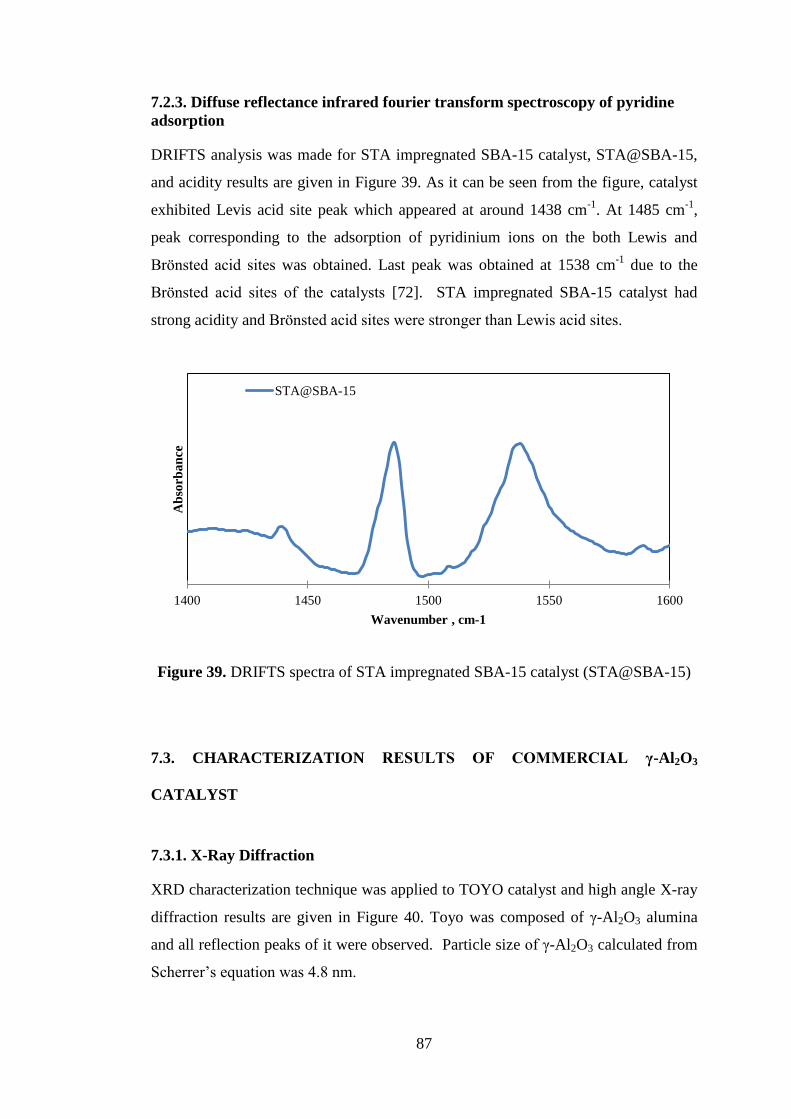
87
7.2.3. Diffuse reflectance infrared fourier transform spectroscopy of pyridine
adsorption
DRIFTS analysis was made for STA impregnated SBA-15 catalyst, STA@SBA-15,
and acidity results are given in Figure 39. As it can be seen from the figure, catalyst
exhibited Levis acid site peak which appeared at around 1438 cm-1
. At 1485 cm-1
,
peak corresponding to the adsorption of pyridinium ions on the both Lewis and
Brönsted acid sites was obtained. Last peak was obtained at 1538 cm-1
due to the
Brönsted acid sites of the catalysts [72]. STA impregnated SBA-15 catalyst had
strong acidity and Brönsted acid sites were stronger than Lewis acid sites.
Figure 39. DRIFTS spectra of STA impregnated SBA-15 catalyst (STA@SBA-15)
7.3. CHARACTERIZATION RESULTS OF COMMERCIAL γ-Al2O3
CATALYST
7.3.1. X-Ray Diffraction
XRD characterization technique was applied to TOYO catalyst and high angle X-ray
diffraction results are given in Figure 40. Toyo was composed of γ-Al2O3 alumina
and all reflection peaks of it were observed. Particle size of γ-Al2O3 calculated from
Scherrer‟s equation was 4.8 nm.
1400 1450 1500 1550 1600
Ab
sorb
an
ce
Wavenumber , cm-1
STA@SBA-15
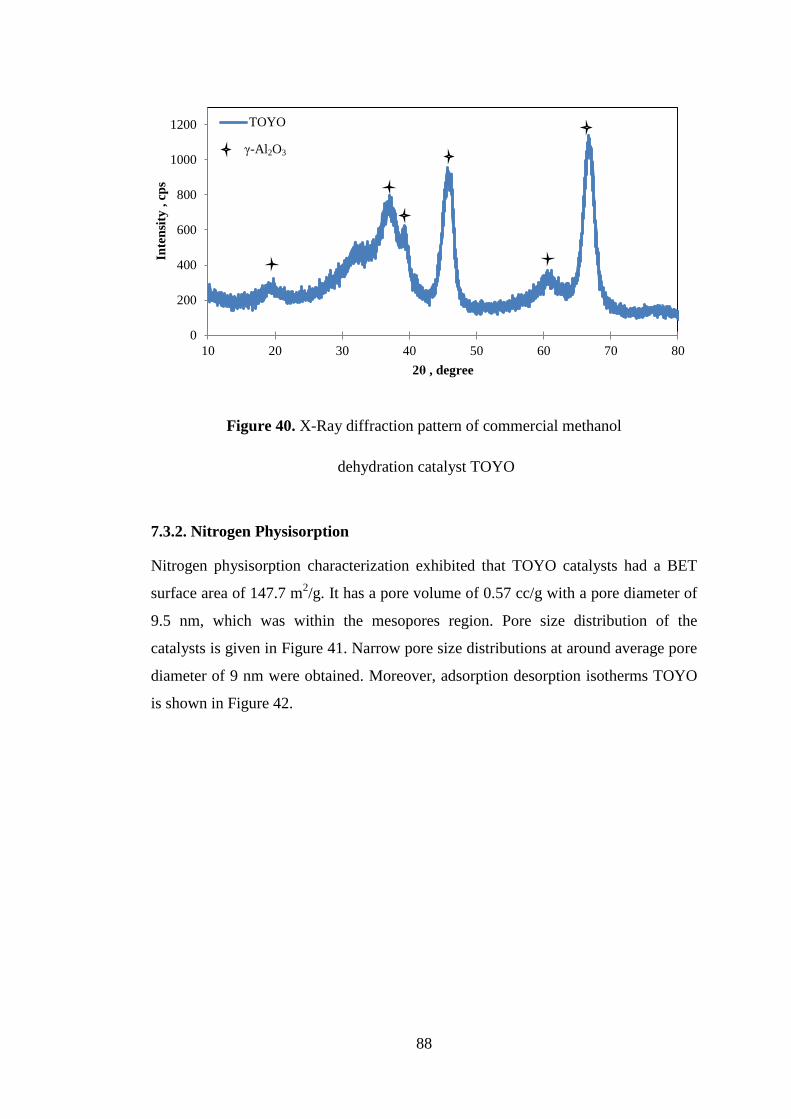
88
Figure 40. X-Ray diffraction pattern of commercial methanol
dehydration catalyst TOYO
7.3.2. Nitrogen Physisorption
Nitrogen physisorption characterization exhibited that TOYO catalysts had a BET
surface area of 147.7 m2/g. It has a pore volume of 0.57 cc/g with a pore diameter of
9.5 nm, which was within the mesopores region. Pore size distribution of the
catalysts is given in Figure 41. Narrow pore size distributions at around average pore
diameter of 9 nm were obtained. Moreover, adsorption desorption isotherms TOYO
is shown in Figure 42.
0
200
400
600
800
1000
1200
10 20 30 40 50 60 70 80
Inte
nsi
ty ,
cp
s
2θ , degree
TOYO
γ-Al2O3
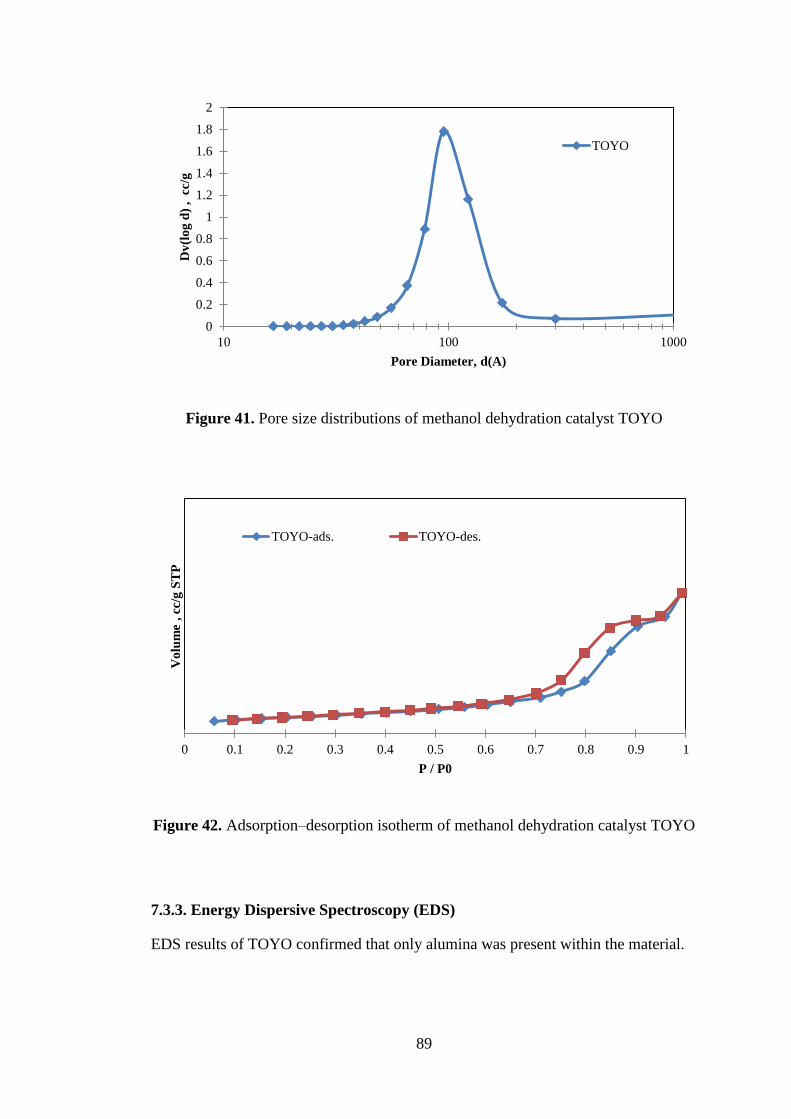
89
Figure 41. Pore size distributions of methanol dehydration catalyst TOYO
Figure 42. Adsorption–desorption isotherm of methanol dehydration catalyst TOYO
7.3.3. Energy Dispersive Spectroscopy (EDS)
EDS results of TOYO confirmed that only alumina was present within the material.
0
0.2
0.4
0.6
0.8
1
1.2
1.4
1.6
1.8
2
10 100 1000
Dv
(lo
g d
) , c
c/g
Pore Diameter, d(A)
TOYO
0 0.1 0.2 0.3 0.4 0.5 0.6 0.7 0.8 0.9 1
Vo
lum
e , cc
/g S
TP
P / P0
TOYO-ads. TOYO-des.
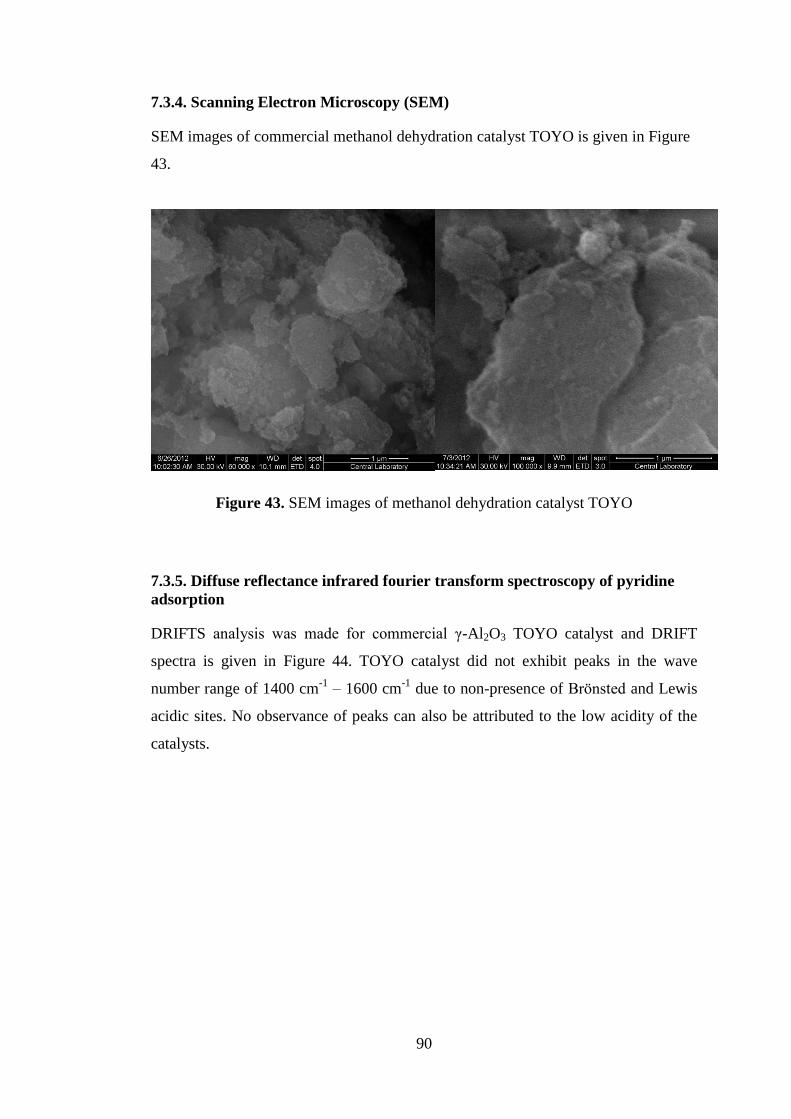
90
7.3.4. Scanning Electron Microscopy (SEM)
SEM images of commercial methanol dehydration catalyst TOYO is given in Figure
43.
Figure 43. SEM images of methanol dehydration catalyst TOYO
7.3.5. Diffuse reflectance infrared fourier transform spectroscopy of pyridine
adsorption
DRIFTS analysis was made for commercial γ-Al2O3 TOYO catalyst and DRIFT
spectra is given in Figure 44. TOYO catalyst did not exhibit peaks in the wave
number range of 1400 cm-1
– 1600 cm-1
due to non-presence of Brönsted and Lewis
acidic sites. No observance of peaks can also be attributed to the low acidity of the
catalysts.
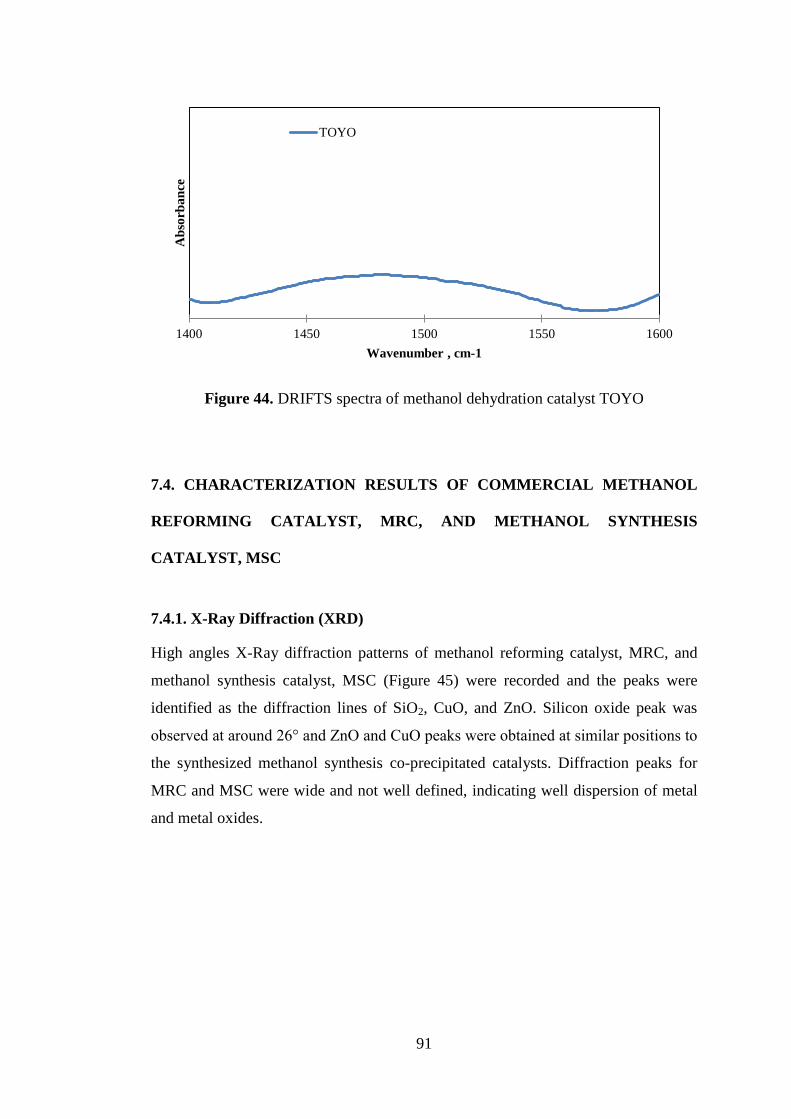
91
Figure 44. DRIFTS spectra of methanol dehydration catalyst TOYO
7.4. CHARACTERIZATION RESULTS OF COMMERCIAL METHANOL
REFORMING CATALYST, MRC, AND METHANOL SYNTHESIS
CATALYST, MSC
7.4.1. X-Ray Diffraction (XRD)
High angles X-Ray diffraction patterns of methanol reforming catalyst, MRC, and
methanol synthesis catalyst, MSC (Figure 45) were recorded and the peaks were
identified as the diffraction lines of SiO2, CuO, and ZnO. Silicon oxide peak was
observed at around 26° and ZnO and CuO peaks were obtained at similar positions to
the synthesized methanol synthesis co-precipitated catalysts. Diffraction peaks for
MRC and MSC were wide and not well defined, indicating well dispersion of metal
and metal oxides.
1400 1450 1500 1550 1600
Ab
sorb
an
ce
Wavenumber , cm-1
TOYO
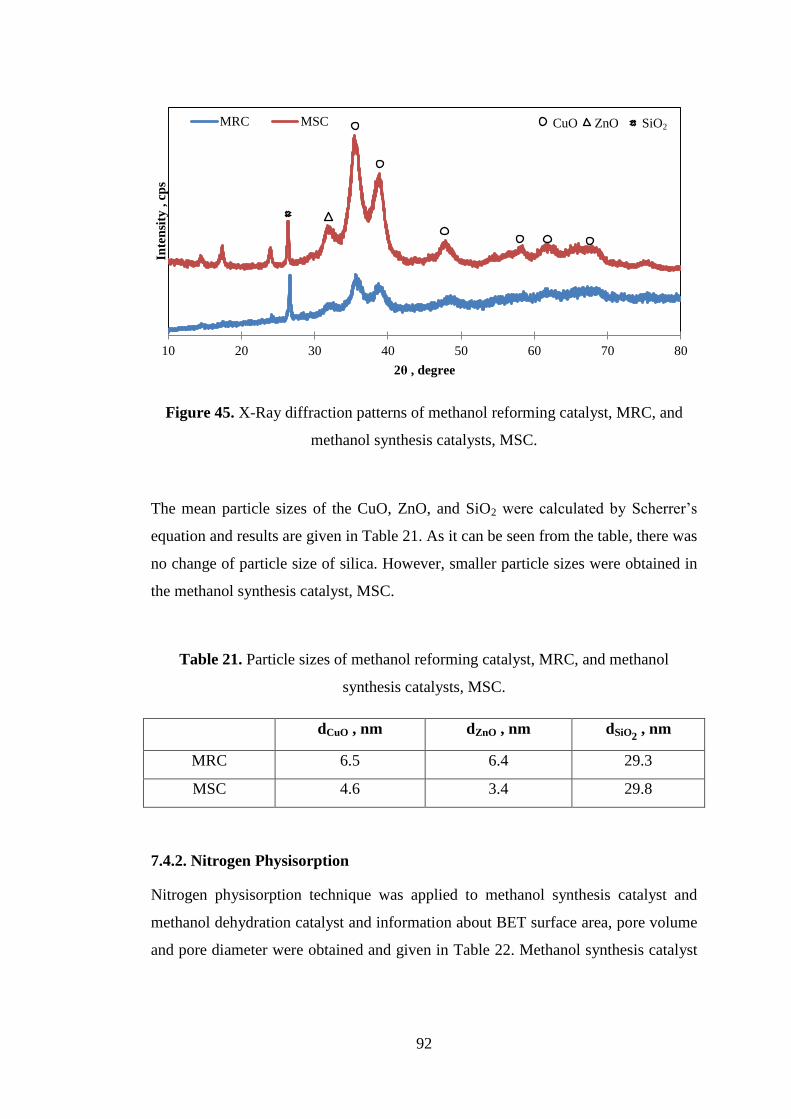
92
Figure 45. X-Ray diffraction patterns of methanol reforming catalyst, MRC, and
methanol synthesis catalysts, MSC.
The mean particle sizes of the CuO, ZnO, and SiO2 were calculated by Scherrer‟s
equation and results are given in Table 21. As it can be seen from the table, there was
no change of particle size of silica. However, smaller particle sizes were obtained in
the methanol synthesis catalyst, MSC.
Table 21. Particle sizes of methanol reforming catalyst, MRC, and methanol
synthesis catalysts, MSC.
dCuO , nm dZnO , nm dSiO2 , nm
MRC 6.5 6.4 29.3
MSC 4.6 3.4 29.8
7.4.2. Nitrogen Physisorption
Nitrogen physisorption technique was applied to methanol synthesis catalyst and
methanol dehydration catalyst and information about BET surface area, pore volume
and pore diameter were obtained and given in Table 22. Methanol synthesis catalyst
10 20 30 40 50 60 70 80
Inte
nsi
ty ,
cp
s
2θ , degree
MRC MSC CuO ZnO SiO2
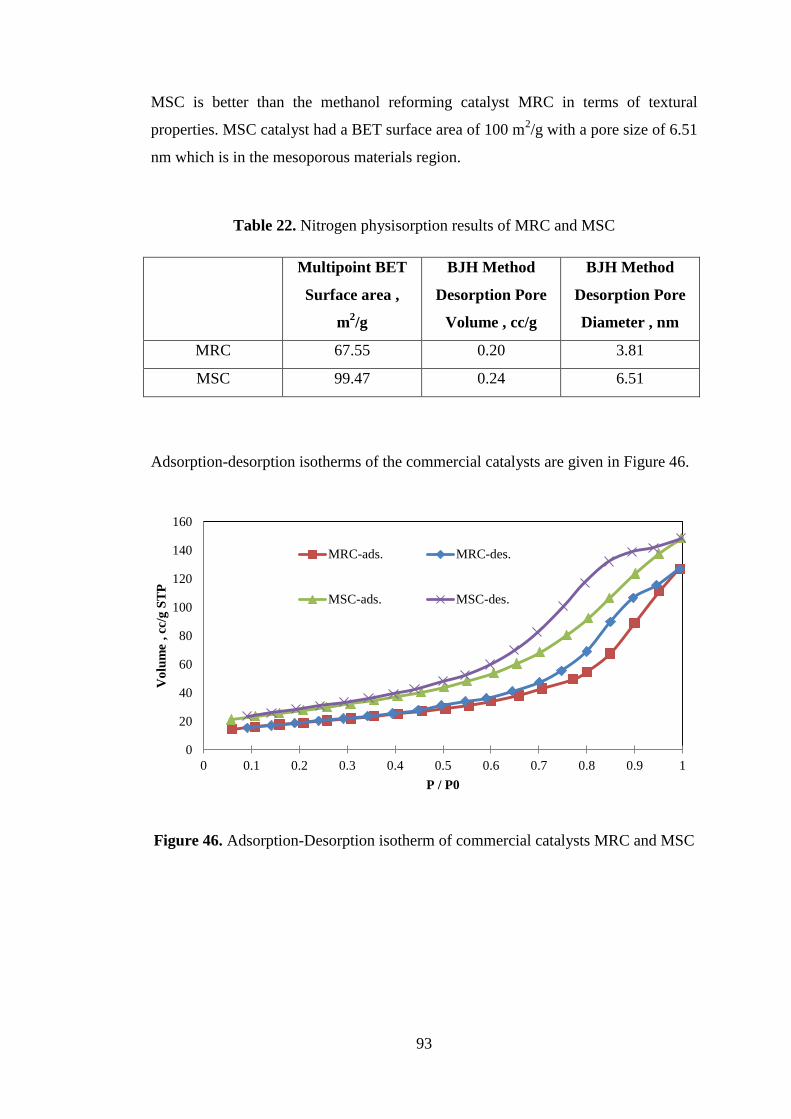
93
MSC is better than the methanol reforming catalyst MRC in terms of textural
properties. MSC catalyst had a BET surface area of 100 m2/g with a pore size of 6.51
nm which is in the mesoporous materials region.
Table 22. Nitrogen physisorption results of MRC and MSC
Multipoint BET
Surface area ,
m2/g
BJH Method
Desorption Pore
Volume , cc/g
BJH Method
Desorption Pore
Diameter , nm
MRC 67.55 0.20 3.81
MSC 99.47 0.24 6.51
Adsorption-desorption isotherms of the commercial catalysts are given in Figure 46.
Figure 46. Adsorption-Desorption isotherm of commercial catalysts MRC and MSC
0
20
40
60
80
100
120
140
160
0 0.1 0.2 0.3 0.4 0.5 0.6 0.7 0.8 0.9 1
Vo
lum
e , cc
/g S
TP
P / P0
MRC-ads. MRC-des.
MSC-ads. MSC-des.
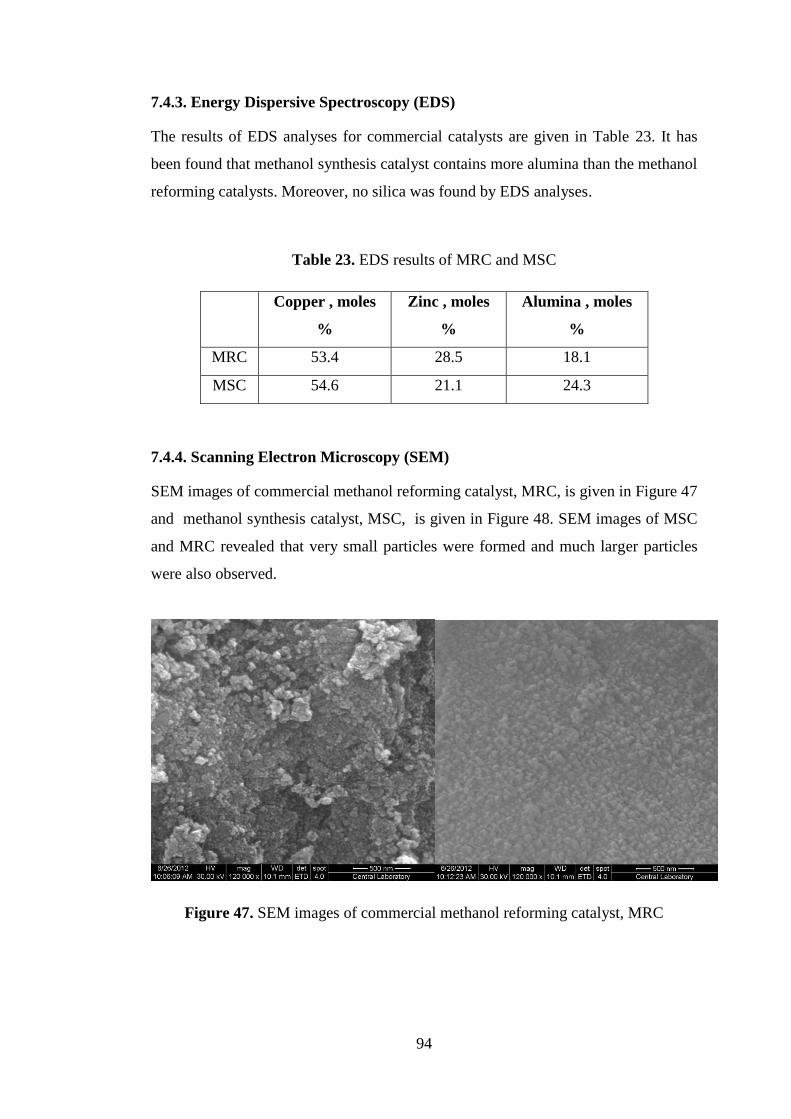
94
7.4.3. Energy Dispersive Spectroscopy (EDS)
The results of EDS analyses for commercial catalysts are given in Table 23. It has
been found that methanol synthesis catalyst contains more alumina than the methanol
reforming catalysts. Moreover, no silica was found by EDS analyses.
Table 23. EDS results of MRC and MSC
Copper , moles
%
Zinc , moles
%
Alumina , moles
%
MRC 53.4 28.5 18.1
MSC 54.6 21.1 24.3
7.4.4. Scanning Electron Microscopy (SEM)
SEM images of commercial methanol reforming catalyst, MRC, is given in Figure 47
and methanol synthesis catalyst, MSC, is given in Figure 48. SEM images of MSC
and MRC revealed that very small particles were formed and much larger particles
were also observed.
Figure 47. SEM images of commercial methanol reforming catalyst, MRC
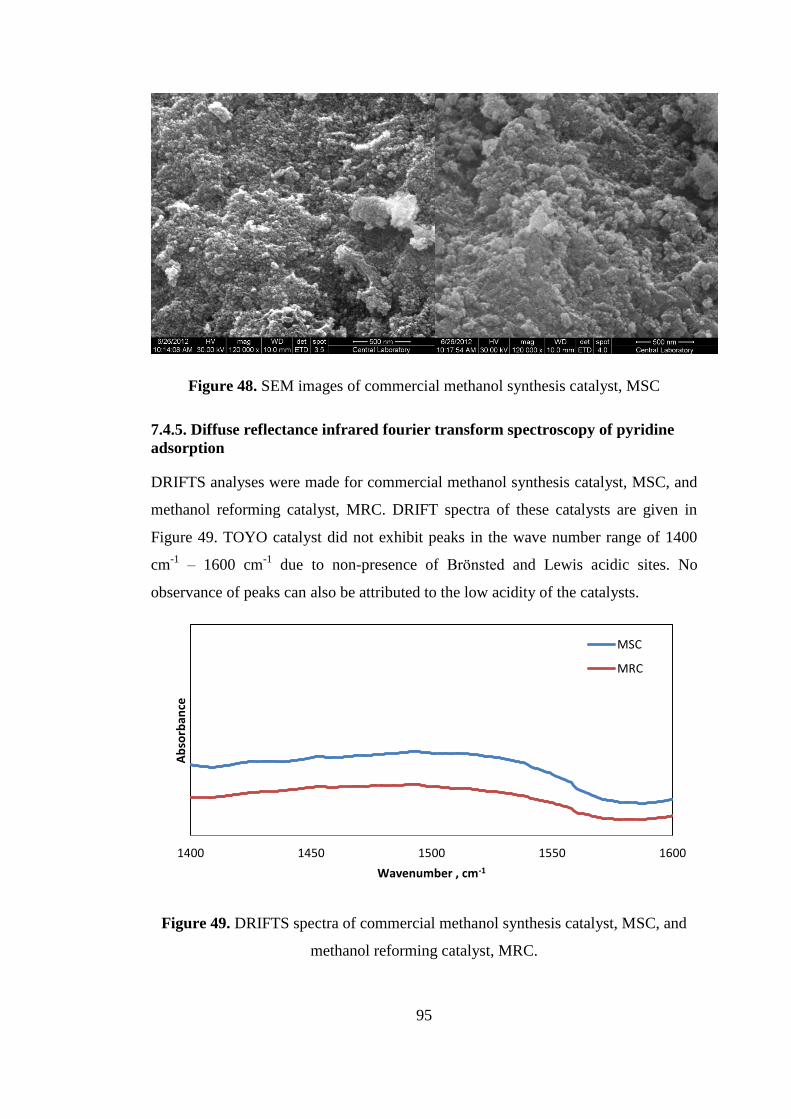
95
Figure 48. SEM images of commercial methanol synthesis catalyst, MSC
7.4.5. Diffuse reflectance infrared fourier transform spectroscopy of pyridine
adsorption
DRIFTS analyses were made for commercial methanol synthesis catalyst, MSC, and
methanol reforming catalyst, MRC. DRIFT spectra of these catalysts are given in
Figure 49. TOYO catalyst did not exhibit peaks in the wave number range of 1400
cm-1
– 1600 cm-1
due to non-presence of Brönsted and Lewis acidic sites. No
observance of peaks can also be attributed to the low acidity of the catalysts.
Figure 49. DRIFTS spectra of commercial methanol synthesis catalyst, MSC, and
methanol reforming catalyst, MRC.
1400 1450 1500 1550 1600
Ab
sorb
ance
Wavenumber , cm-1
MSC
MRC
96
CHAPTER 8
ACTIVITY RESULTS
8. ACTIVITY RESULTS
In this part, activity results of characterized catalysts are given in the direct synthesis
of DME. Since some catalysts are methanol synthesis catalysts, some are methanol
dehydrations catalysts, or direct DME synthesis catalysts, their activities are given on
the basis of what they are responsible for. The carbon monoxide and carbon dioxide
conversions (when applicable) and selectivity of the products are given in graphical
forms as a function of temperature.
8.1. ACTIVITY RESULTS OF COMMERCIAL CATALYSTS
Activity results of commercial methanol reforming catalyst and methanol synthesis
catalyst were made for different flow rates and different reactant gas mixtures.
Methanol reforming catalyst was obtained from the Alfa- Aesar and denoted as
“MRC” whereas methanol synthesis catalyst was also obtained from the Alfa – Aesar
and denoted as “MSC”. Characterization results of these commercial catalysts were
discussed in Section 7.4. Activity test of MSC was done in another study at the same
experimental set-up and experimental data was taken for the comparative purposes
[8].
8.1.1. Activity results of MRC from Mixture-1 (CO:H2=50:50)
Activity tests of MRC were conducted for methanol synthesis from the syngas. Since
there was no methanol dehydration component, methanol formation was expected,
mainly.
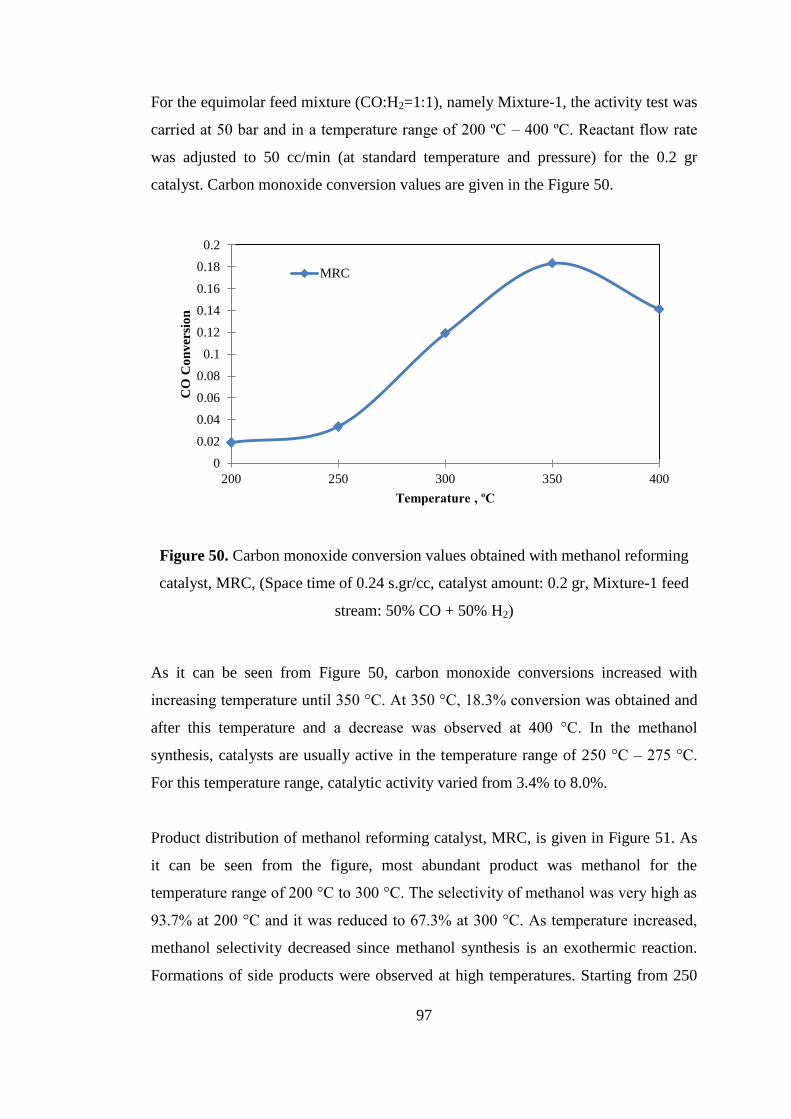
97
For the equimolar feed mixture (CO:H2=1:1), namely Mixture-1, the activity test was
carried at 50 bar and in a temperature range of 200 ºC – 400 ºC. Reactant flow rate
was adjusted to 50 cc/min (at standard temperature and pressure) for the 0.2 gr
catalyst. Carbon monoxide conversion values are given in the Figure 50.
Figure 50. Carbon monoxide conversion values obtained with methanol reforming
catalyst, MRC, (Space time of 0.24 s.gr/cc, catalyst amount: 0.2 gr, Mixture-1 feed
stream: 50% CO + 50% H2)
As it can be seen from Figure 50, carbon monoxide conversions increased with
increasing temperature until 350 °C. At 350 °C, 18.3% conversion was obtained and
after this temperature and a decrease was observed at 400 °C. In the methanol
synthesis, catalysts are usually active in the temperature range of 250 °C – 275 °C.
For this temperature range, catalytic activity varied from 3.4% to 8.0%.
Product distribution of methanol reforming catalyst, MRC, is given in Figure 51. As
it can be seen from the figure, most abundant product was methanol for the
temperature range of 200 °C to 300 °C. The selectivity of methanol was very high as
93.7% at 200 °C and it was reduced to 67.3% at 300 °C. As temperature increased,
methanol selectivity decreased since methanol synthesis is an exothermic reaction.
Formations of side products were observed at high temperatures. Starting from 250
0
0.02
0.04
0.06
0.08
0.1
0.12
0.14
0.16
0.18
0.2
200 250 300 350 400
CO
Co
nv
ersi
on
Temperature , ºC
MRC
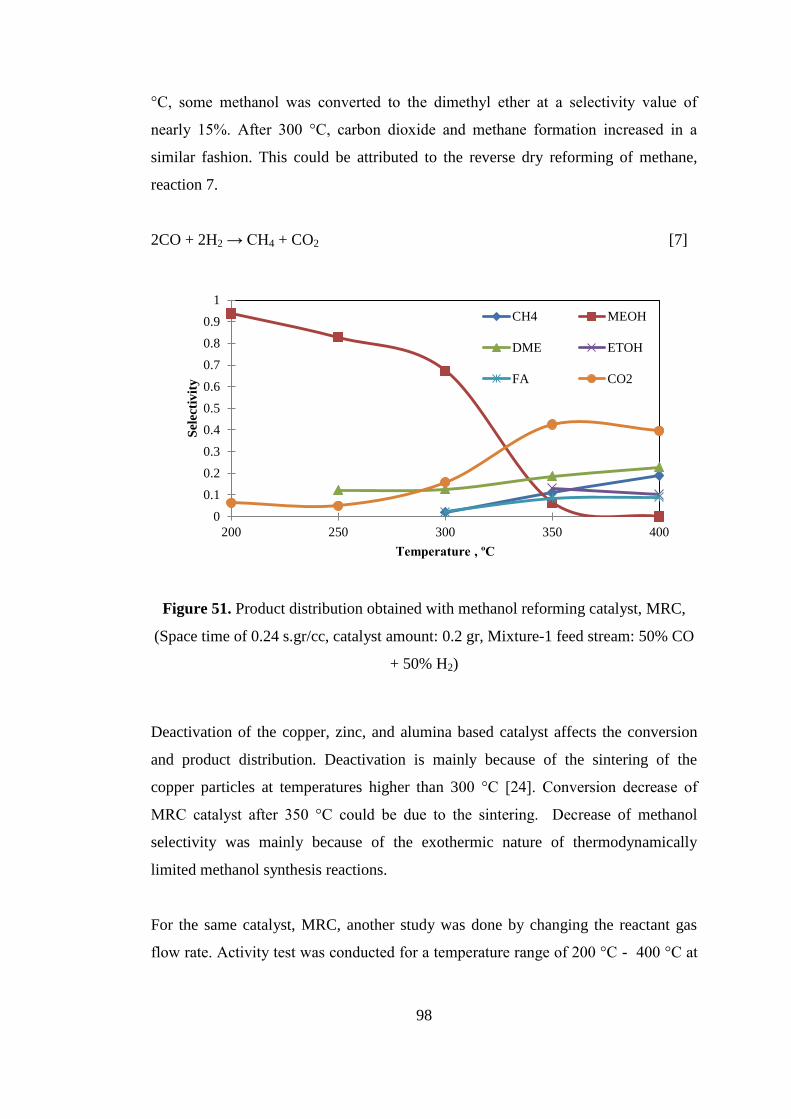
98
°C, some methanol was converted to the dimethyl ether at a selectivity value of
nearly 15%. After 300 °C, carbon dioxide and methane formation increased in a
similar fashion. This could be attributed to the reverse dry reforming of methane,
reaction 7.
2CO + 2H2 → CH4 + CO2 [7]
Figure 51. Product distribution obtained with methanol reforming catalyst, MRC,
(Space time of 0.24 s.gr/cc, catalyst amount: 0.2 gr, Mixture-1 feed stream: 50% CO
+ 50% H2)
Deactivation of the copper, zinc, and alumina based catalyst affects the conversion
and product distribution. Deactivation is mainly because of the sintering of the
copper particles at temperatures higher than 300 °C [24]. Conversion decrease of
MRC catalyst after 350 °C could be due to the sintering. Decrease of methanol
selectivity was mainly because of the exothermic nature of thermodynamically
limited methanol synthesis reactions.
For the same catalyst, MRC, another study was done by changing the reactant gas
flow rate. Activity test was conducted for a temperature range of 200 °C - 400 °C at
0
0.1
0.2
0.3
0.4
0.5
0.6
0.7
0.8
0.9
1
200 250 300 350 400
Sel
ecti
vit
y
Temperature , ºC
CH4 MEOH
DME ETOH
FA CO2
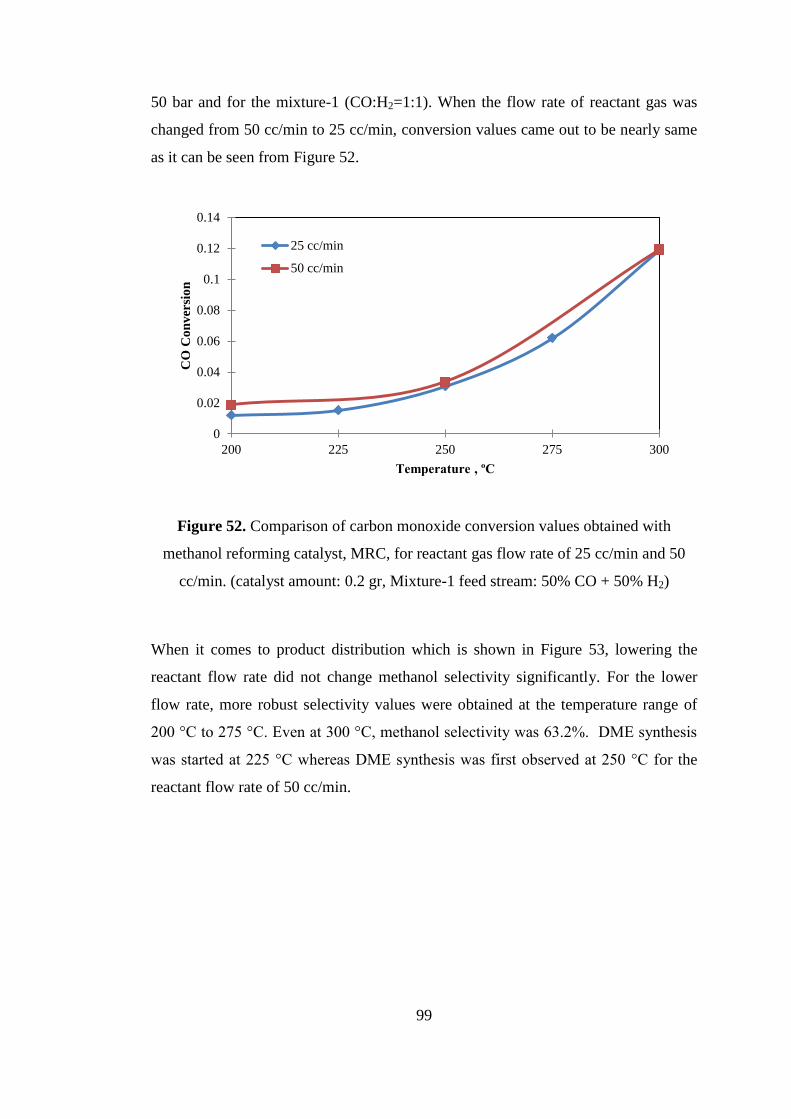
99
50 bar and for the mixture-1 (CO:H2=1:1). When the flow rate of reactant gas was
changed from 50 cc/min to 25 cc/min, conversion values came out to be nearly same
as it can be seen from Figure 52.
Figure 52. Comparison of carbon monoxide conversion values obtained with
methanol reforming catalyst, MRC, for reactant gas flow rate of 25 cc/min and 50
cc/min. (catalyst amount: 0.2 gr, Mixture-1 feed stream: 50% CO + 50% H2)
When it comes to product distribution which is shown in Figure 53, lowering the
reactant flow rate did not change methanol selectivity significantly. For the lower
flow rate, more robust selectivity values were obtained at the temperature range of
200 °C to 275 °C. Even at 300 °C, methanol selectivity was 63.2%. DME synthesis
was started at 225 °C whereas DME synthesis was first observed at 250 °C for the
reactant flow rate of 50 cc/min.
0
0.02
0.04
0.06
0.08
0.1
0.12
0.14
200 225 250 275 300
CO
Co
nv
ersi
on
Temperature , ºC
25 cc/min
50 cc/min
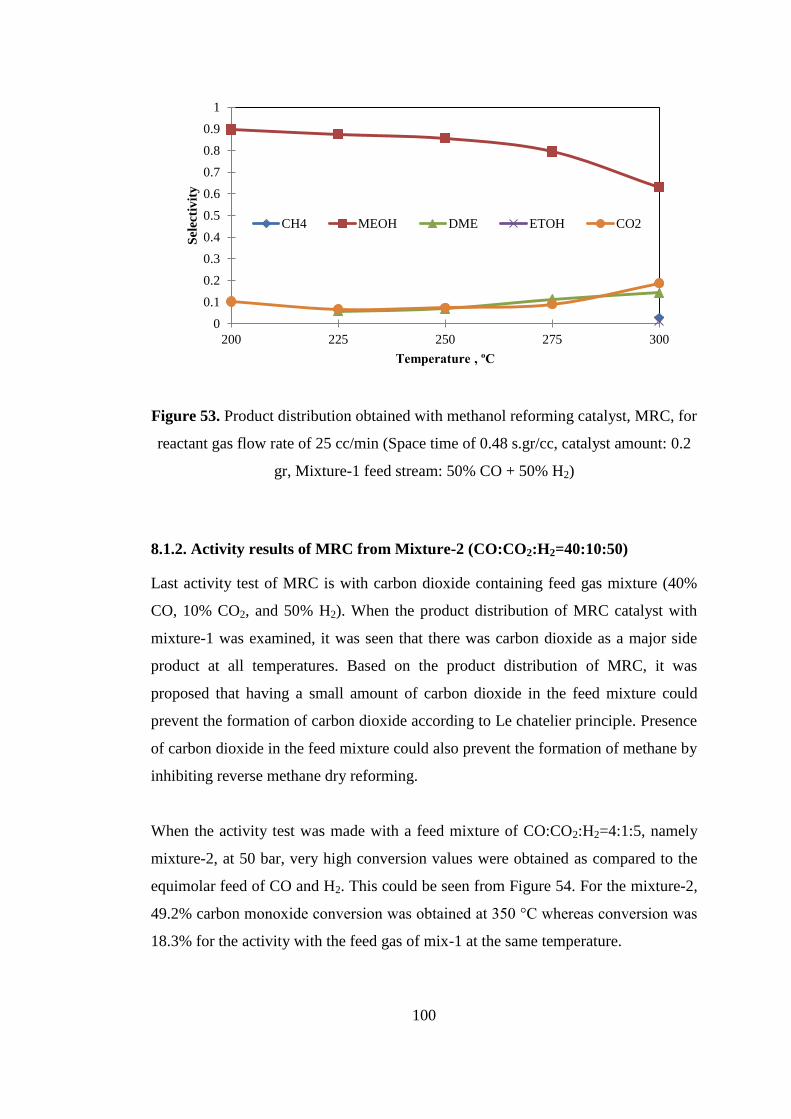
100
Figure 53. Product distribution obtained with methanol reforming catalyst, MRC, for
reactant gas flow rate of 25 cc/min (Space time of 0.48 s.gr/cc, catalyst amount: 0.2
gr, Mixture-1 feed stream: 50% CO + 50% H2)
8.1.2. Activity results of MRC from Mixture-2 (CO:CO2:H2=40:10:50)
Last activity test of MRC is with carbon dioxide containing feed gas mixture (40%
CO, 10% CO2, and 50% H2). When the product distribution of MRC catalyst with
mixture-1 was examined, it was seen that there was carbon dioxide as a major side
product at all temperatures. Based on the product distribution of MRC, it was
proposed that having a small amount of carbon dioxide in the feed mixture could
prevent the formation of carbon dioxide according to Le chatelier principle. Presence
of carbon dioxide in the feed mixture could also prevent the formation of methane by
inhibiting reverse methane dry reforming.
When the activity test was made with a feed mixture of CO:CO2:H2=4:1:5, namely
mixture-2, at 50 bar, very high conversion values were obtained as compared to the
equimolar feed of CO and H2. This could be seen from Figure 54. For the mixture-2,
49.2% carbon monoxide conversion was obtained at 350 °C whereas conversion was
18.3% for the activity with the feed gas of mix-1 at the same temperature.
0
0.1
0.2
0.3
0.4
0.5
0.6
0.7
0.8
0.9
1
200 225 250 275 300
Sel
ecti
vit
y
Temperature , ºC
CH4 MEOH DME ETOH CO2
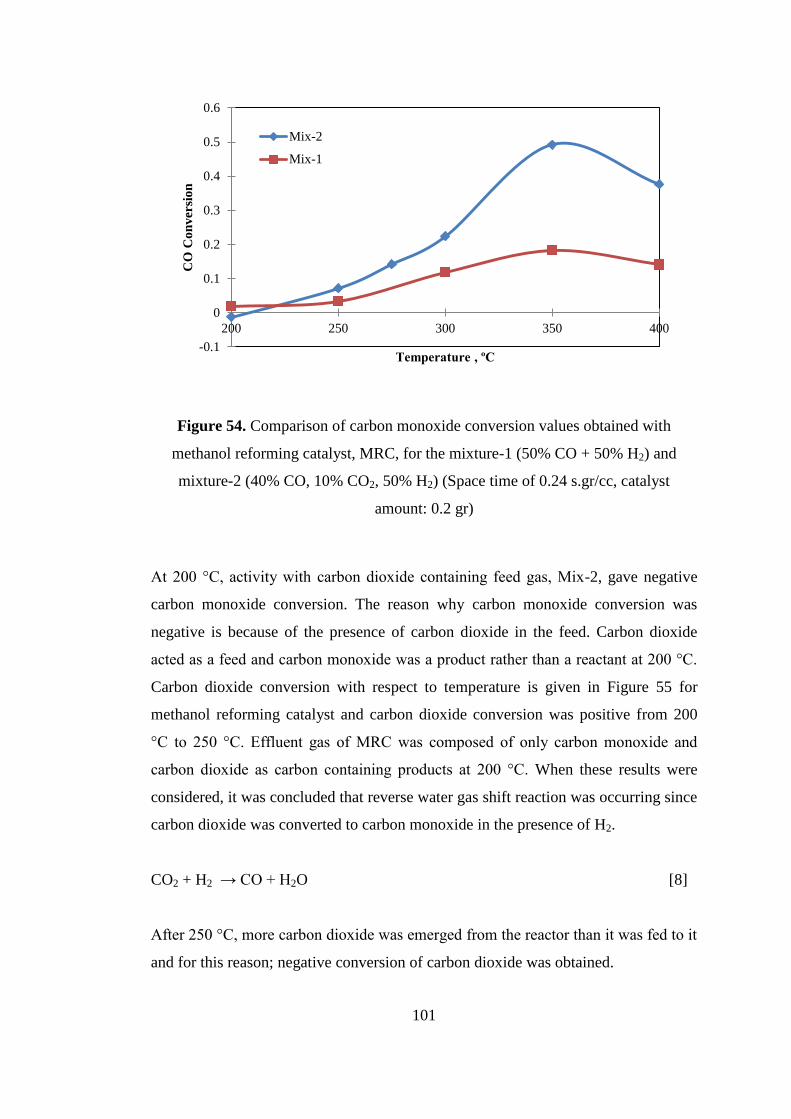
101
Figure 54. Comparison of carbon monoxide conversion values obtained with
methanol reforming catalyst, MRC, for the mixture-1 (50% CO + 50% H2) and
mixture-2 (40% CO, 10% CO2, 50% H2) (Space time of 0.24 s.gr/cc, catalyst
amount: 0.2 gr)
At 200 °C, activity with carbon dioxide containing feed gas, Mix-2, gave negative
carbon monoxide conversion. The reason why carbon monoxide conversion was
negative is because of the presence of carbon dioxide in the feed. Carbon dioxide
acted as a feed and carbon monoxide was a product rather than a reactant at 200 °C.
Carbon dioxide conversion with respect to temperature is given in Figure 55 for
methanol reforming catalyst and carbon dioxide conversion was positive from 200
°C to 250 °C. Effluent gas of MRC was composed of only carbon monoxide and
carbon dioxide as carbon containing products at 200 °C. When these results were
considered, it was concluded that reverse water gas shift reaction was occurring since
carbon dioxide was converted to carbon monoxide in the presence of H2.
CO2 + H2 → CO + H2O [8]
After 250 °C, more carbon dioxide was emerged from the reactor than it was fed to it
and for this reason; negative conversion of carbon dioxide was obtained.
-0.1
0
0.1
0.2
0.3
0.4
0.5
0.6
200 250 300 350 400
CO
Co
nv
ersi
on
Temperature , ºC
Mix-2
Mix-1
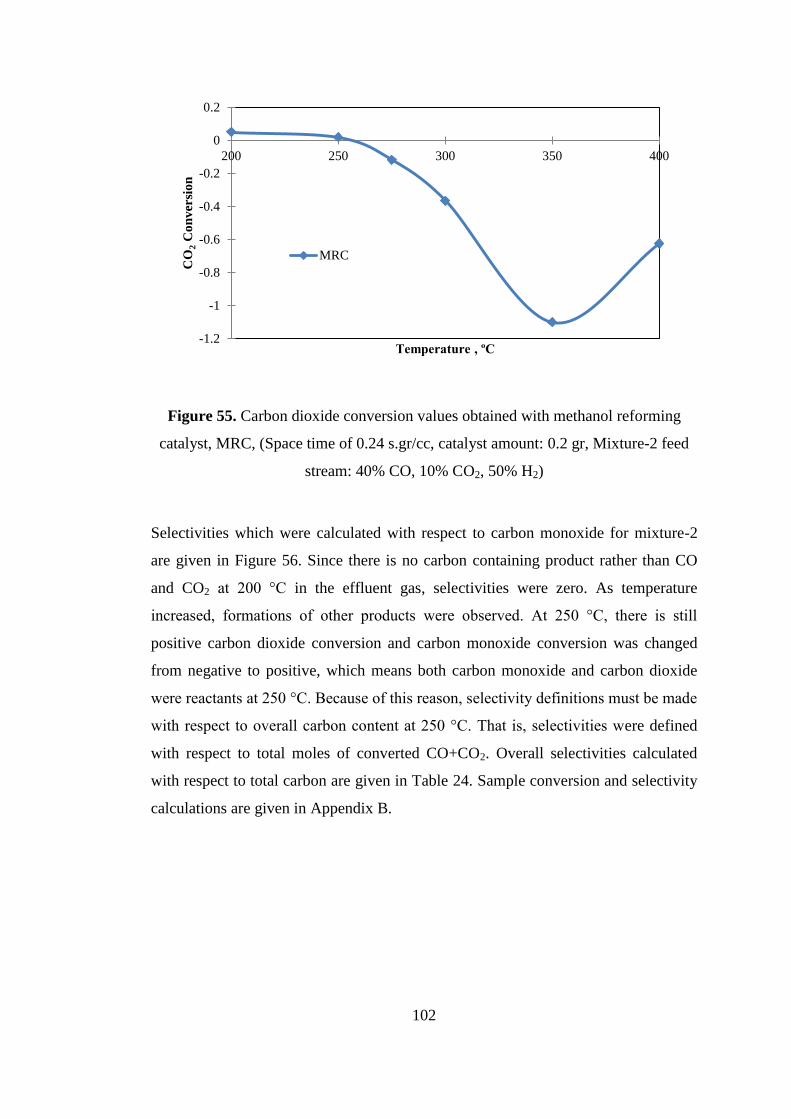
102
Figure 55. Carbon dioxide conversion values obtained with methanol reforming
catalyst, MRC, (Space time of 0.24 s.gr/cc, catalyst amount: 0.2 gr, Mixture-2 feed
stream: 40% CO, 10% CO2, 50% H2)
Selectivities which were calculated with respect to carbon monoxide for mixture-2
are given in Figure 56. Since there is no carbon containing product rather than CO
and CO2 at 200 °C in the effluent gas, selectivities were zero. As temperature
increased, formations of other products were observed. At 250 °C, there is still
positive carbon dioxide conversion and carbon monoxide conversion was changed
from negative to positive, which means both carbon monoxide and carbon dioxide
were reactants at 250 °C. Because of this reason, selectivity definitions must be made
with respect to overall carbon content at 250 °C. That is, selectivities were defined
with respect to total moles of converted CO+CO2. Overall selectivities calculated
with respect to total carbon are given in Table 24. Sample conversion and selectivity
calculations are given in Appendix B.
-1.2
-1
-0.8
-0.6
-0.4
-0.2
0
0.2
200 250 300 350 400
CO
2 C
on
ver
sio
n
Temperature , ºC
MRC
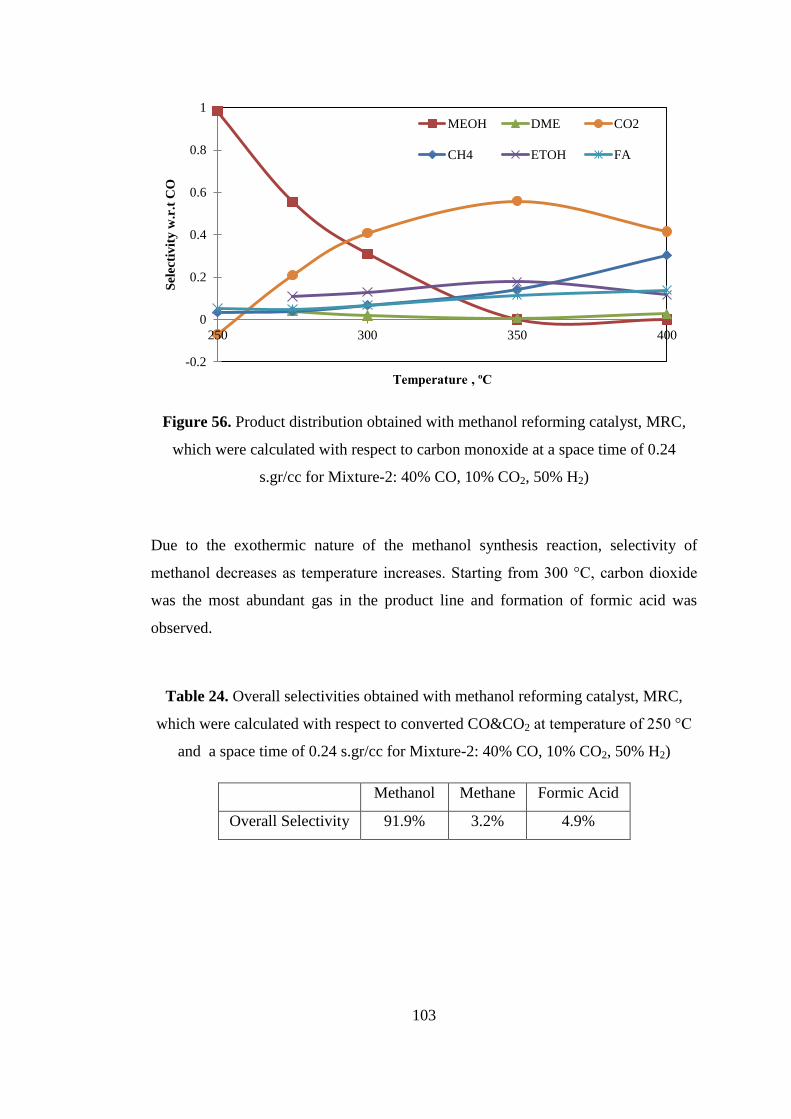
103
Figure 56. Product distribution obtained with methanol reforming catalyst, MRC,
which were calculated with respect to carbon monoxide at a space time of 0.24
s.gr/cc for Mixture-2: 40% CO, 10% CO2, 50% H2)
Due to the exothermic nature of the methanol synthesis reaction, selectivity of
methanol decreases as temperature increases. Starting from 300 °C, carbon dioxide
was the most abundant gas in the product line and formation of formic acid was
observed.
Table 24. Overall selectivities obtained with methanol reforming catalyst, MRC,
which were calculated with respect to converted CO&CO2 at temperature of 250 °C
and a space time of 0.24 s.gr/cc for Mixture-2: 40% CO, 10% CO2, 50% H2)
Methanol Methane Formic Acid
Overall Selectivity 91.9% 3.2% 4.9%
-0.2
0
0.2
0.4
0.6
0.8
1
250 300 350 400
Sel
ecti
vit
y w
.r.t
CO
Temperature , ºC
MEOH DME CO2
CH4 ETOH FA
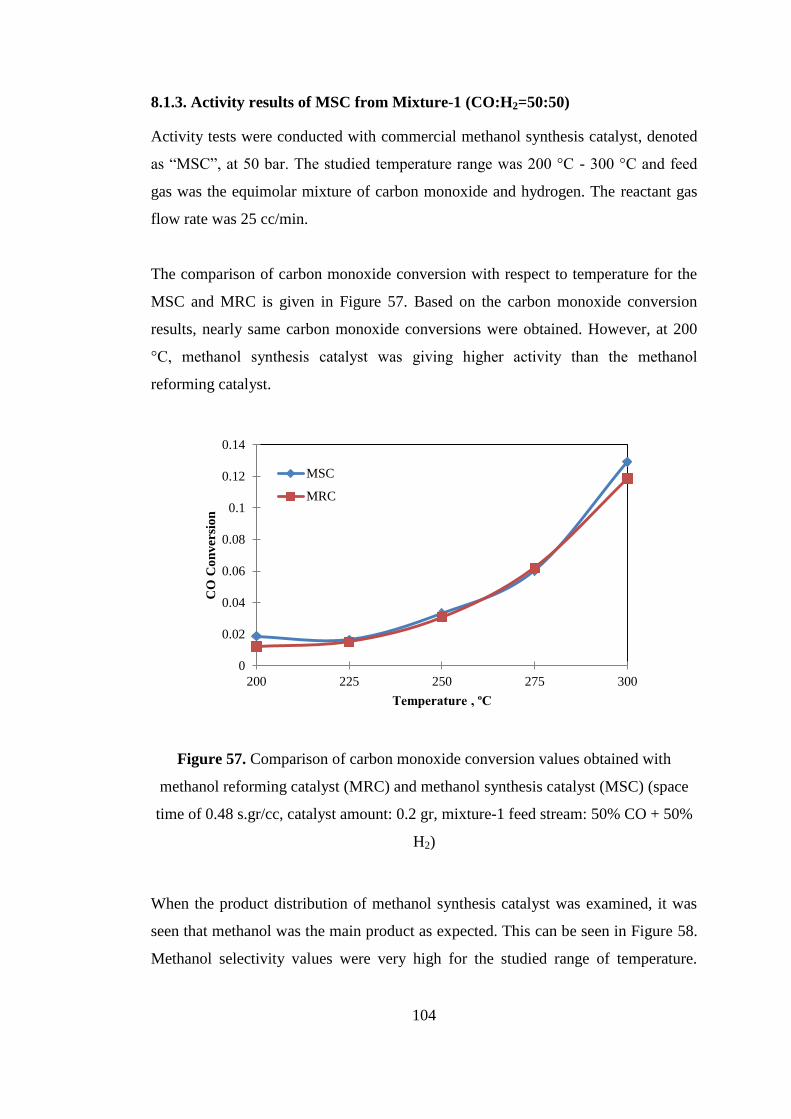
104
8.1.3. Activity results of MSC from Mixture-1 (CO:H2=50:50)
Activity tests were conducted with commercial methanol synthesis catalyst, denoted
as “MSC”, at 50 bar. The studied temperature range was 200 °C - 300 °C and feed
gas was the equimolar mixture of carbon monoxide and hydrogen. The reactant gas
flow rate was 25 cc/min.
The comparison of carbon monoxide conversion with respect to temperature for the
MSC and MRC is given in Figure 57. Based on the carbon monoxide conversion
results, nearly same carbon monoxide conversions were obtained. However, at 200
°C, methanol synthesis catalyst was giving higher activity than the methanol
reforming catalyst.
Figure 57. Comparison of carbon monoxide conversion values obtained with
methanol reforming catalyst (MRC) and methanol synthesis catalyst (MSC) (space
time of 0.48 s.gr/cc, catalyst amount: 0.2 gr, mixture-1 feed stream: 50% CO + 50%
H2)
When the product distribution of methanol synthesis catalyst was examined, it was
seen that methanol was the main product as expected. This can be seen in Figure 58.
Methanol selectivity values were very high for the studied range of temperature.
0
0.02
0.04
0.06
0.08
0.1
0.12
0.14
200 225 250 275 300
CO
Co
nv
ersi
on
Temperature , ºC
MSC
MRC
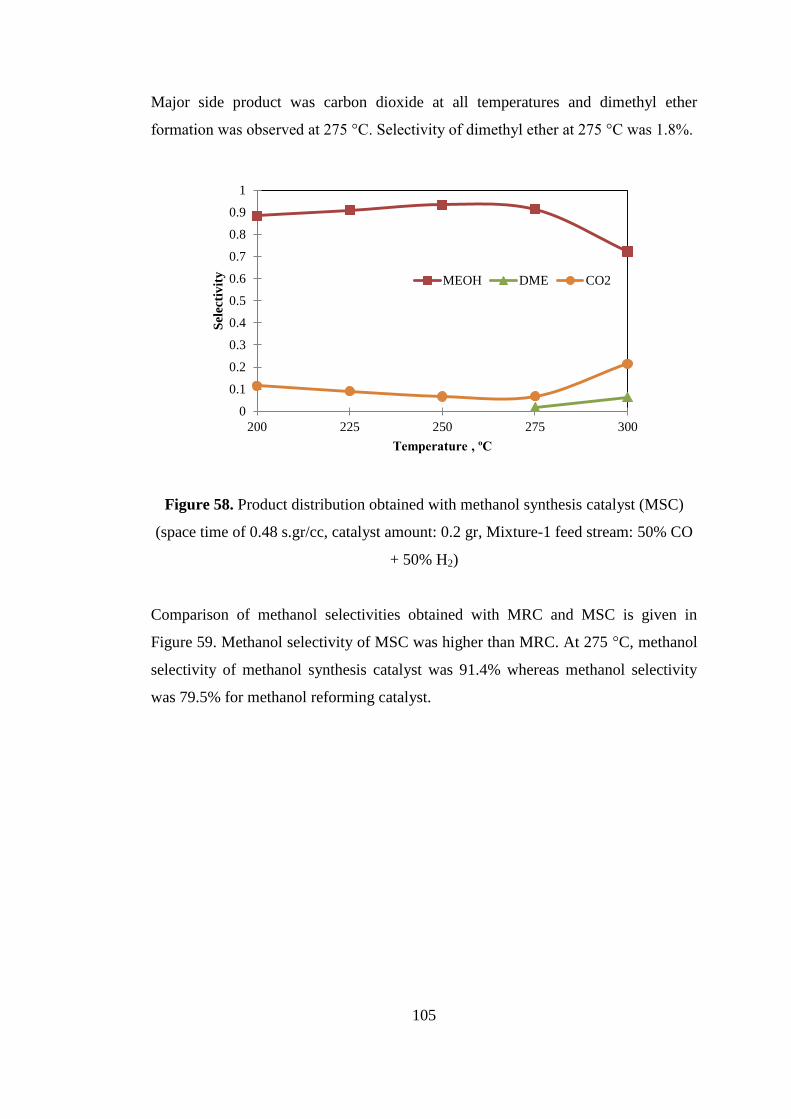
105
Major side product was carbon dioxide at all temperatures and dimethyl ether
formation was observed at 275 °C. Selectivity of dimethyl ether at 275 °C was 1.8%.
Figure 58. Product distribution obtained with methanol synthesis catalyst (MSC)
(space time of 0.48 s.gr/cc, catalyst amount: 0.2 gr, Mixture-1 feed stream: 50% CO
+ 50% H2)
Comparison of methanol selectivities obtained with MRC and MSC is given in
Figure 59. Methanol selectivity of MSC was higher than MRC. At 275 °C, methanol
selectivity of methanol synthesis catalyst was 91.4% whereas methanol selectivity
was 79.5% for methanol reforming catalyst.
0
0.1
0.2
0.3
0.4
0.5
0.6
0.7
0.8
0.9
1
200 225 250 275 300
Sel
ecti
vit
y
Temperature , ºC
MEOH DME CO2
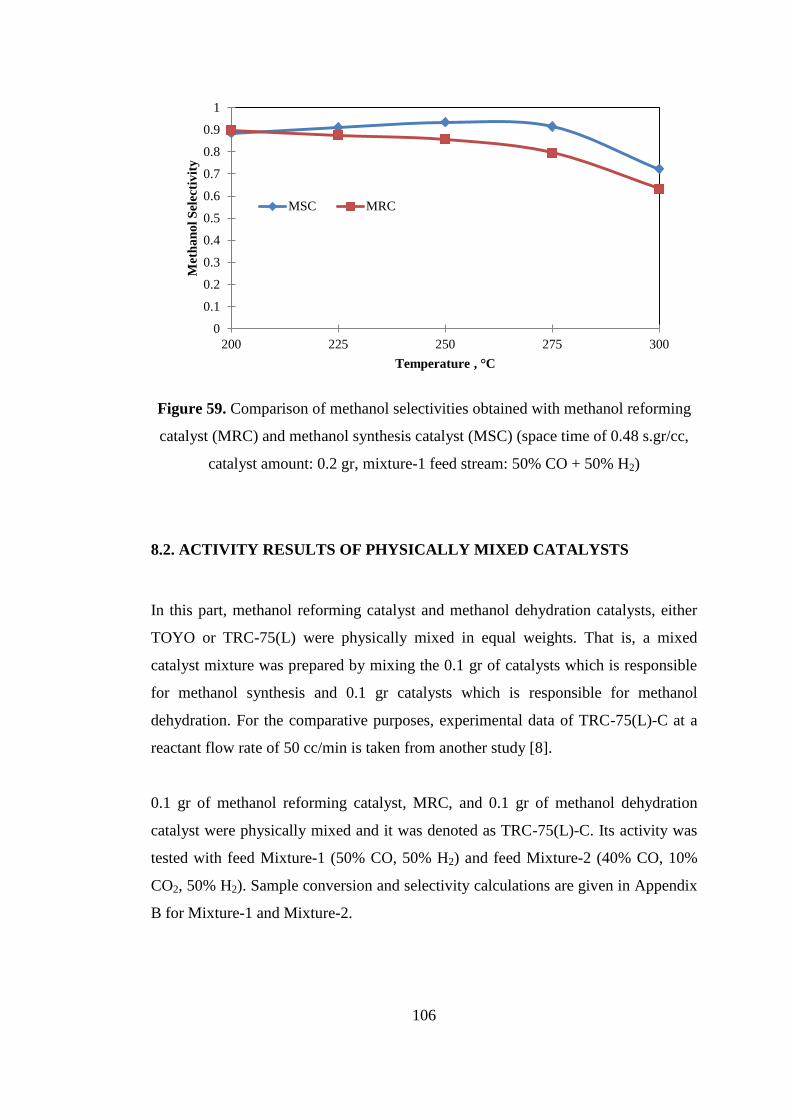
106
Figure 59. Comparison of methanol selectivities obtained with methanol reforming
catalyst (MRC) and methanol synthesis catalyst (MSC) (space time of 0.48 s.gr/cc,
catalyst amount: 0.2 gr, mixture-1 feed stream: 50% CO + 50% H2)
8.2. ACTIVITY RESULTS OF PHYSICALLY MIXED CATALYSTS
In this part, methanol reforming catalyst and methanol dehydration catalysts, either
TOYO or TRC-75(L) were physically mixed in equal weights. That is, a mixed
catalyst mixture was prepared by mixing the 0.1 gr of catalysts which is responsible
for methanol synthesis and 0.1 gr catalysts which is responsible for methanol
dehydration. For the comparative purposes, experimental data of TRC-75(L)-C at a
reactant flow rate of 50 cc/min is taken from another study [8].
0.1 gr of methanol reforming catalyst, MRC, and 0.1 gr of methanol dehydration
catalyst were physically mixed and it was denoted as TRC-75(L)-C. Its activity was
tested with feed Mixture-1 (50% CO, 50% H2) and feed Mixture-2 (40% CO, 10%
CO2, 50% H2). Sample conversion and selectivity calculations are given in Appendix
B for Mixture-1 and Mixture-2.
0
0.1
0.2
0.3
0.4
0.5
0.6
0.7
0.8
0.9
1
200 225 250 275 300
Met
ha
no
l S
elec
tiv
ity
Temperature , °C
MSC MRC
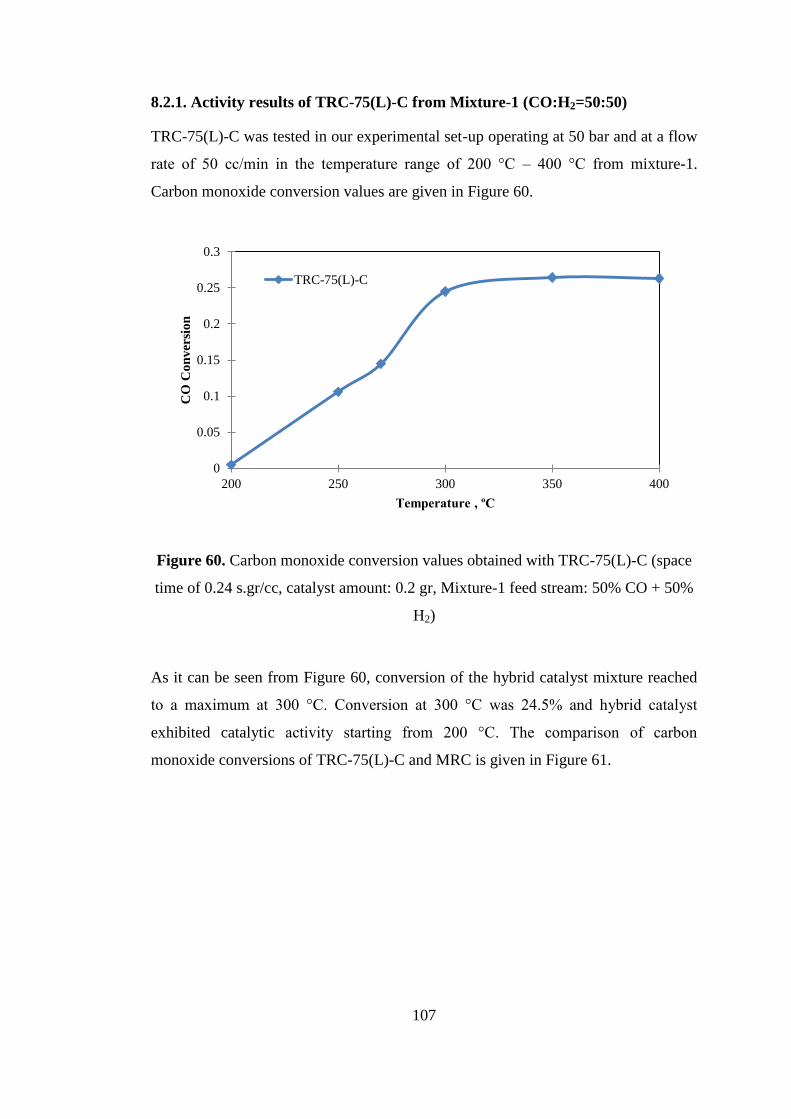
107
8.2.1. Activity results of TRC-75(L)-C from Mixture-1 (CO:H2=50:50)
TRC-75(L)-C was tested in our experimental set-up operating at 50 bar and at a flow
rate of 50 cc/min in the temperature range of 200 °C – 400 °C from mixture-1.
Carbon monoxide conversion values are given in Figure 60.
Figure 60. Carbon monoxide conversion values obtained with TRC-75(L)-C (space
time of 0.24 s.gr/cc, catalyst amount: 0.2 gr, Mixture-1 feed stream: 50% CO + 50%
H2)
As it can be seen from Figure 60, conversion of the hybrid catalyst mixture reached
to a maximum at 300 °C. Conversion at 300 °C was 24.5% and hybrid catalyst
exhibited catalytic activity starting from 200 °C. The comparison of carbon
monoxide conversions of TRC-75(L)-C and MRC is given in Figure 61.
0
0.05
0.1
0.15
0.2
0.25
0.3
200 250 300 350 400
CO
Co
nv
ersi
on
Temperature , ºC
TRC-75(L)-C
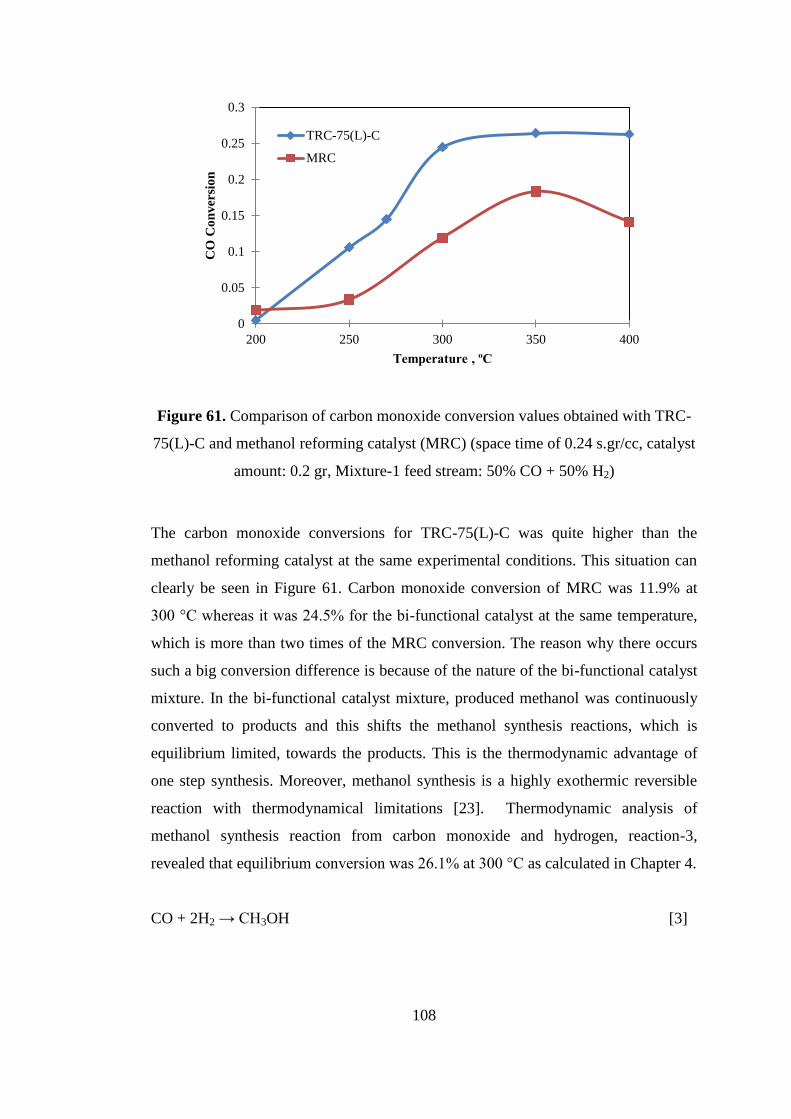
108
Figure 61. Comparison of carbon monoxide conversion values obtained with TRC-
75(L)-C and methanol reforming catalyst (MRC) (space time of 0.24 s.gr/cc, catalyst
amount: 0.2 gr, Mixture-1 feed stream: 50% CO + 50% H2)
The carbon monoxide conversions for TRC-75(L)-C was quite higher than the
methanol reforming catalyst at the same experimental conditions. This situation can
clearly be seen in Figure 61. Carbon monoxide conversion of MRC was 11.9% at
300 °C whereas it was 24.5% for the bi-functional catalyst at the same temperature,
which is more than two times of the MRC conversion. The reason why there occurs
such a big conversion difference is because of the nature of the bi-functional catalyst
mixture. In the bi-functional catalyst mixture, produced methanol was continuously
converted to products and this shifts the methanol synthesis reactions, which is
equilibrium limited, towards the products. This is the thermodynamic advantage of
one step synthesis. Moreover, methanol synthesis is a highly exothermic reversible
reaction with thermodynamical limitations [23]. Thermodynamic analysis of
methanol synthesis reaction from carbon monoxide and hydrogen, reaction-3,
revealed that equilibrium conversion was 26.1% at 300 °C as calculated in Chapter 4.
CO + 2H2 → CH3OH [3]
0
0.05
0.1
0.15
0.2
0.25
0.3
200 250 300 350 400
CO
Co
nv
ersi
on
Temperature , ºC
TRC-75(L)-C
MRC
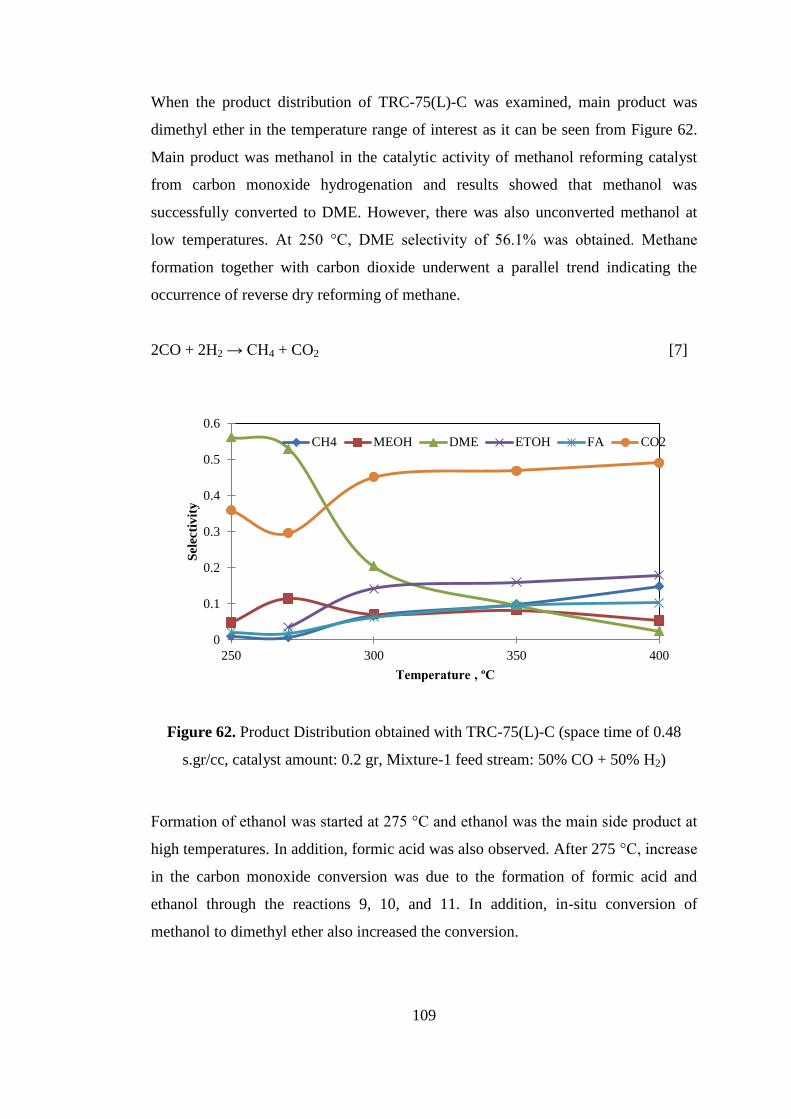
109
When the product distribution of TRC-75(L)-C was examined, main product was
dimethyl ether in the temperature range of interest as it can be seen from Figure 62.
Main product was methanol in the catalytic activity of methanol reforming catalyst
from carbon monoxide hydrogenation and results showed that methanol was
successfully converted to DME. However, there was also unconverted methanol at
low temperatures. At 250 °C, DME selectivity of 56.1% was obtained. Methane
formation together with carbon dioxide underwent a parallel trend indicating the
occurrence of reverse dry reforming of methane.
2CO + 2H2 → CH4 + CO2 [7]
Figure 62. Product Distribution obtained with TRC-75(L)-C (space time of 0.48
s.gr/cc, catalyst amount: 0.2 gr, Mixture-1 feed stream: 50% CO + 50% H2)
Formation of ethanol was started at 275 °C and ethanol was the main side product at
high temperatures. In addition, formic acid was also observed. After 275 °C, increase
in the carbon monoxide conversion was due to the formation of formic acid and
ethanol through the reactions 9, 10, and 11. In addition, in-situ conversion of
methanol to dimethyl ether also increased the conversion.
0
0.1
0.2
0.3
0.4
0.5
0.6
250 300 350 400
Sel
ecti
vit
y
Temperature , ºC
CH4 MEOH DME ETOH FA CO2
110
2CO + 4H2 → C2H5OH + H2O [9]
3CO + 3H2 → C2H5OH + CO2 [10]
CO + H2O → CH2O2 [11]
Carbon dioxide was the major side product at 250°C. Beside reverse methane dry
reforming reaction, direct dimethyl ether synthesis reaction, reaction-1, was majorly
responsible for the production of carbon dioxide. For each one mole of DME
produced, one mole of carbon dioxide should also form. In reaction 1, selectivity
ratio of DME to CO2 is equal to two since the former contains two carbon atoms
whereas the latter contains one. DME selectivity of TRC-75(L)-C catalyst at 250 °C
0.56 and CO2 selectivity at the same temperature is 0.36, respectively. Selectivity
ratio of DME to CO2 is 1.6 and quite consistent with the expected results from
reaction-1. Formation of CO2 with methane reverse dry reforming decreased the
selectivity ratio. All these results indicated that DME formation was essentially due
to methanol synthesis from CO (reaction-3) and dehydration of methanol to DME
(reaction-4).
3 CO + 3 H2 → DME + CO2 [1]
CO + 2H2 → CH3OH [3]
2CH3OH → DME + H2O [4]
Formation of water was occurred by reaction-4 and water reacted with carbon
monoxide through water gas shift reaction. CO2 was also produced by water gas shift
reaction.
CO + H2O → CO2 + H2 [5]
Comparison of DME selectivities of MRC and TRC-75(L)-C for the Mixture-1 is
given in Figure 63. For the MRC, DME was produced with low selectivity which
was being equal to 12.2% at 250°C. When the bi-functional catalyst TRC-75(L)-C
was used, DME selectivity increased to 56.2%. Increase in DME selectivity for bi-
functional catalyst can be attributed to the Brønsted acid sites of bi-functional
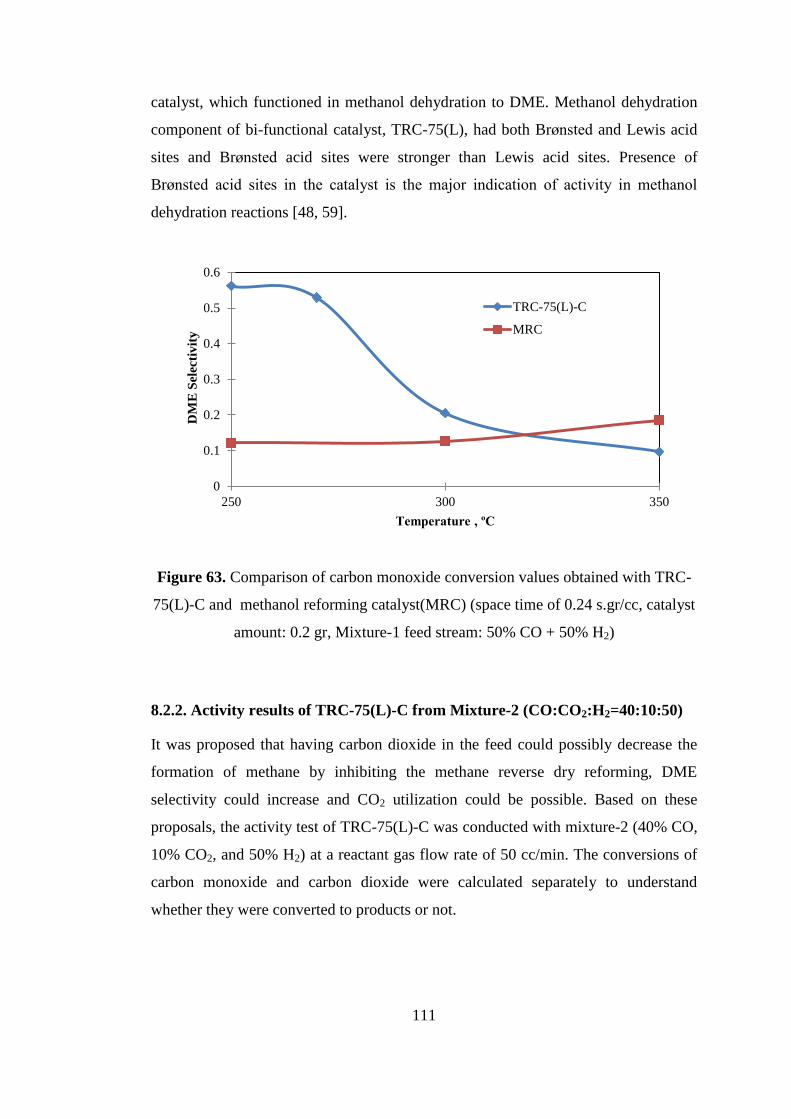
111
catalyst, which functioned in methanol dehydration to DME. Methanol dehydration
component of bi-functional catalyst, TRC-75(L), had both Brønsted and Lewis acid
sites and Brønsted acid sites were stronger than Lewis acid sites. Presence of
Brønsted acid sites in the catalyst is the major indication of activity in methanol
dehydration reactions [48, 59].
Figure 63. Comparison of carbon monoxide conversion values obtained with TRC-
75(L)-C and methanol reforming catalyst(MRC) (space time of 0.24 s.gr/cc, catalyst
amount: 0.2 gr, Mixture-1 feed stream: 50% CO + 50% H2)
8.2.2. Activity results of TRC-75(L)-C from Mixture-2 (CO:CO2:H2=40:10:50)
It was proposed that having carbon dioxide in the feed could possibly decrease the
formation of methane by inhibiting the methane reverse dry reforming, DME
selectivity could increase and CO2 utilization could be possible. Based on these
proposals, the activity test of TRC-75(L)-C was conducted with mixture-2 (40% CO,
10% CO2, and 50% H2) at a reactant gas flow rate of 50 cc/min. The conversions of
carbon monoxide and carbon dioxide were calculated separately to understand
whether they were converted to products or not.
0
0.1
0.2
0.3
0.4
0.5
0.6
250 300 350
DM
E S
elec
tiv
ity
Temperature , ºC
TRC-75(L)-C
MRC
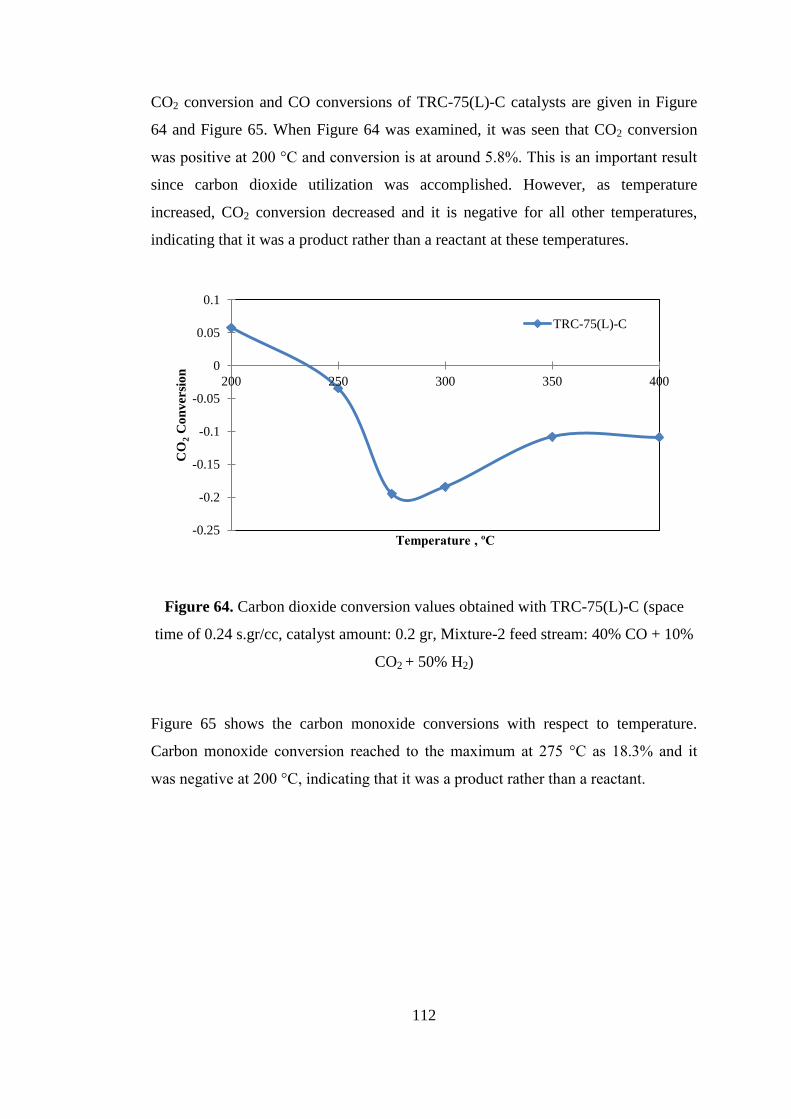
112
CO2 conversion and CO conversions of TRC-75(L)-C catalysts are given in Figure
64 and Figure 65. When Figure 64 was examined, it was seen that CO2 conversion
was positive at 200 °C and conversion is at around 5.8%. This is an important result
since carbon dioxide utilization was accomplished. However, as temperature
increased, CO2 conversion decreased and it is negative for all other temperatures,
indicating that it was a product rather than a reactant at these temperatures.
Figure 64. Carbon dioxide conversion values obtained with TRC-75(L)-C (space
time of 0.24 s.gr/cc, catalyst amount: 0.2 gr, Mixture-2 feed stream: 40% CO + 10%
CO2 + 50% H2)
Figure 65 shows the carbon monoxide conversions with respect to temperature.
Carbon monoxide conversion reached to the maximum at 275 °C as 18.3% and it
was negative at 200 °C, indicating that it was a product rather than a reactant.
-0.25
-0.2
-0.15
-0.1
-0.05
0
0.05
0.1
200 250 300 350 400
CO
2 C
on
ver
sio
n
Temperature , ºC
TRC-75(L)-C
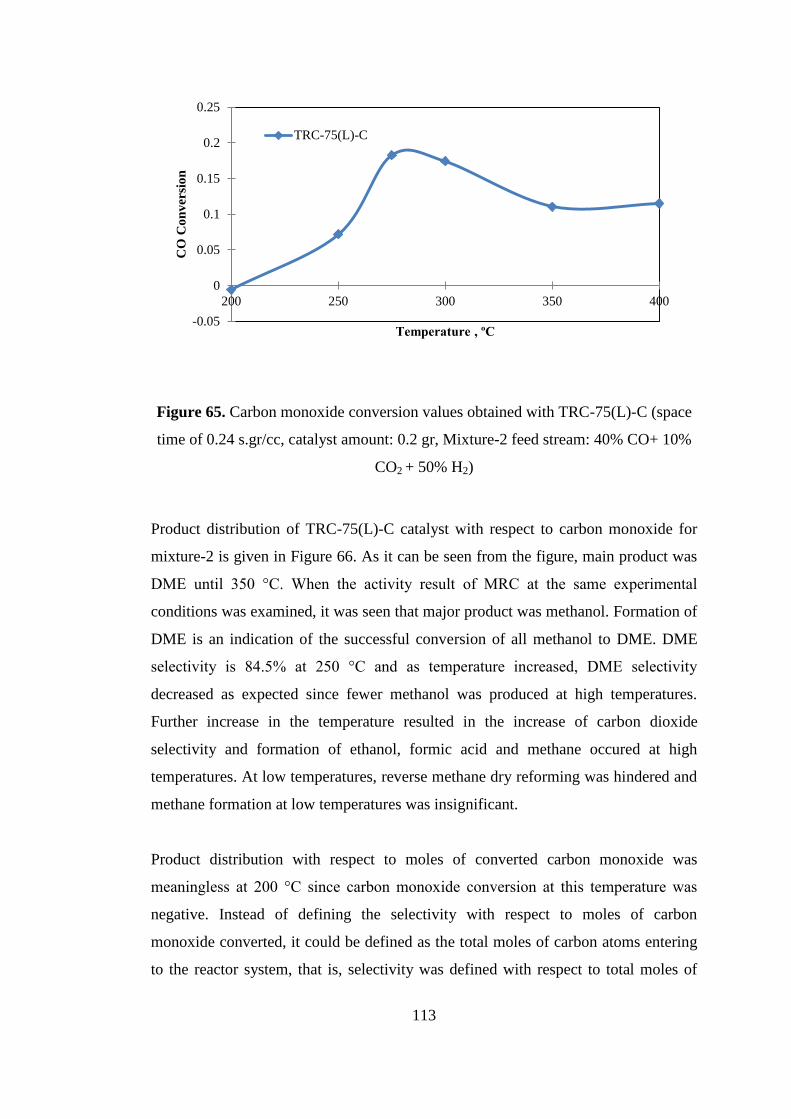
113
Figure 65. Carbon monoxide conversion values obtained with TRC-75(L)-C (space
time of 0.24 s.gr/cc, catalyst amount: 0.2 gr, Mixture-2 feed stream: 40% CO+ 10%
CO2 + 50% H2)
Product distribution of TRC-75(L)-C catalyst with respect to carbon monoxide for
mixture-2 is given in Figure 66. As it can be seen from the figure, main product was
DME until 350 °C. When the activity result of MRC at the same experimental
conditions was examined, it was seen that major product was methanol. Formation of
DME is an indication of the successful conversion of all methanol to DME. DME
selectivity is 84.5% at 250 °C and as temperature increased, DME selectivity
decreased as expected since fewer methanol was produced at high temperatures.
Further increase in the temperature resulted in the increase of carbon dioxide
selectivity and formation of ethanol, formic acid and methane occured at high
temperatures. At low temperatures, reverse methane dry reforming was hindered and
methane formation at low temperatures was insignificant.
Product distribution with respect to moles of converted carbon monoxide was
meaningless at 200 °C since carbon monoxide conversion at this temperature was
negative. Instead of defining the selectivity with respect to moles of carbon
monoxide converted, it could be defined as the total moles of carbon atoms entering
to the reactor system, that is, selectivity was defined with respect to total moles of
-0.05
0
0.05
0.1
0.15
0.2
0.25
200 250 300 350 400
CO
Co
nv
ersi
on
Temperature , ºC
TRC-75(L)-C
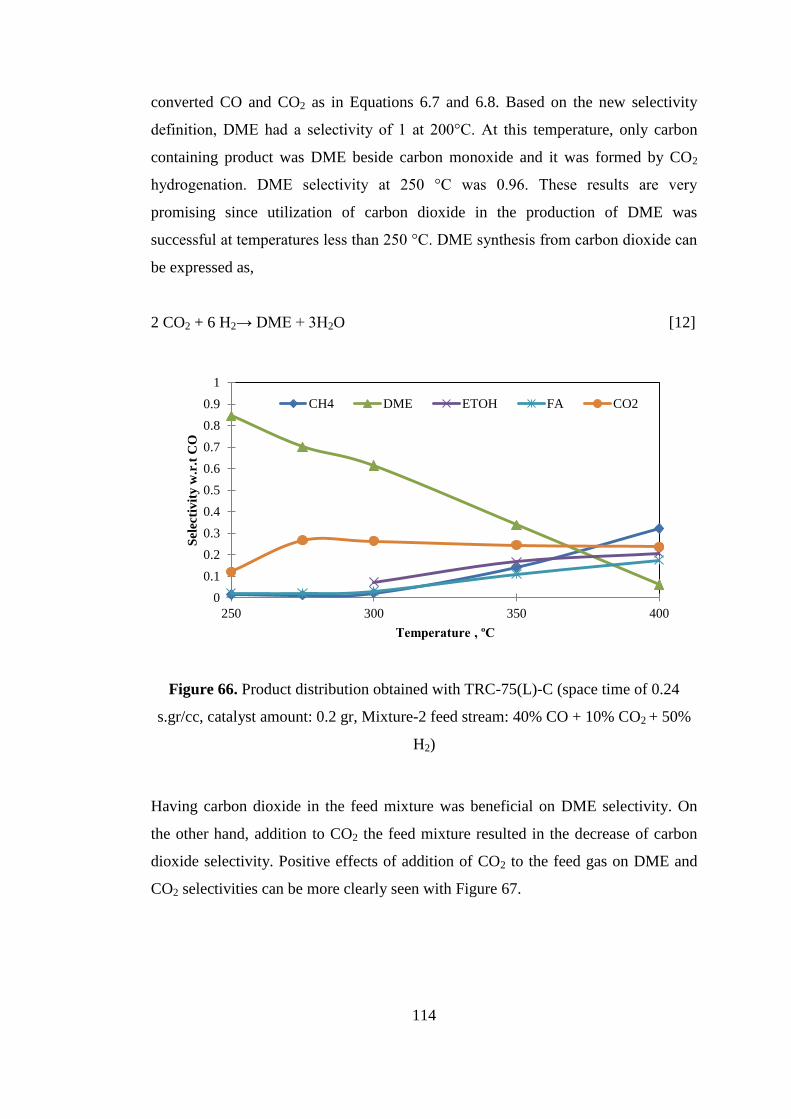
114
converted CO and CO2 as in Equations 6.7 and 6.8. Based on the new selectivity
definition, DME had a selectivity of 1 at 200°C. At this temperature, only carbon
containing product was DME beside carbon monoxide and it was formed by CO2
hydrogenation. DME selectivity at 250 °C was 0.96. These results are very
promising since utilization of carbon dioxide in the production of DME was
successful at temperatures less than 250 °C. DME synthesis from carbon dioxide can
be expressed as,
2 CO2 + 6 H2→ DME + 3H2O [12]
Figure 66. Product distribution obtained with TRC-75(L)-C (space time of 0.24
s.gr/cc, catalyst amount: 0.2 gr, Mixture-2 feed stream: 40% CO + 10% CO2 + 50%
H2)
Having carbon dioxide in the feed mixture was beneficial on DME selectivity. On
the other hand, addition to CO2 the feed mixture resulted in the decrease of carbon
dioxide selectivity. Positive effects of addition of CO2 to the feed gas on DME and
CO2 selectivities can be more clearly seen with Figure 67.
0
0.1
0.2
0.3
0.4
0.5
0.6
0.7
0.8
0.9
1
250 300 350 400
Sel
ecti
vit
y w
.r.t
CO
Temperature , ºC
CH4 DME ETOH FA CO2
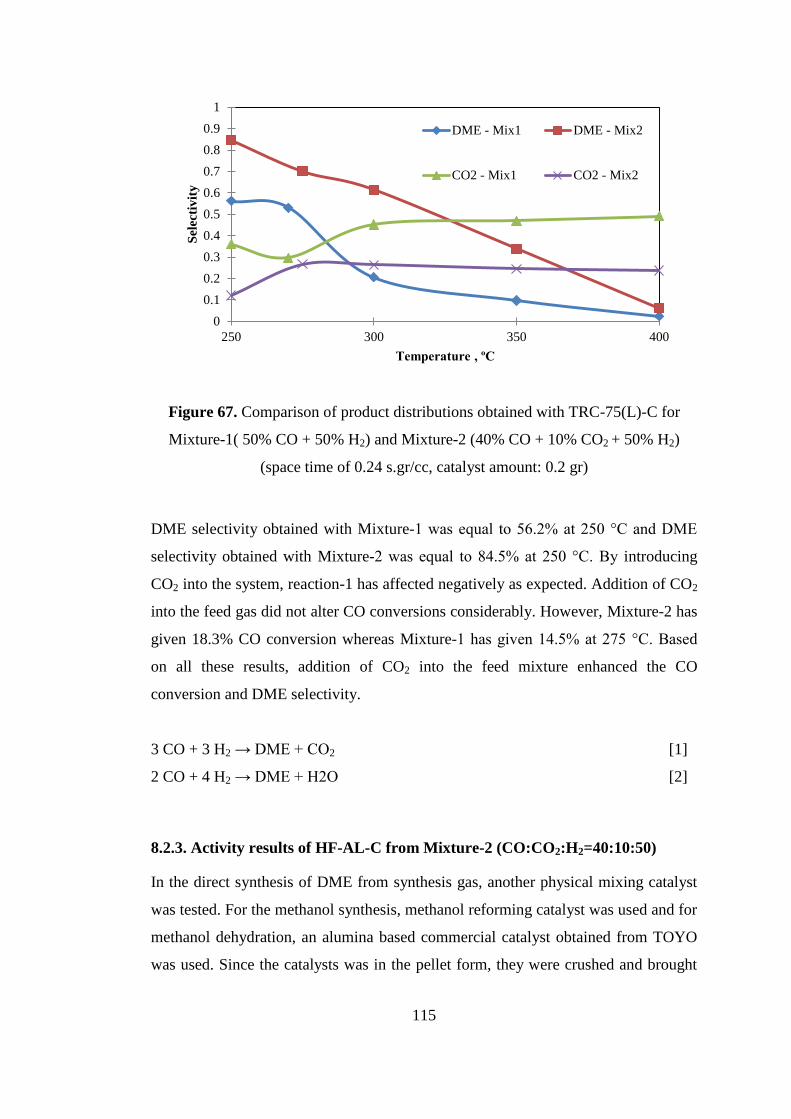
115
Figure 67. Comparison of product distributions obtained with TRC-75(L)-C for
Mixture-1( 50% CO + 50% H2) and Mixture-2 (40% CO + 10% CO2 + 50% H2)
(space time of 0.24 s.gr/cc, catalyst amount: 0.2 gr)
DME selectivity obtained with Mixture-1 was equal to 56.2% at 250 °C and DME
selectivity obtained with Mixture-2 was equal to 84.5% at 250 °C. By introducing
CO2 into the system, reaction-1 has affected negatively as expected. Addition of CO2
into the feed gas did not alter CO conversions considerably. However, Mixture-2 has
given 18.3% CO conversion whereas Mixture-1 has given 14.5% at 275 °C. Based
on all these results, addition of CO2 into the feed mixture enhanced the CO
conversion and DME selectivity.
3 CO + 3 H2 → DME + CO2 [1]
2 CO + 4 H2 → DME + H2O [2]
8.2.3. Activity results of HF-AL-C from Mixture-2 (CO:CO2:H2=40:10:50)
In the direct synthesis of DME from synthesis gas, another physical mixing catalyst
was tested. For the methanol synthesis, methanol reforming catalyst was used and for
methanol dehydration, an alumina based commercial catalyst obtained from TOYO
was used. Since the catalysts was in the pellet form, they were crushed and brought
0
0.1
0.2
0.3
0.4
0.5
0.6
0.7
0.8
0.9
1
250 300 350 400
Sel
ecti
vit
y
Temperature , ºC
DME - Mix1 DME - Mix2
CO2 - Mix1 CO2 - Mix2
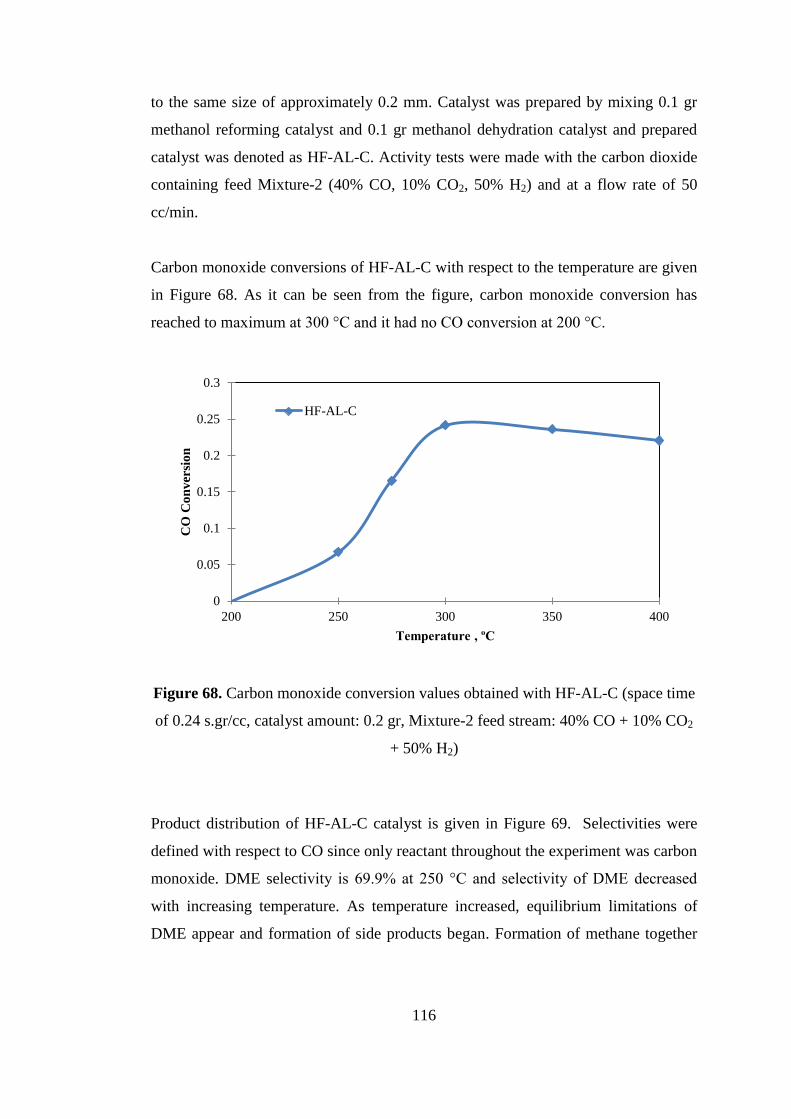
116
to the same size of approximately 0.2 mm. Catalyst was prepared by mixing 0.1 gr
methanol reforming catalyst and 0.1 gr methanol dehydration catalyst and prepared
catalyst was denoted as HF-AL-C. Activity tests were made with the carbon dioxide
containing feed Mixture-2 (40% CO, 10% CO2, 50% H2) and at a flow rate of 50
cc/min.
Carbon monoxide conversions of HF-AL-C with respect to the temperature are given
in Figure 68. As it can be seen from the figure, carbon monoxide conversion has
reached to maximum at 300 °C and it had no CO conversion at 200 °C.
Figure 68. Carbon monoxide conversion values obtained with HF-AL-C (space time
of 0.24 s.gr/cc, catalyst amount: 0.2 gr, Mixture-2 feed stream: 40% CO + 10% CO2
+ 50% H2)
Product distribution of HF-AL-C catalyst is given in Figure 69. Selectivities were
defined with respect to CO since only reactant throughout the experiment was carbon
monoxide. DME selectivity is 69.9% at 250 °C and selectivity of DME decreased
with increasing temperature. As temperature increased, equilibrium limitations of
DME appear and formation of side products began. Formation of methane together
0
0.05
0.1
0.15
0.2
0.25
0.3
200 250 300 350 400
CO
Co
nv
ersi
on
Temperature , ºC
HF-AL-C
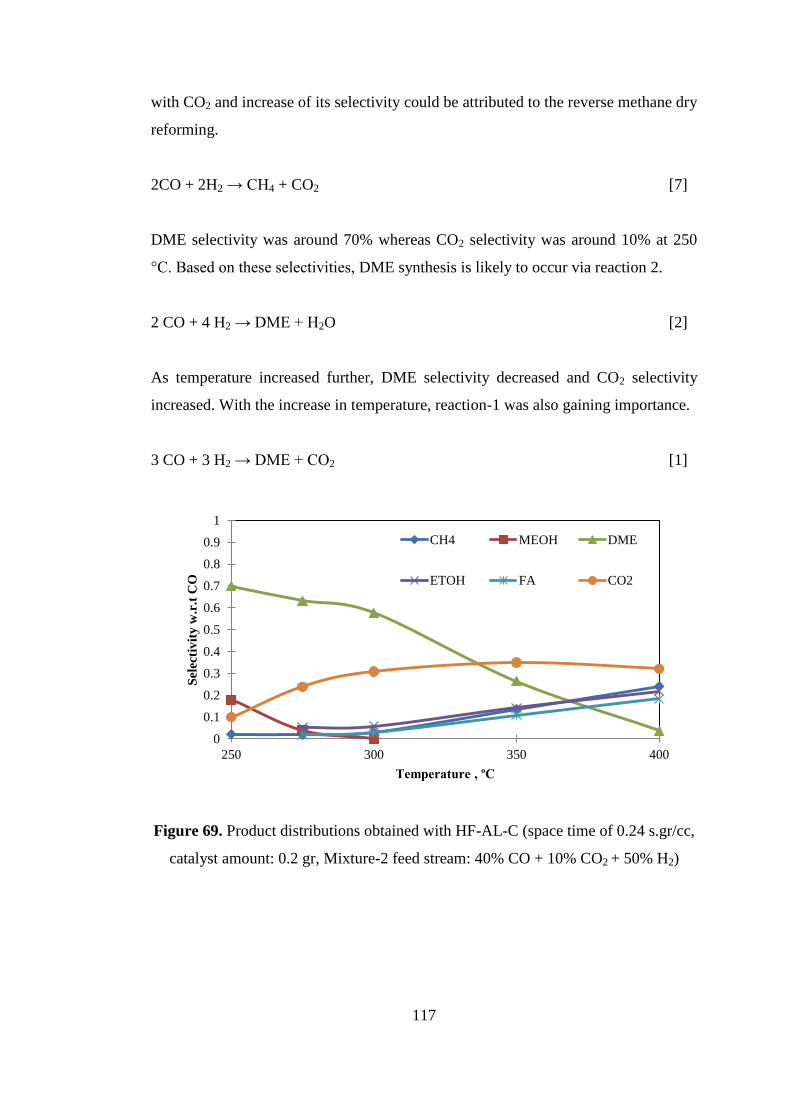
117
with CO2 and increase of its selectivity could be attributed to the reverse methane dry
reforming.
2CO + 2H2 → CH4 + CO2 [7]
DME selectivity was around 70% whereas CO2 selectivity was around 10% at 250
°C. Based on these selectivities, DME synthesis is likely to occur via reaction 2.
2 CO + 4 H2 → DME + H2O [2]
As temperature increased further, DME selectivity decreased and CO2 selectivity
increased. With the increase in temperature, reaction-1 was also gaining importance.
3 CO + 3 H2 → DME + CO2 [1]
Figure 69. Product distributions obtained with HF-AL-C (space time of 0.24 s.gr/cc,
catalyst amount: 0.2 gr, Mixture-2 feed stream: 40% CO + 10% CO2 + 50% H2)
0
0.1
0.2
0.3
0.4
0.5
0.6
0.7
0.8
0.9
1
250 300 350 400
Sel
ecti
vit
y w
.r.t
CO
Temperature , ºC
CH4 MEOH DME
ETOH FA CO2
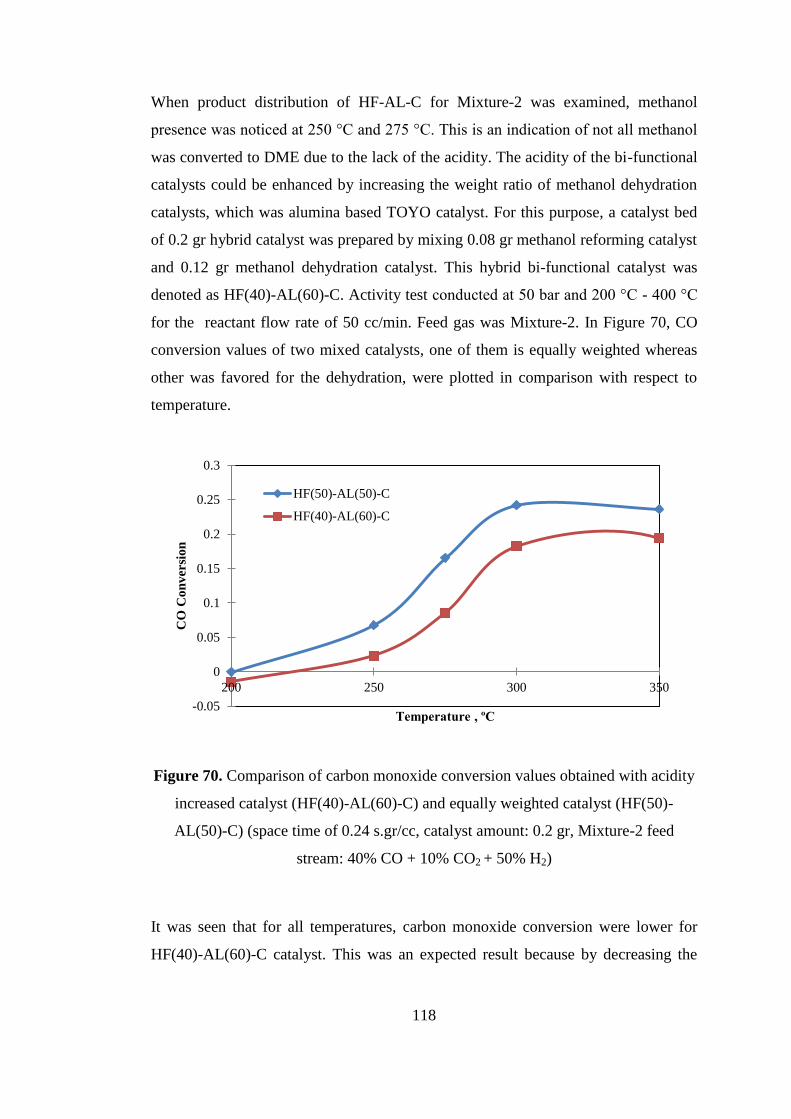
118
When product distribution of HF-AL-C for Mixture-2 was examined, methanol
presence was noticed at 250 °C and 275 °C. This is an indication of not all methanol
was converted to DME due to the lack of the acidity. The acidity of the bi-functional
catalysts could be enhanced by increasing the weight ratio of methanol dehydration
catalysts, which was alumina based TOYO catalyst. For this purpose, a catalyst bed
of 0.2 gr hybrid catalyst was prepared by mixing 0.08 gr methanol reforming catalyst
and 0.12 gr methanol dehydration catalyst. This hybrid bi-functional catalyst was
denoted as HF(40)-AL(60)-C. Activity test conducted at 50 bar and 200 °C - 400 °C
for the reactant flow rate of 50 cc/min. Feed gas was Mixture-2. In Figure 70, CO
conversion values of two mixed catalysts, one of them is equally weighted whereas
other was favored for the dehydration, were plotted in comparison with respect to
temperature.
Figure 70. Comparison of carbon monoxide conversion values obtained with acidity
increased catalyst (HF(40)-AL(60)-C) and equally weighted catalyst (HF(50)-
AL(50)-C) (space time of 0.24 s.gr/cc, catalyst amount: 0.2 gr, Mixture-2 feed
stream: 40% CO + 10% CO2 + 50% H2)
It was seen that for all temperatures, carbon monoxide conversion were lower for
HF(40)-AL(60)-C catalyst. This was an expected result because by decreasing the
-0.05
0
0.05
0.1
0.15
0.2
0.25
0.3
200 250 300 350
CO
Co
nv
ersi
on
Temperature , ºC
HF(50)-AL(50)-C
HF(40)-AL(60)-C
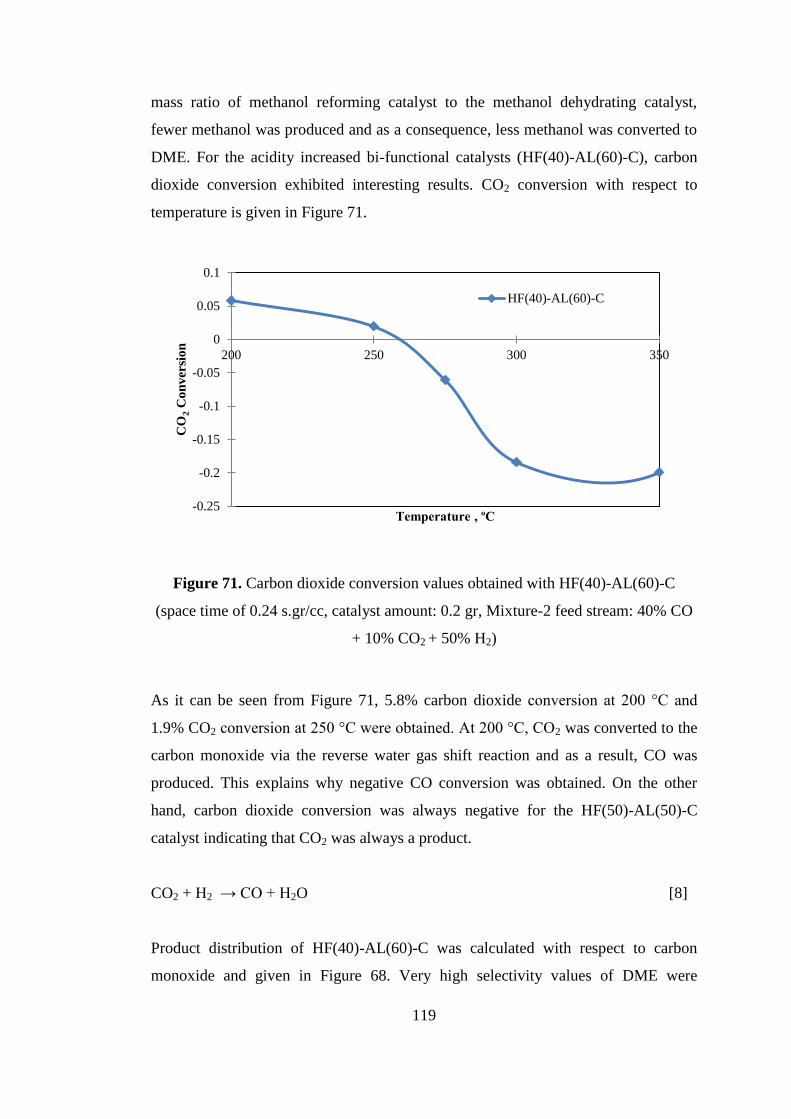
119
mass ratio of methanol reforming catalyst to the methanol dehydrating catalyst,
fewer methanol was produced and as a consequence, less methanol was converted to
DME. For the acidity increased bi-functional catalysts (HF(40)-AL(60)-C), carbon
dioxide conversion exhibited interesting results. CO2 conversion with respect to
temperature is given in Figure 71.
Figure 71. Carbon dioxide conversion values obtained with HF(40)-AL(60)-C
(space time of 0.24 s.gr/cc, catalyst amount: 0.2 gr, Mixture-2 feed stream: 40% CO
+ 10% CO2 + 50% H2)
As it can be seen from Figure 71, 5.8% carbon dioxide conversion at 200 °C and
1.9% CO2 conversion at 250 °C were obtained. At 200 °C, CO2 was converted to the
carbon monoxide via the reverse water gas shift reaction and as a result, CO was
produced. This explains why negative CO conversion was obtained. On the other
hand, carbon dioxide conversion was always negative for the HF(50)-AL(50)-C
catalyst indicating that CO2 was always a product.
CO2 + H2 → CO + H2O [8]
Product distribution of HF(40)-AL(60)-C was calculated with respect to carbon
monoxide and given in Figure 68. Very high selectivity values of DME were
-0.25
-0.2
-0.15
-0.1
-0.05
0
0.05
0.1
200 250 300 350
CO
2 C
on
ver
sio
n
Temperature , ºC
HF(40)-AL(60)-C
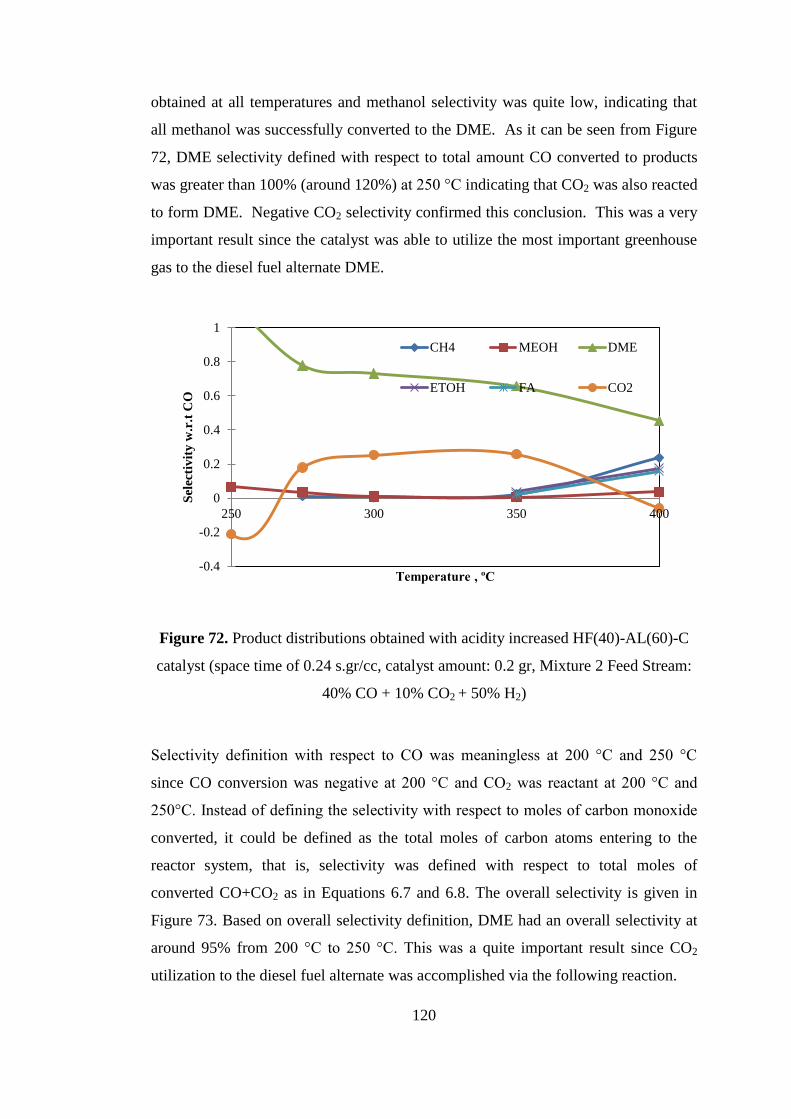
120
obtained at all temperatures and methanol selectivity was quite low, indicating that
all methanol was successfully converted to the DME. As it can be seen from Figure
72, DME selectivity defined with respect to total amount CO converted to products
was greater than 100% (around 120%) at 250 °C indicating that CO2 was also reacted
to form DME. Negative CO2 selectivity confirmed this conclusion. This was a very
important result since the catalyst was able to utilize the most important greenhouse
gas to the diesel fuel alternate DME.
Figure 72. Product distributions obtained with acidity increased HF(40)-AL(60)-C
catalyst (space time of 0.24 s.gr/cc, catalyst amount: 0.2 gr, Mixture 2 Feed Stream:
40% CO + 10% CO2 + 50% H2)
Selectivity definition with respect to CO was meaningless at 200 °C and 250 °C
since CO conversion was negative at 200 °C and CO2 was reactant at 200 °C and
250°C. Instead of defining the selectivity with respect to moles of carbon monoxide
converted, it could be defined as the total moles of carbon atoms entering to the
reactor system, that is, selectivity was defined with respect to total moles of
converted CO+CO2 as in Equations 6.7 and 6.8. The overall selectivity is given in
Figure 73. Based on overall selectivity definition, DME had an overall selectivity at
around 95% from 200 °C to 250 °C. This was a quite important result since CO2
utilization to the diesel fuel alternate was accomplished via the following reaction.
-0.4
-0.2
0
0.2
0.4
0.6
0.8
1
250 300 350 400
Sel
ecti
vit
y w
.r.t
CO
Temperature , ºC
CH4 MEOH DME
ETOH FA CO2
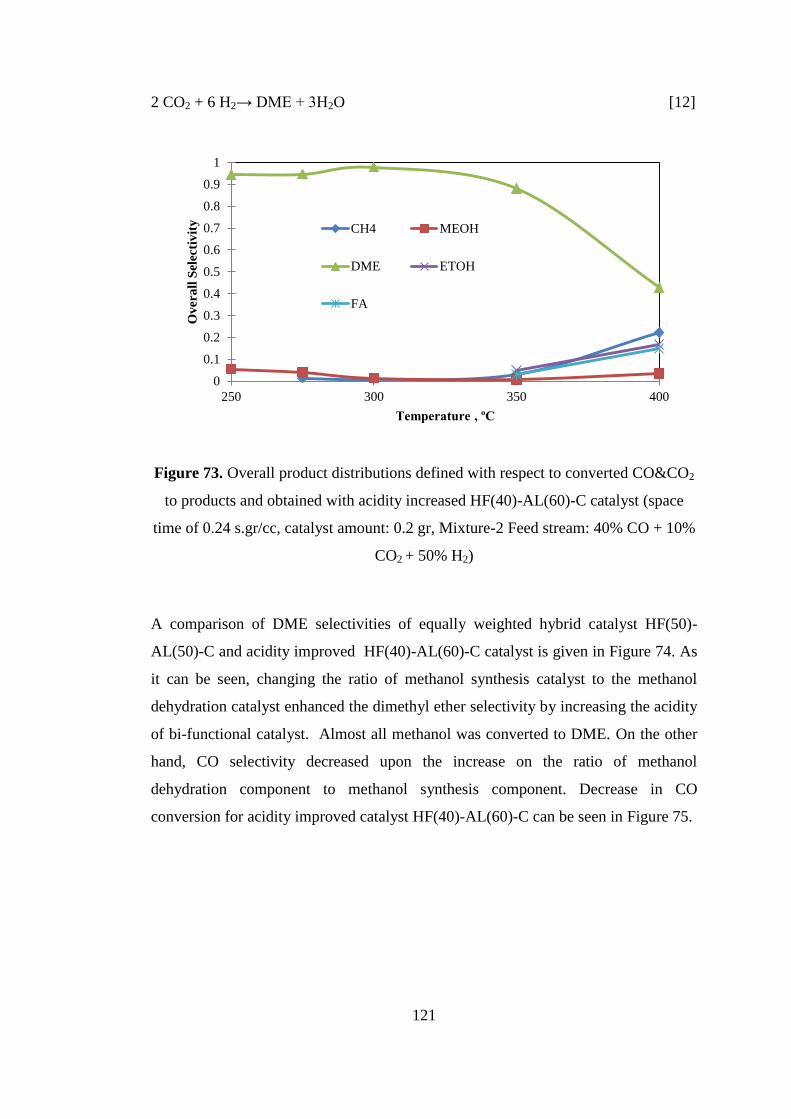
121
2 CO2 + 6 H2→ DME + 3H2O [12]
Figure 73. Overall product distributions defined with respect to converted CO&CO2
to products and obtained with acidity increased HF(40)-AL(60)-C catalyst (space
time of 0.24 s.gr/cc, catalyst amount: 0.2 gr, Mixture-2 Feed stream: 40% CO + 10%
CO2 + 50% H2)
A comparison of DME selectivities of equally weighted hybrid catalyst HF(50)-
AL(50)-C and acidity improved HF(40)-AL(60)-C catalyst is given in Figure 74. As
it can be seen, changing the ratio of methanol synthesis catalyst to the methanol
dehydration catalyst enhanced the dimethyl ether selectivity by increasing the acidity
of bi-functional catalyst. Almost all methanol was converted to DME. On the other
hand, CO selectivity decreased upon the increase on the ratio of methanol
dehydration component to methanol synthesis component. Decrease in CO
conversion for acidity improved catalyst HF(40)-AL(60)-C can be seen in Figure 75.
0
0.1
0.2
0.3
0.4
0.5
0.6
0.7
0.8
0.9
1
250 300 350 400
Ov
era
ll S
elec
tiv
ity
Temperature , ºC
CH4 MEOH
DME ETOH
FA
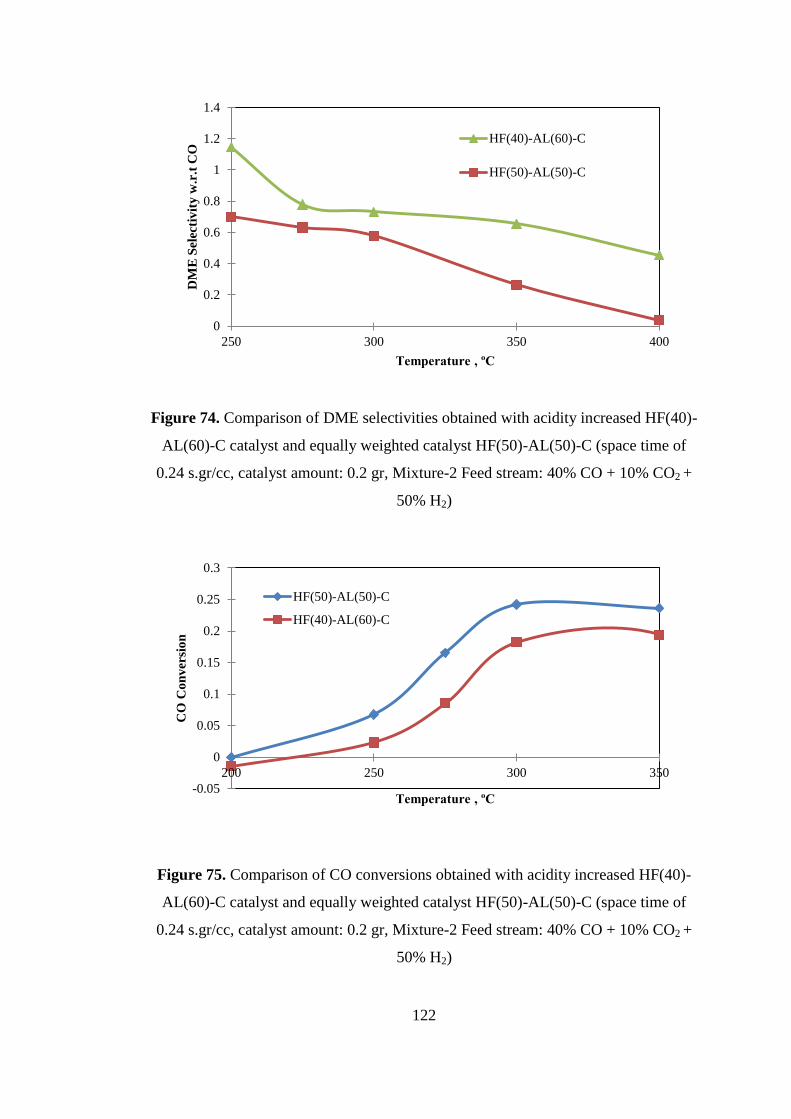
122
Figure 74. Comparison of DME selectivities obtained with acidity increased HF(40)-
AL(60)-C catalyst and equally weighted catalyst HF(50)-AL(50)-C (space time of
0.24 s.gr/cc, catalyst amount: 0.2 gr, Mixture-2 Feed stream: 40% CO + 10% CO2 +
50% H2)
Figure 75. Comparison of CO conversions obtained with acidity increased HF(40)-
AL(60)-C catalyst and equally weighted catalyst HF(50)-AL(50)-C (space time of
0.24 s.gr/cc, catalyst amount: 0.2 gr, Mixture-2 Feed stream: 40% CO + 10% CO2 +
50% H2)
0
0.2
0.4
0.6
0.8
1
1.2
1.4
250 300 350 400
DM
E S
elec
tiv
ity
w.r
.t C
O
Temperature , ºC
HF(40)-AL(60)-C
HF(50)-AL(50)-C
-0.05
0
0.05
0.1
0.15
0.2
0.25
0.3
200 250 300 350
CO
Co
nv
ersi
on
Temperature , ºC
HF(50)-AL(50)-C
HF(40)-AL(60)-C
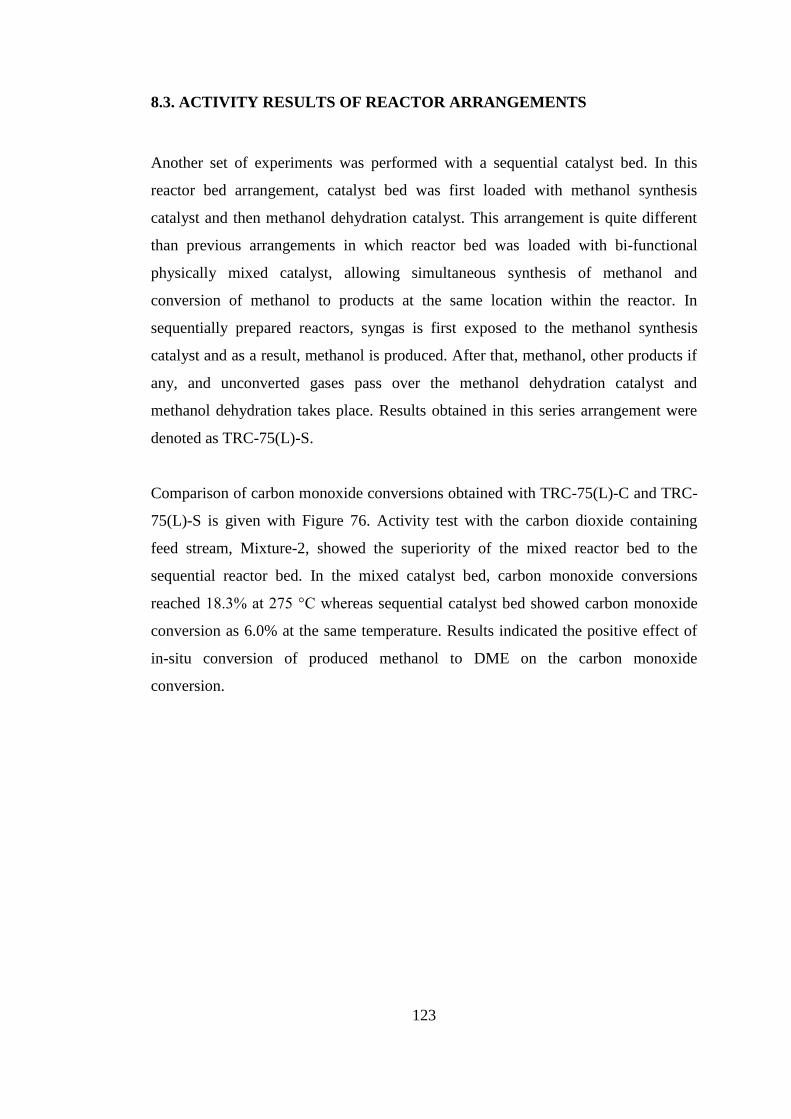
123
8.3. ACTIVITY RESULTS OF REACTOR ARRANGEMENTS
Another set of experiments was performed with a sequential catalyst bed. In this
reactor bed arrangement, catalyst bed was first loaded with methanol synthesis
catalyst and then methanol dehydration catalyst. This arrangement is quite different
than previous arrangements in which reactor bed was loaded with bi-functional
physically mixed catalyst, allowing simultaneous synthesis of methanol and
conversion of methanol to products at the same location within the reactor. In
sequentially prepared reactors, syngas is first exposed to the methanol synthesis
catalyst and as a result, methanol is produced. After that, methanol, other products if
any, and unconverted gases pass over the methanol dehydration catalyst and
methanol dehydration takes place. Results obtained in this series arrangement were
denoted as TRC-75(L)-S.
Comparison of carbon monoxide conversions obtained with TRC-75(L)-C and TRC-
75(L)-S is given with Figure 76. Activity test with the carbon dioxide containing
feed stream, Mixture-2, showed the superiority of the mixed reactor bed to the
sequential reactor bed. In the mixed catalyst bed, carbon monoxide conversions
reached 18.3% at 275 °C whereas sequential catalyst bed showed carbon monoxide
conversion as 6.0% at the same temperature. Results indicated the positive effect of
in-situ conversion of produced methanol to DME on the carbon monoxide
conversion.
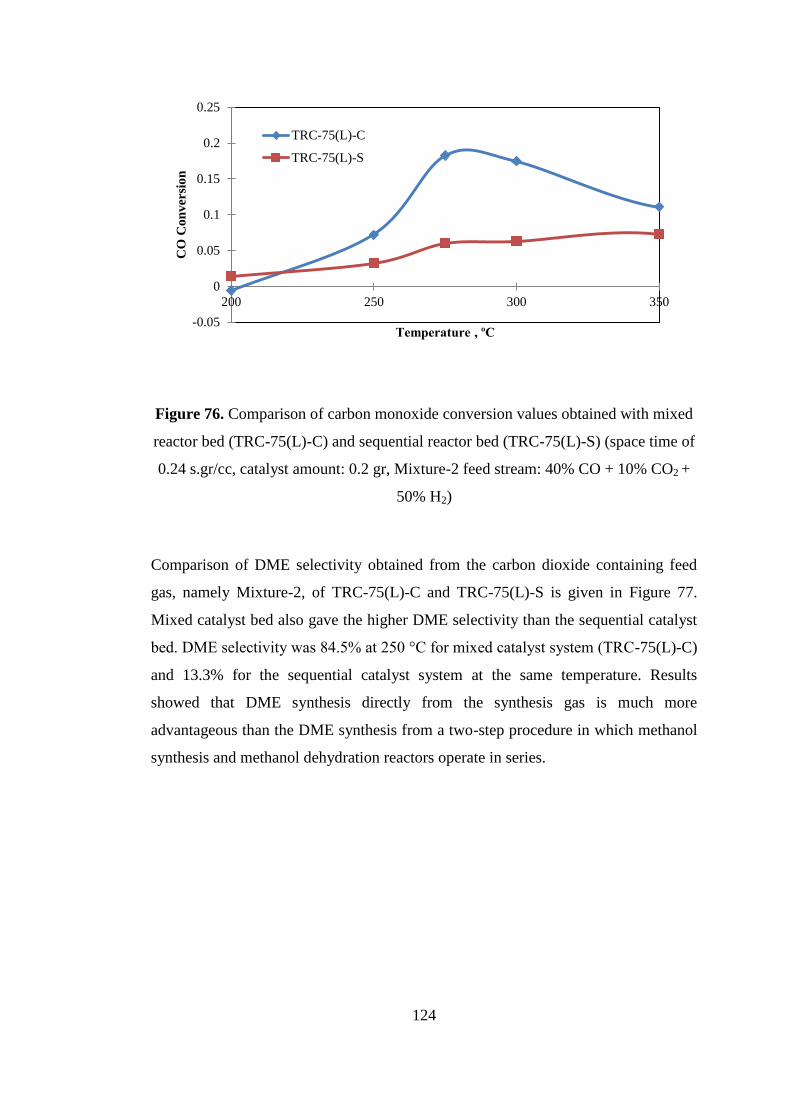
124
Figure 76. Comparison of carbon monoxide conversion values obtained with mixed
reactor bed (TRC-75(L)-C) and sequential reactor bed (TRC-75(L)-S) (space time of
0.24 s.gr/cc, catalyst amount: 0.2 gr, Mixture-2 feed stream: 40% CO + 10% CO2 +
50% H2)
Comparison of DME selectivity obtained from the carbon dioxide containing feed
gas, namely Mixture-2, of TRC-75(L)-C and TRC-75(L)-S is given in Figure 77.
Mixed catalyst bed also gave the higher DME selectivity than the sequential catalyst
bed. DME selectivity was 84.5% at 250 °C for mixed catalyst system (TRC-75(L)-C)
and 13.3% for the sequential catalyst system at the same temperature. Results
showed that DME synthesis directly from the synthesis gas is much more
advantageous than the DME synthesis from a two-step procedure in which methanol
synthesis and methanol dehydration reactors operate in series.
-0.05
0
0.05
0.1
0.15
0.2
0.25
200 250 300 350
CO
Co
nv
ersi
on
Temperature , ºC
TRC-75(L)-C
TRC-75(L)-S
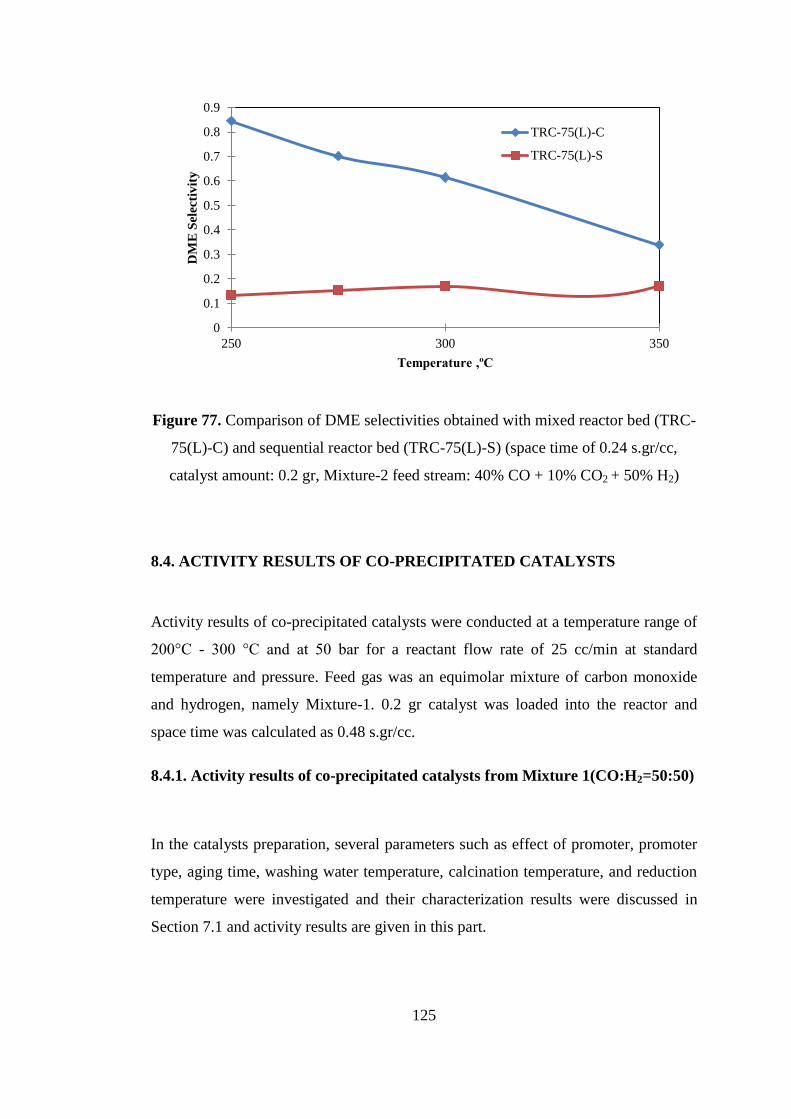
125
Figure 77. Comparison of DME selectivities obtained with mixed reactor bed (TRC-
75(L)-C) and sequential reactor bed (TRC-75(L)-S) (space time of 0.24 s.gr/cc,
catalyst amount: 0.2 gr, Mixture-2 feed stream: 40% CO + 10% CO2 + 50% H2)
8.4. ACTIVITY RESULTS OF CO-PRECIPITATED CATALYSTS
Activity results of co-precipitated catalysts were conducted at a temperature range of
200°C - 300 °C and at 50 bar for a reactant flow rate of 25 cc/min at standard
temperature and pressure. Feed gas was an equimolar mixture of carbon monoxide
and hydrogen, namely Mixture-1. 0.2 gr catalyst was loaded into the reactor and
space time was calculated as 0.48 s.gr/cc.
8.4.1. Activity results of co-precipitated catalysts from Mixture 1(CO:H2=50:50)
In the catalysts preparation, several parameters such as effect of promoter, promoter
type, aging time, washing water temperature, calcination temperature, and reduction
temperature were investigated and their characterization results were discussed in
Section 7.1 and activity results are given in this part.
0
0.1
0.2
0.3
0.4
0.5
0.6
0.7
0.8
0.9
250 300 350
DM
E S
elec
tiv
ity
Temperature ,ºC
TRC-75(L)-C
TRC-75(L)-S
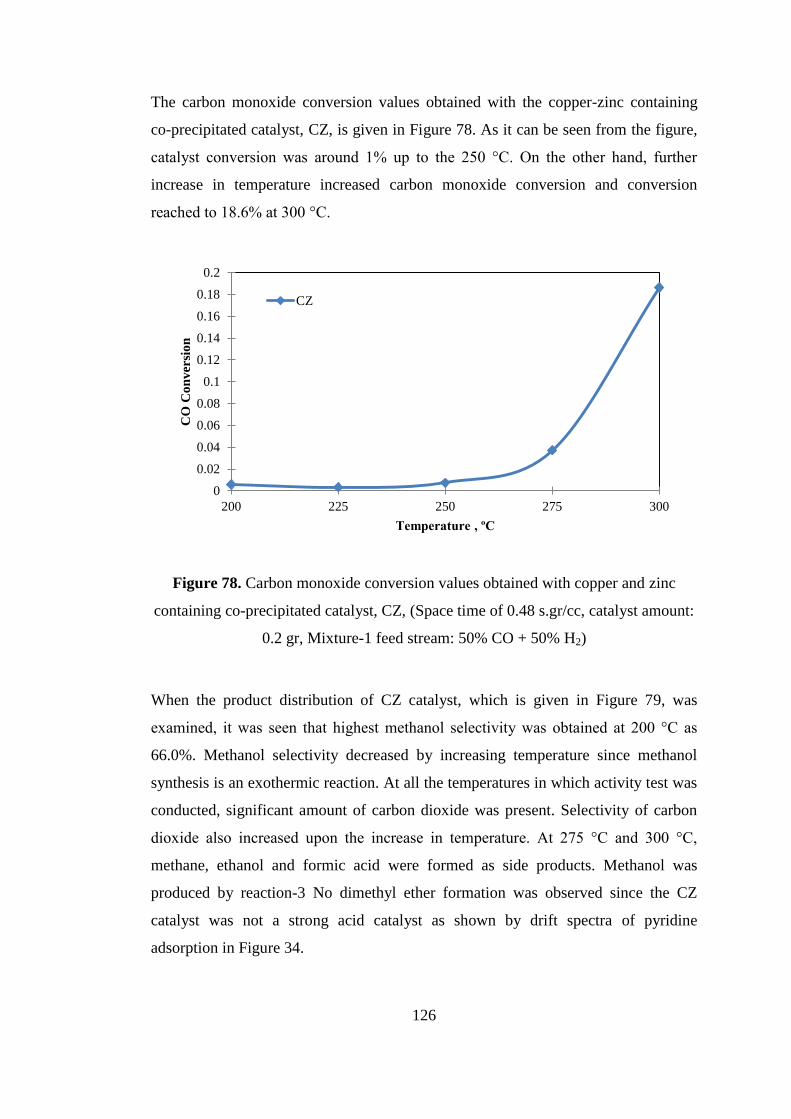
126
The carbon monoxide conversion values obtained with the copper-zinc containing
co-precipitated catalyst, CZ, is given in Figure 78. As it can be seen from the figure,
catalyst conversion was around 1% up to the 250 °C. On the other hand, further
increase in temperature increased carbon monoxide conversion and conversion
reached to 18.6% at 300 °C.
Figure 78. Carbon monoxide conversion values obtained with copper and zinc
containing co-precipitated catalyst, CZ, (Space time of 0.48 s.gr/cc, catalyst amount:
0.2 gr, Mixture-1 feed stream: 50% CO + 50% H2)
When the product distribution of CZ catalyst, which is given in Figure 79, was
examined, it was seen that highest methanol selectivity was obtained at 200 °C as
66.0%. Methanol selectivity decreased by increasing temperature since methanol
synthesis is an exothermic reaction. At all the temperatures in which activity test was
conducted, significant amount of carbon dioxide was present. Selectivity of carbon
dioxide also increased upon the increase in temperature. At 275 °C and 300 °C,
methane, ethanol and formic acid were formed as side products. Methanol was
produced by reaction-3 No dimethyl ether formation was observed since the CZ
catalyst was not a strong acid catalyst as shown by drift spectra of pyridine
adsorption in Figure 34.
0
0.02
0.04
0.06
0.08
0.1
0.12
0.14
0.16
0.18
0.2
200 225 250 275 300
CO
Co
nv
ersi
on
Temperature , ºC
CZ
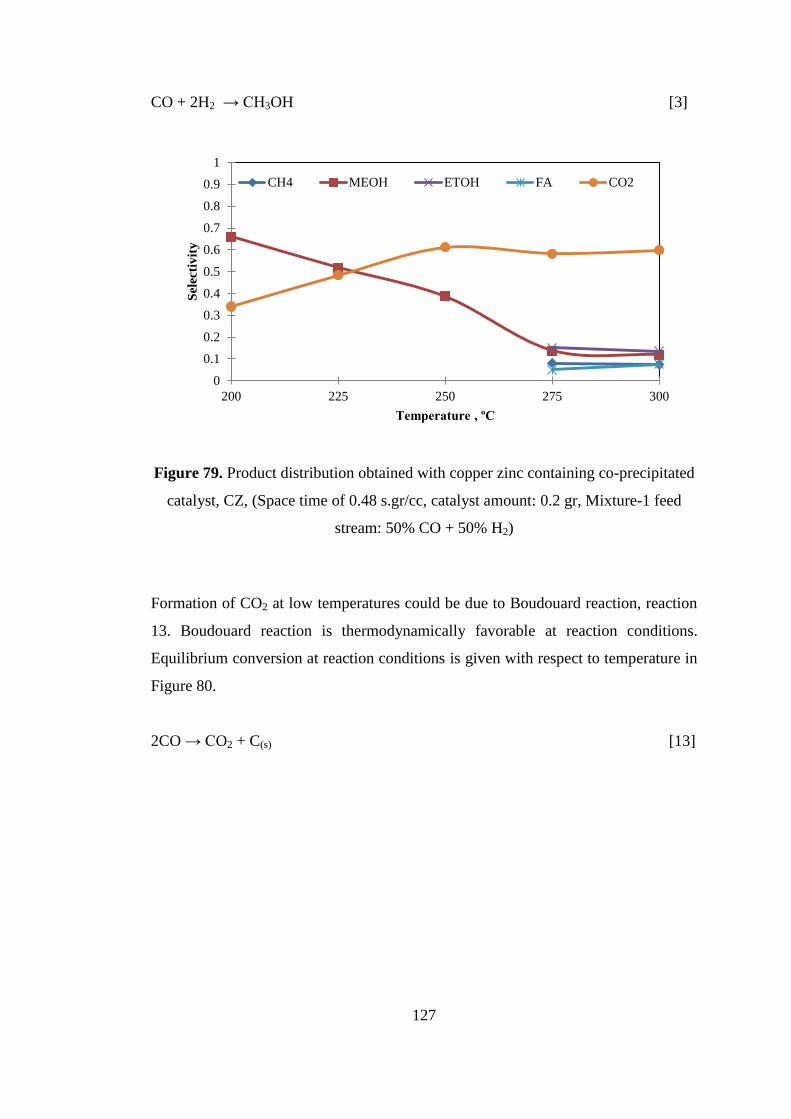
127
CO + 2H2 → CH3OH [3]
Figure 79. Product distribution obtained with copper zinc containing co-precipitated
catalyst, CZ, (Space time of 0.48 s.gr/cc, catalyst amount: 0.2 gr, Mixture-1 feed
stream: 50% CO + 50% H2)
Formation of CO2 at low temperatures could be due to Boudouard reaction, reaction
13. Boudouard reaction is thermodynamically favorable at reaction conditions.
Equilibrium conversion at reaction conditions is given with respect to temperature in
Figure 80.
2CO → CO2 + C(s) [13]
0
0.1
0.2
0.3
0.4
0.5
0.6
0.7
0.8
0.9
1
200 225 250 275 300
Sel
ecti
vit
y
Temperature , ºC
CH4 MEOH ETOH FA CO2
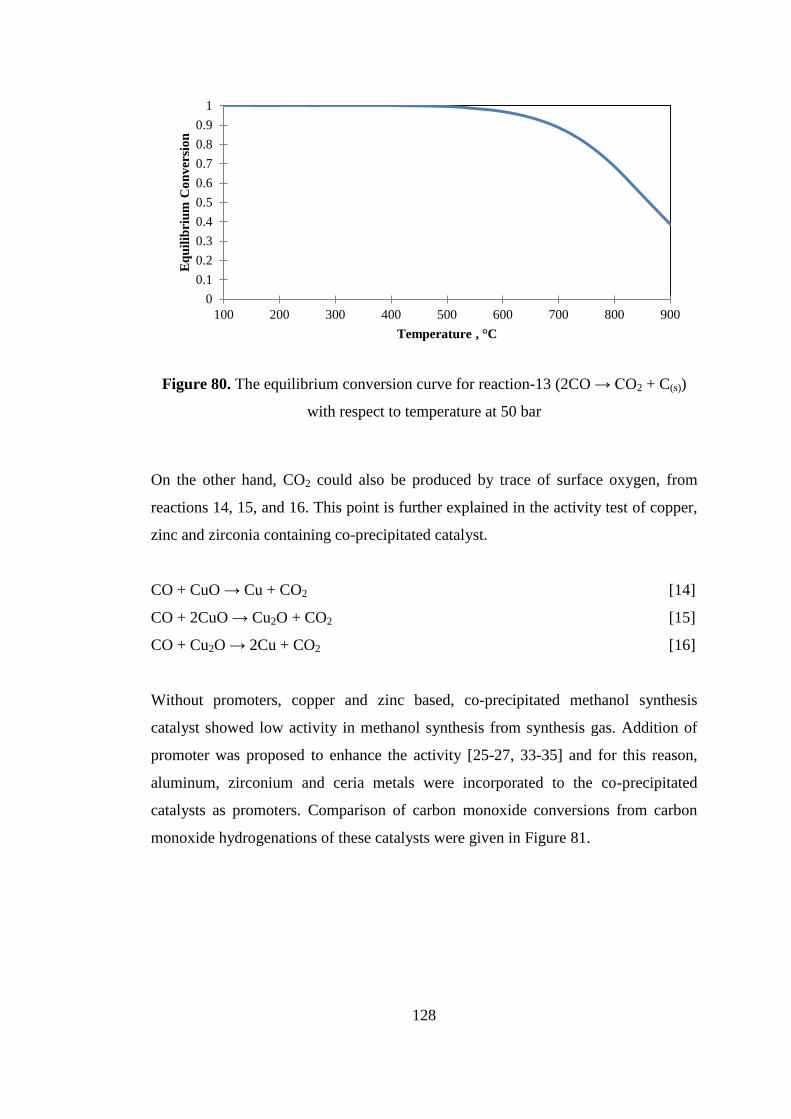
128
Figure 80. The equilibrium conversion curve for reaction-13 (2CO → CO2 + C(s))
with respect to temperature at 50 bar
On the other hand, CO2 could also be produced by trace of surface oxygen, from
reactions 14, 15, and 16. This point is further explained in the activity test of copper,
zinc and zirconia containing co-precipitated catalyst.
CO + CuO → Cu + CO2 [14]
CO + 2CuO → Cu2O + CO2 [15]
CO + Cu2O → 2Cu + CO2 [16]
Without promoters, copper and zinc based, co-precipitated methanol synthesis
catalyst showed low activity in methanol synthesis from synthesis gas. Addition of
promoter was proposed to enhance the activity [25-27, 33-35] and for this reason,
aluminum, zirconium and ceria metals were incorporated to the co-precipitated
catalysts as promoters. Comparison of carbon monoxide conversions from carbon
monoxide hydrogenations of these catalysts were given in Figure 81.
0
0.1
0.2
0.3
0.4
0.5
0.6
0.7
0.8
0.9
1
100 200 300 400 500 600 700 800 900
Eq
uil
ibri
um
Co
nv
ersi
on
Temperature , °C
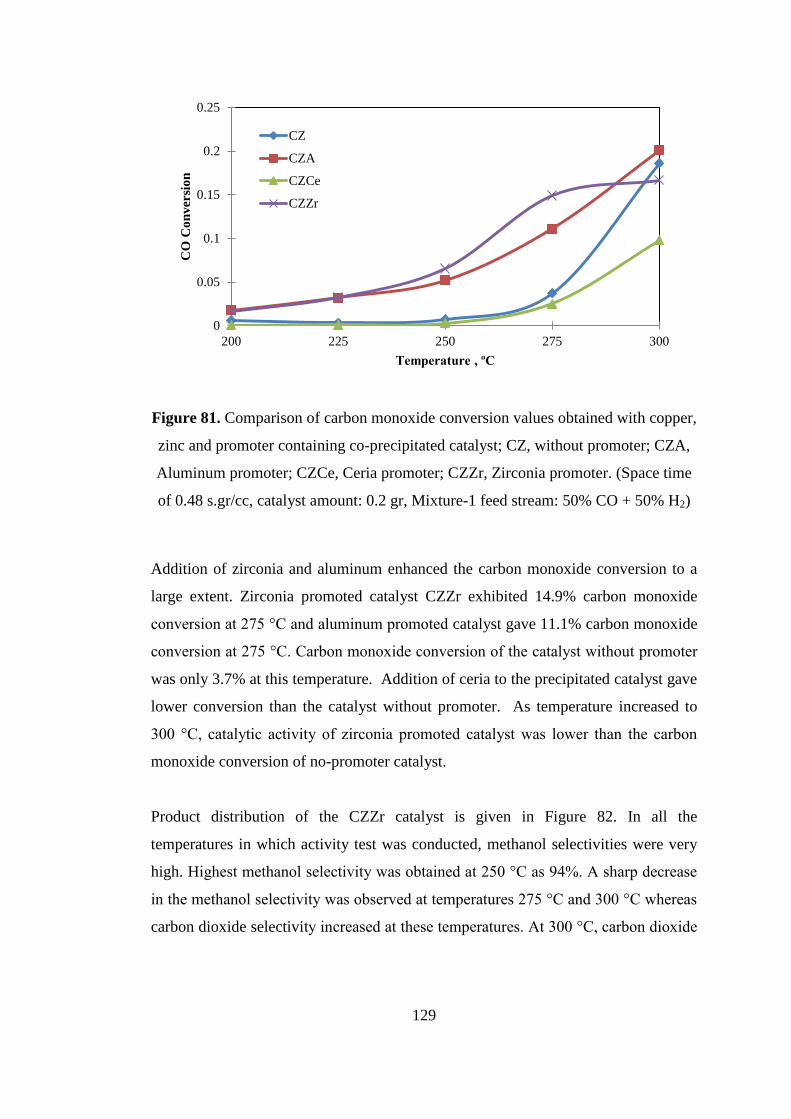
129
Figure 81. Comparison of carbon monoxide conversion values obtained with copper,
zinc and promoter containing co-precipitated catalyst; CZ, without promoter; CZA,
Aluminum promoter; CZCe, Ceria promoter; CZZr, Zirconia promoter. (Space time
of 0.48 s.gr/cc, catalyst amount: 0.2 gr, Mixture-1 feed stream: 50% CO + 50% H2)
Addition of zirconia and aluminum enhanced the carbon monoxide conversion to a
large extent. Zirconia promoted catalyst CZZr exhibited 14.9% carbon monoxide
conversion at 275 °C and aluminum promoted catalyst gave 11.1% carbon monoxide
conversion at 275 °C. Carbon monoxide conversion of the catalyst without promoter
was only 3.7% at this temperature. Addition of ceria to the precipitated catalyst gave
lower conversion than the catalyst without promoter. As temperature increased to
300 °C, catalytic activity of zirconia promoted catalyst was lower than the carbon
monoxide conversion of no-promoter catalyst.
Product distribution of the CZZr catalyst is given in Figure 82. In all the
temperatures in which activity test was conducted, methanol selectivities were very
high. Highest methanol selectivity was obtained at 250 °C as 94%. A sharp decrease
in the methanol selectivity was observed at temperatures 275 °C and 300 °C whereas
carbon dioxide selectivity increased at these temperatures. At 300 °C, carbon dioxide
0
0.05
0.1
0.15
0.2
0.25
200 225 250 275 300
CO
Co
nv
ersi
on
Temperature , ºC
CZ
CZA
CZCe
CZZr
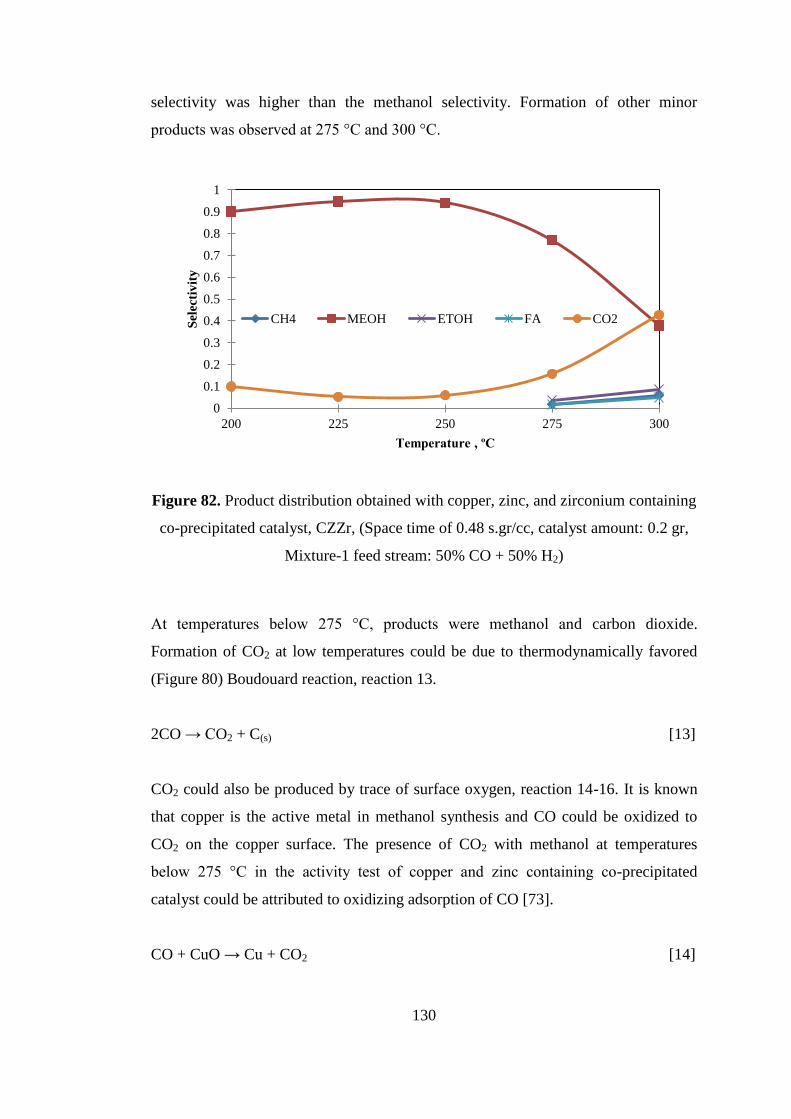
130
selectivity was higher than the methanol selectivity. Formation of other minor
products was observed at 275 °C and 300 °C.
Figure 82. Product distribution obtained with copper, zinc, and zirconium containing
co-precipitated catalyst, CZZr, (Space time of 0.48 s.gr/cc, catalyst amount: 0.2 gr,
Mixture-1 feed stream: 50% CO + 50% H2)
At temperatures below 275 °C, products were methanol and carbon dioxide.
Formation of CO2 at low temperatures could be due to thermodynamically favored
(Figure 80) Boudouard reaction, reaction 13.
2CO → CO2 + C(s) [13]
CO2 could also be produced by trace of surface oxygen, reaction 14-16. It is known
that copper is the active metal in methanol synthesis and CO could be oxidized to
CO2 on the copper surface. The presence of CO2 with methanol at temperatures
below 275 °C in the activity test of copper and zinc containing co-precipitated
catalyst could be attributed to oxidizing adsorption of CO [73].
CO + CuO → Cu + CO2 [14]
0
0.1
0.2
0.3
0.4
0.5
0.6
0.7
0.8
0.9
1
200 225 250 275 300
Sel
ecti
vit
y
Temperature , ºC
CH4 MEOH ETOH FA CO2
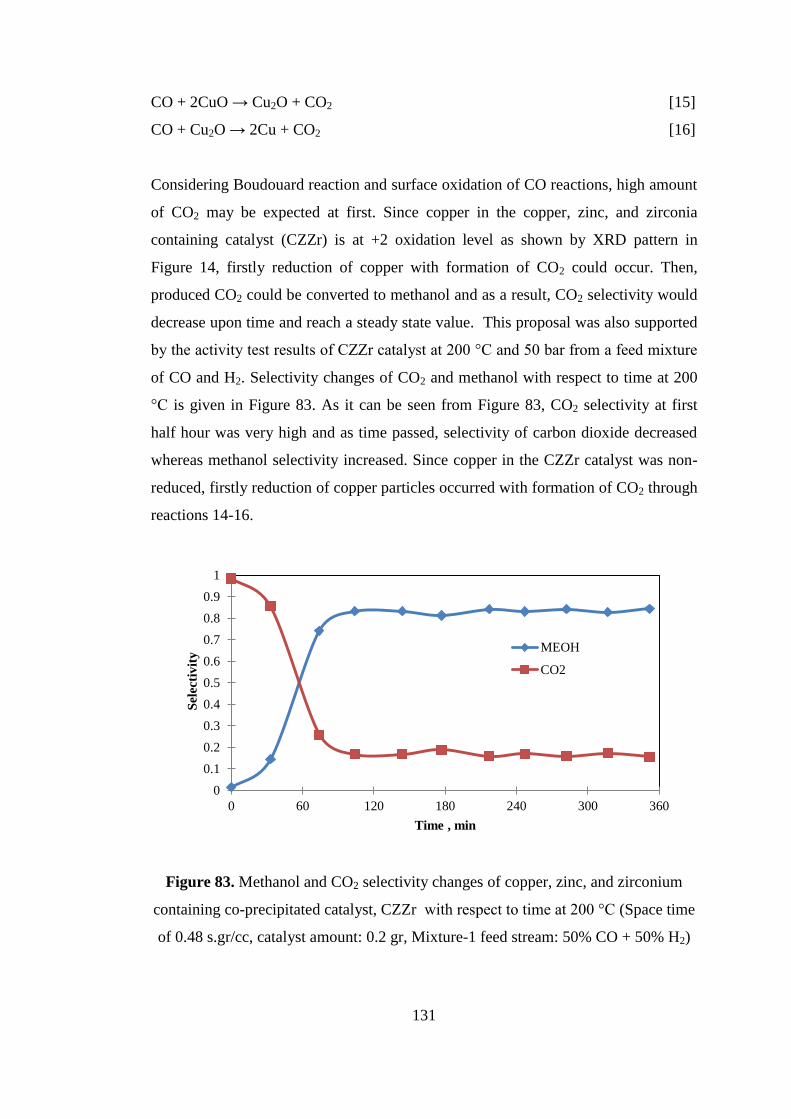
131
CO + 2CuO → Cu2O + CO2 [15]
CO + Cu2O → 2Cu + CO2 [16]
Considering Boudouard reaction and surface oxidation of CO reactions, high amount
of CO2 may be expected at first. Since copper in the copper, zinc, and zirconia
containing catalyst (CZZr) is at +2 oxidation level as shown by XRD pattern in
Figure 14, firstly reduction of copper with formation of CO2 could occur. Then,
produced CO2 could be converted to methanol and as a result, CO2 selectivity would
decrease upon time and reach a steady state value. This proposal was also supported
by the activity test results of CZZr catalyst at 200 °C and 50 bar from a feed mixture
of CO and H2. Selectivity changes of CO2 and methanol with respect to time at 200
°C is given in Figure 83. As it can be seen from Figure 83, CO2 selectivity at first
half hour was very high and as time passed, selectivity of carbon dioxide decreased
whereas methanol selectivity increased. Since copper in the CZZr catalyst was non-
reduced, firstly reduction of copper particles occurred with formation of CO2 through
reactions 14-16.
Figure 83. Methanol and CO2 selectivity changes of copper, zinc, and zirconium
containing co-precipitated catalyst, CZZr with respect to time at 200 °C (Space time
of 0.48 s.gr/cc, catalyst amount: 0.2 gr, Mixture-1 feed stream: 50% CO + 50% H2)
0
0.1
0.2
0.3
0.4
0.5
0.6
0.7
0.8
0.9
1
0 60 120 180 240 300 360
Sel
ecti
vit
y
Time , min
MEOH
CO2
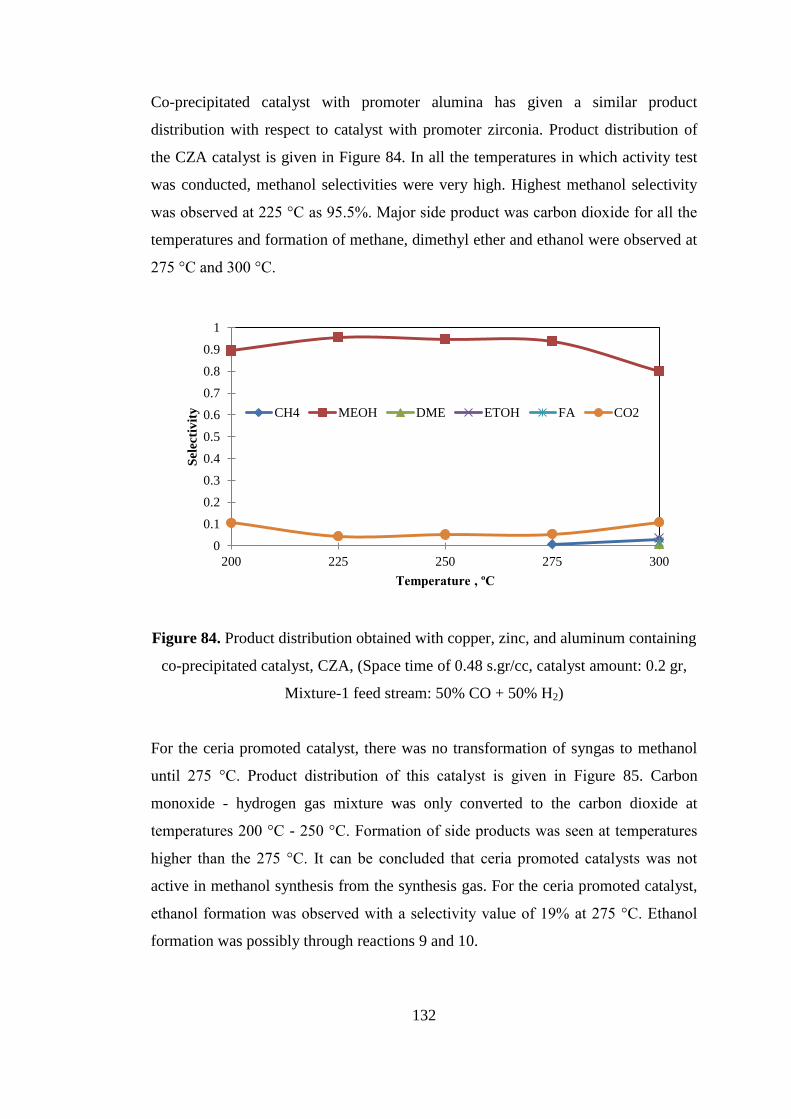
132
Co-precipitated catalyst with promoter alumina has given a similar product
distribution with respect to catalyst with promoter zirconia. Product distribution of
the CZA catalyst is given in Figure 84. In all the temperatures in which activity test
was conducted, methanol selectivities were very high. Highest methanol selectivity
was observed at 225 °C as 95.5%. Major side product was carbon dioxide for all the
temperatures and formation of methane, dimethyl ether and ethanol were observed at
275 °C and 300 °C.
Figure 84. Product distribution obtained with copper, zinc, and aluminum containing
co-precipitated catalyst, CZA, (Space time of 0.48 s.gr/cc, catalyst amount: 0.2 gr,
Mixture-1 feed stream: 50% CO + 50% H2)
For the ceria promoted catalyst, there was no transformation of syngas to methanol
until 275 °C. Product distribution of this catalyst is given in Figure 85. Carbon
monoxide - hydrogen gas mixture was only converted to the carbon dioxide at
temperatures 200 °C - 250 °C. Formation of side products was seen at temperatures
higher than the 275 °C. It can be concluded that ceria promoted catalysts was not
active in methanol synthesis from the synthesis gas. For the ceria promoted catalyst,
ethanol formation was observed with a selectivity value of 19% at 275 °C. Ethanol
formation was possibly through reactions 9 and 10.
0
0.1
0.2
0.3
0.4
0.5
0.6
0.7
0.8
0.9
1
200 225 250 275 300
Sel
ecti
vit
y
Temperature , ºC
CH4 MEOH DME ETOH FA CO2
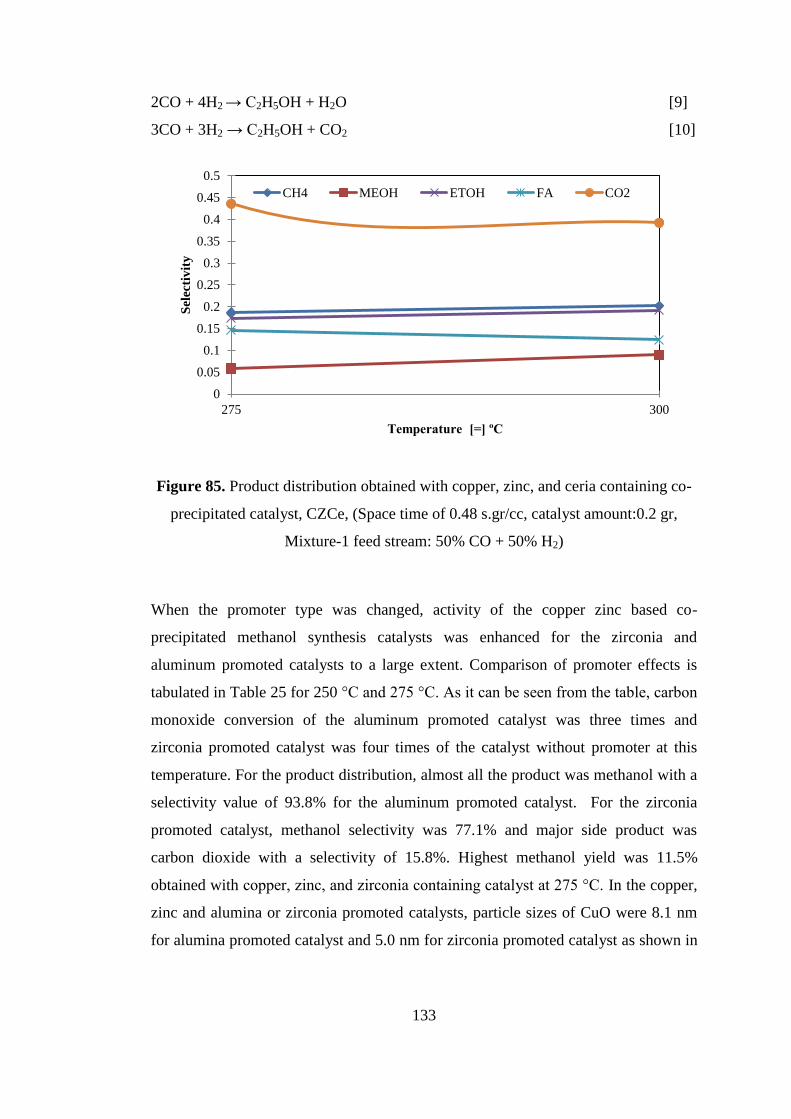
133
2CO + 4H2 → C2H5OH + H2O [9]
3CO + 3H2 → C2H5OH + CO2 [10]
Figure 85. Product distribution obtained with copper, zinc, and ceria containing co-
precipitated catalyst, CZCe, (Space time of 0.48 s.gr/cc, catalyst amount:0.2 gr,
Mixture-1 feed stream: 50% CO + 50% H2)
When the promoter type was changed, activity of the copper zinc based co-
precipitated methanol synthesis catalysts was enhanced for the zirconia and
aluminum promoted catalysts to a large extent. Comparison of promoter effects is
tabulated in Table 25 for 250 °C and 275 °C. As it can be seen from the table, carbon
monoxide conversion of the aluminum promoted catalyst was three times and
zirconia promoted catalyst was four times of the catalyst without promoter at this
temperature. For the product distribution, almost all the product was methanol with a
selectivity value of 93.8% for the aluminum promoted catalyst. For the zirconia
promoted catalyst, methanol selectivity was 77.1% and major side product was
carbon dioxide with a selectivity of 15.8%. Highest methanol yield was 11.5%
obtained with copper, zinc, and zirconia containing catalyst at 275 °C. In the copper,
zinc and alumina or zirconia promoted catalysts, particle sizes of CuO were 8.1 nm
for alumina promoted catalyst and 5.0 nm for zirconia promoted catalyst as shown in
0
0.05
0.1
0.15
0.2
0.25
0.3
0.35
0.4
0.45
0.5
275 300
Sel
ecti
vit
y
Temperature [=] ºC
CH4 MEOH ETOH FA CO2
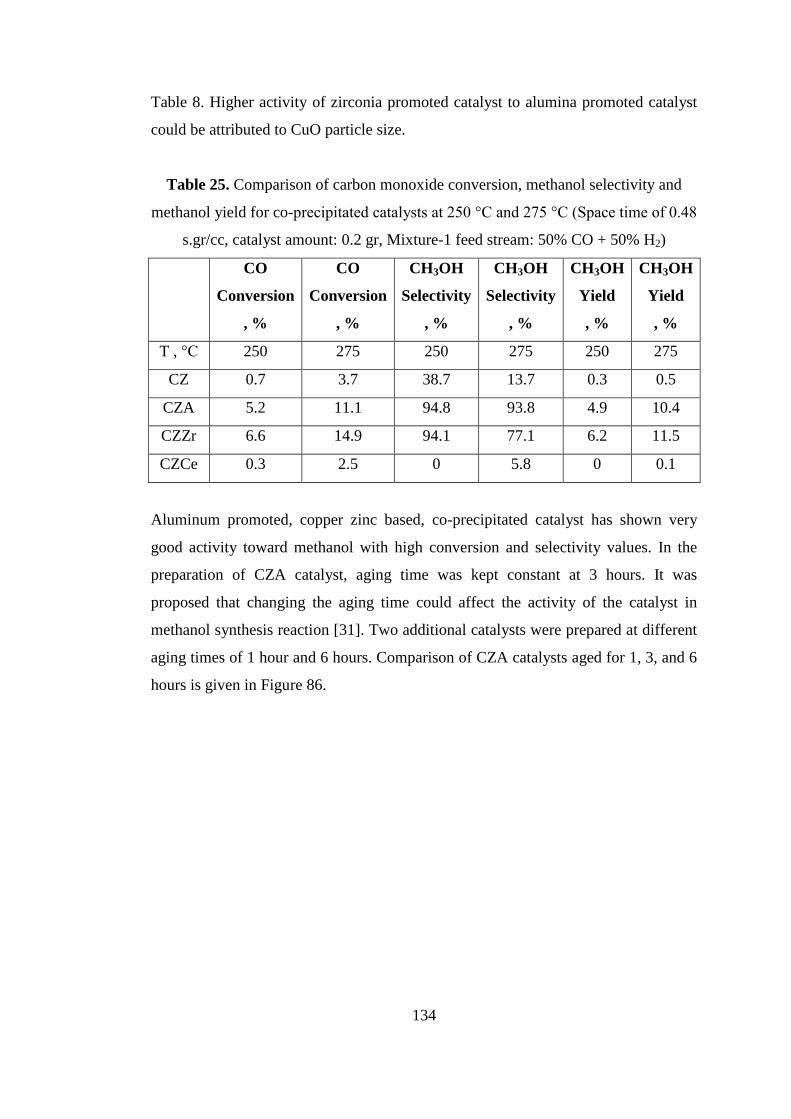
134
Table 8. Higher activity of zirconia promoted catalyst to alumina promoted catalyst
could be attributed to CuO particle size.
Table 25. Comparison of carbon monoxide conversion, methanol selectivity and
methanol yield for co-precipitated catalysts at 250 °C and 275 °C (Space time of 0.48
s.gr/cc, catalyst amount: 0.2 gr, Mixture-1 feed stream: 50% CO + 50% H2)
CO
Conversion
, %
CO
Conversion
, %
CH3OH
Selectivity
, %
CH3OH
Selectivity
, %
CH3OH
Yield
, %
CH3OH
Yield
, %
T , °C 250 275 250 275 250 275
CZ 0.7 3.7 38.7 13.7 0.3 0.5
CZA 5.2 11.1 94.8 93.8 4.9 10.4
CZZr 6.6 14.9 94.1 77.1 6.2 11.5
CZCe 0.3 2.5 0 5.8 0 0.1
Aluminum promoted, copper zinc based, co-precipitated catalyst has shown very
good activity toward methanol with high conversion and selectivity values. In the
preparation of CZA catalyst, aging time was kept constant at 3 hours. It was
proposed that changing the aging time could affect the activity of the catalyst in
methanol synthesis reaction [31]. Two additional catalysts were prepared at different
aging times of 1 hour and 6 hours. Comparison of CZA catalysts aged for 1, 3, and 6
hours is given in Figure 86.
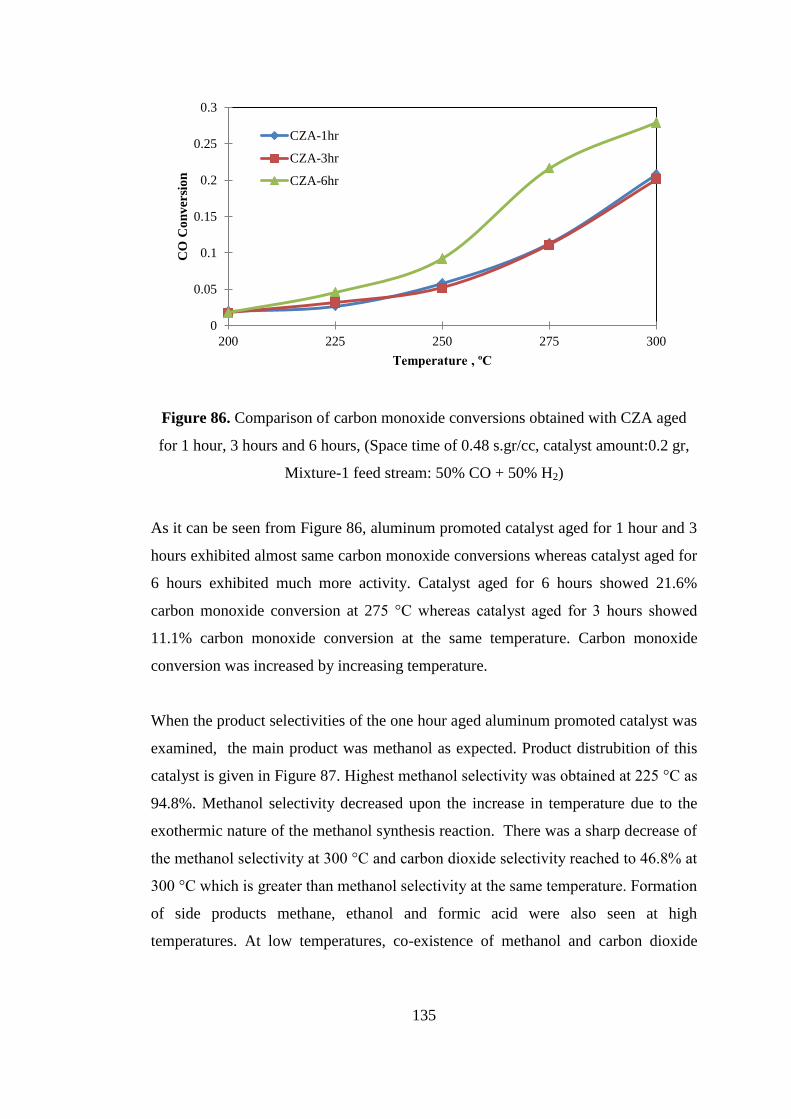
135
Figure 86. Comparison of carbon monoxide conversions obtained with CZA aged
for 1 hour, 3 hours and 6 hours, (Space time of 0.48 s.gr/cc, catalyst amount:0.2 gr,
Mixture-1 feed stream: 50% CO + 50% H2)
As it can be seen from Figure 86, aluminum promoted catalyst aged for 1 hour and 3
hours exhibited almost same carbon monoxide conversions whereas catalyst aged for
6 hours exhibited much more activity. Catalyst aged for 6 hours showed 21.6%
carbon monoxide conversion at 275 °C whereas catalyst aged for 3 hours showed
11.1% carbon monoxide conversion at the same temperature. Carbon monoxide
conversion was increased by increasing temperature.
When the product selectivities of the one hour aged aluminum promoted catalyst was
examined, the main product was methanol as expected. Product distrubition of this
catalyst is given in Figure 87. Highest methanol selectivity was obtained at 225 °C as
94.8%. Methanol selectivity decreased upon the increase in temperature due to the
exothermic nature of the methanol synthesis reaction. There was a sharp decrease of
the methanol selectivity at 300 °C and carbon dioxide selectivity reached to 46.8% at
300 °C which is greater than methanol selectivity at the same temperature. Formation
of side products methane, ethanol and formic acid were also seen at high
temperatures. At low temperatures, co-existence of methanol and carbon dioxide
0
0.05
0.1
0.15
0.2
0.25
0.3
200 225 250 275 300
CO
Co
nv
ersi
on
Temperature , ºC
CZA-1hr
CZA-3hr
CZA-6hr
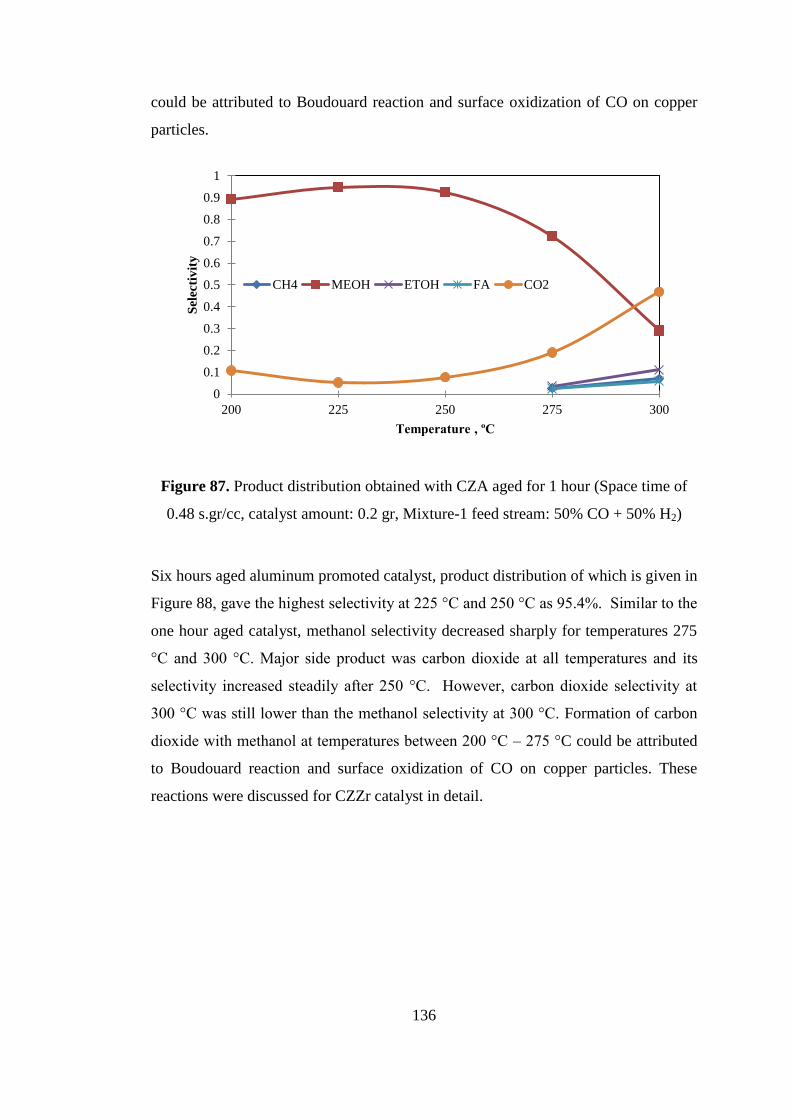
136
could be attributed to Boudouard reaction and surface oxidization of CO on copper
particles.
Figure 87. Product distribution obtained with CZA aged for 1 hour (Space time of
0.48 s.gr/cc, catalyst amount: 0.2 gr, Mixture-1 feed stream: 50% CO + 50% H2)
Six hours aged aluminum promoted catalyst, product distribution of which is given in
Figure 88, gave the highest selectivity at 225 °C and 250 °C as 95.4%. Similar to the
one hour aged catalyst, methanol selectivity decreased sharply for temperatures 275
°C and 300 °C. Major side product was carbon dioxide at all temperatures and its
selectivity increased steadily after 250 °C. However, carbon dioxide selectivity at
300 °C was still lower than the methanol selectivity at 300 °C. Formation of carbon
dioxide with methanol at temperatures between 200 °C – 275 °C could be attributed
to Boudouard reaction and surface oxidization of CO on copper particles. These
reactions were discussed for CZZr catalyst in detail.
0
0.1
0.2
0.3
0.4
0.5
0.6
0.7
0.8
0.9
1
200 225 250 275 300
Sel
ecti
vit
y
Temperature , ºC
CH4 MEOH ETOH FA CO2
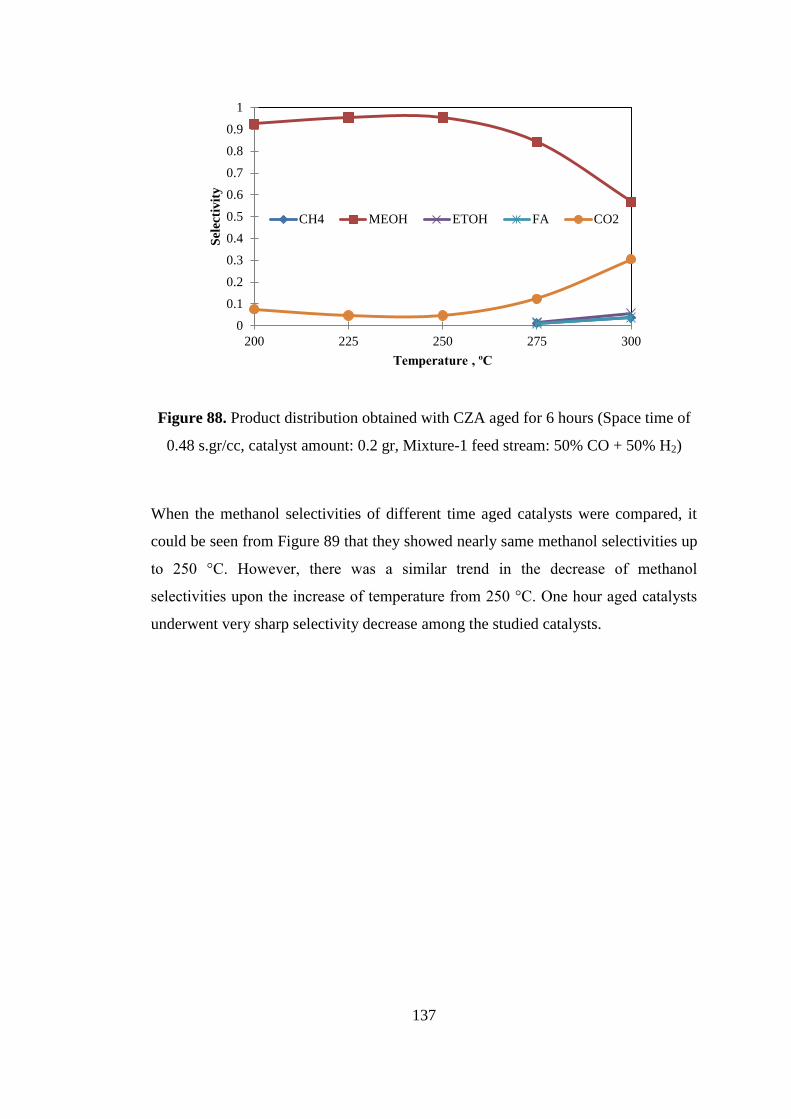
137
Figure 88. Product distribution obtained with CZA aged for 6 hours (Space time of
0.48 s.gr/cc, catalyst amount: 0.2 gr, Mixture-1 feed stream: 50% CO + 50% H2)
When the methanol selectivities of different time aged catalysts were compared, it
could be seen from Figure 89 that they showed nearly same methanol selectivities up
to 250 °C. However, there was a similar trend in the decrease of methanol
selectivities upon the increase of temperature from 250 °C. One hour aged catalysts
underwent very sharp selectivity decrease among the studied catalysts.
0
0.1
0.2
0.3
0.4
0.5
0.6
0.7
0.8
0.9
1
200 225 250 275 300
Sel
ecti
vit
y
Temperature , ºC
CH4 MEOH ETOH FA CO2
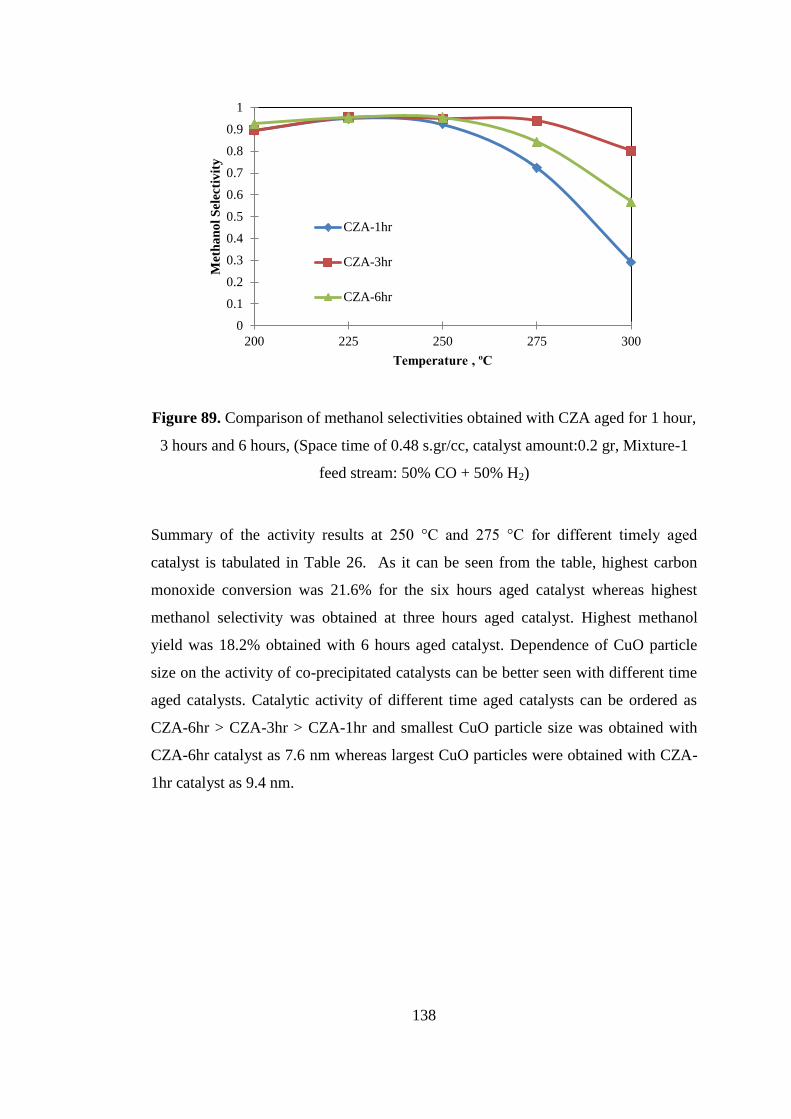
138
Figure 89. Comparison of methanol selectivities obtained with CZA aged for 1 hour,
3 hours and 6 hours, (Space time of 0.48 s.gr/cc, catalyst amount:0.2 gr, Mixture-1
feed stream: 50% CO + 50% H2)
Summary of the activity results at 250 °C and 275 °C for different timely aged
catalyst is tabulated in Table 26. As it can be seen from the table, highest carbon
monoxide conversion was 21.6% for the six hours aged catalyst whereas highest
methanol selectivity was obtained at three hours aged catalyst. Highest methanol
yield was 18.2% obtained with 6 hours aged catalyst. Dependence of CuO particle
size on the activity of co-precipitated catalysts can be better seen with different time
aged catalysts. Catalytic activity of different time aged catalysts can be ordered as
CZA-6hr > CZA-3hr > CZA-1hr and smallest CuO particle size was obtained with
CZA-6hr catalyst as 7.6 nm whereas largest CuO particles were obtained with CZA-
1hr catalyst as 9.4 nm.
0
0.1
0.2
0.3
0.4
0.5
0.6
0.7
0.8
0.9
1
200 225 250 275 300
Met
ha
no
l S
elec
tiv
ity
Temperature , ºC
CZA-1hr
CZA-3hr
CZA-6hr
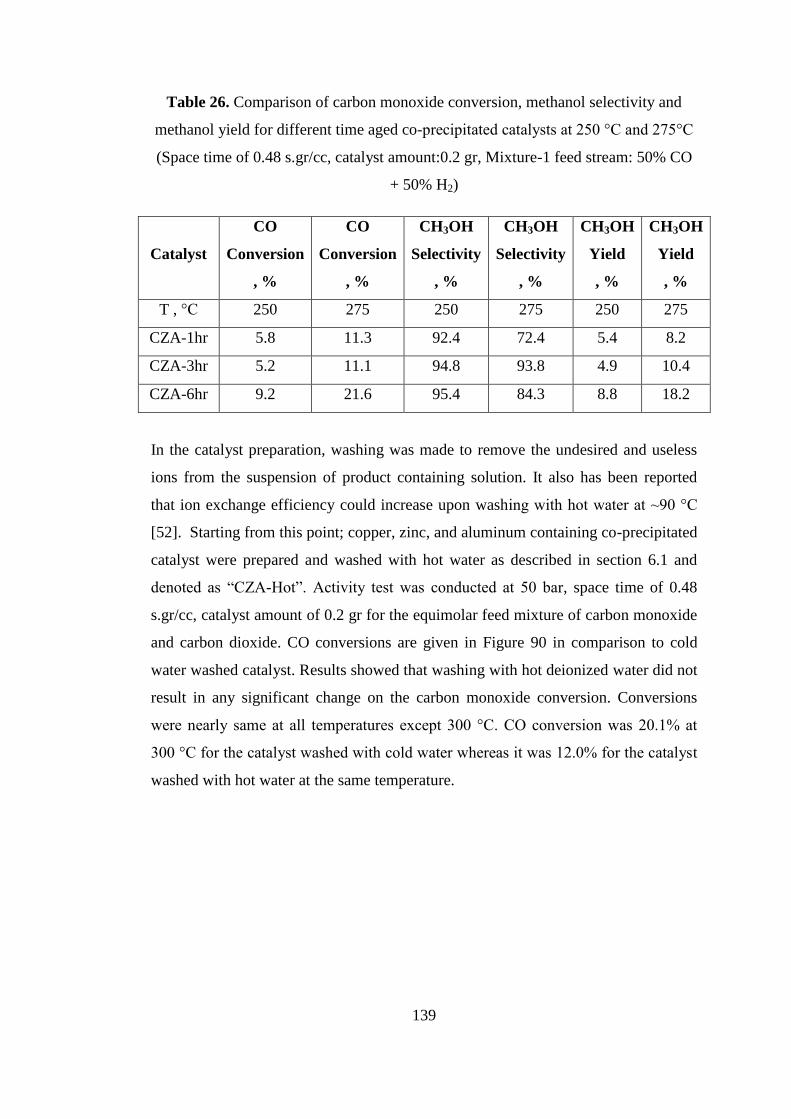
139
Table 26. Comparison of carbon monoxide conversion, methanol selectivity and
methanol yield for different time aged co-precipitated catalysts at 250 °C and 275°C
(Space time of 0.48 s.gr/cc, catalyst amount:0.2 gr, Mixture-1 feed stream: 50% CO
+ 50% H2)
Catalyst
CO
Conversion
, %
CO
Conversion
, %
CH3OH
Selectivity
, %
CH3OH
Selectivity
, %
CH3OH
Yield
, %
CH3OH
Yield
, %
T , °C 250 275 250 275 250 275
CZA-1hr 5.8 11.3 92.4 72.4 5.4 8.2
CZA-3hr 5.2 11.1 94.8 93.8 4.9 10.4
CZA-6hr 9.2 21.6 95.4 84.3 8.8 18.2
In the catalyst preparation, washing was made to remove the undesired and useless
ions from the suspension of product containing solution. It also has been reported
that ion exchange efficiency could increase upon washing with hot water at ~90 °C
[52]. Starting from this point; copper, zinc, and aluminum containing co-precipitated
catalyst were prepared and washed with hot water as described in section 6.1 and
denoted as “CZA-Hot”. Activity test was conducted at 50 bar, space time of 0.48
s.gr/cc, catalyst amount of 0.2 gr for the equimolar feed mixture of carbon monoxide
and carbon dioxide. CO conversions are given in Figure 90 in comparison to cold
water washed catalyst. Results showed that washing with hot deionized water did not
result in any significant change on the carbon monoxide conversion. Conversions
were nearly same at all temperatures except 300 °C. CO conversion was 20.1% at
300 °C for the catalyst washed with cold water whereas it was 12.0% for the catalyst
washed with hot water at the same temperature.
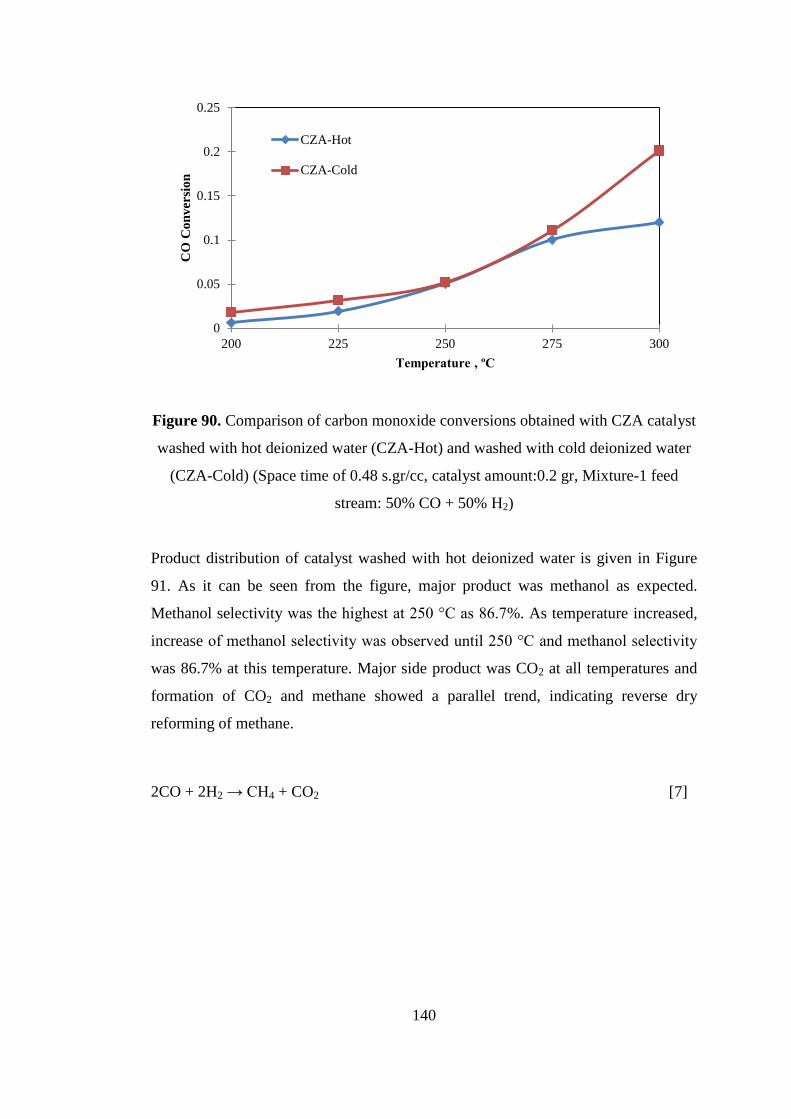
140
Figure 90. Comparison of carbon monoxide conversions obtained with CZA catalyst
washed with hot deionized water (CZA-Hot) and washed with cold deionized water
(CZA-Cold) (Space time of 0.48 s.gr/cc, catalyst amount:0.2 gr, Mixture-1 feed
stream: 50% CO + 50% H2)
Product distribution of catalyst washed with hot deionized water is given in Figure
91. As it can be seen from the figure, major product was methanol as expected.
Methanol selectivity was the highest at 250 °C as 86.7%. As temperature increased,
increase of methanol selectivity was observed until 250 °C and methanol selectivity
was 86.7% at this temperature. Major side product was CO2 at all temperatures and
formation of CO2 and methane showed a parallel trend, indicating reverse dry
reforming of methane.
2CO + 2H2 → CH4 + CO2 [7]
0
0.05
0.1
0.15
0.2
0.25
200 225 250 275 300
CO
Co
nv
ersi
on
Temperature , ºC
CZA-Hot
CZA-Cold
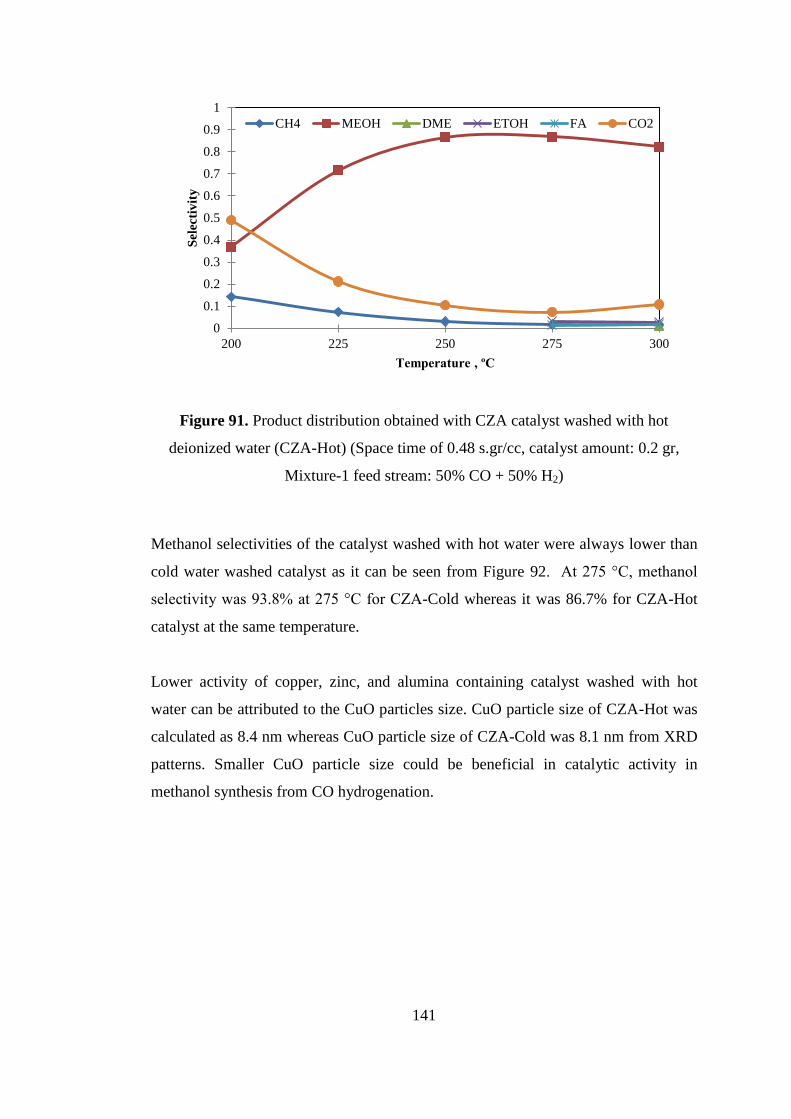
141
Figure 91. Product distribution obtained with CZA catalyst washed with hot
deionized water (CZA-Hot) (Space time of 0.48 s.gr/cc, catalyst amount: 0.2 gr,
Mixture-1 feed stream: 50% CO + 50% H2)
Methanol selectivities of the catalyst washed with hot water were always lower than
cold water washed catalyst as it can be seen from Figure 92. At 275 °C, methanol
selectivity was 93.8% at 275 °C for CZA-Cold whereas it was 86.7% for CZA-Hot
catalyst at the same temperature.
Lower activity of copper, zinc, and alumina containing catalyst washed with hot
water can be attributed to the CuO particles size. CuO particle size of CZA-Hot was
calculated as 8.4 nm whereas CuO particle size of CZA-Cold was 8.1 nm from XRD
patterns. Smaller CuO particle size could be beneficial in catalytic activity in
methanol synthesis from CO hydrogenation.
0
0.1
0.2
0.3
0.4
0.5
0.6
0.7
0.8
0.9
1
200 225 250 275 300
Sel
ecti
vit
y
Temperature , ºC
CH4 MEOH DME ETOH FA CO2
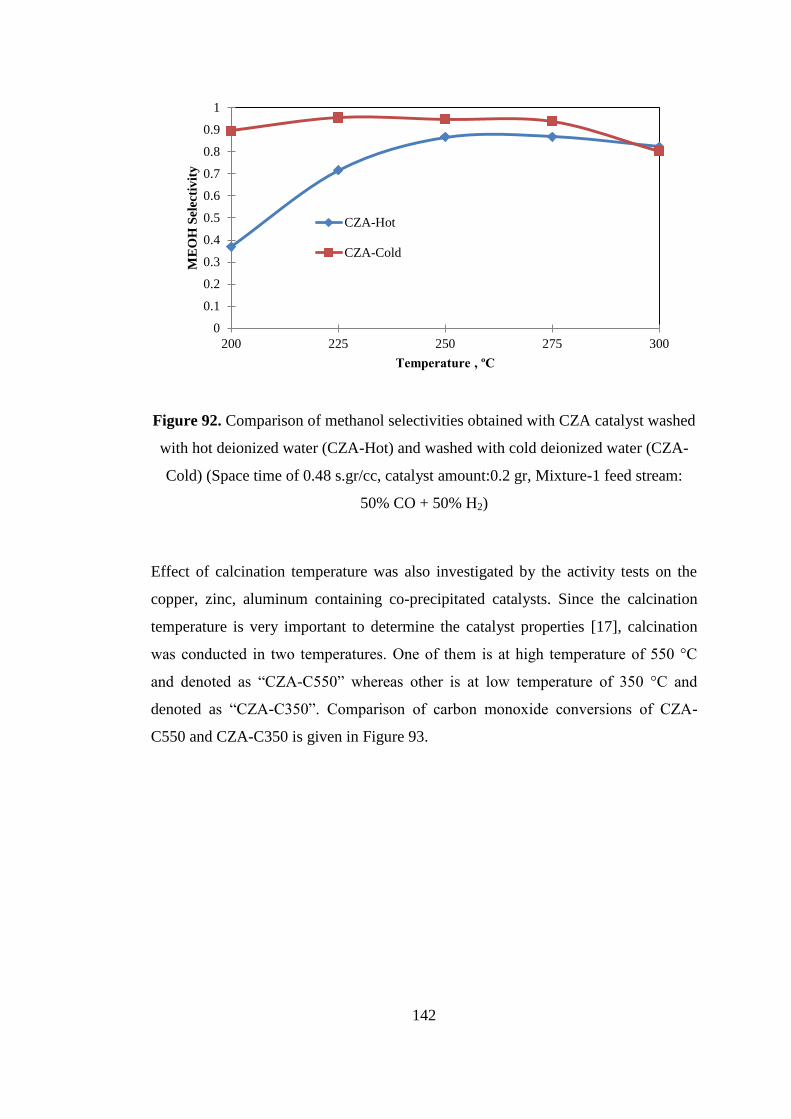
142
Figure 92. Comparison of methanol selectivities obtained with CZA catalyst washed
with hot deionized water (CZA-Hot) and washed with cold deionized water (CZA-
Cold) (Space time of 0.48 s.gr/cc, catalyst amount:0.2 gr, Mixture-1 feed stream:
50% CO + 50% H2)
Effect of calcination temperature was also investigated by the activity tests on the
copper, zinc, aluminum containing co-precipitated catalysts. Since the calcination
temperature is very important to determine the catalyst properties [17], calcination
was conducted in two temperatures. One of them is at high temperature of 550 °C
and denoted as “CZA-C550” whereas other is at low temperature of 350 °C and
denoted as “CZA-C350”. Comparison of carbon monoxide conversions of CZA-
C550 and CZA-C350 is given in Figure 93.
0
0.1
0.2
0.3
0.4
0.5
0.6
0.7
0.8
0.9
1
200 225 250 275 300
ME
OH
Sel
ecti
vit
y
Temperature , ºC
CZA-Hot
CZA-Cold
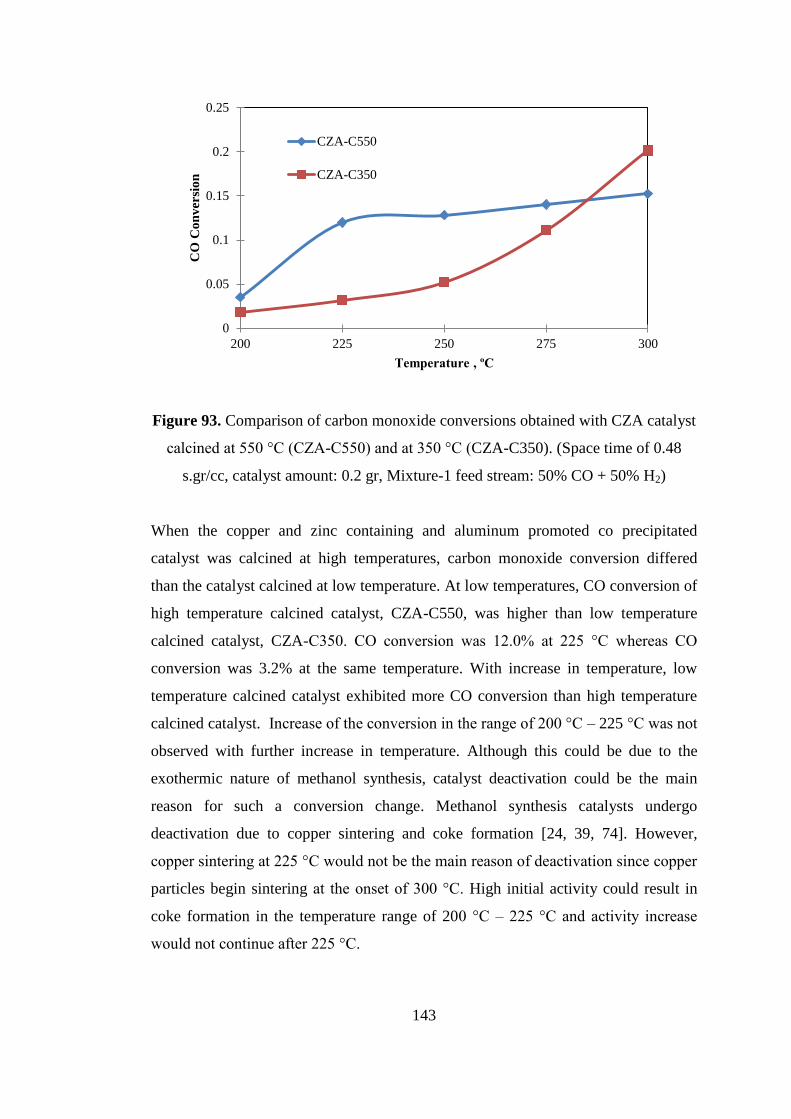
143
Figure 93. Comparison of carbon monoxide conversions obtained with CZA catalyst
calcined at 550 °C (CZA-C550) and at 350 °C (CZA-C350). (Space time of 0.48
s.gr/cc, catalyst amount: 0.2 gr, Mixture-1 feed stream: 50% CO + 50% H2)
When the copper and zinc containing and aluminum promoted co precipitated
catalyst was calcined at high temperatures, carbon monoxide conversion differed
than the catalyst calcined at low temperature. At low temperatures, CO conversion of
high temperature calcined catalyst, CZA-C550, was higher than low temperature
calcined catalyst, CZA-C350. CO conversion was 12.0% at 225 °C whereas CO
conversion was 3.2% at the same temperature. With increase in temperature, low
temperature calcined catalyst exhibited more CO conversion than high temperature
calcined catalyst. Increase of the conversion in the range of 200 °C – 225 °C was not
observed with further increase in temperature. Although this could be due to the
exothermic nature of methanol synthesis, catalyst deactivation could be the main
reason for such a conversion change. Methanol synthesis catalysts undergo
deactivation due to copper sintering and coke formation [24, 39, 74]. However,
copper sintering at 225 °C would not be the main reason of deactivation since copper
particles begin sintering at the onset of 300 °C. High initial activity could result in
coke formation in the temperature range of 200 °C – 225 °C and activity increase
would not continue after 225 °C.
0
0.05
0.1
0.15
0.2
0.25
200 225 250 275 300
CO
Co
nv
ersi
on
Temperature , ºC
CZA-C550
CZA-C350
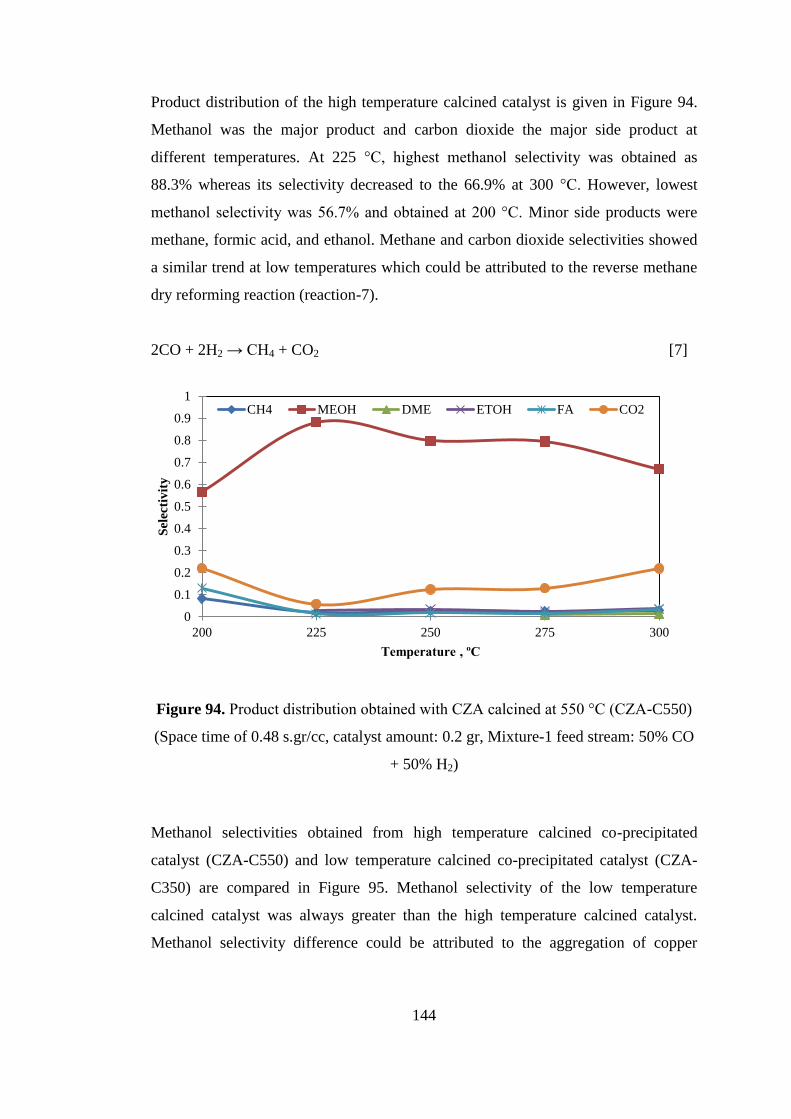
144
Product distribution of the high temperature calcined catalyst is given in Figure 94.
Methanol was the major product and carbon dioxide the major side product at
different temperatures. At 225 °C, highest methanol selectivity was obtained as
88.3% whereas its selectivity decreased to the 66.9% at 300 °C. However, lowest
methanol selectivity was 56.7% and obtained at 200 °C. Minor side products were
methane, formic acid, and ethanol. Methane and carbon dioxide selectivities showed
a similar trend at low temperatures which could be attributed to the reverse methane
dry reforming reaction (reaction-7).
2CO + 2H2 → CH4 + CO2 [7]
Figure 94. Product distribution obtained with CZA calcined at 550 °C (CZA-C550)
(Space time of 0.48 s.gr/cc, catalyst amount: 0.2 gr, Mixture-1 feed stream: 50% CO
+ 50% H2)
Methanol selectivities obtained from high temperature calcined co-precipitated
catalyst (CZA-C550) and low temperature calcined co-precipitated catalyst (CZA-
C350) are compared in Figure 95. Methanol selectivity of the low temperature
calcined catalyst was always greater than the high temperature calcined catalyst.
Methanol selectivity difference could be attributed to the aggregation of copper
0
0.1
0.2
0.3
0.4
0.5
0.6
0.7
0.8
0.9
1
200 225 250 275 300
Sel
ecti
vit
y
Temperature , ºC
CH4 MEOH DME ETOH FA CO2
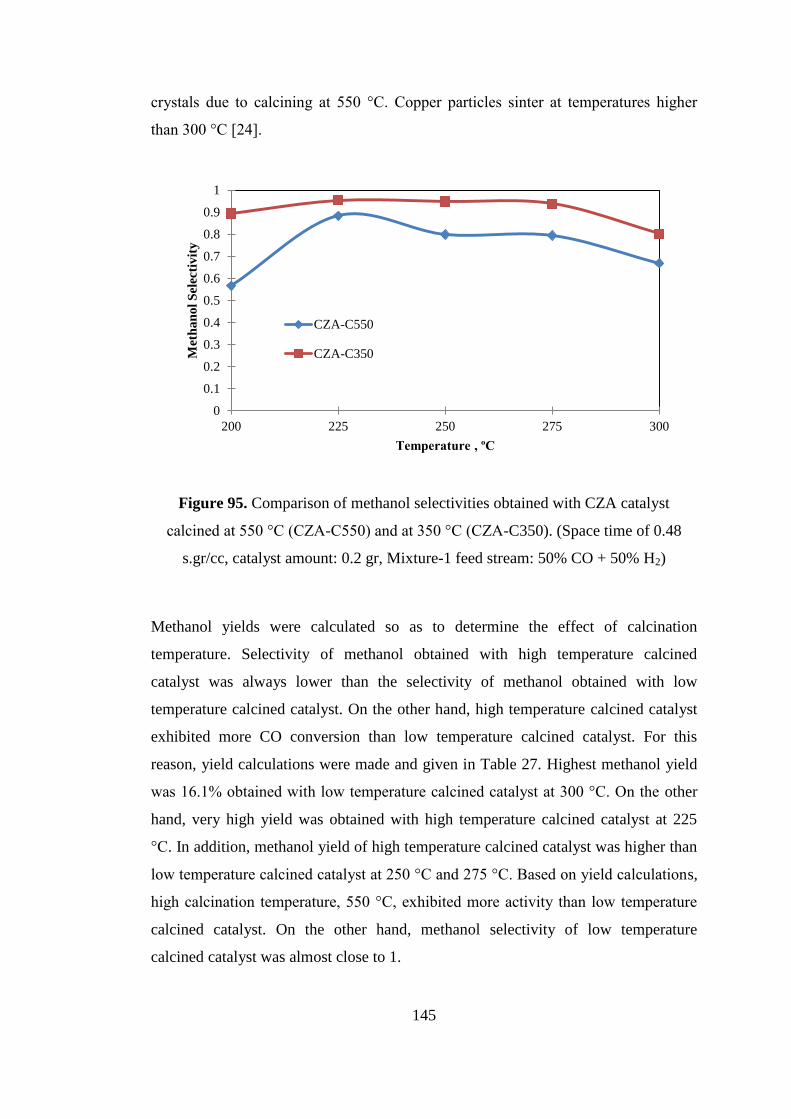
145
crystals due to calcining at 550 °C. Copper particles sinter at temperatures higher
than 300 °C [24].
Figure 95. Comparison of methanol selectivities obtained with CZA catalyst
calcined at 550 °C (CZA-C550) and at 350 °C (CZA-C350). (Space time of 0.48
s.gr/cc, catalyst amount: 0.2 gr, Mixture-1 feed stream: 50% CO + 50% H2)
Methanol yields were calculated so as to determine the effect of calcination
temperature. Selectivity of methanol obtained with high temperature calcined
catalyst was always lower than the selectivity of methanol obtained with low
temperature calcined catalyst. On the other hand, high temperature calcined catalyst
exhibited more CO conversion than low temperature calcined catalyst. For this
reason, yield calculations were made and given in Table 27. Highest methanol yield
was 16.1% obtained with low temperature calcined catalyst at 300 °C. On the other
hand, very high yield was obtained with high temperature calcined catalyst at 225
°C. In addition, methanol yield of high temperature calcined catalyst was higher than
low temperature calcined catalyst at 250 °C and 275 °C. Based on yield calculations,
high calcination temperature, 550 °C, exhibited more activity than low temperature
calcined catalyst. On the other hand, methanol selectivity of low temperature
calcined catalyst was almost close to 1.
0
0.1
0.2
0.3
0.4
0.5
0.6
0.7
0.8
0.9
1
200 225 250 275 300
Met
ha
no
l S
elec
tiv
ity
Temperature , ºC
CZA-C550
CZA-C350
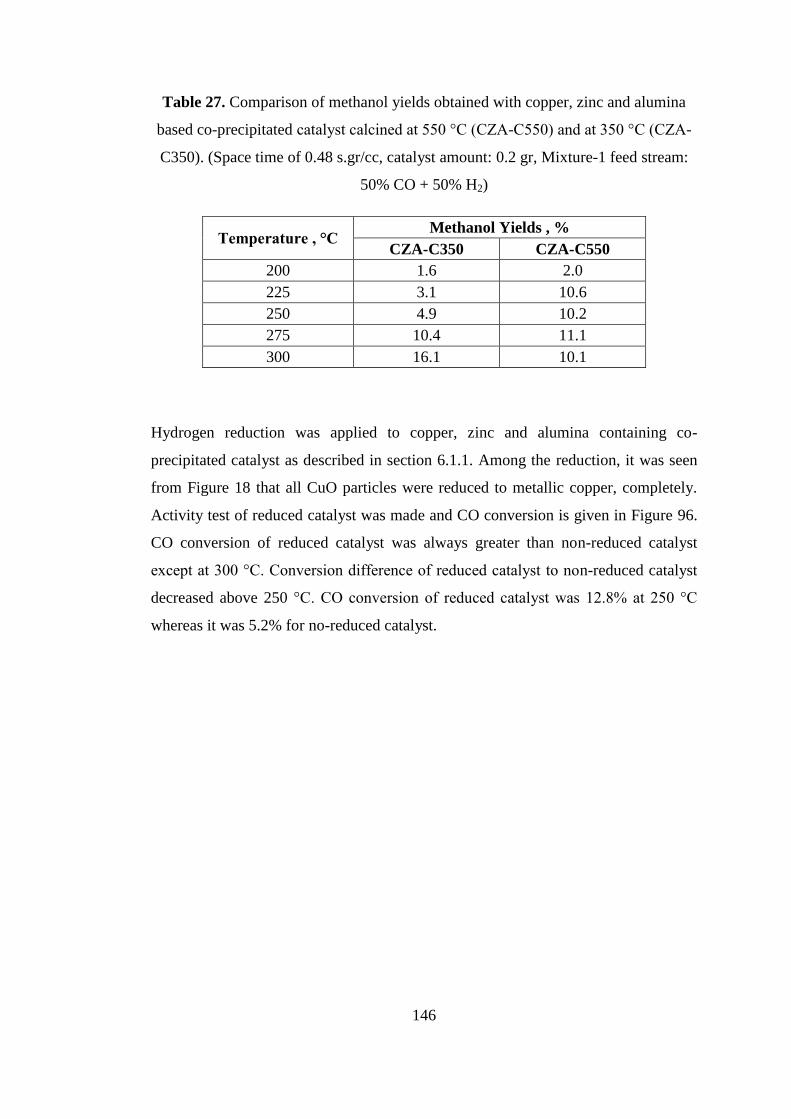
146
Table 27. Comparison of methanol yields obtained with copper, zinc and alumina
based co-precipitated catalyst calcined at 550 °C (CZA-C550) and at 350 °C (CZA-
C350). (Space time of 0.48 s.gr/cc, catalyst amount: 0.2 gr, Mixture-1 feed stream:
50% CO + 50% H2)
Temperature , °C Methanol Yields , %
CZA-C350 CZA-C550
200 1.6 2.0
225 3.1 10.6
250 4.9 10.2
275 10.4 11.1
300 16.1 10.1
Hydrogen reduction was applied to copper, zinc and alumina containing co-
precipitated catalyst as described in section 6.1.1. Among the reduction, it was seen
from Figure 18 that all CuO particles were reduced to metallic copper, completely.
Activity test of reduced catalyst was made and CO conversion is given in Figure 96.
CO conversion of reduced catalyst was always greater than non-reduced catalyst
except at 300 °C. Conversion difference of reduced catalyst to non-reduced catalyst
decreased above 250 °C. CO conversion of reduced catalyst was 12.8% at 250 °C
whereas it was 5.2% for no-reduced catalyst.
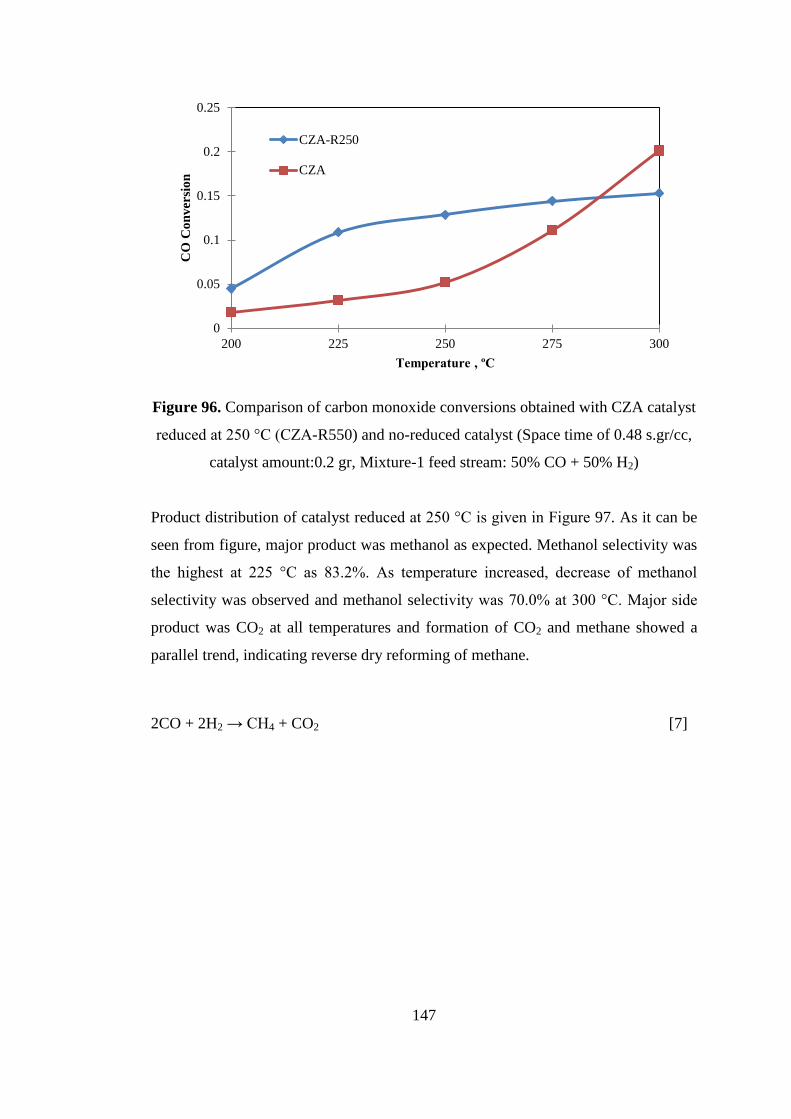
147
Figure 96. Comparison of carbon monoxide conversions obtained with CZA catalyst
reduced at 250 °C (CZA-R550) and no-reduced catalyst (Space time of 0.48 s.gr/cc,
catalyst amount:0.2 gr, Mixture-1 feed stream: 50% CO + 50% H2)
Product distribution of catalyst reduced at 250 °C is given in Figure 97. As it can be
seen from figure, major product was methanol as expected. Methanol selectivity was
the highest at 225 °C as 83.2%. As temperature increased, decrease of methanol
selectivity was observed and methanol selectivity was 70.0% at 300 °C. Major side
product was CO2 at all temperatures and formation of CO2 and methane showed a
parallel trend, indicating reverse dry reforming of methane.
2CO + 2H2 → CH4 + CO2 [7]
0
0.05
0.1
0.15
0.2
0.25
200 225 250 275 300
CO
Co
nv
ersi
on
Temperature , ºC
CZA-R250
CZA
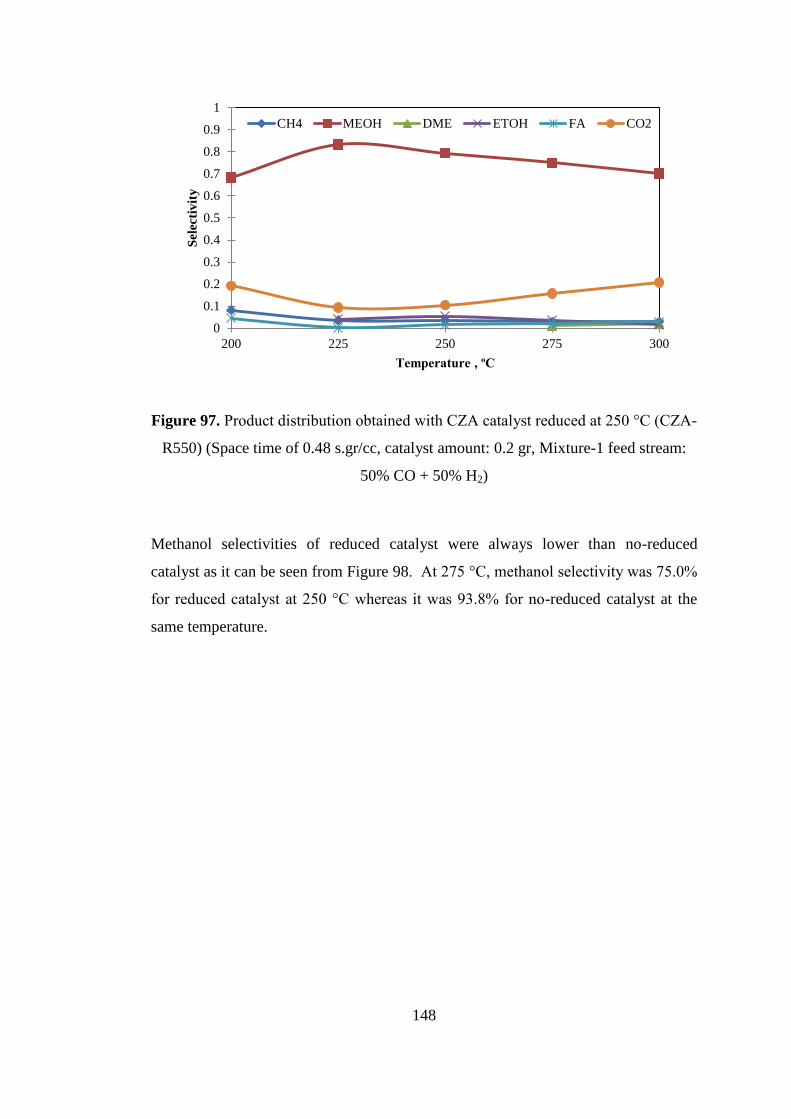
148
Figure 97. Product distribution obtained with CZA catalyst reduced at 250 °C (CZA-
R550) (Space time of 0.48 s.gr/cc, catalyst amount: 0.2 gr, Mixture-1 feed stream:
50% CO + 50% H2)
Methanol selectivities of reduced catalyst were always lower than no-reduced
catalyst as it can be seen from Figure 98. At 275 °C, methanol selectivity was 75.0%
for reduced catalyst at 250 °C whereas it was 93.8% for no-reduced catalyst at the
same temperature.
0
0.1
0.2
0.3
0.4
0.5
0.6
0.7
0.8
0.9
1
200 225 250 275 300
Sel
ecti
vit
y
Temperature , ºC
CH4 MEOH DME ETOH FA CO2
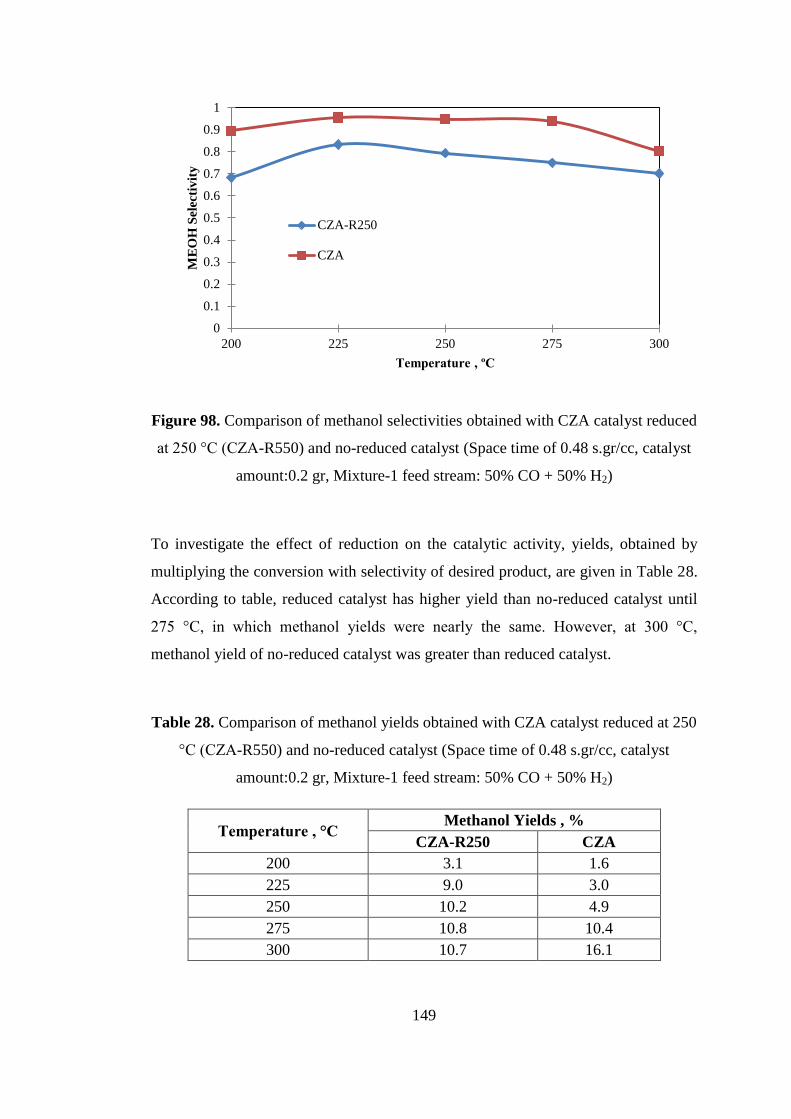
149
Figure 98. Comparison of methanol selectivities obtained with CZA catalyst reduced
at 250 °C (CZA-R550) and no-reduced catalyst (Space time of 0.48 s.gr/cc, catalyst
amount:0.2 gr, Mixture-1 feed stream: 50% CO + 50% H2)
To investigate the effect of reduction on the catalytic activity, yields, obtained by
multiplying the conversion with selectivity of desired product, are given in Table 28.
According to table, reduced catalyst has higher yield than no-reduced catalyst until
275 °C, in which methanol yields were nearly the same. However, at 300 °C,
methanol yield of no-reduced catalyst was greater than reduced catalyst.
Table 28. Comparison of methanol yields obtained with CZA catalyst reduced at 250
°C (CZA-R550) and no-reduced catalyst (Space time of 0.48 s.gr/cc, catalyst
amount:0.2 gr, Mixture-1 feed stream: 50% CO + 50% H2)
Temperature , °C Methanol Yields , %
CZA-R250 CZA
200 3.1 1.6
225 9.0 3.0
250 10.2 4.9
275 10.8 10.4
300 10.7 16.1
0
0.1
0.2
0.3
0.4
0.5
0.6
0.7
0.8
0.9
1
200 225 250 275 300
ME
OH
Sel
ecti
vit
y
Temperature , ºC
CZA-R250
CZA
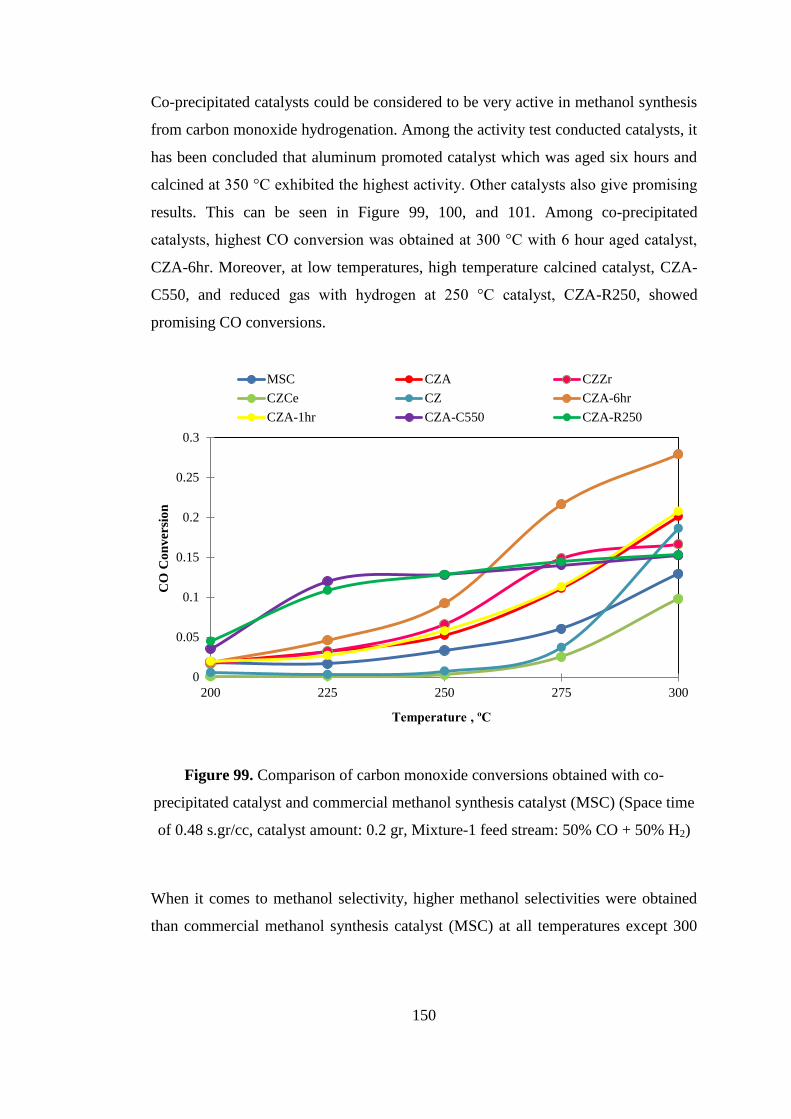
150
Co-precipitated catalysts could be considered to be very active in methanol synthesis
from carbon monoxide hydrogenation. Among the activity test conducted catalysts, it
has been concluded that aluminum promoted catalyst which was aged six hours and
calcined at 350 °C exhibited the highest activity. Other catalysts also give promising
results. This can be seen in Figure 99, 100, and 101. Among co-precipitated
catalysts, highest CO conversion was obtained at 300 °C with 6 hour aged catalyst,
CZA-6hr. Moreover, at low temperatures, high temperature calcined catalyst, CZA-
C550, and reduced gas with hydrogen at 250 °C catalyst, CZA-R250, showed
promising CO conversions.
Figure 99. Comparison of carbon monoxide conversions obtained with co-
precipitated catalyst and commercial methanol synthesis catalyst (MSC) (Space time
of 0.48 s.gr/cc, catalyst amount: 0.2 gr, Mixture-1 feed stream: 50% CO + 50% H2)
When it comes to methanol selectivity, higher methanol selectivities were obtained
than commercial methanol synthesis catalyst (MSC) at all temperatures except 300
0
0.05
0.1
0.15
0.2
0.25
0.3
200 225 250 275 300
CO
Co
nv
ersi
on
Temperature , ºC
MSC CZA CZZr
CZCe CZ CZA-6hr
CZA-1hr CZA-C550 CZA-R250
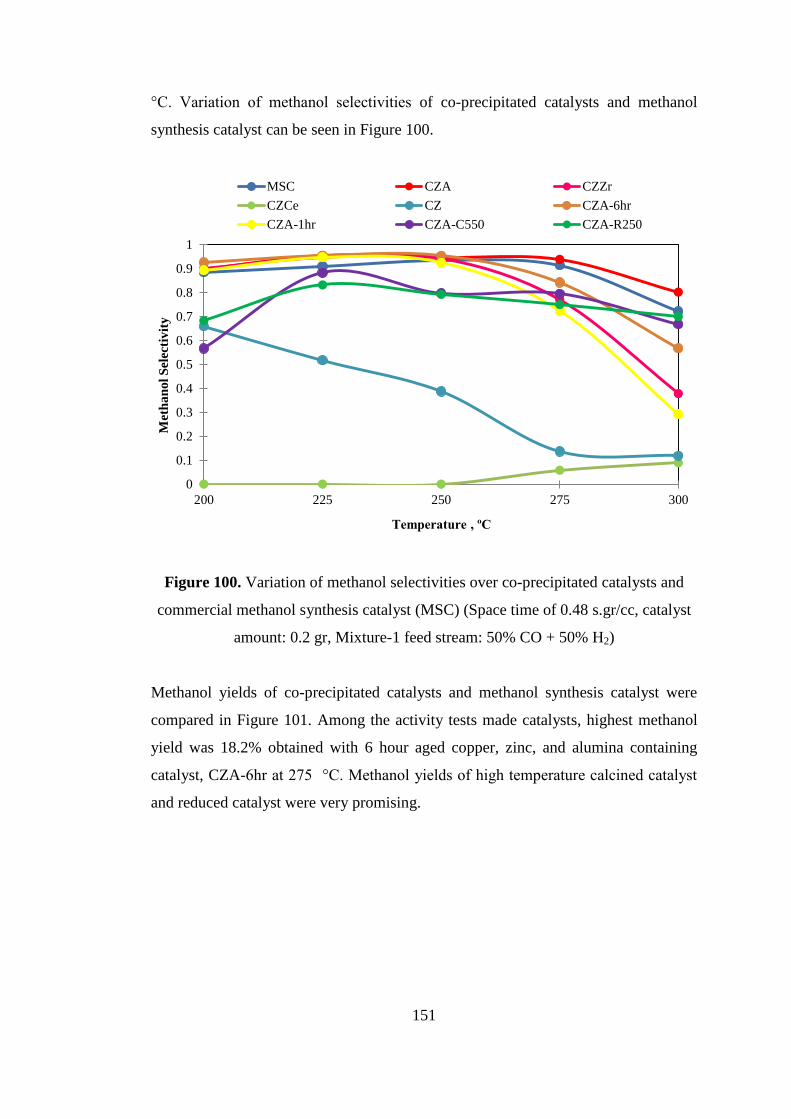
151
°C. Variation of methanol selectivities of co-precipitated catalysts and methanol
synthesis catalyst can be seen in Figure 100.
Figure 100. Variation of methanol selectivities over co-precipitated catalysts and
commercial methanol synthesis catalyst (MSC) (Space time of 0.48 s.gr/cc, catalyst
amount: 0.2 gr, Mixture-1 feed stream: 50% CO + 50% H2)
Methanol yields of co-precipitated catalysts and methanol synthesis catalyst were
compared in Figure 101. Among the activity tests made catalysts, highest methanol
yield was 18.2% obtained with 6 hour aged copper, zinc, and alumina containing
catalyst, CZA-6hr at 275 °C. Methanol yields of high temperature calcined catalyst
and reduced catalyst were very promising.
0
0.1
0.2
0.3
0.4
0.5
0.6
0.7
0.8
0.9
1
200 225 250 275 300
Met
ha
no
l S
elec
tiv
ity
Temperature , ºC
MSC CZA CZZr
CZCe CZ CZA-6hr
CZA-1hr CZA-C550 CZA-R250
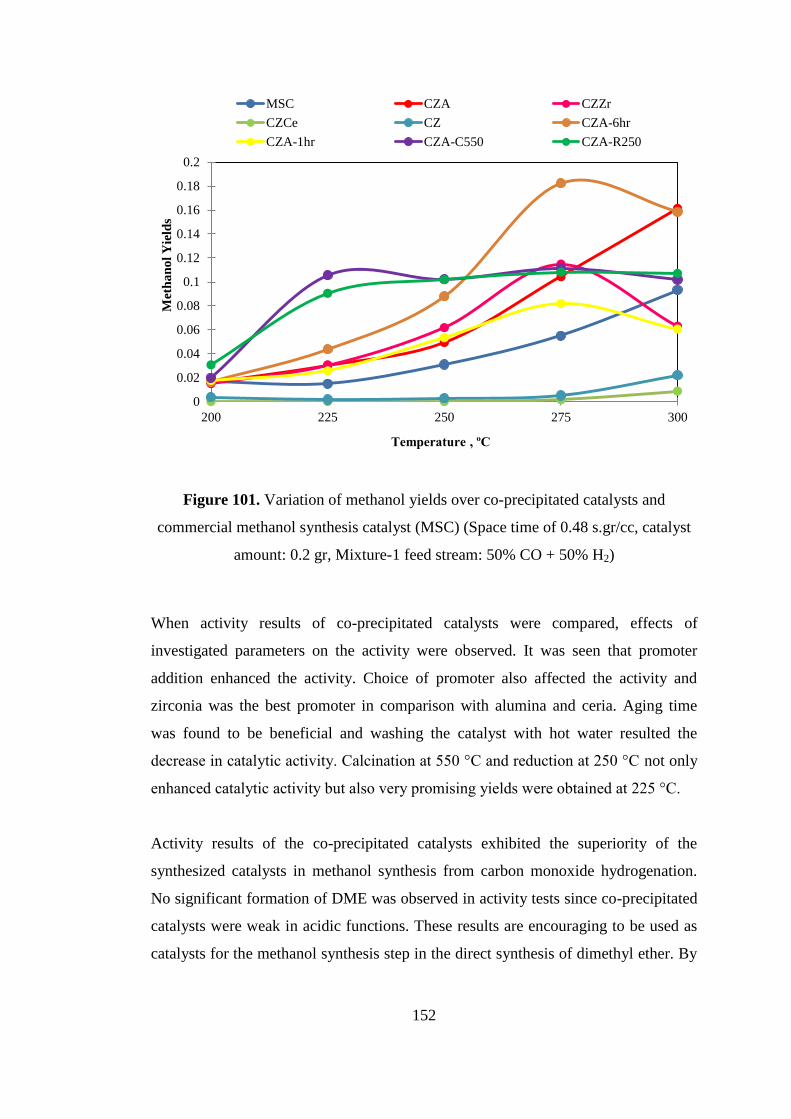
152
Figure 101. Variation of methanol yields over co-precipitated catalysts and
commercial methanol synthesis catalyst (MSC) (Space time of 0.48 s.gr/cc, catalyst
amount: 0.2 gr, Mixture-1 feed stream: 50% CO + 50% H2)
When activity results of co-precipitated catalysts were compared, effects of
investigated parameters on the activity were observed. It was seen that promoter
addition enhanced the activity. Choice of promoter also affected the activity and
zirconia was the best promoter in comparison with alumina and ceria. Aging time
was found to be beneficial and washing the catalyst with hot water resulted the
decrease in catalytic activity. Calcination at 550 °C and reduction at 250 °C not only
enhanced catalytic activity but also very promising yields were obtained at 225 °C.
Activity results of the co-precipitated catalysts exhibited the superiority of the
synthesized catalysts in methanol synthesis from carbon monoxide hydrogenation.
No significant formation of DME was observed in activity tests since co-precipitated
catalysts were weak in acidic functions. These results are encouraging to be used as
catalysts for the methanol synthesis step in the direct synthesis of dimethyl ether. By
0
0.02
0.04
0.06
0.08
0.1
0.12
0.14
0.16
0.18
0.2
200 225 250 275 300
Met
ha
no
l Y
ield
s
Temperature , ºC
MSC CZA CZZr
CZCe CZ CZA-6hr
CZA-1hr CZA-C550 CZA-R250
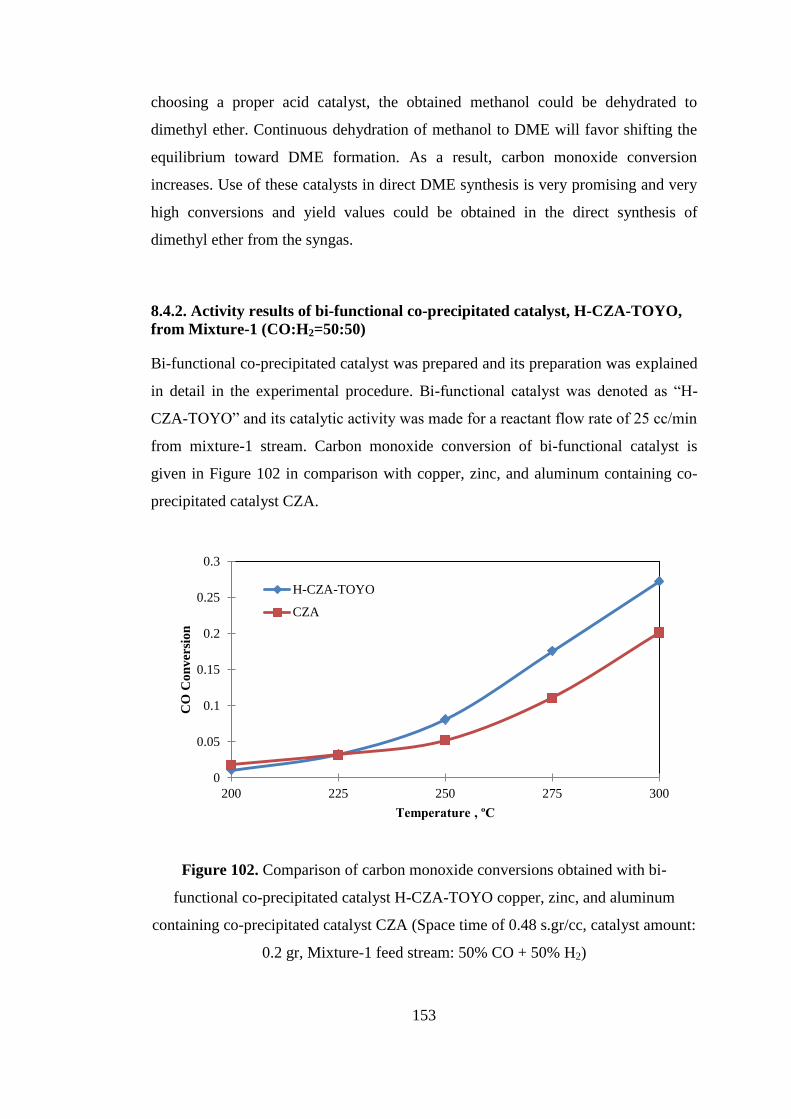
153
choosing a proper acid catalyst, the obtained methanol could be dehydrated to
dimethyl ether. Continuous dehydration of methanol to DME will favor shifting the
equilibrium toward DME formation. As a result, carbon monoxide conversion
increases. Use of these catalysts in direct DME synthesis is very promising and very
high conversions and yield values could be obtained in the direct synthesis of
dimethyl ether from the syngas.
8.4.2. Activity results of bi-functional co-precipitated catalyst, H-CZA-TOYO,
from Mixture-1 (CO:H2=50:50)
Bi-functional co-precipitated catalyst was prepared and its preparation was explained
in detail in the experimental procedure. Bi-functional catalyst was denoted as “H-
CZA-TOYO” and its catalytic activity was made for a reactant flow rate of 25 cc/min
from mixture-1 stream. Carbon monoxide conversion of bi-functional catalyst is
given in Figure 102 in comparison with copper, zinc, and aluminum containing co-
precipitated catalyst CZA.
Figure 102. Comparison of carbon monoxide conversions obtained with bi-
functional co-precipitated catalyst H-CZA-TOYO copper, zinc, and aluminum
containing co-precipitated catalyst CZA (Space time of 0.48 s.gr/cc, catalyst amount:
0.2 gr, Mixture-1 feed stream: 50% CO + 50% H2)
0
0.05
0.1
0.15
0.2
0.25
0.3
200 225 250 275 300
CO
Co
nv
ersi
on
Temperature , ºC
H-CZA-TOYO
CZA
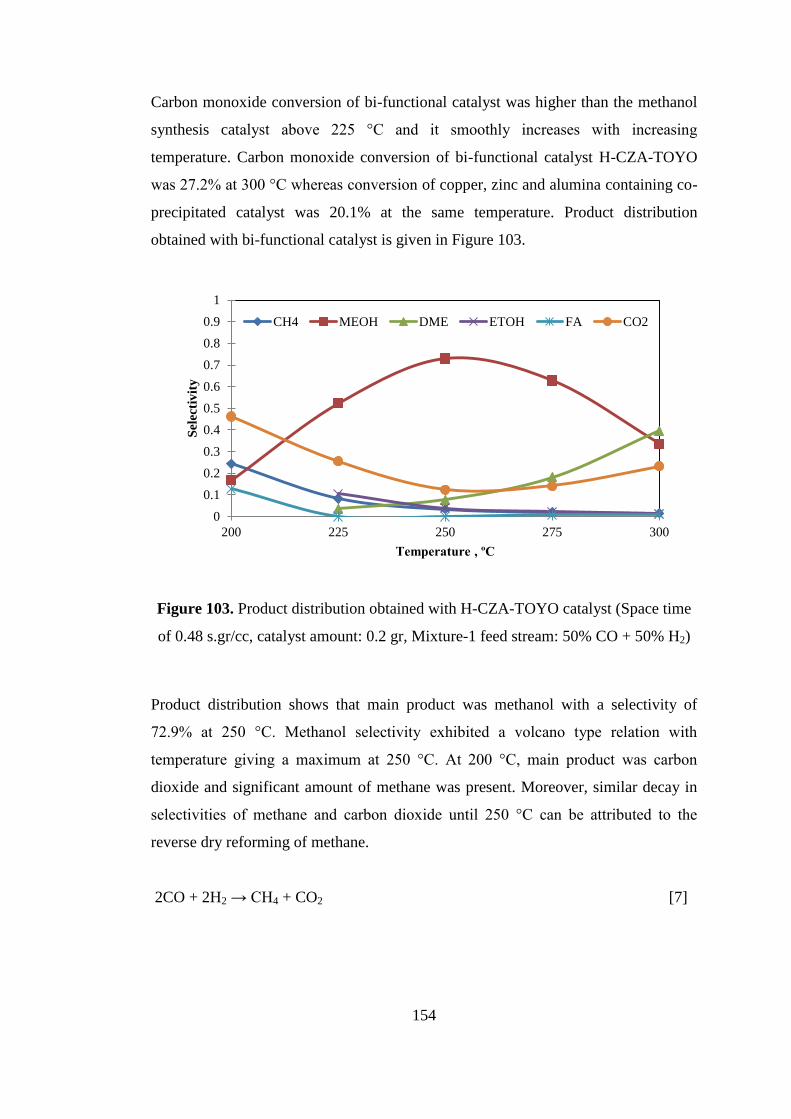
154
Carbon monoxide conversion of bi-functional catalyst was higher than the methanol
synthesis catalyst above 225 °C and it smoothly increases with increasing
temperature. Carbon monoxide conversion of bi-functional catalyst H-CZA-TOYO
was 27.2% at 300 °C whereas conversion of copper, zinc and alumina containing co-
precipitated catalyst was 20.1% at the same temperature. Product distribution
obtained with bi-functional catalyst is given in Figure 103.
Figure 103. Product distribution obtained with H-CZA-TOYO catalyst (Space time
of 0.48 s.gr/cc, catalyst amount: 0.2 gr, Mixture-1 feed stream: 50% CO + 50% H2)
Product distribution shows that main product was methanol with a selectivity of
72.9% at 250 °C. Methanol selectivity exhibited a volcano type relation with
temperature giving a maximum at 250 °C. At 200 °C, main product was carbon
dioxide and significant amount of methane was present. Moreover, similar decay in
selectivities of methane and carbon dioxide until 250 °C can be attributed to the
reverse dry reforming of methane.
2CO + 2H2 → CH4 + CO2 [7]
0
0.1
0.2
0.3
0.4
0.5
0.6
0.7
0.8
0.9
1
200 225 250 275 300
Sel
ecti
vit
y
Temperature , ºC
CH4 MEOH DME ETOH FA CO2
155
After 250 °C, methanol selectivity decreased and dimethyl ether and carbon dioxide
selectivity increased. Since there was no methane at high temperatures and carbon
dioxide formation was showing an increasing trend with dimethyl ether, it was likely
that dimethyl ether was produced from the reaction-1.
3CO + 3H2 → C2H5OH + CO2 [1]
The selectivity ratio of dimethyl ether to carbon dioxide is 2 if reaction-6 occurs
only. At 300 °C, ratio of selectivities was equal to 1.7. Since selectivity ratio is closer
to the ratio obtained with reaction-6, it could be concluded that DME was produced
mostly from reaction-6. However, formation of DME through other reactions was
also possible.
2CO + 4H2 → C2H5OH + H2O [2]
Although bi-functional catalyst had acidic sites to convert produced methanol into
dimethyl ether, conversion to dimethyl ether was not successful. Methanol was the
main product at almost all temperatures. Dimethyl ether formation was first observed
at 225 °C and selectivity of it reached 39.5% at 300 °C which was greater than the
selectivity of methanol. It is clear that acidity of the bi-functional catalyst was not
strong enough to convert methanol into DME, completely. Drift spectra of pyridine
adsorption also confirmed the low acidity of bi-functional catalyst as shown in
Figure 34
To enhance the catalytic activity of bi-functional H-CZA-TOYO catalyst in direct
synthesis of DME, experimental procedure should be modified so as to increase the
acidity. This could be done by changing the weight percentages of methanol
dehydration component to methanol synthesis one. Moreover, presence of carbon
dioxide in the feed gas inhibits the reverse methane dry reforming and less amount of
carbon dioxide forms.
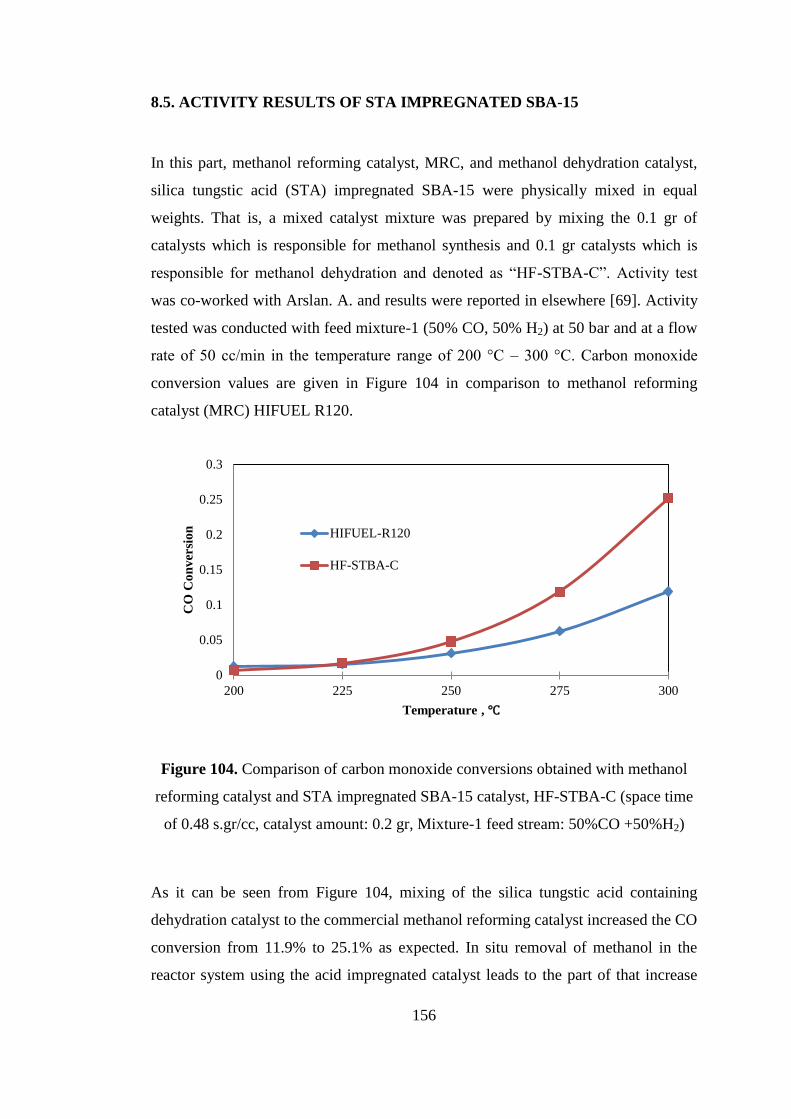
156
8.5. ACTIVITY RESULTS OF STA IMPREGNATED SBA-15
In this part, methanol reforming catalyst, MRC, and methanol dehydration catalyst,
silica tungstic acid (STA) impregnated SBA-15 were physically mixed in equal
weights. That is, a mixed catalyst mixture was prepared by mixing the 0.1 gr of
catalysts which is responsible for methanol synthesis and 0.1 gr catalysts which is
responsible for methanol dehydration and denoted as “HF-STBA-C”. Activity test
was co-worked with Arslan. A. and results were reported in elsewhere [69]. Activity
tested was conducted with feed mixture-1 (50% CO, 50% H2) at 50 bar and at a flow
rate of 50 cc/min in the temperature range of 200 °C – 300 °C. Carbon monoxide
conversion values are given in Figure 104 in comparison to methanol reforming
catalyst (MRC) HIFUEL R120.
Figure 104. Comparison of carbon monoxide conversions obtained with methanol
reforming catalyst and STA impregnated SBA-15 catalyst, HF-STBA-C (space time
of 0.48 s.gr/cc, catalyst amount: 0.2 gr, Mixture-1 feed stream: 50%CO +50%H2)
As it can be seen from Figure 104, mixing of the silica tungstic acid containing
dehydration catalyst to the commercial methanol reforming catalyst increased the CO
conversion from 11.9% to 25.1% as expected. In situ removal of methanol in the
reactor system using the acid impregnated catalyst leads to the part of that increase
0
0.05
0.1
0.15
0.2
0.25
0.3
200 225 250 275 300
CO
Co
nv
ersi
on
Temperature , ℃
HIFUEL-R120
HF-STBA-C
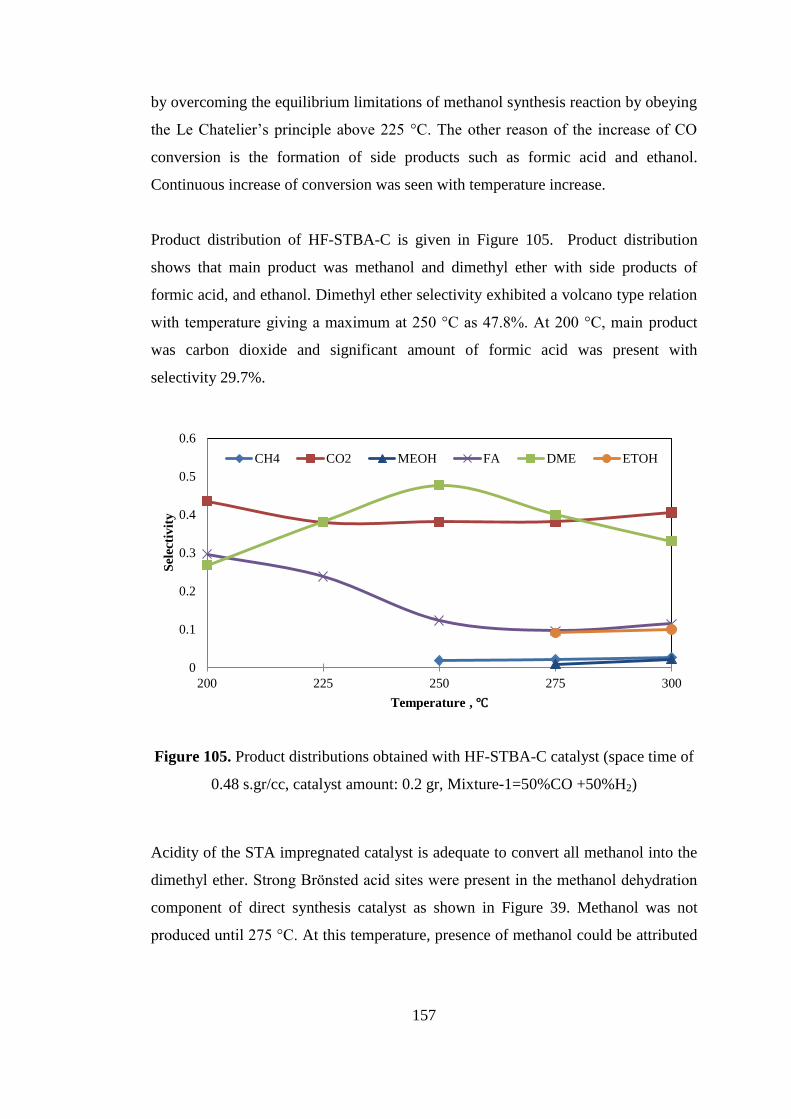
157
by overcoming the equilibrium limitations of methanol synthesis reaction by obeying
the Le Chatelier‟s principle above 225 °C. The other reason of the increase of CO
conversion is the formation of side products such as formic acid and ethanol.
Continuous increase of conversion was seen with temperature increase.
Product distribution of HF-STBA-C is given in Figure 105. Product distribution
shows that main product was methanol and dimethyl ether with side products of
formic acid, and ethanol. Dimethyl ether selectivity exhibited a volcano type relation
with temperature giving a maximum at 250 °C as 47.8%. At 200 °C, main product
was carbon dioxide and significant amount of formic acid was present with
selectivity 29.7%.
Figure 105. Product distributions obtained with HF-STBA-C catalyst (space time of
0.48 s.gr/cc, catalyst amount: 0.2 gr, Mixture-1=50%CO +50%H2)
Acidity of the STA impregnated catalyst is adequate to convert all methanol into the
dimethyl ether. Strong Brönsted acid sites were present in the methanol dehydration
component of direct synthesis catalyst as shown in Figure 39. Methanol was not
produced until 275 °C. At this temperature, presence of methanol could be attributed
0
0.1
0.2
0.3
0.4
0.5
0.6
200 225 250 275 300
Sel
ecti
vit
y
Temperature , ℃
CH4 CO2 MEOH FA DME ETOH
158
to the activity loss of the methanol dehydration component. Coking of the acidic
catalyst could be one of the main reasons for the deactivation [24].
For all the temperatures, significant amount of carbon dioxide was present.
Formation of carbon dioxide could follow water gas shift reaction (reaction 5) and
direct synthesis of DME reaction (reaction-1).
CO + H2O → CO2 + H2 [5]
3 CO + 3 H2 → DME + CO2 [1]
To prevent the enormous amount of carbon dioxide in the product stream, carbon
dioxide could be added to the feed in small amount. By this way, it would prevent
the formation of carbon dioxide simply by Le chatelier principle.
159
CHAPTER 9
CONCLUSIONS
9. CONCLUSIONS
In this study, dimethyl ether, which is an excellent green diesel fuel alternate, was
synthesized successfully by direct synthesis route from the synthesis gas. For this
purpose, novel catalytic materials for methanol synthesis, methanol dehydration, and
direct synthesis of DME from syngas were synthesized and commercial catalysts
were also used. In catalyst synthesis; co-precipitation, one-pot hydrothermal
synthesis and impregnation methods were applied. Catalyst beds were prepared
either by physical mixing of methanol synthesis component with methanol
dehydration component or by loading them in series to the fixed bed flow reactor
operating at 50 bar. In the case of bi-functional catalysts, catalyst bed was composed
of only one catalyst since active sites necessary for the direct synthesis of DME was
already present. Catalysts were characterized by XRD, N2 physisorption, EDS, SEM
and DRIFTS of pyridine adsorption. Activity tests were carried out at 50 bar and in a
temperature range of 200 °C – 400 °C from two different compositions of feed gas,
namely mixture-1 and mixture-2. Mixture-1 was an equimolar composition of CO
and H2 and Mixture-2 was composed of CO, CO2 and H2 with a composition
CO:CO2:H2=40:10:50.
Characterization results indicated that catalysts were synthesized successfully.
Catalysts with very narrow CuO particles as small as 3 nm were obtained and CuO
was reduced completely to Cu by H2 reduction at 250 °C. High temperature
treatments resulted in more crystalline structure with increase in particle sizes due to
160
agglomeration and decrease in surface area due to thermal sintering was also
observed. Rod-like morphologies were obtained as shown by SEM images. For the
one-pot hydrothermally synthesized materials, very high surface areas such as 800
m2/g were obtained by the SBA-15 and impregnation of STA was successful. Upon
impregnation, decrease on the surface areas was observed due to pore blockage.
However, mesoporous structure was still retained as reflected by adsorption-
desorption isotherms. In addition to synthesized catalysts, characterization studies of
the commercial catalysts were also conducted and results showed that similar
morphologies and textural properties were obtained with the synthesized catalysts.
Activity results of the co-precipitated catalysts exhibited the superiority of the
synthesized catalysts in methanol synthesis from carbon monoxide hydrogenation.
Methanol was synthesized from synthesis gas with very high yield and selectivity
values. Aging time, promoter additions, high calcination temperature and reduction
with hydrogen enhanced the catalytic activity whereas washing with hot water
decreased the catalytic activity. Based on the co-precipitation activity results, best
catalyst would be the combination of catalyst preparation parameters of zirconia
promoted, 6 hours aged, cold water washed, 550 °C calcined and 250 °C reduced.
Co-precipitated methanol synthesis catalysts were more active than commercial
methanol synthesis and methanol reforming catalysts in terms of both selectivity and
conversions in carbon monoxide hydrogenation. These results are encouraging to be
used as catalysts for the methanol synthesis step in the direct synthesis of dimethyl
ether. When used with a proper acid catalyst, continuous dehydration of methanol to
DME will favor shifting the equilibrium toward DME formation and as a result,
carbon monoxide conversion will increase. Furthermore, bi-functional co-
precipitated catalyst, H-CZA-TOYO, did not function very well in the catalytic
conversion of methanol to DME due to low acidity. However, CO conversion
increase was observed by in-situ conversion of produced methanol to DME.
Results proved that, with the bi-functional catalyst TRC-75(L)-C, HF-AL-C, and
STA impregnated SBA-15, very high DME yield values were obtained in direct
161
synthesis of DME from syngas. The performance of the tungsto silisic acid
incorporated mesoporous catalyst TRC-75(L) developed in our laboratory was better
than the conventional γ-alumina catalyst for the dehydration function of bi-functional
catalyst. Higher DME selectivity values were obtained with the TRC-75(L)-C and
STA@SBA-15 than the bi-functional catalyst composed of commercial Cu-Zn-
alumina and γ-alumina.
Results indicated that presence of CO2 in the feed stream was shown to have a
positive effect on DME selectivity. DME selectivity reached very high values in a
temperature range of 250 °C - 275 °C, in the presence of CO2 (Mixture-2). However,
in the absence of CO2 in the feed stream (Mixture-1), DME selectivity was decreased
in the same temperature range. Results indicated that some CO2 was also converted
to DME at temperatures lower than 250°C. Apparently, in the absence of CO2 in the
feed stream, DME was essentially produced through Reaction 1, in which DME and
CO2 are the products. However, presence of CO2 in the feed stream (Mixture-2),
shifted DME formation through Reaction 2, in which water was formed, together
with DME. Presence of CO2 in the feed stream not only enhanced the catalytic
activity but also utilization of the most important greenhouse gas was also
accomplished.
3CO + 3H2 → CH3OCH3 + CO2 [1]
2CO + 4H2 → CH3OCH3 + H2O [2]
Comparison of activity results of DME synthesis obtained by using the bi-functional
system, which was composed of methanol reforming catalyst and TRC-75(L)
methanol dehydration catalyst, with the results obtained in a system in which these
catalysts were charged to the reactor in series, clearly showed the advantages of in-
situ conversion of produced methanol to DME. The bi-functional catalytic system
prepared in this work functioned very well in DME synthesis directly from synthesis
gas. It was concluded that direct synthesis of DME from synthesis gas had significant
superiorities in terms of CO conversion and DME yield, over the two step process,

162
involving methanol synthesis and dehydration reactions taking place in consecutive
reactors.
Use of these catalysts in direct DME synthesis is very promising and very high
conversions and yield values could be obtained in the direct synthesis of dimethyl
ether from the syngas.
163
REFERENCES
REFERENCES
[1] Olah G.A., Goeppert A., Prakash G.K.S., Chemical Recycling of Carbon
Dioxide to Methanol and Dimethyl Ether: From Greenhouse Gas to
Renewable, Environmentally Carbon Neutral Fuels and Synthetic
Hydrocarbons, Journal of Organic Chemistry, 74:487-498, 2009.
[2] Dogu T., Varisli D., Alcohols as Alternatives to Petroleum for
Environmentally Clean Fuels and Petrochemicals, Turkish Journal of
Chemistry, 31:551-567, 2007.
[3] Yoon E.S., Han C., A Review of Sustainable Energy-Recent Development
and Future Prospects of Dimethyl Ether (DME), 10th
International
Symposium on Process System Engineering, PSE2009, 169-175, 2009.
[4] Semelsberger T.A., Borup R.L., Greene H.L., Dimethyl ether (DME) as an
Alternative Fuel, Journal of Power Sources, 156:497-511, 2006.
[5] Fleisch T.H., Basu A., Gradassi M.J., Masin J.G., Dimethyl ether: a Fuel for
the 21st Century, Natural Gas Conversion IV, Studies in Surface Science and
Catalysis, 107:117-125, 1997.
[6] Taupy J.A., DME , a New Energy Carrier, Global Forum: Flaring Reduction
and Gas Utilisation, 2006.
[7] Olah, G.A., Goeppert, A., Prakash, G.K.S., Beyond Oil and Gas: The
Methanol Economy, Wiley-VCH, Weinheim, 2006.
[8] Arınan, A., Direct Synthesis of Dimethyl Ether (DME) from Synthesis Gas
Using Novel Catalysts, M. Sc. Thesis, Middle East Technical University,
Ankara, January 2010.
164
[9] Dme applications. Retrieved from
http://www.aboutdme.org/index.asp?bid=219
[10] Dimethyl Ether Technology and Markets, Nexant, PERP07/08-S3, December
2008.
[11] Serov A., Kwak C, Progress in Development of Direct Dimethyl Ether Fuel
Cells, Applied Catalysis B: Environmental, 91:1-10, 2010.
[12] Yoon E.S., Han C., A Review of Sustainable Energy - Recent Development
and Future Prospects of Dimethyl Ether (DME), 10th
International
Symposium on Process System Engineering – PSE2009:169-175, 2010.
[13] Ogawa T., Inoue N., Shikada T., Inokoshi O., Ohno Y., Direct Dimethyl
Ether (DME) Synthesis from Natural Gas, Studies in Surface Science and
Catalysis, 147:379-384, 2004.
[14] Zhang Y., Fei J., Yu Y., Zheng X., Methanol Synthesis from CO2
Hydrogenation over Cu Based Catalyst Supported on Zirconia Modified ɣ-
Al2O3, Energy Conversion and Management, 47:3360-3367, 2006.
[15] Sun, K., Lu W., Wang M., Xu X., „Low-temperature synthesis of DME from
CO2/H2 over Pd-modified CuO–ZnO–Al2O3–ZrO2/HZSM-5 catalysts,
Catalyst Communications, 5:367-370, 2004.
[16] Yoo K.S., Kim J.H., Park M.J., Kim S.J., Joo O.S., Jung K.D., Influence of
Solid Acid Catalyst on DME Production Directly from Synthesis Gas Over
the Admixed Catalyst of Cu/ZnO/Al2O3 and Various SAPO Catalysts Applied
Catalysis A: General, 330:57-62, 2007.
[17] Mao D., Yang W., Xia J., Zhang B., Lu G., The Direct Synthesis of Dimethyl
Eher from Syngas Over Hybrid Catalysts With Sulfate-modified γ-alumina as
Methanol Dehydration Components, Journal of Molecular Catalysis A:
Chemical, 250:138-144, 2006.
[18] Sofianos A.C., Scurrell M.S., Conversion of Synthesis Gas to Dimethyl Ether
Over Bifunctional Catalytic Systems, Ind. Eng. Chem. Res., 30:2372-2378,
1991.
165
[19] Sun K., Lu W., Qiu F., Liu S., Xu X., Direct Synthesis of DME Over
Bifunctional Catalyst: Surface Properties and Catalytic Performance, Applied
Catalysis A: General, 252:243-249, 2003.
[20] Sierra I., Erena J., Aguayo A.T., Arandes J.M., Bilbao J., Regeneration of
CuO-ZnO-Al2O3/ɣ-Al2O3 Catalyst in the Direct Synthesis of Dimethyl Ether,
Applied Catalysis B: Environmental 94:108-116, 2010.
[21] Tijm P.J.A., Waller F.J., Brown D.M., Methanol Technology Developments
for the New Millenium, Applied Catalysis A: General, 221:275-282, 2001.
[22] Klier K., Beretta A., Sun Q., Feeley O. C., Herman R. G., Catalytic Synthesis
of Methanol, Higher Alcohols and Ethers, Catalysis Today, 36:3-14, 1997.
[23] Hansen, J.B., Højlund Nielsen P.E, Methanol Synthesis, Handbook of
Heterogeneous Catalysis, 2920–2949, 2008.
[24] Twigg, M. V., Spencer, M. S., Deactivation of Supported Copper Metal
Catalysts for Hydrogenation Reactions, Appl. Catal. A: Gen., 212:161, 2001.
[25] Arena F., Italiano G., Barbera K., Bonura G., Spadaro L., Frusteri F., Basic
Evidences for Methanol-Synthesis Catalyst Design, Catalysis Today, 143:80-
85, 2009.
[26] Saito M., Fujitani T., Takeuchi M., Watanabe T., Development of
Copper/zinc Oxide-based Multicomponent Catalysts for Methanol Synthesis
from Carbon Dioxide and Hydrogen, Applied Catalysis A: General, 138:311-
318, 1996.
[27] Meshkini F., Taghizadeh M., Bahmani M., Investigating the Effect of Metal
Oxide Additives on the Properties of Cu/ZnO/Al2O3 Catalysts in Methanol
Synthesis from Syngas Using Factorial Experimental Design, Fuel, 89:170-
175, 2010.
[28] Dai W.L., Sun Q., Deng J.F., Wu D., Sun Y.H., XPS studies of
Cu/ZnO/Al2O3 Ultra-fine Catalysts Derived by a Novel Gel Oxalate Co-
precipitation for Methanol Synthesis by CO2+H2, Applied Surface Science,
177:172-17, 2001.
166
[29] Spencer M.S., The role of zinc oxide in Cu/ZnO Catalysts for Methanol
Synthesis and the Water-gas Shift Reaction, Topics in Catalysis, 8:259-266,
1999.
[30] Ma Y., Sun Q., Wu D., Fan W.H., Zhang Y.L., Deng J.F., A Practical
Approach for the Preparation of High Activity Cu/ZnO/ZrO2 Catalyst for
Methanol Synthesis from CO2 Hydrogenation, Applied Catalysis A: General,
171:45-55, 1998.
[31] Raudaskoski R., Niemela M.V., Keiski R.L., The Effect of Ageing Time on
Co-precipitated Cu/ZnO/ZrO2 Catalysts Used in Methanol Synthesis from
CO2 and H2, Topics in Catalysis, 45:57-60, 2007.
[32] Sun K., Lu W., Qiu F., Liu S., Xu X., Direct synthesis of DME Over
Bifunctional Catalyst: Surface Properties and Catalytic Performance, Applied
Catalysis A: General, 252:243-249, 2003.
[33] Flores J.H., Peixoto D.P.B., Appel L.G., Avillez R.R., Pais da Silva M.I., The
Influence of Different Methanol Synthesis Catalysts on Direct Synthesis of
DME from Syngas, Catalysis Today, 172:218-225, 2011.
[34] Słoczynski J., Grabowski R., Olszewski P., Kozłowska A., Stoch J.,
Lachowska M., Skrzypek J., Effect of Metal Oxide Additives on the Activity
and Stability of Cu/ZnO/ZrO2 Catalysts in the Synthesis of Methanol from
CO2 and H2, Applied Catalysis: A General, 310:127-137, 2006.
[35] Shen W.J., Ichihashi Y., Matsumura Y., Low Temperature Methanol
Synthesis from Carbon Monoxide and Hydrogen Over Ceria Supported
Copper Catalyst, Applied Catalysis A: General, 282:221-226, 2005.
[36] Pokrovski Konstantin A., Rhodes M.D., Bell A.T., Effects of Cerium
Incorporation into Zirconia on the Activity of Cu/ZrO2 for Methanol
Synthesis via CO Hydrogenation, Journal of Catalysis, 235:368-377, 2005.
[37] Kaluza, S., Behrens, M., Schiefenhövel N., Kniep B., Fischer R., Schlögl R.
and Muhler M., A Novel Synthesis Route for Cu/ZnO/Al2O3 Catalysts Used
in Methanol Synthesis: Combining Continuous Consecutive Precipitation
with Continuous Aging of the Precipitate, Chem. Cat. Chem., 3: 189–
199,2011.
167
[38] Guo X., Mao D., Lu G., Wang S., Wu G., Glycine-nitrate Combustion
Synthesis of CuO-ZnO-ZrO2 Catalysts for Methanol Synthesis from CO2
Hydrogenation, Journal of Catalysis, 271:178-185, 2010.
[39] Kim J.-H., Park M.J., Kim S.J., Joo O.-S., Jung K.-D., DME Synthesis from
Synthesis Gas on the Admixed Catalysts of Cu/ZnO/Al2O3 and ZSM-5,
Applied Catalysis A: General 264:37-41, 2004.
[40] Yaripour F., Mollavali M., Mohammadi Jam Sh., Atashi H., Catalytic
Dehydration of Methanol to Dimethyl Ether Catalyzed by Aluminum
Phosphate Catalysts, Energy&Fuels, 23:1896-1900, 2009.
[41] Yaripour F., Baghaei F., Schmidt I., Perregaard J., Synthesis of Dimethyl
Ether from Methanol Over Aluminum Phosphate and Silica–Titania
Catalysts, Catalysis Communications, 6:542-549, 2005.
[42] Khaleel A., Methanol Dehydration to Dimethyl Ether over Highly Porous
Xerogel Alumina Catalyst: Flow Rate Effect, Fuel Processing Technology,
91:1505-1509, 2010.
[43] Fu Y., Hong T., Chen J., Auroux A., Shen J., Surface Acidity and the
Dehydration of Methanol to Dimethyl Ether, Thermochimica Acta, 434:22-
26, 2005.
[44] Vishwanathan V., Jun K.W., Kim J.W., Roh H.S., Vapour Phase Dehydration
of Crude Methanol to Dimethyl Ether Over Na-modified H-ZSM-5 Catalysts,
Applied Catalysis A: General, 276:251-255, 2004.
[45] Tokay K.C., Dogu T., Dogu G., Dimethyl Ether Synthesis Over Alumina
Based Catalyst, Chemical Engineering Journal, 184:278-285, 2012.
[46] Xu, M., Lunsford, J.H., Goodman, D.W., Synthesis of Dimethyl Ether (DME)
from Methanol over Solid-acid Catalysts, Applied Catalysis A: General, 149:
289-301, 1997.
[47] Çiftçi A., Sezgi N.A., Dogu T., Nafion incorporated silicate structured
Nanocomposites Catalysts for DME Synthesis, Ind. Eng. Chem. Res.,
49:6756-6752, 2010.
168
[48] Ciftci A., Varisli D., Dogu T, Dimethyl Ether Synthesis over Novel
Silicotungstic Acid Incorporated Nanostructured Catalysts, Int. J. Chemical
Reactor Eng, 8, A45, 2010.
[49] Sandler S.I., Chemical and Engineering Thermodynamics, 3th Ed., Wiley,
New York, 1999.
[50] Wijngaarden R.J., Kronberg A., Westerterp K.R., Industrial Catalysis
Optimizing Catalysts and Processes, Wiley-vch, 1998.
[51] Haber J., Block J.H., Delmon, B.,Methods and Procedures for Catalysts
Characterization, Handbook of Heterogeneous Catalysis, Wiley-VCH Verlag
GmbH, Weinheim, Germany., 1230-1232, 2008.
[52] Perego C., Villa P., Catalyst Preparation Methods, Catalysis Today, 34:281-
305, 1994.
[53] Schüth, F., Hesse, M. and Unger K. K., Precipitation and Co-precipitation:
Handbook of Heterogeneous Catalysis, 100–119, 2008.
[54] Baerns M., Basic Principles in Applied Catalysis, New York, Springer -
Verlag, 2004.
[55] Sener C., Synthesis and Characterization of Pd-MCM Type Mesoporous
Nanocomposite Materials, M. Sc. Thesis, Middle East Technical University,
January 2006.
[56] Kleitz F., Ordered Mesoporous Materials, Handbook of Heterogeneous
Catalysis, 178–219, 2008.
[57] Kresge, C.T., Leonowicz, M.E., Roth W.J., Varuli J.C., Beck, J.S. Ordered
Mesporous Molecular Sieves Synthesized by a Liquid Crystal Template
Mechanism, Nature, 359:710, 1992.
[58] Gucbilmez Y., Dogu T., Balci S., Ethylene and Acetaldehyde Production by
Selective Oxidation of Ethanol Using Mesoporous V-MCM-41 Catalysts. Ind.
Eng. Chem. Res., 45:3496, 2006.
169
[59] Varisli D., Dogu T., Dogu G., Novel Mesoporous Nanocomposite WOx-
Silicate Acidic Catalysts: Ethylene and DEE from Ethanol, Ind. Eng. Chem.
Res., 48:9394, 2009.
[60] Varisli D., Dogu T., Dogu G, Petrochemicals from Ethanol over a W-Si-
based Nanocomposite Bidisperse Solid Acid Catalyst, Chem. Eng. Sci., 65,
153, 2010.
[61] Varisli D., Dogu T., Dogu G. Silicotungstic Acid Impregnated MCM-41-Like
Mesoporous Solid Acid Catalysts for Dehydration of Ethanol, Ind. Eng.
Chem. Res., 47:4071, 2008.
[62] Zhao D., Jianglin F., Qisheng H., Melosh N., Fredrickson G. H., Chmelka B.
F., Stucky G. D., Triblock Copolymer Syntheses of Mesoporous Silica with
Periodic 50 to 300 Angstrom Pores, Science, 279:548-552, 1998.
[63] Aktas O., Yasyerli S., Dogu T., Dogu G., Structural Variations of MCF and
SBA-15-like Mesoporous Materials as a Result of Differences in Synthesis
Solution pH, Materials Chemistry and Physics, 131:151-159, 2011.
[64] Chorkendorff I., Niemantsverdriet J.W., Concept of Modern Catalysis and
Kinetics, 2nd
ed., Wiley-VCH, 2007.
[65] Yao N., Synthesis and Characterization of Pt/Sn-MCM-41 Petroleum
Reforming Catalysts, PhD Thesis, Yale University, January 2002.
[66] Singh K.S.W., Neimark A.V., Thommes M., Characterization of Solid
Catalysts: Handbook of Heterogeneous Catalysis, Wiley-VCH Verlag GmbH,
Weinheim, 721-725, 2008.
[67] Walker , C. Surface science techniques. Retrieved from
http://www.uksaf.org/tech/ftir.html
[68] Arslan A., Direct synthesis of DME from Syngas, ChE499-Topics in
Chemical Engineering, Middle East Technical University, January 2012.
[69] Mbaraka I.K., Shanks B.H., Design of multifunctionalized mesoporous silicas
for esterification of fatty acid, Journal of Catalysis, 229:365-373, 2005.
170
[70] Varışlı D., Kinetic Studies for Dimethyl Ether and Diethyl Ether Production,
PhD. Thesis, Middle East Technical University, Ankara, September 2007.
[71] Tennyson W., X-Ray Diffraction: The Basics Followed by a few Examples of
Data Analysis, Nanolab/NSF NUE/Bumm, 2005.
[72] Damyanova S., Fierro J.L., Sobrados I., Sanz J., Surface Behavior of
Supported 12-Heteropoly Acid As Revealed by Nuclear Magnetic Resonance,
X-ray Photoelectron Spectroscopy and Fourier Transform Infrared
Techniques, Langmuir, 15(2):469-476, 1999.
[73] Vanden Bussche K.M., Froment G.F., A Steady State Kinetic Model for
Methanol Synthesis and the Water Gas Shift Reaction on a Commercial
Cu/ZnO/Al2O3 Catalyst, J. Catal., 161:1-10, 1996.
[74] Erena J., Sierra I., Olazar M., Gayubo A.G., Aguayo A.T., Deactivation of a
CuO-ZnO-Al2O3/γ-Al2O3 Catalyst in the Synthesis of Dimethyl Ether, Ind.
Eng. Chem. Res., 47:2238-2247, 2008.

171
APPENDICES
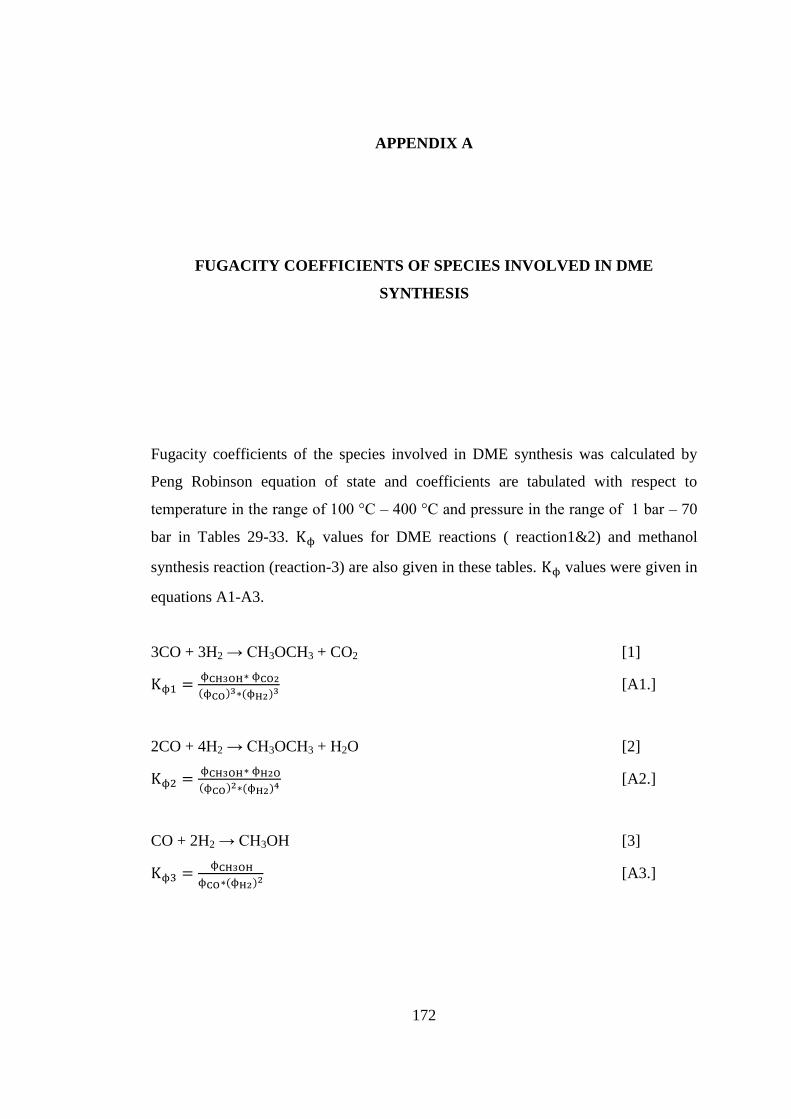
172
APPENDIX A
FUGACITY COEFFICIENTS OF SPECIES INVOLVED IN DME
SYNTHESIS
A. FUGACITY COEFFICIENTS OF SPECIES INVOLVED IN DME
SYNTHESIS
Fugacity coefficients of the species involved in DME synthesis was calculated by
Peng Robinson equation of state and coefficients are tabulated with respect to
temperature in the range of 100 °C – 400 °C and pressure in the range of 1 bar – 70
bar in Tables 29-33. values for DME reactions ( reaction1&2) and methanol
synthesis reaction (reaction-3) are also given in these tables. values were given in
equations A1-A3.
3CO + 3H2 → CH3OCH3 + CO2 [1]
( ) ( ) [A1.]
2CO + 4H2 → CH3OCH3 + H2O [2]
( ) ( ) [A2.]
CO + 2H2 → CH3OH [3]
( ) [A3.]
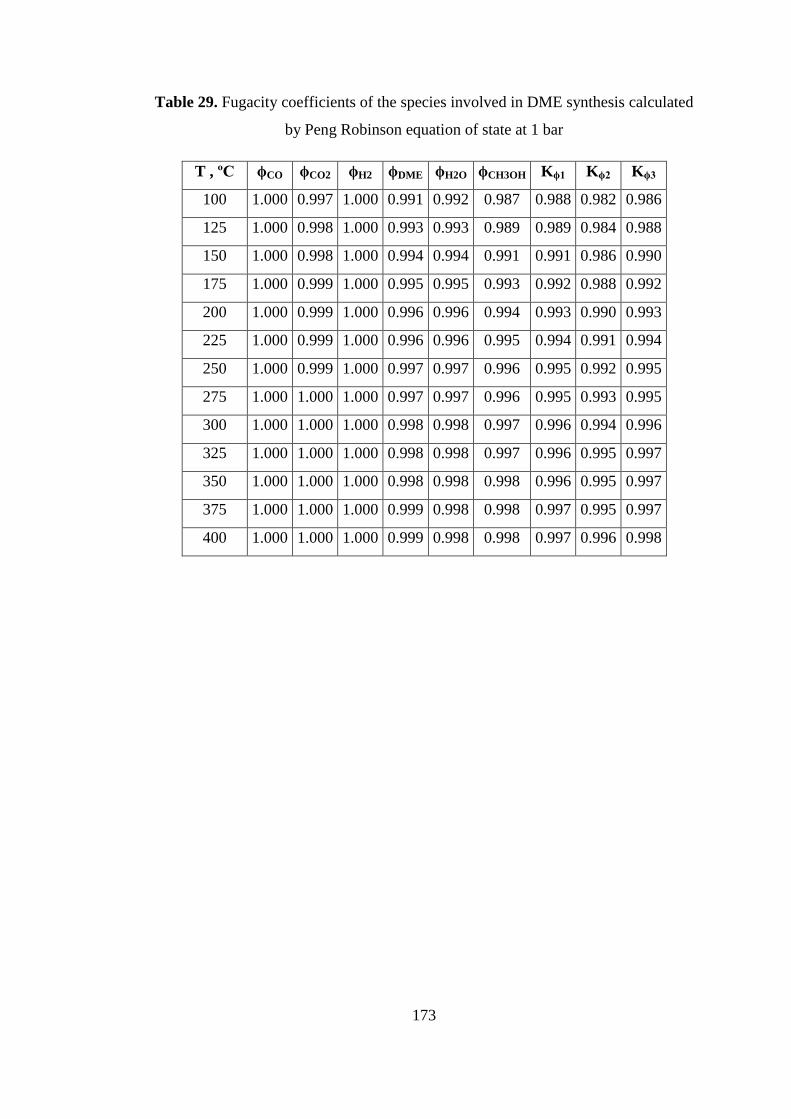
173
Table 29. Fugacity coefficients of the species involved in DME synthesis calculated
by Peng Robinson equation of state at 1 bar
T , ºC ϕCO ϕCO2 ϕH2 ϕDME ϕH2O ϕCH3OH Kϕ1 Kϕ2 Kϕ3
100 1.000 0.997 1.000 0.991 0.992 0.987 0.988 0.982 0.986
125 1.000 0.998 1.000 0.993 0.993 0.989 0.989 0.984 0.988
150 1.000 0.998 1.000 0.994 0.994 0.991 0.991 0.986 0.990
175 1.000 0.999 1.000 0.995 0.995 0.993 0.992 0.988 0.992
200 1.000 0.999 1.000 0.996 0.996 0.994 0.993 0.990 0.993
225 1.000 0.999 1.000 0.996 0.996 0.995 0.994 0.991 0.994
250 1.000 0.999 1.000 0.997 0.997 0.996 0.995 0.992 0.995
275 1.000 1.000 1.000 0.997 0.997 0.996 0.995 0.993 0.995
300 1.000 1.000 1.000 0.998 0.998 0.997 0.996 0.994 0.996
325 1.000 1.000 1.000 0.998 0.998 0.997 0.996 0.995 0.997
350 1.000 1.000 1.000 0.998 0.998 0.998 0.996 0.995 0.997
375 1.000 1.000 1.000 0.999 0.998 0.998 0.997 0.995 0.997
400 1.000 1.000 1.000 0.999 0.998 0.998 0.997 0.996 0.998
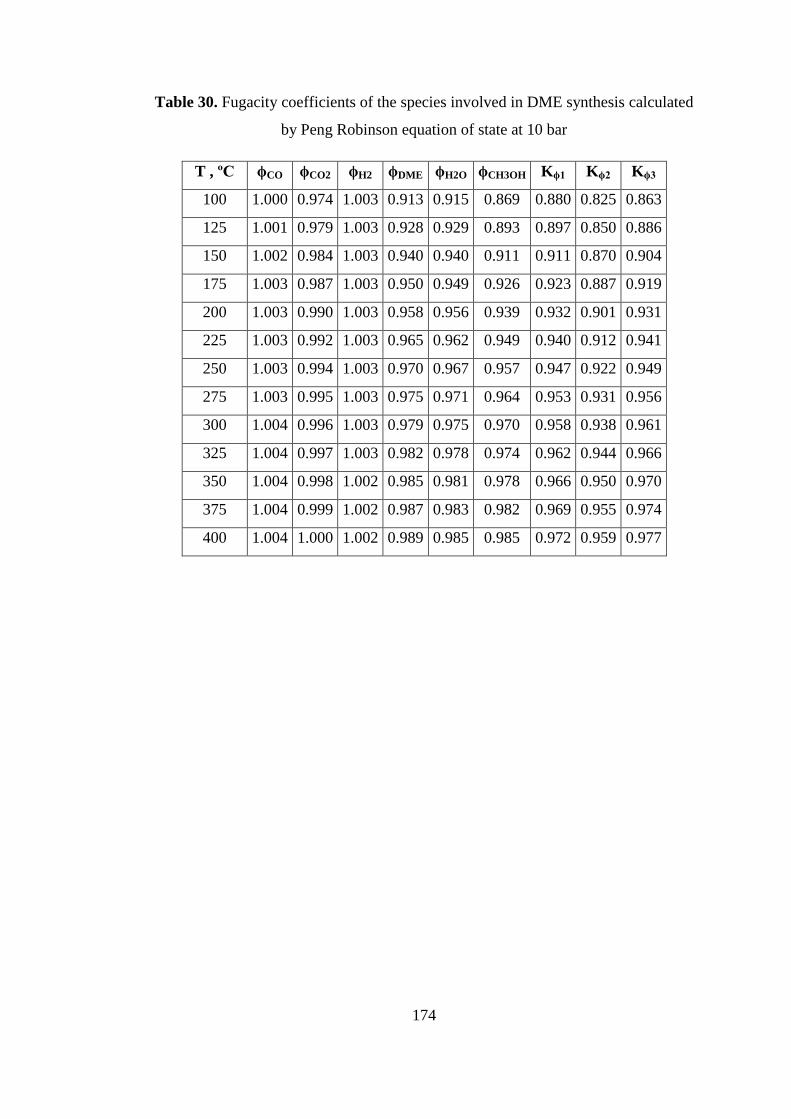
174
Table 30. Fugacity coefficients of the species involved in DME synthesis calculated
by Peng Robinson equation of state at 10 bar
T , ºC ϕCO ϕCO2 ϕH2 ϕDME ϕH2O ϕCH3OH Kϕ1 Kϕ2 Kϕ3
100 1.000 0.974 1.003 0.913 0.915 0.869 0.880 0.825 0.863
125 1.001 0.979 1.003 0.928 0.929 0.893 0.897 0.850 0.886
150 1.002 0.984 1.003 0.940 0.940 0.911 0.911 0.870 0.904
175 1.003 0.987 1.003 0.950 0.949 0.926 0.923 0.887 0.919
200 1.003 0.990 1.003 0.958 0.956 0.939 0.932 0.901 0.931
225 1.003 0.992 1.003 0.965 0.962 0.949 0.940 0.912 0.941
250 1.003 0.994 1.003 0.970 0.967 0.957 0.947 0.922 0.949
275 1.003 0.995 1.003 0.975 0.971 0.964 0.953 0.931 0.956
300 1.004 0.996 1.003 0.979 0.975 0.970 0.958 0.938 0.961
325 1.004 0.997 1.003 0.982 0.978 0.974 0.962 0.944 0.966
350 1.004 0.998 1.002 0.985 0.981 0.978 0.966 0.950 0.970
375 1.004 0.999 1.002 0.987 0.983 0.982 0.969 0.955 0.974
400 1.004 1.000 1.002 0.989 0.985 0.985 0.972 0.959 0.977
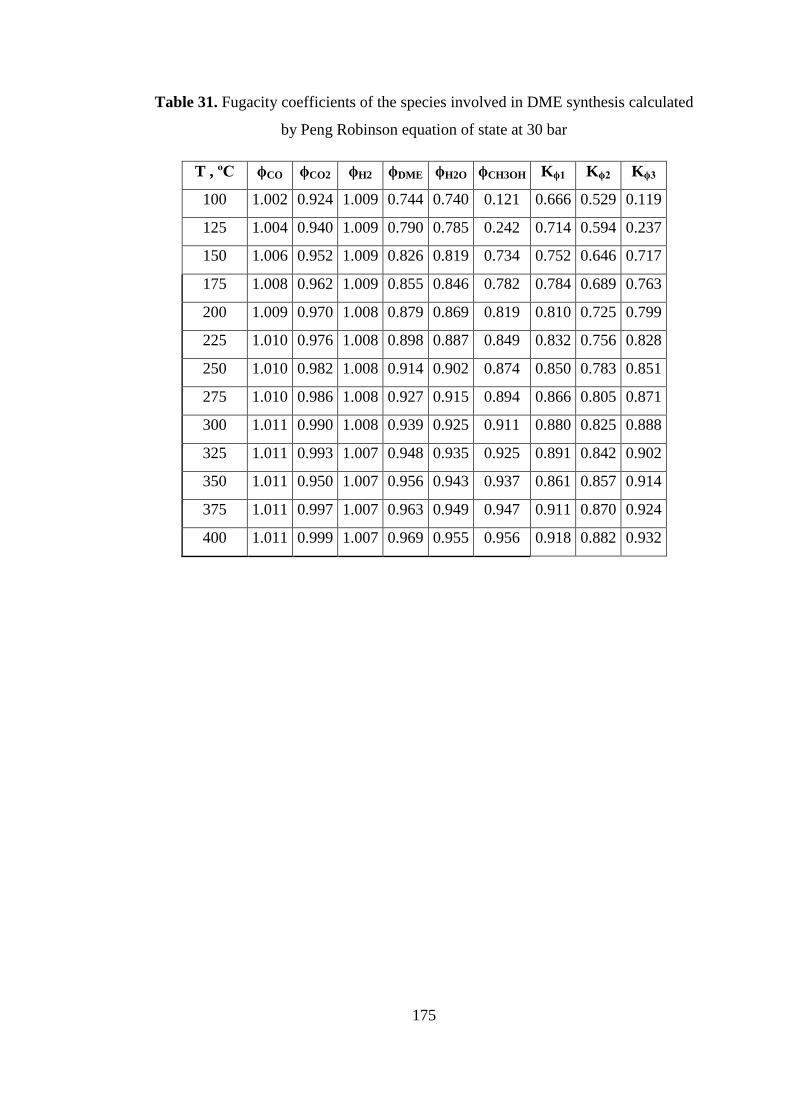
175
Table 31. Fugacity coefficients of the species involved in DME synthesis calculated
by Peng Robinson equation of state at 30 bar
T , ºC ϕCO ϕCO2 ϕH2 ϕDME ϕH2O ϕCH3OH Kϕ1 Kϕ2 Kϕ3
100 1.002 0.924 1.009 0.744 0.740 0.121 0.666 0.529 0.119
125 1.004 0.940 1.009 0.790 0.785 0.242 0.714 0.594 0.237
150 1.006 0.952 1.009 0.826 0.819 0.734 0.752 0.646 0.717
175 1.008 0.962 1.009 0.855 0.846 0.782 0.784 0.689 0.763
200 1.009 0.970 1.008 0.879 0.869 0.819 0.810 0.725 0.799
225 1.010 0.976 1.008 0.898 0.887 0.849 0.832 0.756 0.828
250 1.010 0.982 1.008 0.914 0.902 0.874 0.850 0.783 0.851
275 1.010 0.986 1.008 0.927 0.915 0.894 0.866 0.805 0.871
300 1.011 0.990 1.008 0.939 0.925 0.911 0.880 0.825 0.888
325 1.011 0.993 1.007 0.948 0.935 0.925 0.891 0.842 0.902
350 1.011 0.950 1.007 0.956 0.943 0.937 0.861 0.857 0.914
375 1.011 0.997 1.007 0.963 0.949 0.947 0.911 0.870 0.924
400 1.011 0.999 1.007 0.969 0.955 0.956 0.918 0.882 0.932

176
Table 32. Fugacity coefficients of the species involved in DME synthesis calculated
by Peng Robinson equation of state at 50 bar
T , ºC ϕCO ϕCO2 ϕH2 ϕDME ϕH2O ϕCH3OH Kϕ1 Kϕ2 Kϕ3
100 1.004 0.876 1.015 0.497 0.020 0.075 0.412 0.009 0.073
125 1.008 0.902 1.015 0.654 0.046 0.150 0.551 0.028 0.145
150 1.011 0.922 1.015 0.719 0.094 0.266 0.614 0.062 0.256
175 1.013 0.938 1.015 0.767 0.741 0.427 0.662 0.522 0.410
200 1.015 0.951 1.014 0.805 0.780 0.699 0.702 0.577 0.670
225 1.016 0.962 1.014 0.836 0.812 0.753 0.735 0.622 0.721
250 1.017 0.970 1.013 0.862 0.837 0.794 0.764 0.661 0.760
275 1.018 0.977 1.013 0.883 0.859 0.827 0.788 0.695 0.792
300 1.018 0.983 1.013 0.901 0.877 0.855 0.809 0.725 0.819
325 1.018 0.988 1.012 0.917 0.892 0.878 0.827 0.751 0.841
350 1.018 0.992 1.012 0.930 0.905 0.897 0.843 0.774 0.860
375 1.018 0.996 1.012 0.941 0.916 0.914 0.857 0.794 0.877
400 1.018 0.998 1.012 0.951 0.926 0.928 0.869 0.812 0.891
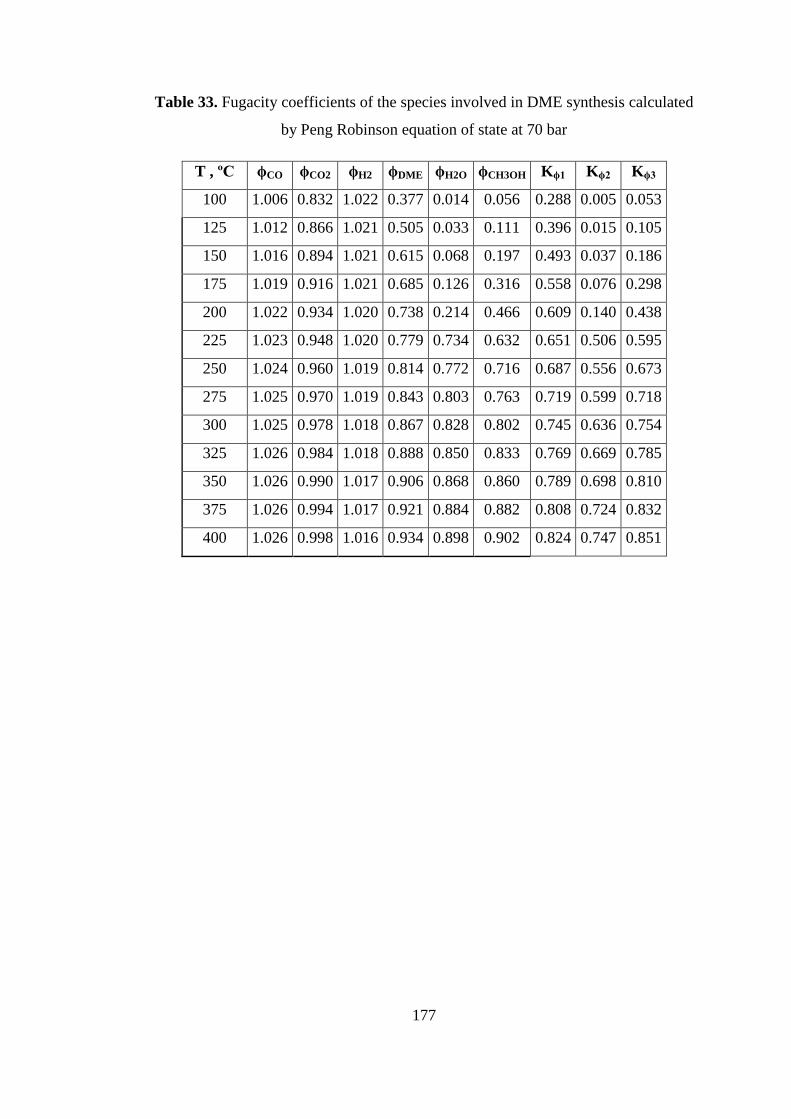
177
Table 33. Fugacity coefficients of the species involved in DME synthesis calculated
by Peng Robinson equation of state at 70 bar
T , ºC ϕCO ϕCO2 ϕH2 ϕDME ϕH2O ϕCH3OH Kϕ1 Kϕ2 Kϕ3
100 1.006 0.832 1.022 0.377 0.014 0.056 0.288 0.005 0.053
125 1.012 0.866 1.021 0.505 0.033 0.111 0.396 0.015 0.105
150 1.016 0.894 1.021 0.615 0.068 0.197 0.493 0.037 0.186
175 1.019 0.916 1.021 0.685 0.126 0.316 0.558 0.076 0.298
200 1.022 0.934 1.020 0.738 0.214 0.466 0.609 0.140 0.438
225 1.023 0.948 1.020 0.779 0.734 0.632 0.651 0.506 0.595
250 1.024 0.960 1.019 0.814 0.772 0.716 0.687 0.556 0.673
275 1.025 0.970 1.019 0.843 0.803 0.763 0.719 0.599 0.718
300 1.025 0.978 1.018 0.867 0.828 0.802 0.745 0.636 0.754
325 1.026 0.984 1.018 0.888 0.850 0.833 0.769 0.669 0.785
350 1.026 0.990 1.017 0.906 0.868 0.860 0.789 0.698 0.810
375 1.026 0.994 1.017 0.921 0.884 0.882 0.808 0.724 0.832
400 1.026 0.998 1.016 0.934 0.898 0.902 0.824 0.747 0.851
178
APPENDIX B
CONVERSION AND SELECTIVITY CALCULATIONS
B. CONVERSION AND SELECTIVITY CALCULATION
In the activity tests, products and unconverted gases were analyzed with an online
GC connected to experimental set-up. Details of experimental system are explained
in Section 6.3. From GC analyses, peaks regarding to component(s) were obtained.
Retention time of each peak was found by calibration and calibration factors are
given in Table 7. In this appendix, sample calculations for conversion and selectivity
calculations are illustrated for two different feed gas compositions.
B1. ACTIVITY RESULTS OF TRC-75(L)-C from mixture-1 (50% H2, 50%
CO)
Activity test of TRC-75(L)-C was made at a pressure of 50 bar and in a temperature
range of 200 °C – 400 °C. Reactant gas flow rate was 50 cc/min and 0.2 gr catalyst
was loaded to reactor. Activity results were given in Section 8.2.1.
In experiments, steady state was reached at around 30 minutes that corresponds to
duration of one complete GC analysis. After steady state reached, four successive
runs were carried out and peak areas corresponding to any component was recorded.
For conversion and selectivity calculations, average of them was taken and average
values are given in Table 34.
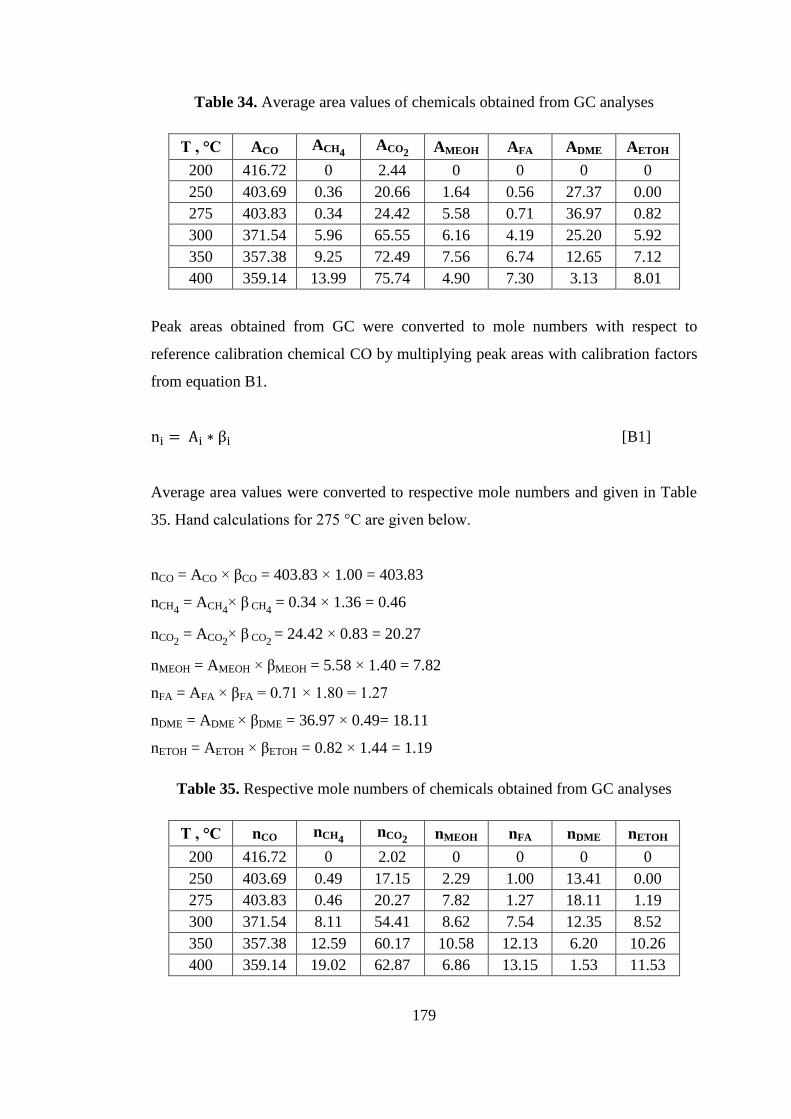
179
Table 34. Average area values of chemicals obtained from GC analyses
T , °C ACO ACH4 ACO2
AMEOH AFA ADME AETOH
200 416.72 0 2.44 0 0 0 0
250 403.69 0.36 20.66 1.64 0.56 27.37 0.00
275 403.83 0.34 24.42 5.58 0.71 36.97 0.82
300 371.54 5.96 65.55 6.16 4.19 25.20 5.92
350 357.38 9.25 72.49 7.56 6.74 12.65 7.12
400 359.14 13.99 75.74 4.90 7.30 3.13 8.01
Peak areas obtained from GC were converted to mole numbers with respect to
reference calibration chemical CO by multiplying peak areas with calibration factors
from equation B1.
[B1]
Average area values were converted to respective mole numbers and given in Table
35. Hand calculations for 275 °C are given below.
nCO = ACO × βCO = 403.83 × 1.00 = 403.83
nCH4 = ACH4
× β CH4 = 0.34 × 1.36 = 0.46
nCO2 = ACO2
× β CO2 = 24.42 × 0.83 = 20.27
nMEOH = AMEOH × βMEOH = 5.58 × 1.40 = 7.82
nFA = AFA × βFA = 0.71 × 1.80 = 1.27
nDME = ADME × βDME = 36.97 × 0.49= 18.11
nETOH = AETOH × βETOH = 0.82 × 1.44 = 1.19
Table 35. Respective mole numbers of chemicals obtained from GC analyses
T , °C nCO nCH4 nCO2
nMEOH nFA nDME nETOH
200 416.72 0 2.02 0 0 0 0
250 403.69 0.49 17.15 2.29 1.00 13.41 0.00
275 403.83 0.46 20.27 7.82 1.27 18.11 1.19
300 371.54 8.11 54.41 8.62 7.54 12.35 8.52
350 357.38 12.59 60.17 10.58 12.13 6.20 10.26
400 359.14 19.02 62.87 6.86 13.15 1.53 11.53
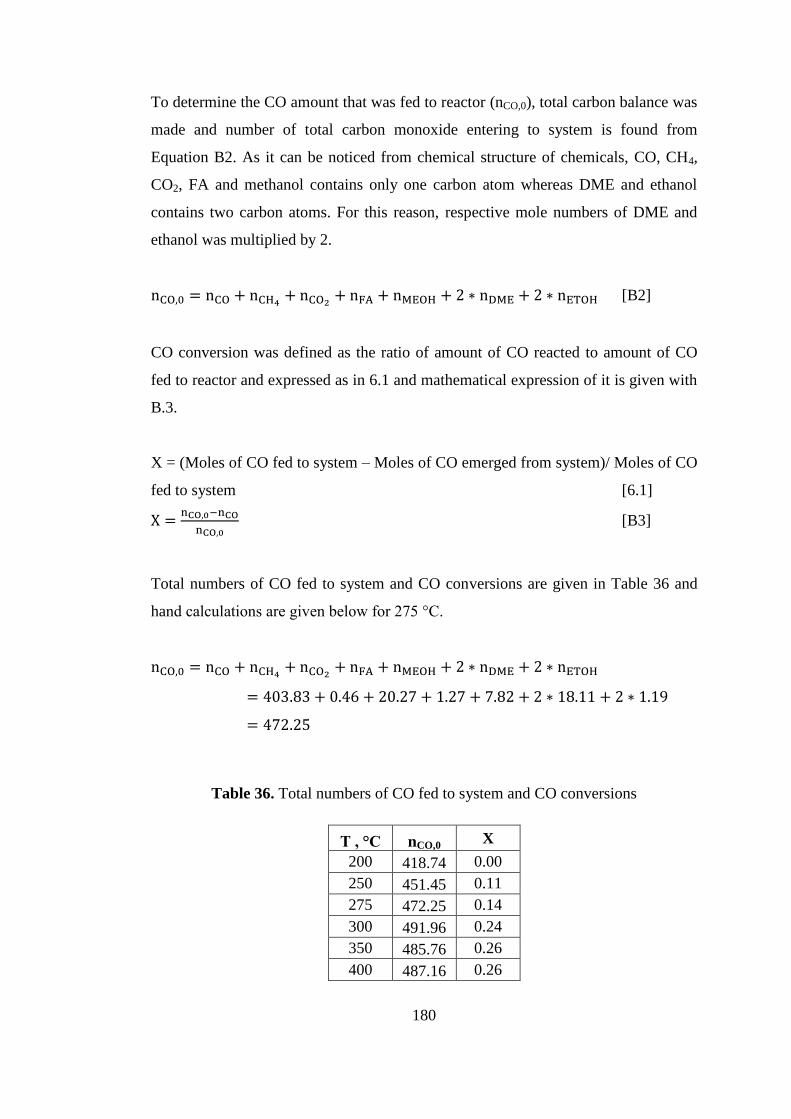
180
To determine the CO amount that was fed to reactor (nCO,0), total carbon balance was
made and number of total carbon monoxide entering to system is found from
Equation B2. As it can be noticed from chemical structure of chemicals, CO, CH4,
CO2, FA and methanol contains only one carbon atom whereas DME and ethanol
contains two carbon atoms. For this reason, respective mole numbers of DME and
ethanol was multiplied by 2.
[B2]
CO conversion was defined as the ratio of amount of CO reacted to amount of CO
fed to reactor and expressed as in 6.1 and mathematical expression of it is given with
B.3.
X = (Moles of CO fed to system – Moles of CO emerged from system)/ Moles of CO
fed to system [6.1]
[B3]
Total numbers of CO fed to system and CO conversions are given in Table 36 and
hand calculations are given below for 275 °C.
Table 36. Total numbers of CO fed to system and CO conversions
T , °C nCO,0 X
200 418.74 0.00
250 451.45 0.11
275 472.25 0.14
300 491.96 0.24
350 485.76 0.26
400 487.16 0.26
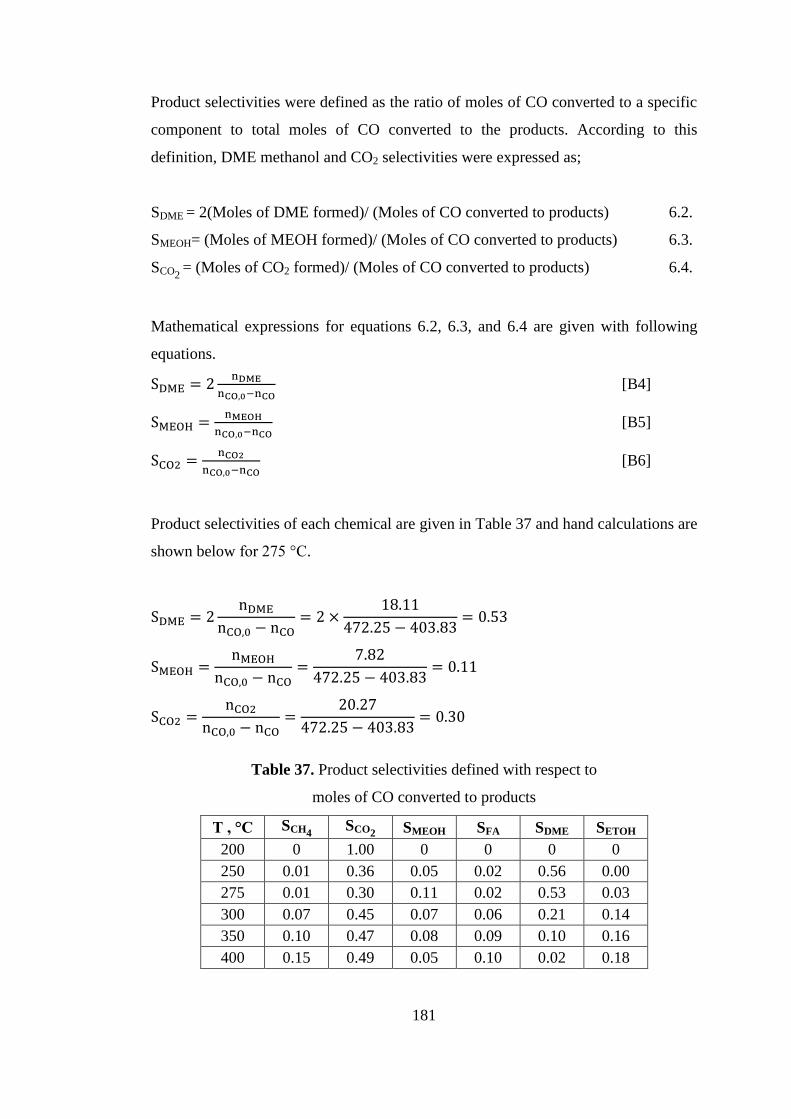
181
Product selectivities were defined as the ratio of moles of CO converted to a specific
component to total moles of CO converted to the products. According to this
definition, DME methanol and CO2 selectivities were expressed as;
SDME = 2(Moles of DME formed)/ (Moles of CO converted to products) 6.2.
SMEOH= (Moles of MEOH formed)/ (Moles of CO converted to products) 6.3.
SCO2 = (Moles of CO2 formed)/ (Moles of CO converted to products) 6.4.
Mathematical expressions for equations 6.2, 6.3, and 6.4 are given with following
equations.
[B4]
[B5]
[B6]
Product selectivities of each chemical are given in Table 37 and hand calculations are
shown below for 275 °C.
Table 37. Product selectivities defined with respect to
moles of CO converted to products
T , °C SCH4 SCO2
SMEOH SFA SDME SETOH
200 0 1.00 0 0 0 0
250 0.01 0.36 0.05 0.02 0.56 0.00
275 0.01 0.30 0.11 0.02 0.53 0.03
300 0.07 0.45 0.07 0.06 0.21 0.14
350 0.10 0.47 0.08 0.09 0.10 0.16
400 0.15 0.49 0.05 0.10 0.02 0.18
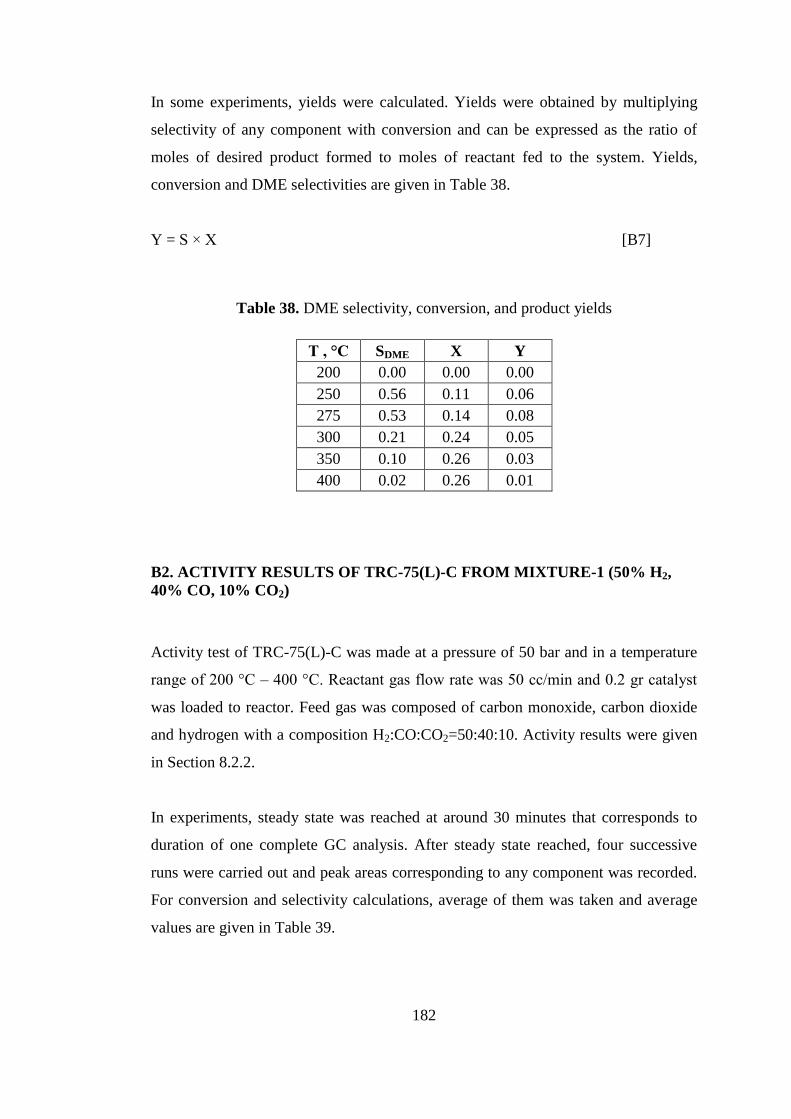
182
In some experiments, yields were calculated. Yields were obtained by multiplying
selectivity of any component with conversion and can be expressed as the ratio of
moles of desired product formed to moles of reactant fed to the system. Yields,
conversion and DME selectivities are given in Table 38.
Y = S × X [B7]
Table 38. DME selectivity, conversion, and product yields
T , °C SDME X Y
200 0.00 0.00 0.00
250 0.56 0.11 0.06
275 0.53 0.14 0.08
300 0.21 0.24 0.05
350 0.10 0.26 0.03
400 0.02 0.26 0.01
B2. ACTIVITY RESULTS OF TRC-75(L)-C FROM MIXTURE-1 (50% H2,
40% CO, 10% CO2)
Activity test of TRC-75(L)-C was made at a pressure of 50 bar and in a temperature
range of 200 °C – 400 °C. Reactant gas flow rate was 50 cc/min and 0.2 gr catalyst
was loaded to reactor. Feed gas was composed of carbon monoxide, carbon dioxide
and hydrogen with a composition H2:CO:CO2=50:40:10. Activity results were given
in Section 8.2.2.
In experiments, steady state was reached at around 30 minutes that corresponds to
duration of one complete GC analysis. After steady state reached, four successive
runs were carried out and peak areas corresponding to any component was recorded.
For conversion and selectivity calculations, average of them was taken and average
values are given in Table 39.
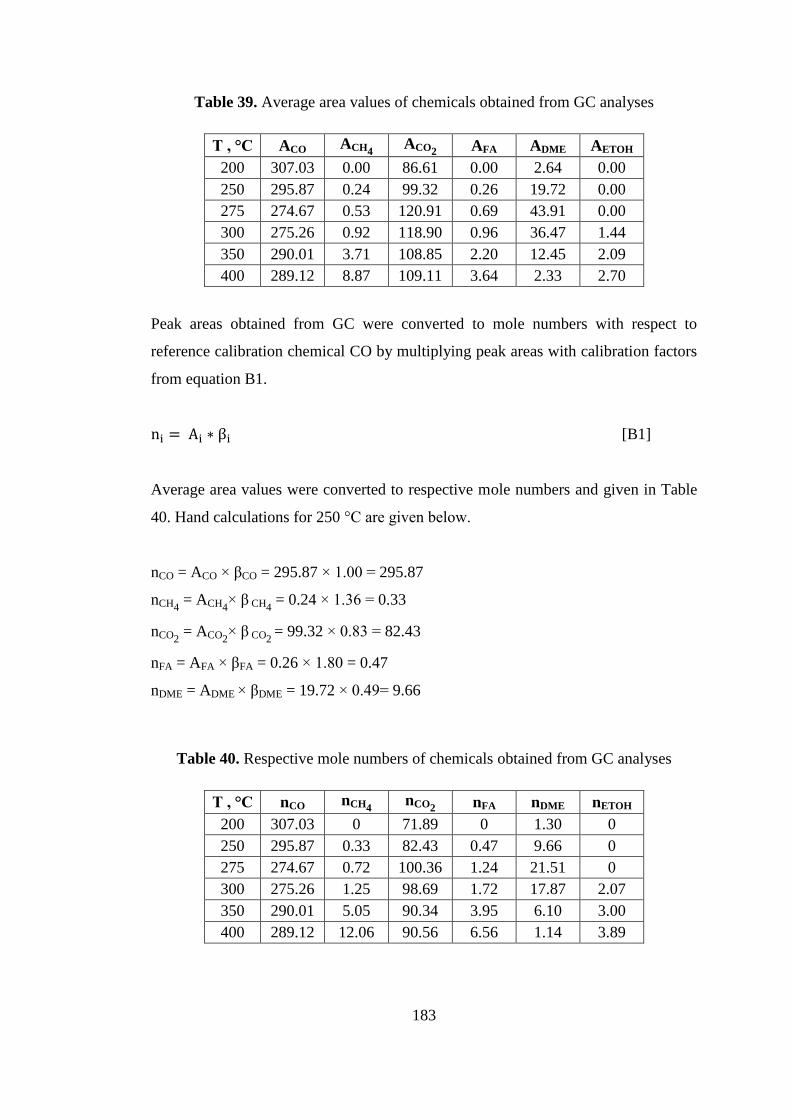
183
Table 39. Average area values of chemicals obtained from GC analyses
T , °C ACO ACH4 ACO2
AFA ADME AETOH
200 307.03 0.00 86.61 0.00 2.64 0.00
250 295.87 0.24 99.32 0.26 19.72 0.00
275 274.67 0.53 120.91 0.69 43.91 0.00
300 275.26 0.92 118.90 0.96 36.47 1.44
350 290.01 3.71 108.85 2.20 12.45 2.09
400 289.12 8.87 109.11 3.64 2.33 2.70
Peak areas obtained from GC were converted to mole numbers with respect to
reference calibration chemical CO by multiplying peak areas with calibration factors
from equation B1.
[B1]
Average area values were converted to respective mole numbers and given in Table
40. Hand calculations for 250 °C are given below.
nCO = ACO × βCO = 295.87 × 1.00 = 295.87
nCH4 = ACH4
× β CH4 = 0.24 × 1.36 = 0.33
nCO2 = ACO2
× β CO2 = 99.32 × 0.83 = 82.43
nFA = AFA × βFA = 0.26 × 1.80 = 0.47
nDME = ADME × βDME = 19.72 × 0.49= 9.66
Table 40. Respective mole numbers of chemicals obtained from GC analyses
T , °C nCO nCH4 nCO2
nFA nDME nETOH
200 307.03 0 71.89 0 1.30 0
250 295.87 0.33 82.43 0.47 9.66 0
275 274.67 0.72 100.36 1.24 21.51 0
300 275.26 1.25 98.69 1.72 17.87 2.07
350 290.01 5.05 90.34 3.95 6.10 3.00
400 289.12 12.06 90.56 6.56 1.14 3.89
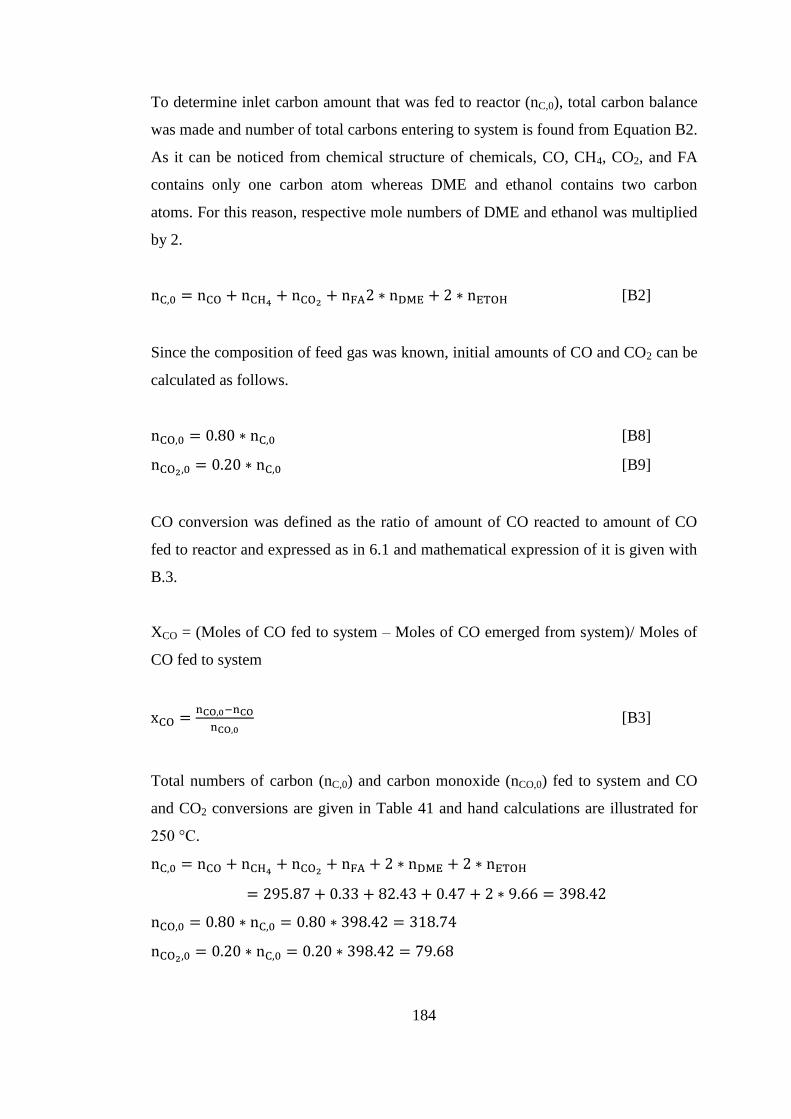
184
To determine inlet carbon amount that was fed to reactor (nC,0), total carbon balance
was made and number of total carbons entering to system is found from Equation B2.
As it can be noticed from chemical structure of chemicals, CO, CH4, CO2, and FA
contains only one carbon atom whereas DME and ethanol contains two carbon
atoms. For this reason, respective mole numbers of DME and ethanol was multiplied
by 2.
[B2]
Since the composition of feed gas was known, initial amounts of CO and CO2 can be
calculated as follows.
[B8]
[B9]
CO conversion was defined as the ratio of amount of CO reacted to amount of CO
fed to reactor and expressed as in 6.1 and mathematical expression of it is given with
B.3.
XCO = (Moles of CO fed to system – Moles of CO emerged from system)/ Moles of
CO fed to system
[B3]
Total numbers of carbon (nC,0) and carbon monoxide (nCO,0) fed to system and CO
and CO2 conversions are given in Table 41 and hand calculations are illustrated for
250 °C.

185
Table 41. Total numbers of carbon, CO, and CO2 fed to system
and CO conversions
T , °C nC,0 nCO,0 nCO2,0 xCO
200 381.51 305.21 76.3 -0.01
250 398.42 318.74 79.7 0.07
275 420.02 336.02 84.0 0.18
300 416.80 333.44 83.4 0.17
350 407.56 326.05 81.5 0.11
400 408.36 326.69 81.7 0.12
Product selectivities were defined as the ratio of moles of CO converted to a specific
component to total moles of CO converted to the products. According to this
definition, DME and CO2 selectivities were expressed as;
SDME = 2(Moles of DME formed)/ (Moles of CO converted to products) 6.2.
SCO2 = (Moles of CO2 formed)/ (Moles of CO converted to products) 6.4.
Mathematical expressions for equations 6.2 and 6.4 are given with following
equations.
[B4]
[B6]
Product selectivities of each chemical are given in Table 42 and hand calculations are
shown below for 250 °C.
SDME =
=
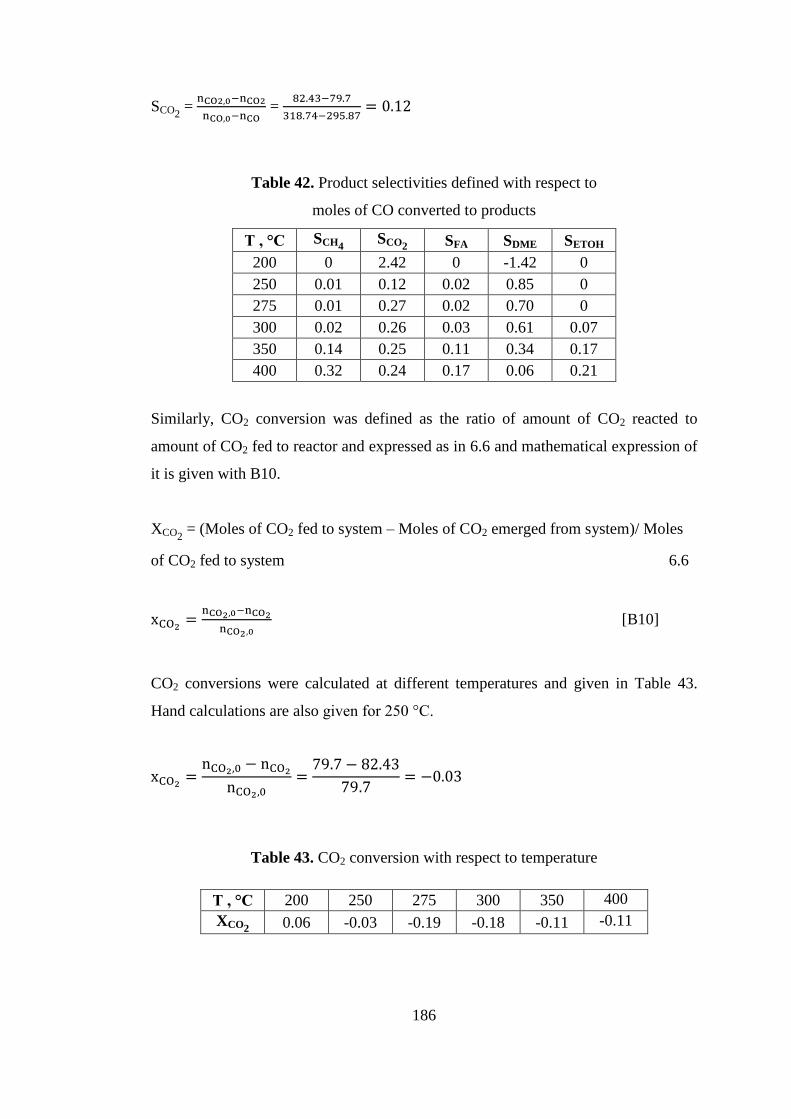
186
SCO2 =
=
Table 42. Product selectivities defined with respect to
moles of CO converted to products
T , °C SCH4 SCO2
SFA SDME SETOH
200 0 2.42 0 -1.42 0
250 0.01 0.12 0.02 0.85 0
275 0.01 0.27 0.02 0.70 0
300 0.02 0.26 0.03 0.61 0.07
350 0.14 0.25 0.11 0.34 0.17
400 0.32 0.24 0.17 0.06 0.21
Similarly, CO2 conversion was defined as the ratio of amount of CO2 reacted to
amount of CO2 fed to reactor and expressed as in 6.6 and mathematical expression of
it is given with B10.
XCO2 = (Moles of CO2 fed to system – Moles of CO2 emerged from system)/ Moles
of CO2 fed to system 6.6
[B10]
CO2 conversions were calculated at different temperatures and given in Table 43.
Hand calculations are also given for 250 °C.
Table 43. CO2 conversion with respect to temperature
T , °C 200 250 275 300 350 400
XCO2 0.06 -0.03 -0.19 -0.18 -0.11 -0.11
187
As it could be seen from Table 41, CO conversion was negative at 200 °C.
Moreover, DME selectivity was negative and CO2 selectivity was positive and
greater than one at 200 °C. Negative CO conversion indicated that CO was a product
rather than a reactant at 200 °C. Based on CO2 conversion results, which is shown in
Table 43, CO2 conversion was positive at 200 °C, meaning that CO2 acted as reactant
instead of being a product. Therefore, selectivity definition which was made with
respect to converted CO to products was meaningless for positive CO2 definition.
Selectivity must be defined with respect to total amount of converted CO & CO2.
According to this definition, DME and methanol selectivities were expressed as;
SDME = 2(Moles of DME formed)/ (Moles of CO&CO2 converted to products) 6.7.
SMEOH= (Moles of MEOH formed)/ (Moles of CO&CO2 converted to products) 6.8.
Mathematical expressions for 6.7 and 6.8 are given with B11 and B12.
( ) [B11]
( ) [B12]
Product selectivities which were defined with respect to converted CO&CO2 were
calculated at different temperatures and given in Table 44. Hand calculations are also
given for 200 °C.
( )
( )

188
Table 44. Product selectivities defined with respect to
moles of CO&CO2 converted to products
T , °C SCH4 SFA SDME SETOH
200 0 0 1 0
250 0.02 0.02 0.96 0
275 0.02 0.03 0.96 0
300 0.03 0.04 0.83 0.10
350 0.19 0.15 0.45 0.22
400 0.42 0.23 0.08 0.27
189
APPENDIX C
PARTICLE SIZE CALCULATIONS
C. PARTICLE SIZE CALCULATIONS
Particle sizes of the metals and metal oxides were calculated by Scherrer‟s equation
[74].
( )
where, di = particle size of i,
K = shape factor
λ = X-Ray wavelength
β = Full width at half max (FWHM)
θ = Bragg‟s angle
Particle size of CuO, Cu2O, Cu, ZnO, γ-Al2O3, and SiO2 were calculated from the
Scherrer‟s equation for the peaks of 2θ at around 35° for CuO, 65° for Cu2O, 43° for
Cu, 31° for ZnO, and 66° for γ-Al2O3. X-Ray diffractions were taken at the
wavelength of 0.154 nm and shape factor was taken as 0.89.
CuO particle size was calculated for 2θ angle of 35.6°. XRD results revealed that
FWHM was 1.93°. FWHM and 2θ were converted to radians.
( ) ( )
( ) ( )
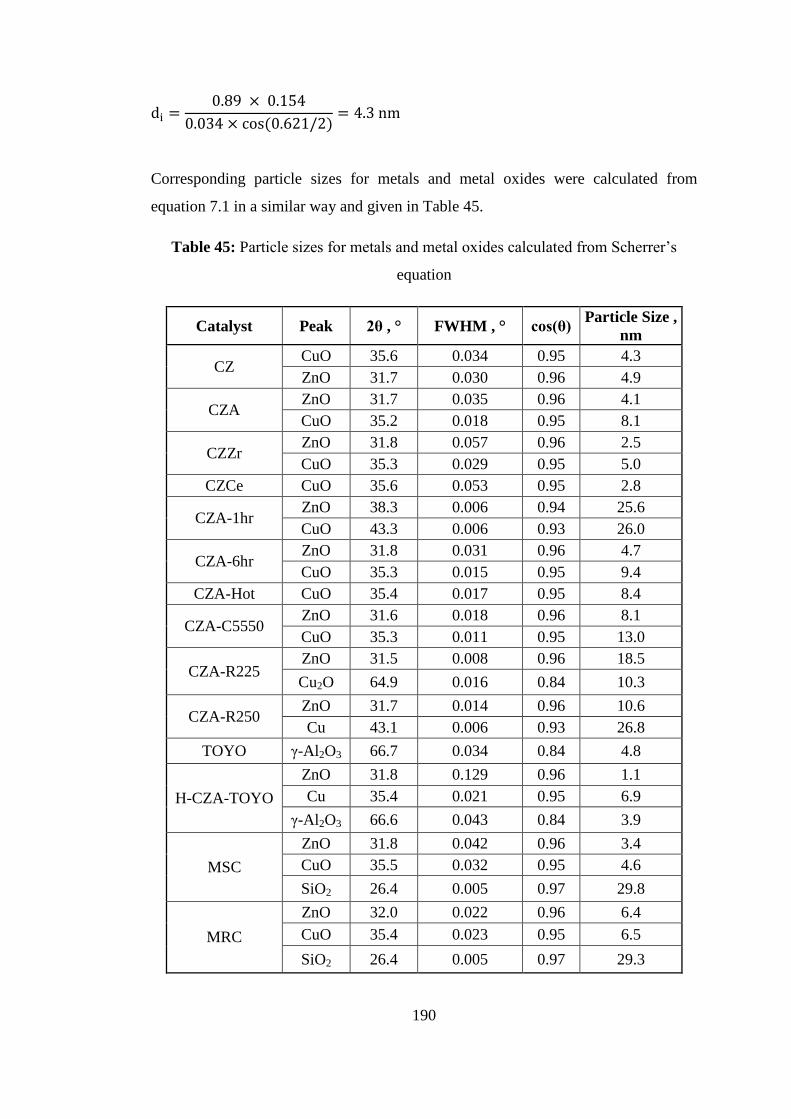
190
( )
Corresponding particle sizes for metals and metal oxides were calculated from
equation 7.1 in a similar way and given in Table 45.
Table 45: Particle sizes for metals and metal oxides calculated from Scherrer‟s
equation
Catalyst Peak 2θ , ° FWHM , ° cos(θ) Particle Size ,
nm
CZ CuO 35.6 0.034 0.95 4.3
ZnO 31.7 0.030 0.96 4.9
CZA ZnO 31.7 0.035 0.96 4.1
CuO 35.2 0.018 0.95 8.1
CZZr ZnO 31.8 0.057 0.96 2.5
CuO 35.3 0.029 0.95 5.0
CZCe CuO 35.6 0.053 0.95 2.8
CZA-1hr ZnO 38.3 0.006 0.94 25.6
CuO 43.3 0.006 0.93 26.0
CZA-6hr ZnO 31.8 0.031 0.96 4.7
CuO 35.3 0.015 0.95 9.4
CZA-Hot CuO 35.4 0.017 0.95 8.4
CZA-C5550 ZnO 31.6 0.018 0.96 8.1
CuO 35.3 0.011 0.95 13.0
CZA-R225 ZnO 31.5 0.008 0.96 18.5
Cu2O 64.9 0.016 0.84 10.3
CZA-R250 ZnO 31.7 0.014 0.96 10.6
Cu 43.1 0.006 0.93 26.8
TOYO γ-Al2O3 66.7 0.034 0.84 4.8
H-CZA-TOYO
ZnO 31.8 0.129 0.96 1.1
Cu 35.4 0.021 0.95 6.9
γ-Al2O3 66.6 0.043 0.84 3.9
MSC
ZnO 31.8 0.042 0.96 3.4
CuO 35.5 0.032 0.95 4.6
SiO2 26.4 0.005 0.97 29.8
MRC
ZnO 32.0 0.022 0.96 6.4
CuO 35.4 0.023 0.95 6.5
SiO2 26.4 0.005 0.97 29.3
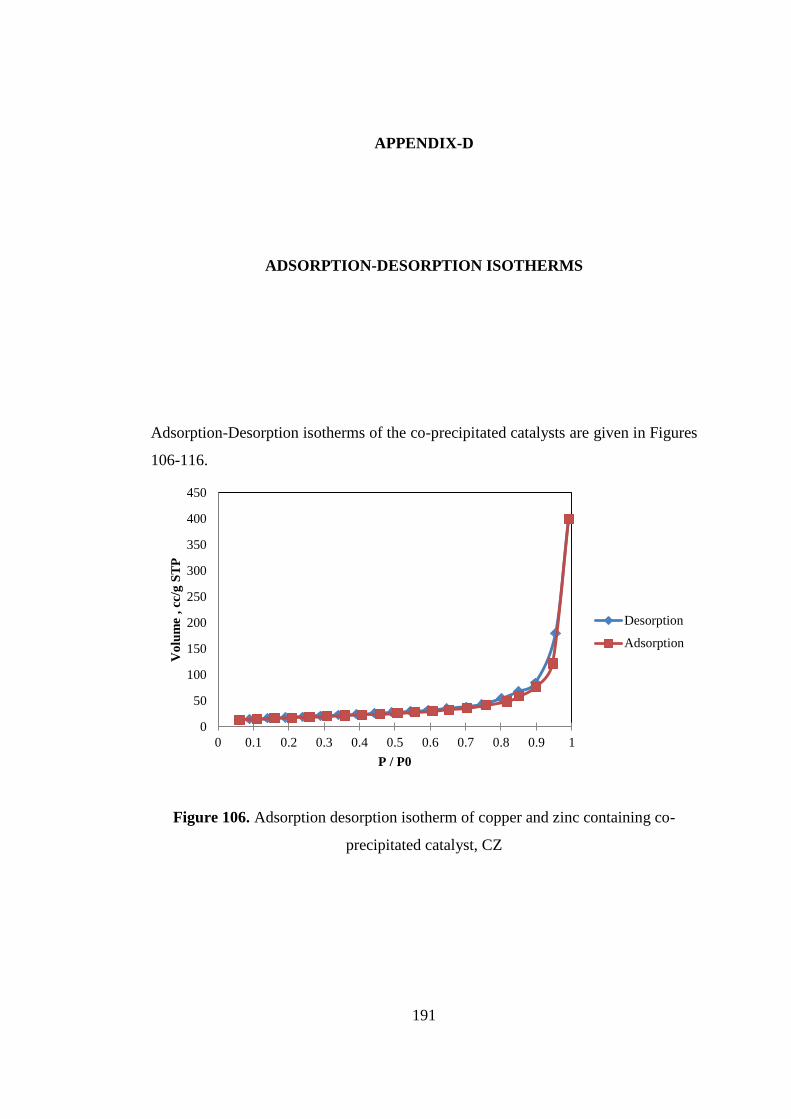
191
APPENDIX-D
ADSORPTION-DESORPTION ISOTHERMS
D. ADSORPTION-DESORPTION ISOTHERMS
Adsorption-Desorption isotherms of the co-precipitated catalysts are given in Figures
106-116.
Figure 106. Adsorption desorption isotherm of copper and zinc containing co-
precipitated catalyst, CZ
0
50
100
150
200
250
300
350
400
450
0 0.1 0.2 0.3 0.4 0.5 0.6 0.7 0.8 0.9 1
Vo
lum
e , cc
/g S
TP
P / P0
Desorption
Adsorption
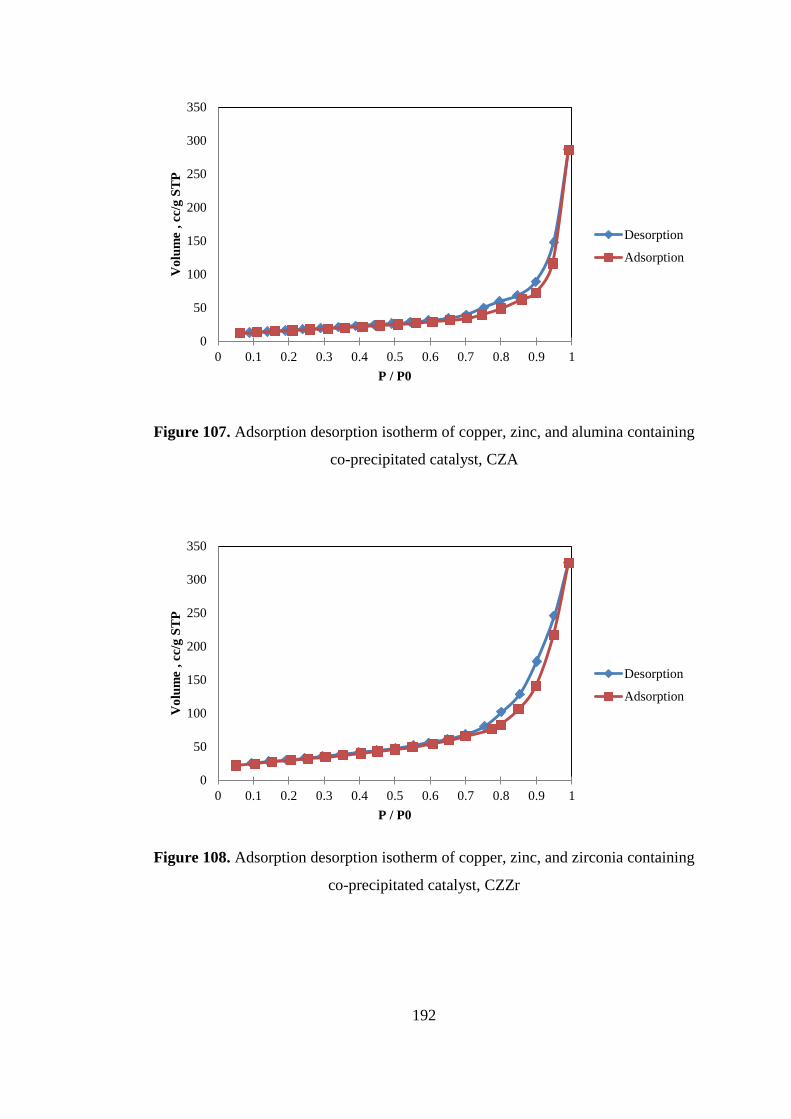
192
Figure 107. Adsorption desorption isotherm of copper, zinc, and alumina containing
co-precipitated catalyst, CZA
Figure 108. Adsorption desorption isotherm of copper, zinc, and zirconia containing
co-precipitated catalyst, CZZr
0
50
100
150
200
250
300
350
0 0.1 0.2 0.3 0.4 0.5 0.6 0.7 0.8 0.9 1
Vo
lum
e , cc
/g S
TP
P / P0
Desorption
Adsorption
0
50
100
150
200
250
300
350
0 0.1 0.2 0.3 0.4 0.5 0.6 0.7 0.8 0.9 1
Vo
lum
e , cc
/g S
TP
P / P0
Desorption
Adsorption
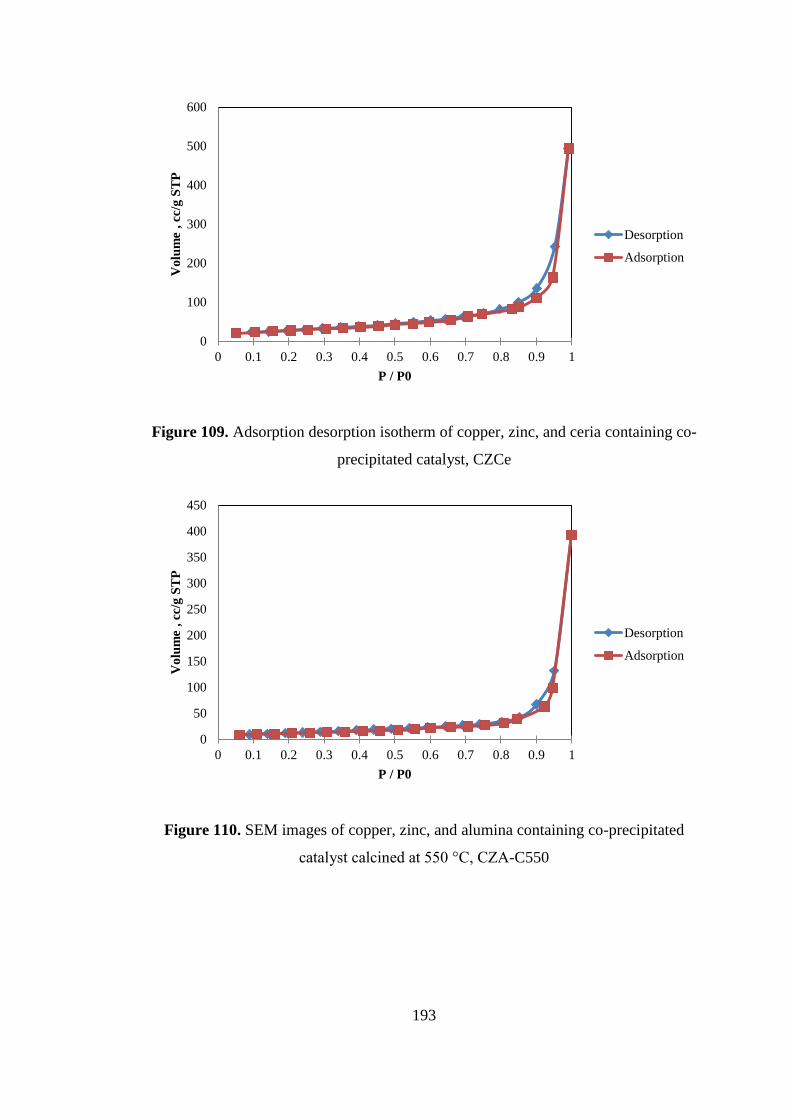
193
Figure 109. Adsorption desorption isotherm of copper, zinc, and ceria containing co-
precipitated catalyst, CZCe
Figure 110. SEM images of copper, zinc, and alumina containing co-precipitated
catalyst calcined at 550 °C, CZA-C550
0
100
200
300
400
500
600
0 0.1 0.2 0.3 0.4 0.5 0.6 0.7 0.8 0.9 1
Vo
lum
e , cc
/g S
TP
P / P0
Desorption
Adsorption
0
50
100
150
200
250
300
350
400
450
0 0.1 0.2 0.3 0.4 0.5 0.6 0.7 0.8 0.9 1
Vo
lum
e , cc
/g S
TP
P / P0
Desorption
Adsorption
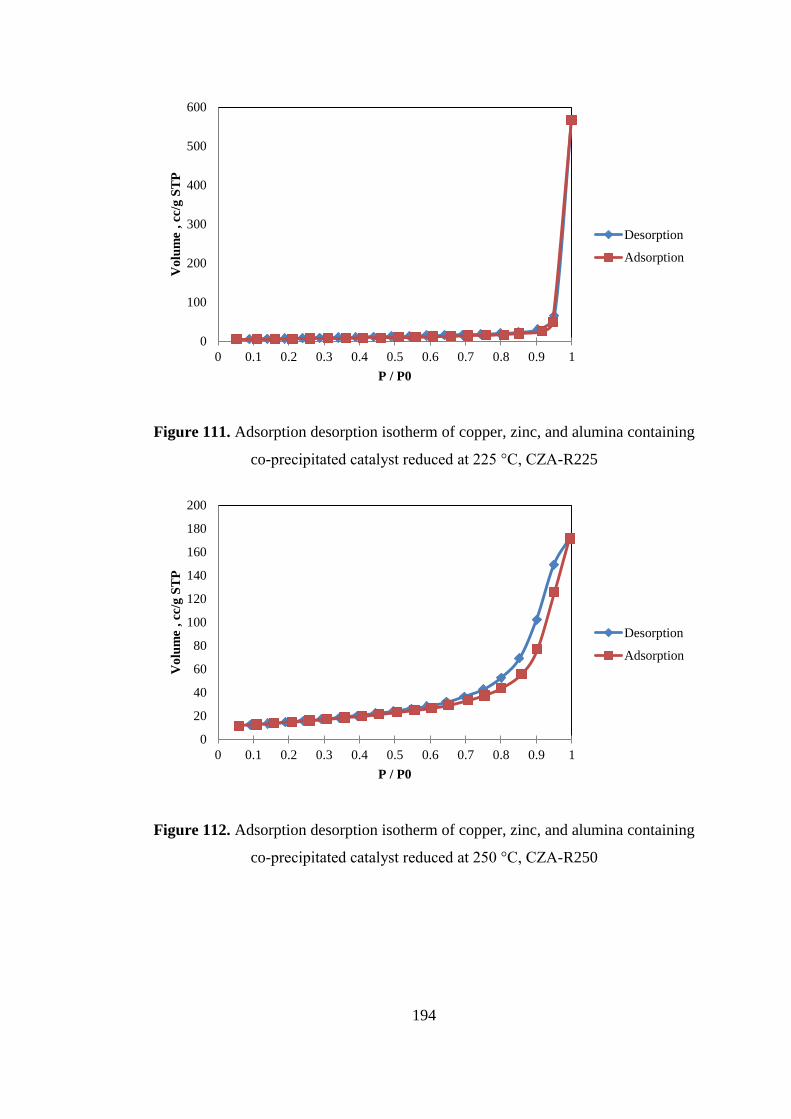
194
Figure 111. Adsorption desorption isotherm of copper, zinc, and alumina containing
co-precipitated catalyst reduced at 225 °C, CZA-R225
Figure 112. Adsorption desorption isotherm of copper, zinc, and alumina containing
co-precipitated catalyst reduced at 250 °C, CZA-R250
0
100
200
300
400
500
600
0 0.1 0.2 0.3 0.4 0.5 0.6 0.7 0.8 0.9 1
Vo
lum
e , cc
/g S
TP
P / P0
Desorption
Adsorption
0
20
40
60
80
100
120
140
160
180
200
0 0.1 0.2 0.3 0.4 0.5 0.6 0.7 0.8 0.9 1
Vo
lum
e , cc
/g S
TP
P / P0
Desorption
Adsorption
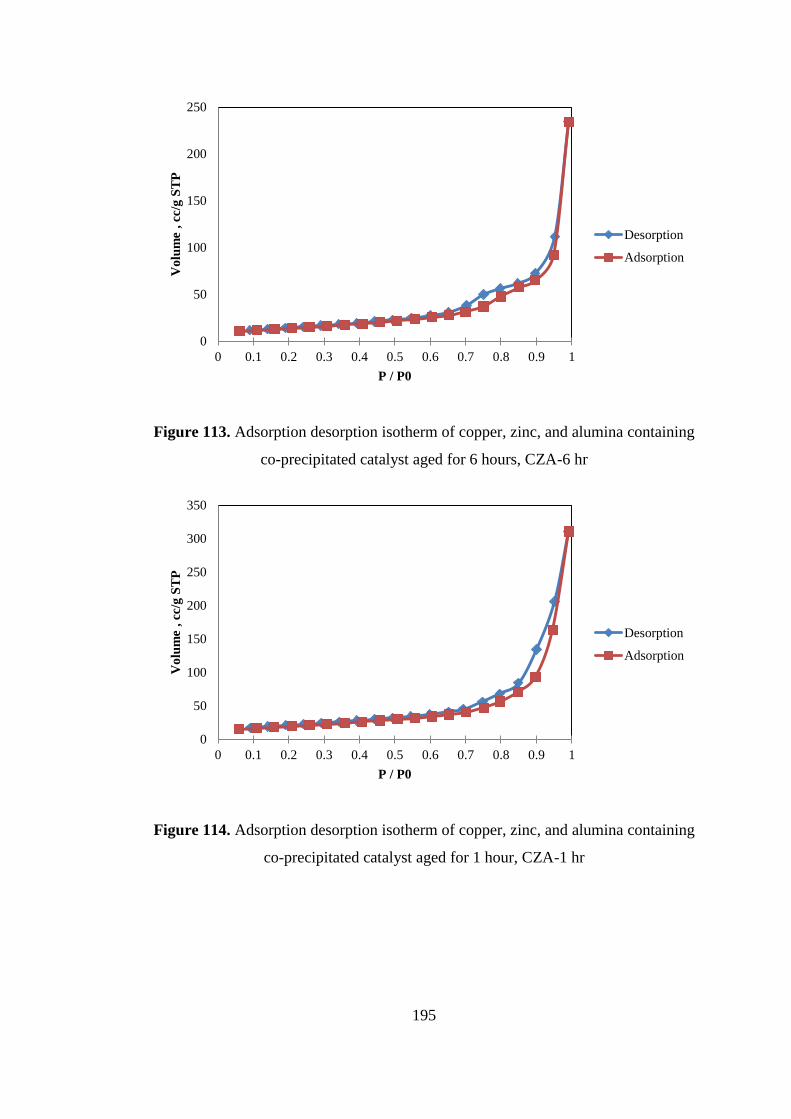
195
Figure 113. Adsorption desorption isotherm of copper, zinc, and alumina containing
co-precipitated catalyst aged for 6 hours, CZA-6 hr
Figure 114. Adsorption desorption isotherm of copper, zinc, and alumina containing
co-precipitated catalyst aged for 1 hour, CZA-1 hr
0
50
100
150
200
250
0 0.1 0.2 0.3 0.4 0.5 0.6 0.7 0.8 0.9 1
Vo
lum
e , cc
/g S
TP
P / P0
Desorption
Adsorption
0
50
100
150
200
250
300
350
0 0.1 0.2 0.3 0.4 0.5 0.6 0.7 0.8 0.9 1
Vo
lum
e , cc
/g S
TP
P / P0
Desorption
Adsorption
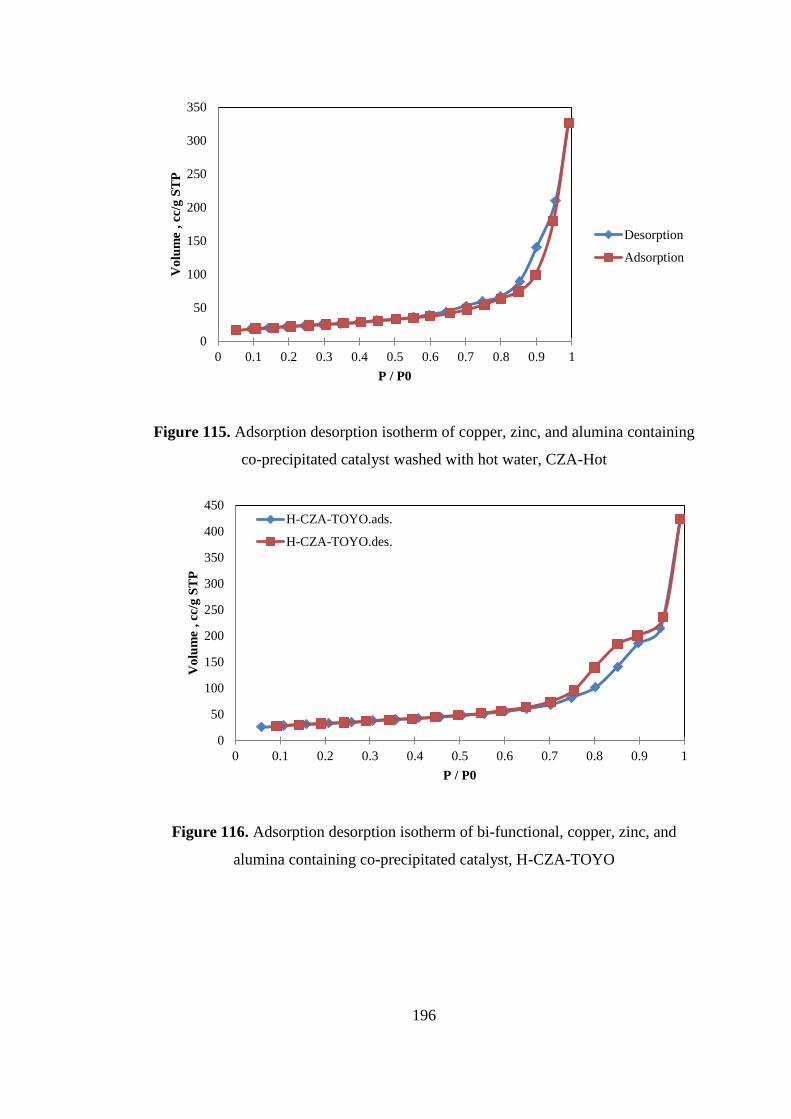
196
Figure 115. Adsorption desorption isotherm of copper, zinc, and alumina containing
co-precipitated catalyst washed with hot water, CZA-Hot
Figure 116. Adsorption desorption isotherm of bi-functional, copper, zinc, and
alumina containing co-precipitated catalyst, H-CZA-TOYO
0
50
100
150
200
250
300
350
0 0.1 0.2 0.3 0.4 0.5 0.6 0.7 0.8 0.9 1
Vo
lum
e , cc
/g S
TP
P / P0
Desorption
Adsorption
0
50
100
150
200
250
300
350
400
450
0 0.1 0.2 0.3 0.4 0.5 0.6 0.7 0.8 0.9 1
Vo
lum
e , cc
/g S
TP
P / P0
H-CZA-TOYO.ads.
H-CZA-TOYO.des.
Recommended


![GIDA TEKNOLOJİSİ - megep.meb.gov.trmegep.meb.gov.tr/mte_program_modul/moduller_pdf/Tereyağı.pdf · o üü öh sesdudwög jçlulophvlyle krema eldesi ve ühwlohq nuhpı wöul]](https://img.pdfslide.net/doc/110x75/5e2aee9a0239fa38b764e972/gida-teknolojs-megepmebgov-pdf-o-h-sesdudwg-jlulophvlyle.jpg)