
C A R F W o r k i n g P a p e r
CARF is presently supported by Bank of Tokyo-Mitsubishi UFJ, Ltd., Dai-ichi Mutual Life Insurance Company, Meiji Yasuda Life Insurance Company, Nomura Holdings, Inc. and Sumitomo Mitsui Banking Corporation (in alphabetical order). This financial support enables us to issue CARF Working Papers.
CARF Working Papers can be downloaded without charge from: http://www.carf.e.u-tokyo.ac.jp/workingpaper/index.cgi
Working Papers are a series of manuscripts in their draft form. They are not intended for circulation or distribution except as indicated by the author. For that reason Working Papers may not be reproduced or distributed without the written consent of the author.
CARF-F-299
High quality topic extraction from business news explains
abnormal financial market volatility
Ryohei Hisano ETH Zurich
Didier Sornette ETH Zurich
Takayuki Mizuno University of Tsukuba
Takaaki Ohnishi The Canon Institute of Global Studies
Tsutomu Watanabe The University of Tokyo
October 2012
High quality topic extraction from business news explains abnormal financial market
volatility
Ryohei Hisanoab, Didier Sornetteac, Takayuki Mizunodbe, Takaaki Ohnishibe, Tsutomu Watanabebe
aETH Zurich, Department of Management,
Technology and EconomicsbThe Canon Institute of Global Studies
cSwiss Finance InstitutedDepartment of Computer Science,
Graduate school of SIE, University of TsukubaeThe University of Tokyo,
Graduate School of Economics
(Dated: October 23, 2012)
Understanding the mutual relationships between information flows and social activity in societytoday is one of the cornerstones of the social sciences. In financial economics, the key issue in thisregard is understanding and quantifying how news of all possible types (geopolitical, environmental,social, financial, economic, etc.) affect trading and the pricing of firms in organized stock markets.In this paper we seek to address this issue by performing an analysis of more than 24 millionnews records provided by Thompson Reuters and of their relationship with trading activity for 205major stocks in the S&P US stock index. We show that the whole landscape of news that affectstock price movements can be automatically summarized via simple regularized regressions betweentrading activity and news information pieces decomposed, with the help of simple topic modelingtechniques, into their “thematic” features. Using these methods, we are able to estimate and quantifythe impacts of news on trading. We introduce network-based visualization techniques to representthe whole landscape of news information associated with a basket of stocks. The examination ofthe words that are representative of the topic distributions confirms that our method is able toextract the significant pieces of information influencing the stock market. Our results show thatone of the most puzzling stylized fact in financial economies, namely that at certain times tradingvolumes appear to be “abnormally large,” can be explained by the flow of news. In this sense, ourresults prove that there is no “excess trading,” if the news are genuinely novel and provide relevantfinancial information.
I. INTRODUCTION
Neoclassical financial economics based on the “efficient market hypothesis” (EMH) considers price movements asalmost perfect instantaneous reactions to information flows. Thus, according to the EMH, price changes simply reflectexogenous news. Such news - of all possible types (geopolitical, environmental, social, financial, economic, etc.) - leadinvestors to continuously reassess their expectations of the cash flows that firms’ investment projects could generate inthe future. These reassessments are translated into readjusted demand/supply functions, which then push prices up ordown, depending on the net imbalance between demand and supply, towards a fundamental value. As a consequence,observed prices are considered the best embodiments of the present value of future cash flows. In this view, marketmovements are purely exogenous without any internal feedback loops. In particular, the most extreme losses occurringduring crashes are considered to be solely triggered exogenously.
The problem with this paradigm is that, in practice, relating actual price movements to particular news has beenstrikingly elusive. Many attempts to relate price changes to news, be it low frequency or high frequency, have failedto find convincing supportive evidence for the EMH [1–6]. Moreover, it has long been recognized that prices movemuch too large an extent and trading volume is much too large compared with what would be predicted from theEMH [7–9]. This suggests that there is more to price dynamics than just the exogenous flow of information. Againstthis background, the concept of “reflexivity” has been introduced [10], which embodies the notion that past actionsof investors also significantly influence present decisions so as to create feedback loops and significant endogenousdynamics [11]. The unresolved issue until now is then to disentangle exogenous and endogenous factors and understandwhich news are really important and how they are incorporated in prices. Given the a priori foundational nature ofnews flows on price formation in financial economics on the one hand and the absence of empirical support for it onthe other hand, without such an understanding and the corresponding control that should derive from it, financialmarkets will remain vulnerable to the excess volatility, wild price swings, bubbles and crashes that have plagued themin recent years as well as over most of their history [12].
The present paper represents an attempt to break the above stalemate by (i) using a huge database of business newsgathered for institutional investors and (ii) introducing a new methodology to extract relevant news that influencetrading activity. This new methodology allows us to remove in large part the endogenous components of price dynamics
2
50x106
40
30
20
10
100x103
80
60
40
20
0
Tra
de V
olum
e
New
s V
olum
e
Jan 2003 June 2011
50x106
40
30
20
10
100x103
806040200
Tra
ding
vol
ume
News volume
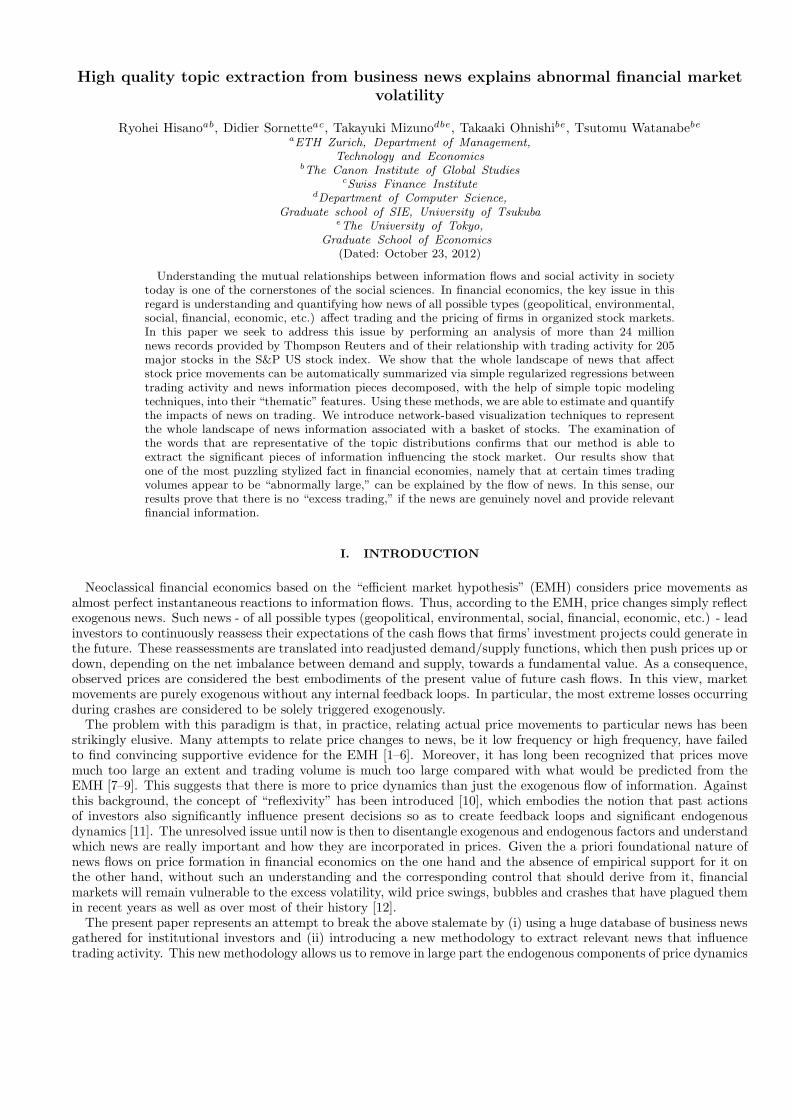
FIG. 1: Comparison between the time evolution of trading volume (black continuous line) and aggregate news volume (reddashed line) for Toyota. The inset plots the trading volume as a function of the concomitant news volume.
and to identify a hierarchy of important news. Our approach differs in several important dimensions from the onesemployed by previous studies investigating the impact of news on financial markets, such as [13–19]. One class ofprevious studies analyzed the information provided by news only in an aggregated manner without taking into accountthe specific information content. However, as casual observation indicates, each news record has different meaning toinvestors and thus different impact on prices, so that just counting the total number of news records for a particularperiod would not work well. Other previous studies only considered a small restricted set of news, such as earningsreports and the release of new economic data, and thus suffered from the serious limitation of neglecting the possiblesignificant impact of other types of news arriving at the time. One way to circumvent the latter problem could beto use very short time intervals [20] so as to minimize attribution errors. But recent studies, including [18, 21], haveshown that the impact of news persists over days, weeks and sometimes months, making it difficult, if not impossible,to extract their influence by just using temporal partitioning.
We address all these problems by performing a simultaneous disaggregated estimation of the relevant news typeswith respect to financial trading activity. We mine raw texts of more than 24 million news records provided byThompson Reuters and examine their impact on trading activity in stocks of the 205 firms listed in the S&P 500 USstock index for each of which there were more than 5,000 news records over the period from January 2003 to June2011. To determine what pieces of information are the most relevant to explain trading activity of each stock, weuse a combination of regularized regressions and topic modeling techniques. This allows us to compare quantitativelythe relative importance of the different news. We show that the top 5% most important events in terms of tradingvolume can be almost perfectly explained by our decoded news flow.
II. METHODOLOGY
The existence of a good correspondence between the time evolution of trading activity (measured by the dailytrading volume) and the time evolution of news volume is well-known [13–15]. This correspondence is illustrated inFig. 1, which shows the time evolution of the trading volume (the number of shares traded per day) of the Toyotastock and the evolution of the volume of news, measured as the number of words per day in text records that includethe company name Toyota. Using just the number of news records (instead of the total number of words in theserecords) yields essentially the same results.
Starting from this rough aggregate correspondence, our much more ambitious goal is to disaggregate (a) the flowof news into relevant topics and their associated words and (b) the trading volume of individual stocks, in order toconstruct a complete network of interdependences. Fig. 2 provides a flowchart of our methodology, which consistsof (i) decomposing the total flow of news into their thematic features by applying topic modeling techniques, (ii)estimating their impact on trading activity simultaneously in order to prune out the unimportant topics, and (iii)quantifying how many of the peaks in trading activity can be explained by news shocks.
Once a term (for instance Toyota) is chosen and the associated news records are collected (step (1)), the second stepis to decompose news information pieces into their “thematic” features, as shown in Fig. 2. This is done by applyinga simple topic modeling technique called Latent Dirichlet Allocation (LDA) [22, 23]. Topic models are graphical

3
50x106
40
30
20
10
Vol
ume
Jan 2003 June 2011
50x106
40
30
20
10
Jan 2003 June 2011
Vol
ume
50x106
40
30
20
10
Vol
ume
Jan 2003 June 2011
Raw texts
News relatedto some asset
(1) Select news which included the term
(2-a) LDA (2-b) Exclude topics with news and market words
Decompose news volume
Trading volume
(3-a) Select topics with LASSO(3-b) Estimate contributions (FVE)
Selected features with estimated contributions
22.8% 12% 8%
Fitted tradingvolume
(4) Add them up and measure how many peaks it was able to explain (FPE)
News volume100x10
3
80
60
40
20
0
New
s V
olum
e
Jan 2003 June 201150x106
40
30
20
10
Tra
ding
Vol
ume
Jan 2003 June 2011
69.8%50x10
6
40
30
20
10
Jan 2003 June 2011
Vol
ume
FIG. 2: Flowchart summarizing the procedure followed in our analyses. The number in parentheses indexes the step. Step (1)selects the news records associated with a given term, here the name of a company, such as Toyota. Step (2-a) applies theLatent Dirichlet Allocation (LDA) that decomposes any document as a mixture of different topics. Step (3-a) implements aconstrained LASSO regression. The percentage shown in step (3-b) denotes the estimated impact of each topic. The percentageshown in step (4) is the “fraction of (trading volume) peaks explained” (FPE) by news, which is our metric to assess the qualityof our methodology (see text).
models [24] which assume that shared global multinomial word distributions (i.e., topic distributions) govern thecorpus. Word frequencies within a given document are created from a mixture of these global topic distributions.LDA is the simplest topic model and uses the Dirichlet prior in order to ensure sparsity in the underlying multinomialdistribution. This makes learned topics easier to interpret. Since LDA has already yielded excellent results, we didnot find it useful to employ more elaborate topic models. We removed common stop words from the original newsrecords and ran LDA by setting the number of topics to 100 for all stocks analyzed in this paper. Varying the numberof topics according to the number of news records for each stock did not change the result significantly. We used thefast implementation of Smola and Narayanamurthy [25].
In what follows, we use the news volume Ik(t) of a given topic k, which is defined as the total number of wordstagged with topic number k on day t,
Ik(t) =∑
d∈I(t)
∑
w
N(d,w, k) , (1)
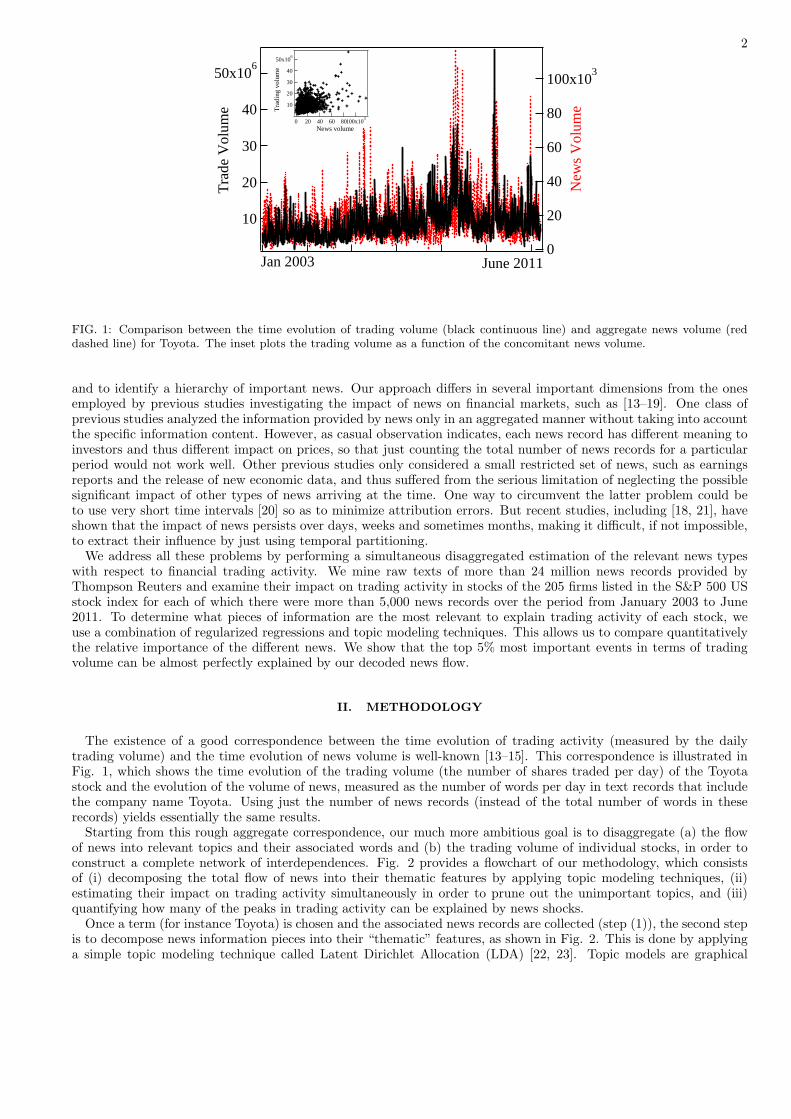
where N(d,w, k) is the number of times a word w tagged with topic k appeared in document d and I(t) is the indicatorfunction of the set of documents on day t. Fig. 3 presents some examples of the time evolution of the news volumefor four topics for the term “Toyota.” It also lists the top three words of the corresponding topic distributions. A fulldescription is provided in the supporting information.
The fundamental characteristic of LDA (and of topic modeling in general) is that every word that appears inthe corpus is tagged with a specific topic and is thus assumed to be generated by the corresponding specific topicdistribution. Put differently, even though words in a given document can be generated by a mixture of topics, eachword is assumed to be drawn from exactly one topic. This procedure makes the interpretation of the estimated topicseasier to comprehend [26]. As highlighted by [27], this construction, however, has the following negative consequence:because news records, such as ours, have many repeated phrases such as “double click for more information,” “Reutersmessaging net,” or “top news,” many topic distributions simply reflect these repeated phrases. One way to deal withthis problem is to eliminate these repeated phrases where they appear in the original corpus. However, because itis difficult to construct an algorithm that would work well for all the variations found in the huge amount of newsrecords analyzed here, we chose to prune the topics using topic distributions, employing the following procedure. Foreach topic, we focused on the top 6 words of the corresponding topic distribution and eliminated that topic if these top6 words were included in the set of words in the unwanted repeated phrases (Step 2-b in Fig. 1). We also removed alltopics that appear for less than 80 days (out of the 3103 days from January 2003 to June 2011). This excludes topicssuch as specific symbols and numbers reported in short time intervals. We also eliminated topics that describe stockmarket activity, i.e., which include words such as “hot,” “stocks,” “markets,” etc., in order to focus on the underlyingnews information that is supposed to influence that stock. This procedure corresponds to filtering out the endogenous
4
(a) Volume for Topic: Recall
Time
Nor
mal
ized
vol
ume
0.00
0.01
0.02
0.03
0.04
2003 2004 2005 2006 2007 2008 2009 2010 2011
(b) Volume for Topic: Global Recession
Time
Nor
mal
ized
vol
ume
0.000
0.005
0.010
0.015
0.020
0.025
0.030
2003 2004 2005 2006 2007 2008 2009 2010 2011
(c) Volume for Topic: Earthquake
Time
Nor
mal
ized
vol
ume
0.00
0.02
0.04
0.06
0.08
0.10
0.12
0.14
2003 2004 2005 2006 2007 2008 2009 2010 2011
(d) Volume for Topic: Formula one
Time
Nor
mal
ized
vol
ume
0.000
0.001
0.002
0.003
0.004
0.005
0.006
0.007
2003 2004 2005 2006 2007 2008 2009 2010 2011
FIG. 3: Selected topics learned by LDA and the associated news volume estimated using equation (1) for the term “Toyota.”The top three words for these topics were: (a) Toyota, recall, safety; (b) financial, crisis, economy; (c) Japan, production,earthquake; (d) team, F1, race.
component underlying the information flow and price generating process. Thus, for “Toyota,” for example, out of theoriginal 100 topics, we are left with 34 useful topics to work with that are associated with the term.
The relative importance of each topic in explaining trading volume of a given stock is determined by a simpleLASSO regression [28–30] with positive constraints:
V ol(t) =
K∑
k=1
wkIk(t) + ǫ(t) , (2)
where V ol(t) is the de-trended trading volume at time t. De-trending of the trading volume is performed by subtractingthe minimum recorded volume observed in the last 100 trading days (boundary values are set to the nearest non-zerovalue). The regularized linear regression with mean-squared error provides a robust estimation of the relationshipbetween news topics and trading volume in the presence of large bursts of trading activity and news, so that a largerspan of activity sizes can contribute to the determination of the regression weights {wk}. The regularization parameterused in the LASSO regression was chosen equal to the mean value of the regularization parameter over one hundredten-fold cross validations. Ten-fold cross validation was performed by randomly dividing the entire data set into tensubsets and measuring the average mean-squared error of each testing set from the ten-fold cross validation. Thisprocedure was performed multiple times to ensure stability of the estimated regularization parameter.
Because researchers are generally interested in explaining large (or “abnormal”) market activity, we focus ourattention on “peak days,” defined in terms of the 95th percentile of daily trading volume, so that on 95% of the daysthe trading volume was smaller than during the peak days. To account for the non-stationarity and large growth of
5
De−trended Trading volume of Toytoa
Time
Trad
ing
Vol
ume
1e+07
2e+07
3e+07
4e+07
5e+07
2003 2004 2005 2006 2007 2008 2009 2010 2011
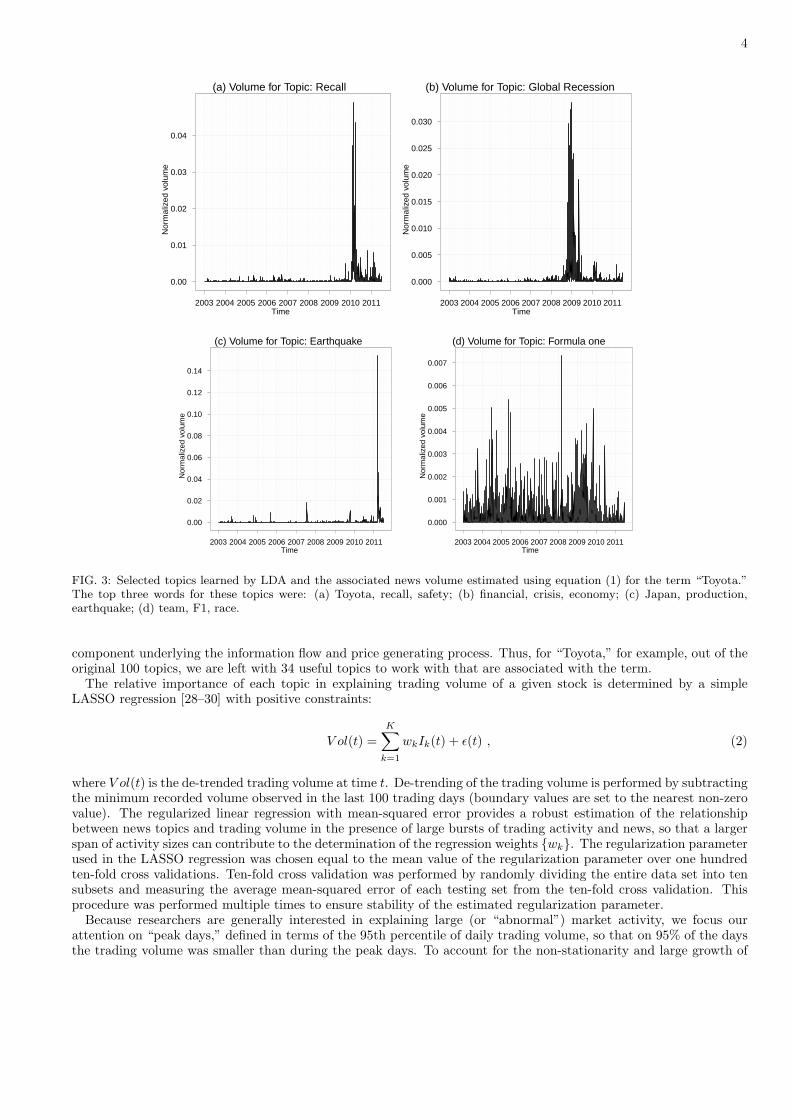
FIG. 4: The black line shows the de-trended trading volume of Toyota stock for the period from January 2003 to June 2011.The red dots indicate the “peak days” selected by the method described in the text. There are 119 “peak days” for the entireperiod from January 2003 to June 2011.
������ ���� � ������ ������� � ���� ����
������ ����������� �� ����� ������� � ���� ����
������ �� ��� ����� �������� � ���� ���
����!� �"����� �� #$���� ��� %&$���� � ���� ���!
����'� ������� �"����� ��� ���� ��"� � ���� ���
���� � ��� � ����� � ���$�� � ���� ���'
����(��)�� �� #� ��% ���� � � ���� ���'
������ ����� ��� ���� �)�� � ���� ���'
����* � ����� ��� ���� �������� � ��� � ���'
������� ������ ��� ���� ������� �� ����� �#����#� � ��� � ���!
��������%�� �#� ��� �� ��� � � ���� ����
������� ���� �������� ��� ���)�� � ���� ����
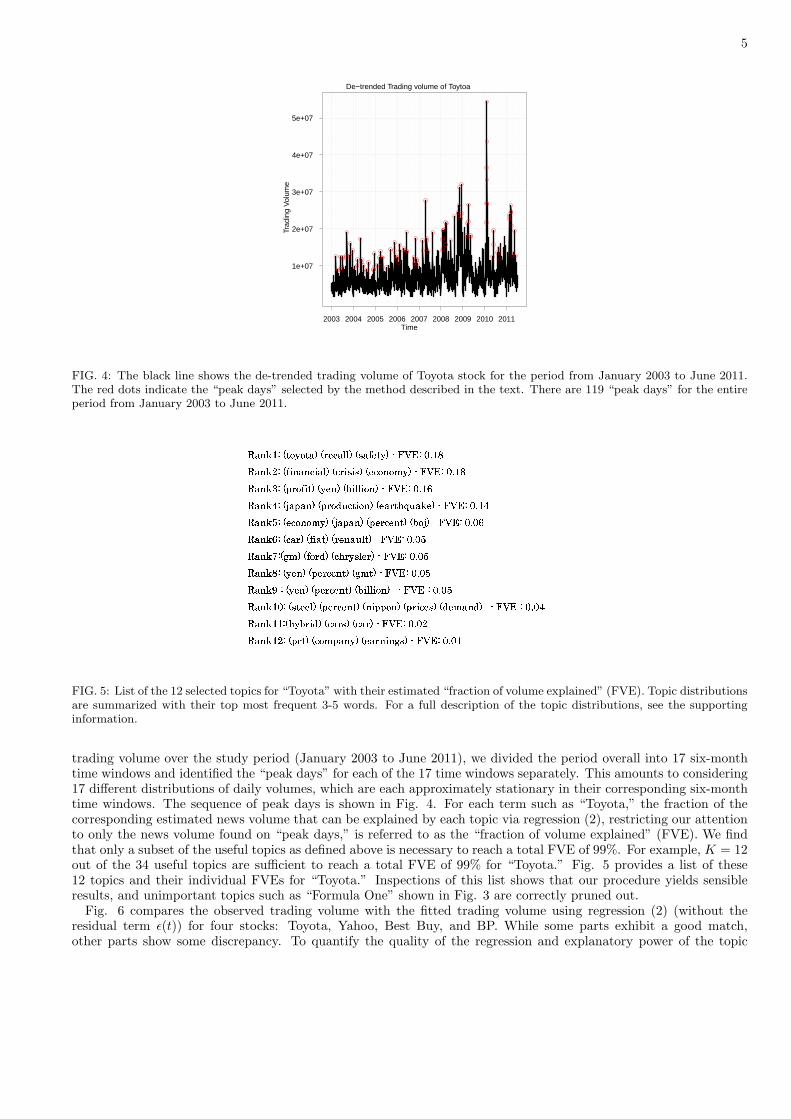
FIG. 5: List of the 12 selected topics for “Toyota” with their estimated “fraction of volume explained” (FVE). Topic distributionsare summarized with their top most frequent 3-5 words. For a full description of the topic distributions, see the supportinginformation.
trading volume over the study period (January 2003 to June 2011), we divided the period overall into 17 six-monthtime windows and identified the “peak days” for each of the 17 time windows separately. This amounts to considering17 different distributions of daily volumes, which are each approximately stationary in their corresponding six-monthtime windows. The sequence of peak days is shown in Fig. 4. For each term such as “Toyota,” the fraction of thecorresponding estimated news volume that can be explained by each topic via regression (2), restricting our attentionto only the news volume found on “peak days,” is referred to as the “fraction of volume explained” (FVE). We findthat only a subset of the useful topics as defined above is necessary to reach a total FVE of 99%. For example, K = 12out of the 34 useful topics are sufficient to reach a total FVE of 99% for “Toyota.” Fig. 5 provides a list of these12 topics and their individual FVEs for “Toyota.” Inspections of this list shows that our procedure yields sensibleresults, and unimportant topics such as “Formula One” shown in Fig. 3 are correctly pruned out.
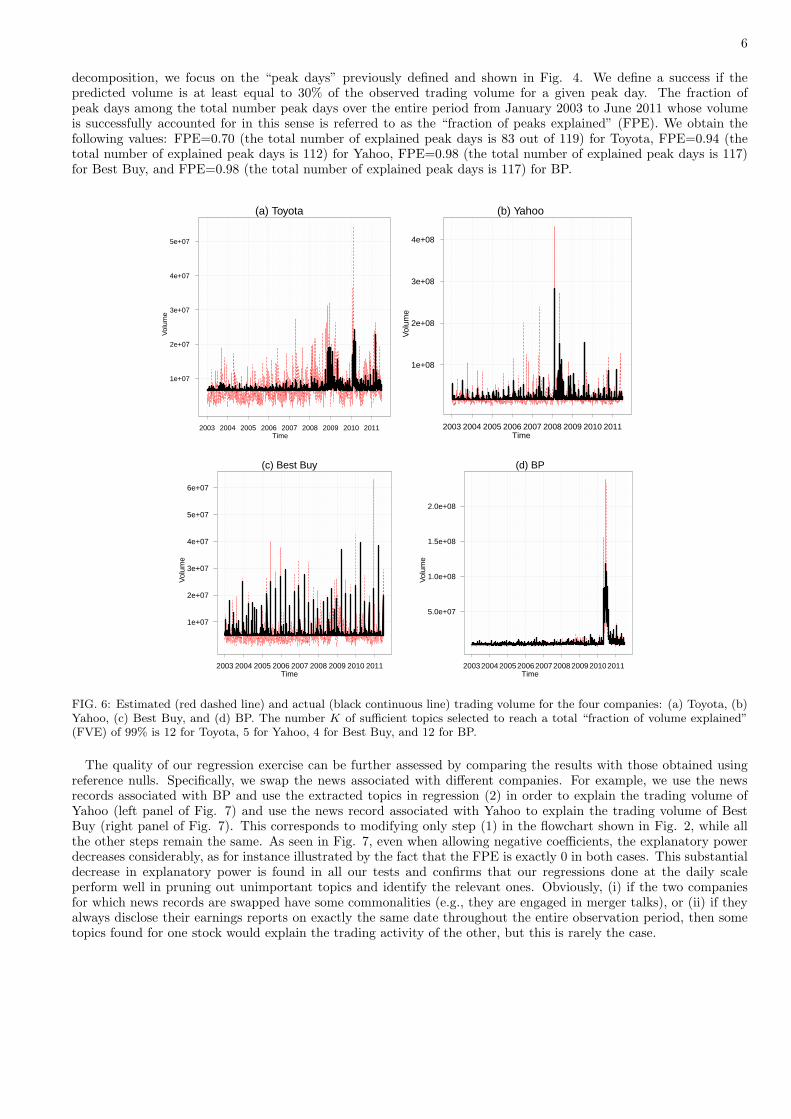
Fig. 6 compares the observed trading volume with the fitted trading volume using regression (2) (without theresidual term ǫ(t)) for four stocks: Toyota, Yahoo, Best Buy, and BP. While some parts exhibit a good match,other parts show some discrepancy. To quantify the quality of the regression and explanatory power of the topic
6
decomposition, we focus on the “peak days” previously defined and shown in Fig. 4. We define a success if thepredicted volume is at least equal to 30% of the observed trading volume for a given peak day. The fraction ofpeak days among the total number peak days over the entire period from January 2003 to June 2011 whose volumeis successfully accounted for in this sense is referred to as the “fraction of peaks explained” (FPE). We obtain thefollowing values: FPE=0.70 (the total number of explained peak days is 83 out of 119) for Toyota, FPE=0.94 (thetotal number of explained peak days is 112) for Yahoo, FPE=0.98 (the total number of explained peak days is 117)for Best Buy, and FPE=0.98 (the total number of explained peak days is 117) for BP.
(a) Toyota
Time
Vol
ume
1e+07
2e+07
3e+07
4e+07
5e+07
2003 2004 2005 2006 2007 2008 2009 2010 2011
(b) Yahoo
Time
Vol
ume
1e+08
2e+08
3e+08
4e+08
2003 2004 2005 2006 2007 2008 2009 2010 2011
(c) Best Buy
Time
Vol
ume
1e+07
2e+07
3e+07
4e+07
5e+07
6e+07
2003 2004 2005 2006 2007 2008 2009 2010 2011
(d) BP
Time
Vol
ume
5.0e+07
1.0e+08
1.5e+08
2.0e+08
200320042005200620072008200920102011
FIG. 6: Estimated (red dashed line) and actual (black continuous line) trading volume for the four companies: (a) Toyota, (b)Yahoo, (c) Best Buy, and (d) BP. The number K of sufficient topics selected to reach a total “fraction of volume explained”(FVE) of 99% is 12 for Toyota, 5 for Yahoo, 4 for Best Buy, and 12 for BP.
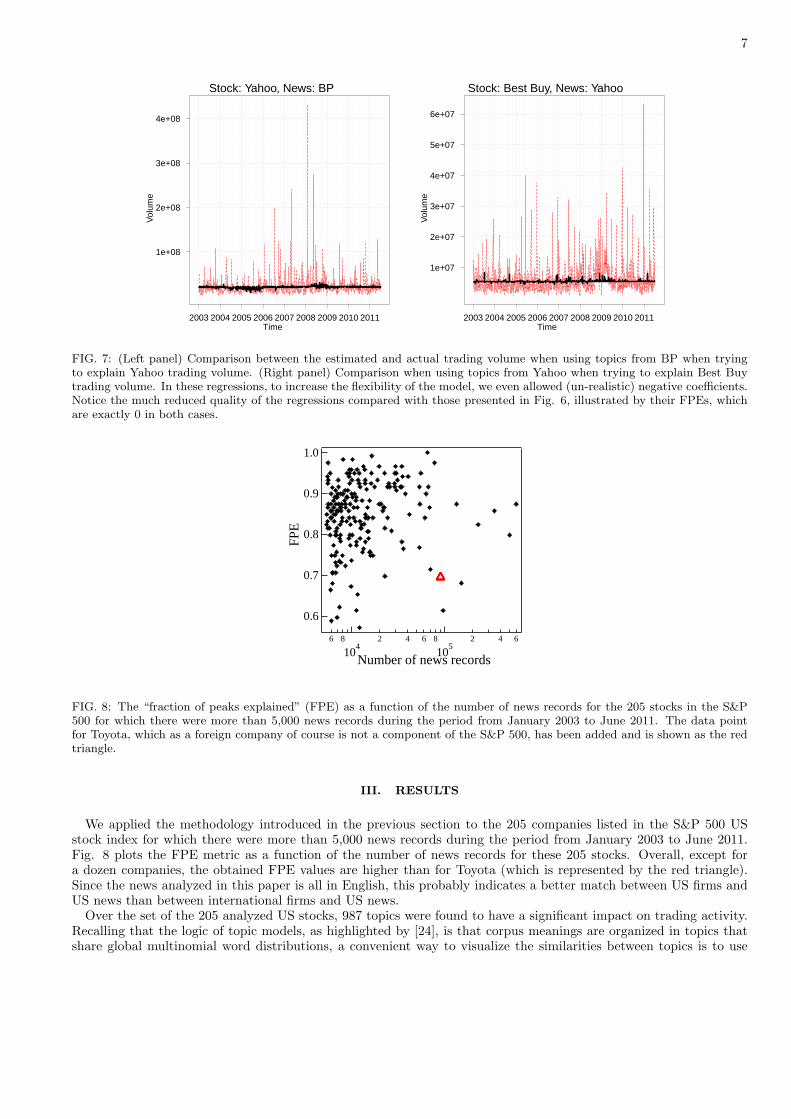
The quality of our regression exercise can be further assessed by comparing the results with those obtained usingreference nulls. Specifically, we swap the news associated with different companies. For example, we use the newsrecords associated with BP and use the extracted topics in regression (2) in order to explain the trading volume ofYahoo (left panel of Fig. 7) and use the news record associated with Yahoo to explain the trading volume of BestBuy (right panel of Fig. 7). This corresponds to modifying only step (1) in the flowchart shown in Fig. 2, while allthe other steps remain the same. As seen in Fig. 7, even when allowing negative coefficients, the explanatory powerdecreases considerably, as for instance illustrated by the fact that the FPE is exactly 0 in both cases. This substantialdecrease in explanatory power is found in all our tests and confirms that our regressions done at the daily scaleperform well in pruning out unimportant topics and identify the relevant ones. Obviously, (i) if the two companiesfor which news records are swapped have some commonalities (e.g., they are engaged in merger talks), or (ii) if theyalways disclose their earnings reports on exactly the same date throughout the entire observation period, then sometopics found for one stock would explain the trading activity of the other, but this is rarely the case.
7
Stock: Yahoo, News: BP
Time
Vol
ume
1e+08
2e+08
3e+08
4e+08
2003 2004 2005 2006 2007 2008 2009 2010 2011
Stock: Best Buy, News: Yahoo
Time
Vol
ume
1e+07
2e+07
3e+07
4e+07
5e+07
6e+07
2003 2004 2005 2006 2007 2008 2009 2010 2011
FIG. 7: (Left panel) Comparison between the estimated and actual trading volume when using topics from BP when tryingto explain Yahoo trading volume. (Right panel) Comparison when using topics from Yahoo when trying to explain Best Buytrading volume. In these regressions, to increase the flexibility of the model, we even allowed (un-realistic) negative coefficients.Notice the much reduced quality of the regressions compared with those presented in Fig. 6, illustrated by their FPEs, whichare exactly 0 in both cases.
1.0
0.9
0.8
0.7
0.6
6 8
104
2 4 6 8
105
2 4 6
FPE
Number of news records
FIG. 8: The “fraction of peaks explained” (FPE) as a function of the number of news records for the 205 stocks in the S&P500 for which there were more than 5,000 news records during the period from January 2003 to June 2011. The data pointfor Toyota, which as a foreign company of course is not a component of the S&P 500, has been added and is shown as the redtriangle.
III. RESULTS
We applied the methodology introduced in the previous section to the 205 companies listed in the S&P 500 USstock index for which there were more than 5,000 news records during the period from January 2003 to June 2011.Fig. 8 plots the FPE metric as a function of the number of news records for these 205 stocks. Overall, except fora dozen companies, the obtained FPE values are higher than for Toyota (which is represented by the red triangle).Since the news analyzed in this paper is all in English, this probably indicates a better match between US firms andUS news than between international firms and US news.
Over the set of the 205 analyzed US stocks, 987 topics were found to have a significant impact on trading activity.Recalling that the logic of topic models, as highlighted by [24], is that corpus meanings are organized in topics thatshare global multinomial word distributions, a convenient way to visualize the similarities between topics is to use
8
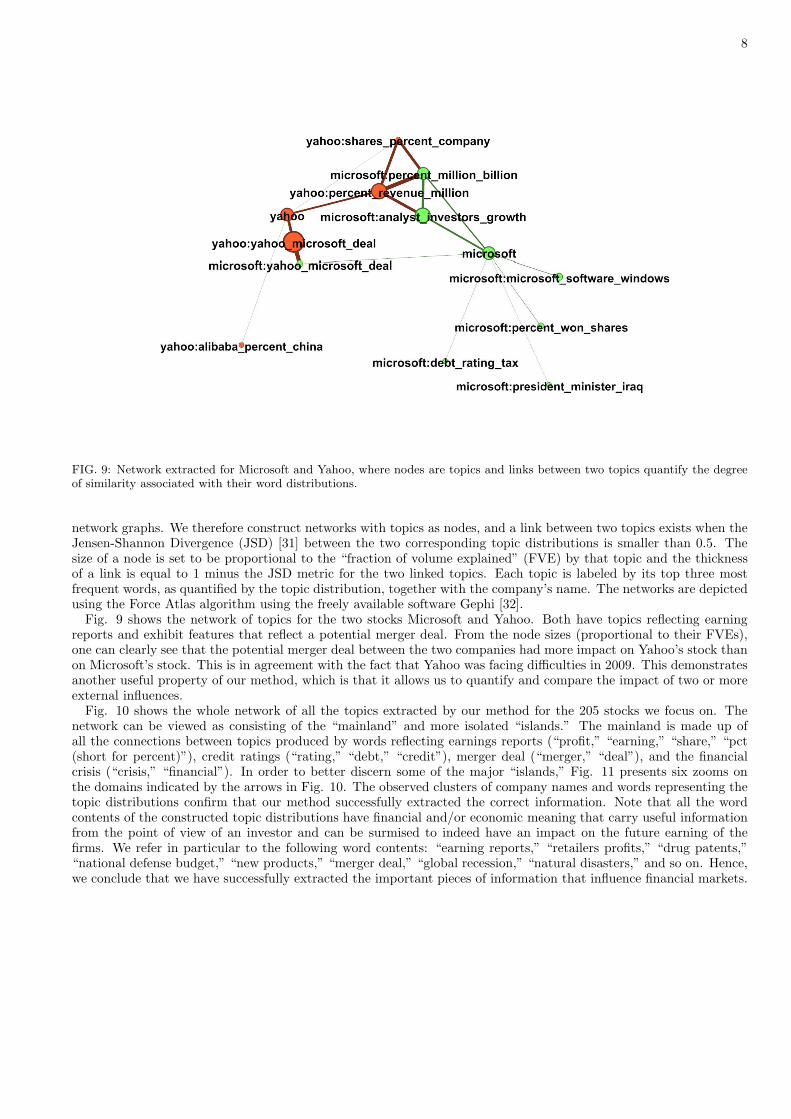
FIG. 9: Network extracted for Microsoft and Yahoo, where nodes are topics and links between two topics quantify the degreeof similarity associated with their word distributions.
network graphs. We therefore construct networks with topics as nodes, and a link between two topics exists when theJensen-Shannon Divergence (JSD) [31] between the two corresponding topic distributions is smaller than 0.5. Thesize of a node is set to be proportional to the “fraction of volume explained” (FVE) by that topic and the thicknessof a link is equal to 1 minus the JSD metric for the two linked topics. Each topic is labeled by its top three mostfrequent words, as quantified by the topic distribution, together with the company’s name. The networks are depictedusing the Force Atlas algorithm using the freely available software Gephi [32].
Fig. 9 shows the network of topics for the two stocks Microsoft and Yahoo. Both have topics reflecting earningreports and exhibit features that reflect a potential merger deal. From the node sizes (proportional to their FVEs),one can clearly see that the potential merger deal between the two companies had more impact on Yahoo’s stock thanon Microsoft’s stock. This is in agreement with the fact that Yahoo was facing difficulties in 2009. This demonstratesanother useful property of our method, which is that it allows us to quantify and compare the impact of two or moreexternal influences.
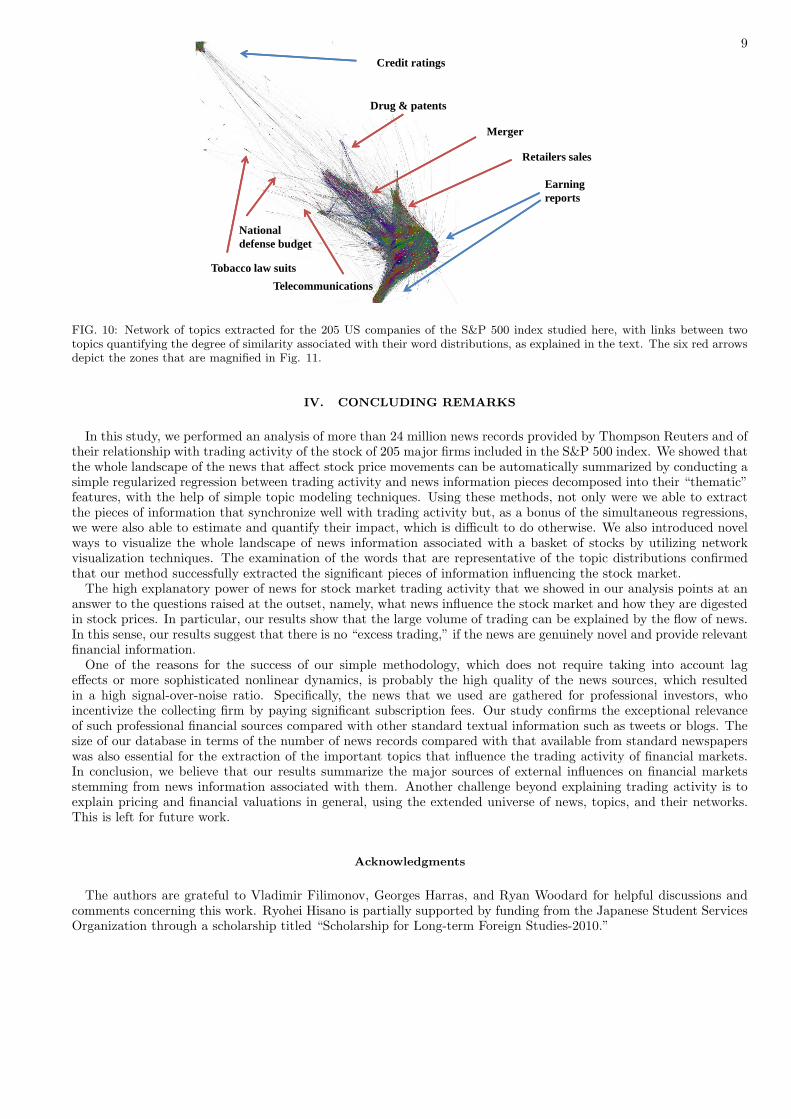
Fig. 10 shows the whole network of all the topics extracted by our method for the 205 stocks we focus on. Thenetwork can be viewed as consisting of the “mainland” and more isolated “islands.” The mainland is made up ofall the connections between topics produced by words reflecting earnings reports (“profit,” “earning,” “share,” “pct(short for percent)”), credit ratings (“rating,” “debt,” “credit”), merger deal (“merger,” “deal”), and the financialcrisis (“crisis,” “financial”). In order to better discern some of the major “islands,” Fig. 11 presents six zooms onthe domains indicated by the arrows in Fig. 10. The observed clusters of company names and words representing thetopic distributions confirm that our method successfully extracted the correct information. Note that all the wordcontents of the constructed topic distributions have financial and/or economic meaning that carry useful informationfrom the point of view of an investor and can be surmised to indeed have an impact on the future earning of thefirms. We refer in particular to the following word contents: “earning reports,” “retailers profits,” “drug patents,”“national defense budget,” “new products,” “merger deal,” “global recession,” “natural disasters,” and so on. Hence,we conclude that we have successfully extracted the important pieces of information that influence financial markets.
9
Credit ratings
Earning reports
Merger
Retailers sales
Drug & patents
National defense budget
Telecommunications
Tobacco law suits
FIG. 10: Network of topics extracted for the 205 US companies of the S&P 500 index studied here, with links between twotopics quantifying the degree of similarity associated with their word distributions, as explained in the text. The six red arrowsdepict the zones that are magnified in Fig. 11.
IV. CONCLUDING REMARKS
In this study, we performed an analysis of more than 24 million news records provided by Thompson Reuters and oftheir relationship with trading activity of the stock of 205 major firms included in the S&P 500 index. We showed thatthe whole landscape of the news that affect stock price movements can be automatically summarized by conducting asimple regularized regression between trading activity and news information pieces decomposed into their “thematic”features, with the help of simple topic modeling techniques. Using these methods, not only were we able to extractthe pieces of information that synchronize well with trading activity but, as a bonus of the simultaneous regressions,we were also able to estimate and quantify their impact, which is difficult to do otherwise. We also introduced novelways to visualize the whole landscape of news information associated with a basket of stocks by utilizing networkvisualization techniques. The examination of the words that are representative of the topic distributions confirmedthat our method successfully extracted the significant pieces of information influencing the stock market.
The high explanatory power of news for stock market trading activity that we showed in our analysis points at ananswer to the questions raised at the outset, namely, what news influence the stock market and how they are digestedin stock prices. In particular, our results show that the large volume of trading can be explained by the flow of news.In this sense, our results suggest that there is no “excess trading,” if the news are genuinely novel and provide relevantfinancial information.
One of the reasons for the success of our simple methodology, which does not require taking into account lageffects or more sophisticated nonlinear dynamics, is probably the high quality of the news sources, which resultedin a high signal-over-noise ratio. Specifically, the news that we used are gathered for professional investors, whoincentivize the collecting firm by paying significant subscription fees. Our study confirms the exceptional relevanceof such professional financial sources compared with other standard textual information such as tweets or blogs. Thesize of our database in terms of the number of news records compared with that available from standard newspaperswas also essential for the extraction of the important topics that influence the trading activity of financial markets.In conclusion, we believe that our results summarize the major sources of external influences on financial marketsstemming from news information associated with them. Another challenge beyond explaining trading activity is toexplain pricing and financial valuations in general, using the extended universe of news, topics, and their networks.This is left for future work.
Acknowledgments
The authors are grateful to Vladimir Filimonov, Georges Harras, and Ryan Woodard for helpful discussions andcomments concerning this work. Ryohei Hisano is partially supported by funding from the Japanese Student ServicesOrganization through a scholarship titled “Scholarship for Long-term Foreign Studies-2010.”
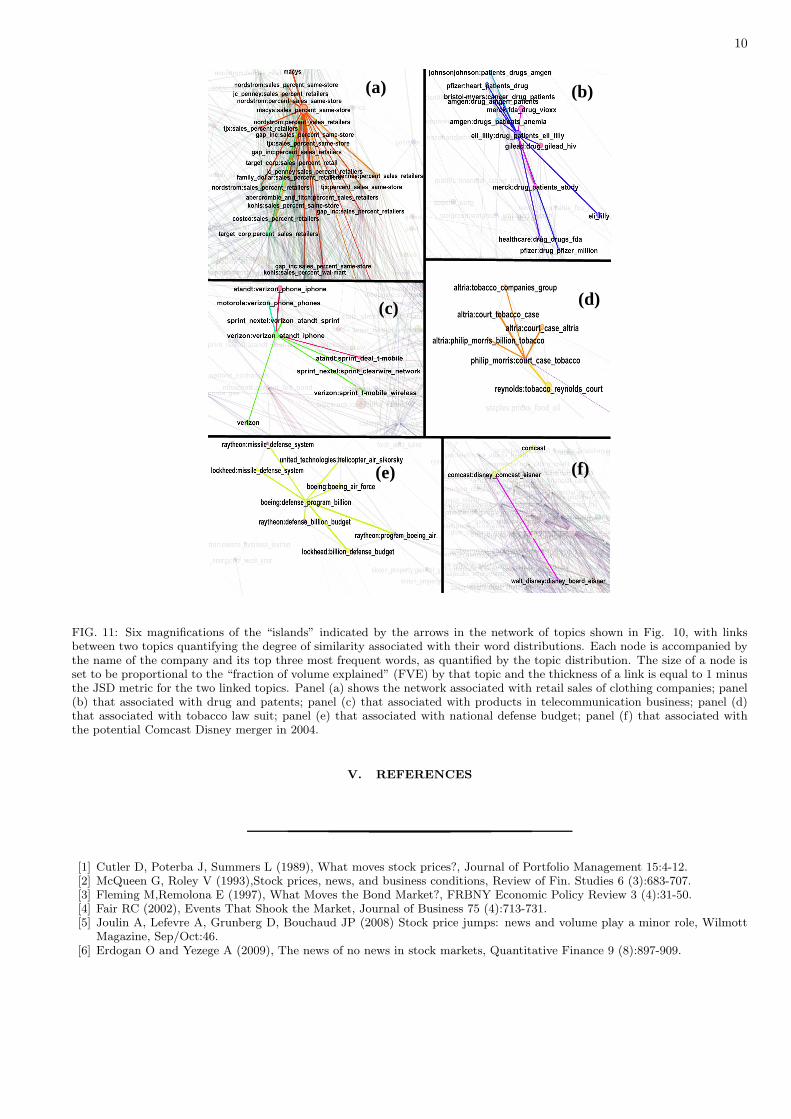
10
(a) (b)
(c) (d)
(e) (f)
FIG. 11: Six magnifications of the “islands” indicated by the arrows in the network of topics shown in Fig. 10, with linksbetween two topics quantifying the degree of similarity associated with their word distributions. Each node is accompanied bythe name of the company and its top three most frequent words, as quantified by the topic distribution. The size of a node isset to be proportional to the “fraction of volume explained” (FVE) by that topic and the thickness of a link is equal to 1 minusthe JSD metric for the two linked topics. Panel (a) shows the network associated with retail sales of clothing companies; panel(b) that associated with drug and patents; panel (c) that associated with products in telecommunication business; panel (d)that associated with tobacco law suit; panel (e) that associated with national defense budget; panel (f) that associated withthe potential Comcast Disney merger in 2004.
V. REFERENCES
[1] Cutler D, Poterba J, Summers L (1989), What moves stock prices?, Journal of Portfolio Management 15:4-12.[2] McQueen G, Roley V (1993),Stock prices, news, and business conditions, Review of Fin. Studies 6 (3):683-707.[3] Fleming M,Remolona E (1997), What Moves the Bond Market?, FRBNY Economic Policy Review 3 (4):31-50.[4] Fair RC (2002), Events That Shook the Market, Journal of Business 75 (4):713-731.[5] Joulin A, Lefevre A, Grunberg D, Bouchaud JP (2008) Stock price jumps: news and volume play a minor role, Wilmott
Magazine, Sep/Oct:46.[6] Erdogan O and Yezege A (2009), The news of no news in stock markets, Quantitative Finance 9 (8):897-909.
11
[7] Shiller RJ (1981), Do stock prices move too much to be justified by subsequent changes in dividends?, American EconomicReview, 71:421-436.
[8] LeRoy SF and Porter RD (1981), The Present-Value Relation: Tests Based on Implied Variance Bounds, Econometrica:Journal of the Econometric Society:555-574.
[9] LeRoy SF(2008), Excess Volatility Tests, The New Palgrave Dictionary of Economics, The New Palgrave Dictionary ofEconomics, 2nd ed.
[10] Soros G, The Alchemy of Finance, Wiley Investment Classics, Wiley (July 29, 2003).[11] Filimonov V, Sornette D, Quantifying Reflexivity in Financial Markets: Toward a Prediction of Flash Crashes, Physical
Review E 85 (5): 056108 (2012).[12] Reinhart CM, Rogoff K, This Time Is Different: Eight Centuries of Financial Folly, Princeton University Press (July 18,
2011).[13] Zhi D, Engelberg J, Gao P (2011), In search of attention, The Journal of Finance, Vol LXVI, No. 5, Oct 2011.[14] Dellavigna S and Pollet JM (2009), Investor Inattention and Friday Earnings Announcements, The Journal of Finance,
Vol 64, Issue 2:709-749.[15] Engelberg J and Parsons C (2011), The causal impact of media in financial markets, The Journal of Finance, Vol 66, Issue
1:67-97.[16] Tetlock P (2007), Giving content to investor sentiment: The role of media in the stock market, Journal of Finance 62:1139-
1168.[17] Bollen J, Mao H and Zeng XJ (2011), Twitter mood predicts the stock market, Journal of Computational Science 2:1-8.[18] Ulh MW (2011), Reuters Sentiment and Stock Returns, http://ssrn.com/abstract=1924867.[19] Gurun UG, Butler AW (2012), Don’t Believe the Hype: Local Media Slant, Local Advertising, and Firm Value, The
Journal of Finance Volume 67, Issue 2:561-598, April 2012.[20] Ito T, Roley VV (1987), News From the U.S. and Japan Which moves the Yen/Dollar Exchange Rate?, Journal of Monetary
Economics 19:255-277.[21] Mizuno T, Takei K, Ohnishi T, Watanabe T (2012), Temporal and Cross Correlations in Business News, Progress of
Theoretical Physics Supplement, No.194:181-192.[22] Blei DM, Ng AY, Jordan MI (2003), Latent Dirichlet Allocation, Journal of Machine Learning Research 3:993-1022.[23] Griffiths T, Steyvers M (2004) Finding Scientific topics, PNAS 101:5228-5235.[24] Koller D and Friedman N (2009), Probabilistic Graphical Models, The MIT press.[25] Smola A, Narayanamurthy S (2010), An Architecture for Parallel Topic Models, Proceedings of the VLDB Endowment,
Vol. 3, No. 1.[26] Hinton GE and Salakhutdinov RR (2010), Discovering Binary Codes for Documents by Learning Deep Generative Models,
Topics in Cognitive Science (2010),1-18.[27] Mimno D and Blei D (2011), Bayesian Checking for Topic Models, Empirical Methods in Natural Language Processing,
2011.[28] Tibshirani R (1996), Regression shrinkage and selection via the lasso, J. Royal. Statist. Soc B., Vol. 58, No. 1:267-288.[29] Hastie T, Tibshirani R, Friedman J (2009),The Elements of Statistical Learning: Data Mining, Inference and Prediction,
Springer, 2nd Edition.[30] Goeman JJ (2010), CL-1 Penalized Estimation in the Cox Proportional Hazards Model, Biometrical Journal 52 (1):70-84.[31] Endres DM, Schindelin JE(2003), A new metric for probability distributions, IEEE Trans. Inf. Theory 49(7):1858-1860.[32] Gephi, https://gephi.org/
VI. EXACT PRUNING PROCDEDURE OF STEP (2-B)
A. Topics reflecting repeated phrases
If the top 6 words in the topic distribution included more than one of these words listed below we defined the topicdistribution as only reflecting repeated news phrases. Namely they are “top”, “news”, “reutersnet”, “messaging”,“double”, “click”, “words”, “moved”, “update”, “stories”, “press”, “corp”, “services”, and “trademark”.
B. Topics reflecting market words
If the top 6 words in the topic distribution included more than one of these words listed below we defined thetopic distribution as only reflecting market news. Namely they are “stock”, “stocks”, “index”, “futures”, “market”,“rose”, “fell”, “buy”, “sell”, “nasdaq”, “nyse”, “dow”, “target”,all sorts of numbers and names of month (i.e. “jan”,“january”,...).
12
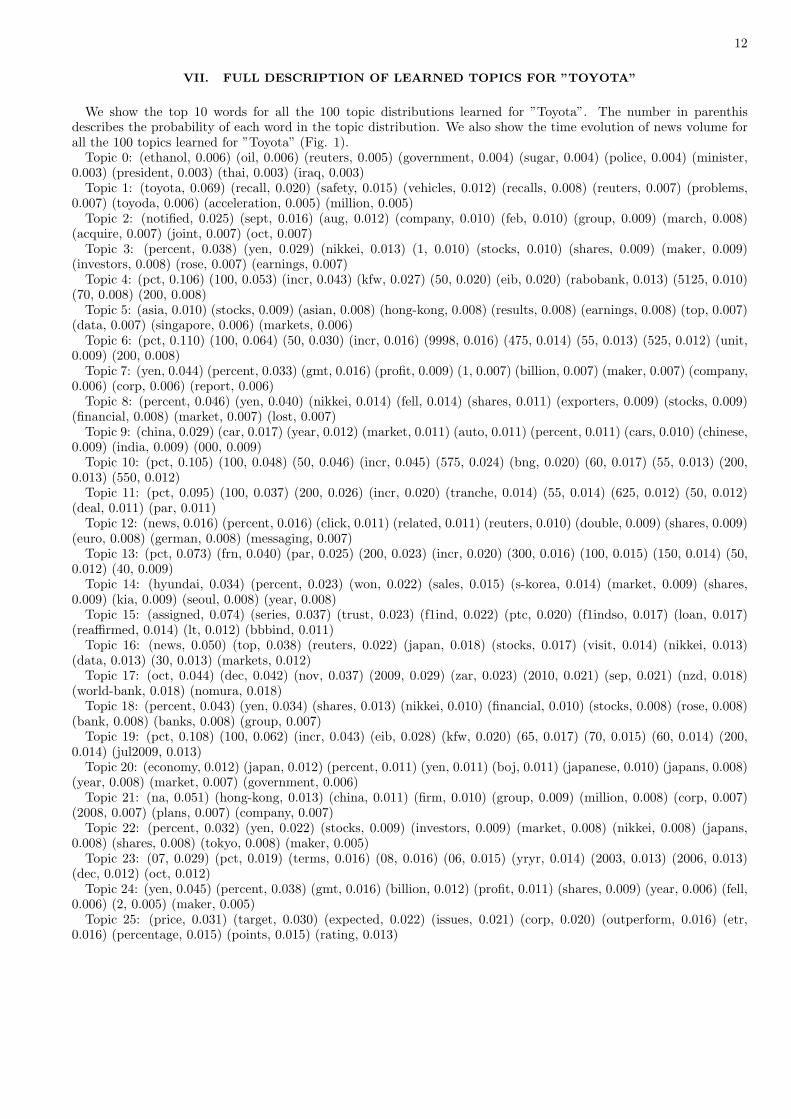
VII. FULL DESCRIPTION OF LEARNED TOPICS FOR ”TOYOTA”
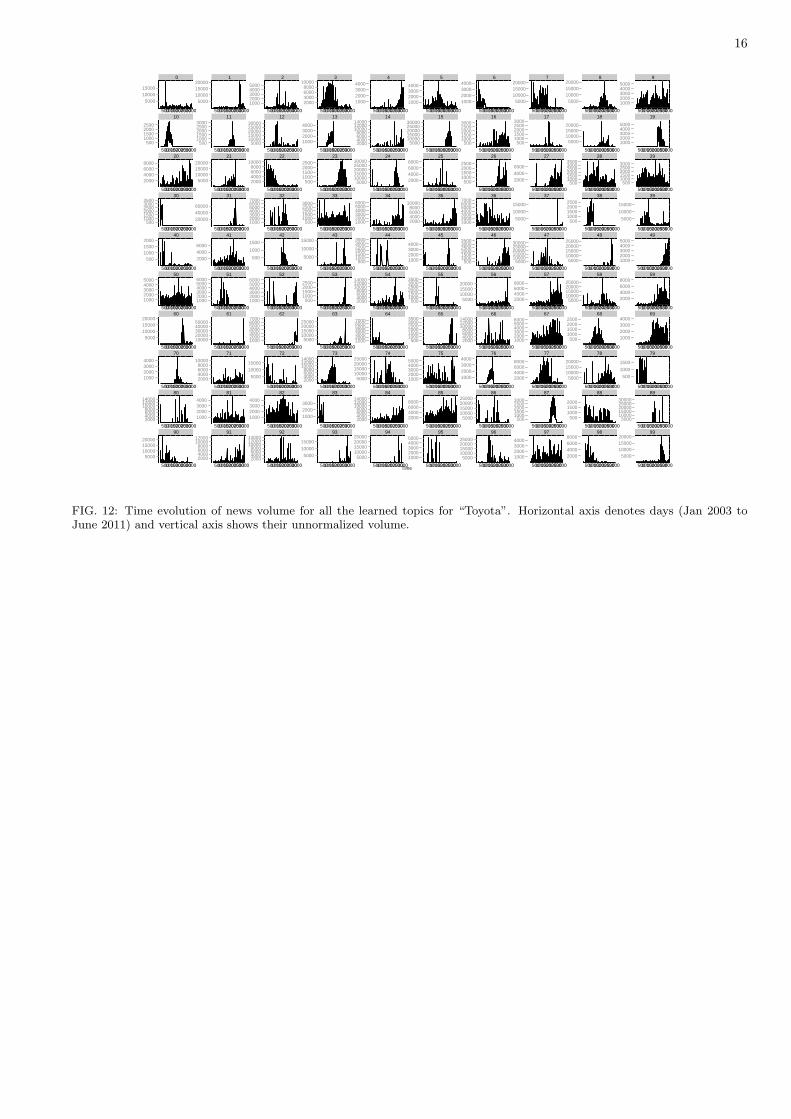
We show the top 10 words for all the 100 topic distributions learned for ”Toyota”. The number in parenthisdescribes the probability of each word in the topic distribution. We also show the time evolution of news volume forall the 100 topics learned for ”Toyota” (Fig. 1).
Topic 0: (ethanol, 0.006) (oil, 0.006) (reuters, 0.005) (government, 0.004) (sugar, 0.004) (police, 0.004) (minister,0.003) (president, 0.003) (thai, 0.003) (iraq, 0.003)
Topic 1: (toyota, 0.069) (recall, 0.020) (safety, 0.015) (vehicles, 0.012) (recalls, 0.008) (reuters, 0.007) (problems,0.007) (toyoda, 0.006) (acceleration, 0.005) (million, 0.005)
Topic 2: (notified, 0.025) (sept, 0.016) (aug, 0.012) (company, 0.010) (feb, 0.010) (group, 0.009) (march, 0.008)(acquire, 0.007) (joint, 0.007) (oct, 0.007)
Topic 3: (percent, 0.038) (yen, 0.029) (nikkei, 0.013) (1, 0.010) (stocks, 0.010) (shares, 0.009) (maker, 0.009)(investors, 0.008) (rose, 0.007) (earnings, 0.007)
Topic 4: (pct, 0.106) (100, 0.053) (incr, 0.043) (kfw, 0.027) (50, 0.020) (eib, 0.020) (rabobank, 0.013) (5125, 0.010)(70, 0.008) (200, 0.008)
Topic 5: (asia, 0.010) (stocks, 0.009) (asian, 0.008) (hong-kong, 0.008) (results, 0.008) (earnings, 0.008) (top, 0.007)(data, 0.007) (singapore, 0.006) (markets, 0.006)
Topic 6: (pct, 0.110) (100, 0.064) (50, 0.030) (incr, 0.016) (9998, 0.016) (475, 0.014) (55, 0.013) (525, 0.012) (unit,0.009) (200, 0.008)
Topic 7: (yen, 0.044) (percent, 0.033) (gmt, 0.016) (profit, 0.009) (1, 0.007) (billion, 0.007) (maker, 0.007) (company,0.006) (corp, 0.006) (report, 0.006)
Topic 8: (percent, 0.046) (yen, 0.040) (nikkei, 0.014) (fell, 0.014) (shares, 0.011) (exporters, 0.009) (stocks, 0.009)(financial, 0.008) (market, 0.007) (lost, 0.007)
Topic 9: (china, 0.029) (car, 0.017) (year, 0.012) (market, 0.011) (auto, 0.011) (percent, 0.011) (cars, 0.010) (chinese,0.009) (india, 0.009) (000, 0.009)
Topic 10: (pct, 0.105) (100, 0.048) (50, 0.046) (incr, 0.045) (575, 0.024) (bng, 0.020) (60, 0.017) (55, 0.013) (200,0.013) (550, 0.012)
Topic 11: (pct, 0.095) (100, 0.037) (200, 0.026) (incr, 0.020) (tranche, 0.014) (55, 0.014) (625, 0.012) (50, 0.012)(deal, 0.011) (par, 0.011)
Topic 12: (news, 0.016) (percent, 0.016) (click, 0.011) (related, 0.011) (reuters, 0.010) (double, 0.009) (shares, 0.009)(euro, 0.008) (german, 0.008) (messaging, 0.007)
Topic 13: (pct, 0.073) (frn, 0.040) (par, 0.025) (200, 0.023) (incr, 0.020) (300, 0.016) (100, 0.015) (150, 0.014) (50,0.012) (40, 0.009)
Topic 14: (hyundai, 0.034) (percent, 0.023) (won, 0.022) (sales, 0.015) (s-korea, 0.014) (market, 0.009) (shares,0.009) (kia, 0.009) (seoul, 0.008) (year, 0.008)
Topic 15: (assigned, 0.074) (series, 0.037) (trust, 0.023) (f1ind, 0.022) (ptc, 0.020) (f1indso, 0.017) (loan, 0.017)(reaffirmed, 0.014) (lt, 0.012) (bbbind, 0.011)
Topic 16: (news, 0.050) (top, 0.038) (reuters, 0.022) (japan, 0.018) (stocks, 0.017) (visit, 0.014) (nikkei, 0.013)(data, 0.013) (30, 0.013) (markets, 0.012)
Topic 17: (oct, 0.044) (dec, 0.042) (nov, 0.037) (2009, 0.029) (zar, 0.023) (2010, 0.021) (sep, 0.021) (nzd, 0.018)(world-bank, 0.018) (nomura, 0.018)
Topic 18: (percent, 0.043) (yen, 0.034) (shares, 0.013) (nikkei, 0.010) (financial, 0.010) (stocks, 0.008) (rose, 0.008)(bank, 0.008) (banks, 0.008) (group, 0.007)
Topic 19: (pct, 0.108) (100, 0.062) (incr, 0.043) (eib, 0.028) (kfw, 0.020) (65, 0.017) (70, 0.015) (60, 0.014) (200,0.014) (jul2009, 0.013)
Topic 20: (economy, 0.012) (japan, 0.012) (percent, 0.011) (yen, 0.011) (boj, 0.011) (japanese, 0.010) (japans, 0.008)(year, 0.008) (market, 0.007) (government, 0.006)
Topic 21: (na, 0.051) (hong-kong, 0.013) (china, 0.011) (firm, 0.010) (group, 0.009) (million, 0.008) (corp, 0.007)(2008, 0.007) (plans, 0.007) (company, 0.007)
Topic 22: (percent, 0.032) (yen, 0.022) (stocks, 0.009) (investors, 0.009) (market, 0.008) (nikkei, 0.008) (japans,0.008) (shares, 0.008) (tokyo, 0.008) (maker, 0.005)
Topic 23: (07, 0.029) (pct, 0.019) (terms, 0.016) (08, 0.016) (06, 0.015) (yryr, 0.014) (2003, 0.013) (2006, 0.013)(dec, 0.012) (oct, 0.012)
Topic 24: (yen, 0.045) (percent, 0.038) (gmt, 0.016) (billion, 0.012) (profit, 0.011) (shares, 0.009) (year, 0.006) (fell,0.006) (2, 0.005) (maker, 0.005)
Topic 25: (price, 0.031) (target, 0.030) (expected, 0.022) (issues, 0.021) (corp, 0.020) (outperform, 0.016) (etr,0.016) (percentage, 0.015) (points, 0.015) (rating, 0.013)
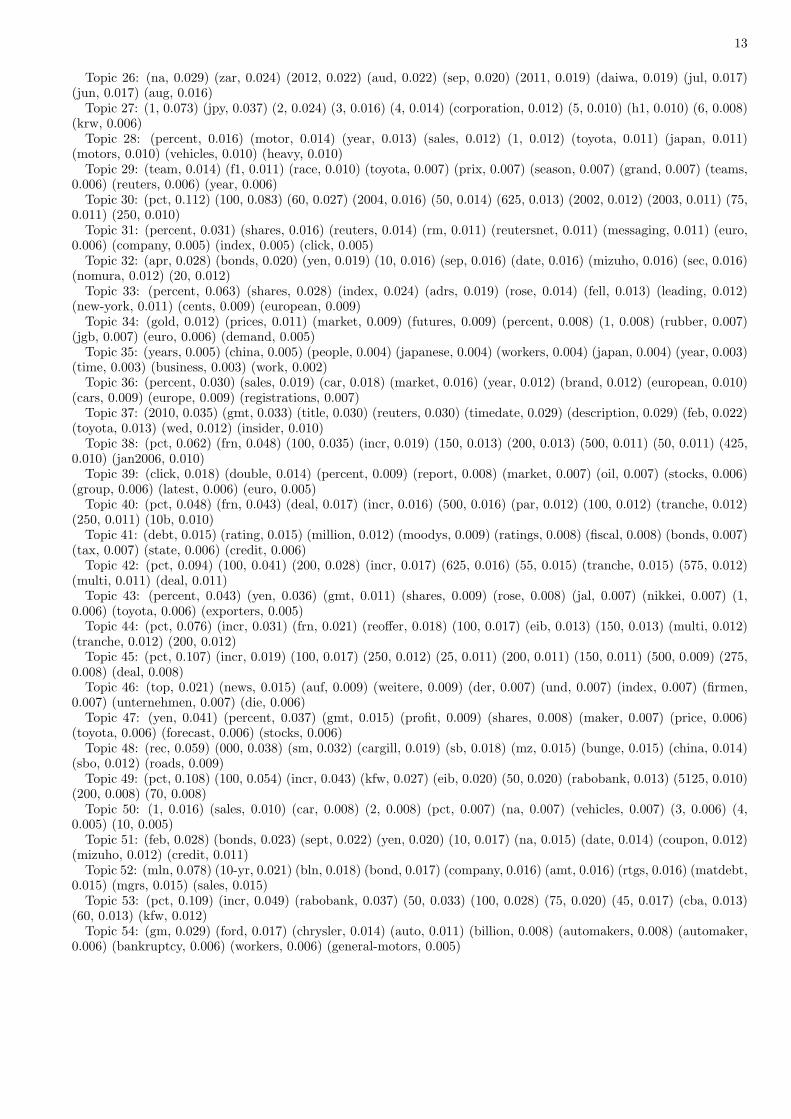
13
Topic 26: (na, 0.029) (zar, 0.024) (2012, 0.022) (aud, 0.022) (sep, 0.020) (2011, 0.019) (daiwa, 0.019) (jul, 0.017)(jun, 0.017) (aug, 0.016)
Topic 27: (1, 0.073) (jpy, 0.037) (2, 0.024) (3, 0.016) (4, 0.014) (corporation, 0.012) (5, 0.010) (h1, 0.010) (6, 0.008)(krw, 0.006)
Topic 28: (percent, 0.016) (motor, 0.014) (year, 0.013) (sales, 0.012) (1, 0.012) (toyota, 0.011) (japan, 0.011)(motors, 0.010) (vehicles, 0.010) (heavy, 0.010)
Topic 29: (team, 0.014) (f1, 0.011) (race, 0.010) (toyota, 0.007) (prix, 0.007) (season, 0.007) (grand, 0.007) (teams,0.006) (reuters, 0.006) (year, 0.006)
Topic 30: (pct, 0.112) (100, 0.083) (60, 0.027) (2004, 0.016) (50, 0.014) (625, 0.013) (2002, 0.012) (2003, 0.011) (75,0.011) (250, 0.010)
Topic 31: (percent, 0.031) (shares, 0.016) (reuters, 0.014) (rm, 0.011) (reutersnet, 0.011) (messaging, 0.011) (euro,0.006) (company, 0.005) (index, 0.005) (click, 0.005)
Topic 32: (apr, 0.028) (bonds, 0.020) (yen, 0.019) (10, 0.016) (sep, 0.016) (date, 0.016) (mizuho, 0.016) (sec, 0.016)(nomura, 0.012) (20, 0.012)
Topic 33: (percent, 0.063) (shares, 0.028) (index, 0.024) (adrs, 0.019) (rose, 0.014) (fell, 0.013) (leading, 0.012)(new-york, 0.011) (cents, 0.009) (european, 0.009)
Topic 34: (gold, 0.012) (prices, 0.011) (market, 0.009) (futures, 0.009) (percent, 0.008) (1, 0.008) (rubber, 0.007)(jgb, 0.007) (euro, 0.006) (demand, 0.005)
Topic 35: (years, 0.005) (china, 0.005) (people, 0.004) (japanese, 0.004) (workers, 0.004) (japan, 0.004) (year, 0.003)(time, 0.003) (business, 0.003) (work, 0.002)
Topic 36: (percent, 0.030) (sales, 0.019) (car, 0.018) (market, 0.016) (year, 0.012) (brand, 0.012) (european, 0.010)(cars, 0.009) (europe, 0.009) (registrations, 0.007)
Topic 37: (2010, 0.035) (gmt, 0.033) (title, 0.030) (reuters, 0.030) (timedate, 0.029) (description, 0.029) (feb, 0.022)(toyota, 0.013) (wed, 0.012) (insider, 0.010)
Topic 38: (pct, 0.062) (frn, 0.048) (100, 0.035) (incr, 0.019) (150, 0.013) (200, 0.013) (500, 0.011) (50, 0.011) (425,0.010) (jan2006, 0.010)
Topic 39: (click, 0.018) (double, 0.014) (percent, 0.009) (report, 0.008) (market, 0.007) (oil, 0.007) (stocks, 0.006)(group, 0.006) (latest, 0.006) (euro, 0.005)
Topic 40: (pct, 0.048) (frn, 0.043) (deal, 0.017) (incr, 0.016) (500, 0.016) (par, 0.012) (100, 0.012) (tranche, 0.012)(250, 0.011) (10b, 0.010)
Topic 41: (debt, 0.015) (rating, 0.015) (million, 0.012) (moodys, 0.009) (ratings, 0.008) (fiscal, 0.008) (bonds, 0.007)(tax, 0.007) (state, 0.006) (credit, 0.006)
Topic 42: (pct, 0.094) (100, 0.041) (200, 0.028) (incr, 0.017) (625, 0.016) (55, 0.015) (tranche, 0.015) (575, 0.012)(multi, 0.011) (deal, 0.011)
Topic 43: (percent, 0.043) (yen, 0.036) (gmt, 0.011) (shares, 0.009) (rose, 0.008) (jal, 0.007) (nikkei, 0.007) (1,0.006) (toyota, 0.006) (exporters, 0.005)
Topic 44: (pct, 0.076) (incr, 0.031) (frn, 0.021) (reoffer, 0.018) (100, 0.017) (eib, 0.013) (150, 0.013) (multi, 0.012)(tranche, 0.012) (200, 0.012)
Topic 45: (pct, 0.107) (incr, 0.019) (100, 0.017) (250, 0.012) (25, 0.011) (200, 0.011) (150, 0.011) (500, 0.009) (275,0.008) (deal, 0.008)
Topic 46: (top, 0.021) (news, 0.015) (auf, 0.009) (weitere, 0.009) (der, 0.007) (und, 0.007) (index, 0.007) (firmen,0.007) (unternehmen, 0.007) (die, 0.006)
Topic 47: (yen, 0.041) (percent, 0.037) (gmt, 0.015) (profit, 0.009) (shares, 0.008) (maker, 0.007) (price, 0.006)(toyota, 0.006) (forecast, 0.006) (stocks, 0.006)
Topic 48: (rec, 0.059) (000, 0.038) (sm, 0.032) (cargill, 0.019) (sb, 0.018) (mz, 0.015) (bunge, 0.015) (china, 0.014)(sbo, 0.012) (roads, 0.009)
Topic 49: (pct, 0.108) (100, 0.054) (incr, 0.043) (kfw, 0.027) (eib, 0.020) (50, 0.020) (rabobank, 0.013) (5125, 0.010)(200, 0.008) (70, 0.008)
Topic 50: (1, 0.016) (sales, 0.010) (car, 0.008) (2, 0.008) (pct, 0.007) (na, 0.007) (vehicles, 0.007) (3, 0.006) (4,0.005) (10, 0.005)
Topic 51: (feb, 0.028) (bonds, 0.023) (sept, 0.022) (yen, 0.020) (10, 0.017) (na, 0.015) (date, 0.014) (coupon, 0.012)(mizuho, 0.012) (credit, 0.011)
Topic 52: (mln, 0.078) (10-yr, 0.021) (bln, 0.018) (bond, 0.017) (company, 0.016) (amt, 0.016) (rtgs, 0.016) (matdebt,0.015) (mgrs, 0.015) (sales, 0.015)
Topic 53: (pct, 0.109) (incr, 0.049) (rabobank, 0.037) (50, 0.033) (100, 0.028) (75, 0.020) (45, 0.017) (cba, 0.013)(60, 0.013) (kfw, 0.012)
Topic 54: (gm, 0.029) (ford, 0.017) (chrysler, 0.014) (auto, 0.011) (billion, 0.008) (automakers, 0.008) (automaker,0.006) (bankruptcy, 0.006) (workers, 0.006) (general-motors, 0.005)
14
Topic 55: (pct, 0.086) (par, 0.028) (reoffer, 0.025) (10b, 0.023) (frn, 0.022) (500, 0.018) (300, 0.010) (incr, 0.009)(200, 0.008) (475, 0.008)
Topic 56: (hybrid, 0.017) (cars, 0.016) (car, 0.013) (electric, 0.013) (vehicles, 0.011) (toyota, 0.010) (fuel, 0.008)(technology, 0.007) (battery, 0.006) (batteries, 0.005)
Topic 57: (words, 0.035) (moved, 0.022) (update, 0.019) (expect, 0.013) (1, 0.011) (2, 0.009) (business, 0.006) (600,0.006) (gmt, 0.006) (3, 0.005)
Topic 58: (yen, 0.043) (percent, 0.035) (gmt, 0.017) (billion, 0.012) (profit, 0.011) (shares, 0.009) (year, 0.008)(forecast, 0.006) (maker, 0.006) (million, 0.006)
Topic 59: (percent, 0.034) (yen, 0.033) (nikkei, 0.021) (market, 0.011) (shares, 0.010) (rose, 0.008) (investors, 0.007)(exporters, 0.007) (average, 0.007) (3, 0.006)
Topic 60: (financial, 0.013) (crisis, 0.011) (economy, 0.010) (global, 0.009) (cut, 0.009) (banks, 0.008) (economic,0.008) (recession, 0.007) (billion, 0.007) (percent, 0.006)
Topic 61: (japan, 0.026) (production, 0.020) (earthquake, 0.011) (plant, 0.011) (plants, 0.009) (nuclear, 0.009)(power, 0.009) (parts, 0.009) (quake, 0.008) (supply, 0.008)
Topic 62: (pct, 0.110) (incr, 0.060) (50, 0.049) (100, 0.032) (rabobank, 0.025) (60, 0.023) (bng, 0.016) (575, 0.015)(kfw, 0.015) (jan2015, 0.010)
Topic 63: (fixed, 0.019) (tap, 0.015) (westpac, 0.014) (bond, 0.014) (mln, 0.013) (rmbs, 0.012) (undisc, 0.012) (frn,0.012) (eurobond, 0.012) (aaaa1aa, 0.011)
Topic 64: (03, 0.030) (02, 0.024) (pct, 0.018) (terms, 0.015) (2002, 0.015) (2001, 0.014) (1997, 0.013) (yryr, 0.013)(1999, 0.012) (dec, 0.012)
Topic 65: (pct, 0.107) (100, 0.059) (incr, 0.041) (kfw, 0.025) (eib, 0.023) (60, 0.013) (200, 0.012) (65, 0.011) (70,0.011) (jul2009, 0.010)
Topic 66: (auto, 0.012) (sales, 0.011) (sees, 0.009) (stories, 0.008) (gm, 0.007) (car, 0.007) (europe, 0.006) (toyota,0.005) (news, 0.005)
Topic 67: (percent, 0.032) (dollar, 0.013) (stocks, 0.010) (markets, 0.009) (index, 0.008) (shares, 0.008) (investors,0.008) (asian, 0.008) (fell, 0.007) (yen, 0.007)
Topic 68: (05, 0.025) (04, 0.024) (pct, 0.019) (terms, 0.016) (06, 0.015) (yryr, 0.014) (2003, 0.013) (2004, 0.013)(03, 0.013) (oct, 0.013)
Topic 69: (nikkei, 0.019) (japan, 0.012) (market, 0.011) (stocks, 0.010) (yen, 0.008) (business, 0.007) (billion, 0.006)(friday, 0.006) (percent, 0.006) (daily, 0.005)
Topic 70: (2010, 0.036) (aug, 0.034) (world-bank, 0.030) (2009, 0.029) (na, 0.026) (jun, 0.024) (rand, 0.022) (mizuho,0.020) (jul, 0.019) (feb, 0.019)
Topic 71: (reuters, 0.007) (company, 0.006) (business, 0.006) (million, 0.006) (billion, 0.005) (press, 0.004) (stories,0.004) (companies, 0.004) (sony, 0.004) (executive, 0.003)
Topic 72: (yen, 0.047) (percent, 0.030) (billion, 0.015) (gmt, 0.015) (profit, 0.009) (year, 0.008) (million, 0.007)(shares, 0.007) (company, 0.007) (japans, 0.006)
Topic 73: (percent, 0.030) (yen, 0.023) (shares, 0.011) (nikkei, 0.011) (investors, 0.010) (earnings, 0.010) (market,0.009) (rose, 0.006) (1, 0.006) (stocks, 0.006)
Topic 74: (yen, 0.045) (percent, 0.038) (gmt, 0.016) (profit, 0.009) (billion, 0.008) (shares, 0.007) (1, 0.006) (million,0.005) (maker, 0.005) (forecast, 0.005)
Topic 75: (nihon, 0.012) (keizai, 0.012) (news, 0.011) (page, 0.011) (asahi, 0.011) (mainichi, 0.010) (yomiuri, 0.010)(japan, 0.010) (australian, 0.007) (japanese, 0.007)
Topic 76: (pct, 0.097) (100, 0.037) (incr, 0.035) (50, 0.035) (575, 0.026) (bng, 0.017) (55, 0.017) (200, 0.014) (frn,0.011) (550, 0.011)
Topic 77: (percent, 0.038) (yen, 0.027) (nikkei, 0.013) (market, 0.011) (stocks, 0.010) (shares, 0.010) (1, 0.008)(investors, 0.007) (rose, 0.006) (fell, 0.006)
Topic 78: (yen, 0.048) (percent, 0.043) (gmt, 0.020) (shares, 0.011) (profit, 0.009) (billion, 0.009) (rose, 0.008) (1,0.008) (nikkei, 0.006) (fell, 0.006)
Topic 79: (aaaaaa, 0.023) (rmbs, 0.019) (fixed, 0.018) (euro, 0.014) (100, 0.011) (frn, 0.011) (td, 0.010) (sec, 0.009)(aaa, 0.009) (aaaaaaaaa, 0.008)
Topic 80: (yen, 0.023) (percent, 0.018) (billion, 0.010) (gmt, 0.008) (profit, 0.008) (earnings, 0.008) (forecast, 0.006)(year, 0.005) (company, 0.005) (cut, 0.005)
Topic 81: (toyota, 0.022) (percent, 0.021) (year, 0.019) (000, 0.015) (sales, 0.014) (plant, 0.012) (car, 0.012) (million,0.010) (production, 0.010) (units, 0.009)
Topic 82: (percent, 0.029) (points, 0.015) (index, 0.012) (new-york, 0.010) (gold, 0.009) (1, 0.007) (closed, 0.007)(prices, 0.006) (london, 0.006) (crude, 0.006)
Topic 83: (pct, 0.106) (100, 0.059) (incr, 0.035) (425, 0.017) (50, 0.015) (ontario, 0.014) (200, 0.013) (525, 0.011)(40, 0.010) (dec2007, 0.010)
15
Topic 84: (sales, 0.060) (percent, 0.032) (ford, 0.017) (year, 0.013) (toyota, 0.011) (auto, 0.011) (market, 0.010)(gm, 0.009) (vehicles, 0.009) (million, 0.008)
Topic 85: (profit, 0.028) (yen, 0.026) (billion, 0.025) (percent, 0.023) (year, 0.023) (toyota, 0.018) (sales, 0.015)(operating, 0.013) (forecast, 0.011) (earnings, 0.009)
Topic 86: (yen, 0.045) (percent, 0.035) (profit, 0.016) (gmt, 0.015) (billion, 0.014) (year, 0.010) (forecast, 0.008)(maker, 0.007) (sales, 0.006) (group, 0.006)
Topic 87: (pct, 0.104) (100, 0.031) (incr, 0.030) (200, 0.019) (50, 0.018) (rabobank, 0.016) (ge-capital, 0.015)(tranche, 0.014) (150, 0.011) (feb2012, 0.011)
Topic 88: (germany, 0.021) (1, 0.017) (ferrari, 0.017) (2, 0.014) (3, 0.014) (renault, 0.014) (toyota, 0.014) (britain,0.014) (uk, 0.014) (4, 0.014)
Topic 89: (rmbs, 0.024) (fixed, 0.021) (frn, 0.017) (aaaaaa-, 0.013) (eurobond, 0.013) (aaaaaaaaa, 0.012) (anz, 0.010)(tap, 0.009) (200, 0.008) (2007-1, 0.008)
Topic 90: (yen, 0.038) (percent, 0.028) (billion, 0.013) (gmt, 0.012) (profit, 0.008) (group, 0.008) (maker, 0.007)(year, 0.007) (shares, 0.007) (million, 0.006)
Topic 91: (car, 0.010) (fiat, 0.010) (euro, 0.008) (renault, 0.008) (percent, 0.008) (europe, 0.005) (reuters, 0.005)(volkswagen, 0.005) (german, 0.005) (industry, 0.005)
Topic 92: (percent, 0.020) (yen, 0.020) (electronics, 0.015) (billion, 0.011) (nec, 0.009) (year, 0.009) (maker, 0.008)(sanyo, 0.007) (shares, 0.007) (corp, 0.007)
Topic 93: (words, 0.032) (moved, 0.021) (update, 0.016) (1, 0.010) (expect, 0.009) (2, 0.007) (london, 0.006) (600,0.006) (gmt, 0.005) (3, 0.005)
Topic 94: (words, 0.036) (moved, 0.031) (pix, 0.012) (update, 0.011) (tv, 0.009) (1, 0.006) (600, 0.006) (president,0.005) (2, 0.004) (700, 0.004)
Topic 95: (dec, 0.037) (nov, 0.037) (bonds, 0.021) (10, 0.018) (yen, 0.017) (mar, 0.013) (nomura, 0.013) (mizuho,0.013) (date, 0.012) (na, 0.011)
Topic 96: (reuters, 0.019) (messaging, 0.017) (percent, 0.017) (stocks, 0.016) (click, 0.014) (shares, 0.014) (reuter-snet, 0.011) (rm, 0.011) (double, 0.010) (stock, 0.010)
Topic 97: (steel, 0.065) (percent, 0.017) (nippon, 0.016) (prices, 0.015) (demand, 0.012) (year, 0.010) (price, 0.009)(¡5401t¿, 0.008) (nippon-steel, 0.007) (japanese, 0.007)
Topic 98: (bonds, 0.028) (yen, 0.021) (10, 0.017) (na, 0.014) (jul, 0.014) (date, 0.013) (oct, 0.012) (20, 0.010) (corp,0.010) (mizuho, 0.010)
Topic 99: (pct, 0.035) (company, 0.024) (earnings, 0.020) (reported, 0.019) (toyota, 0.013) (expectations, 0.013)(year, 0.010) (corp, 0.010) (results, 0.010) (shares, 0.010)
16
Time
50001000015000
5001000150020002500
2000400060008000
500100015002000250030003500
500100015002000
10002000300040005000
5000100001500020000
1000200030004000
2000400060008000
100001200014000
5000100001500020000
0
5001000150020002500300010
5001000150020002500300020
5001000150020002500300030
5001000150020002500300040
5001000150020002500300050
5001000150020002500300060
5001000150020002500300070
5001000150020002500300080
5001000150020002500300090
50010001500200025003000
5000100001500020000
50010001500200025003000
5000100001500020000
200004000060000
200040006000
100020003000400050006000
1000020000300004000050000
2000400060008000
10000
1000200030004000
2000400060008000
1000012000
1
5001000150020002500300011
5001000150020002500300021
5001000150020002500300031
5001000150020002500300041
5001000150020002500300051
5001000150020002500300061
5001000150020002500300071
5001000150020002500300081
5001000150020002500300091
50010001500200025003000
10002000300040005000
50001000015000200002500030000
2000400060008000
10000
1000200030004000500060007000
500
1000
1500
100020003000400050006000
1000200030004000500060007000
5000
10000
15000
1000200030004000
2000400060008000
100001200014000
2
5001000150020002500300012
5001000150020002500300022
5001000150020002500300032
5001000150020002500300042
5001000150020002500300052
5001000150020002500300062
5001000150020002500300072
5001000150020002500300082
5001000150020002500300092
50010001500200025003000
2000400060008000
10000
1000200030004000
5001000150020002500
50010001500200025003000
5000
10000
15000
5001000150020002500
500010000150002000025000
2000400060008000
100001200014000
100020003000
5000
10000
15000
3
5001000150020002500300013
5001000150020002500300023
5001000150020002500300033
5001000150020002500300043
5001000150020002500300053
5001000150020002500300063
5001000150020002500300073
5001000150020002500300083
5001000150020002500300093
50010001500200025003000
1000200030004000
2000400060008000
100001200014000
50001000015000200002500030000
100020003000400050006000
500100015002000250030003500
2000400060008000
100001200014000
1000200030004000500060007000
500010000150002000025000
2000400060008000
100001200014000
500010000150002000025000
4
5001000150020002500300014
5001000150020002500300024
5001000150020002500300034
5001000150020002500300044
5001000150020002500300054
5001000150020002500300064
5001000150020002500300074
5001000150020002500300084
5001000150020002500300094
50010001500200025003000
1000200030004000
50001000015000200002500030000
2000400060008000
2000400060008000
10000
1000200030004000
500100015002000250030003500
500100015002000250030003500
10002000300040005000
2000400060008000
10002000300040005000
5
5001000150020002500300015
5001000150020002500300025
5001000150020002500300035
5001000150020002500300045
5001000150020002500300055
5001000150020002500300065
5001000150020002500300075
5001000150020002500300085
5001000150020002500300095
50010001500200025003000
1000200030004000
50010001500200025003000
5001000150020002500
1000200030004000500060007000
500100015002000250030003500
5000100001500020000
2000400060008000
100001200014000
1000200030004000
500010000150002000025000
500010000150002000025000
6
5001000150020002500300016
5001000150020002500300026
5001000150020002500300036
5001000150020002500300046
5001000150020002500300056
5001000150020002500300066
5001000150020002500300076
5001000150020002500300086
5001000150020002500300096
50010001500200025003000
5000100001500020000
50010001500200025003000
200040006000
5000
10000
15000
50001000015000200002500030000
2000400060008000
100020003000400050006000
2000400060008000
50010001500200025003000
1000200030004000
7
5001000150020002500300017
5001000150020002500300027
5001000150020002500300037
5001000150020002500300047
5001000150020002500300057
5001000150020002500300067
5001000150020002500300077
5001000150020002500300087
5001000150020002500300097
50010001500200025003000
5000100001500020000
5000100001500020000
500100015002000250030003500
5001000150020002500
500010000150002000025000
500010000150002000025000
5001000150020002500
5000100001500020000
500100015002000
2000400060008000
8
5001000150020002500300018
5001000150020002500300028
5001000150020002500300038
5001000150020002500300048
5001000150020002500300058
5001000150020002500300068
5001000150020002500300078
5001000150020002500300088
5001000150020002500300098
50010001500200025003000
10002000300040005000
10002000300040005000
50010001500200025003000
5000
10000
15000
10002000300040005000
2000400060008000
1000200030004000
500
1000
1500
50001000015000200002500030000
5000100001500020000
9
5001000150020002500300019
5001000150020002500300029
5001000150020002500300039
5001000150020002500300049
5001000150020002500300059
5001000150020002500300069
5001000150020002500300079
5001000150020002500300089
5001000150020002500300099
50010001500200025003000
FIG. 12: Time evolution of news volume for all the learned topics for “Toyota”. Horizontal axis denotes days (Jan 2003 toJune 2011) and vertical axis shows their unnormalized volume.
Recommended