1
An application of the performance-evaluation model for e-learning
quality in higher education
Martínez-Caro, Eva Department of Business Management, School of Industrial Engineering, Universidad
Politécnica de Cartagena, Cartagena, Spain
School of Industrial Engineering, C/ Doctor Fleming s/n, 30202 Cartagena (Spain)
Cegarra-Navarro, Juan Gabriel Department of Business Management, Faculty of Business, Universidad Politécnica
de Cartagena, Cartagena, Spain
Cepeda-Carrión, Gabriel Management and Marketing Department, University of Seville, Spain
The demand for e-learning in higher education is rising, competition is increasing, and
universities are investing significant resources towards improving the quality of their e-
learning offerings. Thus, effective quality measures for e-learning are urgently required.
With the aim of following the total quality management practices of raising students’
satisfaction and continuous improvement, a performance-evaluation model was applied
in a sample of business students. The application of this model was useful for selecting
the quality items that most urgently require improvement to achieve student satisfaction
and for identifying items of surplus resource investment, thereby helping to provide the
means to minimize resource wastage. This way, an effective and efficient improvement
plan to enhance the efficient use of resources in e-learning and to meet an adequate level
of quality was established.
Keywords: e-learning quality; performance-evaluation model; student satisfaction; higher
education
Eva Martínez-Caro is associate professor of operation management in the School of Industrial
Engineering, Universidad Politécnica Cartagena (Spain). She received her PhD degree in business
management in 2005. From 2000 until 2005, she served as the Head of the Virtual Classroom of that
University. Her current research interests include virtual learning environments, knowledge
management, and educational technology management.
Juan Gabriel Cegarra-Navarro is associate professor of Business Management in the Faculty of
Business, Universidad Politécnica Cartagena. He is a Doctor in Business Administration and Master in
marketing and communications. His research is on the use of knowledge management to help small
and medium businesses to become more competitive. During the last few years he has also been
dedicating his time to several research projects on the SME sector (at the European Level) including
the congenital learning project.
Gabriel Cepeda-Carrión is associate professor in Management and Marketing Department at
University of Seville. His main research topics include knowledge management, absorptive capacity,
dynamic capabilities and organizational learning and unlearning. He also is an expert in qualitative
(case study research) and quantitative (SEM and PLS) methods in management research. His research
is published in several top ranked journals. He has developed professional projects about knowledge
management in industries such as: banking, health care and professional sport.

2
An application of the performance-evaluation model for e-learning
quality in higher education
The demand for e-learning in higher education is rising, competition is increasing, and
universities are investing significant resources towards improving the quality of their e-
learning offerings. Thus, effective quality measures for e-learning are urgently required.
With the aim of following the total quality management practices of raising students’
satisfaction and continuous improvement, a performance-evaluation model was applied
in a sample of business students. The application of this model was useful for selecting
the quality items that most urgently require improvement to achieve student satisfaction
and for identifying items of surplus resource investment, thereby helping to provide the
means to minimize resource wastage. This way, an effective and efficient improvement
plan to enhance the efficient use of resources in e-learning and to meet an adequate level
of quality was established.
Keywords: e-learning quality; performance-evaluation model; student satisfaction; higher
education
Introduction
The subject of quality in higher education has received increasing attention. This
study agrees with Ruben (1995) that generally speaking, it is a service industry, one
that every day is more and more exposed to globalisation processes (O’Neil and
Palmer, 2004), and increasingly intense competition and expectations from
stakeholders. Never before have they had to focus on asking what society values in
the skills and abilities of their graduates, nor have they been concerned with asking
their students how they feel about their educational “experiences” (Ford, 1999). As a
consequence, universities and colleges are placing increasing emphasis on improving
the quality of their educational services (Kuo and Ye, 2009).
Con formato: Color de fuente: Automático
3
Service quality is defined as the degree to which an event or experience meets an
individual’s needs or expectations. How satisfied the customers are on important
service elements determines the level of service quality (Hung et al, 2003). As the
education sector has transformed itself from a teaching-orientated to a customer-
orientated model, an educational institute can be seen as a provider of products and
services to customers, namely, its students (Kuo and Ye, 2009). Thus, in order to
attract students, serve their needs, and retain them, higher education providers are
actively involved in understanding the students’ expectations and perceptions of
service quality (Nadiri at al., 2009).
Because the levels of service quality and customer satisfaction are of the greatest
importance, universities are investing significant resources towards improved service
quality. Moreover, with the availability of new technology and the Internet,
universities are increasingly finding innovative ways of teaching. During the last few
years, universities have been experimenting with the use of e-learning in order to look
at what new technology can offer to both their existing students and potential ‘new’
students (Hodgson, 2002). E-learning can be viewed as synonymous with web-based
learning, online learning, internet-based training, or virtual learning (Khan, 2001). It
can be considered as a teaching-learning process supported by information and
communication technologies (ICT), in which it is not necessary to have a physical
meeting of teachers and students, and whose objective is to facilitate a flexible (at any
time and place), interactive, and student-centred learning (Martínez-Caro, 2011).
The use of e-learning as a teaching and learning tool is now rapidly expanding into
education, with thousands of courses offered by educational institutions. The major
forces driving its popularity are: (1) the emergence of a worldwide communication
network, with powerful computer technologies leading to a revolution in all sectors,
Con formato: Color de fuente: Automático
4
including education; (2) the perception of e-learning as a solution to the cost and
quality problems of universities (Selim, 2007); and (3) profound changes in the ways
in which we work and live, which are claiming a new concept of education for those
who have irregular working schedules and both family and employment commitments
(Shen et al., 2007; Marks, et al., 2005). University students are becoming more
diverse and the demand for e-learning courses is going up (Papp, 2000). Competition
is increasing and it is not surprising that universities are trying to differentiate their
‘product’ by infusing quality into their e-learning offerings (Aggarwal and Adlakha,
2006).
The increasing use of alternative teaching methods such as e-learning is clearly
changing the traditional understanding of educative activities. Thus, effective service-
quality measures for e-learning are urgently required. From a total quality
management (TQM) approach, raising students’ satisfaction and continuous
improvement should be the two main areas of focus (Yang, 2003a). Student
satisfaction in the classroom is an inherently desirable goal and a benefit of teaching.
There is a considerable volume of research related to the benefits of satisfaction in
higher education. For example, satisfaction has been linked to student performance
(Bean and Russell, 1986; Marks et al.; 2005, Martínez-Caro; 2011), retention (Astin,
1993; Tinto, 1993; DeShields et al., 2005), class attendance (Spady, 1979; Aitken,
1982; Bean, 1985), or student engagement (Kuh, 2003; Zhao and Kuh, 2004; Coates,
2005). Moreover, student satisfaction is often used to assess educational quality (e.g.
Cheng, 1990, Ramsden, 1991; Nadiri et al., 1994; Lawrence and McCollough, 2004).
Satisfaction is particularly important when considering e-learning environments,
because if students are not satisfied with the online course experience they could opt
out of e-learning courses or transfer to other institutions (Arbaugh and Benbunan-
Con formato: Color de fuente: Automático
5
Fich, 2007). Several models are available to measure student satisfaction, each one
with its own advantages and disadvantages (Chen, 2009). However, the most pressing
disadvantage of these models is their inability to provide accurate priorities for
improvement (Chen et al., 2006; Yang, 2003b). O’Neill and Palmer (2004) argue that,
while much time is taken up discussing the psychometric performance of such tools,
their real value to the higher education sector rests on their ability to pinpoint service
failures and to direct continuous quality improvement efforts that are of demonstrated
importance to students.
As a consequence, the purpose of this particular study was to select and apply the
most adequate model for the improvement of e-learning quality in higher education.
In particular, this was accomplished through an assessment of the perceptions of a
sample of business students at one higher education institution by using the
performance-evaluation model.
Measuring quality in higher education
A challenge facing practitioners in teaching is the identification and implementation of
the most appropriate measurement tools to gain a better understanding of the quality
issues that impact on the experiences of students (O’Neil and Palmer, 2004). In the
absence of objective measures, higher education providers must rely on the students’
perceptions of quality to identify the strengths and weaknesses of educational
programs, and to conceive appropriate improvement strategies.
Universities have traditionally employed qualitative or quantitative methods to
measure students’ perceptions of quality, such as interviews, focus groups, or
observation research. Many models have been adapted in higher education from
quality improvement methodologies used in the industry: Total Quality Management
Con formato: Color de fuente: Automático
6
(TQM), Quality Function Deployment (QFD), Six Sigma, ISO 9001, the Malcolm
Baldrige National Quality Award or the EFQM Model. Other techniques have been
created ad hoc for higher education (e.g. College Student Satisfaction Questionnaire
(CSSQ), Course Perception Questionnaire (CPQ), Student evaluation of teaching
(SET) instruments). While traditional research on quality education has borrowed
heavily from the management discipline and job satisfaction theory, current
researchers shift their focus to customer satisfaction theories from the service
marketing discipline (Franklin and Shemwell, 1995). Traditional questionnaires
reduce student satisfaction to a static outcome of a uni-dimensional process whereas
researchers in marketing have a different perspective: satisfaction is a process in
which student will experience a beginning expectations state and an ending
performance state (Oliver, 1993). As a consequence of this dynamic nature of
satisfaction, the most appropriate method for assessing student satisfaction is through
an expectation-disconfirmation process (Franklin and Shemwell, 1995). The
disconfirmation approaches have become pre-eminent in the sector (Chen, 2009). An
often used model most often utilized has been SERVQUAL, developed by
Parasuraman et al. (1985, 1988). This instrument performs quality evaluation by
comparing the customers’ expectations with their perception of the organisation’s
service performance. SERVQUAL conceptualises service quality through five factors,
namely, tangibles, reliability, responsiveness, assurance, and empathy.
While SERVQUAL is widely recognised for its various adaptations for different
industries, including the educational context, it has also attracted considerable
criticism. Ford (1999) pointed out the following: (1) the potential inappropriateness of
the five dimensions of choice criteria used by SERVQUAL; (2) the inability of
expectations to remain constant over time; and (3) the lack of prior knowledge and
7
experience with university education and the unrealistic expectations of incoming
university students. As a result of these criticisms, an alternative method of assessing
service quality was needed. This led to the development and application of a more
direct form of measurement technique, known as SERVPERF (Cronin and Taylor,
1992).
The SERVPERF technique makes use of the original SERVQUAL scale items and
requires the customer to rate a provider’s performance. However, it does not seek to
estimate difference scores, but requires the consumer to rate only the performance of a
particular service encounter. It has been argued that a performance-only measure
explains more of the variance in an overall measure of service quality than does the
SERVQUAL instrument (Cronin and Taylor, 1994). However, although taking a
single measure of service performance is seen to circumvent some of the problems
raised regarding SERVQUAL, it is felt that from an operational point of view much
useful information is lost when performance-only measures are taken (O’Neill and
Palmer, 2004).
Martilla and James (1997) developed the importance-performance analysis (IPA) as a
tool to develop marketing strategies. Like SERVPERF, IPA is described as an
absolute measure of performance, aimed at identifying the underlying importance
ascribed by students to the various quality criteria under assessment. An attractive
feature of IPA is that the results may be graphically displayed on an easily interpreted
two-dimensional grid (Martilla and James, 1997), which demonstrates the mean of
importance and performance ratings for attributes used to assess the quality of a
particular service (Ford, 1999). The importance-performance grid is interpreted
through four quadrants: (a) concentrate here: reflecting that certain aspects of the
Con formato: Color de fuente: Automático
Con formato: Color de fuente: Automático

8
organisation, which are important for customers, are not performing to their full
service potential; (b) keep up the good work: reflecting a level of optimal
performance; (c) low priority: reflecting a low level in a feature’s performance but
customers do not perceive this feature to be very important; and (d) possible overkill:
reflecting a high level in a feature’s performance but customers do not perceive this
feature to be very important. Importance is viewed as a reflection by consumers of the
relative value of the various quality attributes. It is this additional information that
makes the technique more suited to the task of directing improvement based on what
is deemed by consumers as most important (O’Neill and Palmer, 2004).
Over the years, many different IPA variations have emerged. For example, Yang
(2003a) used the TQM practices of raising customers’ satisfaction and continuous
improvement as the bases to propose the importance-satisfaction (I-S) model. The
purpose of the model is to identify the actual requirements of customers and the actual
level of customers’ satisfaction. It is then possible to identify which quality attributes
require steps to be taken to ensure improvement. As with the IPA, the I-S allows
results to be graphically displayed on a two-dimensional grid: the degreeof
importance of a given quality attribute and the satisfaction level of that quality
attribute. Four areas are defined (Yang, 2003b): (1) the excellent area: companies
should endeavour to maintain good performance with respect to the items in this area;
(2) the to-be-improved area: companies should focus on the items in this area with a
view to making improvements immediately; (3) the surplus area: the attributes listed
in this area are not very important for customers, but they are quite satisfied with
them; and (4) the care-free area: customers perceive lowers satisfaction levels but
they also feel that these items are less important.
9
It must be borne in mind that the basic issue in improving service quality performance
is determining the priorities for critical service elements and drafting the improvement
plan to effectively and efficiently enhance all the service quality levels (Hung et al.,
2003). Despite the advantages of the I-S model, it is unable to suggest improvement
priorities. To overcome this lack, this research proposes the use of an alternative
model: the performance-evaluation model.
Performance-evaluation model
Although I-S analysis overcomes the criticisms of the SERVQUAL and SERVPERF
models and, unlike IPA, reflects specifically the TQM principle of raising customer
satisfaction, some shortcomings still exist in this model (Chen, 2009). First, the
application of the I-S model is limited to questionnaires based on a 7-point scale..
Second, the attributes located in the ‘surplus area’ are imply an overinvestment.
According to the I-S model, organisations do not need to take any particular action
with respect to such attributes. This approach does not square with a reality in most
organisations because resources are limited and, consequently, it is vital that
resources are not overinvested in wasteful areas. Third, the attributes located in the
‘to-be-improved area’ require improvement; however, the I-S model does not suggest
what item should be given priority with respect to improvement strategies. Fourth,
when the quality attributes lie on the borderline between two areas it is unclear
whether these attributes should be improved or not. With the aim of addressing these
shortcomings, Chen (2009) proposes a modified I–S model, called the Performance-
Evaluation model. In this model, the performance matrix is divided into three
performance zones (Figure 1) that represent the effectiveness of various system-
improvement items. The first is Zone A, or the insufficient resources zone. The
quality attributes that fall into the Zone A have greater importance than satisfaction;
Con formato: Color de fuente: Automático
Con formato: Color de fuente: Automático
10
thus, more resources must be invested in these attributes to improve satisfaction. The
second is Zone B, or the misspent resources zone. The quality attributes that fall into
Zone B have less importance than satisfaction; thus, the investment of resources in
these items should be decreased to prevent waste. The third is Zone APCZ, or the
appropriate performance control zone. The investment of resources in the quality
attributes that fall into this zone must be maintained. The three areas are limited by
two lines, the performance upper control limit (PUCL) and the performance lower
control limit (PLCL). Between these two lines is an oblique line representing the
performance-control centre limit (PCCL). These lines are established according to the
coordinates that enable objective diagnosis and judgment of the required
improvements to be performed. Organisations should seek to improve only those
items that are located outside the control lines. Following Chen (2009), PUCL and
PLCL are defined as +3σ and -3σ, respectively, with σ being the standard deviation or
the performance-control matrix.
<Figure 1. Performance-control zone of performance matrix.>
This performance-control matrix is expressed in terms of a performance-control
matrix index (PCMI), which is defined as the index of satisfaction minus the index of
importance. In turn, the indices of importance and of satisfaction are defined as
follows:
RP I
I
min
RP S
S
min
in which
PI= index of importance,
Con formato: Color de fuente: Automático
Con formato: Color de fuente: Automático
Con formato: Color de fuente: Automático
Con formato: Color de fuente: Automático
Código de campo cambiado
Con formato: Color de fuente: Automático
11
PS = index of satisfaction,
µI = mean of importance,
µS= mean of satisfaction,
min = the minimum value of the k scale, and
R = the full range of the k scale.
If the PCMI has a positive value, this indicates that importance is less than satisfaction
and that fewer resources should be invested to prevent waste. Conversely, if the PCMI
has a negative value, this demonstrates that importance is greater than satisfaction and
that more resources should be invested to improve satisfaction.
The additional and very useful contribution of this performance-evaluation model
approach is that the LTB (larger the better) model is adopted, in which a large loss
function value indicates improvement priority. That is, a greater PCMI indicates that
an item should be given priority with respect to improvement strategies.
Empirical analysis
Questionnaire design
A questionnaire of student satisfaction in e-learning was developed based on a review
of the literature (e.g., Arbaugh, 2000; Stokes, 2001; Selim, 2005; Wang, 2003;
Agarwal and Day, 1998; Motiwalla and Tello, 2000; Marks et al., 2005; Ozkan and
Koseler, 2009; McGorry, 2003). Most researchers agree that the main factors
affecting student satisfaction are the following: (1) teacher-student interaction, (2)
student-student interaction, (3) learning contents, and (4) system flexibility and
support. Traditionally, distance education has been criticized because of the lack of
interaction between teacher and students and between students. During the last few
years, however, with the introduction of ICT, the number of tools to promote the
Con formato: Color de fuente: Automático
Con formato: Color de fuente: Automático
Con formato: Color de fuente: Automático
12
interaction between the participants of an online course has increased greatly. Thus,
an increasing number of studies suggest that interaction, whether it is between
participants and/or between participants and the teacher, is one of the strongest
predictors of positive outcomes in e-learning (Arbaugh and Benbunan-Fich, 2007;
Flottemesch, 2000; Palloff and Pratt, 2001; Swan, 2002; Zhao et al., 2005).
In a traditional face-to-face classroom, a teacher-centred model is frequently adopted.
Students are taught as if they were passive recipients of knowledge and had little
engagement in the instructional tasks. In this approach the students have no incentive
to construct their own knowledge and little motivation to retain information or
transfer its use to novel situations (Berge and Collins, 1995). E-learning instruction is
learner-centred rather than teacher-centred, and knowledge is viewed as a social
construct, facilitated by peer interaction, evaluation, and cooperation. Therefore, the
role of the teacher changes from transferring knowledge to students (the “sage on the
stage”) to being a facilitator in the students’ construction of their own knowledge (the
“guide on the side”) (Benbunan-Fich and Hiltz, 2003). Learner-teacher interactions
contribute to that objective by establishing an environment that encourages learners to
understand the content better (Su et al., 2005). Harasim et al. (1995) reported that e-
learning allows an increased interaction between the teacher and the students that
could be even better than the interactivity achieved in the traditional setting. In
addition, e-learning allows a more equitable distribution of the teacher’s attention
among the students (Hartman et al., 1995). Furthermore, students who are shy or
uncomfortable about participating in class discussions often no longer feel that way in
online forums (Owston, 1997).
On the other hand, the interaction between students in a course is well documented
and considered a valuable experience and learning resource (e.g., Rovai, 2002; Pallof
13
and Pratt, 2001; Benbunan-Fich and Hiltz, 2003; Vrasidas and S.M. McIsaac, 1999;
Arbaugh, 2004) and a critical component of quality education (Anderson, 2001).
Learning is most successful when small groups of students share and discuss
information (Arbaugh and Benbunan-Fich, 2007). The students may learn as much, or
more, from each other as they do from the professor and the textbook (Brower, 2003).
When students work with peers instead of alone (or just with the teacher), anxiety and
uncertainty are reduced as learners communicate with their peers and find their way
together through complex or new tasks (Harasim, 1995). In some cases, students have
even expressed a preference for online dialogue over traditional classroom discussion
because they can participate more fully and can reflect upon the comments and
responses of other students before sharing their own (Clark, 2001).
The process of creating an effective learning experience involves effective
configuration of curriculum content and pedagogic content, among other factors
(Biggs, 1999). Content quality in e-learning depends on how well the learning
environment is designed and managed. For example, students highlighted the
importance of the following aspects relative to content: good organisation, effective
presentation, right length, usefulness, ease in understanding, interactiveness, and up-
to-datedness (Holsapple and Lee-Post, 2006; Shee and Wang, 2008). Additionally,
students state that clear examples, illustrations, and given additional resources gain
their attention, and positively influence their satisfaction (Ozkan and Koseler, 2009).
In that respect, to offer a high value in e-learning, plain text content must be
complemented with other new media, such as multimedia presentations, audios,
videos, or simulations (Marks et al., 2005).
Prior research has stressed that the main advantages of e-learning are related to the
flexibility and convenience that this type of educational delivery system provides to
14
students (Selim, 2007; Arbaugh, 2002; Choy et al., 2001; Leonard and Guha, 2001).
E-learning flexibility can remove time and location barriers, enable students to access
information in a self-paced fashion, and reinforce learning (Ellsworth, 1994).
Furthermore, e-learning allows some students to combine education with other
activities such as work, enabling those who otherwise do not have the opportunity to
complete educational programs to do so.
However, it must be taken into account that students in e-learning courses often face
technical problems. According to Ngai et al. (2007), it is essential for universities to
provide effective technical support to users to encourage them to use their e-learning
systems. Several research studies have suggested that the provision of appropriate
user technical support is among the most effective methods of ensuring user
satisfaction (Mirani and King, 1994). It is also important for the e-learning system to
have stability, security, reliability, ease of use, and a well-organized design (Shee and
Wang, 2008) because a user-friendly learner interface becomes one of the most
critical factors in determining the satisfaction of learners in e-learning (Ozkan and
Koseler, 2009).
Table 1 below shows the items used for measuring student satisfaction according to
these factors. A double 5-point response scale was used (1 = very unsatisfactory and 5
= very satisfied, to measure satisfaction, and 1 = very unimportant and 5 = very
important, to measure importance).
< Table 1. Factors and items of questionnaire.>
Sample and data collection
We used a sample of 408 students enrolled in 14 class sections of 6 courses at one
university delivered in the e-learning modality over the course of four academic years.
Con formato: Color de fuente: Automático
15
The courses were in the field of operations and production management at the
graduate and postgraduate levels . Using students from multiple courses provided
methodological benefits such as external validity and increased statistical power
(Marks et al., 2005). Students completed the questionnaire via the tools provided by
the e-learning system which guaranteed the anonymity of the students. Data were
collected from 333 students, for a response rate of 81.61 percent.
Students in all courses were supplied with the following resources:
(1) Course information: The instructor placed items such as the course schedule, the
syllabus, learning objectives and goals, general instructor information , and/or
recommended bibliography.
(2) Access to a resource centre: a shared knowledge base that stores online lectures,
articles, case studies, videos, multimedia presentations, graphics, or links to
resources relevant to the course.
(3) Asynchronous communication tools were used in all courses, such as e-mail and
debate forums. Synchronous tools such as chat were used for some of the courses.
These tools were used for the communication between students (e.g., discussion of
case studies, collaborative task) and between students and teachers (e.g., teacher
follow-up of students, online tutorials).
(4) Assessment tools were used for hand-in of reports, group and individual
deliverables for assessment. In some cases, multiple-choice-type examinations and
open questions were used as well.
(5) Student tools: These tools allowed students to track their progress and check their
grades online. Students could also develop their own personal information pages
and share them with their classmates.
Con formato: Color de fuente: Automático
Con formato: Color de fuente: Automático
16
Research results
The SPSS 15.0 statistical pack was used to analyse the data. Reliability was assessed
using Cronbach’s alpha. The coefficient alpha for students’ satisfaction and for
students’ importance as well as for each dimension was greater that 0.7, the
commonly accepted lower limit for alpha (Nunnally, 1978), hence the questionnaire
had good reliability.
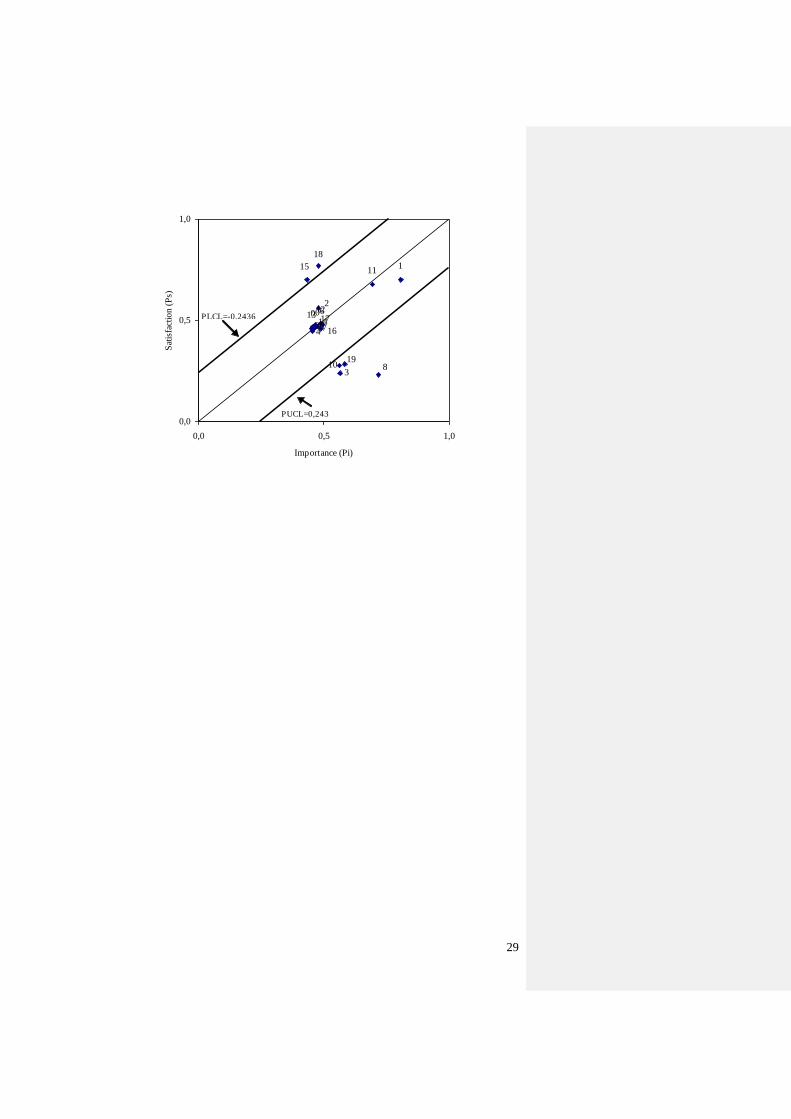
The means for satisfaction and for importance of the twenty items were calculated,
and then transformed to PS and PI, respectively. Performance-control matrix indeces
and PUCL and PLCL were also calculated (Table 2). Then, the control lines were
drawn and the coordinates of PS and PI were mapped onto the performance-control
matrix. The performance-control matrix revealed that items 15 and 18 were outside
PLCL and items 3, 8, 10, and 19 were outside PUCL (Figure 2).
Table 2. Performance and Satisfaction Results.
Figure 2. Performance-control matrix.
Discussions
Universities, as with any organization, have limited resources, and thus must manage
these resources in the most efficient way. From a continuous quality improvement
point of view, the performance-evaluation model used in this research allows making
a prioritization between the items for improvement by classifying them according to
their PCMI. This way, a more efficient management of the universities’ resources is
possible. The results of this study suggest that six areas must be improved in e-
learning:
17
(1) Item 8, with a PCMI net value of 0.4842, suggested that this item should be given
the highest priority for improvement. This item referred to the efforts made by
instructors to encourage interaction with students. The item was located in the
performance-control matrix outside PUCL, which implies that instructors should
do more to promote student satisfaction. While students considered the
instructor’s availability, attitude, and level of interaction with them to be
adequate, the efforts made by instructors to promote that interaction were not
deemed to be enough.
These results suggest that if students take the initiative of contacting the teacher they
will have an adequate communication with such teacher, but if the students do not
adopt an active role interaction will not take place. The direct implication of this
finding is that teachers must be actively engaged with their courses to enable
participants to obtain better learning and satisfaction outcomes. To improve
effectiveness, Lehman et al. (2001) advise teachers to interact with students in a
prescribed manner by providing the theoretical rationale as well as multiple examples
of motivation-building and personal-investment enhancements. According to Marks et
al. (2005), teachers could seek student involvement in discussion, tell a case story
about a subject to aid remembering, use positive reinforcement for successful
performance, and ask questions to students.
(2) The second item that needs to be improved is item 3, with a PCMI net value of
0.3251. This item is related to the encouragement of students to interact with other
students. The item was located in the performance-control matrix outside PUCL,
suggesting that student-student interaction is not promoted enough. Similar to the
previous item, the implication of the finding is that if students take the initiative of
contacting their classmates they will have an adequate level of interaction with
Con formato: Color de fuente: Automático
Con formato: Color de fuente: Automático
Con formato: Color de fuente: Automático
18
them, but if students do not adopt an active role, interaction will not take place.
Some writing on-online learning communities literature suggests that people need
encouragement to share information and to learn from each other (Newman and
Smith, 1999), hence the course must be structured in a way that encourages
student participation amongst themselves (Vrasidas and McIsaac, 1999). To that
end, strategies such as requiring students to post discussion comments and
assignments for all members of the class to respond to, or encouraging cooperative
group work, can be adopted (Benbunan-Fich and Hiltz, 2003).
(3) The third item that needs to be improved is item 19, which refers to the effective
management of study time by students, with a PCMI net value of 0.2995. The item
was located in the performance-control matrix outside PUCL, and so more
resources must be allocated to help students manage their study time. The
anytime-anywhere aspect of e-learning has long been touted as one of its most
significant advantages over traditional classrooms, but research shows that
students need time to process and contextualize the freedom that this learning
involves (Arbaugh, 2004) and to accept that the responsibility for the learning
process now falls on them. To help students in this situation, it could be crucial to
teach them how to learn online as soon as they start the e-learning experience.
Arbaugh (2004) proposes that instructors give new learners focused attention to
help them in their transition to online learning. Experienced classmates might also
play an important part by sharing their knowledge with the novice students and
explaining to them how to manage their study time, as an additional help to the
instructors’ efforts, in their first e-learning experiences.
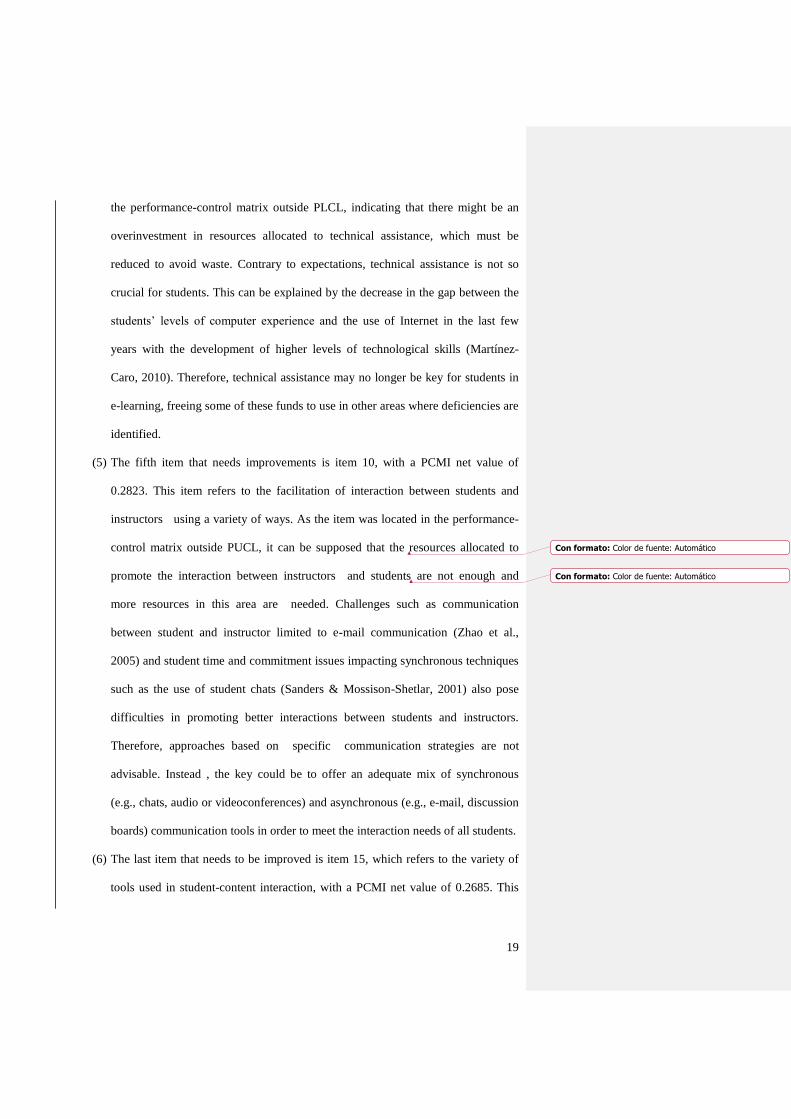
(4) The fourth item that needs to be improved is item 18, which refers to access to
technical assistance, with a PCMI net value of 0.2920. This item was located in
19
the performance-control matrix outside PLCL, indicating that there might be an
overinvestment in resources allocated to technical assistance, which must be
reduced to avoid waste. Contrary to expectations, technical assistance is not so
crucial for students. This can be explained by the decrease in the gap between the
students’ levels of computer experience and the use of Internet in the last few
years with the development of higher levels of technological skills (Martínez-
Caro, 2010). Therefore, technical assistance may no longer be key for students in
e-learning, freeing some of these funds to use in other areas where deficiencies are
identified.
(5) The fifth item that needs improvements is item 10, with a PCMI net value of
0.2823. This item refers to the facilitation of interaction between students and
instructors using a variety of ways. As the item was located in the performance-
control matrix outside PUCL, it can be supposed that the resources allocated to
promote the interaction between instructors and students are not enough and
more resources in this area are needed. Challenges such as communication
between student and instructor limited to e-mail communication (Zhao et al.,
2005) and student time and commitment issues impacting synchronous techniques
such as the use of student chats (Sanders & Mossison-Shetlar, 2001) also pose
difficulties in promoting better interactions between students and instructors.
Therefore, approaches based on specific communication strategies are not
advisable. Instead , the key could be to offer an adequate mix of synchronous
(e.g., chats, audio or videoconferences) and asynchronous (e.g., e-mail, discussion
boards) communication tools in order to meet the interaction needs of all students.
(6) The last item that needs to be improved is item 15, which refers to the variety of
tools used in student-content interaction, with a PCMI net value of 0.2685. This
Con formato: Color de fuente: Automático
Con formato: Color de fuente: Automático
20
item, as item 18 above, exceeded the PLCL, indicating that the resources allocated
to develop different tools for student-content interaction must be reduced to avoid
waste. This finding can be explained by the fact that the media are not as
important as the message itself, with some research showing that the positive
effects of new media on the learning experience are caused mainly by the
Hawthorne – or halo -- effect 2, rather than by the media per se (Clark, 1985). For
example, research shows that including too much unnecessary multimedia
elements in instructional material may distract learners and actually decrease
learning performance (Bartscha and Cobern, 2003; Mayer et al., 2001). Sun and
Chen (2007) consider it expensive to design and develop multimedia instructional
material because of their findings to the effect that multimedia content alone does
not necessarily result in significant positive learning performance and satisfaction;
indeed, they found it ineffective to use highrichness media, such as video
conferencing or interactive contents, to promote learning performance for course
units with low uncertainty and equivocality, the content of which could be stated
clearly in regular text. In conclusion, what is needed is to create an appropriate
equilibrium between cost and media in order to help students understand content
and to avoid wasting institutional resources.
Conclusions
At the heart of all quality initiatives there is an emphasis on the use of data to make
decisions associated with quality improvements (Wild and Hope, 2003). In this
study, the data from students’ perceptions of satisfaction and importance were
transformed into reccomendations to improve resource investment in e-learning
programs in higher education.
21
The first contribution of this research is the use of a model to measure quality in e-
learning that is not focused exclusively on evaluating quality through selected
attributes in terms of the students’ satisfaction, with the aim of improving those
attributes with the lowest levels of satisfaction. Low-quality attributes should not be
the only consideration when designing improvement plans. The approach employed is
more ambitious because it suggests taking actions to improve the attributes that have
low satisfaction levels and are important to students at the same time. Furthermore,
the performance-evaluation model employed is a useful tool for selecting quality
items that most urgently require improvement to achieve student satisfaction in e-
learning and for identifying items of surplus resource investment, thereby helping to
provide the means to minimize resource wastage. The information gathered through
this approach helps in the drafting of an effective and efficient improvement plan to
enhance the efficient use of resources in e-learning and to meet an adequate level of
quality.
The second contribution is derived from the several implications of the results. An
underinvestment was identified in several areas, suggesting the following prioritized
improvements: (1) instructors must adopt an active role and make additional efforts
to encourage student participation; (2) to allocate resources in teaching students how
to learn online and helping them in their transition to e-learning; and (3) Investing
more resources to provide different ways to promote teacher-student interaction. On
the other hand, the data in this study suggests that there is an overinvestment in
providing technical assistance to students and in the development different tools for
student-content interaction . Students’ skills and needs are changing and institutions
must be aware of these changes in order to adapt the allocation of their resources to
the actual requirements. In summary, the findings of this study can help colleges and
Con formato: Color de fuente: Automático
Con formato: Color de fuente: Automático
Con formato: Color de fuente: Automático
22
schools learn more about how to enhance e-learning quality while simultaneously
promoting efficiency in the investment of resources.
Finally, this study is not lacking in limitations. Firstly, although several e-learning
courses in different subjects were analyzed, the study was conducted at a single
institution. Thus, the findings may not be widely generalizable. Further research is
needed with broader samples. Secondly, all courses analyzed in this study were
delivered fully online. Classroom-based courses or blended courses were not
considered. Hence, it cannot be said that the findings of this study are unique to e-
learning courses. The performance-evaluation model could be a promising tool for
assessing quality in any learning modality. Future research is also needed to address
this issue . Furthermore, it could be interesting to compare the findings with those that
would be found using more traditional instruments for assessing student satisfaction
with instruction. This comparison may help universities to select the appropriate
assessment instrument to make the adequate strategic decisions.
References
Aggarwal, A.K., & Adlakha, V.G. (2006). Quality Management Applied to Web-
Based Courses. Total Quality Management, 17(1), 1-19.
Aitken, N.D. (1982). College student performance, satisfaction and retention:
Specification and estimation of a structural model. The Journal of Higher
Education, 53(1), 32-50.
Anderson, T. (2001). The hidden curriculum in distance education. An update view.
Change, 33(6), 28-35.
Arbaugh, J.B. (2000). Virtual Classroom Characteristics and Student Satisfaction with
Internet-Based MBA Courses. Journal of Management Education, 24(1), 32-
54.
Arbaugh, J.B. (2002). Managing the on-line classroom. A study of technological and
behavioral characteristics of web-based MBA courses. Journal of High
Technology Management Research, 13, 203-223.
Arbaugh, J.B. (2004). Learning to learn online: A study of perceptual changes
between multiple online course experiences. Internet and Higher Education, 7,
169-182.
Arbaugh, J.B., & Benbunan-Fich, R. (2007). The importance of participant interaction
in online environments. Decision Support Systems, 43, 853-865.
Con formato: Color de fuente: Automático

23
Astin, A.W. (1993). What matters in college? Four critical years revisited. San
Francisco: Jossey Bass.
Awargal, R., & Day, E. (1998). The Impact of the Internet on Economic Education.
Journal of Economic Education, 29(2), 99-110.
Bartscha, R. A., & Cobern, K. M. (2003). Effectiveness of PowerPoint presentations
in lectures. Computers &Education, 41, 77–86.
Bean, J. P. (1985). Interaction effects based on class level in an explanatory model of
college student dropout syndrome. American Educational Research Journal,
22(1), 35-64.
Bean, J.P., & Russell K.B. (1986). Untangling the satisfaction-performance
relationship for college students. The Journal of Higher Education, 57(4), 393-
412.
Benbunan-Fich, R., & Hiltz, S.R. (2003). Mediators of the effectiveness of online
courses. IEEE Transactions on Professional Communication, 46 (4), 298-312.
Berge, Z. & Collins, M. (1995). Computer-mediated communication and the online
classroom in distance learning. Computer-Mediated Communication
Magazine, 2(4). Retrieved from http://sunsite.unc.edu/cmc/mag/1995/apr/
berge.html.
Biggs, J. (1999). Teaching for quality learning at university. Buckingham: Open
University Press.
Brower, H.H. (2003). On emulating classroom discussion in a distance-delivered
OBHR course: Creating an on-line community. Academy of Management
Learning and Education, 2 (1), 22–36.
Chen, S.H. (2009). Establishment of a performance-evaluation model for service
quality in the banking industry. The Services Industries Journal, 29(2), 235-
247.
Chen, S-H., Yang, C-C., Shiau, J-Y., & Wang, H-H. (2006). The development of an
employee satisfaction model for higher education. The TQM Magazine, 18(5),
484-500.
Cheng, Y.C. (1990). Conception of school effectiveness and models of school
evaluation: A dynamic perspective. Education Journal, 18(1), 47-62.
Choy, S., McNickle, C. & Clayton, B. Online support for VET clients: expectations
and experiences. 2001 AVETRA conference: Research to reality: putting VET
research to work, 28-30 March, Adelaide (Australia), 2001.
Clark, L.J. (2001). Web-based teaching: A new educational paradigm. Intercom, 48,
20-23.
Clark, R. (1985). Evidence for confounding in computer-based instruction studies:
Analyzing the meta-analyses. Educational Communication and Technology
Journal, 33(4), 249–262.
Cronin, J.J.Jr., & Taylor, S.A. (1992). Measuring Service Quality: A Reexamination
and Extension. Journal of Marketing, 56, 55-68.
Cronin, J.J.Jr., & Taylor, S.A. (1994). SERVPERF Versus SERVQUAL: Reconciling
Performance-Based and Perceptions-Minus-Expectations Measurement of
Service Quality. Journal of Marketing, 58, 125-131.
DeShields, O.W., Kara, A., & Kaynak, E. (2005). Determinants of business student
satisfaction and retention in higher education: applying Herzberg's two-factor
theory. International Journal of Educational Management, 19(2), 128-139.
Ellsworth, J.H. (1994). Education on the Internet. Indianapolis: Sams Publishing
Flottemesch, K. (2000). Building effective interaction in distance education: A review
of the literature. Educational Technology, 40(3), 46-51.
24
Ford, J.B., Joseph, M., & Joseph, B. (1999). Importance-performance analysis as a
strategic tool for service marketers: the case of quality perceptions of business
students in New Zealand and the USA. The Journal of Services Marketing, 13
(2), 171-186.
Franklin, K.K., & Shemwell, D.W. (1995). Disconfirmation theory: An approach to
student satisfaction assessment in Higher Education. Paper presented at the
Annual Meeting of The Mid-South Educational Research Association
Conference, Biloxi, November 1995. ERIC Document N. 388199.
Hamish, C. (2005): The value of student engagement for higher education quality
assurance. Quality in Higher Education. 11(1), 25-36.
Harasim, L., Hiltz, S.R., Teles, L., & Turoff, M. (1995). Learning networks: A field
guide to teaching and learning online. Cambrige, MA: The MIT Press.
Hartman, K., Neuwirth, C.M., Kiesler, S., Sproull, L., Cochran, C., Palmquist, M., &
Zubrow, D. (1995). Patterns of social interaction and learning to write: Some
effects of network technologies. In Berge, Z.L., & Collins, M.P. (Eds.),
Computer mediated communication and the online classroom, 2, Cresskill, NJ:
Hampton Press, Inc, 47-78.
Hodgson, V.E. (2002). The European Union and e-learning: an examination of
rhetoric, theory and practice. Journal of Computer Assisted Learning, 18, 240-
252.
Holsapple, C.W., & Lee-Post, A. (2006). Defining, assessing, and promoting e-
learning success: An information systems perspective. Decision Sciences
Journal of Innovative Education, 4(1), 67-85.
Hung, Y.H., Huang, M.L., & Chen, K.S. (2003). Service quality evaluation by service
quality performance matrix. Total Quality Management, 14(1), 79-89.
Keller, J. M. (1987). Strategies for stimulating the motivation to learn. Performance +
Instruction, 26, 1–7.
Khan, B.H. (2001). A framework for web-based learning. Englewood Cliffs, New
Jersey: Educational Technology Publications.
Kuh, G. D. (2003): What We're Learning about Student Engagement from NSSE:
Benchmarks for Effective Educational Practices. Change, 35(2), 24-32.
Kuo, Y., & Ye, K. (2009). The casual relationship between service quality, corporate
image and adults’ learning satisfaction and loyalty: A study of professional
training programmes in a Taiwanese vocational institute. Total Quality
Management & Business Excellence, 20(7), 749-762.
Lawrence, J.J., & McCollough, M.A. (2004). Implementing Total Quality
Management in the classroom by means of student satisfaction guarantees.
Total Quality Management, 15(2), 235-254.
Lehman, S., Kauffman, D.F., White, M.J., Horn, C.A., & Bruning, R.H. (2001).
Teacher interaction: Motivation at-risk students in web-based high school
courses. Journal of Research on Computing in Education, 33(5). Retrieved
from http://www.iste.org/jrte/33/5/lehman_s.html
Leonard, J., & Guha, S. (2001). Education at the crossroads: Online teaching and
students’ perspectives on distance learning. Journal of Research on
Technology Education, 34(1), 51-57.
Marks, R.B., Sibley, S.D., & Arbaugh, J.B. (2005). A structural equation model of
predictor for effective online learning. Journal of Management Education,
29(4), 531-563.
Con formato: Color de fuente: Automático
Con formato: Color de fuente: Automático
25
Martilla, J., & James, J. (1997). The need for implementing total quality management
in education. International Journal of Educational Management, 11(3), 131-
135.
Martínez-Caro, E. (2011). Factors affecting effectiveness in e-learning: An analysis in
production management courses. Computer Applications in Engineering
Education, 19: n/a. DOI: 10.1002/cae.20337
Mayer, R.E., Heiser, J., & Lonn, S. (2001). Cognitive constraints on multimedia
learning: When presenting more material results in less understanding. Journal
of Educational Psychology, 93(1), 187–198.
McGorry, S.Y. (2003). Measuring Quality in Online Programs. The Internet and
Higher Education, 6, 159-177.
Mirani, R., & King, W.R. (1994). Impacts of end-user and information center
characteristics on end-user computing support. Journal of Management
Information Systems, 11(1), 141–166.
Motiwalla, L., & Tello, S. (2000). Distance Learning on the Internet: An Exploratory
Study. The Internet and Higher Education, 2(4), 253-264.
Nadiri, H., Kandampully, J., & Hussain, K. (2009). Students’ perceptions of service
quality in higher education. Total Quality Management, 20(5), 523-535.
Newman, A. & Smith, M. (1999). How to create a virtual learning community.
Training and Development, 53, 44-50.
Ngai, E.W.T., Poon, J.K.L., & Chan, Y.H.C. (2007). Empirical examination of the
adoption of WebCT using TAM. Computers & Education 48, 250–267
Nunnally, J.C. (1978). Psychometric Theory. New York: McGraw-Hill.
O’Neill, M.A., & Palmer, A. (2004). Importance-performance analysis: a useful tool
for directing continuous quality improvement in higher education. Quality
Assurance in Education, 12(1), 39-52.
Oliver, R.L. (1993). A conceptual model of service quality and service satisfaction:
Compatible goals, different concepts. Advances in Services Marketing and
Management, 2, 65-85.
Owston, R. (1997). The World Wide Web: a technology to enhance teaching and
learning?. Educational Researcher, 26 (2). Retrieved from
http://www.edu.yorku.ca/~rowston/article.html.
Ozkan, S., & Koseler, R. (2009). Multi-dimensional students’ evaluation of e-learning
systems in the higher education context: An empirical investigation.
Computers&Education, 53, 1285-1296.
Palloff, R., & Pratt, K. (2001). Lessons from the cyberspace classroom. San
Francisco, CA: Jossey-Bass.
Papp, R. (2000). Critical success factors for distance learning. Americas Conference
on Information Systems, Long Beach, CA, 2000.
Parasuraman, A., Zeithaml, V.A., & Berry, L.L. (1985). A Conceptual Model of
Service Quality and Its Implications for Future Research. Journal of
Marketing, 49, 41-50.
Parasuraman, A., Zeithaml, V.A., & Berry, L.L. (1988). SERVQUAL: A Multi Item
Scale for Measuring Consumer Perception of Service Quality. Journal of
Retailing, 64 (1), 12-37.
Ramsden, P. (1991). A performance indicator of teaching Quality in Higher
Education: the Course Experience Questionnaire. Studies in Higher Education,
16(2), 129-150.
Rovai, A.P. (2002). Development of an instrument to measure classroom community.
The Internet and Higher Education, 5, 197-211.

26
Sanders, D.W., & Morrison-Shetlar, A.I. (2001). Students attitudes towards web-
enhanced instruction in an introductory Biology course. Journal of Research
on Computing in Education, 33(3), 251-262.
Selim, H.M. (2007). Critical success factors for e-learning acceptance: Confirmatory
factor models. Computers & Education, 49, 396-413.
Shee, D.Y., & Wang, Y.S. (2008). Multi-criteria evaluation of the web-based e-
learning system: A methodology based on learner satisfaction and its
applications. Computers Education, 50(3), 894–905.
Shen, Q., Chung, J.K.H., Challlis, D., & Cheung, R.C.T. (2007). A comparative study
of student performance in traditional mode and online mode of learning.
Computer Applications in Engineering Education, 15, 30-40.
Spady, W. (1970). Dropouts from higher education: An interdisciplinary review and
synthesis. Interchange, 1(1): 64-85.
Stokes, S.P. (2001). Satisfaction of College Students with the Digital Learning
Environment. Do Learners’ Temperaments make a Difference?. Internet and
Higher Education, 4(1), 31-44.
Su, B., Bonk, C.J., Magjuka, R.J., Liu, X., & Lee, S. (2005). The importance on
Interaction in web-based education: a program level case study of online MBA
courses. Journal of Interactive online learning, 4 (1), 1-19.
Sun, P-C., & Chen, H.K. (2007). The design of instructional multimedia in e-
Learning: A Media Richness Theory-based approach. Computers &
Education, 49, 662-676.
Swan, K. (2002). Buiding learning communities in online courses: the importance o
interaction. Education Communication and Information, 2(1), 23-49.
Tinto, V. (1993). Leaving college: Rethinking the causes and cures of student
attrition. Chicago: The University of Chicago Press.
Volery, T., & Lord, D. (2000). Critical success factors in online education. The
International Journal of Educational Management, 14(5), 216–223.
Vrasidas, C., & McIsaac, S.M. (2004). Factors influencing interaction in an online
course. The American Journal of Distance Education, 13(3), 22-36.
Wang, Y.S. (2003). Assessment of learner satisfaction with asynchronous electronic
learning systems. Information & Management, 4, 75–86.
Wild, R.H., & Hope, B. (2003). DATQUAL: a prototype e-learning application to
support quality management practices in service industries. Total Quality
Management & Business Excellence, 14(6), 695-713.
Yang, C.C. (2003a). Improvement actions based on the customers’ satisfaction
survey. Total Quality Management and Business Excellence, 14(8), 919–930.
Yang, C.C. (2003b). Establishment and applications of the integrated model of service
quality measurement. Managing Service Quality, 13(4), 310–324.
Zhao, C., & Kuh, G.D. (2004). Adding Value: Learning Communities and Student
Engagement. Research in Higher Education, 45 (2), 115-138
Zhao, Y., Lei, J., Chun Lai, B.Y., & Tan, H.S. (2005). What makes the difference? A
practical analysis of research on the effectiveness of distance education.
Teachers College Record, 107(8), 1836-1884.
Con formato: Color de fuente: Automático
Con formato: Color de fuente: Automático

27
Figure 1. Performance-control zone of performance matrix. Source: Chen (2009)
Table 1. Dimensions and items of questionnaire.
Dimensions Items
Student-Student
interaction
1. Student interaction with other students is frequent.
2. Interaction with other students is facilitated through a variety of ways.
3. I feel encouraged to interact with other students.
4. Interaction with my fellow students has allowed me to learn from them.
5. Communication with other students is a positive experience.
Teacher-student
interaction
6. Teacher is available to assists students.
7. Teacher is active in teaching me the subject.
8. The teacher encourages student interaction with him.
9. Student interaction with faculty is frequent.
10. Interaction with the teacher is facilitated through a variety of ways.
Content 11. The course contents fit my needs.
12. The content is up-to-date.
13. The course content is covered to an appropriate degree of breadth.
14. The course materials are placed on-line in a timely manner.
15. Students can interact with content through a variety of tools (e.g.

28
PowerPoint presentations, audios, videos, simulations, etc.).
System flexibility
and convenience
16. The course allows me more flexibility in my daily activities.
17. It was easy for me to become skilful at using the technology.
18. I have convenient access to technical assistance.
19. I can manage my ‘‘study time” effectively.
20. The course allowed me to take a class I would otherwise have to miss.
Table 2. Performance and Satisfaction Results.
Items µS µI PS PI Index
1,0 3,7958 4,2282 0,6989 0,8071 -0,1081
2,0 4,2372 3,9099 0,5593 0,4775 0,0818
3,0 2,9520 4,2523 0,2380 0,5631 -0,3251
4,0 3,7928 3,8138 0,4482 0,4535 -0,0053
5,0 3,8799 3,9069 0,4700 0,4767 -0,0068
6,0 3,9129 3,9730 0,4782 0,4932 -0,0150
7,0 3,8619 3,8709 0,4655 0,4677 -0,0023
8,0 3,9309 3,8679 0,2327 0,7170 -0,4842
9,0 3,8589 3,8228 0,4647 0,4557 0,0090
10,0 3,1111 4,2402 0,2778 0,5601 -0,2823
11,0 3,7147 3,7748 0,6787 0,6937 -0,0150
12,0 3,9399 3,9550 0,4850 0,4887 -0,0038
13,0 3,8348 3,7988 0,4587 0,4497 0,0090
14,0 3,8198 3,8318 0,4550 0,4580 -0,0030
15,0 3,8006 3,7267 0,7002 0,4317 0,2685
16,0 3,8378 3,9489 0,4595 0,4872 -0,0278
17,0 3,9099 3,8649 0,4775 0,4662 0,0113
18,0 4,0811 3,9129 0,7703 0,4782 0,2920
19,0 3,1351 4,3333 0,2838 0,5833 -0,2995
20,0 3,8799 3,8318 0,4700 0,4580 0,0120
Figure 2. Performance-control matrix.
29
0
7
18
8
0
15
1720
19
1614
4
613
10
11
12
3
1
2
0,0
0,5
1,0
0,0 0,5 1,0
Importance (Pi)
Sat
isfa
ctio
n (
Ps)
PUCL=0,243
PLCL=-0,2436
Recommended