DISCLOSURE APPENDIX AT THE BACK OF THIS REPORT CONTAINS IMPORTANT DISCLOSURES, ANALYST CERTIFICATIONS, LEGAL ENTITY DISCLOSURE AND THE STATUS OF NON-US ANALYSTS. US Disclosure: Credit Suisse does and seeks to do business with companies covered in its research reports. As a result, investors should be aware that the Firm may have a conflict of interest that could affect the objectivity of this report. Investors should consider this report as only a single factor in making their investment decision.
10 April 2017 Global
Equity Research Food Retail
Global online grocery The Credit Suisse Connections Series leverages our
exceptional breadth of macro and micro research to deliver
incisive cross-sector and cross-border thematic insights for
our clients.
Research Analysts
Stewart McGuire, CFA
44 20 7888 6531
Olga Bystrova, CFA
7 495 967 8871
A-Hyung Cho
82 2 3707 3735
Antonio Gonzalez, CFA
52 55 5283 8921
Stephen Ju
212 325 8662
Edward J. Kelly, CFA, CPA
212 325 3241
Andre Kukhnin, CFA
44 20 7888 0350
Victoria Petrova
49 69 75 38 2272
Grant Saligari
61 3 9280 1720
Tobias Stingelin, CFA
5511 3701 6301
Keiichi Yoneshima
81 3 4550 9740
Evan Zhou
852 2101 6745
CONNECTIONS SERIES
On the cusp of a seismic shift Online grocery adoption is increasing worldwide and threatens to upend the
economics of all food retailers, regardless of geography. We analyse the
options available to grocers and conclude that in developed countries, only
centralised, automated fulfilment can profitably meet the needs of customers.
The risks to incumbent food retailers are widespread and serious, particularly
for those companies with large supermarkets located too far from customers;
these risks increase with the size and duration of their store lease portfolios.
This report is published in conjunction with a report from our capital goods
team on Warehouse Automation and Robotics, specifically looking at the
companies with exposure to grocery supply chain automation.
■ Technology disruption is coming to grocery. The barriers to efficient
online grocery operations are falling as companies solve the main cost
problems of picking and delivery. We estimate that $37bn of online grocery
infrastructure will be spent in the US to achieve a 25% penetration rate.
■ Business model choice will separate winners from losers. We identify
~20 different permutations of picking and delivery methods within online
grocery. Very few meet the criteria of high service quality and reasonable
profitability due to the exceptionally difficult logistics and the low margins.
■ IGD projects double-digit CAGRs for online grocery in all key markets.
We expect developed regions to rapidly catch up to the UK in online
grocery. If the US had UK-levels of adoption, online grocery revenue would
be US$70bn vs. US$7bn currently.
■ Key companies to watch. We identify a number of companies that are
either leading, trialling or at risk from online grocery (often all three),
demonstrating the nascent and uncertain nature of the channel.
■ CORRECTION: In this version of the report we have corrected the RHS
axis of Figure 1, as the full values were truncated in the original publication.
Figure 1: Online grocery revenue – double-digit CAGRs to 2020
Source: IGD, Credit Suisse research
$0
$100
$200
$300
$400
$500
$600
$0bn
$10bn
$20bn
$30bn
China UK Japan US France S. Korea Germany Australia Belgium Netherlands
2015 (LHS)
2020 (LHS)
2015 Per capita (RHS)
2020 Per capita (RHS)
China; $41bn (2015)China; $178bn (2020)

10 April 2017
Global online grocery 2
Key tables and charts
Figure 2: Margin potential for centralised, automated fulfilment is materially higher than traditional grocery
Source: Credit Suisse research
Figure 3: Attitudes about buying groceries online Figure 4: Have shopped online for groceries (%)
Source: Nielsen Source: Nielsen
Figure 5: Ocado KPIs and LfLs Figure 6: Mixed palletising robot
Source: Company data, Credit Suisse research Source: Kuka
Picking location In-store Dark store Hybrid 3rd-party Centralised In-store Centralised Centralised Centralised
Picking technology Staff Staff Staff 3rd-party Staff Staff Staff Robotic Robotic
Delivery location Home Home Home Home Home C&C C&C Home Home
Delivery mechanism Driver Driver Driver 3rd-party Driver Customer Customer Driver Automated
Industry leader Tesco Tesco Peapod Instacart Ocado Leclerc n/a n/a n/a
Gross margin (avg. basket) 27% 27% 27% 27% 27% 25% 25% 27% 27%
Total direct costs -29% -26% -27% -6% -21% -22% -14% -19% -11%
Direct P&L per basket -1% 1% 1% 21% 6% 3% 11% 9% 17%
0% 20% 40% 60% 80% 100%
Global
Asia-Pacific
Europe
Africa / Middle East
Latin America
North America
Considerers Trialists Regulars Avoiders
0%
5%
10%
15%
20%
25%
30%
35%
40%
45%
China South
Korea
India Europe North
America
Africa /
Middle East
Latin
America
0%
5%
10%
15%
20%
80%
85%
90%
95%
100%
2011 2012 2013 2014 2015 2016
On time delivery or early
Order accuracy
LfLs (RHS)

10 April 2017
Global online grocery 3
Executive summary “The factory [or warehouse] of the future will have only two employees, a man and a dog.
The man will be there to feed the dog. The dog will be there to keep the man from
touching the equipment.” – Warren Bennis1. For further reading into warehouse and
logistics automation, we refer you to today's publication from our capital goods team
Warehouse Automation and Robotics.
Our eight key takeaways for the global online grocery market are:
■ Online grocery growth will accelerate in all key markets. Improved mobile phone
interfaces, easier to navigate web pages, tailored features, more valuable promotions,
automated 24-hour pick-up points, delivery passes, integration with home automation
systems and same day delivery all add tremendous value to the customer. The offline
model will likely be seen as static and passé, with a declining value proposition.
■ Centralisation is vital for scale, high service quality and margin. The abundance
of business models is a result of grocers trying to move online inexpensively. Third-
party solutions (i.e. Instacart) add material costs to the customer and are likely to be
short-term, niche solutions. Using an existing store estate as a quasi-distribution
network is also a stopgap measure.
■ Automation and scale will solve the delivery problem. The need for centralisation
runs counter to delivery economics, which improve when the picking operations move
closer to customers. Potential solutions exist to reduce delivery costs, including
shrinking fulfilment centres and locating them nearer customers, stand-alone click and
collect facilities, sophisticated routing algorithms, and driverless delivery technologies.
■ Low labour costs help, but high labour costs may help more. The paradox of
labour within online grocery is that low labour costs facilitate online grocery (as we see
in China – at least for now), but high labour costs are needed to provide the incentive
to switch to an automated, scaled solution. This ultimately leads to a point where a
lower variable cost model establishes a cost advantage over the traditional store.
■ Most developed markets are amenable to online grocery. The main factors that
provide the conditions for online grocery to flourish are improving in all jurisdictions.
The capital costs of the most efficient online business models continue to fall, which in
turn expands the addressable market. Even a modest shift in market share to online
(say, 20% to 30%), is likely to have far-reaching, negative ramifications for incumbents.
■ Technology changes cannot be overstated. The ability to substitute capital for
labour is reaching a level where automation is making inroads into the most
economically challenging parts of online grocery: picking a basket of goods and
delivering it to the customer. Where grocery was traditionally a local venture, we expect
the scale benefits of technology to spread rapidly across borders.
■ Amazon is a threat to incumbents. Despite AmazonFresh's slower-than-expected
rollout, the strategic and tactical implications remain positive because grocery is: (i) the
largest consumer spend vertical; (ii) drives greater engagement from higher shopping
frequency; (iii) leverages existing fulfilment infrastructure; (iv) accelerates share gain in
adjacent categories; and (v) decreases friction on handling returns.
■ Potential for the adoption of existing marketplace models. We are starting to see
the third-party marketplace model gain traction in grocery. Amazon's arrangement with
Morrisons in the UK offers customers access to multiple credible food sources. Marks
& Spencer does not have an online food strategy, and it would be groundbreaking to
see M&S and Morrisons products listed alongside branded goods on Amazon.com.
1 Mark Fisher (1991), The Millionaire's Book of Quotations

10 April 2017
Global online grocery 4
Key players within online grocery
This report is intended to show the opportunities and pitfalls of various business models
for online grocery. We are still at a very early stage in this channel shift with less than 1%
of global grocery revenues occurring online. The winners and losers from this shift are not
yet known, nor are they easy to predict because the outcome will be based largely on the
decisions that will be made by management teams over the next few years.
In this report, we have drawn together the perspectives of all our regional retail analysts.
We have identified a number of companies that are either market leaders in grocery (and
are therefore at risk), or are working on positioning for the shift to online, or both. These
include the companies listed in Figure 7. Out of all of the companies we cover, only one –
Ocado – stands out as a technological leader with no legacy assets, but this does not
necessarily make it the leader in a sector where access to capital and localised supply
chains remain significant barriers to entry.
We also refer readers to the report published from our capital goods team on Warehouse
Automation and Robotics, specifically looking at the companies with exposure to grocery
supply chain automation. The following players have the widest product offering, and
featured prominently in our discussions with industry experts: Dematic (KION), Swisslog
(KUKA), Daifuku, Bastian Solutions (private) and Intelligrated (Honeywell).
Figure 7: Country rankings2 and key companies
Source: Credit Suisse research
2 For an explanation of the 13 characteristics used in the ranking, please see Appendix A.
Country /
Region
Country
Score*
Companies to
WatchRating / TP Key companies within country / region for online grocery
US 66
Amazon
Walmart
Kroger
Ahold Delhaize
OUTPERFORM, TP $900
OUTPERFORM, TP $80
NEUTRAL, TP $30
OUTPERFORM, TP €24.50
Continues to expand grocery offerings in US and UK
Largest mass merchant globally with 19% share of the US grocery market
Rapid click and collect expansion; currently unwilling to invest in direct delivery
Multiple online operations in multiple jurisdictions
Canada 65Loblaws
Longo's
Not rated
Private
Offline leader; click and collect offered but no delivery
Toronto-based grocer with full-service online delivery
UK 63
Tesco
Ocado
Morrisons
UNDERPERFORM, TP 160p
OUTPERFORM, TP 410p
NEUTRAL, TP 230p
Sophisticated online operations, but levered to large stores and long leases
The leader in purpose-built automation for grocery
Strategic partnerships with Ocado and Amazon, plus upstream leverage
China 61
Alibaba
JD.com
Yihaodian
OUTPERFORM, TP $127
NEUTRAL, TP $32
Private
Parterning with top international supermarket brands, focus on fresh
Strong #2 to Alibaba, good strategic partnerships (Walmart, Yihaodian)
Strong procurement and fulfillment expertise
France 57 None
All major players have extensive click and collect or 'Drive' locations, which total
more than 4,000 throughout the country. France has a very high proportion of
hypermarkets, which is a strategic negative.
Germany 57 NoneHigh discounter penetration and lack of an anchor metropolitan area like London
or New York has placed German retailers relatively behind in online grocery.
Scandinavia 55 ICA Not rated Innovative 'delivery to fridge' model.
Australia 54Wesfamers
Metcash
NEUTRAL, TP A$41.92
OUTPERFORM, TP A$2.54
Heavy exposure to bricks and mortar retail but offering online grocery
Most likely wholesale distribution partner for Amazon in Australia
South Korea 54
E-MART
Homeplus
Lotte Mart
OUTPERFORM, TP W235,000
Private
NEUTRAL, TP W220,000
Two fulfillment centres and increasing penetration via same day delivery
Same-day delivery service
Growing SKU selection, planning to have 3 fulfillment centres by 2019
Russia 52 NoneMajor players are watching developments but are currently only in testing
phases.
Japan 49 None
Some private, B2B and niche players operate in key cities, but Japan is
currently lacking leadership from the large consolidated food players (such as
Ito-Yokado, Aeon and Seiyu) or well-capitalised internet-only disruptors.
Mexico 41 Walmex NEUTRAL, TP MXN39 Investing in online infrastructure, especially relative to competition
Brazil 37 GPA Food NEUTRAL, TP R$70 A pioneer of online grocery in Braz il with dedicated fulfilment capacity
* Country score is the sum of the 13 characterisics used to create the country spider charts in Part II

10 April 2017
Global online grocery 5
Table of contents
On the cusp of a seismic shift 1
Key tables and charts 2
Executive summary 3
Key players within online grocery ............................................................................. 4
Part I: The grocery sector 6
A very brief history of grocery ................................................................................... 6
Business models: Centralised or Distributed? ......................................................... 7
Other economic considerations for online grocery ................................................. 14
The growing role of Amazon .................................................................................. 15
The inflection point is coming ................................................................................. 17
Part II: Country analysis 18
Where does online grocery work best? .................................................................. 18
Geographic analysis ............................................................................................... 19
Part III: Online grocery economics 39
The cost of picking ................................................................................................. 39
The cost of delivery (or collection).......................................................................... 46
Cost and margin comparisons of all business models ........................................... 49
Online grocery costs from the customers' perspective .......................................... 50
Appendix A: Multi-factor country model 52
Appendix B: Further reading / viewing 54

10 April 2017
Global online grocery 6
Part I: The grocery sector
A very brief history of grocery
Step-changes in grocery distribution are not new. It wasn't until 1916 at a Piggly Wiggly in
the US that customers were able to browse groceries themselves rather than asking
someone behind a counter for them. It took another 20 years to incorporate produce,
baked goods and meat into what we now call a supermarket. The hypermarket, born in
Belgium 20 years later added general merchandise under the same roof. Format-wise,
things then remained reasonably static until the 1990s.
Webvan, the first online grocery delivery company of any size, was founded in 1996 and
went public at a valuation of $4.8bn. Five years later it was bankrupt, with the media
branding it one of the largest dot-com flops in history. The management of Ocado (a UK-
based, pure-play online grocer) cites the implosion of Webvan as a critical event that
provided the lead time to hone operations with few competitors. We also believe it soured
the appetite for online grocery within the US for a significant period of time.
As a result, consumable categories have been slower to gain traction amongst online
shoppers, with only certain categories (personal-care, beauty products online, packaged
grocery) growing well. Fresh groceries have much lower penetration. They are highest in
Asia, where 40% of Chinese, 39% of South Korean and just over 33% of Indian
respondents say they’ve purchased fresh groceries online (source: Nielsen). These
numbers drop materially in Europe (9%) and North America (9%), the traditional leaders in
online marketplaces. 64% of respondents were concerned about the freshness or quality
of products purchased online.
There are a large number of sceptics of
the online grocery model. Our research
shows that some believe online grocery
shopping is a niche service for time-
starved, cash-rich families, technology
buffs or foodies who are looking for
unusual or exotic ingredients. We also
read that consumers like going to the store
to buy groceries.
However, we believe the appeal is much
broader and the value proposition much
greater. From a customer's perspective,
there are good reasons to try online
grocery – but also, many more reasons
why, even after trying, customers switch
back to traditional stores (Figure 8).
This is particularly true when a lack of dedicated resources results in unmet expectations,
especially if there is a premium being charged for the service. So far, online grocery
underwhelms in most countries. We believe much of the blame lies in the choice of
business model of online grocery.
Done correctly, however, online grocery is of immense value to the consumer. According
to Kantar Worldpanel, households shop for the same 400 items on a weekly basis, if not
more often. If the outcome of an online shopping trip meets or exceeds an in-person shop
at similar price levels, we expect the shift to accelerate. We believe we are now
approaching that point.
Figure 8: Some pros, many cons
Source: Credit Suisse research
Positives Negatives
Shop at any time Sign-up hassle
Time savings Website navigation
Chore avoidance Selection issues
Wide range of items Substitutions
Hidden cost savings Returns
Delivery coordination
Slot availability
Premium cost
Fresh food anxiety
Lose out on "experience"

10 April 2017
Global online grocery 7
Business models: Centralised or Distributed?
Online grocery business models, fulfilment models, customer experiences and economic
sustainability are inextricably linked and vastly different. When looking at the logistics
value chain from a customer's perspective, there are four discrete elements to a shopping
trip: getting to the store, picking the basket, checking out (paying and packing) and
transporting the shopping home (Figure 9). We believe that many shoppers could consider
each of these tasks a chore – i.e. best avoided, if possible.
Within these four elements, the key component, in our view, is the picking function: For an
online grocer, this is the most time intensive part of the process (and so the highest labour
cost portion) and is also the target of customers' two main anxieties:
■ Are the fresh items the ones they would have picked?
■ If an item is unavailable, what is the best substitute?
Figure 9: The online logistics value chain; outsourcing chores
Source: Credit Suisse research
The business model (and its accompanying fulfilment model) has a material effect on
customer experience, so it ultimately drives overall adoption of online grocery. The most
straightforward model (and still the most common) is to pick from a store close to the
customer. In recent years, grocers have added 'dark stores (dedicated quasi-warehouses,
efficiently merchandised, not open to the public), hybrid stores (stores with some
dedicated non-public space for certain categories) and centralised fulfilment centres
(CFCs, large, warehouse-style operations that receive good from manufacturers), but
these still form a relatively small percentage of all online baskets.
If we take the fulfilment models and incorporate the two main options for getting a
completed basket to the customer's house (home delivery and 'Click and Collect' or C&C),
we can create the matrix in Figure 10. Each cell represents a unique economic model for
the grocer and a different value proposition for the customer, and each combination can
have either a subtle or significant impact on overall economics.
Figure 10: The way baskets are picked and delivered changes the economics
Source: Credit Suisse research
Create
shopping
list
Pick itemsCheckout
/ pay
Transport
to home
Pick itemsCheckout
/ pay
Transport
to home
Traditionalcustomer functions
Pick itemsCheckout
/ pay
Online grocer functions
Travel to
store
In-store Dark store Hybrid Centralised
Home Delivery
Store Pick Up ? ? Currently in use
Non-Store Pick Up Not currently used
Unattended Collection ? Most common
Picking Methodology
Delivery
Method

10 April 2017
Global online grocery 8
We worked with Kurt Salmon, an international consulting firm that specialises in retail and
consumer products, to analyse individual costs that are incurred within the UK during
online grocery fulfilment. Later in the report we explore detailed economics of the four
main picking models and the two main delivery options as well as the relative impact of the
cost of labour and capital between regions.
All online grocery is not created equal
Online grocery adoption has been slow. The negative issues highlighted in Figure 8 show
the main arguments against online grocery from a customer's perspective. The main
reason why these issues persist is cost. Online grocery is an order of magnitude more
difficult to execute than online general retail, which makes the economics for the grocers
extremely poor, and hence there are few incentives to solve the issues. Exacerbating this
issue is the fact that customers are exceptionally sensitive to substitutions and delivery
timing in grocery, which sets the bar very high.
There are four main reasons why this cost disadvantage exists:
■ Individual item values are low. Picking costs are very high as a percentage of value.
■ Orders have a large number of items. As number of items increases, achieving a
100% pick rate becomes challenging. Mistakes and substitutions introduce high-cost
return processes.
■ Temperature chain of custody. Food safety regulations require frozen and chilled
products to be handled independently, requiring much greater logistical effort.
■ Delivery timing is determined by the customer. Because delivery slots are chosen
by the customer (within a narrow window), delivery routing is inherently inefficient.
In addition to the high-cost nature of online fulfilment, cannibalisation of store-shopped
baskets is margin dilutive, reducing the incentive for grocers to move online. What we end
up with is a piecemeal approach, where tentative grocers link up with early adopters to
create a suboptimal system that grows slowly and creates a high degree of scepticism.
This partly explains why even in the UK, where the highest-quality offerings are available,
there are numerous impediments to a mass market shift to online grocery. Consumer
habits are hard to break, and the perception that online grocery is expensive, cumbersome
and delivers low-quality produce make it a challenge for marketers. Only 27% of the UK's
population shops online for groceries, and of that group, ~50% shop 5 or fewer times per
year. There is clearly work to be done to increase the frequency of those who already
shop online, and to increase the overall percentage of people who shop online.
Figure 11: UK frequency – mostly low Figure 12: UK penetration – modest
Source: Kantar Worldpanel, Credit Suisse research Source: Kantar Worldpanel, Credit Suisse research
0%
10%
20%
30%
40%
50%
60%
70%
1 to 12 13 to 20 21 to 30 31 to 40 41+
Frequency of Shop (per year)
?
0%
10%
20%
30%
40%
50%
60%
2012 2013 2014 2015 2016
?

10 April 2017
Global online grocery 9
We note penetration looks like it is actually slowing at a time it should be picking up. Why
do fewer than 30% of consumers shop online, and of those, perhaps only 20% could be
considered "high frequency" shoppers?
The data suggest that choice of business model has a material impact on acceptance and
growth of online grocery. Currently, the vast majority of online orders in the UK are still
picked in stores (Figure 14). The consumer does not differentiate between fulfilment
models, but relies on the same set of performance indicators to determine overall value:
assortment, product availability, freshness, substitutions and delivery performance.
Figure 13: UK online market share Figure 14: UK market share by model
Source: Kantar Worldpanel, Credit Suisse research Source: Kantar Worldpanel, Credit Suisse research
The arguments for centralisation
Assortment: Ocado has the broadest assortment among all UK grocers (online or offline)
with >50k grocery SKUs (2015: >47k, 2014: >43k, 2013: 34k). Inventory only needs to be
carried in a small number of locations (for Ocado: 2), and adding SKUs is inexpensive.
Availability: We compile the service and availability statistics that are published in a UK
trade publication and supplement the data with our own availability statistics on Ocado.
The consistency shown by the centralised model has been notable; out of the last 25
weeks of data, there were only two weeks where two items were out of stock and four
weeks where there one item was out of stock; the other 17 weeks had 100% in-stock
availability, materially better than in-store availability (Figure 15).
Figure 15: Product availability; the centralised model excels
Source: The Grocer, Credit Suisse research
Tesco
42%
Asda
16%Sainsbury
17%Morrisons
5%
Waitrose
3%
Ocado
17%
Amazon
0%
In-store
73%
Dark
store
5%
CFC
22%
0%
10%
20%
30%
40%
50%
60%
70%
80%
90%
100%
Nov-16 Dec-16 Jan-17 Mar-17
Asda Morrisons
Sainsbury's Tesco
Waitrose Ocado

10 April 2017
Global online grocery 10
Freshness: Centralised fulfilment centres receive goods directly from suppliers and orders
are shipped directly to customers. This shortens the supply chain and extends the lifespan
of fresh produce. A shorter supply chain coupled with FIFO inventory management also
minimises waste. A store-based fulfilment model must balance between high inventory
levels (to ensure availability), or low inventory levels (to maintain throughput and
freshness). Local demand fluctuations can have a material effect on this balance, and also
mean that customers in different regions will experience different service levels.
Substitutions: Substitutions are largely a function of inventory control, and are closely
related to availability. Centralised fulfilment has much greater availability, and so inherently
has fewer substitutions. More broadly, the customer is interested in order accuracy (which
is the metric that Ocado tracks). Accuracy is a combination of substitutions and errors.
Centralised operations have more automation and easier to maintain picking processes
that can reduce errors.
Delivery performance: We discuss the complexities of delivery in the next section, but we
believe that centralised order routing allows for more accurate delivery time estimates.
Ocado publishes KPIs with respect to delivery metrics and order accuracy. Figure 16
shows that both have been consistently high. We believe Ocado puts significant effort into
maintaining these metrics, but it is our view is that it is their business model that gives
them the opportunity to achieve these high scores. The corollary of this is an in-store
picking model, which is not inherently able to support high KPIs, even at great effort.
Figure 17 shows Ocado's revenue by year of customer acquisition. We would expect each
horizontal bar to trend downward over time; new customers cannot be added to a cohort
but existing customers leave (to competitors, moving away, or otherwise). However, each
of the bars in the diagram are quite flat, implying that any loss of customers is being
balanced by spending increases by the customers that remain.
Not only is each cohort's sales relatively flat, each subsequent cohort is adding an
increasing level of spend (i.e. the bars are getting wider). This is supported by Ocado's
organic growth, which has averaged 15% over the past five years. The high and consistent
KPIs give customers reasons to become repeat customers.
Figure 16: Ocado KPIs and LfLs Figure 17: Ocado sales by cohort
Source: Company data, Credit Suisse research Source: Ocado, Credit Suisse research
Our supposition is that the adoption of store-based fulfilment for online grocery is slowing
materially, either because companies are trying to slow down growth (due to low
profitability/cannibalisation), or customers are slowing adoption (due to poor value), or a
combination of both factors. The Kantar data in Figure 18 show that Tesco's contribution
to online growth was negative for much of 2016, while Ocado, Morrisons and Amazon – all
centralised fulfilment operations – continued growing strongly.
0%
5%
10%
15%
20%
80%
85%
90%
95%
100%
2011 2012 2013 2014 2015 2016
On time delivery or early
Order accuracy
LfLs (RHS)
2007 20142008 2009 2010 2011 2012 2013
£

10 April 2017
Global online grocery 11
Figure 18: Contribution to online growth by UK retailer
Source: Kantar Worldpanel
The arguments against centralisation
While there are many and varied benefits from centralisation, there are also two main
drawbacks that need to be considered. The first issue relates to drive times. By increasing
the distance between the central facility and customers, drive times increase, thereby
adding costs – both direct costs such as fuel and labour, but also indirect costs such as
depreciation on transportation infrastructure. The second issue relates to scale. A fully-
utilised facility would maximise profitability, but the ramp-up period of a large facility can
take a long time, thereby depressing IRRs.
Both of these issues raise the question of the optimal size of a CFC, and are the main
reasons why a grocer may decide to open a dark store close to customers rather than a
CFC. Currently the capacity crossover between a dark store and a CFC is in the £150m to
£350m/year range – anything larger than £350m would be a centralised operation, while
anything smaller than £150m would be a dark store. Ocado is currently aiming at reducing
the lower bound for CFCs to allow the construction of facilities that are closer to customers
(and to reduce capex requirements).
Ocado attempts to bridge the distance from its CFCs by 'trunking' – trucking consolidated
orders via tractor-trailer trucks to a 'spoke, where orders are broken out into delivery van
sizes. Currently, just one CFC fulfills orders for the entire London area, supplemented by
eight spokes, as shown in Figure 19. The commissioning of CFC4 in 2018 should alleviate
pressure on this CFC, and also reduce the trunking requirements into London.
The added step of trunking, and the potentially longer drive times from the nearest spoke
to the furthest away delivery are the main additional costs of centralised fulfilment when
compared to store picking. We estimate this to be ~2% of sales. To the extent that online
operators are able to position fulfilment centres closer to the ultimate catchment area, this
cost will decline, although we do not expect it to disappear.
-4%
0%
4%
8%
12%
16%
May 2015 2016 2017
Tesco Asda Sainsbury Morrisons
Waitrose Ocado Amazon Online

10 April 2017
Global online grocery 12
Figure 19: Ocado's current fulfilment infrastructure around London
Source: Company data, Map data ©2017 Google, Credit Suisse research
The data seem to bear out this headwind. As shown in Figure 21, trunking and delivery
costs as a percentage of sales have not fallen materially for Ocado, which is not surprising
given the lack of obvious leverage in the delivery model.
Figure 20: Ocado's London spokes Figure 21: Ocado delivery expenses
Source: Company data, Credit Suisse research Source: Company data, Credit Suisse research
However, with drivers' labour representing ~60% of current trunking and delivery costs, it
could be argued that the other costs (capital, fuel) have fallen, implying higher efficiencies
overall. These efficiencies come from higher customer densities and improved routing –
both of which should continue to improve given that Ocado's market share is still low.
We can attempt to unpick these costs by looking at the increasing level of wage rates
using national statistics and backing into the total costs for trunking and delivery using
Ocado's published costs.
Centralised Fulfillment Centre (operational)
Centralised Fulfillment Centre (under construction)
Spoke
Shaded circles’ radius = 5km
Distance from
CFC (km)
Enfield 26 24
Park Royal 32 36
West Drayton 50 39
South Ruislip 31 45
Dagenham 63 48
Kent 69 51
Surrey 67 53
Wimbledon 51 76
SpokeDrive Time
(mins)
10%
11%
12%
13%
2010 2011 2012 2013 2014 2015 2016

10 April 2017
Global online grocery 13
Figure 22: UK labour rates Figure 23: Delivery cost breakdown
Source: ONS, Credit Suisse research Source: Company data, Credit Suisse research
But are these improvements any better than what we could expect from a store-pick
model? In our view, the answer is yes. We estimate that Tesco delivered £3.5bn of
groceries in 2016 using 5,500 vans, or £640k/year per van; Ocado delivered £1.2bn of
groceries per year using 1,350 vans, or £870k/year per van – a 30% delta after adjusting
for pricing differences3. The trunking costs that Ocado incur appear to be more than
compensated for by the efficiency gains it has been able to achieve from the 'last mile'. We
think this is due to three main issues:
■ The 'n+1' van problem. For each site, some number of redundant vans are required to
ensure continuity of service if there is a breakdown or a roadworthiness issue. The
more sites in operation (which are much greater in a store-based vs. centralised
model), the more redundant vans are required.
■ Routing efficiencies. In a store-based model, routes are optimised by individual van
(or potentially, by store). This reduces the ability to route efficiently, which requires
larger fleet sizes and larger catchment areas to provide optionality and flexibility.
Routing algorithms involve some of the most complex areas of study within
mathematics and computer science; for grocery, the added constraints of weight and
volume within a route plan further complicate the problem. The high level of complexity
offers myriad opportunities to squeeze out efficiencies if operations are centralised,
while a store-based model does not have these opportunities.
■ Coverage areas. Store picking allows for large coverage areas; both Tesco and
Sainsbury are able to reach the vast majority of the UK population with their online
offers, whereas Ocado reaches 70% of the population, but services only ~25% of the
area. The extended reach of store-based fulfilment creates locations where asset
utilisation is relatively low.
Taking all of these factors into consideration, it is difficult to come to a definitive conclusion
regarding the true costs of delivery for each business model. We believe that Ocado and
Tesco provide excellent case studies to analyse delivery issues, but neither should be
assumed to be a 'general case'; different implementations of their models could have
different outcomes. However, our analysis shows greater opportunities for cost savings
with wider catchment areas, and so we expect trunking and delivery costs to trend lower
for centralised operations, while store-based costs should remain relatively static. Longer-
term, step-changes in technology (for example, driverless vans, drone-bots) coupled with
tweaks to the business model have the potential to materially cut delivery costs.
3 The difference between £870k and £640k is 36%, but part of that difference is due to pricing rather than volume, which we argue
is not a function of delivery efficiency. Our analysis shows that Ocado prices at a 6% premium to Tesco. On a like-for-like volume basis, this would reduce the efficiency premium from 36% to 30%.
96%
98%
100%
102%
104%
106%
108%
110%
112%
114%
£420
£430
£440
£450
£460
£470
£480
£490
£500
£510
2010 2011 2012 2013 2014 2015 2016
Labour rates (£, LHS)
Labour rates (indexed, RHS)
35%
40%
45%
50%
55%
60%
2010 2011 2012 2013 2014 2015 2016
Driver labour
Residual (efficiency gains)

10 April 2017
Global online grocery 14
Other economic considerations for online grocery
The value of data
We see the increasing role of data analytics as a way for retailers to add value to their
suppliers (and in the process, monetise the data they accumulate). Ocado has shown it
can increase supplier revenue as a percentage of overall revenue (Figure 24), a trend that
we expect to continue. The majority of Ocado's orders are now placed via a mobile device,
where screen real estate is limited. The value of being able to place specific products on a
particular customer's screen is very powerful. Figure 25 shows offers on the home screen
of an Ocado customer who had made multiple purchases of each one of those items in
previous orders.
Figure 24: Supplier income (% revs.) Figure 25: Ocado app home page
Source: Company data, Credit Suisse research Source: Credit Suisse research
Differential product pricing
As an adjunct to the rising importance of data, an important benefit of online shopping is
that every 'storefront' can be customised for each consumer. Customisation is already
happening with promotions and delivery costs, but we should expect pricing to become
individualised (or at least categorised) as well.
National pricing is a 'taboo' subject in the UK – every grocer sells the same product in the
same format at the same price, no matter whether they are in Central London or in a
remote part of the country. These issues do not exist in larger countries (France, US,
Canada, for example), and we do not believe they should persist online either. Multi-
channel grocers are competing with their own stores, so price customisation may be more
challenging, but grocers with no store infrastructure would not be subject to the same
constraints.
Same day delivery: Not just a risk to convenience operations
We expect another step-change to occur when same day delivery (SDD) becomes
mainstream. SDD will enable grocers to move away from bad trading practices, drive
customer engagement and (potentially) boost margins.
When customers changed from daily shopping at a local market to a supermarket (and
subsequently to the hypermarket), they benefited from a wider assortment, higher quality
and lower prices. The trade-off was that customers then had specific, sometimes
inconvenient, shopping missions: e.g., a weekly shop, top-up shops, food for today, food
for now, special events. These benefits were driven by new stores and significant supply
chain efficiencies, but many consumer wants and needs remained unfulfilled. Their goal is
1.0%
1.5%
2.0%
2.5%
3.0%
3.5%
2010 2011 2012 2013 2014 2015 2016

10 April 2017
Global online grocery 15
to have a complete inventory of fresh groceries at home, low costs, wide variety, and low
involvement.
These goals are extremely difficult to meet within the context of the existing large
supermarket infrastructure (and are challenging to meet with current online offerings,
although they come much closer). But once online can promise SDD, consumers will be
able to shop for groceries the way they always wanted to, with no planning, no stocking up
or bulk shopping. The size of the basket becomes reasonably consistent, which helps both
consumers and online operators; 'convenience' is redefined because proximity benefits
break down as delivery lag approaches zero. Waste is reduced and customers are happy.
The retailers (and ultimately, the suppliers) can then move away from their mass-
marketing, mass-promotion and mass-merchandising models. Promotional intensity would
fall as it would not be required to encourage customers to choose a particular store.
Consistent, at-home replenishment removes the focus on bulk shopping and a truly
personalised interface reduces price sensitivity and provides an easier path to trading up
and trading across.
The reward of this model will be loyalty. Traditional online fulfilment methods, such as in-
store picking or C&C, do not lend themselves to this model because of the built-in
inefficiencies and the fact that they have to follow the same pricing/promotion structure as
the mother stores. Only centrally-fulfilled (or large dark stores) offer the scale and
efficiencies to enable widespread SDD while maintaining a broad, in-stock assortment.
Home automation: Beyond music and the weather
Home automation has evolved into what is now a home assistant, with Amazon's Echo
perhaps the most recognisable example. And although Google Home was only released in
November 2016, we note that the underlying AI-based technology in the form of Assistant
is rapidly gaining distribution across the spectrum of Google's applications as well as
Android phones. While Amazon and Google are the frontrunners in commercialising this
technology, it is difficult to ignore Apple, as it was among the first to demonstrate its
expertise in natural language processing with the release of Siri.
In 2013, Google CEO Larry Page articulated the concept of a connected, multi-screen
home, a point worth raising once again as we are on the cusp of advancement of smart
home appliances/refrigerators that should be able to determine when replenishment is
required, in addition to performing the basic task of maintaining shopping lists. This
reduction of transactional friction should help the adoption of online grocery, in our view.
What may be a troubling development for grocers is that the number of companies who
have the technology/engineering resources to develop and maintain applications within a
connected home environment will be few and far between, with either Google and/or
Amazon (or Apple) serving as the primary consumer gateway for transactions.
The growing role of Amazon
The business that Amazon started in books has spread to all kinds of goods, but it wasn't
until 2010 that it started to test the feasibility of expanding into the single-largest sector
within retail: grocery. As noted earlier, there has been a spectacular failure (Webvan), and
some small successes (Peapod in the US, Tesco and Ocado in the UK), but online
grocery remains less than 1% of all grocery sales globally.
And just as Amazon has gained share over time in other product verticals, it would not
surprise us to learn that it has similar ambitions to be a Top 5 grocer over the longer term.
Amazon grocery model still in flux
That said, handling fresh produce is vastly different from other categories. And it should be
no surprise that Amazon's full offer grocery service (AmazonFresh) has seen a slower-
than-anticipated rollout. Our expectation in 2H13 when the company started to expand out

10 April 2017
Global online grocery 16
of its home base of Seattle and into Los Angeles and San Francisco, was for Fresh to be
offered in 25 additional markets by the end of 2014. (Please see our report, The Key
Product in Amazon Fresh is Not Just Produce but Rather Same Day Delivery from 17
December 2013) .
The complexity that food adds to the fulfilment process is extremely high, a summary of
which is in Figure 26.
Figure 26: Difference between food and non-food fulfilment
Source: Credit Suisse research
According to an academic paper that analysed Amazon's fulfilment processes4, Amazon
undertakes numerous other steps within fresh produce that have no parallels in non-food.
These include more advanced receiving functions, transforming cases to individual SKUs,
preparation (individual wrapping, for example), replenishment (from non-pickable locations
to pickable locations), produce-specific storage and packing, trimming, inspection, ongoing
rating and cleaning. Overall complexity is much higher than in non-food, and so training
requirements are necessarily higher, as are costs.
And just as it has already done across many other product verticals, Amazon has entered
into a number of deals that continue to demonstrate its ambivalence to source inventory as
well as first-party or third-party ownership – as long as the consumer gains access to the
best selection at the best price.
The delivery process is also not yet optimised. Amazon trucks (not third-party) transport
orders directly from the fulfilment centre in Seattle, whereas orders for customers in Los
Angeles and San Francisco are transported in bulk from fulfilment centres to local delivery
stations and then separated onto different delivery routes (similar to Ocado's trunking
operations).
Lack of current market share should be no comfort
Even after seven years, AmazonFresh remains relatively underpenetrated. It is not
available in most US cities, and overall market share is immaterial.
As we have noted previously, AmazonFresh as an offering should not be viewed just as an
encroachment into grocery, but rather a broader rollout of same day delivery. Amazon's
existing product selection within Prime Now has seen a faster rollout than grocery and
continues to expand vis-à-vis its third-party offering along with shipping discounts across a
greater array of products facilitated by Fulfilment By Amazon. Grocery is one of the last big
steps, which should aid consumer engagement and frequency.
4 V. Modi, Application of Flexible Labor and Standard Work in Fulfilment Center Produce Operations, MIT, 2015
Order fulfillment step Food Non-food
Temperature checksPotential disagreements with driver when
product arrives outside of specificationsNone
Prioritisation Required, due to freshness concerns None
Quality check In-depth, multi-faceted Cursory
Depalletising Complex; similar products look alike Straightforward
Storage Location findingHighly regulated, due to temperature
requirementsStored anywhere within FC
Expiration dates Closest date picked first No expiration dates
Order Fragile items segregated Based on routing efficiency
Quality controlMulti-faceted quality checks during
pickingCursory damage inspection
Item combinations Multiple exceptions (i.e. garlic + flowers) None
Temperature combinations Grouped, where possible None
Receiving
Picking

10 April 2017
Global online grocery 17
The inflection point is coming
After 20 years since the first pure-play online grocery operation started, we are seeing a
business model emerge that provides excellent service, but at a high cost. We expect this
business model to develop into one that companies can use to drive costs materially
lower, while maintaining, or even increasing KPIs.
The technological advances in customer interfaces, data analytics, robotics, and delivery
channels will make centralised online grocery a far superior value proposition to both
customers and grocers. In many ways, it is a mindset shift – away from costs added
(picking labour, delivery costs, IT infrastructure) to costs removed (store expenses, rent,
labour, utilities, maintenance).
Revisiting the pros and cons from Figure 8, we show the remedies for each of the
customer issues we raised. We expect that over the medium term, customers will receive
a significant increase in value without a commensurate rise in prices.
Figure 27: Technology, over time, will address all of the negatives
Source: Credit Suisse research
The end game
The complexities of grocery means that the sector is still at the very early stages of a shift
to online – perhaps five years behind general merchandise. In non-food, not only did
technology and software need to improve materially but so did the systems integration
processes, which are materially easier than those needed for food.
Figure 28 shows the gross profit contribution per basket for each of the main business
models using an average basket size for an online order (£90).
Figure 28: Centralised operations provide a clear path to materially higher margins
Source: Company data, Credit Suisse research
The reward for centralising and automating grocery fulfilment is significant: operating profit
margins are expected to be ~2x of those in traditional store-based models, and over 3x
once the next round of technology advances is implemented.
Positives Negatives Remedies
Shop at any time Sign-up hassle Use single sign on / 1-time event
Time savings Website navigation Website improvements
Chore avoidance Selection issues Website improvements / learning
Wide range of items Substitutions Operational improvements / scale
Hidden cost savings Returns Operational improvements
Delivery coordination Delivery alternatives / technology improvements
Slot availability Operational improvements / scale
Premium cost Scale / technology advancements
Fresh food anxiety Operational improvements / scale
Lose out on "experience" Virtual reality
Picking location In-store Dark store Hybrid 3rd-party Centralised In-store Centralised Centralised Centralised
Picking technology Staff Staff Staff 3rd-party Staff Staff Staff Robotic Robotic
Delivery location Home Home Home Home Home C&C C&C Home Home
Delivery mechanism Driver Driver Driver 3rd-party Driver Customer Customer Driver Automated
Industry leader Tesco Tesco Peapod Instacart Ocado Leclerc n/a n/a n/a
Gross margin (avg. basket) 27% 27% 27% 27% 27% 25% 25% 27% 27%
Total direct costs -29% -26% -27% -6% -21% -22% -14% -19% -11%
Direct P&L per basket -1% 1% 1% 21% 6% 3% 11% 9% 17%

10 April 2017
Global online grocery 18
Part II: Country analysis
Where does online grocery work best?
Global socioeconomic and demographic trends will contribute to rising demand for
convenience amongst an increasingly urban and ageing populace: According to the UN
60% of the world population is expected to live in urban areas by 2030; by 2050, the
number of persons over the age of 60 will triple, from 606m today to nearly 2bn. Both
trends will contribute to rising consumer demand for convenience offerings by retailers.
Dispelling the population density myth
One of the most common pushbacks we hear regarding online grocery is that it requires
very high population densities to work. London has become the epicenter of that argument
– it has a big, rich population that seems well-suited to online grocery.
Figure 29: Population densities and wealth of selected countries
Source: UN, World Bank, Credit Suisse research
But there are more cities similar to London than one might think. Canada is a good
example of just how misleading country statistics can be. With the world's second-largest
land mass and a modest population of 36m, Canada seems like a poor candidate for a
service that needs high population densities.
However, the region around Toronto encompasses 630km2 (a mere 0.007% of the
country) but it has a population of 2.7m (7.5% of the country).
Country Area (km2) Population (m) Pop. per km
2GDP per capita
South Korea 97,000 50.6 522 27.2
Netherlands 34,000 16.9 497 44.4
Belgium 30,000 11.3 377 40.3
Japan 365,000 127.0 348 34.5
United Kingdom 242,000 64.9 268 44.0
Germany 349,000 81.5 234 41.3
Switzerland 40,000 8.3 208 80.8
Italy 294,000 60.8 207 30.0
China 9,388,000 1371.0 146 8.0
Denmark 42,000 5.7 136 51.8
Thailand 511,000 68.1 133 5.8
Poland 306,000 38.0 124 12.6
France 548,000 64.4 118 37.6
Austria 83,000 8.6 104 43.8
Turkey 769,000 77.7 101 9.2
Spain 500,000 46.4 93 25.8
Republic of Ireland 69,000 4.6 67 61.7
Mexico 1,944,000 121.0 62 9.5
South Africa 1,213,000 54.0 45 5.8
Colombia 1,109,000 48.0 43 6.1
United States 9,147,000 321.0 35 56.2
Braz il 8,358,000 204.0 24 8.7
Sweden 407,000 9.7 24 51.1
Finland 304,000 5.5 18 42.2
Norway 365,000 5.2 14 74.4
Saudi Arabia 2,150,000 31.0 14 20.8
Russia 16,377,000 143.4 9 9.3
Canada 9,093,000 35.8 4 43.3
Australia 7,682,000 23.8 3 56.3
Total 71,816,000 3,108.2 43
10 April 2017
Global online grocery 19
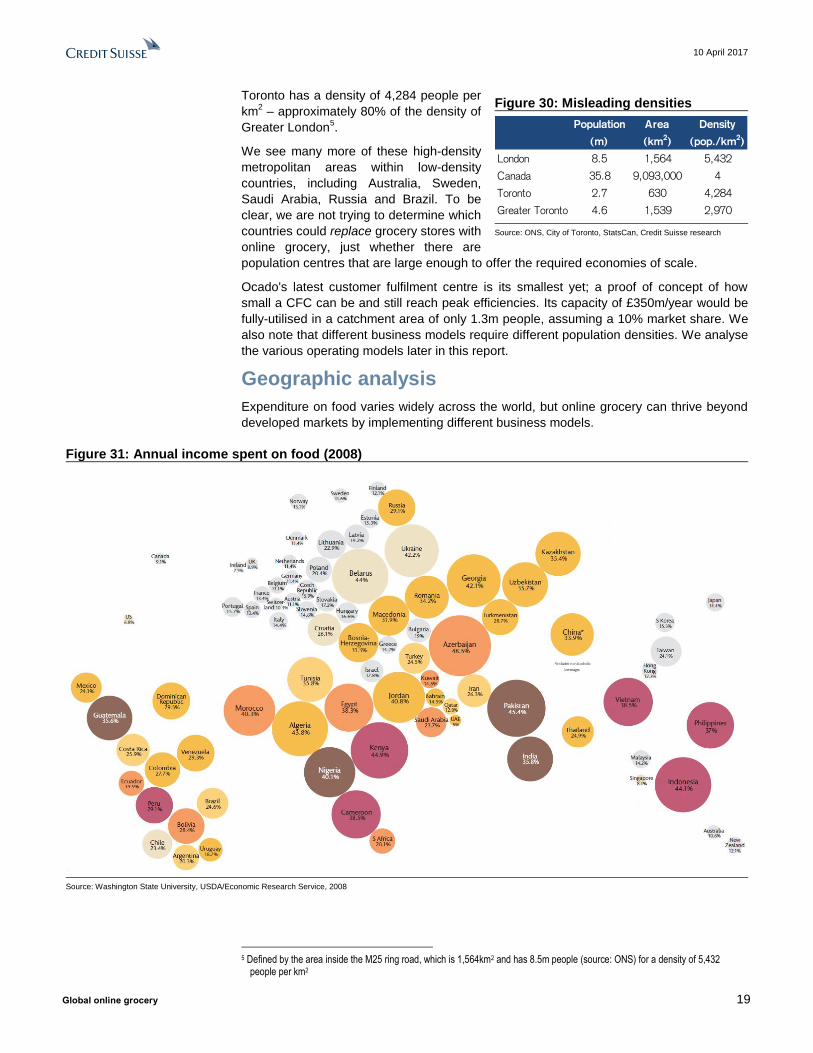
Toronto has a density of 4,284 people per
km2 – approximately 80% of the density of
Greater London5.
We see many more of these high-density
metropolitan areas within low-density
countries, including Australia, Sweden,
Saudi Arabia, Russia and Brazil. To be
clear, we are not trying to determine which
countries could replace grocery stores with
online grocery, just whether there are
population centres that are large enough to offer the required economies of scale.
Ocado's latest customer fulfilment centre is its smallest yet; a proof of concept of how
small a CFC can be and still reach peak efficiencies. Its capacity of £350m/year would be
fully-utilised in a catchment area of only 1.3m people, assuming a 10% market share. We
also note that different business models require different population densities. We analyse
the various operating models later in this report.
Geographic analysis
Expenditure on food varies widely across the world, but online grocery can thrive beyond
developed markets by implementing different business models.
Figure 31: Annual income spent on food (2008)
Source: Washington State University, USDA/Economic Research Service, 2008
5 Defined by the area inside the M25 ring road, which is 1,564km2 and has 8.5m people (source: ONS) for a density of 5,432
people per km2
Figure 30: Misleading densities
Source: ONS, City of Toronto, StatsCan, Credit Suisse research
Population Area Density
(m) (km2) (pop./km
2)
London 8.5 1,564 5,432
Canada 35.8 9,093,000 4
Toronto 2.7 630 4,284
Greater Toronto 4.6 1,539 2,970

10 April 2017
Global online grocery 20
In order to assess the viability of online grocery within a given market, we created a multi-
dimensional model loosely-based on work first published by McKinsey & Co. to analyse
the European online grocery market. Our model measures characteristics that correlate to
the overall viability for high efficiency, centralised online grocery operations. These
characteristics can be grouped into three categories: infrastructure (such as broadband
penetration), economic viability (such as population and GDP), and latent demand (such
as prevalence of double-income households). For a complete description of our
methodology, please see Appendix A: Multi-factor country model.
Europe: Leading characteristics
Within Europe, only the UK and France can lay claim to having a meaningful share for
online within grocery, at ~6-7%. Figure 32 shows the UK's characteristics which,
unsurprisingly, are mostly favourable.
Figure 32: UK grocery characteristics; only latent demand is weak
Source: Credit Suisse research
The UK has five highly-developed online grocery operators.
0
1
2
3
4
5
6
Broadband penetration Tablet / smartphone
penetration
Online share of retailspend
Amazon penetration
Start-up / independentculture
Urban drivinginfrastructure
Metro areas > 1mMetro areas > 5m
GDP per capita
Density of supermarketspace*
Car ownership*
Prevalence of double-income households
Inclement seasonalweather
* inverse correlation
10 April 2017
Global online grocery 21
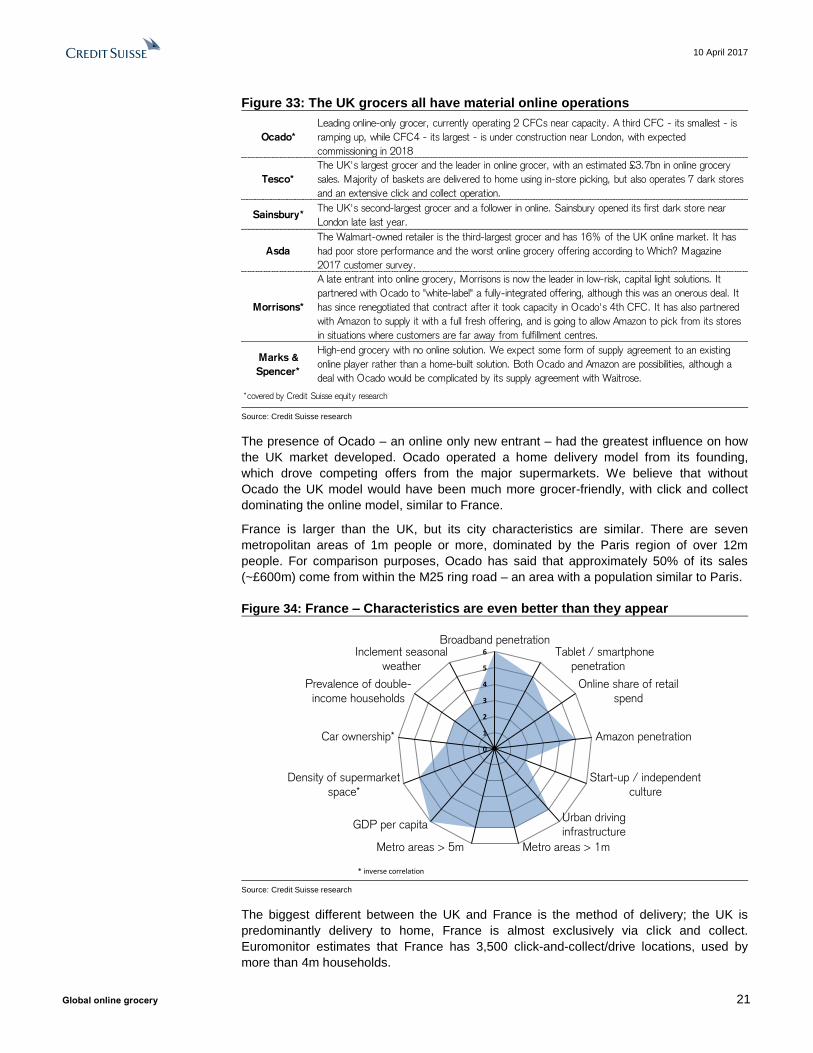
Figure 33: The UK grocers all have material online operations
Source: Credit Suisse research
The presence of Ocado – an online only new entrant – had the greatest influence on how
the UK market developed. Ocado operated a home delivery model from its founding,
which drove competing offers from the major supermarkets. We believe that without
Ocado the UK model would have been much more grocer-friendly, with click and collect
dominating the online model, similar to France.
France is larger than the UK, but its city characteristics are similar. There are seven
metropolitan areas of 1m people or more, dominated by the Paris region of over 12m
people. For comparison purposes, Ocado has said that approximately 50% of its sales
(~£600m) come from within the M25 ring road – an area with a population similar to Paris.
Figure 34: France – Characteristics are even better than they appear
Source: Credit Suisse research
The biggest different between the UK and France is the method of delivery; the UK is
predominantly delivery to home, France is almost exclusively via click and collect.
Euromonitor estimates that France has 3,500 click-and-collect/drive locations, used by
more than 4m households.
Ocado*
Leading online-only grocer, currently operating 2 CFCs near capacity. A third CFC - its smallest - is
ramping up, while CFC4 - its largest - is under construction near London, with expected
commissioning in 2018
Tesco*
The UK's largest grocer and the leader in online grocer, with an estimated £3.7bn in online grocery
sales. Majority of baskets are delivered to home using in-store picking, but also operates 7 dark stores
and an extensive click and collect operation.
Sainsbury*The UK's second-largest grocer and a follower in online. Sainsbury opened its first dark store near
London late last year.
Asda
The Walmart-owned retailer is the third-largest grocer and has 16% of the UK online market. It has
had poor store performance and the worst online grocery offering according to Which? Magazine
2017 customer survey.
Morrisons*
A late entrant into online grocery, Morrisons is now the leader in low-risk, capital light solutions. It
partnered with Ocado to "white-label" a fully-integrated offering, although this was an onerous deal. It
has since renegotiated that contract after it took capacity in Ocado's 4th CFC. It has also partnered
with Amazon to supply it with a full fresh offering, and is going to allow Amazon to pick from its stores
in situations where customers are far away from fulfillment centres.
Marks &
Spencer*
High-end grocery with no online solution. We expect some form of supply agreement to an existing
online player rather than a home-built solution. Both Ocado and Amazon are possibilities, although a
deal with Ocado would be complicated by its supply agreement with Waitrose.
*covered by Credit Suisse equity research
0
1
2
3
4
5
6
Broadband penetration Tablet / smartphone
penetration
Online share of retailspend
Amazon penetration
Start-up / independentculture
Urban drivinginfrastructure
Metro areas > 1mMetro areas > 5m
GDP per capita
Density of supermarketspace*
Car ownership*
Prevalence of double-income households
Inclement seasonalweather
* inverse correlation

10 April 2017
Global online grocery 22
Germany is more decentralised, which reduces the economic appeal for online grocery.
Figure 35: Germany – Technology infrastructure and latent demand issues
Source: Credit Suisse research
Also, as the home market for the two dominant discount operators, Aldi and Lidl, there is
an inherent bias towards low-cost staples that would be an impediment in any rollout of
online grocery. However, the potential for a disruptor such as AmazonFresh to launch may
change this significantly, and force some of the more traditional grocers to increase their
online focus.
We also see potential for growth within northern Europe given the high internet
penetration. Key population centres around Stockholm (2.3m), Copenhagen (2.0m) and
Oslo (1.5m) could each support dedicated online facilities, even though overall population
figures are modest.
Figure 36: Scandinavia's lack of density is a barrier to adoption
Source: Credit Suisse research
Asia: Vast differences between countries
China is the world leader by total sales
China's retail e-commerce market grew by 36% in 2016 and accounted for ~15% of total
retail sales (source: National Bureau of Statistics of China) – a higher proportion of than
0
1
2
3
4
5
6
Broadband penetration Tablet / smartphone
penetration
Online share of retailspend
Amazon penetration
Start-up / independentculture
Urban driving
infrastructure
Metro areas > 1mMetro areas > 5m
GDP per capita
Density of supermarketspace*
Car ownership*
Prevalence of double-income households
Inclement seasonalweather
* inverse correlation
0
1
2
3
4
5
6
Broadband penetration Tablet / smartphone
penetration
Online share of retailspend
Amazon penetration
Start-up / independent
culture
Urban driving
infrastructure
Metro areas > 1mMetro areas > 5m
GDP per capita
Density of supermarket
space*
Car ownership*
Prevalence of double-income households
Inclement seasonalweather
* inverse correlation

10 April 2017
Global online grocery 23
that of the US, Japan and many other developed countries. Apparel and consumer
electronics products have been well-penetrated, and online shopper growth is maturing in
top tier cities.
Chinese consumers spend ~30% on food and beverage – much greater than developed
markets (US: 7%, Germany: 11%). Spending patterns are also very different: according to
Nielsen, Chinese consumers like to shop frequently for food, with a focus on fresh.
Online grocery has already reached high levels within China due to lower supermarket
density than developed markets, a relatively fragmented food retail market, low car
ownership, fast moving lifestyles and poor offline retail infrastructure. These characteristics
create latent demand for e-commerce grocery shopping.
According to CNNIC, China's internet penetration reached 53% (64% of whom shop
online), with top tier cities near developed countries' level. Smartphone/smart device
ownership continues to grow strongly. In China, the main online players are Alibaba and
JD (rather than Amazon).
Euromonitor estimates China's offline grocery retailing sales to reach Rmb4.9 trillion by
2020, representing ~3% five-year CAGR. In our view, online sales of groceries is likely to
take an increasing share of the total market, from Rmb245 billion (US$39bn) in 2015,
5.4% of grocery sales in total, to ~Rmb 1.3 trillion (US$178 bn) in 2020, or ~20% of the
market – a 40% CAGR over 2015-2020.
China's large population and high density in metropolitan area provides opportunities to
develop online delivery of food retail in urban areas (13 cities with greater than 10m
people). Nielsen's white paper on Fresh E-Commerce Development (October 2015)
reported that out of 1,600 interviewees living in seven megacities (>10m people), >63%
shopped for milk and dairy products online, >50% had purchased fruit, and 38% had
purchased meat, vegetables or seafood with higher basket sizes than offline shopping.
China's e-commerce giants Alibaba and JD.com are highly interested in online grocery
given China's population and customers' shopping habits. Both companies are
experiencing growth slowdown in their core categories, and see grocery as their next
opportunity. In addition, it is a very fragmented market, with various food specialty e-
retailers emerging rapidly.
Figure 37: China, unsurprisingly, leads in terms of population density
Source: Credit Suisse research
0
1
2
3
4
5
6
Broadband penetration Tablet / smartphone
penetration
Online share of retailspend
Alibaba penetration
Start-up / independentculture
Urban drivinginfrastructure
Metro areas > 1mMetro areas > 5m
GDP per capita
Density of supermarketspace*
Car ownership*
Prevalence of double-income households
Inclement seasonalweather
* inverse correlation

10 April 2017
Global online grocery 24
The main online grocery retailers are Alibaba's Tmall Supermarket and JD Supermarket.
Both offer a similar range of products and compete head-to-head in terms of price
(including promotion and user subsidies), product variety, quality and delivery service.
In July 2015, Alibaba announced the launch of an Rmb 1bn online grocery promotional
campaign, and teamed up with Cainiao (Not Covered) to offer the same-day delivery
services to Beijing residents. The service has now been expanded into more cities. On 14
July 2016, Tmall Supermarket announced the 'Double two billion plan' to provide Rmb 2
billion subsidies for consumers and will invest Rmb 2 billion into supply chain infrastructure
for service improvement.
The sheer scale of operations in China has led Alibaba to seek out multiple partners to
assist in sourcing, supply chain management, logistics and delivery. Tmall works closely
with western players such as Germany's Metro Group and Spain's DIA to bring more
premium and imported goods to Chinese consumers. Alibaba invested in and partnered
with Yiguo.com (Not Covered) to operate Tmall's fresh food section because of its strong
cold-chain logistics capability and focus on premier brands and quality fresh produce. In
addition, Alibaba invests actively in supply chain and logistics partners like warehouse
operation service provider ALOG and last-mile delivery service provider Ewinshine,
helping to strengthen the overall supply chain efficiency and ensure delivery quality. These
partnerships allow Alibaba to execute its strategy of offering same-day or next-day delivery
services while continuing to expand within China.
Figure 38: China online grocery led by Tmall and JD Supermarket
Source: Company data, Credit Suisse research
We think JD is the best-positioned online grocer in China. It is the strongest competitor to
Alibaba, and moved aggressively last year by forming a strategic alliance with offline
leader Yonghui supermarket (and acquiring a 10% stake). Yonghui is the country's fifth-
largest supermarket chain and has an excellent reputation for its fresh food business (45%
of total sales). JD also acquired the top online supermarket platform Yihaodian and signed
Tmall
Supermarket*
Partnering with top international supermarket brands for high-quality imported products and cooperate
with Yiguo.com to operate fresh produce. Leverage Cainiao (and partners) to manage warehousing
and fulfill orders. Avg. order size is >Rmb100 and free shipping from Rmb 88.
JD
Supermarket*
Allied with Walmart, Yihaodian for better product variety, and China's largest crowdsourcing logistics
platform Dada. Invested in Yonghui, China's top 5 local supermarket. Free delivery from Rmb99, and
offer "within 2 hour delivery" for Rmb 99.
Yihaodian
8-years of experience in online grocery now offering more than 8 million SKUs, well-equipped with in-
house fulfillment and strong procurement capability. Free delivery from Rmb68 for all major cities.
China's leading e-commerce company focusing on grocery. Strong in Eastern China (in particular
Greater Shanghai) due to its convenient logistics and high-quality groceries. However, due to the
ownership acquisition by Ping'An and later Wal-Mart, as well as the departure of founders, the
company has experienced slower for expansion in recent years. In late 2016, Wal-Mart sold YHD to
JD.com for Rmb40 billion.
Feiniu.com
(Sun Art*)
Launched in 2014. Large offer size. Average order is Rmb160-170 with monthly GMV at
Rmb250m. Delivery across China through its offline stores and 3rd-party couriers.
Benlai LifeSmall, specialty online retailer that offers ~5k SKUs of fresh produce. Has built out full cold-chain and
large warehouses and tier 1 cities and provides speedy delivery in selected regions.
Womai.comBacked by the state-owned grain group COFCO, Womai focused offer on premium imported food,
wine, oil and grain, etc. Geographically focused on tier 1 cities and nearby regions.
Others
Womai.com (a wholly-owned subsidiary of China National Cereals, Oils and Foodstuffs Corporation –
China's state-owned food processing holding company); SF Express' SFBest (a leading express
couriers' online marketplace selling food products); Fruitday (fruit specialty retailer), TooToo Organic
Farm (organic and high quality food retailer); Benlai Life (fresh produce e-commerce start-up), Fields
(Shanghai's premium online grocery store), Missfresh.cn.
Vanguard
(e-Wanjia)
Officially launched in June 2015, focusing on fresh food of more than 800 kinds. Vanguard aims to
develop the online platform by leveraging its robust offline resources and advantages in procurement
and logistics, and then broaden the geographic coverage and customer base.
*covered by Credit Suisse equity research
10 April 2017
Global online grocery 25
a cooperation agreement with Wal-Mart to improve procurement and warehousing
management. JD can leverage JD Daojia and the crowdsourcing platform Dada for more
efficient last-mile delivery in the country.
Japan has significant potential, but no integrated offerings yet
Japanese consumers tend to shop at small, local stores and convenience stores – a 'little
and often' strategy that is typically more difficult to supplant with online grocery, where
delivery costs are high (unlike China). One of the main themes in Japanese grocery
recently has been the consolidation of convenience chains and pressure on supermarket
operators to close unprofitable stores – a situation that is a tailwind to moving online.
Against that backdrop, it may be somewhat surprising to see that online grocery is well-
developed and large – the Yano Research Institute forecasts the domestic online food
market was ¥3,377bn in FY15 (US$30bn), and should continue to expand in the mid-
single digits.
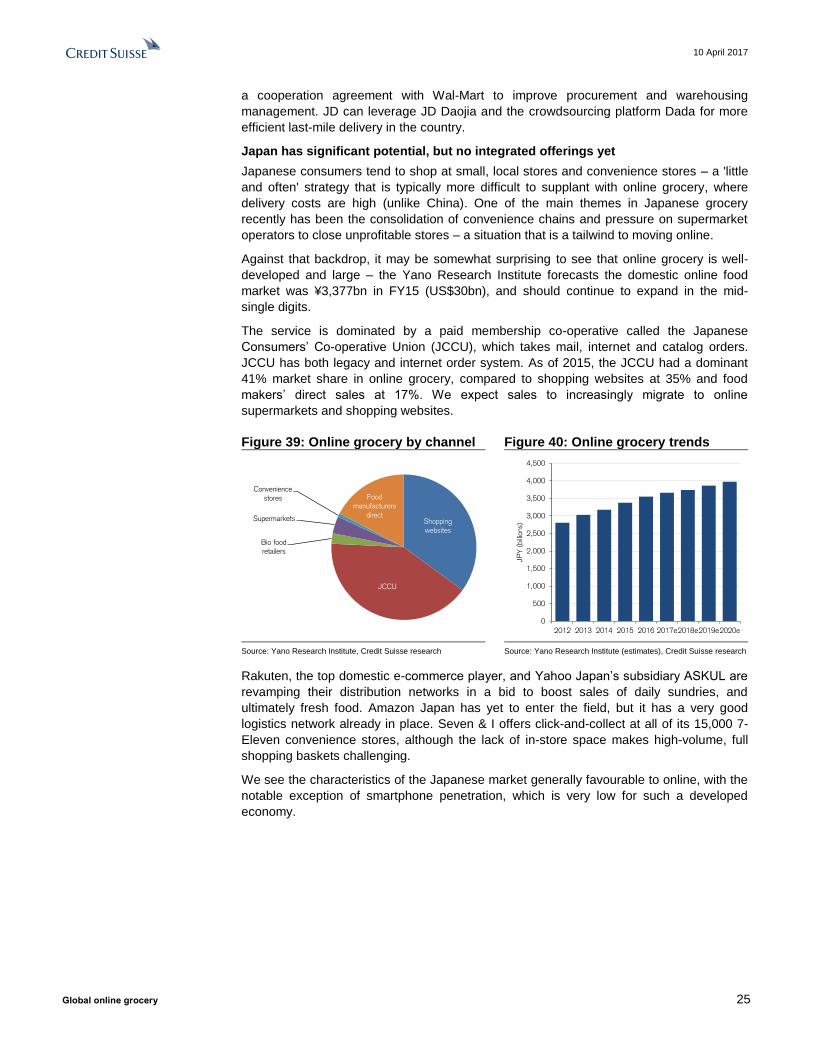
The service is dominated by a paid membership co-operative called the Japanese
Consumers’ Co-operative Union (JCCU), which takes mail, internet and catalog orders.
JCCU has both legacy and internet order system. As of 2015, the JCCU had a dominant
41% market share in online grocery, compared to shopping websites at 35% and food
makers’ direct sales at 17%. We expect sales to increasingly migrate to online
supermarkets and shopping websites.
Figure 39: Online grocery by channel Figure 40: Online grocery trends
Source: Yano Research Institute, Credit Suisse research Source: Yano Research Institute (estimates), Credit Suisse research
Rakuten, the top domestic e-commerce player, and Yahoo Japan’s subsidiary ASKUL are
revamping their distribution networks in a bid to boost sales of daily sundries, and
ultimately fresh food. Amazon Japan has yet to enter the field, but it has a very good
logistics network already in place. Seven & I offers click-and-collect at all of its 15,000 7-
Eleven convenience stores, although the lack of in-store space makes high-volume, full
shopping baskets challenging.
We see the characteristics of the Japanese market generally favourable to online, with the
notable exception of smartphone penetration, which is very low for such a developed
economy.
Shopping
websites
JCCU
Bio food
retailers
Supermarkets
Convenience
stores Food
manufacturers
direct
0
500
1,000
1,500
2,000
2,500
3,000
3,500
4,000
4,500
2012 2013 2014 2015 2016 2017e2018e2019e2020e
JPY
(bill
ions)

10 April 2017
Global online grocery 26
Figure 41: Latent demand drivers are weak but economic viability is strong
Source: Credit Suisse research
Overall, Japan is still searching for the best model, which is made incrementally more
difficult without the large consolidated food players (such as Ito-Yokado, Aeon and Seiyu)
to drive the market forward. The entry of AmazonFresh would be a material event, and
would hasten the shift from third-party services to the supermarkets/manufacturers .
Figure 42: Japanese online grocery evolving rapidly
Source: Company data, Credit Suisse research
Korea: High online growth; Grocery penetration material
Korea already has high e-commerce penetration with 22% share of retail spend in 2016,
one of the highest globally. However, we still expect this channel to register a 16% 2-year
CAGR (2016-18e) and remain the fastest growing, boosted by the intense competition and
changing consumer behavior.
0
1
2
3
4
5
6
Broadband penetration Tablet / smartphone
penetration
Online share of retailspend
Amazon penetration
Start-up / independent
culture
Urban drivinginfrastructure
Metro areas > 1mMetro areas > 5m
GDP per capita
Density of supermarket
space*
Car ownership*
Prevalence of double-income households
Inclement seasonalweather
* inverse correlation
Rakuten*
Rakuten currently delivers fresh foods to homes via Rakuten Mart. Rakuten’s presence in e-
commerce is based on the marketplace model, and has recently acquired Kenko.com (healthy food)
and Soukai Drug (prescriptions and health food). We think their distribution networks are likely to be
merged and improved to a point where fresh food deliveries are possible.
LOHACO
ASKUL (a consolidated subsidiary of Yahoo Japan) operates LOHACO, a B2C e-commerce
Website. Leveraging its B2B logistics network, LOHACO has offered its own designated delivery time
service in some areas of Tokyo and Osaka since mid-2016. LOHACO’s main focus is currently on
daily sundries, and it could make an entry into the food sector, in our view.
Radishbo-ya
Radishbo-ya (an NTT docomo subsidiary) provides mail/online order services for vegetables, meats,
seafood, processed foods and daily sundries. Instead of aiming to replace supermarkets, the company
offers services for regular home delivery and one-time deliveries of specific products.
Oisix Oisix (3182, NR) also offers regular scheduled deliveries of specialty cooking ingredients.
*covered by Credit Suisse equity research

10 April 2017
Global online grocery 27
Figure 43: Online grocery nearing 10% Figure 44: Online food is fast growing
Source: KOSIS, Credit Suisse estimates Source: KOSIS
Retail has been challenging in recent years due to an intense competitive landscape in the
online channel, which has resulted in on-going cannibalisation of the offline channel. That
said, online was mainly focused on non-food categories but interest has shifted to the
grocery category, into which most retailers try to expand.
As such, we see the biggest growth opportunity in online grocery retail. Among different
product categories, the food category is still the least penetrated with only 9% of grocery
shopping online vs. aggregate penetration of 22% across different categories. Also, food is
the largest consumer spend category in Korea, and involves more frequent shopping and
has stronger loyalty. As technology improves and consumer behaviour changes, we
expect online grocery to continue to grow faster than other categories. The infrastructure
required to support online grocery is well developed, in particular broadband penetration
and tablet/smartphone ownership, which supports the shopping experience for grocery.
We believe the worst in the competition among online players, especially in FMCG, is
behind us. Consequently, we see significant interest and competition, not only amongst
Korea's grocery operators but also amongst pure online players.
Figure 45: Online infrastructure and consumer trends are dominant
Source: Credit Suisse research
We see significant interest and competition amongst Korea's grocery operators.
0%
10%
20%
30%
40%
Total Home
appliances
Cosmetics Apparel
and
fashion
Food,
beverage,
agricultural
Other -10%
-5%
0%
5%
10%
15%
20%
25%
30%
35%
-
1,000
2,000
3,000
4,000
5,000
6,000
7,000
8,000
9,000
2009 2010 2011 2012 2013 2014 2015 2016
(W bn) Online grocery size Online grocery growth
Online channel growth
0
1
2
3
4
5
6
Broadband penetration Tablet / smartphone
penetration
Online share of retailspend
Amazon penetration
Start-up / independent
culture
Urban driving
infrastructure
Metro areas > 1mMetro areas > 5m
GDP per capita
Density of supermarket
space*
Car ownership*
Prevalence of double-income households
Inclement seasonalweather
* inverse correlation

10 April 2017
Global online grocery 28
Figure 46: South Korean online grocery evolving rapidly
Source: Company data, Credit Suisse estimates
Online grocery remains a high barrier to entry business due to the sizeable investment
required for refrigeration logistics and need for a strong 'retail brand' to support product
quality perception.
Amongst online players, we believe E-Mart will remain the most compelling player thanks
to its leadership and strong brand equity in food retailing and popular private labels such
as Peacock and No Brand. E-Mart's online business was 6% of parent revenue in FY16
and we believe the company can increase that to 10% by 2018, in part due to the new
online distribution centers it started operating since 2014. Scale and cost efficiency should
continue to improve with these online centers. As per the official guidance from the
company, it aims to double the revenue to W1.5tn by 2023 with six online distribution
centers in total, led by grocery. The repurchase rate, which is close to 90%, suggests that
E-Mart can maintain its market leadership in this channel.
Online Grocery in Russia: waiting for the customer
Currently, the Russian market ranks well against its global peers in terms of e-commerce
share (3% of sales in 2016 or RUB 920bn), and mobile technologies usage (on par with
that of Germany). However, the Russian economy is slowly coming out of recession and
the average customer’s real income is only now stabilising. While we see no structural
barriers to online grocery development, online grocery growth will need some changes in
consumption patterns as well as yet-to-be-developed infrastructure.
E-Mart*E-Mart has two fulfillment centres and continues to increase strength in fresh food category through
same-day delivery system. Average number of daily order is around 30,000 for two centres.
HomeplusHomeplus has same-day delivery service (if ordered before 4pm). Also, the company hires "Pickers"
to select and purchase fresh foods that are ordered online.
Lotte Mart*Lotte Mart targets to increase the number of SKUs and invest in online fulfillment to enhance its
delivery service. The company targets to have 3 centres by 2019.
CJ OS*CJ O Shopping has opened a premium store at online CJ Mall to overcome the negative perception
on online fresh food category.
Ticket
Monster
TicketMonster started to sell fresh foods through its direct purchase stores since last year. It offers
same-day delivery service from 7am.
WeMakePrice
WeMakePrice started the direct delivery service for fresh food November 2016. It has established
21,800㎡-sized cold storage and it also provides "next-day delivery service" for the orders made
before 10pm.
Coupang
Coupang cooperates with Nonghyup (Korea National Agricutural Coop). It delivers (within the same
day or the next day) products that are sourced from Nonghyup. Coupang offers 10~20% price
discount as well (compared to Nonghyup price).
*covered by Credit Suisse equity research
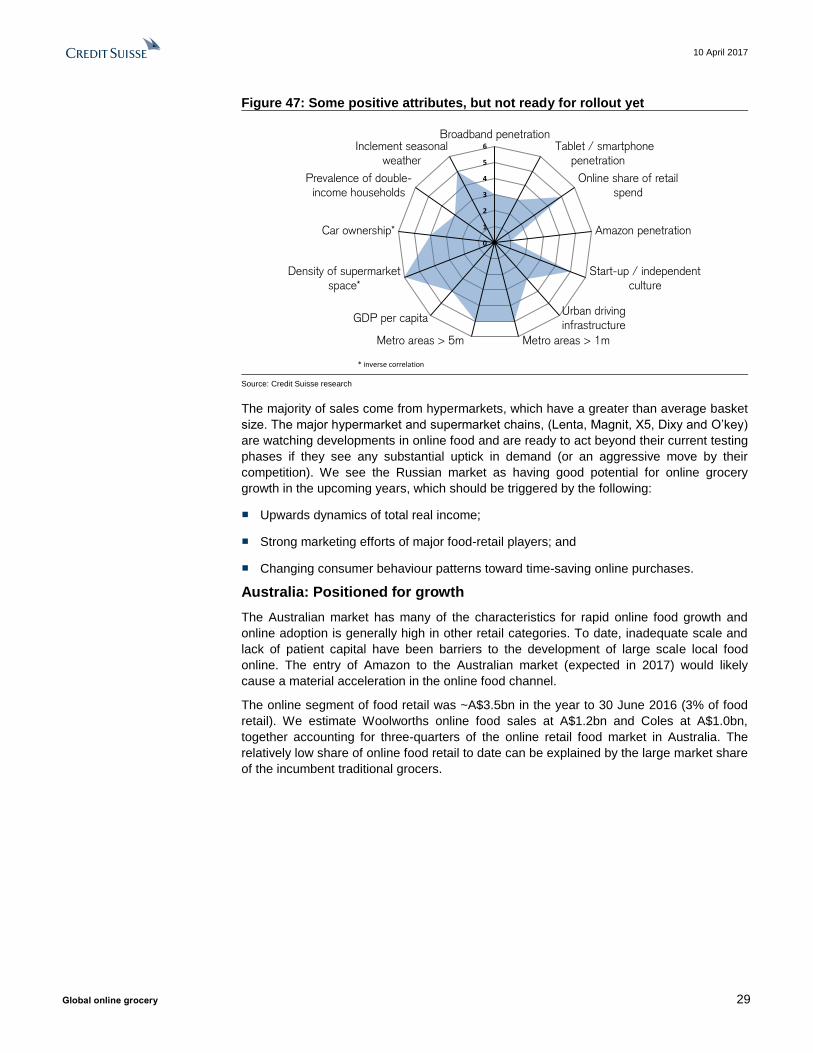
10 April 2017
Global online grocery 29
Figure 47: Some positive attributes, but not ready for rollout yet
Source: Credit Suisse research
The majority of sales come from hypermarkets, which have a greater than average basket
size. The major hypermarket and supermarket chains, (Lenta, Magnit, X5, Dixy and O’key)
are watching developments in online food and are ready to act beyond their current testing
phases if they see any substantial uptick in demand (or an aggressive move by their
competition). We see the Russian market as having good potential for online grocery
growth in the upcoming years, which should be triggered by the following:
■ Upwards dynamics of total real income;
■ Strong marketing efforts of major food-retail players; and
■ Changing consumer behaviour patterns toward time-saving online purchases.
Australia: Positioned for growth
The Australian market has many of the characteristics for rapid online food growth and
online adoption is generally high in other retail categories. To date, inadequate scale and
lack of patient capital have been barriers to the development of large scale local food
online. The entry of Amazon to the Australian market (expected in 2017) would likely
cause a material acceleration in the online food channel.
The online segment of food retail was ~A$3.5bn in the year to 30 June 2016 (3% of food
retail). We estimate Woolworths online food sales at A$1.2bn and Coles at A$1.0bn,
together accounting for three-quarters of the online retail food market in Australia. The
relatively low share of online food retail to date can be explained by the large market share
of the incumbent traditional grocers.
0
1
2
3
4
5
6
Broadband penetration Tablet / smartphone
penetration
Online share of retail
spend
Amazon penetration
Start-up / independent
culture
Urban driving
infrastructure
Metro areas > 1mMetro areas > 5m
GDP per capita
Density of supermarket
space*
Car ownership*
Prevalence of double-
income households
Inclement seasonal
weather
* inverse correlation

10 April 2017
Global online grocery 30
Figure 48: Australian online grocery dominated by Woolworths and Coles
Source: Company data, Credit Suisse research
Woolworths and Coles offer most of their respective ranges online, with the exception of
in-store manufactured items such as cut delicatessen and hot food. Coles typically
charges higher prices online than in store, whereas Woolworths generally has the same
pricing in store and on line.
With high broadband and smartphone penetration and high online spend, Australia ticks
most of the boxes in terms of customer propensity to shop online.
Figure 49: Infrastructure and large population centres support online grocery
Source: Credit Suisse research
Urbanisation is high, with three cities – Sydney (4.3 million), Melbourne (4.1 million) and
Brisbane (2.1 million), having the requisite population level to support a large scale
specialist grocery online competitor. High labour cost (including base wages and punitive
retail penalty rates) improves the economics of a centralised picking model. Discounter
penetration is modest and, with only Aldi operating in the hard discount segment of the
market, discounter competition is at the low end of comparable markets. Latent demand
would appear reasonably high, but without Amazon in the Australian market, capturing that
latent demand has been left to the major incumbent retailers, which have little incentive to
compete strongly in online.
Woolworths*
Offers ~22,000 skus online – pantry and fresh. Combination of fee per delivery and subscription. Flat
$11 delivery fee on orders up to $150. Free delivery on orders $300 and over. Delivery saver for
$89/year offers free delivery on all orders over $100
Coles*
Offer ~19,000 skus online – pantry and fresh. Prices online are typically higher than in store.
Minimum $50 order. Delivery fee $4-$18 per order. Free delivery on orders over $100 when paid
for using Coles Mastercard.
Harris FarmFree delivery on first three orders and minimum $80 spend. Delivery fee $15 on orders less than $80
and free on orders $150 and above. Available in the Sydney region.
Kogan PantryLaunched in January 2015. Stocks 600 grocery products. Fixed shipping cost $9.99 anywhere in
Australia via Australia Post.
Aussie
Farmers
Direct
Founded in 2005. Provides delivery of fruit & vegetables, meat and some groceries. Does not charge
an explicit delivery fee. Franchises cost between $50k and $110k. Franchisees receive a margin on
goods sold.
Grocery RunPantry, health & beauty, cleaning and households goods items. Flat rate $9.99 per delivery. Delivery
is through Australia Post 1-2 business days
Grocery
ButlerShopping service
*covered by Credit Suisse equity research
0
1
2
3
4
5
6
Broadband penetration Tablet / smartphone
penetration
Online share of retailspend
Amazon penetration
Start-up / independentculture
Urban driving
infrastructure
Metro areas > 1mMetro areas > 5m
GDP per capita
Density of supermarketspace*
Car ownership*
Prevalence of double-income households
Inclement seasonalweather
* inverse correlation

10 April 2017
Global online grocery 31
The Melbourne and Sydney retail food markets would be ~A$4bn each, on the assumption
that online delivery captured 20% of retail food sales. The relevance of that statistic is that
it implies that the Australian urban markets are sufficiently large under even moderate
penetration assumptions, to support a centralised online infrastructure.
Figure 50: Attractive opportunities within the largest Australian cities
Source: Credit Suisse research
The online scenario with the most impact would likely involve the entry of Amazon. Without
Amazon, the emergence of a domestic large scale online competitor outside of
Woolworths and Coles is less likely, in our view. Amazon does not presently have a
distribution infrastructure in Australia, although has been reported widely in the press as
likely to launch in Australia in 2017.
Supermarket gross margin in Australia appears to leave room for an efficient large scale
online competitor to slip potentially under the umbrella of pricing provided by the
incumbents. Ambient grocery gross margin is c. 18% and fresh is c. 30%. Pick from store
models operated by Woolworths and Coles have a fully end-to-end cost of online fulfilment
of ~18% of basket costs; a centralised model at scale would be likely to provide a similar
or lower cost of doing business due to the substitution of capital for relatively high cost
labour. The profitability of incumbent store based online models would be likely to
deteriorate.
Whilst the gross margin structure of the Australian industry is not excessive, there are
sufficient alternative sources of grocery supply for Amazon that would create some
downward pressure on pricing. Consequently it is likely that an Amazon entry to food
would cause some downward pressure on gross margin. Improved services would be
likely to increase the proportion of grocery sales online and increase online related capital
expenditure by incumbents.
Metcash's position is an interesting one.
As the only large scale food wholesaler, it
has the scale in buying and warehousing,
which would position it well to partner with
Amazon. Metcash has some capability in
unit pick solutions due to its supply to the
convenience sector.
There is a potential scenario whereby
Metcash can be a third-party merchant on
Amazon (being the only large scale national grocery supplier) and provide a readymade
A$0.0
A$0.5
A$1.0
A$1.5
A$2.0
A$2.5
A$3.0
A$3.5
A$4.0
A$4.5
0.0 0.5 1.0 1.5 2.0 2.5 3.0 3.5 4.0 4.5 5.0
Population (m)
SydneyMelbourne
Brisbane
Perth
Adelaide
Hobart
Deliv
ery
mark
et
(bn)
at 2
0%
share
of
reta
il fo
od
Figure 51: Valuation sensitivity
Source: Company data, Credit Suisse estimates
Woolworths Wesfarmers Metcash
-50bp gross margin -7% -5% -9%*
-100bps sales revenue -4% -2% -1%
A$100m annual capex -4% -5% n/a
* 25bp reduction

10 April 2017
Global online grocery 32
scale buying platform for Amazon, much the way Morrisons has done so for Amazon in the
UK.
In terms of assessing earnings and valuation sensitivity, we propose a scenario whereby
Amazon entered one of the larger population centres (Sydney, Melbourne or Brisbane)
and grew to a market share of 10% in the chosen market over five years; that would be
half of the probable delivery market. That would be a circa 10bp per annum drag on sales
growth from that market. Expansion to other markets would see that drag multiplied.
Increasing the service cost of incumbents would be more material. A 10ppt increase in
service cost across 5% of sales would have a 50bp impact on gross margin. Every 50bp of
gross margin has 5% impacts on the valuation of Woolworths and Coles. The more subtle,
but perhaps a change with more impact could result from a reduction in supplier
promotional support as a result of additional channel choice. It would not be realistic for a
gross margin impact to be borne entirely at the wholesale level by Metcash – a 25bp
reduction would have a 9% impact on gross margin. An A$100mn per annum increase in
capital expenditure has 3% impact on valuation of Woolworths and Coles.
The Americas: Laggards, but expect rapid growth
The US and Canada are behind Europe in terms of penetration of online grocery, but only
because competition had not forced unprofitable growth – as we reach the inflection point
in technology, we expect US (and possibly Canada) to expand rapidly.
Figure 52: The US is ripe for online grocery growth
Source: Credit Suisse research
The US already has the most diverse set of online grocery models in operation. The battle
for online is most intense around New York City and down through the Philadelphia to
Washington, DC corridor.
There are at least 30 metropolitan areas of 2m people or more, totalling over 150m
people. Each of these regions could be serviced by an online-only model, making the US
the most lucrative market globally.
Beyond the issue of density, other factors, such as truck weight limits, parking and traffic
flows actually favour large urban/suburban centres found in the US compared to European
countries.
0
1
2
3
4
5
6
Broadband penetration Tablet / smartphone
penetration
Online share of retailspend
Amazon penetration
Start-up / independentculture
Urban drivinginfrastructure
Metro areas > 1mMetro areas > 5m
GDP per capita
Density of supermarketspace*
Car ownership*
Prevalence of double-income households
Inclement seasonalweather
* inverse correlation

10 April 2017
Global online grocery 33
Figure 53: Online penetration across the US, with significant concentration within the densest areas
Source: Company data, Credit Suisse research
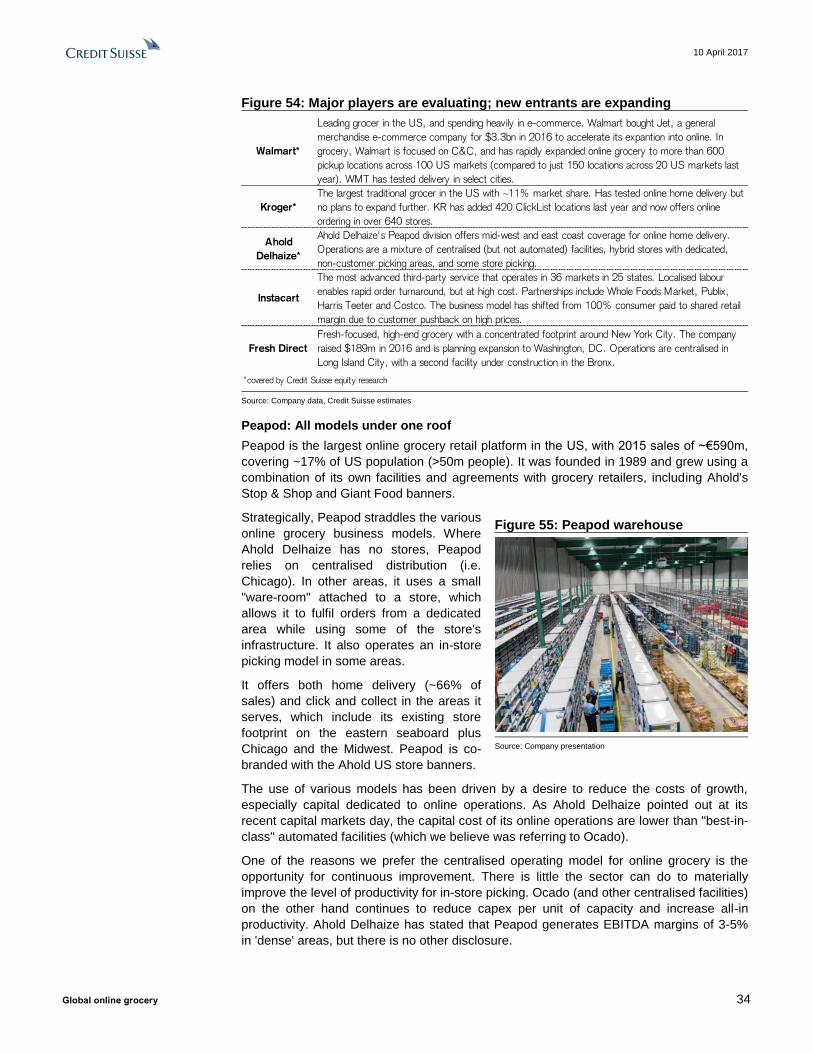
10 April 2017
Global online grocery 34
Figure 54: Major players are evaluating; new entrants are expanding
Source: Company data, Credit Suisse estimates
Peapod: All models under one roof
Peapod is the largest online grocery retail platform in the US, with 2015 sales of ~€590m,
covering ~17% of US population (>50m people). It was founded in 1989 and grew using a
combination of its own facilities and agreements with grocery retailers, including Ahold's
Stop & Shop and Giant Food banners.
Strategically, Peapod straddles the various
online grocery business models. Where
Ahold Delhaize has no stores, Peapod
relies on centralised distribution (i.e.
Chicago). In other areas, it uses a small
"ware-room" attached to a store, which
allows it to fulfil orders from a dedicated
area while using some of the store's
infrastructure. It also operates an in-store
picking model in some areas.
It offers both home delivery (~66% of
sales) and click and collect in the areas it
serves, which include its existing store
footprint on the eastern seaboard plus
Chicago and the Midwest. Peapod is co-
branded with the Ahold US store banners.
The use of various models has been driven by a desire to reduce the costs of growth,
especially capital dedicated to online operations. As Ahold Delhaize pointed out at its
recent capital markets day, the capital cost of its online operations are lower than "best-in-
class" automated facilities (which we believe was referring to Ocado).
One of the reasons we prefer the centralised operating model for online grocery is the
opportunity for continuous improvement. There is little the sector can do to materially
improve the level of productivity for in-store picking. Ocado (and other centralised facilities)
on the other hand continues to reduce capex per unit of capacity and increase all-in
productivity. Ahold Delhaize has stated that Peapod generates EBITDA margins of 3-5%
in 'dense' areas, but there is no other disclosure.
Walmart*
Leading grocer in the US, and spending heavily in e-commerce. Walmart bought Jet, a general
merchandise e-commerce company for $3.3bn in 2016 to accelerate its expantion into online. In
grocery, Walmart is focused on C&C, and has rapidly expanded online grocery to more than 600
pickup locations across 100 US markets (compared to just 150 locations across 20 US markets last
year). WMT has tested delivery in select cities.
Kroger*
The largest traditional grocer in the US with ~11% market share. Has tested online home delivery but
no plans to expand further. KR has added 420 ClickList locations last year and now offers online
ordering in over 640 stores.
Ahold
Delhaize*
Ahold Delhaize's Peapod division offers mid-west and east coast coverage for online home delivery.
Operations are a mixture of centralised (but not automated) facilities, hybrid stores with dedicated,
non-customer picking areas, and some store picking.
Instacart
The most advanced third-party service that operates in 36 markets in 25 states. Localised labour
enables rapid order turnaround, but at high cost. Partnerships include Whole Foods Market, Publix,
Harris Teeter and Costco. The business model has shifted from 100% consumer paid to shared retail
margin due to customer pushback on high prices.
Fresh Direct
Fresh-focused, high-end grocery with a concentrated footprint around New York City. The company
raised $189m in 2016 and is planning expansion to Washington, DC. Operations are centralised in
Long Island City, with a second facility under construction in the Bronx.
*covered by Credit Suisse equity research
Figure 55: Peapod warehouse
Source: Company presentation

10 April 2017
Global online grocery 35
Figure 56: Peapod has reasonably good operating metrics
Source: Ahold Delhaize company presentation, Credit Suisse research
Figure 57: Eastern seaboard Peapod coverage
Source: Company data, Credit Suisse research
Canada: Excellent infrastructure and harsh winters
In many ways, Canada has the best characteristics for online grocery of any of the
countries we have analysed. Although population is low, it is clustered around five major
centres. Grocery is highly concentrated, which is appealing to a disrupter like Amazon. For
much of the country, driving to a grocery store from January to March (i.e, the middle of
winter) is particularly difficult – an extra incentive for consumers to outsource the process.
Figure 58 shows the characteristics for online grocery for Canada. As noted earlier, the
Greater Toronto Area encompasses 4.6m, with a density of ~55% that of London. The
makeup of that density is positive, with easy-to-navigate high rise towers along the main
arteries and single family dwellings further out.
Peapod Ah.nl "Best in Class" Ocado
All in productivity - 135 150-160 200+
Item completeness - 99.6% ~99% 99%+
Driver timeliness - 99.0% ~95% ~95%
Capex - ~€10m >€100m ~€120m
Capacity (orders per week) - 35k - 200k
Product range 12,000 - - 50,000+
Delivery slots 2 hour - - 1 hour
Boston
New York City
Philadelphia
Harrisburg
Baltimore
Washington DC

10 April 2017
Global online grocery 36
Figure 58: Canada has many characteristics that suit online grocery growth
Source: Credit Suisse research
Mexican ecommerce remains still largely underpenetrated
Mexico has long been a market where structural barriers have limited ecommerce growth.
Among these barriers, we highlight low credit card penetration (c.4% consumer credit to
GDP; source: IMF, Mexico Central Bank), and low fixed broadband penetration (c.47%;
source: IFT). However, we think these barriers will be increasingly less relevant in the
coming years, as the ecommerce market has found alternatives to capture strong growth:
offline payment methods have largely proliferated (accounting for c.22% of total
ecommerce payments), and we expect smartphone penetration to increase from c.40% as
of 2015, to 66% by 2018E.
Figure 59: Infrastructure is the main impediment for online grocery in Mexico
Source: Credit Suisse research
Credit Suisse economics team expects Mexico to have one of EM’s highest growth rates
in ecommerce sales over the next 4 years, at 23% CAGR – outpacing the overall growth
rate of Latin America (c.18%), and specifically, that of Brazil (12%). Total online sales
(including grocery + other categories, but excluding travel) reached ~US$6bn in 2015 and
are expected to at least double by 2019. Online grocery sales at this point are de minimis
(see report on Mexican Ecommerce sector here).
0
1
2
3
4
5
6
Broadband penetration Tablet / smartphone
penetration
Online share of retailspend
Amazon penetration
Start-up / independentculture
Urban drivinginfrastructure
Metro areas > 1mMetro areas > 5m
GDP per capita
Density of supermarketspace*
Car ownership*
Prevalence of double-income households
Inclement seasonalweather
* inverse correlation
0
1
2
3
4
5
6
Broadband penetration Tablet / smartphone
penetration
Online share of retailspend
Amazon penetration
Start-up / independentculture
Urban driving
infrastructure
Metro areas > 1mMetro areas > 5m
GDP per capita
Density of supermarketspace*
Car ownership*
Prevalence of double-income households
Inclement seasonalweather
* inverse correlation

10 April 2017
Global online grocery 37
Today the largest player in online grocery retailing is bricks-and-mortar leader, Walmart
México y Centroamérica (70% owned by Wal-Mart Stores, Inc.). For Walmart, online sales
account for 0.9% of total sales (~US$250mn annual sales, as of 2016). Walmart is
achieving growth rates of c.27% y/y, with 156 click-and-collect locations across Mexico
(out of c.2,291 stores in the country), and a delivery business model, which has been
particularly strong at high-income supermarkets, called Superama (responsible for c. 7%
of total sales). We do highlight though, that c.36% of Walmart online sales in Mexico
continue to be driven by general merchandise items (as opposed to pure grocery sales).
Walmart is now spending ~US$100m in annual capex on ecommerce (c.13% of total
capex); below the levels of some US retailers (30-35% of total capex allocated to
ecommerce), but significantly outpacing local competition. In absolute terms, Walmex is
investing over 10x the absolute dollar amount that its nearest competitor, Soriana, is
investing (among brick-and-mortar players), even when the actual sales gap on the
‘physical’ world reaches ‘only’ c.3.5x.
We think this investment gap will result in a larger sales gap in online than the one seen in
physical sales. The question then becomes whether pure ecommerce players can be a
challenger as well. Rappi and Cornershop have become two up-and-coming pure
ecommerce players that are growing in the Mexican market, albeit sales figures for these
two players are not publically available. Amazon entered Mexico in mid-2015 and has so
far not launched AmazonFresh.
Brazil: Many positive characteristics, but household economics the key headwind
The Brazilian online grocery market was estimated at ~US$330m (R$1.1 billion) in 2016
according to Euromonitor, representing only around 3% of total internet retailing in the
country. Lower income and lower urbanisation rates are part of the reason for the modest
size of the local market, but significant back office and logistics' bottlenecks and lower
internet penetration are also key factors.
However, we believe that the structural growth outlook for online grocery retail remains
good, and the gradual clearing of some of the hurdles coupled with higher investment in
marketing and infrastructure are expected to help the segment to fulfill its potential over
time.
Figure 60: Brazil's population and density are the main positive factors
Source: Credit Suisse research
Although the market is small, it has been growing during one of Brazil's worst-ever
recessions. According to Euromonitor, the online grocery market grew at a CAGR of 16%
between 2013 and 2016 and 18% in 2016 (Figure 61), a year in which overall retail sales
0
1
2
3
4
5
6
Broadband penetration Tablet / smartphone
penetration
Online share of retail
spend
Amazon penetration
Start-up / independent
culture
Urban driving
infrastructure
Metro areas > 1mMetro areas > 5m
GDP per capita
Density of supermarket
space*
Car ownership*
Prevalence of double-
income households
Inclement seasonal
weather
* inverse correlation

10 April 2017
Global online grocery 38
declined by ~6% YoY and GDP declined 3.6% YoY. More interesting is that online grocery
grew faster than non-food online for the first time.
With the exception of Companhia Brasileira de Distribuicao (CBD), there are no listed
players with large online grocery operations (CBD's online grocery business generated
over R$200m in sales in 2016, for ~20% share). Neither Carrefour (the largest food retailer
in Brazil) nor Walmart (the third-largest) is selling groceries online. There are some
regional players such as Mambo, Sonda and Zona Sul operating in the segment, but are
still very small.
Figure 61: Online food and non-food growth
Source: Euromonitor, Credit Suisse research
Per capita grocery spend remains low, but there is a large overall addressable market;
R$316bn (US$81bn) in gross revenues according to ABRAS in 2015. There are large,
densely populated metropolitan regions where sizeable mid-to-high end income classes
live that are fully connected and able to pay for convenience. The statistics we have so far
are encouraging: average online basket size is ~ 6x higher than an in-store basket.
Consumers expectations are as high as in other regions, where timeliness of deliveries
and high quality fresh are minimum requirements.
The challenges in logistics are vast, especially in a country with the limitations of Brazil.
CBD has spent a number of years and sizeable investments to develop its own know-how
and remains a pioneer in the segment. Until late 2016 CBD was delivering to customers in
the city of São Paulo directly from three stores, limiting the company's growth potential,
although it still exceeded double-digits.
It is our understanding that the company did not heavily invest in marketing at that time, as
faster growth would have jeopardized the quality of the service. The situation changed in
November 2016 when the company opened a 25,000m2 dedicated distribution centre for
online grocery along with 20 stores that are able to deliver a reduced number of SKUs in
up to 4 hours. There should be 40 stores to process "Express" deliveries by year end
2017, according to the company. We believe that the company's growth rates will
accelerate and that this will drive overall industry growth and bring competitors such as
Carrefour into the mix. Currently we see some local players using the store distribution
model but their operations are small in nature.
As a departure from other regions, online grocery complexity has seen the emergence of
'verticals'' in Brazil. Over the last few years, several specialised websites have emerged,
such as those looking to sell beer (emporio.com, cervejastore.com.br), wine
(redvinhos.com.br, winebrands.com.br), dry goods (homerefill.com) and other categories,
which require specific logistics' structure. This is more feasible in a low labour cost
environment, but this was also the case in the US when online shopping was starting to
emerge (and were ultimately consolidated).
0%
5%
10%
15%
20%
25%
15,000
20,000
25,000
30,000
35,000
40,000
2012 2013 2014 2015 2016
Food and DrinkInternet Retailing
(R$m)
Internet Retailing(R$m)
E-CommerceGrowth (RHS)
Food and DrinkGrowth (RHS)
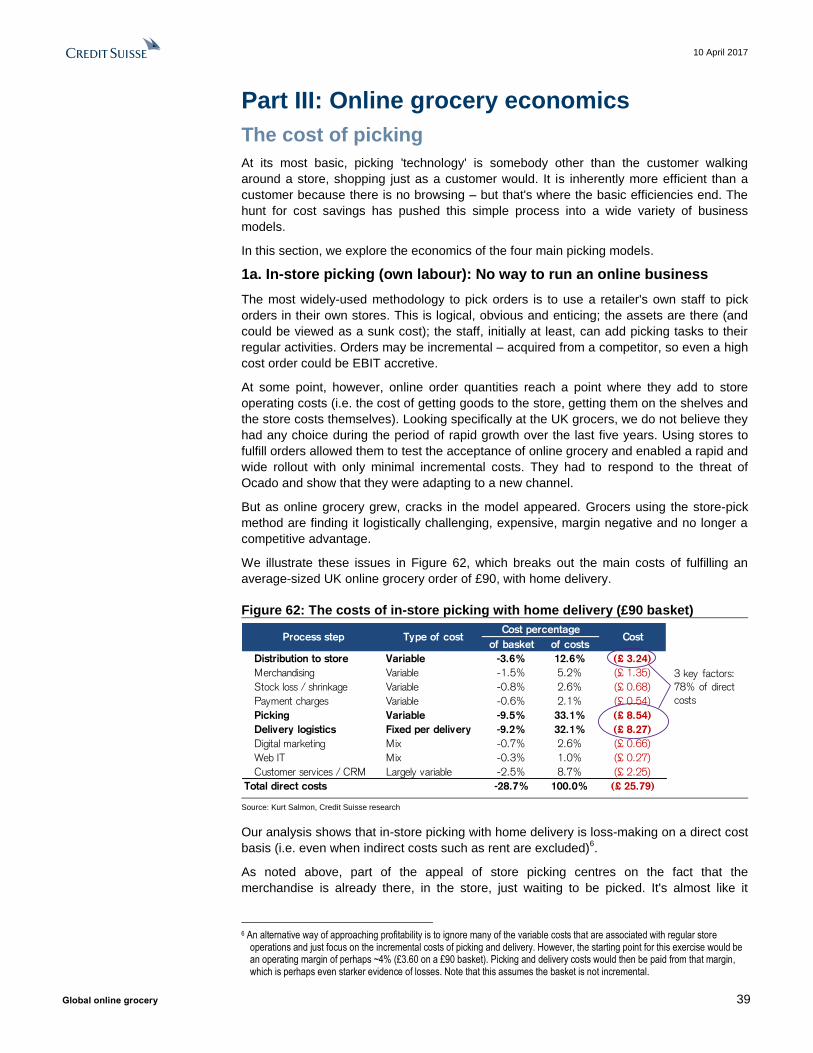
10 April 2017
Global online grocery 39
Part III: Online grocery economics
The cost of picking
At its most basic, picking 'technology' is somebody other than the customer walking
around a store, shopping just as a customer would. It is inherently more efficient than a
customer because there is no browsing – but that's where the basic efficiencies end. The
hunt for cost savings has pushed this simple process into a wide variety of business
models.
In this section, we explore the economics of the four main picking models.
1a. In-store picking (own labour): No way to run an online business
The most widely-used methodology to pick orders is to use a retailer's own staff to pick
orders in their own stores. This is logical, obvious and enticing; the assets are there (and
could be viewed as a sunk cost); the staff, initially at least, can add picking tasks to their
regular activities. Orders may be incremental – acquired from a competitor, so even a high
cost order could be EBIT accretive.
At some point, however, online order quantities reach a point where they add to store
operating costs (i.e. the cost of getting goods to the store, getting them on the shelves and
the store costs themselves). Looking specifically at the UK grocers, we do not believe they
had any choice during the period of rapid growth over the last five years. Using stores to
fulfill orders allowed them to test the acceptance of online grocery and enabled a rapid and
wide rollout with only minimal incremental costs. They had to respond to the threat of
Ocado and show that they were adapting to a new channel.
But as online grocery grew, cracks in the model appeared. Grocers using the store-pick
method are finding it logistically challenging, expensive, margin negative and no longer a
competitive advantage.
We illustrate these issues in Figure 62, which breaks out the main costs of fulfilling an
average-sized UK online grocery order of £90, with home delivery.
Figure 62: The costs of in-store picking with home delivery (£90 basket)
Source: Kurt Salmon, Credit Suisse research
Our analysis shows that in-store picking with home delivery is loss-making on a direct cost
basis (i.e. even when indirect costs such as rent are excluded)6.
As noted above, part of the appeal of store picking centres on the fact that the
merchandise is already there, in the store, just waiting to be picked. It's almost like it
6 An alternative way of approaching profitability is to ignore many of the variable costs that are associated with regular store
operations and just focus on the incremental costs of picking and delivery. However, the starting point for this exercise would be an operating margin of perhaps ~4% (£3.60 on a £90 basket). Picking and delivery costs would then be paid from that margin, which is perhaps even starker evidence of losses. Note that this assumes the basket is not incremental.
of basket of costs
Distribution to store Variable -3.6% 12.6% (£ 3.24)
Merchandising Variable -1.5% 5.2% (£ 1.35)
Stock loss / shrinkage Variable -0.8% 2.6% (£ 0.68)
Payment charges Variable -0.6% 2.1% (£ 0.54)
Picking Variable -9.5% 33.1% (£ 8.54)
Delivery logistics Fixed per delivery -9.2% 32.1% (£ 8.27)
Digital marketing Mix -0.7% 2.6% (£ 0.66)
Web IT Mix -0.3% 1.0% (£ 0.27)
Customer services / CRM Largely variable -2.5% 8.7% (£ 2.25)
Total direct costs -28.7% 100.0% (£ 25.79)
Cost percentageCostType of costProcess step
3 key factors:
78% of direct
costs

10 April 2017
Global online grocery 40
appeared on the shelves for free. But it didn't – and that is the first of our three main costs
that store picking must absorb – the 'Distribution to store' line item7.
The other two large costs are picking and delivery, which include a number of direct but
hidden costs, such as team management and the IT costs associated with each order.
Delivery costs include fuel, maintenance and depreciation on vehicles, warehouse labour
and driver costs.
The most difficult costs to allocate are the IT costs. They are 'central' costs, but are driven
purely by the online offer (e.g., photographs, product information databases, web page
design, order entry, customer relationship management) Some of these costs are fixed,
and are therefore scalable, while some are variable.
At this point, our analysis suggests grocers are losing money for each delivery they make,
yet we have still not accounted for the rent and associated building costs (e.g., rates,
electricity, security). We are also assuming that this basket is an incremental sale; if the
basket in question had been shopped in person rather than online then the cost of
cannibalisation (i.e. the profit forgone) also needs to be added to the operating loss from
the online basket.
Perhaps the most deceptive issue with in-store picking is that there is a theoretical limit to
picking efficiency, which is necessarily low. This means that scale has very little value as
volumes grow. The layout of a supermarket is designed to be inefficient: grocers want
customers to go to the back corner to get milk, the other corner for meat, and then snacks
near the check-outs. The idea is to get customers to spend as much time as possible
browsing around the aisles (also known as 'dwell time'), which is counterproductive for in-
store pickers. And there is very little technology or automation that can help; wearable
scanners and systems can optimise picking routes and provide some level of assistance,
but they are not groundbreaking.
We are also concerned about using in-store picking as a transitional strategy to something
more sophisticated. The online team, IT staff and management will be focused on avoiding
out of stocks, substitution management and product-supply planning. The substitution
logistics process is complex because substitute items may require segregation from
ordered items so the customer can agree which ones should be kept. There is an added
process where the rejected substitute comes back to the store and is reconciled to the
original invoice, which is important from a customer service/wastage perspective but adds
little value.
Finally, we note the negative impact on store operations. Significant store-based fulfilment
makes inventory management more challenging, requires additional assortment efforts
and impairs customers' shopping experiences as they try to dodge store staff picking
online baskets.
1b. In-store picking (third-party): Somebody has to pay
Third-party picking is an extension of the 'gig economy'. The private company Instacart,
based in California, is the leader in third-party fulfilment as demonstrated by its rapid
expansion, the supportive store economics and its capital-raising ability (it raised $220m in
2014 at a valuation of $2bn and $400m in 2017 at a valuation of $3.4bn).
Instacart was co-founded by a former Amazon employee and launched in 2012. The
model uses an 'aggregated' storefront that allows customers to shop for groceries online
and then employs local labour to pick and deliver orders from a variety of shops. Its asset-
light model supports high growth – it already operates in 36 markets in 25 states across
the US and unlike Uber's regulatory burdens, is relatively unencumbered from growing
internationally.
7 We use data from Kurt Salmon consultants for distribution costs, which are broadly similar to Tesco's disclosure at its most recent
capital markets day. Tesco identified Net Distribution Costs in its cost breakdown, which we estimate to be ~£1.45bn on £48.4bn of sales, or 3%.

10 April 2017
Global online grocery 41
The two key differentiating factors of thirdd-party fulfilment compared to most other grocery
delivery services are speed and cost. Instacart can deliver within an hour because of its
local labour and extensive store network. The use of local labour also keeps costs down –
there is no requirement for temperature controlled vans; shoppers use their own vehicle.
However, Instacart has been the most expensive model for customers by far because it
charges in full for the service, unlike in-house operations.
Instacart's original model charged delivery fees to customers, service charges to retailers
and marked up individual items. The Wall Street Journal reported that on a $69 order, the
company’s profit was $1.40 (a 2.0% margin).
The Wall Street Journal looked at the markups across a number of items and found that
prices ranged from a (rare) discount of 15% to a premium of 26%. Delivery charges are
based on timing, order size and whether the customer has an annual delivery pass
($149/year, which makes deliveries free on orders >$35).
On a random selection of products Instacart's item pricing was 30% higher than an
average of Peapod and FreshDirect. Once the lower delivery fees were incorporated, the
premium fell to 21% - still in the realm of a 'luxury' service, in our view.
Figure 63: The Instacart model is fully-costed … and unsustainable, in our view
Source: WSJ.com, Credit Suisse research
This price discrepancy led to key changes within the Instacart model. The company now
states clearly whether prices on Instacart are the same as local in-store prices, and
customers can see the different pricing policies for each of Instacart's partners. In most
cases, the retailer sets the prices for their products on Instacart; less often Instacart sets
the price.
This means that retailers are now sharing their margin, although the details of that revenue
share are not disclosed. In an interview with the New York Times, the CEO said “Instacart
was adding so much more volume and new dollars to the store that it made sense for
them to partner with us” – which appears to be exactly the same philosophy the UK
grocers had when online grocery started. The appeal of the incremental basket means that
the margin on that basket starts at 25% to 30% - its gross margin. But if the prices are the
Peapod FreshDirect Average InstacartInstacart premium
vs. Avg.
Bananas (6) 2.34 1.99 2.17 2.34 8%
Broccoli 2.39 3.49 2.94 4.49 53%
POM pomegranate juice (48 oz.) 9.99 11.99 10.99 15.79 44%
Fage Total 0% Greek yogurt (17.6 oz.) 3.99 3.99 3.99 5.49 38%
Part-skim mozzarella cheese (8 oz.) 3.00 4.59 3.80 5.69 50%
Organic fat-free milk ( 1/2 gal.) 4.99 5.69 5.34 8.58 61%
Cage-free large brown eggs (12) 3.79 3.79 3.79 4.49 18%
Coca-Cola (2l) 1.89 1.99 1.94 2.49 28%
Dunkin’ Donuts Original Blend coffee (12 oz.) 8.69 9.99 9.34 10.29 10%
Tropicana orange juice, no pulp (59 oz.) 3.00 4.39 3.70 4.89 32%
Cheerios (8.9 oz.) 3.59 3.99 3.79 5.09 34%
Kellogg’s Special K cereal (18 oz.) 3.89 6.29 5.09 7.69 51%
Nutella (13 oz.) 4.99 4.29 4.64 5.59 20%
Thomas’ English Muffins (12 oz.) 4.29 4.19 4.24 2.49 -41%
Item total 60.83 70.66 65.75 85.40 30%
DELIVERY FEE 9.95 5.99 7.97 5.00*
TAX AND OTHER 1.05 1.18 1.12 0.22
Total 71.83 77.83 74.83 90.62 21%
* average of 1-hour and 2-hour delivery costs

10 April 2017
Global online grocery 42
same as in-store and a customer can get their goods within an hour, the risk of
cannibalisation is extremely high. We see a sharing of margin as another way of fully-
costing the picking and delivery service and paying it from store profits.
From the retailer's perspective, Instacart still offers a relatively low-cost and rapid way to
get online, but at the expense of giving up control of the customer relationship (and
perhaps more importantly, their data). For mid-sized chains, Instacart may be the initial
'lowest-risk' path to online fulfilment. Once the customer base has been confirmed, offering
an integrated online solution may be the next logical step.
Ultimately, we do not believe this is will grow much beyond a niche solution. The cost to
the customer is high, which structurally limits the addressable market; any reduction in
costs must necessarily come from store subsidies. Once more efficient solutions became
broadly available we expect Instacart's market share to shrink unless it is able to monetise
the data it gathers to offset lower margins.
2. Dark stores: For better and for worse
Dark stores are dedicated online picking and shipping facilities, but look and feel like a
store within the logistics network. They receive goods from distribution centres and
merchandise them much more efficiently than a store, with the layout and facilities more
akin to a warehouse than an actual store. Dark stores would typically carry a full or even
extended supermarket product range, which minimises substitutions.
At least some level of automated goods handling is likely, with the most sophisticated dark
stores employing significant amounts of technology to improve picking rates, minimise
errors and lower costs. For example, dark stores often use refrigerated chambers rather
than refrigerated cabinets.
Figure 64: Inside Tesco's brightly lit, latest generation 'dark' store
Source: Tesco
Although dark stores perform better than the in-store pick model, there are three issues
that have a negative impact on profitability. First, because dark stores are still 'stores'
within the network, distribution costs and the associated double-handling of goods remains
an issue.

10 April 2017
Global online grocery 43
Figure 65: Swisslog zone-pick system with conveyors
Source: Swisslog
The second issue is rent; the in-store model picks baskets from existing stores 'rent free'.
Although it is only an accounting change, once there is a dedicated operation for online
orders, the full occupancy cost needs to be charged back onto orders.
Figure 66: Waitrose dark store; picking with visually enhanced RFID scanners
Source: Waitrose
Third, a dark store is still sub-scale. Dark stores do not enjoy the efficiencies that come
from more consistent inventory turns, and automation equipment and other operational
improvements are not as prevalent as they are in a centralised fulfilment operation.
Figure 67: Wearable scanners – Yes Figure 68: Palletising robot – No
Source: Motorola Source: Kuka
We estimate that Tesco's latest generation dark store in Erith has a yearly throughput of
up to £150m, compared to Ocado's smallest CFC, which has a design capacity of £350m.

10 April 2017
Global online grocery 44
Ultimately, dark stores and CFCs perform the same function at different scale.
3. Hybrid stores: Better, but not optimal
Peapod is the global leader in using hybrid stores. By having associated 'ware-rooms',
Peapod leverages the distribution function and general store costs, but is able to
segregate online picking from regular store operations. However, due to the low
throughput there is little potential for automation, and range is limited unless orders can be
supplemented with lower velocity products from the attached store. While preferable to
dedicated in-store picking, we do not view hybrid stores as having enough incremental
benefits to be a long-term solution.
Can hybrid stores solve space issues?
Because there is an abundance of oversized stores within grocery retail, even the modest
benefits of hybrid stores will result in some being re-tasked as online fulfilment centres.
For example Tesco turned a store near Dudley into a hybrid operation; store space fell
from 108,000 ft2 to 66,500 ft
2, with the recovered space being converted into dot-com
fulfilment and a C&C site.
However, converting a site is complicated and expensive. Ingress and egress is different
for the high volume of large trucks and vans compared to a store designed for customer
parking and individual customer flow. Store locations may be sub-optimal, requiring
extended drive times for the catchment area compared to choosing a greenfield site. Other
critical factors such as roof height and the additional capital costs of retrofitting an existing
store layout are also impediments to repurposing existing stores.
4. Centralised fulfilment: The only path to online profitability
A centralised business model removes traditional expenses (rent, labour) and adds
assortment breadth, improves order accuracy, fresher food and scale. We view the model
as inherently superior to one that piggy-backs on existing store infrastructure.
Because a CFC operates as a warehouse, a picking operation and a distribution centre all
in one, the 'distribution to store' line item cost (shown in Figure 62) is eliminated. The scale
of the operation allows for infrastructure solutions such as independently-routed,
computer-controlled customer totes, automated inventory systems, goods-to-man
workstations, optimised picking methodologies by product line and other strategies.
A key technology used in both Ocado CFCs and Tesco's dark stores are 'goods-to-man'
(GTM) workstations. Bar-coded customer totes (bins) move around the facility without
human interaction on conveyor systems controlled by computer. Some inventory items are
also managed in the same way – via computer-controlled conveyor systems. GTM
technology synchronises inventory totes and customer totes and routes them to a manned
picking station.
GTM enables very fast picking because the picker doesn’t have to move – they take goods
from the inventory tote on one conveyor and put them into a customer tote on the adjacent
conveyor. GTM technology is ideal for hard-to-pick items, such as low-volume goods
where a picker would have to walk a long way to reach the inventory. This compares to
fast-moving items such as bananas or baked beans, which would normally be kept on
traditional shelving given its much lower capital cost.
While these technologies create efficiencies over store-based picking, the long-term
benefit of industrial automation is the ability to incorporate new technology as it improves.
This is evident in Ocado's new CFC, which uses radically different processes in a 'hive'
format to pick orders. This technology will bring GTM capabilities for all ambient and
chilled goods, leading to a material increase in picking rates. We expect a step-change in
productivity.

10 April 2017
Global online grocery 45
It's not just about replacing people
The most obvious advantage of a hive system is to reduce the labour costs associated
with picking a basket. However, there are a number of other benefits beyond mere cost
savings:
■ Concurrent picking. Whereas an order within a semi-automated facility may take a
number of hours to wind its way through the conveyor systems, in a hive system
picking 50 items takes the same time as picking one item. An order that can be picked
and at the dock door within 10 minutes allows for same-day delivery, potentially <1hr,
depending on the location of the facility.
■ Dynamic order processing / buffering. Existing facilities are generally one-way; an
order starts the fulfilment process and moves through completion. Latency between
completion and shipping is minimal. For orders placed in advance in a hive structure,
orders can be picked and placed back in the hive, available for shipping later. This
optimises the picking utilisation and also allows for order changes until just before
shipping.
■ Density. By creating a 3-dimensional storage system, the footprint of the facility can be
materially reduced, thereby allowing it to be positioned closer to customers and
reducing overall costs.
■ Redundancy. Independently-targeted bots and multiple-pick stations allow control
systems to bypass any areas with mechanical failures.
■ Future-proofing. The pick stations have been designed to incorporate robotic picking,
further enhancing efficiency without altering the overall structure. We would expect
heavier 'first in the bag' items like bottled water or laundry detergent to be the first
categories earmarked for robotic picking.
■ Modular and scalable. Allows facilities to grow as demand grows. This improves
companies' IRR and ROCE metrics.
Ocado designed its hive system specifically for food, but other three-dimensional storage
and retrieval systems have been implemented before (Figure 69 – note that the AutoStore
bots cover two cells, whereas Ocado's bots in Figure 70 are one-celled, allowing for much
higher throughput). Ocado has stated that it expects CFC4 (still under construction) to
achieve a units per hour (UPH) target of "over 200" compared to the 160 it achieved in
2015. At that rate, we estimate that 2016's CFC costs would have been ~6.2% of
revenues rather than 7.7% and added £17m of additional margin. We also believe the
target is undemanding given that GTM workstations currently exceed 600 UPHs.
Figure 69: Asda AutoStore Installation Figure 70: Ocado's 'hive'
Source: Asda, Swisslog Source: Company data

10 April 2017
Global online grocery 46
More importantly, this solution is scalable. The smallest hive installation at CFC3 in
Andover is expected to have 1,000 robots. As long as the control systems (e.g., software
logic, communications) are able to scale, adding more hardware to the grid is relatively
straightforward, leading to higher throughput and more SKU choice. The three-
dimensional, very dense nature of the system means that the real estate footprint required
for any given throughput is materially smaller – one of the key drivers in determining CFC
locations.
Lastly, because so much of the basket is now using GTM technology, we expect robots to
replace stationary workers, which is exactly what the CEO of Ocado said at this year's
results presentation:
"Every human touch point in [CFC3] is designed to one day be replaced
by a robotic solution" – Tim Steiner, CEO of Ocado
For further reading into warehouse and logistics automation, we refer you to today's
publication from our capital goods team Warehouse Automation and Robotics.
The cost of delivery (or collection)
Delivery costs are either the most expensive or second-most expensive part of the
fulfilment process, depending on the size of the basket (because picking is a variable cost,
while delivery is almost entirely a fixed cost per order). Online basket sizes remain high
(for now), and many are shopped as substitutes for specific missions (e.g., parties,
holidays, ). The more mainstream online grocery becomes, the more downward pressure
on basket sizes. The impact of this can be seen in Figure 71, using a £90 basket size.
Figure 71: Basket size sensitivity relative to delivery costs
Source: Kurt Salmon, Credit Suisse research
The costs of delivery are straightforward: labour, fuel and maintenance / depreciation on
the vehicles. The primary difference when comparing food and non-food delivery costs is
that food customers choose their own time slots, which causes a number of knock-on
effects:
■ Longer routes;
■ Erratic routes; and
■ Customer service pressure, requiring time buffers.
Furthermore, temperature controls, product returns, rejected substitutions and absent
customers all add complexity to the delivery process, almost none of which apply to non-
food. Scale and high drop densities help counteract some of these issues, but costs are
relatively linear, and defy easy solutions.
Ocado has been able to gain some operational leverage by increasing the drops per van
(rather than increasing drops per hour). In addition to higher customer densities,
companies can improve efficiencies by providing incentives for less popular time slots (or
disincentives for more popular ones), widening delivery windows, and adding capacity on
key days (such as Sunday). Using a combination of these initiatives Ocado has been able
to improve drops per van per week from 133 in 2010 to 176 in 2016 (+32%), with a long-
term target of 190 (Figure 72).
Our cost estimates are based on between 3 and 4 drops per hour, with the bulk of that
cost being the van driver's labour, based on UK rates. Drops per hour can vary on a city-
Basket size £60 £70 £80 £90 £100 £110
Gross margin per basket 17.00£ 19.50£ 22.00£ 24.50£ 27.00£ 29.50£
Delivery cost (£ 8.27) (£ 8.27) (£ 8.27) (£ 8.27) (£ 8.27) (£ 8.27)
Percentage of gross margin 49% 42% 38% 34% 31% 28%
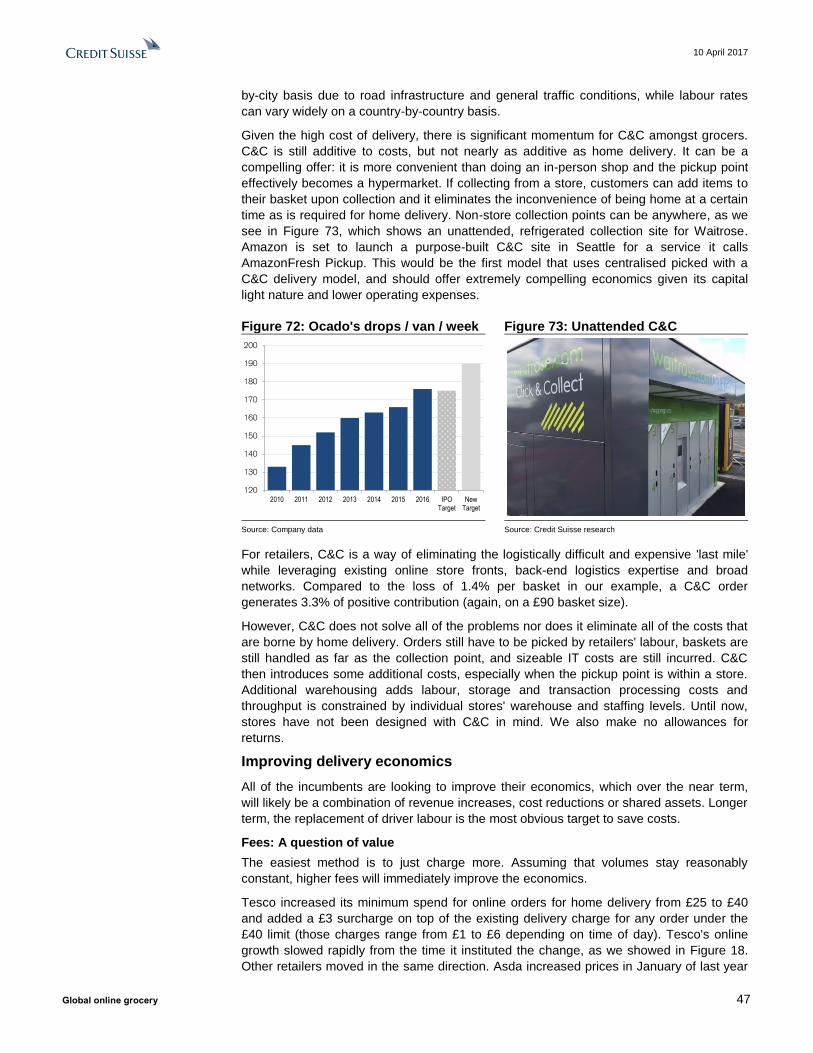
10 April 2017
Global online grocery 47
by-city basis due to road infrastructure and general traffic conditions, while labour rates
can vary widely on a country-by-country basis.
Given the high cost of delivery, there is significant momentum for C&C amongst grocers.
C&C is still additive to costs, but not nearly as additive as home delivery. It can be a
compelling offer: it is more convenient than doing an in-person shop and the pickup point
effectively becomes a hypermarket. If collecting from a store, customers can add items to
their basket upon collection and it eliminates the inconvenience of being home at a certain
time as is required for home delivery. Non-store collection points can be anywhere, as we
see in Figure 73, which shows an unattended, refrigerated collection site for Waitrose.
Amazon is set to launch a purpose-built C&C site in Seattle for a service it calls
AmazonFresh Pickup. This would be the first model that uses centralised picked with a
C&C delivery model, and should offer extremely compelling economics given its capital
light nature and lower operating expenses.
Figure 72: Ocado's drops / van / week Figure 73: Unattended C&C
Source: Company data Source: Credit Suisse research
For retailers, C&C is a way of eliminating the logistically difficult and expensive 'last mile'
while leveraging existing online store fronts, back-end logistics expertise and broad
networks. Compared to the loss of 1.4% per basket in our example, a C&C order
generates 3.3% of positive contribution (again, on a £90 basket size).
However, C&C does not solve all of the problems nor does it eliminate all of the costs that
are borne by home delivery. Orders still have to be picked by retailers' labour, baskets are
still handled as far as the collection point, and sizeable IT costs are still incurred. C&C
then introduces some additional costs, especially when the pickup point is within a store.
Additional warehousing adds labour, storage and transaction processing costs and
throughput is constrained by individual stores' warehouse and staffing levels. Until now,
stores have not been designed with C&C in mind. We also make no allowances for
returns.
Improving delivery economics
All of the incumbents are looking to improve their economics, which over the near term,
will likely be a combination of revenue increases, cost reductions or shared assets. Longer
term, the replacement of driver labour is the most obvious target to save costs.
Fees: A question of value
The easiest method is to just charge more. Assuming that volumes stay reasonably
constant, higher fees will immediately improve the economics.
Tesco increased its minimum spend for online orders for home delivery from £25 to £40
and added a £3 surcharge on top of the existing delivery charge for any order under the
£40 limit (those charges range from £1 to £6 depending on time of day). Tesco's online
growth slowed rapidly from the time it instituted the change, as we showed in Figure 18.
Other retailers moved in the same direction. Asda increased prices in January of last year
120
130
140
150
160
170
180
190
200
2010 2011 2012 2013 2014 2015 2016 IPOTarget
NewTarget

10 April 2017
Global online grocery 48
and Waitrose added a £2 fee for orders under £30 on C&C orders. We expect more
tweaks throughout 2017 as retailers grapple with the changing economics of grocery.
Dynamic delivery pricing is more
sophisticated than a simple increase in
price. Unlike picking, the value of delivery
to the customer can be estimated because
retailers can determine the effort required
to get from the customer's house to the
nearest grocery store.
Adding this knowledge to planned van
routes, the time and day of delivery, store
location data and other factors provides an
opportunity to dynamically price delivery
slots. Data analytics can predict whether
this is an incremental or a cannibalised
basket. Pricing can be set so the customer
gets good value, but does not get a free
ride (i.e. you get what you pay for), which
is especially valuable for hard-to-reach
locations.
We already see this in plain vanilla
delivery services such as the Trader Joe's
in midtown Manhattan (Figure 74). This
delivery program is for own-picked baskets
(i.e. you go to the store and shop, but then
the store takes over delivery). As an aside,
the cost of this service appears extremely high (between $6.95 and $17.95 plus tip,
depending on location) when compared to the delivery fees charged for online elsewhere.
Shared delivery
There is potential for a delivery van that shares suppliers and drives around the same
neighbourhoods on a consistent basis. This materially increases drop density – the key
issue in current online delivery economics. We see potential for existing delivery services
(like UPS), taxi services (including models such as Uber or Lyft), or meal delivery services
(such as Deliveroo or Just Eat) to participate in a milkman-like model.
A local delivery van operator would open up online grocery to lower-margin channels, such
as discount grocers (e.g., Aldi, Lidl, DIA). There would be less flexibility on delivery slots
and less choice due to the discounters' limited assortment, but there would be materially
lower basket prices. The ability to pre-package items or groups of items would further
reduce costs.
Meal kits or recipe boxes are often paired with home delivery – partially from necessity
(meal kit producers are 'asset light' with no store presence), but also because they see this
as part of their value proposition. We believe that the delivery element is not a competitive
advantage, and that the consolidation of delivery models could improve the economics for
this segment as well.
Direct-to-fridge delivery
In Sweden, ICA has partnered with PostNord (not listed) and Glue (not listed) to offer ICA
Infridge, a service that delivers groceries directly to customers' refrigerators. Glue has
smart locking technology that allows authorised delivery personnel to enter homes,
notifying homeowners when their door is unlocked and re-locked. This model improves
routing efficiency, eliminates any delivery coordination issues and increases asset
utilisation. There is a modest technological hurdle in retrofitting door locks, but we think the
trickier hurdle is getting customers comfortable with strangers being in their homes.
Figure 74: Manhattan delivery costs
Source: Credit Suisse research
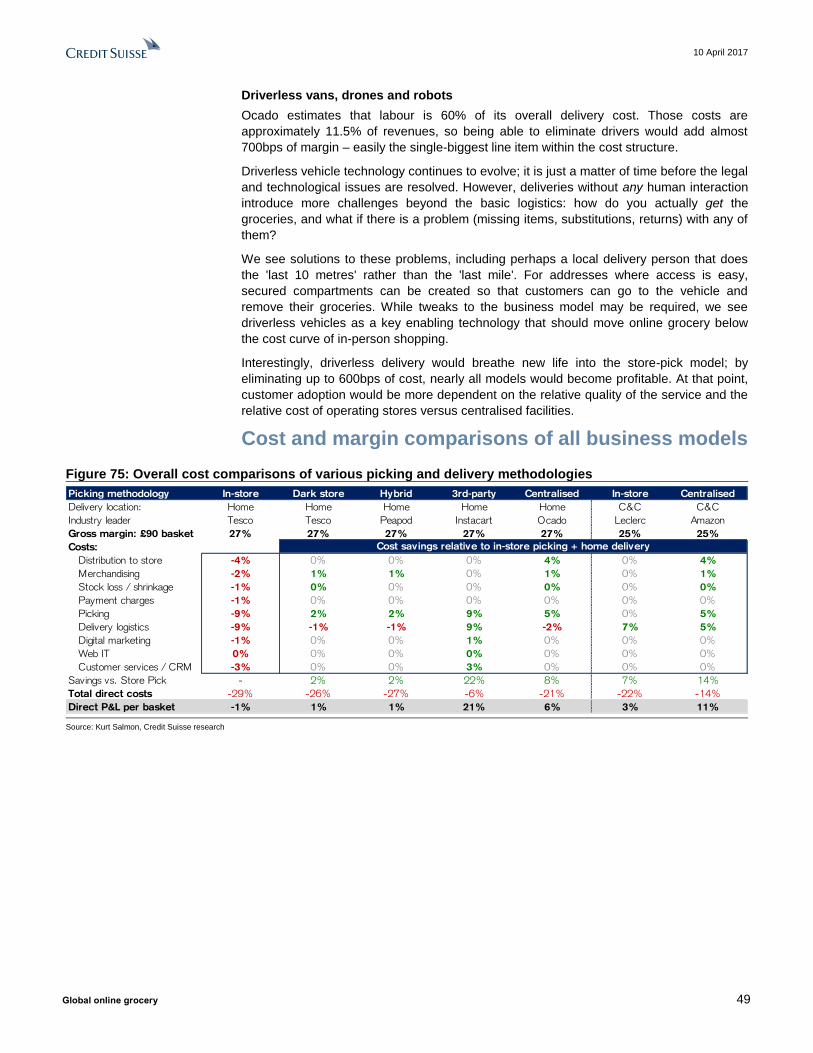
10 April 2017
Global online grocery 49
Driverless vans, drones and robots
Ocado estimates that labour is 60% of its overall delivery cost. Those costs are
approximately 11.5% of revenues, so being able to eliminate drivers would add almost
700bps of margin – easily the single-biggest line item within the cost structure.
Driverless vehicle technology continues to evolve; it is just a matter of time before the legal
and technological issues are resolved. However, deliveries without any human interaction
introduce more challenges beyond the basic logistics: how do you actually get the
groceries, and what if there is a problem (missing items, substitutions, returns) with any of
them?
We see solutions to these problems, including perhaps a local delivery person that does
the 'last 10 metres' rather than the 'last mile'. For addresses where access is easy,
secured compartments can be created so that customers can go to the vehicle and
remove their groceries. While tweaks to the business model may be required, we see
driverless vehicles as a key enabling technology that should move online grocery below
the cost curve of in-person shopping.
Interestingly, driverless delivery would breathe new life into the store-pick model; by
eliminating up to 600bps of cost, nearly all models would become profitable. At that point,
customer adoption would be more dependent on the relative quality of the service and the
relative cost of operating stores versus centralised facilities.
Cost and margin comparisons of all business models
Figure 75: Overall cost comparisons of various picking and delivery methodologies
Source: Kurt Salmon, Credit Suisse research
Picking methodology In-store Dark store Hybrid 3rd-party Centralised In-store Centralised
Delivery location: Home Home Home Home Home C&C C&C
Industry leader Tesco Tesco Peapod Instacart Ocado Leclerc Amazon
Gross margin: £90 basket 27% 27% 27% 27% 27% 25% 25%
Costs:
Distribution to store -4% 0% 0% 0% 4% 0% 4%
Merchandising -2% 1% 1% 0% 1% 0% 1%
Stock loss / shrinkage -1% 0% 0% 0% 0% 0% 0%
Payment charges -1% 0% 0% 0% 0% 0% 0%
Picking -9% 2% 2% 9% 5% 0% 5%
Delivery logistics -9% -1% -1% 9% -2% 7% 5%
Digital marketing -1% 0% 0% 1% 0% 0% 0%
Web IT 0% 0% 0% 0% 0% 0% 0%
Customer services / CRM -3% 0% 0% 3% 0% 0% 0%
Savings vs. Store Pick - 2% 2% 22% 8% 7% 14%
Total direct costs -29% -26% -27% -6% -21% -22% -14%
Direct P&L per basket -1% 1% 1% 21% 6% 3% 11%
Cost savings relative to in-store picking + home delivery
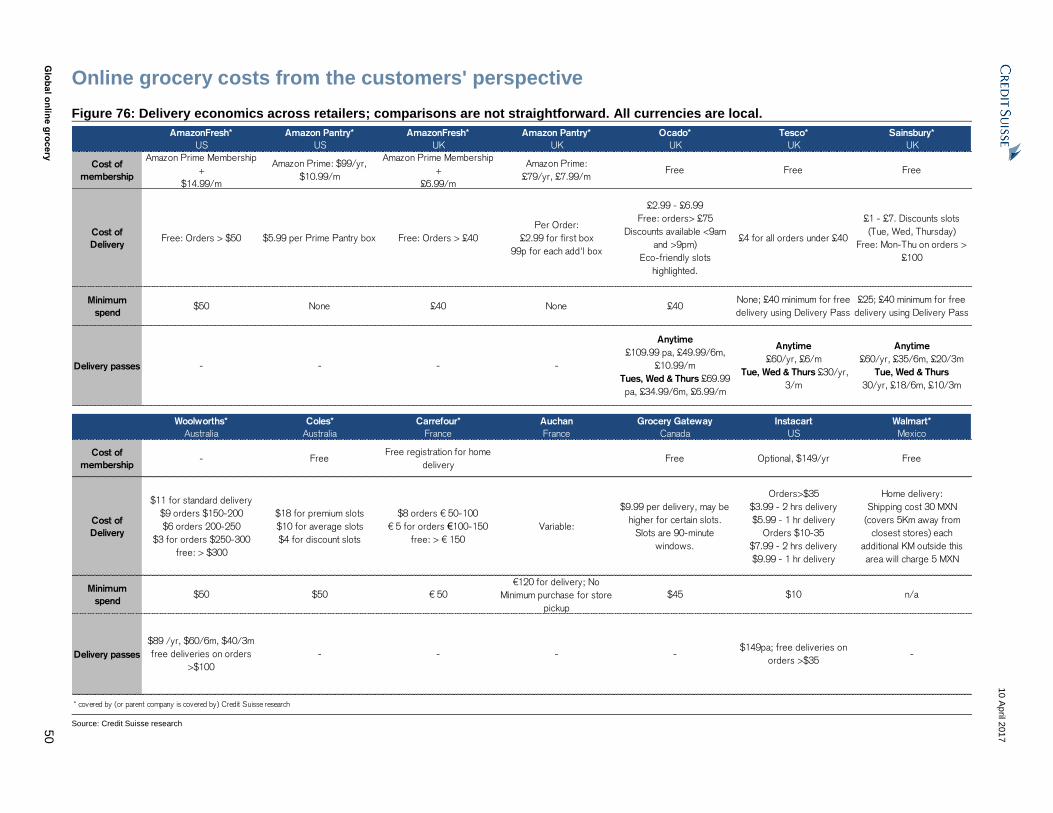
10 A
pril 2
01
7
Glo
ba
l on
line g
roc
ery
5
0
Online grocery costs from the customers' perspective
Figure 76: Delivery economics across retailers; comparisons are not straightforward. All currencies are local.
Source: Credit Suisse research
AmazonFresh* Amazon Pantry* AmazonFresh* Amazon Pantry* Ocado* Tesco* Sainsbury*
US US UK UK UK UK UK
Cost of
membership
Amazon Prime Membership
+
$14.99/m
Amazon Prime: $99/yr,
$10.99/m
Amazon Prime Membership
+
£6.99/m
Amazon Prime:
£79/yr, £7.99/mFree Free Free
Cost of
DeliveryFree: Orders > $50 $5.99 per Prime Pantry box Free: Orders > £40
Per Order:
£2.99 for first box
99p for each add'l box
£2.99 - £6.99
Free: orders> £75
Discounts available <9am
and >9pm)
Eco-friendly slots
highlighted.
£4 for all orders under £40
£1 - £7. Discounts slots
(Tue, Wed, Thursday)
Free: Mon-Thu on orders >
£100
Minimum
spend$50 None £40 None £40
None; £40 minimum for free
delivery using Delivery Pass
£25; £40 minimum for free
delivery using Delivery Pass
Delivery passes - - - -
Anytime
£109.99 pa, £49.99/6m,
£10.99/m
Tues, Wed & Thurs £69.99
pa, £34.99/6m, £6.99/m
Anytime
£60/yr, £6/m
Tue, Wed & Thurs £30/yr,
3/m
Anytime
£60/yr, £35/6m, £20/3m
Tue, Wed & Thurs
30/yr, £18/6m, £10/3m
Woolworths* Coles* Carrefour* Auchan Grocery Gateway Instacart Walmart*
Australia Australia France France Canada US Mexico
Cost of
membership- Free
Free registration for home
deliveryFree Optional, $149/yr Free
Cost of
Delivery
$11 for standard delivery
$9 orders $150-200
$6 orders 200-250
$3 for orders $250-300
free: > $300
$18 for premium slots
$10 for average slots
$4 for discount slots
$8 orders € 50-100
€ 5 for orders €100-150
free: > € 150
Variable:
$9.99 per delivery, may be
higher for certain slots.
Slots are 90-minute
windows.
Orders>$35
$3.99 - 2 hrs delivery
$5.99 - 1 hr delivery
Orders $10-35
$7.99 - 2 hrs delivery
$9.99 - 1 hr delivery
Home delivery:
Shipping cost 30 MXN
(covers 5Km away from
closest stores) each
additional KM outside this
area will charge 5 MXN
Minimum
spend$50 $50 € 50
€120 for delivery; No
Minimum purchase for store
pickup
$45 $10 n/a
Delivery passes
$89 /yr, $60/6m, $40/3m
free deliveries on orders
>$100
- - - -$149pa; free deliveries on
orders >$35-
* covered by (or parent company is covered by) Credit Suisse research

10 A
pril 2
01
7
Glo
ba
l on
line
gro
cery
5
1
Figure 77: Delivery economics (cont.)
Source: Credit Suisse research
Peapod* Fresh Direct Kroger* Walmart* ah.nl* Lenta* O'key*
US US US US The Netherlands Russia Russia
Cost of
membershipFree Free Free Free Free None None
Cost of
Delivery
$6.95: Orders $60 to $100
$9.95: Orders >$100
Variable savings rates from
$2 to $4 depending on time
$5.99 to $9.99
Eco-friendly slots
highlighted.
Standard Delivery: $10.95
Priority fee: addl $5
Pickup: $4.95
Variable ($7-10) depends
on the Weight and location
of delivery
Free Store pickup
From €3.91 and € 12.95
depending on time of
delivery (6 days per week
between 7am and
10.30pm); Free with the
purchase of certain products
(which change). C&C: €1.50
<30kg: RUB249; 30-40kg:
RUB299; 40-60kg:
RUB399; 60-80kg: RUB499
(over 90% of orders are
<30kg)
Free for orders >
RUB2700, RUB249 for
orders below.
Minimum
spend$60 $30
Grocery: $50
Floral /event planning: $25
$30-50 depending on
location
€70 unless "free delivery"
items purchased; no C&C
minimum.
RUB500 None
Delivery passes
$59/6m
Free for orders>$100
$6.95 credit for orders $60
to $100
$119/yr, $69/6m - -
Not offered, but €1
reduction in fees if total
spend exceeds €100
None None
Alibaba* JD* Rakuten* Lohaco (Askul)* Omni7 (Seven & I)* Aeon X5*
China China Japan Japan Japan Japan Russia
Cost of
membershipFree Free Free Free Free Free Free
Cost of
Delivery
RMB20 for order < RMB50
and weight within 5KG;
RMB5 for order between
RMB50 -RMB88 and weight
within 5KG; RMB1 for every
extra 1KG above 5KG
Rmb6 delivery fee for order
below minimum spend +
Rmb1 for every 1kg above
the bar; Rmb99 for premium
service (2-hour delivery);
Rmb6 to select more
specific time slots
Free delivery above ¥5,000.
Charges range from ¥648 to
¥1,080
Free delivery above ¥1,900.
Charges range from ¥350 to
¥500
Free delivery above ¥3,240
(¥1,500 for seven net
shopping). Delivery charges
¥324
Free delivery above ¥5,000.
Delivery charges ¥324Variable
Minimum
spend
Free delivery for order
above RMB88 and weight
within 20KG
Free delivery above RMB99
and under 10KGNone None None None RUB2000
Delivery passes -
Rmb149/yr. - includes 60
free delivery vouchers, free
return and exchange, cash
back and other services.
n/a n/a n/a n/a None
* covered by (or parent company is covered by) Credit Suisse research

10 April 2017
Global online grocery 52
Appendix A: Multi-factor country model We have created a country framework with 13 independent factors that we believe
correlate to online grocery adoption and profitability. We have used this model to compare
the key European countries along with the US, Canada, Japan, Australia, South Korea
and China.
Figure 78: Model characteristics for the UK
Source: Credit Suisse research
Our work is based on a model used in a Coca-Cola Retailing Research Council report,
which engaged McKinsey to analyse online grocery in Europe. Broadly speaking, the
characteristics fit within the same four broad categories. However, our model is materially
different and results in different conclusions.
We have eliminated a number of backward-looking metrics that we believe do not help
predict the rate of online adoption. For instance, "Grocery basket size" and "Share of
stock-up baskets" were used to provide insight in the economics of online grocery; our
view is that metrics like basket size change with the introduction of online grocery, either
due to incentives provided or a change in behaviour. For example, the pricing and
promotion schemes employed by Ocado are used to provide incentives to move towards
bigger baskets.
We also do not include "Cost of labour" as a material factor in online grocery adoption.
Labour could be viewed as inversely correlated to online grocery growth (i.e. cheap labour
helps lower picking and last-mile delivery costs), but this is primarily true for an in-store
picking model. When centralised picking is used, higher labour costs actually benefit
online grocery because technology can be used to automate processes and tasks, thereby
widening the labour cost differential to traditional grocery.
The effect of discounter penetration on online grocery is unclear. They do not have a
significant presence online (hence, reducing the pressure to move online), but we believe
that online gives traditional grocers a point of differentiation, thereby increasing the
potential for a move online. Awareness of very low prices may be a detractor.
Urban factors are critical in online grocery, but overall population density is misleading, as
we discuss within the report. For example, over 600m people in China are in rural regions,
wholly unsuitable for online grocery. Our focus is on the number and size of metropolitan
areas, which we have now incorporated into the model.
We have included weather as a factor. For example the average daily high in Montreal
during the month of January is -4°C, the average low is -14°C and it receives an average
0
1
2
3
4
5
6
Broadband penetration Tablet / smartphone
penetration
Online share of retailspend
Amazon penetration
Start-up / independentculture
Urban drivinginfrastructure
Metro areas > 1mMetro areas > 5m
GDP per capita
Density of supermarketspace*
Car ownership*
Prevalence of double-income households
Inclement seasonalweather
* inverse correlation

10 April 2017
Global online grocery 53
snowfall of 50cm during the month – conditions that we believe are conducive to online
grocery for the 4.0m people in the Greater Montreal area. Countries that have excellent
weather score a 2 (the highest score), while those that have seasonally poor weather such
as Canada would score a 6 (the lowest score). Our scoring is based on temperature and
precipitation. It does not include hurricane/tornado risk.
Other factors that we have included are the road infrastructure within the key metropolitan
areas (which correlates to service levels and costs) and car ownership, which is inversely
correlated to online shopping (for home delivery), but positively correlated for C&C..
We also note that traffic patterns, dwelling mix, and transportation regulations all have an
impact on delivery costs and demand.

10 April 2017
Global online grocery 54
Appendix B: Further reading / viewing
■ YouTube - YASKAWA Motoman robot depalletizing random-cases
YouTube video, Industrial Perception, 2014
■ Robotics in Logistics; A DPDHL perspective on implications
DHL Customer Solutions and Innovation
■ Internet of Things in Logistics
DHL Trend Research and Cisco Consulting Services
■ Shaping the Future of Online Grocery
Coca-Cola Retailing Research Council, Europe by McKinsey & Co.
■ Ocado Warehouse Distribution Robot
Case study, Tharsus
■ Computer scientists find new shortcuts for the infamous traveling salesman problem
Wired, January 2013
■ How Retailers Should Think About Online Versus In-Store Pricing
Rafi Mohammed, Harvard Business Review, January 2017
■ Introducing "Handle"
YouTube video, Boston Dynamics, February 2017
■ Infridge delivery by ICA, PostNord and Glue
YouTube video, April 2016
■ How to win in online grocery: Advice from a pioneer
McKinsey & Company, December 20164

10 April 2017
Global online grocery 55
Unless otherwise indicated, all prices are taken at the close of the trading session of the pricing date quoted. Companies Mentioned (Price as of 05-Apr-2017) AEON (8267.T, ¥1,639) ASKUL (2678.T, ¥2,992) Ahold Delhaize (AD.AS, €19.56) Alibaba Group Holding Limited (BABA.N, $107.44) Alphabet (GOOGL.OQ, $848.91) Amazon com Inc. (AMZN.OQ, $909.28) Apple Inc (AAPL.OQ, $144.02) CJ Logistics (000120.KS, W161,000) COFCO Meat Hldg (1610.HK, HK$1.91) Carrefour (CARR.PA, €21.62) Chedraui (CHDRAUIB.MX, MXN40.05) Companhia Brasileira de Distribuicao (PCAR4.SA, R$60.03) Costco Wholesale Corporation (COST.OQ, $167.0) Coupang (Unlisted) DIA (DIDA.MC, €5.426) Daifuku (6383.T, ¥2,707) Dixy Group of Companies (DIXY.MM, Rbl249.0) E-MART Co. Ltd (139480.KS, W212,500) Honeywell International Inc. (HON.N, $123.57) ICA Gruppen (ICAA.ST, Skr303.9) Ito-Yokado Co., Ltd. (Unlisted) J Sainsbury (SBRY.L, 256.3p) JD.com (JD.OQ, $31.53) Just Eat (JE.L, 564.0p) Kion Group (KGX.DE, €61.6) Kroger Co. (KR.N, $29.31) Kuka (KU2G.DE, €101.25) Lenta Ltd (LNTAq.L, $6.9) Loblaw Companies Limited (L.TO, C$71.2) Lotte Shopping (023530.KS, W220,000) Magnit (MGNTq.L, $38.8) Marks & Spencer (MKS.L, 334.8p) Metcash (MTS.AX, A$2.31) Metro DE (MEOG.DE, €29.25) NTT DoCoMo (9437.T, ¥2,632) Ocado Plc (OCDO.L, 246.7p) Oisix (3182.T, ¥2,235) Okey (OKEYq.L, $2.15) Publix Super Mkt (PUSH.PK, $14.75) Rakuten (4755.T, ¥1,142) Soriana (SORIANAB.MX, MXN43.98) Tesco (TSCO.L, 184.25p) United Parcel Service Inc. (UPS.N, $106.74) Wal-Mart Stores, Inc. (WMT.N, $71.65) Walmex (WALMEX.MX, MXN43.12) Wesfarmers (WES.AX, A$44.26) Whole Foods Market (WFM.OQ, $30.25) Wm Morrison (MRW.L, 232.3p) Woolworths (WOW.AX, A$26.77) X5 Retail Group (PJPq.L, $34.14)
Disclosure Appendix
Analyst Certification Stewart McGuire, CFA, A-Hyung Cho, Antonio Gonzalez, CFA, Stephen Ju, Edward J. Kelly, CFA, CPA, Andre Kukhnin, CFA, Grant Saligari, Tobias Stingelin, CFA, Evan Zhou, Victoria Petrova, Olga Bystrova, CFA and Keiichi Yoneshima each certify, with respect to the companies or securities that the individual analyzes, that (1) the views expressed in this report accurately reflect his or her personal views about all of the subject companies and securities and (2) no part of his or her compensation was, is or will be directly or indirectly related to the specific recommendations or views expressed in this report.

10 April 2017
Global online grocery 56
3-Year Price and Rating History for CJ Logistics (000120.KS)
000120.KS Closing Price Target Price
Date (W) (W) Rating
05-Sep-16 202,500 270,000 O *
* Asterisk signifies initiation or assumption of coverage.
O U T PERFO RM
3-Year Price and Rating History for E-MART Co. Ltd (139480.KS)
139480.KS Closing Price Target Price
Date (W) (W) Rating
24-Jul-14 229,000 250,000 N
14-May-15 252,500 R
15-May-15 252,500 250,000 N
04-Aug-15 245,000 R
25-Sep-15 226,000 250,000 N
16-Nov-15 216,000 260,000 O
10-May-16 186,000 248,000
10-Aug-16 166,500 217,000
07-Nov-16 160,500 228,000
03-Feb-17 204,000 235,000
* Asterisk signifies initiation or assumption of coverage.
N EU T RA L
REST RICT ED
O U T PERFO RM
3-Year Price and Rating History for Lotte Shopping (023530.KS)
023530.KS Closing Price Target Price
Date (W) (W) Rating
12-May-14 304,000 350,000 N
10-Nov-14 284,500 320,000
05-Feb-15 248,500 300,000
24-Feb-15 247,000 R
09-Jun-15 237,000 300,000 N
10-Aug-15 204,500 250,000
09-Nov-15 219,000 240,000
05-Feb-16 237,000 210,000
09-May-16 235,500 206,000 U
08-Aug-16 194,500 190,000
02-Feb-17 226,000 220,000 N
* Asterisk signifies initiation or assumption of coverage.
N EU T RA L
REST RICT ED
U N D ERPERFO RM
The analyst(s) responsible for preparing this research report received Compensation that is based upon various factors including Credit Suisse's total revenues, a portion of which are generated by Credit Suisse's investment banking activities
As of December 10, 2012 Analysts’ stock rating are defined as follows: Outperform (O) : The stock’s total return is expected to outperform the relevant benchmark* over the next 12 months. Neutral (N) : The stock’s total return is expected to be in line with the relevant benchmark* over the next 12 months. Underperform (U) : The stock’s total return is expected to underperform the relevant benchmark* over the next 12 months. *Relevant benchmark by region: As of 10th December 2012, Japanese ratings are based on a stock’s total return relative to the analyst's coverage universe which consists of all companies covered by the analyst within the relevant sector, with Outperforms representing the most attractive, Neutrals the less attractive, a nd Underperforms the least attractive investment opportunities. As of 2nd October 2012, U.S. and Canadian as well as European ra tings are based on a stock’s total return relative to the analyst's coverage universe which consists of all companies covered by the analyst within the relevant sector, with Outperforms representing the most attractive, Neutrals the less attractive, and Underperforms the least attractive investment opportunities. For Latin American and non-Japan Asia stocks, ratings are based on a stock’s total return relative to the average total return of the relevant country or regional benchmark; prior to 2nd October 2012 U.S. and Canadian ratings were based on (1) a stock’s absolute total return potential to its current share price and (2) the relative attractiv eness of a stock’s total return potential within

10 April 2017
Global online grocery 57
an analyst’s coverage universe. For Australian and New Zealand s tocks, the expected total return (ETR) calculation includes 12-month rolling dividend yield. An Outperform rating is assigned where an ETR is greater than or equal to 7.5%; Underperform where an ETR less than or equal to 5%. A Neutral may be assigned where the ETR is between -5% and 15%. The overlapping rating range allows analysts to assign a rating that puts ETR in the context of associated risks. Prior to 18 May 2015, ETR ranges for Outperform and Underperform ratings did not overlap with Neutral thresho lds between 15% and 7.5%, which was in operation from 7 July 2011. Restricted (R) : In certain circumstances, Credit Suisse policy and/or applicable law and regulations preclude certain types of communications, including an investment recommendation, during the course of Credit Suisse's engagement in an investment banking transaction and in certain other circumstances. Not Rated (NR) : Credit Suisse Equity Research does not have an investment rating or view on the stock or any other securities related to the company at this time. Not Covered (NC) : Credit Suisse Equity Research does not provide ongoing coverage of the company or offer an investment rating or investment view on the equity security of the company or related products.
Volatility Indicator [V] : A stock is defined as volatile if the stock price has moved up or down by 20% or more in a month in at least 8 of the past 24 months or the analyst expects significant volatility going forward.
Analysts’ sector weightings are distinct from analysts’ stock ratings and are based on the analyst’s expectations for the fundamentals and/or valuation of the sector* relative to the group’s historic fundamentals and/or valuation: Overweight : The analyst’s expectation for the sector’s fundamentals and/or valuation is favorable over the next 12 months. Market Weight : The analyst’s expectation for the sector’s fundamentals and/or valuation is neutral over the next 12 months. Underweight : The analyst’s expectation for the sector’s fundamentals and/or valuation is cautious over the next 12 months. *An analyst’s coverage sector consists of all companies covered by the analyst within the relevant sector. An analyst may cover multiple sectors.
Credit Suisse's distribution of stock ratings (and banking clients) is:
Global Ratings Distribution
Rating Versus universe (%) Of which banking clients (%) Outperform/Buy* 45% (64% banking clients) Neutral/Hold* 39% (61% banking clients) Underperform/Sell* 14% (53% banking clients) Restricted 2% *For purposes of the NYSE and FINRA ratings distribution disclosure requirements, our stock ratings of Outperform, Neutral, and Underperform most closely correspond to Buy, Hold, and Sell, respectively; however, the meanings are not the same, as our stock ratings are determined on a relative basis. (Please refer to definitions above.) An investor's decision to buy or sell a security should be based on investment objectives, current holdin gs, and other individual factors.
Important Global Disclosures Credit Suisse’s research reports are made available to clients through our proprietary research portal on CS PLUS. Credit Suisse research products may also be made available through third-party vendors or alternate electronic means as a convenience. Certain research products are only made available through CS PLUS. The services provided by Credit Suisse’s analysts to clients may depend on a specific client’s preferences regarding the frequency and manner of receiving communications, the client’s risk profile and investment, the size and scope of the overall client relationship with the Firm, as well as legal and regulatory constraints. To access all of Credit Suisse’s research that you are entitled to receive in the most timely manner, please contact your sales representative or go to https://plus.credit-suisse.com . Credit Suisse’s policy is to update research reports as it deems appropriate, based on developments with the subject company, the sector or the market that may have a material impact on the research views or opinions stated herein. Credit Suisse's policy is only to publish investment research that is impartial, independent, clear, fair and not misleading. For more detail please refer to Credit Suisse's Policies for Managing Conflicts of Interest in connection with Investment Research: https://www.credit-suisse.com/sites/disclaimers-ib/en/managing-conflicts.html . Credit Suisse does not provide any tax advice. Any statement herein regarding any US federal tax is not intended or written to be used, and cannot be used, by any taxpayer for the purposes of avoiding any penalties. See the Companies Mentioned section for full company names The subject company (SBRY.L, DIXY.MM, UPS.N, GOOGL.OQ, AAPL.OQ, MKS.L, 000120.KS, HON.N, 023530.KS, 139480.KS, 4755.T, AMZN.OQ, BABA.N, CARR.PA, CHDRAUIB.MX, JD.OQ, LNTAq.L, MGNTq.L, PCAR4.SA, PJPq.L, SORIANAB.MX, TSCO.L, WALMEX.MX, WES.AX, WMT.N, WOW.AX) currently is, or was during the 12-month period preceding the date of distribution of this report, a client of Credit Suisse. Credit Suisse provided investment banking services to the subject company (GOOGL.OQ, AAPL.OQ, BABA.N, CARR.PA, PJPq.L, WALMEX.MX, WMT.N) within the past 12 months. Credit Suisse provided non-investment banking services to the subject company (SBRY.L, GOOGL.OQ, AAPL.OQ, HON.N, 4755.T, BABA.N, CARR.PA, PJPq.L, TSCO.L, WALMEX.MX, WMT.N) within the past 12 months Credit Suisse has managed or co-managed a public offering of securities for the subject company (GOOGL.OQ) within the past 12 months. Credit Suisse has received investment banking related compensation from the subject company (GOOGL.OQ, AAPL.OQ, BABA.N, CARR.PA, PJPq.L, WALMEX.MX, WMT.N) within the past 12 months Credit Suisse expects to receive or intends to seek investment banking related compensation from the subject company (SBRY.L, DIXY.MM, UPS.N, GOOGL.OQ, AAPL.OQ, MKS.L, 8267.T, 000120.KS, COST.OQ, HON.N, 023530.KS, 139480.KS, 4755.T, AD.AS, AMZN.OQ, BABA.N, CARR.PA, CHDRAUIB.MX, JD.OQ, LNTAq.L, MGNTq.L, PCAR4.SA, PJPq.L, SORIANAB.MX, TSCO.L, WALMEX.MX, WES.AX, WMT.N, WOW.AX) within the next 3 months. Credit Suisse has received compensation for products and services other than investment banking services from the subject company (SBRY.L, GOOGL.OQ, AAPL.OQ, HON.N, 4755.T, BABA.N, CARR.PA, PJPq.L, TSCO.L, WALMEX.MX, WMT.N) within the past 12 months As of the date of this report, Credit Suisse makes a market in the following subject companies (AAPL.OQ).
10 April 2017
Global online grocery 58
A member of the Credit Suisse Group is party to an agreement with, or may have provided services set out in sections A and B of Annex I of Directive 2014/65/EU of the European Parliament and Council ("MiFID Services") to, the subject issuer (DIXY.MM, JE.L, UPS.N, GOOGL.OQ, 8267.T, 000120.KS, 023530.KS, 139480.KS, 4755.T, AMZN.OQ, BABA.N, CARR.PA, CHDRAUIB.MX, JD.OQ, LNTAq.L, MRW.L, MTS.AX, OCDO.L, PCAR4.SA, PJPq.L, SORIANAB.MX, TSCO.L, WALMEX.MX, WES.AX, WMT.N, WOW.AX) within the past 12 months. As of the end of the preceding month, Credit Suisse beneficially own 1% or more of a class of common equity securities of (MRW.L, PCAR4.SA). Credit Suisse beneficially holds >0.5% long position of the total issued share capital of the subject company (GOOGL.OQ, 000120.KS, 023530.KS, 139480.KS). Credit Suisse has a material conflict of interest with the subject company (PCAR4.SA) . Credit Suisse or its controlled entities, controlling entities, or entities under common control hold directly or indirectly a relevant participation in the capital stock of the subject company/companies.[PCAR4]. For purposes of this report, a relevant participation means a participation of 5% or more in a type or class of shares of the capital stock of a company. Credit Suisse or one of its affiliates is acting as an intermediary in a public offering of securities issued by Brasil Foods or referenced in assets or receivables of Companhia Brasileira de Distribuicao.
For other important disclosures concerning companies featured in this report, including price charts, please visit the website at https://rave.credit-suisse.com/disclosures or call +1 (877) 291-2683. For date and time of production, dissemination and history of recommendation for the subject company(ies) featured in this report, disseminated within the past 12 months, please refer to the link: https://rave.credit-suisse.com/disclosures/view/report?i=290826&v=-kh79bhqxmbd3npy5i3naxy6n .
Important Regional Disclosures Singapore recipients should contact Credit Suisse AG, Singapore Branch for any matters arising from this research report. The analyst(s) involved in the preparation of this report may participate in events hosted by the subject company, including site visits. Credit Suisse does not accept or permit analysts to accept payment or reimbursement for travel expenses associated with these events. Restrictions on certain Canadian securities are indicated by the following abbreviations: NVS--Non-Voting shares; RVS--Restricted Voting Shares; SVS--Subordinate Voting Shares. Individuals receiving this report from a Canadian investment dealer that is not affiliated with Credit Suisse should be advised that this report may not contain regulatory disclosures the non-affiliated Canadian investment dealer would be required to make if this were its own report. For Credit Suisse Securities (Canada), Inc.'s policies and procedures regarding the dissemination of equity research, please visit https://www.credit-suisse.com/sites/disclaimers-ib/en/canada-research-policy.html. Credit Suisse Securities (Europe) Limited (Credit Suisse) acts as broker to (MRW.L). The following disclosed European company/ies have estimates that comply with IFRS: (SBRY.L, MKS.L, AD.AS, CARR.PA, MGNTq.L, MRW.L, PJPq.L, TSCO.L). As of the end of the preceding month, the subject company (CARR.PA) beneficially owned 5% or more of the total issued share capital of Credit Suisse Group. Credit Suisse has acted as lead manager or syndicate member in a public offering of securities for the subject company (GOOGL.OQ, AAPL.OQ, BABA.N, LNTAq.L, WALMEX.MX, WMT.N) within the past 3 years. Principal is not guaranteed in the case of equities because equity prices are variable. Commission is the commission rate or the amount agreed with a customer when setting up an account or at any time after that. I, Tobias Stingelin, CFA, certify that (1) The views expressed in this report solely and exclusively reflect my personal opinions and have been prepared independently, including with respect to Banco de Investimentos Credit Suisse (Brasil) S.A. or its affiliates ("Credit Suisse"). (2) Part of my compensation is based on various factors, including the total revenues of Credit Suisse, but no part of my compensation has been, is, or will be related to the specific recommendations or views expressed in this report. In addition, Credit Suisse declares that: Credit Suisse has provided, and/or may in the future provide investment banking, brokerage, asset management, commercial banking and other financial services to the subject company/companies or its affiliates, for which they have received or may receive customary fees and commissions, and which constituted or may constitute relevant financial or commercial interests in relation to the subject company/companies or the subject securities. This research report is authored by: Credit Suisse Securities (Japan) Limited .................................................................................................................................... Keiichi Yoneshima Credit Suisse (Hong Kong) Limited .......................................................................................................................................................... Evan Zhou Casa de Bolsa Credit Suisse (Mexico), S.A ........................................................................................................................ Antonio Gonzalez, CFA Credit Suisse Securities (USA) LLC ......................................................................................................... Stephen Ju ; Edward J. Kelly, CFA, CPA Credit Suisse Securities (Europe) Limited, Seoul Branch ................................................................................................................ A-Hyung Cho Bank Credit Suisse (Moscow) .................................................................................................................................................... Olga Bystrova, CFA Banco de Investments Credit Suisse (Brasil) SA or its affiliates. ....................................................................................... Tobias Stingelin, CFA Credit Suisse International ................................................................................................................. Stewart McGuire, CFA ; Andre Kukhnin, CFA Credit Suisse Equities (Australia) Limited .......................................................................................................................................... Grant Saligari Credit Suisse Securities (Europe) Limited ....................................................................................................................................... Victoria Petrova To the extent this is a report authored in whole or in part by a non-U.S. analyst and is made available in the U.S., the following are important disclosures regarding any non-U.S. analyst contributors: The non-U.S. research analysts listed below (if any) are not registered/qualified as research analysts with FINRA. The non-U.S. research analysts listed below may not be associated persons of CSSU and therefore may not be subject to the FINRA 2241 and NYSE Rule 472 restrictions on communications with a subject company, public appearances and trading securities held by a research analyst account. Credit Suisse Securities (Japan) Limited .................................................................................................................................... Keiichi Yoneshima Credit Suisse (Hong Kong) Limited .......................................................................................................................................................... Evan Zhou Casa de Bolsa Credit Suisse (Mexico), S.A ........................................................................................................................ Antonio Gonzalez, CFA Credit Suisse Securities (Europe) Limited, Seoul Branch ................................................................................................................ A-Hyung Cho Bank Credit Suisse (Moscow) .................................................................................................................................................... Olga Bystrova, CFA

10 April 2017
Global online grocery 59
Banco de Investments Credit Suisse (Brasil) SA or its affiliates. ....................................................................................... Tobias Stingelin, CFA Credit Suisse International ................................................................................................................. Stewart McGuire, CFA ; Andre Kukhnin, CFA Credit Suisse Equities (Australia) Limited .......................................................................................................................................... Grant Saligari Credit Suisse Securities (Europe) Limited ....................................................................................................................................... Victoria Petrova
Important disclosures regarding companies or other issuers that are the subject of this report are available on Credit Suisse’s disclosure website at https://rave.credit-suisse.com/disclosures or by calling +1 (877) 291-2683.

10 April 2017
Global online grocery 60
This report is produced by subsidiaries and affiliates of Credit Suisse operating under its Global Markets Division. For more information on our structure, please use the following link: https://www.credit-suisse.com/who-we-are This report may contain material that is not directed to, or intended for distribution to or use by, any person or entity who is a citizen or resident of or located in any locality, state, country or other jurisdiction where such distribution, publication, availability or use would be contrary to law or regulation or which would subject Credit Suisse or its affiliates ("CS") to any registration or licensing requirement within such jurisdiction. All material presented in this report, unless specifically indicated otherwise, is under copyright to CS. None of the material, nor its content, nor any copy of it, may be altered in any way, transmitted to, copied or distributed to any other party, without the prior express written permission of CS. All trademarks, service marks and logos used in this report are trademarks or service marks or registered trademarks or service marks of CS or its affiliates.The information, tools and material presented in this report are provided to you for information purposes only and are not to be used or considered as an offer or the solicitation of an offer to sell or to buy or subscribe for securities or other financial instruments. CS may not have taken any steps to ensure that the securities referred to in this report are suitable for any particular investor. CS will not treat recipients of this report as its customers by virtue of their receiving this report. The investments and services contained or referred to in this report may not be suitable for you and it is recommended that you consult an independent investment advisor if you are in doubt about such investments or investment services. Nothing in this report constitutes investment, legal, accounting or tax advice, or a representation that any investment or strategy is suitable or appropriate to your individual circumstances, or otherwise constitutes a personal recommendation to you. CS does not advise on the tax consequences of investments and you are advised to contact an independent tax adviser. Please note in particular that the bases and levels of taxation may change. Information and opinions presented in this report have been obtained or derived from sources believed by CS to be reliable, but CS makes no representation as to their accuracy or completeness. CS accepts no liability for loss arising from the use of the material presented in this report, except that this exclusion of liability does not apply to the extent that such liability arises under specific statutes or regulations applicable to CS. This report is not to be relied upon in substitution for the exercise of independent judgment. CS may have issued, and may in the future issue, other communications that are inconsistent with, and reach different conclusions from, the information presented in this report. Those communications reflect the different assumptions, views and analytical methods of the analysts who prepared them and CS is under no obligation to ensure that such other communications are brought to the attention of any recipient of this report. Some investments referred to in this report will be offered solely by a single entity and in the case of some investments solely by CS, or an associate of CS or CS may be the only market maker in such investments. Past performance should not be taken as an indication or guarantee of future performance, and no representation or warranty, express or implied, is made regarding future performance. Information, opinions and estimates contained in this report reflect a judgment at its original date of publication by CS and are subject to change without notice. The price, value of and income from any of the securities or financial instruments mentioned in this report can fall as well as rise. The value of securities and financial instruments is subject to exchange rate fluctuation that may have a positive or adverse effect on the price or income of such securities or financial instruments. Investors in securities such as ADR's, the values of which are influenced by currency volatility, effectively assume this risk. Structured securities are complex instruments, typically involve a high degree of risk and are intended for sale only to sophisticated investors who are capable of understanding and assuming the risks involved. The market value of any structured security may be affected by changes in economic, financial and political factors (including, but not limited to, spot and forward interest and exchange rates), time to maturity, market conditions and volatility, and the credit quality of any issuer or reference issuer. Any investor interested in purchasing a structured product should conduct their own investigation and analysis of the product and consult with their own professional advisers as to the risks involved in making such a purchase. Some investments discussed in this report may have a high level of volatility. High volatility investments may experience sudden and large falls in their value causing losses when that investment is realised. Those losses may equal your original investment. Indeed, in the case of some investments the potential losses may exceed the amount of initial investment and, in such circumstances, you may be required to pay more money to support those losses. Income yields from investments may fluctuate and, in consequence, initial capital paid to make the investment may be used as part of that income yield. Some investments may not be readily realisable and it may be difficult to sell or realise those investments, similarly it may prove difficult for you to obtain reliable information about the value, or risks, to which such an investment is exposed. This report may provide the addresses of, or contain hyperlinks to, websites. Except to the extent to which the report refers to website material of CS, CS has not reviewed any such site and takes no responsibility for the content contained therein. Such address or hyperlink (including addresses or hyperlinks to CS's own website material) is provided solely for your convenience and information and the content of any such website does not in any way form part of this document. Accessing such website or following such link through this report or CS's website shall be at your own risk.
This report is issued and distributed in European Union (except Switzerland): by Credit Suisse Securities (Europe) Limited, One Cabot Square, London E14 4QJ, England, which is authorised by the Prudential Regulation Authority and regulated by the Financial Conduct Authority and the Prudential Regulation Authority. Germany: Credit Suisse Securities (Europe) Limited Niederlassung Frankfurt am Main regulated by the Bundesanstalt fuer Finanzdienstleistungsaufsicht ("BaFin"). United States and Canada: Credit Suisse Securities (USA) LLC; Switzerland: Credit Suisse AG; Brazil: Banco de Investimentos Credit Suisse (Brasil) S.A or its affiliates; Mexico: Banco Credit Suisse (México), S.A. (transactions related to the securities mentioned in this report will only be effected in compliance with applicable regulation); Japan: by Credit Suisse Securities (Japan) Limited, Financial Instruments Firm, Director-General of Kanto Local Finance Bureau ( Kinsho) No. 66, a member of Japan Securities Dealers Association, The Financial Futures Association of Japan, Japan Investment Advisers Association, Type II Financial Instruments Firms Association; Hong Kong: Credit Suisse (Hong Kong) Limited; Australia: Credit Suisse Equities (Australia) Limited; Thailand: Credit Suisse Securities (Thailand) Limited, regulated by the Office of the Securities and Exchange Commission, Thailand, having registered address at 990 Abdulrahim Place, 27th Floor, Unit 2701, Rama IV Road, Silom, Bangrak, Bangkok10500, Thailand, Tel. +66 2614 6000; Malaysia: Credit Suisse Securities (Malaysia) Sdn Bhd; Singapore: Credit Suisse AG, Singapore Branch; India: Credit Suisse Securities (India) Private Limited (CIN no.U67120MH1996PTC104392) regulated by the Securities and Exchange Board of India as Research Analyst (registration no. INH 000001030) and as Stock Broker (registration no. INB230970637; INF230970637; INB010970631; INF010970631), having registered address at 9th Floor, Ceejay House, Dr.A.B. Road, Worli, Mumbai - 18, India, T- +91-22 6777 3777; South Korea: Credit Suisse Securities (Europe) Limited,
Seoul Branch; Taiwan: Credit Suisse AG Taipei Securities Branch; Indonesia: PT Credit Suisse Securities Indonesia; Philippines:Credit Suisse Securities (Philippines ) Inc., and elsewhere in the world by the relevant authorised affiliate of the above. Additional Regional Disclaimers Hong Kong: Credit Suisse (Hong Kong) Limited ("CSHK") is licensed and regulated by the Securities and Futures Commission of Hong Kong under the laws of Hong Kong, which differ from Australian laws. CSHKL does not hold an Australian financial services licence (AFSL) and is exempt from the requirement to hold an AFSL under the Corporations Act 2001 (the Act) under Class Order 03/1103 published by the ASIC in respect of financial services provided to Australian wholesale clients (within the meaning of section 761G of the Act). Research on Taiwanese securities produced by Credit Suisse AG, Taipei Securities Branch has been prepared by a registered Senior Business Person. Australia (to the extent services are offered in Australia): Credit Suisse Securities (Europe) Limited (“CSSEL”) and Credit Suisse International (“CSI”) are authorised by the Prudential Regulation Authority and regulated by the Financial Conduct Authority (“FCA”) and the Prudential Regulation Authority under UK laws, which differ from Australian Laws. CSSEL and CSI do not hold an Australian Financial Services Licence (“AFSL”) and are exempt from the requirement to hold an AFSL under the Corporations Act (Cth) 2001 (“Corporations Act”) under Class Order 03/1099 published by the Australian Securities and Investments Commission (“ASIC”), in respect of the financial services provided to Australian wholesale clients (within the meaning of section 761G of the Corporations Act). This material is not for distribution to retail clients and is directed exclusively at Credit Suisse's professional clients and eligible counterparties as defined by the FCA, and wholesale clients as defined under section 761G of the Corporations Act. Credit Suisse (Hong Kong) Limited (“CSHK”) is licensed and regulated by the Securities and Futures Commission of Hong Kong under the laws of Hong Kong, which differ from Australian laws. CSHKL does not hold an AFSL and is exempt from the requirement to hold an AFSL under the Corporations Act under Class Order 03/1103 published by the ASIC in respect of financial services provided to Australian wholesale clients (within the meaning of section 761G of the Corporations Act). Credit Suisse Securities (USA) LLC (CSSU) and Credit Suisse Asset Management LLC (CSAM LLC) are licensed and regulated by the Securities Exchange Commission of the United States under the laws of the United States, which differ from Australian laws. CSSU and CSAM LLC do not hold an AFSL and is exempt from the requirement to hold an AFSL under the Corporations Act under Class Order 03/1100 published by the ASIC in respect of financial services provided to Australian wholesale clients (within the meaning of section 761G of the Corporations Act). Malaysia: Research provided to residents of Malaysia is authorised by the Head of Research for Credit Suisse Securities (Malaysia) Sdn Bhd, to whom they should direct any queries on +603 2723 2020. Singapore: This report has been prepared and issued for distribution in Singapore to institutional investors, accredited investors and expert investors (each as defined under the Financial Advisers Regulations) only, and is also distributed by Credit Suisse AG, Singapore Branch to overseas investors (as defined under the Financial Advisers Regulations). Credit Suisse AG, Singapore Branch may distribute reports produced by its foreign entities or affiliates pursuant to an arrangement under Regulation 32C of the Financial Advisers Regulations. Singapore recipients should contact Credit Suisse AG, Singapore Branch at +65-6212-2000 for matters arising from, or in connection with, this report. By virtue of your status as an institutional investor, accredited investor, expert investor or overseas investor, Credit Suisse AG, Singapore Branch is exempted from complying with certain compliance requirements under the Financial Advisers Act, Chapter 110 of Singapore (the “FAA”), the Financial Advisers Regulations and the relevant Notices and Guidelines issued thereunder, in respect of any financial advisory service which Credit Suisse AG, Singapore Branch may provide to you. UAE: This information is being distributed by Credit Suisse AG (DIFC Branch), duly licensed and regulated by the Dubai Financial Services Authority (“DFSA”). Related financial services or products are only made available to Professional Clients or Market Counterparties, as defined by the DFSA, and are not intended for any other persons. Credit Suisse AG (DIFC Branch) is located on Level 9 East, The Gate Building, DIFC, Dubai, United Arab Emirates. EU: This report has been produced by subsidiaries and affiliates of Credit Suisse operating under its Global Markets Division In jurisdictions where CS is not already registered or licensed to trade in securities, transactions will only be effected in accordance with applicable securities legislation, which will vary from jurisdiction to jurisdiction and may require that the trade be made in accordance with applicable exemptions from registration or licensing requirements. Non-US customers wishing to effect a transaction should contact a CS entity in their local jurisdiction unless governing law permits otherwise. US customers wishing to effect a transaction should do so only by contacting a representative at Credit Suisse Securities (USA) LLC in the US. Please note that this research was originally prepared and issued by CS for distribution to their market professional and institutional investor customers. Recipients who are not market professional or institutional investor customers of CS should seek the advice of their independent financial advisor prior to taking any investment decision based on this report or for any necessary explanation of its contents. This research may relate to investments or services of a person outside of the UK or to other matters which are not authorised by the Prudential Regulation Authority and regulated by the Financial Conduct Authority and the Prudential Regulation Authority or in respect of which the protections of the Prudential Regulation Authority and Financial Conduct Authority for private customers and/or the UK compensation scheme may not be available, and further details as to where this may be the case are available upon request in respect of this report. CS may provide various services to US municipal entities or obligated persons ("municipalities"), including suggesting individual transactions or trades and entering into such transactions. Any services CS provides to municipalities are not viewed as "advice" within the meaning of Section 975 of the Dodd-Frank Wall Street Reform and Consumer Protection Act. CS is providing any such services and related information solely on an arm's length basis and not as an advisor or fiduciary to the municipality. In connection with the provision of the any such services, there is no agreement, direct or indirect, between any municipality (including the officials,management, employees or agents thereof) and CS for CS to provide advice to the municipality. Municipalities should consult with their financial, accounting and legal advisors regarding any such services provided by CS. In addition, CS is not acting for direct or indirect compensation to solicit the municipality on behalf of an unaffiliated broker, dealer, municipal securities dealer, municipal advisor, or investment adviser for the purpose of obtaining or retaining an engagement by the municipality for or in connection with Municipal Financial Products, the issuance of municipal securities, or of an investment adviser to provide investment advisory services to or on behalf of the municipality. If this report is being distributed by a financial institution other than Credit Suisse AG, or its affiliates, that financial institution is solely responsible for distribution. Clients of that institution should contact that institution to effect a transaction in the securities mentioned in this report or require further information. This report does not constitute investment advice by Credit Suisse to the clients of the distributing financial institution, and neither Credit Suisse AG, its affiliates, and their respective officers, directors and employees accept any liability whatsoever for any direct or consequential loss arising from their use of this report or its content. Principal is not guaranteed. Commission is the commission rate or the amount agreed with a customer when setting up an account or at any time after that. Copyright © 2017 CREDIT SUISSE AG and/or its affiliates. All rights reserved.
Investment principal on bonds can be eroded depending on sale price or market price. In addition, there are bonds on which investment principal can be eroded due to changes in redemption amounts. Care is required when investing in such instruments. When you purchase non-listed Japanese fixed income securities (Japanese government bonds, Japanese municipal bonds, Japanese government guaranteed bonds, Japanese corporate bonds) from CS as a seller, you will be requested to pay the purchase price only.
Recommended