Cloud Computing Driving Infrastructure Innovation
Intel DCSG
Distinguished Speaker Series
James Hamilton, 2012/9/25
VP & Distinguished Engineer, Amazon Web Services
email: [email protected]
web: mvdirona.com/jrh/work
blog: perspectives.mvdirona.com

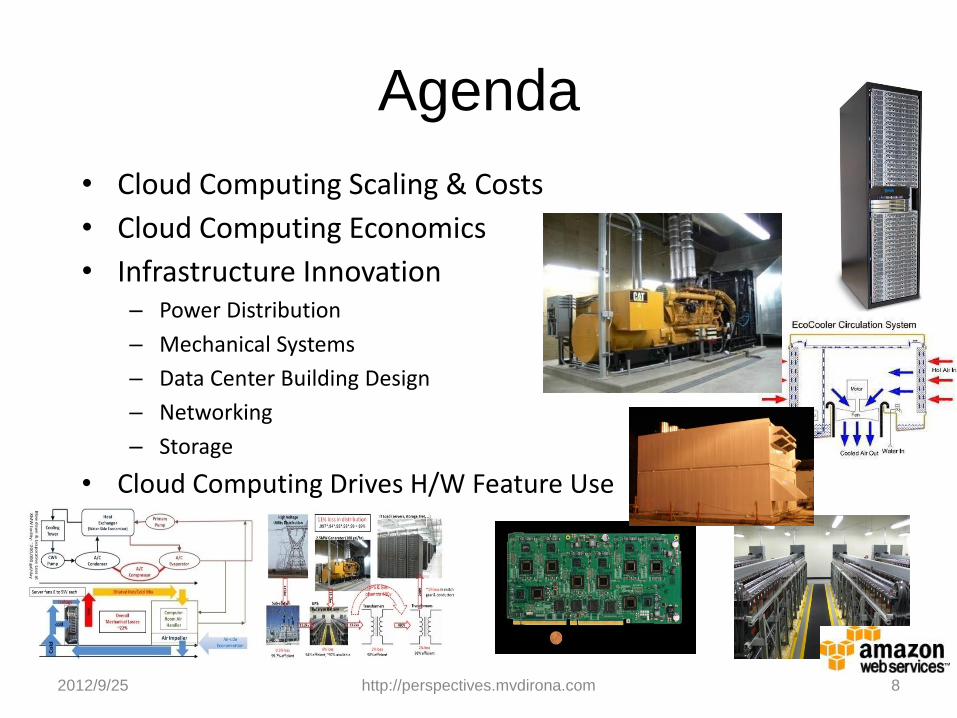
Agenda
• Cloud Computing Scaling & Costs
• Cloud Computing Economics
• Infrastructure Innovation – Power Distribution
– Mechanical Systems
– Data Center Building Design
– Networking
– Storage
• Cloud Computing Drives H/W Feature Use
2 2012/9/25 http://perspectives.mvdirona.com
Pace of Innovation • Datacenter pace of innovation increasing
– More innovation in last 5 years than previous 15
– Driven by cloud service providers and very high-scale internet applications like search
– Cost of infrastructure dominates service cost
– Not just a cost center
• High focus on infrastructure innovation – Driving down cost
– Increasing aggregate reliability
– Reducing resource consumption footprint
2012/9/25 3 http://perspectives.mvdirona.com
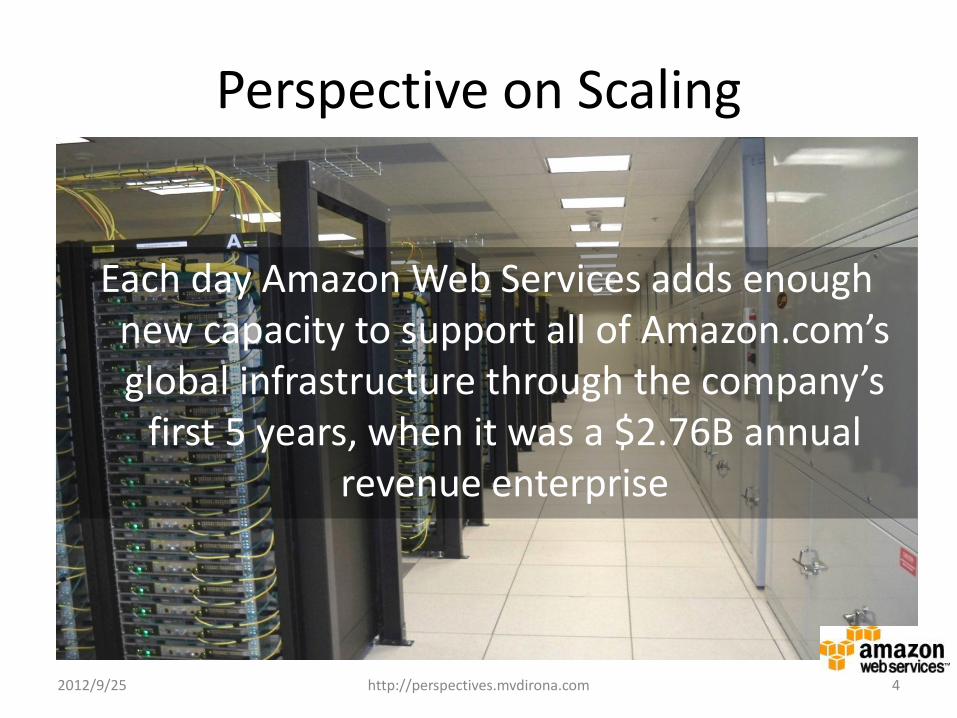
Perspective on Scaling
Each day Amazon Web Services adds enough new capacity to support all of Amazon.com’s global infrastructure through the company’s
first 5 years, when it was a $2.76B annual revenue enterprise
2012/9/25 http://perspectives.mvdirona.com 4
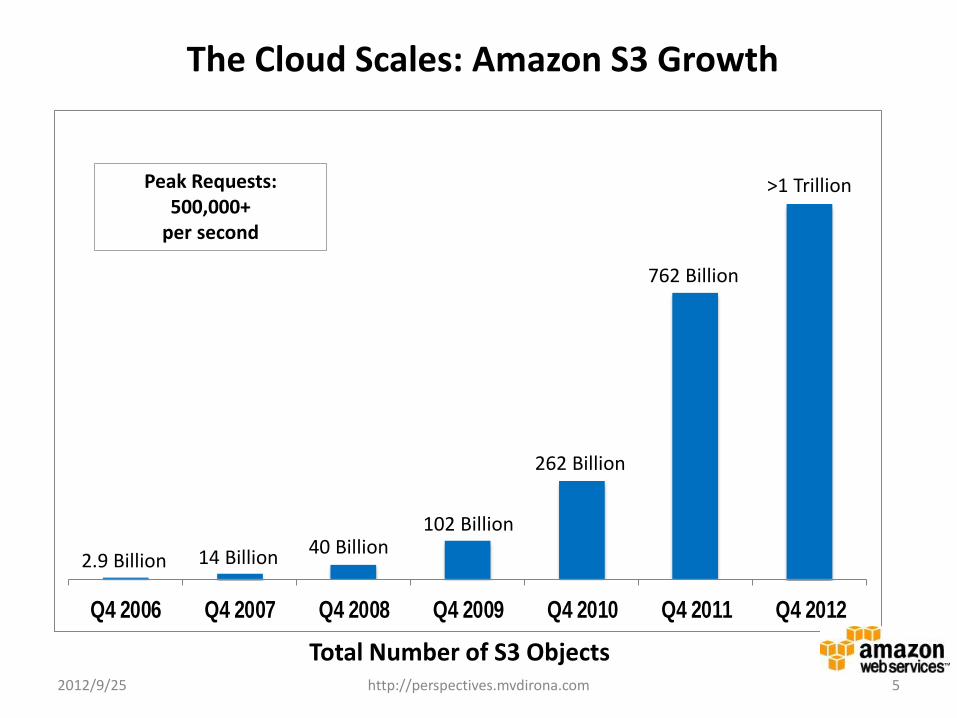
The Cloud Scales: Amazon S3 Growth
Q4 2006 Q4 2007 Q4 2008 Q4 2009 Q4 2010 Q4 2011 Q4 2012
Peak Requests: 500,000+
per second
Total Number of S3 Objects
2.9 Billion 14 Billion 40 Billion 102 Billion
762 Billion
262 Billion
>1 Trillion
2012/9/25 http://perspectives.mvdirona.com 5
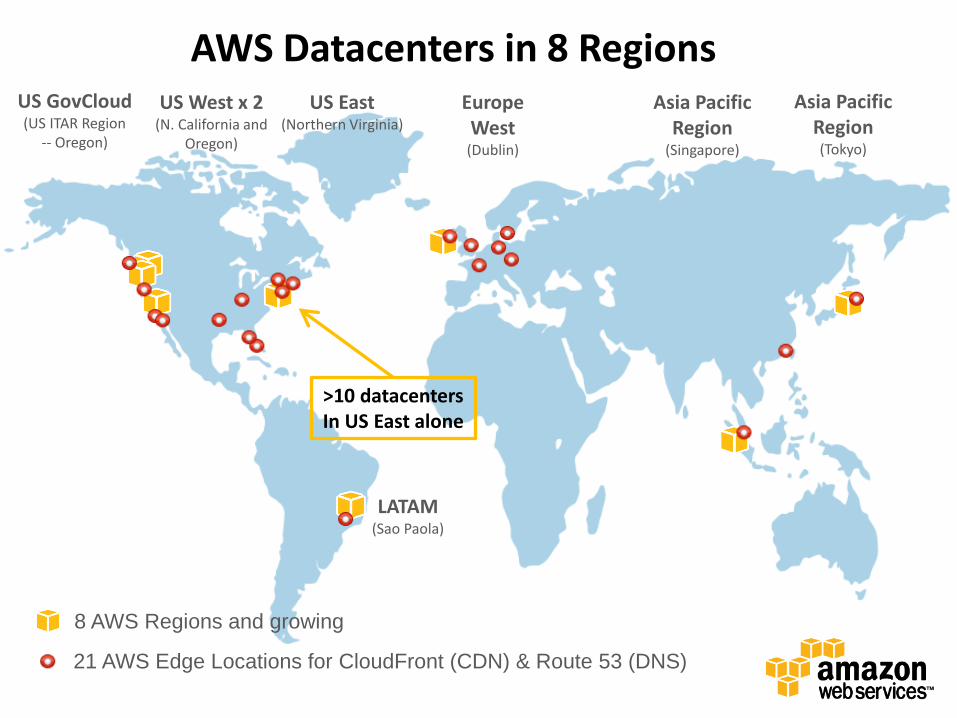
AWS Datacenters in 8 Regions US West x 2
(N. California and Oregon)
US East (Northern Virginia)
Europe West
(Dublin)
Asia Pacific Region
(Singapore)
Asia Pacific Region (Tokyo)
8 AWS Regions and growing
21 AWS Edge Locations for CloudFront (CDN) & Route 53 (DNS)
US GovCloud (US ITAR Region
-- Oregon)
LATAM (Sao Paola)
>10 datacentersIn US East alone
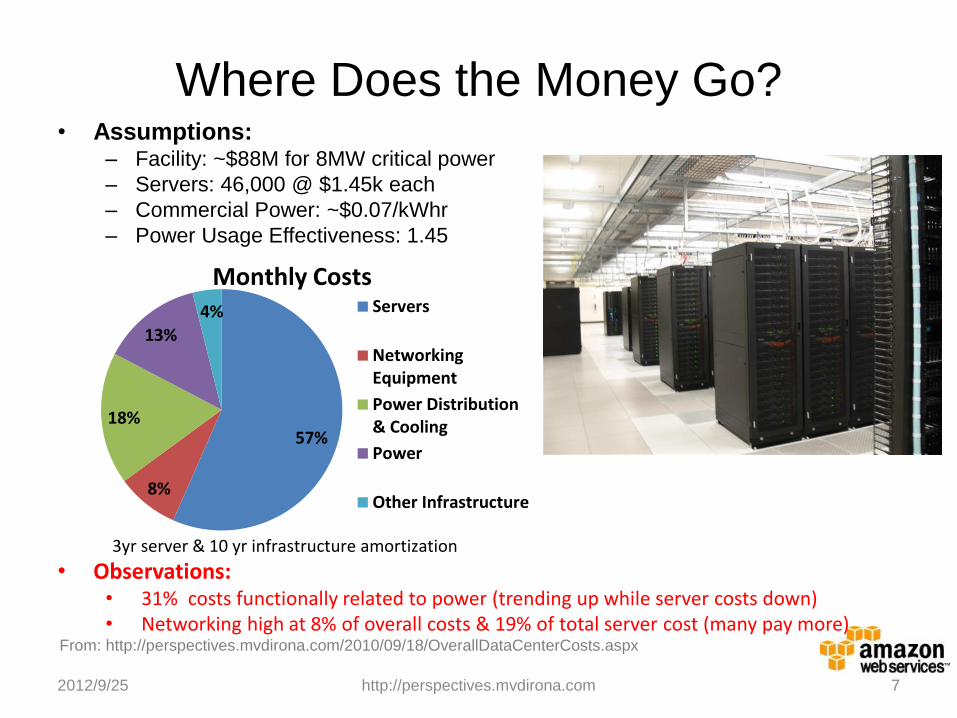
Where Does the Money Go? • Assumptions:
– Facility: ~$88M for 8MW critical power
– Servers: 46,000 @ $1.45k each
– Commercial Power: ~$0.07/kWhr
– Power Usage Effectiveness: 1.45
7 http://perspectives.mvdirona.com
• Observations: • 31% costs functionally related to power (trending up while server costs down) • Networking high at 8% of overall costs & 19% of total server cost (many pay more)
2012/9/25
From: http://perspectives.mvdirona.com/2010/09/18/OverallDataCenterCosts.aspx
57%
8%
18%
13%
4% Servers
NetworkingEquipment
Power Distribution& Cooling
Power
Other Infrastructure
Monthly Costs
3yr server & 10 yr infrastructure amortization
Agenda
• Cloud Computing Scaling & Costs
• Cloud Computing Economics
• Infrastructure Innovation – Power Distribution
– Mechanical Systems
– Data Center Building Design
– Networking
– Storage
• Cloud Computing Drives H/W Feature Use
8 2012/9/25 http://perspectives.mvdirona.com
Utilization & Economics
• Server utilization problem
– 30% utilization VERY good &10% to 20% common
• Expensive & not good for environment
– Solution: pool number of heterogeneous services
• Non-correlated peaks & law of large numbers
• Pay as you go & pay as you grow model
– Don’t block the business
– Don’t over buy
– Transfers capital expense to variable expense
– Apply capital for business investments rather than infrastructure
• Charge back models drive good application owner behavior
– Cost encourages prioritization of work by application developers
– High scale needed to make a market for low priority work
2012/9/25 http://perspectives.mvdirona.com 9
Data Center Efficiency
• Datacenter design efficiency
– Average datacenter efficiency low with PUE over 2.0 (Source: EPA)
• Many with PUE over 3.0
– High-scale cloud services in 1.2 to 1.5 range
– Lowers computing cost & better for environment
• Multiple datacenters
– At scale multiple datacenters can be used
• Close to customer
• Cross datacenter data redundancy
• Address international markets efficiently
• Avoid upfront datacenter cost with years to fully utilize
– Scale supports pervasive automation investment
2012/9/25 http://perspectives.mvdirona.com 10
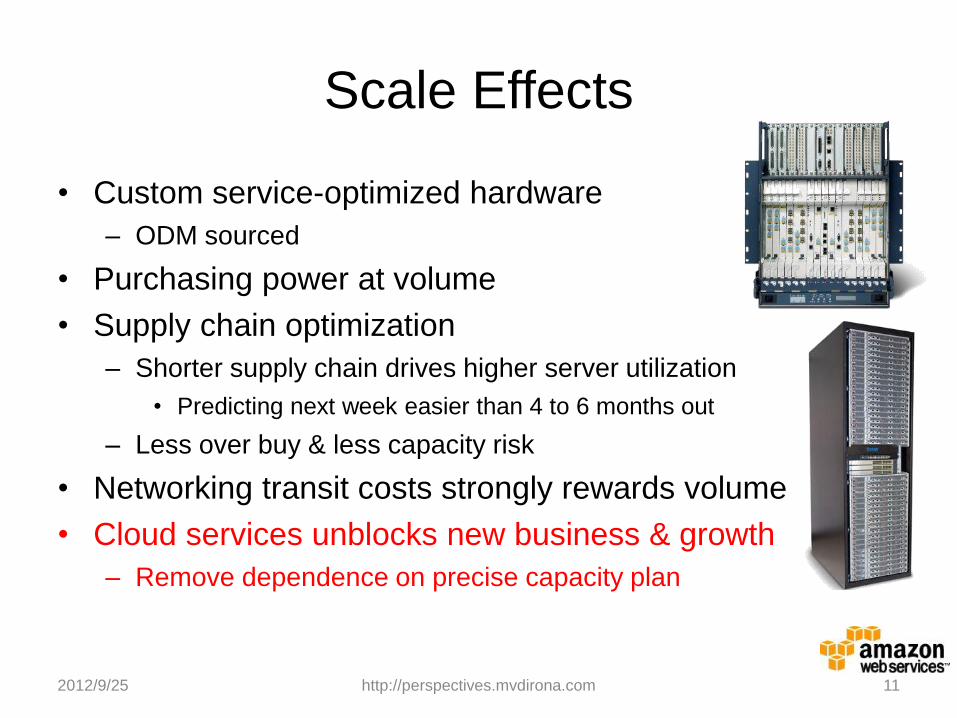
Scale Effects
• Custom service-optimized hardware
– ODM sourced
• Purchasing power at volume
• Supply chain optimization
– Shorter supply chain drives higher server utilization
• Predicting next week easier than 4 to 6 months out
– Less over buy & less capacity risk
• Networking transit costs strongly rewards volume
• Cloud services unblocks new business & growth
– Remove dependence on precise capacity plan
2012/9/25 http://perspectives.mvdirona.com 11
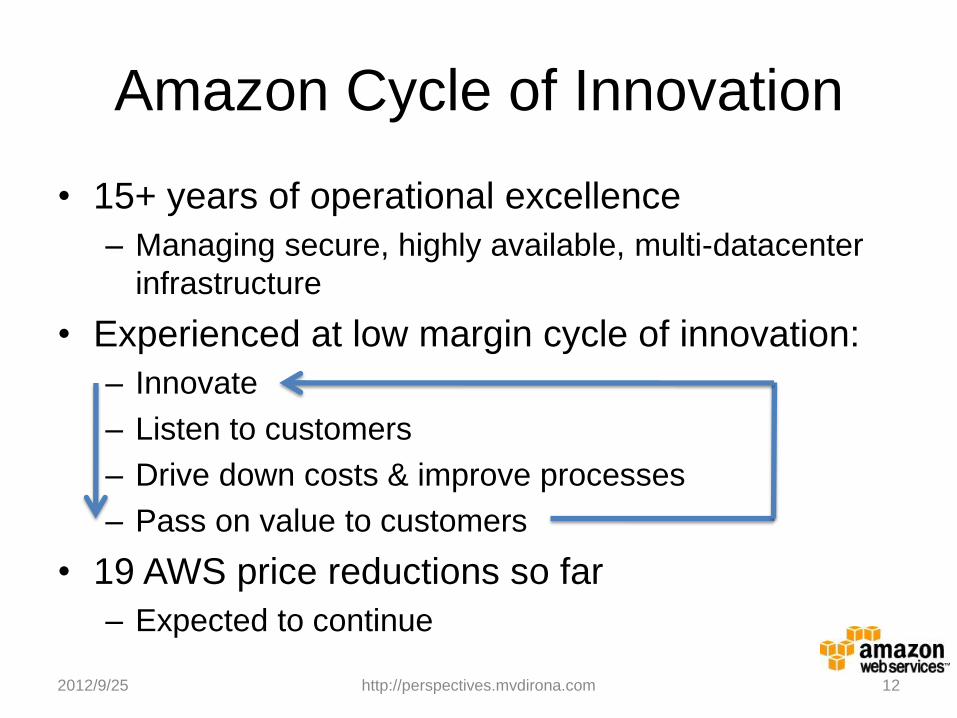
Amazon Cycle of Innovation
• 15+ years of operational excellence
– Managing secure, highly available, multi-datacenter
infrastructure
• Experienced at low margin cycle of innovation:
– Innovate
– Listen to customers
– Drive down costs & improve processes
– Pass on value to customers
• 19 AWS price reductions so far
– Expected to continue
2012/9/25 http://perspectives.mvdirona.com 12

Agenda
• Cloud Computing Scaling & Costs
• Cloud Computing Economics
• Infrastructure Innovation – Power Distribution
– Mechanical Systems
– Data Center Building Design
– Networking
– Storage
• Cloud Computing Drives H/W Feature Use
13 2012/9/25 http://perspectives.mvdirona.com
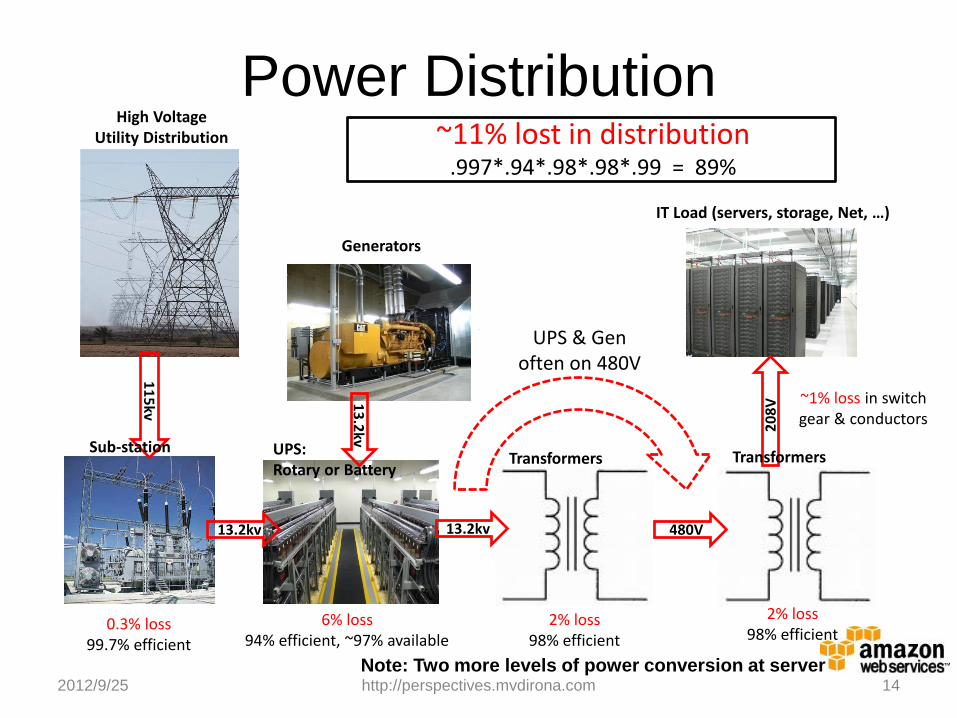
Power Distribution
2012/9/25 http://perspectives.mvdirona.com 14
13.2kv
11
5kv
13
.2kv
13.2kv 480V
20
8V
0.3% loss 99.7% efficient
2% loss 98% efficient
2% loss 98% efficient
6% loss 94% efficient, ~97% available
~1% loss in switch gear & conductors
UPS: Rotary or Battery
Sub-station Transformers Transformers
High Voltage Utility Distribution
IT Load (servers, storage, Net, …)
Generators
~11% lost in distribution .997*.94*.98*.98*.99 = 89%
UPS & Gen often on 480V
Note: Two more levels of power conversion at server
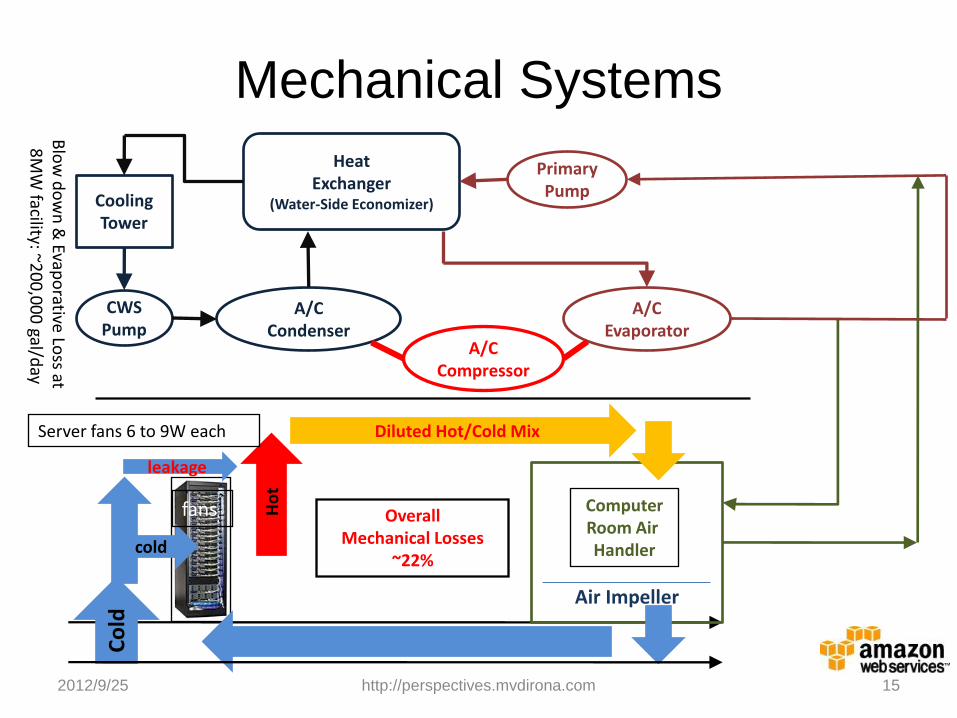
Mechanical Systems
2012/9/25 http://perspectives.mvdirona.com 15
Computer Room Air Handler
Cooling Tower
CWS Pump
Heat Exchanger
(Water-Side Economizer)
A/C Condenser
Primary Pump
A/C Evaporator
leakage
cold
Ho
t
Diluted Hot/Cold Mix
Co
ld
fans
Air Impeller
Server fans 6 to 9W each
Overall Mechanical Losses
~22%
A/C Compressor
Blo
w d
ow
n &
Evapo
rative Loss at
8M
W facility: ~2
00
,00
0 gal/d
ay
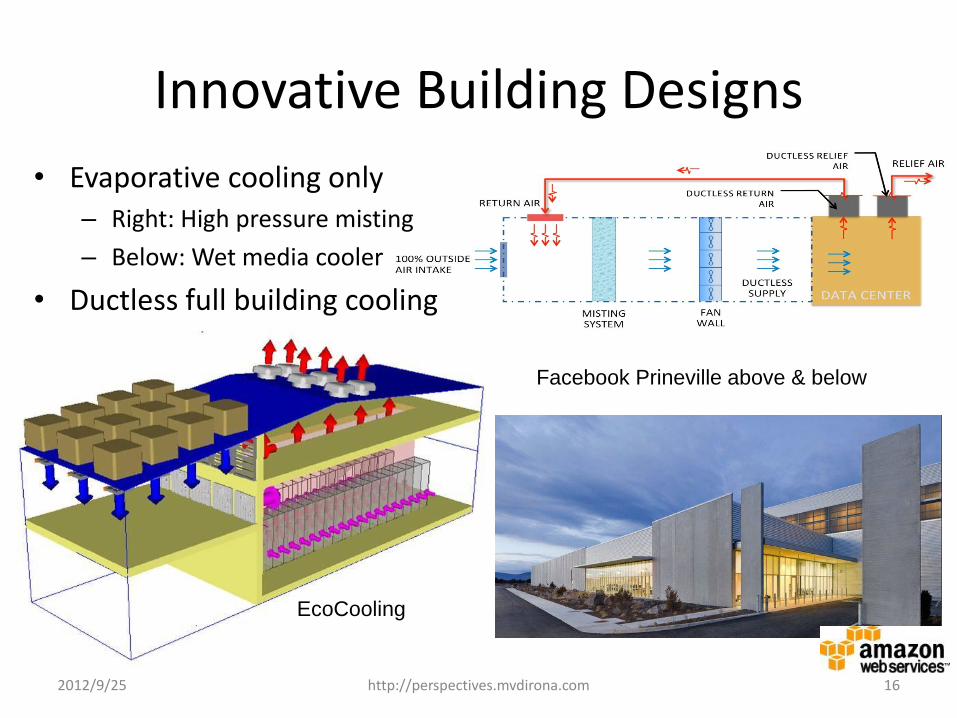
Innovative Building Designs
2012/9/25 http://perspectives.mvdirona.com 16
• Evaporative cooling only – Right: High pressure misting
– Below: Wet media cooler
• Ductless full building cooling
Facebook Prineville above & below
EcoCooling
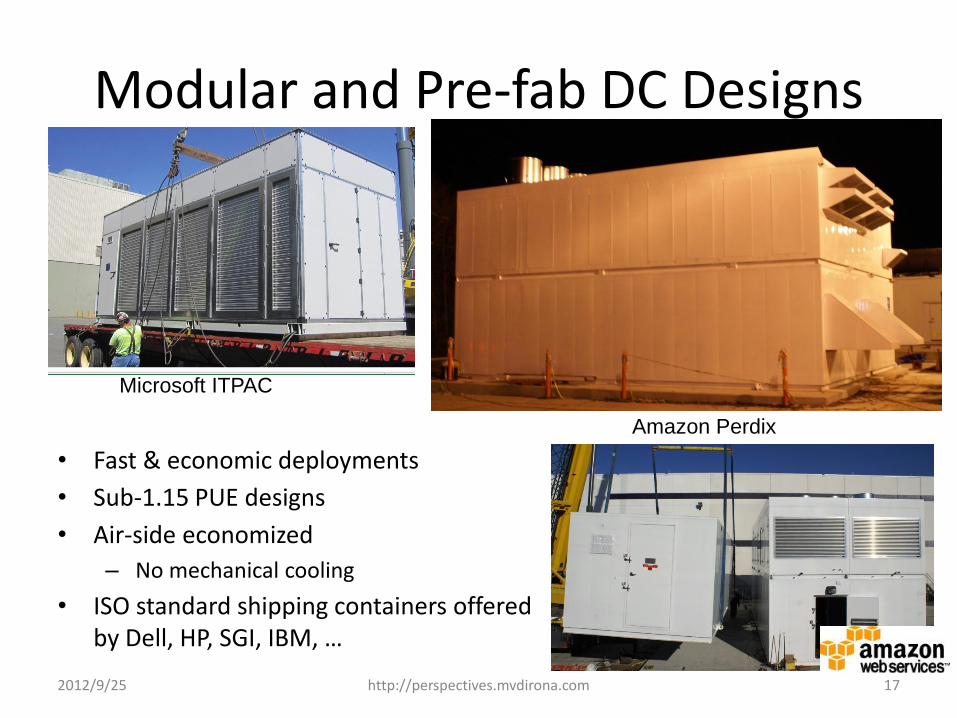
Modular and Pre-fab DC Designs
• Fast & economic deployments
• Sub-1.15 PUE designs
• Air-side economized
– No mechanical cooling
• ISO standard shipping containers offered by Dell, HP, SGI, IBM, …
2012/9/25 http://perspectives.mvdirona.com 17
Microsoft ITPAC
Amazon Perdix
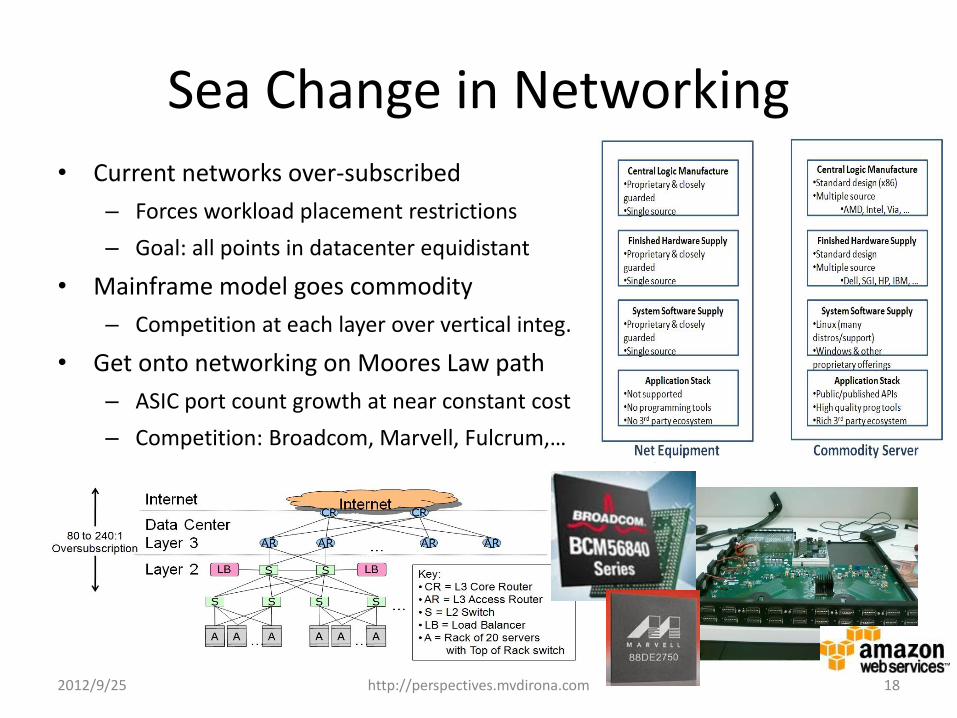
Sea Change in Networking • Current networks over-subscribed
– Forces workload placement restrictions
– Goal: all points in datacenter equidistant
• Mainframe model goes commodity
– Competition at each layer over vertical integ.
• Get onto networking on Moores Law path
– ASIC port count growth at near constant cost
– Competition: Broadcom, Marvell, Fulcrum,…
2012/9/25 http://perspectives.mvdirona.com 18
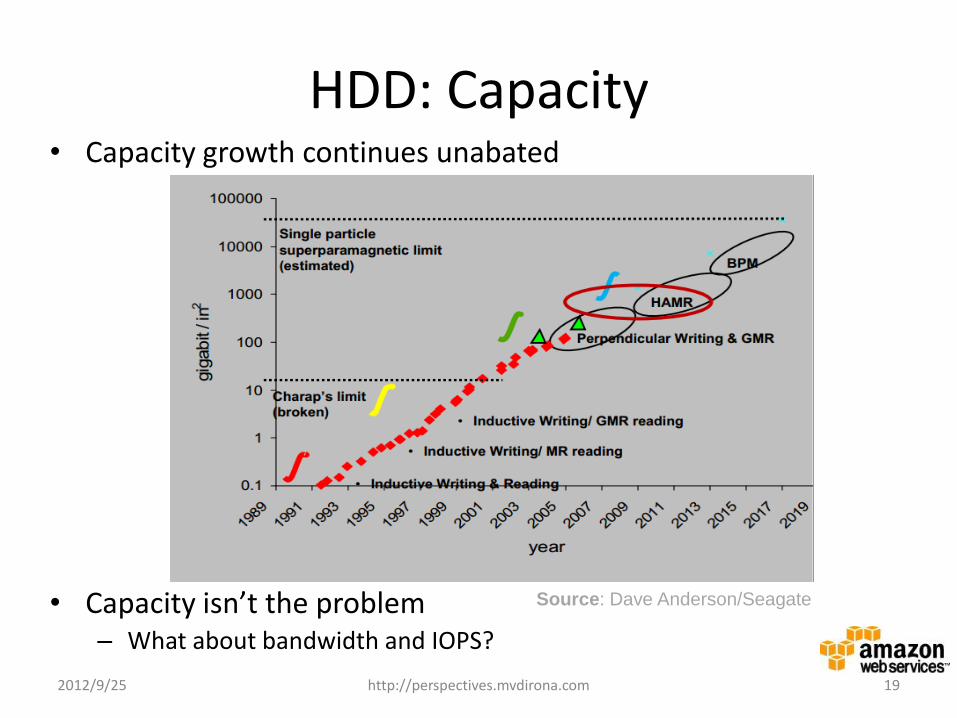
HDD: Capacity • Capacity growth continues unabated
• Capacity isn’t the problem – What about bandwidth and IOPS?
2012/9/25 http://perspectives.mvdirona.com 19
Source: Dave Anderson/Seagate
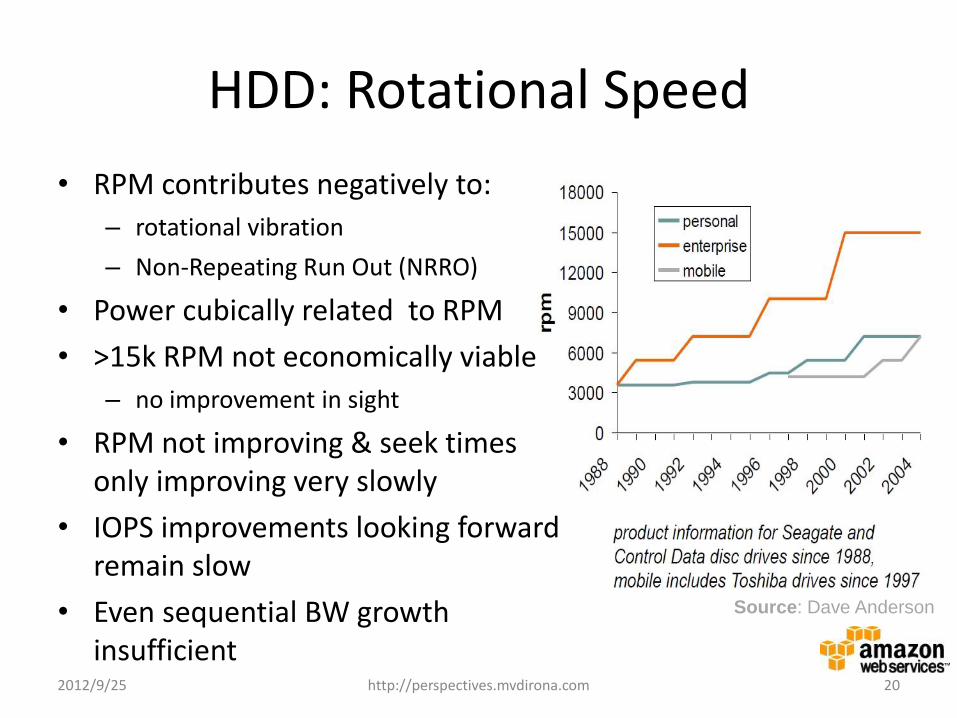
HDD: Rotational Speed
• RPM contributes negatively to:
– rotational vibration
– Non-Repeating Run Out (NRRO)
• Power cubically related to RPM
• >15k RPM not economically viable
– no improvement in sight
• RPM not improving & seek times only improving very slowly
• IOPS improvements looking forward remain slow
• Even sequential BW growth insufficient
2012/9/25 http://perspectives.mvdirona.com 20
Source: Dave Anderson
0
20
40
60
80
100
120
1983 1990 1994 1998 2003 2007
Sequential BW (MB/s)
Random BW (MB/s)
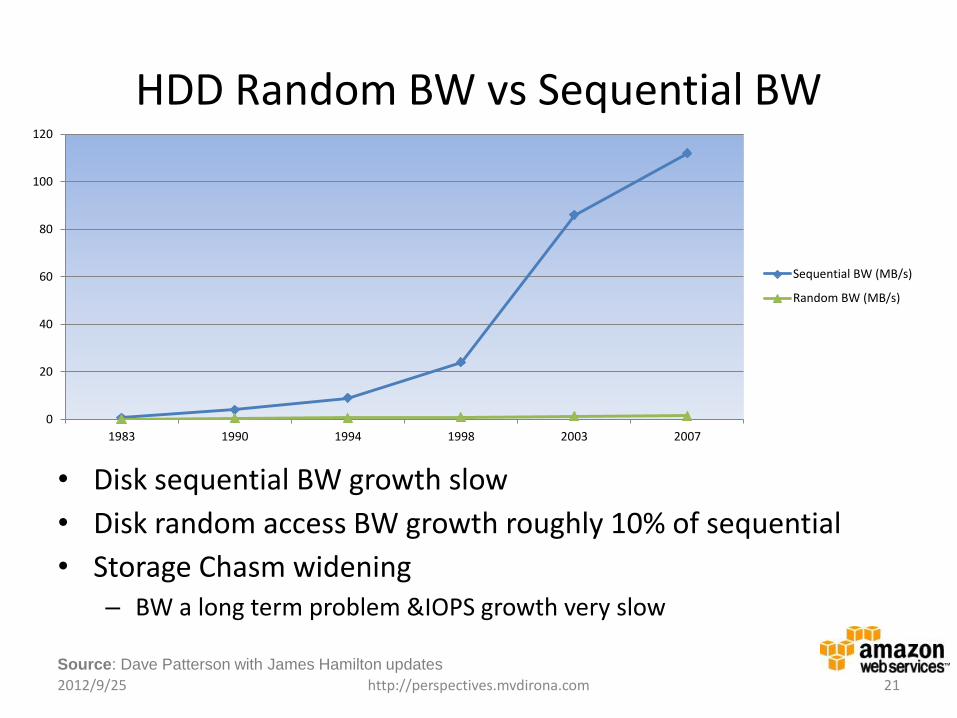
HDD Random BW vs Sequential BW
• Disk sequential BW growth slow
• Disk random access BW growth roughly 10% of sequential
• Storage Chasm widening – BW a long term problem &IOPS growth very slow
2012/9/25 http://perspectives.mvdirona.com 21
Source: Dave Patterson with James Hamilton updates
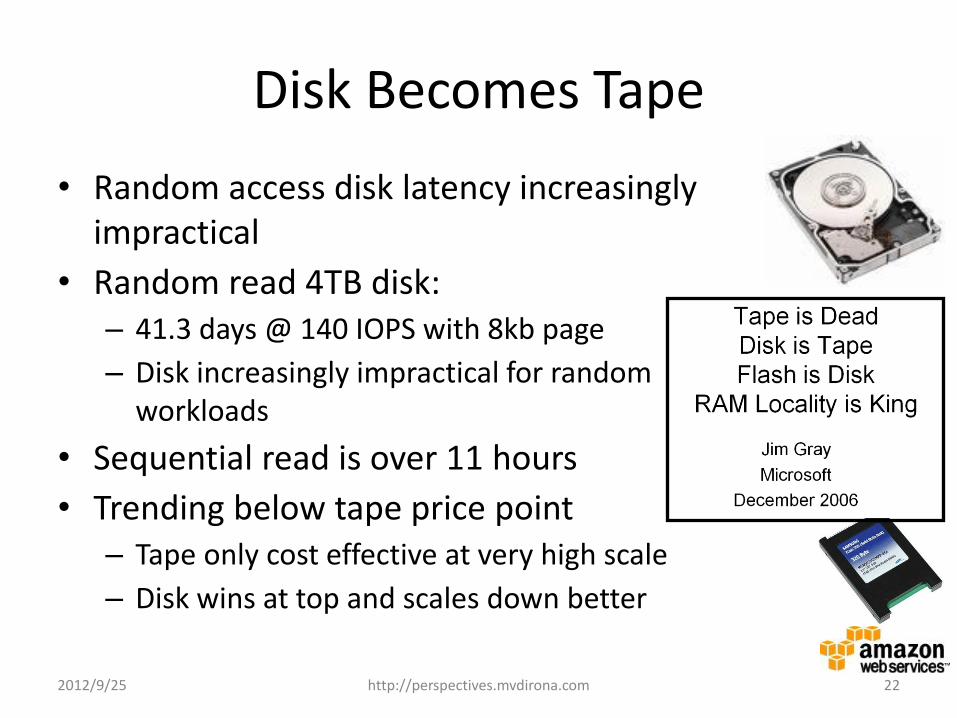
Disk Becomes Tape
• Random access disk latency increasingly impractical
• Random read 4TB disk: – 41.3 days @ 140 IOPS with 8kb page
– Disk increasingly impractical for random workloads
• Sequential read is over 11 hours
• Trending below tape price point – Tape only cost effective at very high scale
– Disk wins at top and scales down better
2012/9/25 http://perspectives.mvdirona.com 22
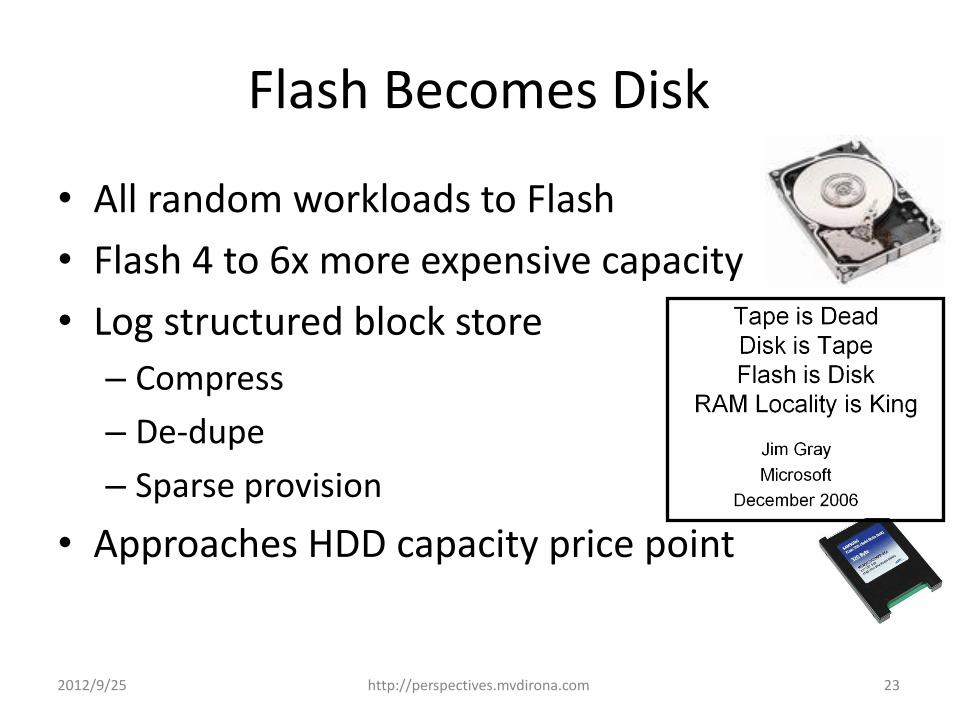
Flash Becomes Disk
• All random workloads to Flash
• Flash 4 to 6x more expensive capacity
• Log structured block store
– Compress
– De-dupe
– Sparse provision
• Approaches HDD capacity price point
2012/9/25 http://perspectives.mvdirona.com 23
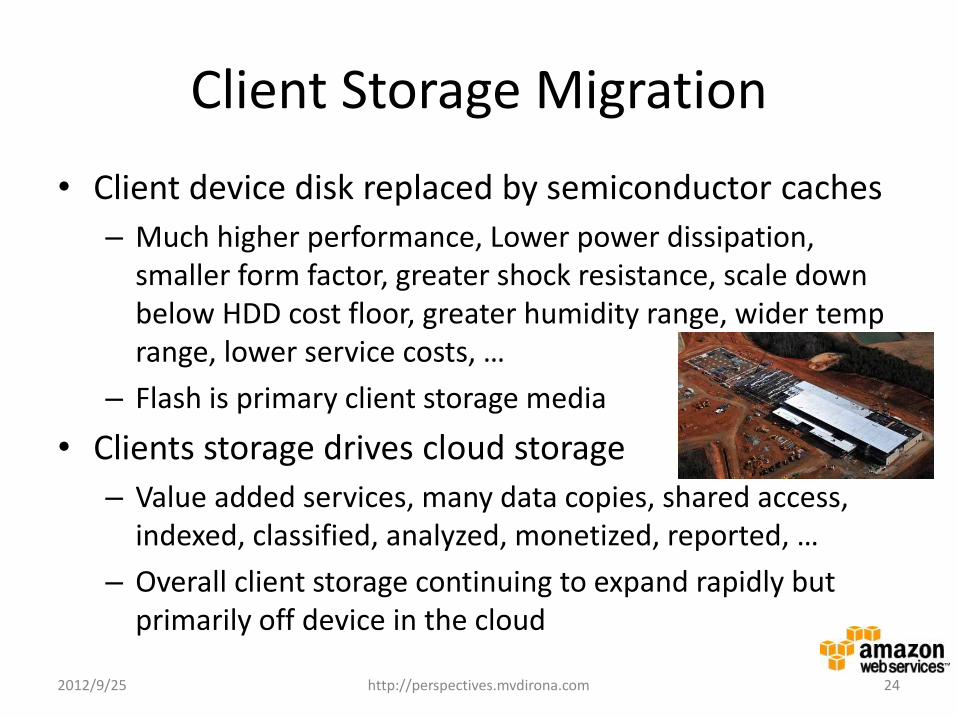
Client Storage Migration
• Client device disk replaced by semiconductor caches
– Much higher performance, Lower power dissipation, smaller form factor, greater shock resistance, scale down below HDD cost floor, greater humidity range, wider temp range, lower service costs, …
– Flash is primary client storage media
• Clients storage drives cloud storage
– Value added services, many data copies, shared access, indexed, classified, analyzed, monetized, reported, …
– Overall client storage continuing to expand rapidly but primarily off device in the cloud
2012/9/25 http://perspectives.mvdirona.com 24
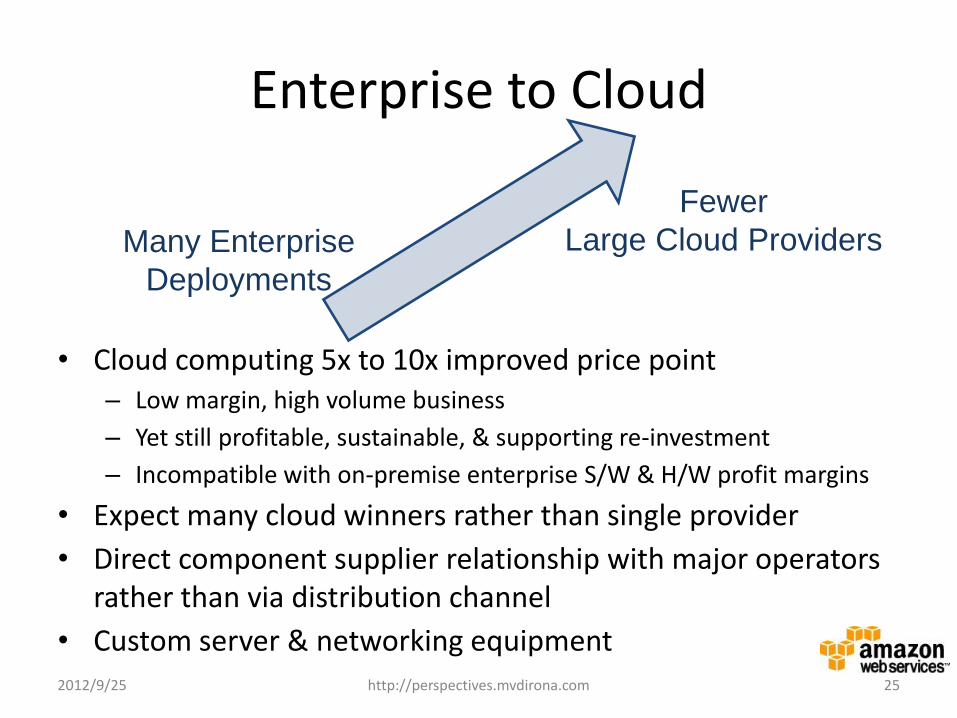
Enterprise to Cloud
• Cloud computing 5x to 10x improved price point – Low margin, high volume business
– Yet still profitable, sustainable, & supporting re-investment
– Incompatible with on-premise enterprise S/W & H/W profit margins
• Expect many cloud winners rather than single provider
• Direct component supplier relationship with major operators rather than via distribution channel
• Custom server & networking equipment 2012/9/25 http://perspectives.mvdirona.com 25
Many Enterprise
Deployments
Fewer
Large Cloud Providers

Agenda
• Cloud Computing Scaling & Costs
• Cloud Computing Economics
• Infrastructure Innovation – Power Distribution
– Mechanical Systems
– Data Center Building Design
– Networking
– Storage
• Cloud Computing Drives H/W Feature Use
26 2012/9/25 http://perspectives.mvdirona.com
Accelerating Compute & Storage Growth
• Rapidly declining cost of computing – Driven by technology improvements & cloud computing
economies of scale
• Traditional transactional systems scale with business – Purchases, ad impressions, pages served, etc.
– Computational trading & machine-to-machine transactions limited only by value of transaction & cost of infrastructure
• Warehousing & analytical systems scale inversely with cost – Cheaper storage allows more data to be analyzed
– Lower compute costs allows deeper analysis
2012/9/25 http://perspectives.mvdirona.com 27
• Perspectives Blog: – http://perspectives.mvdirona.com/
• Email: – [email protected]
Questions?
2012/9/25 28 http://perspectives.mvdirona.com 28
Recommended