Eur. Phys. J. C 6, 413-419 (1999) DOI 10.1007/s100529801026 THE EUROPEAN
PHYSICAL JOURNAL C @ Springer-Verlag 1999
Comparison of strange baryon production at LEP with various models A. Joly 1, J. Gascon 1'2, P. Taras 1
1 Universit~ de Montr6al, CP. 6128 Suceursale Centre Ville, Montreal, PQ H3C 3J7, Canada 2 Present address: CERN, OPAL Collaboration, CH-1211 Geneva 23, Switzerland
Received: 8 April 1998 / Revised version: 27 August 1998 / Published online: 19 November 1998
Abstract. The strange baryon production rates measured at LEP are compared to several models: isospin, LPHD, QCM, JETSET, HEaW~C and MOPS. In particular, the parameters of the new MOPS model are adjusted in an attempt to reproduce the spin and strangeness dependence of the observed rates.
1 Introduction
Our current understanding of baryon production is based on phenomenological models.
In this paper, the results obtained in e+e - collisions at LEP will be compared with the different models available. They fall into two categories: 1- Simple models expressed in terms of physical observables. 2- More complex models which a t tempt to describe the fragmentation process and make use of Monte-Carlo simulation techniques.
Since combining the results of all 4 experiments at LEP is a complex process, we are presenting here only studies limited mainly to the results obtained with the OPAL de- tector. Comparing the models to other LEP results does not lead to any substantial difference in our conclusions. Recently, the JETSET code has been modified to probe the production of baryons in Z ~ decays. In our work some parameters of this modified code, the MOdified Popcorn Scenarium (MOPS [1]), will be adjusted in an a t tempt to reproduce the spin and strangeness dependence of the observed rates.
2 Model predictions and measured baryon production rates
2.1 Simple models: isospin, LPHD and QCM
(i) The first of these models is based on the isospin conservation principle [2]. In case of baryon production, it predicts that the average baryon and anti-baryon multi- plicity per hadronic Z ~ decay < n > is given in terms of the spin J, isospin I and mass M of the observed baryon:
2I + 1 aexp(_bM2) (1) < n > - 2J+~1
The two free parameters a and b are fitted to the data. At LEP, their values were deduced to be [3]: a = 10.4 -4- 0.2 and b = 3.78 + 0.02 (GeV/c2) -z.
In the context of this model, it is clear that the baryon production rate must decrease as the spin increases. In ad- dition, because the strange quark mass is about ten times that of the u or d quark mass, the production of baryons with a greater number of strange quarks will be reduced. These simple predictions are in good agreement with the results given in Table 1 and shown in Fig. 1. A particularly appropriate test of this model is the production rate of the ~ + , ~0 and Z - baryons since they all have identical mass, spin and isospin. Within experimental errors, their production rates are indeed the same. It should be noted that the prediction rate for the direct production of the ~F baryons is only 0.066 baryon/event. However this does not take into account the ~ baryons produced by heavier particle decays. When this is done using JETSET, the real production rate prediction is then 0.088 baryon/event in good agreement with the measured rates given in Table 1.
(ii) The second simple model is based on the Local Parton Hadron Duality (LPHD [4]) principle. This princi- ple assumes that the hadron momentum distribution re- flects directly the initial parton momentum distribution, with no impact from the fragmentation process. Based on this assumption, the shape of the momentum distribution of any baryon can be calculated [5] at any energy in e+e - collisions. It is given by:
de [ln ( Ecm "~ d~ - 1 + o~s~ \2A~f i / - ~] (2)
where the variable ~ = ln(1/Xp) is related to the baryon momentum by Xp = Pba~yon/Pc,~, as is the strong cou- pling constant, E~m is the center of mass energy, A~II the parton shower energy cutoff is a function of the baryon mass (A~ff ~ 1 GeV) and k is a parameter describing the coherent (k = 1) or incoherent (k -- 2) nature of the gluon emission during the shower development.
414 A. Joly et al.: Comparison of strange baryon production at LEP with various models
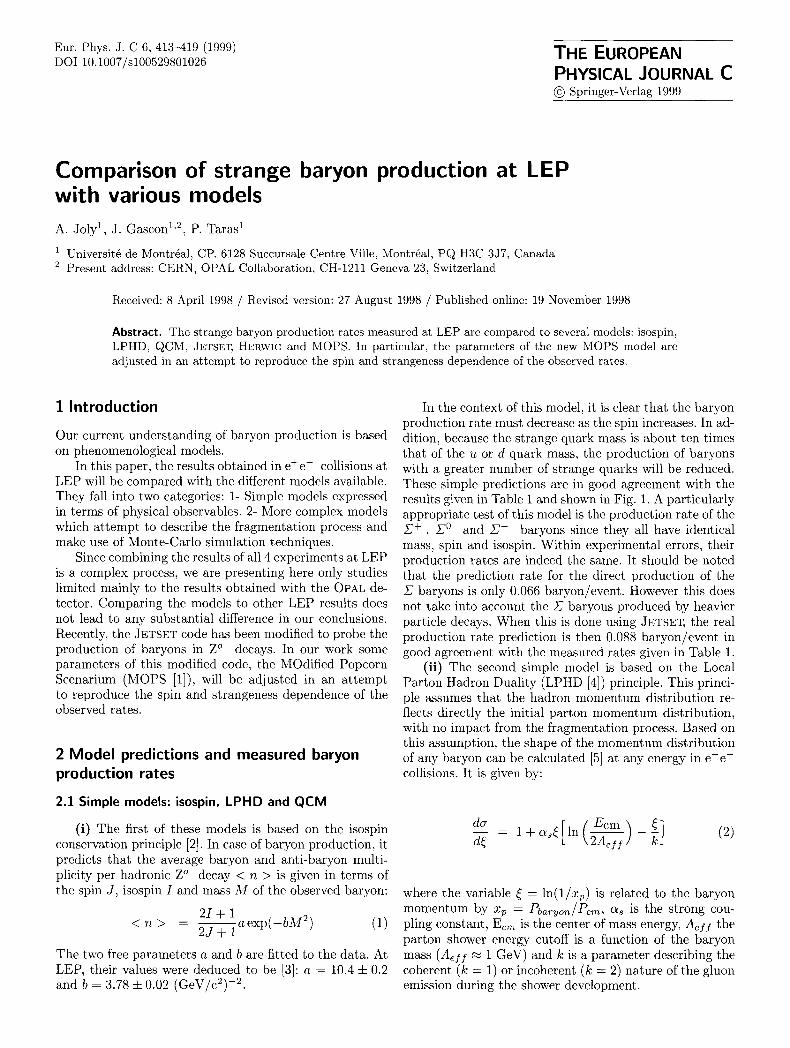
Table 1. Production rates (number of particles per event) of different strange baryons measured [12] with the OPAL detector in e+e - collisions at 91 GeV center of mass energy. Predictions are from the, MOPS, JETSET7.4, HERWIGS.9 and QCM generators (* are not used in the X 2 calculation process)
OPAL Models predictions Particle Spin Isospin Quarks data MOPS JetSet7.4 Herwig5.9 Q.C.M nch - - - - - - 20.92 • 0.13 21.39" 21.0" 21.5" - - p 1/2 1/2 (uud) 0.92 4- 0.11 0.85 1.20 0.83 0.83
A 1/2 0 (uds) 0.374 + 0.010 0.363 0.385 0.351 0.379 Z + 1/2 1 (uus) 0.102 + 0.010 0.086 0.072 0.072 0.112 •o 1/2 1 (uds) 0.071 4- 0.018 0.084 0.073 0.056 0.116 E'- 1/2 1 (dds) 0.083 4- 0.011 0.079 0.067 0.060 0.106 _=- 1/2 1/2 (dss) 0.0259 4- 0.0011 0.031 0.0274 0.0381 0.0203
~*+ 3/2 1 (uus) 0.0239 4- 0.0015 0.034 0.0381 0.0625 0.0387 ~ * - 3/2 1 (dds) 0.0240 4- 0.0017 0.032 0.0359 0.0574 0.0387 ~,o 3/2 1/2 (uss) 0.0068 4- 0.0007 0.0069 0.0054 0.0146 0.0059 .Q- 3/2 0 (sss) 0.0018 4- 0.0004 0.0010 0.0007 0.0039 0.0036 X~/IO 6.8 9.5 12.9 20.5
+
x z
10
10
10
" ' " ' " " ' " ' " " i ' / l j
" ' . . 0
�9 . . . A ++
""" t A I ' " "'"'" E"
Z + O,
x~ I~,. Z" Z*+
OPAL Data
' , F(M 2) = a.exp(-b M 2)
�9 a=,0.4, b=3.78
A
+ "'"., ,r
~*o'"'.,..
"'"""'t",,
l l l , l , i ~ l , , l i l , l , l i l . . I I . . I . ,
,.2 ,.4 ,.6 1.8 2 2.2 2.4 2.6 2.8 3 Mass 2 (GeV/c2) 2
X.p
3.5
2.5
1.5
" . . . . ' . . . . ' . . . . ' . . . . ' . . . . ' . . . . " ' ( b ) -
P
. . . . . . ,_ A
", F(M) = e (a" bM)
", a=1.39, b=0.33
~ OPAL and DELPHI Data
)2(1385) +
. . . . . . . . . . . . i E(1530) ~
A(1520)
Z +
, I , , , , I , , , , I , , , , I , , , , I , , , , I , , , , I , , , , 0.9 , , .1 1.2 1.3 , .4 1.5 , .6
Mass (GeV/J
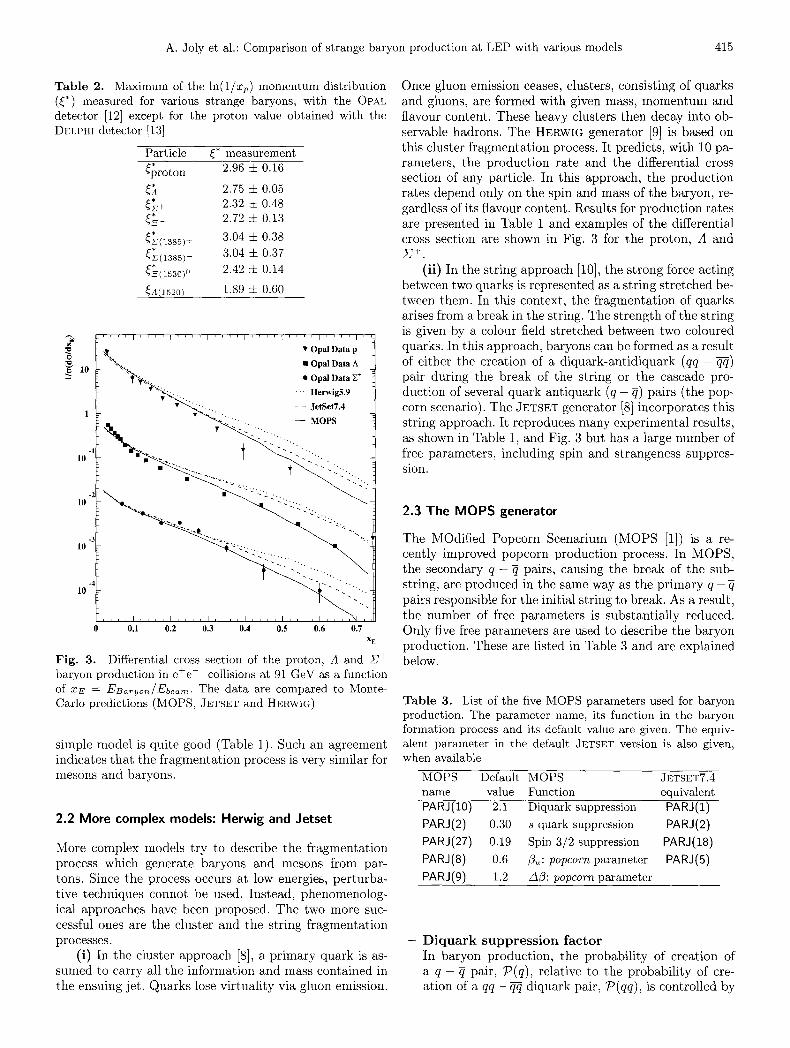
Fig. 1. Strange baryon production rate as a function of the baryon mass compared to a model based on the isospin con- servation principle
Fig. 2. Maximum of the ln(1/x~) distribution, {*, as a func- tion of the baryon mass showing the expected dependence of the LPHD hypothesis. The data were collected with the OPAL detector [12] and the DELPHI detector [13]
The differential cross section of (2) has a max imum at the value {* [4]:
k (Ucm = 71n \ 2A~i i / (3)
This max imum is related to the baryon mass via the pa- rameter Aeff with the result tha t heavier baryons have
(4) which give the number of mesons M and baryons B:
{ M ( N ) = a X + b
B(N) - ( 1 - a ) N _ b 3 3
(4)
where N (N _> 3) is the number of par tons available at harder m o m e n t u m spectra. This predict ion is in good agree- the end of the f ragmenta t ion process given by the JETSET ment with the results presented in Table 2 and Fig. 2. generator [7]. The two free parameters a and b (parti-
(iii) The fundamenta l hypothesis of the Quark Com- t ies /event) were determined to have values of a = 0.66 bination Model (QCM [6]) is t ha t the product ion process and b = 0.56 for meson product ion at LEP. The agreement is the same for mesons and baryons. It leads to relations between the measured values and the predictions of this
A. Joly et al.: Comparison of strange baryon production at LEP with various models 415
Table 2. Maximum of the ln(1/xp) momentum distribution (~*) measured for various strange baryons, with the OPAL detector [12] except for the proton value obtained with the DELPHI detector [13]
Particle ~* measurement ~proton 2.96 • 0.16
~ 2.75 • 0.05 ~r+ 2.32 • 0.48 ~*_ 2.72 • 0.13
~(13s5)+ 3.04 • 0.38
C E'(1385)- 3.04 • 0.37 ~*(1530)0 2.42 • 0.14
~A(1520) 1.89 • 0.60
"~ �9 Opal Data p
"~ % " Opal Data A
�9 . I Opal Data Z +
�9 " ~ . . . . . He rwig5 9 �9 ' . . . �9 ~ . . . . . - - JetSetT.4
1 - "~"~'~-~ . . . . . . . - - M O P S
~ m ~.~. ~ ~' ~ ~ ~ ' . . . .
~ ' . . . ..... 1 0 " 1 - t " " " i 'm'i 'm . . . . . . .
�9 " . . . . . . . . . t " ' - - ....
10 [ " ' . " " . .
~ , ,~ i , , , , i , ~ , ~ 1 , , , , i , , ~ , i , ~ ~ , " 0 0.1 0.2 0.3 0.4 0.5 0.6 0.7
x E
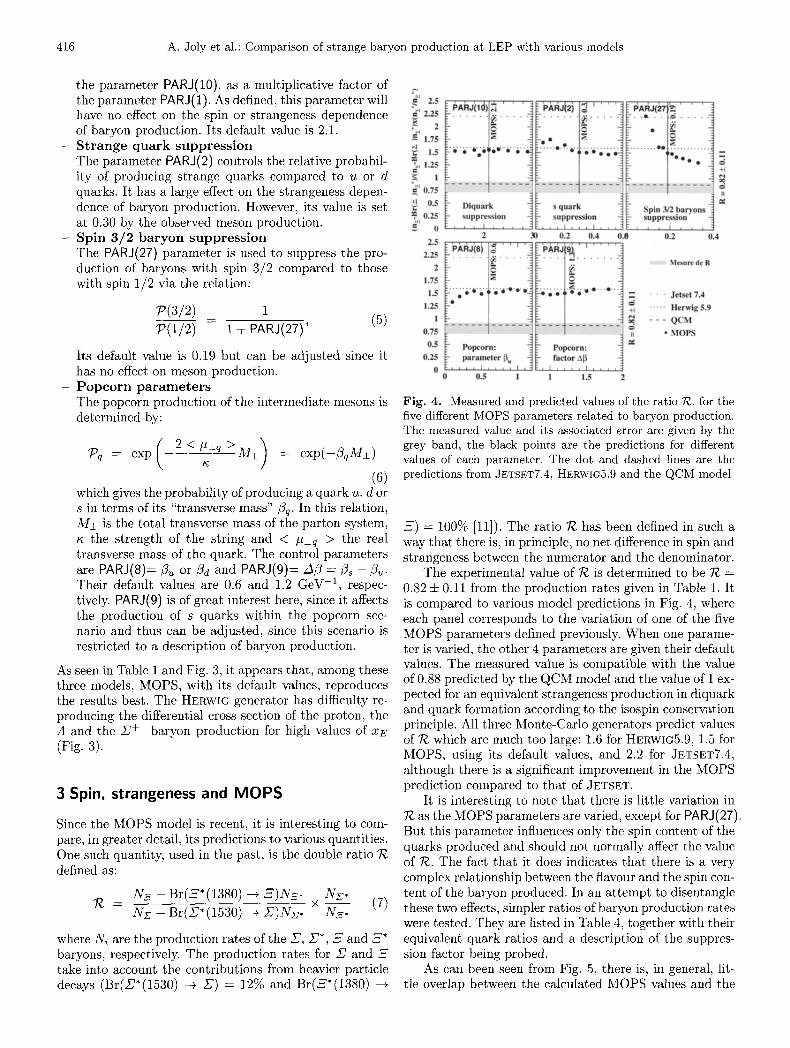
Fig. 3. Differential cross section of the proton, A and ~+ baryon production in e+e - collisions at 91 GeV as a function of XE = EBa~yo~/Eb . . . . . The data are compared to Monte- Carlo predictions (MOPS, JETSET and HERWIG)
simple model is quite good (Table 1). Such an agreement indicates that the fragmentation process is very similar for mesons and baryons.
2.2 More complex models: Herwig and Jetset
More complex models try to describe the fragmentation process which generate baryons and mesons from par- tons. Since the process occurs at low energies, perturba- tive techniques connot be used. Instead, phenomenolog- ical approaches have been proposed. The two more suc- cessful ones are the cluster and the string fragmentation processes.
(i) In the cluster approach [8], a primary quark is as- sumed to carry all the information and mass contained in the ensuing jet. Quarks lose virtuality via gluon emission.
Once gluon emission ceases, clusters, consisting of quarks and gluons, are formed with given mass, momentum and flavour content. These heavy clusters then decay into ob- servable hadrons. The HERWlG generator [9] is based on this cluster fragmentation process. It predicts, with 10 pa- rameters, the production rate and the differential cross section of any particle. In this approach, the production rates depend only on the spin and mass of the baryon, re- gardless of its flavour content. Results for production rates are presented in Table 1 and examples of the differential cross section are shown in Fig. 3 for the proton, A and Z +"
(ii) In the string approach [10], the strong force acting between two quarks is represented as a string stretched be- tween them. In this context, the fragmentation of quarks arises from a break in the string. The strength of the string is given by a colour field stretched between two coloured quarks. In this approach, baryons can be formed as a result of either the creation of a diquark-antidiquark (qq - ~-~) pair during the break of the string or the cascade pro- duction of several quark-antiquark ( q - q) pairs (the pop- corn scenario). The JETSET generator [8] incorporates this string approach. It reproduces many experimental results, as shown in Table 1, and Fig. 3 but has a large number of free parameters, including spin and strangeness suppres- sion.
2.3 The MOPS generator
The MOdified Popcorn Scenarium (MOPS [1]) is a re- cently improved popcorn production process. In MOPS, the secondary q - ~ pairs, causing the break of the sub- string, are produced in the same way as the primary q - pairs responsible for the initial string to break. As a result, the number of free parameters is substantially reduced. Only five free parameters are used to describe the baryon production. These are listed in Table 3 and are explained below.
Table 3. List of the five MOPS parameters used for baryon production. The parameter name, its function in the baryon formation process and its default value are given. The equiv- alent parameter in the default JETSET version is also given, when available
MOPS Default MOPS JETSET7.4 name value Function equivalent PAR J(10) 2.1 Diquark suppression PAR J(1)
PAR J(2) 0.30 s quark suppression PAR J(2)
PAR J(27) 0.19 Spin 3/2 suppression PARJ(18)
PAR J(8) 0.6 ~ : popcorn parameter PAR J(5) PAR J(9) 1.2 A~: popcorn parameter
- D i q u a r k s u p p r e s s i o n f a c t o r
In baryon production, the probability of creation of a q - ~ pair, P(q), relative to the probability of cre- ation of a q q - q~ diquark pair, P(qq ) , is controlled by
416 A. Joly et al.: Comparison of strange baryon production at LEP with various models
the parameter PAR J(10), as a multiplicative factor of the parameter PAR J(1). As defined, this parameter will have no effect on the spin or strangeness dependence of baryon production. Its default value is 2.1.
- S t r a n g e q u a r k s u p p r e s s i o n The parameter PAR J(2) controls the relative probabil- ity of producing strange quarks compared to u or d quarks. It has a large effect on the strangeness depen- dence of baryon production. However, its value is set at 0.30 by the observed meson production.
- Spin 3 / 2 b a r y o n s u p p r e s s i o n The PAR J(27) parameter is used to suppress the pro- duction of baryons with spin 3/2 compared to those with spin 1/2 via the relation:
7~(3/2) 1 - (5)
P(1 /2) 1 + PARJ(27)'
Its default value is 0.19 but can be adjusted since it has no effect on meson production.
- P o p c o r n p a r a m e t e r s The popcorn production of the intermediate mesons is determined by:
( 2 < # • 1 7 7 = ,,q exp(-/Sq~J• e x p \ /g /
(6) which gives the probability of producing a quark u, d or s in terms of its "transverse mass" ~q. In this relation, M• is the total transverse mass of the parton system,
the strength of the string and < #2q ) the real transverse mass of the quark. The control parameters are PAR J(8)= fl~ or fig and PARJ(9)= Aft = fls - fl~,. Their default values are 0.6 and 1.2 GeV - l , respec- tively. PAR J(9) is of great interest here, since it affects the production of s quarks within the popcorn sce- nario and thus can be adjusted, since this scenario is restricted to a description of baryon production.
As seen in Table 1 and Fig. 3, it appears that, among these three models, MOPS, with its default values, reproduces the results best. The HERWIG generator has difficulty re- producing the differential cross section of the proton, the A and the ~P+ baryon production for high values of xE (Fig. 3).
3 Spin, strangeness and MOPS
Since the MOPS model is recent, it is interesting to com- pare, in greater detail, its predictions to various quantities. One such quantity, used in the past, is the double ratio 74 defined as:
74 = N=_ - Br(E*(1380) ~ ~ ) N = . • __Nx* (7) Nx - Br(~*(1530) --+ E ) N x . N--.
where Ni are the production rates of the ~, s ~ and ~* baryons, respectively. The production rates for 2' and E take into account the contributions from heavier particle decays (Br(~*(1530) -+ ~ ) = 12% and Br(~*(1380) --+
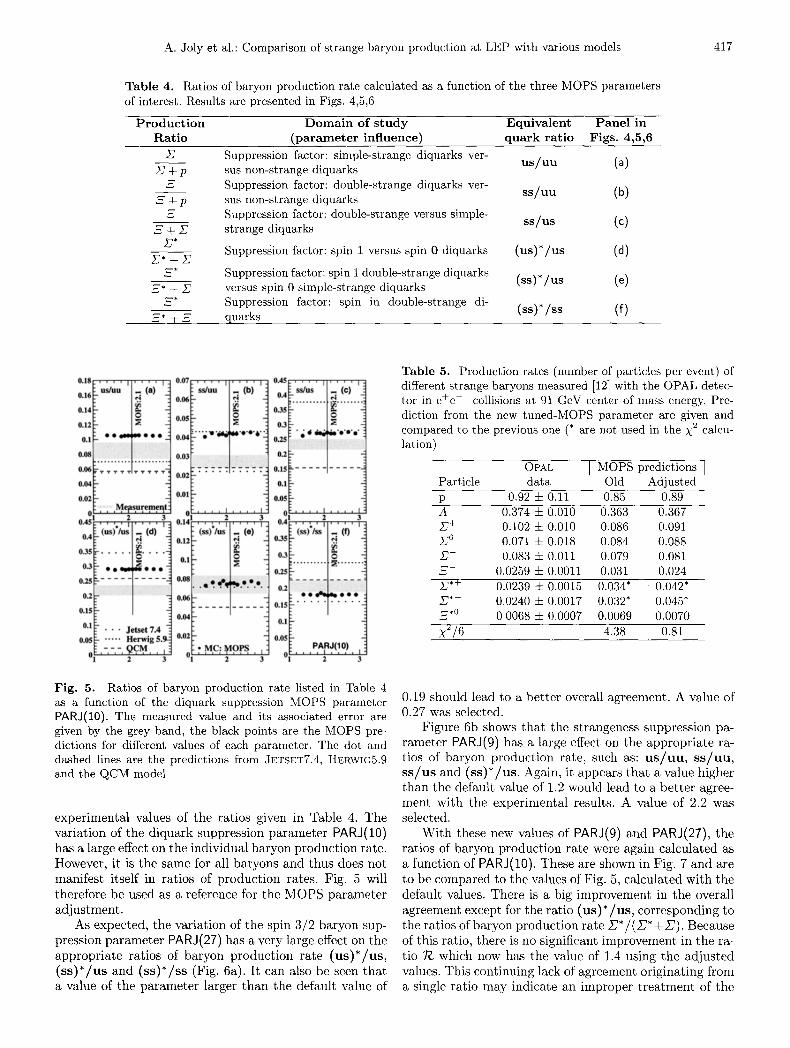
Fig. 4. Measured and predicted values of the ratio g , for the five different MOPS parameters related to baryon production. The measured value and its associated error are given by the grey band, the black points are the predictions for different values of each parameter. The dot and dashed lines are the predictions from JETSET7.4, HERWIG5.9 and the QCM model
~ ) = 100% [11]). The ratio 74 has been defined in such a way that there is, in principle, no net difference in spin and strangeness between the numerator and the denominator.
The experimental value of 74 is determined to be 74 = 0.82 :t: 0.11 from the production rates given in Table 1. It is compared to various model predictions in Fig. 4, where each panel corresponds to the variation of one of the five MOPS parameters defined previously. When one parame- ter is varied, the other 4 parameters are given their default values. The measured value is compatible with the value of 0.88 predicted by the QCM model and the value of 1 ex- pected for an equivalent strangeness production in diquark and quark formation according to the isospin conservation principle. All three Monte-Carlo generators predict values of 74 which are much too large: 1.6 for HERWIG5.9, 1.5 for MOPS, using its default values, and 2.2 for JETSETT.4, although there is a significant improvement in the MOPS prediction compared to that of JETSET.
It is interesting to note that there is little variation in 74 as the MOPS parameters are varied, except for PAR J(27). But this parameter influences only the spin content of the quarks produced and should not normally affect the value of 74. The fact that it does indicates that there is a very complex relationship between the fiavour and the spin con- tent of the baryon produced. In an at tempt to disentangle these two effects, simpler ratios of baryon production rates were tested. They are listed in Table 4, together with their equivalent quark ratios and a description of the suppres- sion factor being probed.
As can been seen from Fig. 5, there is, in general, lit- tle overlap between the calculated MOPS values and the
A. Joly et al.: Comparison of strange baryon production at LEP with various models 417
Table 4. Ratios of baryon production rate calculated as a function of the three MOPS parameters of interest. Results are presented in Figs. 4,5,6
Production Domain of study Equivalent Panel in Ratio (parameter influence) quark ratio Figs. 4,5,6
S E ' + p
~ + p
S*
2"
. ~ * + ~
Suppression factor: simple-strange diquarks ver- sus non-strange diquarks Suppression factor: double-strange diquarks ver- sus non-strange diquarks Suppression factor: double-strange versus simple- strange diquarks
Suppression factor: spin 1 versus spin 0 diquarks
Suppression factor: spin 1 double-strange diquarks versus spin 0 simple-strange diquarks Suppression factor: spin in double-strange di- quarks
us/uu (2)
SS/UU (b)
ss/us (c)
(us)*/us (d)
(ss)*/us (e)
(ss)*/~s (f)
Table 5. Production rates (number of particles per event) of different strange baryons measured [12] with the OPAL detec- tor in e+e collisions at 91 GeV center of mass energy. Pre- diction from the new tuned-MOPS parameter are given and compared to the previous one (* are not used in the X 2 calcu- lation)
OPaL I MOPS predictions I Particle data Old Adjusted p 0.92 • 0.11 0.85 0.89 A 0.374 • 0.010 0.363 0.367 S + 0.102 • 0.086 0.091 Z ~ 0.071 • 0.018 0.084 0.088 Z - 0.083 • 0.011 0.079 0.081 2 - 0.0259 • 0.0011 0.031 0.024 5:*+ 0.0239 • 0.0015 0.034* 0.042* F* 0.0240 • 0.0017 0.032* 0.045* ~.0 0.0068 • 0.0007 0.0069 0.0070 X~/6 4.38 0.81
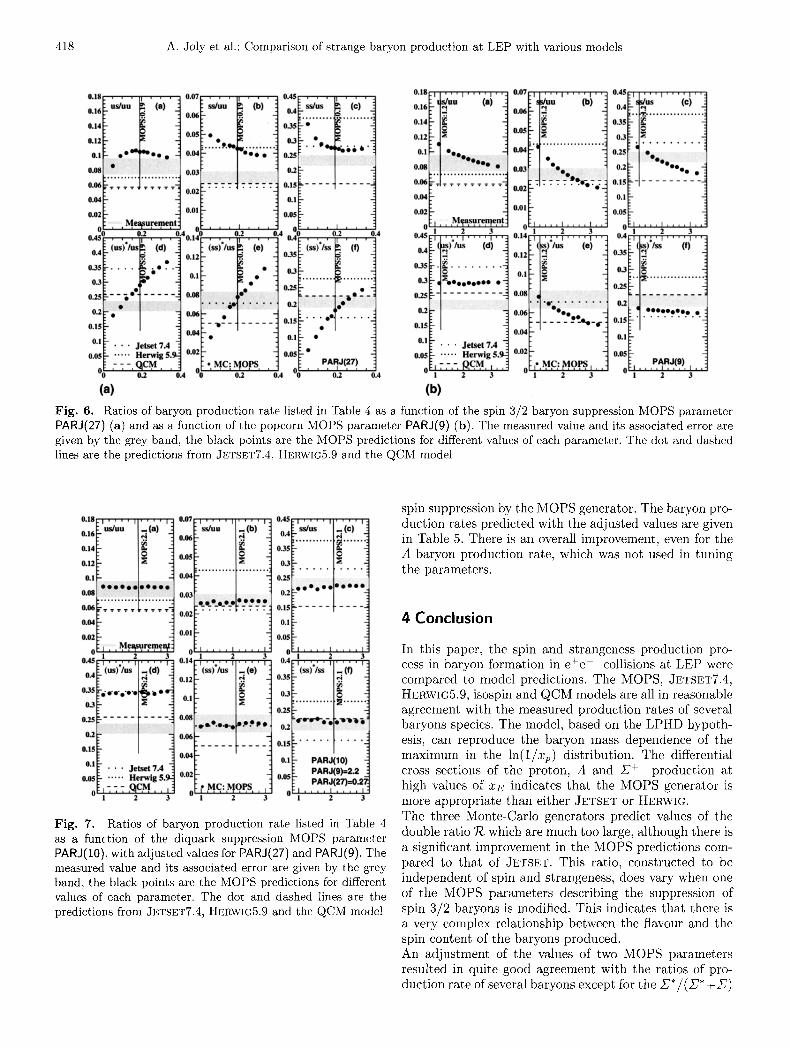
Fig. 5. Ratios of baryon production rate listed in Table 4 as a function of the diquark suppression MOPS parameter PAR J(10). The measured value and its associated error are given by the grey band, the black points are the MOPS pre- dictions for different values of each parameter. The dot and dashed lines are the predictions from JETSET7.4, HERWIG5.9 and the QCM model
experimental values of the ratios given in Table 4. The variation of the diquark suppression parameter PAR J(10) has a large effect on the individual baryon production rate. However, it is the same for all baryons and thus does not manifest itself in ratios of production rates. Fig. 5 will therefore be used as a reference for the MOPS parameter adjustment.
As expected, the variation of the spin 3/2 baryon sup- pression parameter PAR J(27) has a very large effect on the appropriate ratios of baryon production rate (us )* /us , ( s s )* /us and (ss)*/ss (Fig. 6a). It can also be seen that a value of the parameter larger than the default value of
0.19 should lead to a better overall agreement. A value of 0.27 was selected.
Figure 6b shows that the strangeness suppression pa- rameter PAR J(9) has a large effect on the appropriate ra- tios of baryon production rate, such as: u s / u u , s s / u u , s s / u s and (ss)*/us . Again, it appears that a value higher than the default value of 1.2 would lead to a better agree- ment with the experimental results. A value of 2.2 was selected.
With these new values of PARJ(9) and PARJ(27), the ratios of baryon production rate were again calculated as a function of PAR J(10). These are shown in Fig. 7 and are to be compared to the values of Fig. 5, calculated with the default values. There is a big improvement in the overall agreement except for the ratio (us)*/us, corresponding to the ratios of baryon production rate Z*/(Z*-F ~). Because of this ratio, there is no significant improvement in the ra- tio T4 which now has the value of 1.4 using the adjusted values. This continuing lack of agreement originating from a single ratio may indicate an improper treatment of the
418 A. Joly et al.: Comparison of strange baryon production at LEP with various models
Fig. 6. Ratios of baryon production rate listed in Table 4 as a function of the spin 3/2 baryon suppression MOPS parameter PAR J(27) (a) and as a function of the popcorn MOPS parameter PAR J(9) (b). The measured value and its associated error are given by the grey band, the black points are the MOPS predictions for different values of each parameter. The dot and dashed lines are the predictions from JETSET7.4, HERWIC5.9 and the QCM model
spin suppression by the MOPS generator. The baryon pro- duction rates predicted with the adjusted values are given in Table 5. There is an overall improvement, even for the A baryon production rate, which was not used in tuning the parameters.
4 Conclusion
Fig. 7. Ratios of baryon production rate listed in Table 4 as a function of the diquark suppression MOPS parameter PAR J(10), with adjusted values for PAR J(27) and PAR J(9). The measured value and its associated error are given by the grey band, the black points are the MOPS predictions for different values of each parameter. The dot and dashed lines are the predictions from JETSETT.4, HERWlG5.9 and the QCM model
In this paper, the spin and strangeness production pro- cess in baryon formation in e+e - collisions at LEP were compared to model predictions. The MOPS, JETSETT.4, HERWIG5.9, isospin and QCM models are all in reasonable agreement with the measured production rates of several baryons species. The model, based on the LPHD hypoth- esis, can reproduce the baryon mass dependence of the maximum in the ln(1/zp) distribution. The differential cross sections of the proton, A and Z + production at high values of zE indicates that the MOPS generator is more appropriate than either JETSET or HERWIG. The three Monte-Carlo generators predict values of the double ratio T~ which are much too large, although there is a significant improvement in the MOPS predictions com- pared to that of JETSET. This ratio, constructed to be independent of spin and strangeness, does vary when one of the MOPS parameters describing the suppression of spin 3/2 baryons is modified. This indicates that there is a very complex relationship between the flavour and the spin content of the baryons produced. An adjustment of the values of two MOPS parameters resulted in quite good agreement with the ratios of pro- duction rate of several baryons except for the Z*/ (~ '* + ~ )
A. Joly et al.: Comparison of strange baryon production at LEP with various models 419
ratios. The lack of agreement for this particular ratio may indicate an improper t rea tment of spin suppression by the MOPS generator.
References
1. Patrik Eden, A programm for Baryon Generation and its Applications to Baryon Fragmentation in DIS, University of Lund, LU TP 96-29, October 1996.
2. P.V. Chliapnikov, V.A. Uvarov, Striking Regularity in Me- son and Baryon Production Rates in e+ e - annihilation, Phys. Lett. B 345,313-320 (1995)
3. Armin BShrer, Inclusive Particle Production in Hadronic Decays of the Z ~ Boson at LEP [, Si-96-15, Universit/it- GH Siegen, Germany.
4. YU. L. Dokshitzer, V. A. Khoze, S. I. Troyan, Inclusive Particle spectra from QCD Cascade, Int. Jour. of Mod. Phys. Q 7 (9), 1875-1905 (1992)
5. Y.L. Dokshitzer, V.A. Khoze, S.I. Troyan, Phenomenology of the Spectra in QCD jets in Modified Leading Logarith- mic Approximation, Z. Phys. C 55, 107-114 (1992); Ya.I. Azimov et al., Similarity of Patton and Hadron Spectra in QCD Jets, Z. Phys. C 27, 65 72 (1985)
6. Zong-Guo Si, Qu-Bing Xie, Qun Wang, Study of Baryon Antibaryon Rapidity Correlation in e+ e - Annihilation by Quark Combination Model, hep-ph/9704271, 09 April 1997
7. Private communication with Zong-Guo Si and Qu-Bing Xie
8. T. SjSstrand, QCD Generators, Z Physics at LEP I, Vol 3: Event Generators and Software, CERN 89-08
9. B.R. Webber, Monte Carlo Simulation of Hard Hadronic Processes, Ann. Rev. Nucl. Phys. Sci. 36, 253-286 (1986)
10. B. Anderson, G. Gustafson, B. S5derberg, A General Model for Jet Fragmentation, Z. Phys. C 20, 317-329 (1983)
11. Review of Particle Properties, Phys. Rev. D, 1173-1826 (1994)
12. OPAL Collaboration, G. Alexander et al., Phys. Lett. C 7'3, 569 (1997)
13. DELPHI Collaboration, P. Abreu et al., Z. Phys. C 67, 543 (1995)
Recommended


![Baryon Stability on the Higgs Dissolution Edge : violation ... · Baryon Stability on the Higgs Dissolution Edge : Threshold corrections and suppression of Baryon ... (RPP) GUTs[2–8]isuse](https://img.pdfslide.net/doc/110x75/5ca1c77088c99335108cc886/baryon-stability-on-the-higgs-dissolution-edge-violation-baryon-stability.jpg)