Department of the Environment
Overview of Water Quality Data Used by MDE and Water Quality
Parameters
Timothy Fox
MDE, Science Service Administration
Wednesday
January 30th, 2013
2
Presentation Overview
• Describe MDE Water Quality Restoration Process.
• Overview of water quality parameters.
3
Clean Water Act Process
• Water Quality Standards
• Water Quality Monitoring
• Integrated Report
• TMDL
• NPDES permits
• WQ Restoration
4
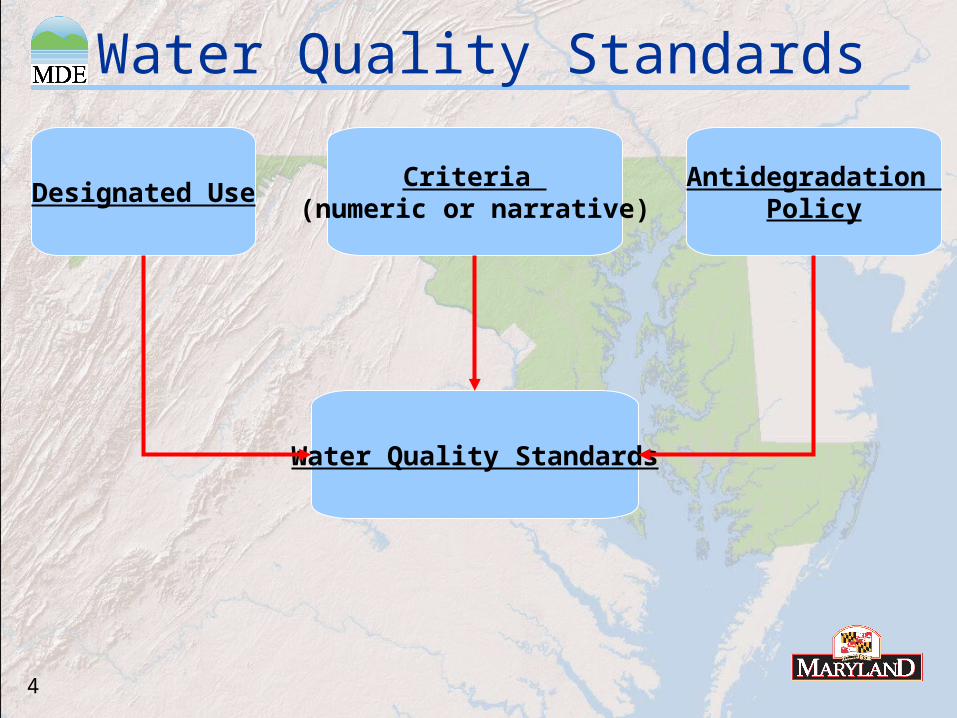
Water Quality Standards
Designated UseCriteria
(numeric or narrative)Antidegradation
Policy
Water Quality Standards
5
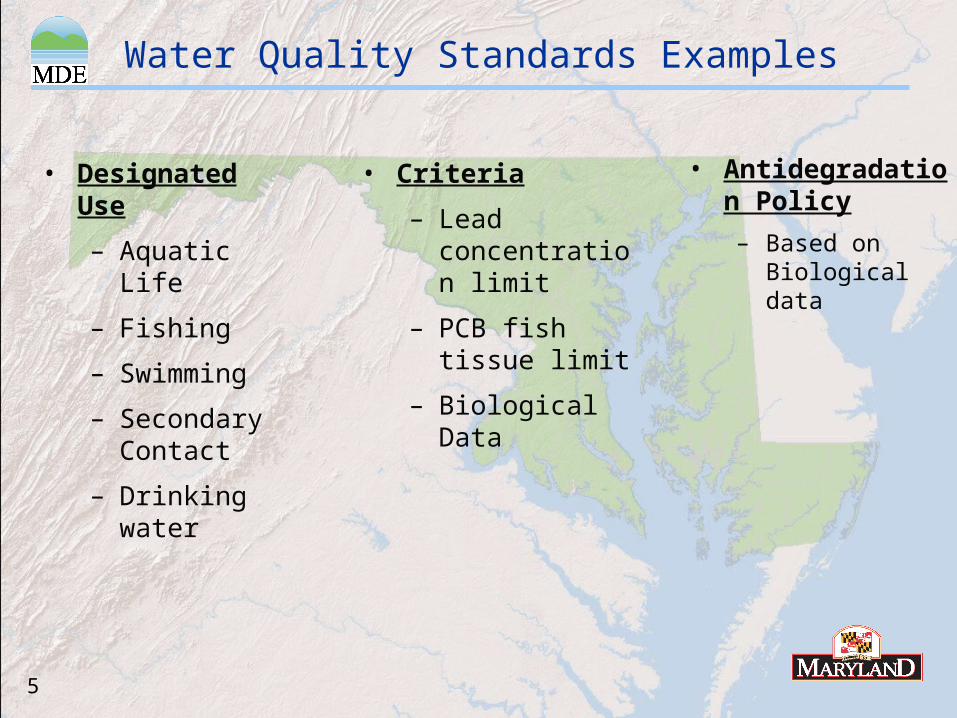
Water Quality Standards Examples
• Designated Use
– Aquatic Life
– Fishing
– Swimming
– Secondary Contact
– Drinking water
• Criteria
– Lead concentration limit
– PCB fish tissue limit
– Biological Data
• Antidegradation Policy
– Based on Biological data
6
Integrated Report
• Section 130.7(B)(5) of the Clean Water Act requires that states “assemble and evaluate all readily available water quality-related data and information”
7
Integrated Report
• Documentation of the water quality status of surface waters in Maryland, compiled biennially.
– Includes a listing (i.e., the 303d list) of those waters not meeting State Water Quality Standards (WQS) as well as those water bodies that meet WQS.
• Documentation of the decision-making process by which water bodies are assessed and listed.
8
Classifying Waters according to Status
• Categories of the Integrated Report
• Categories 1 and 2 - waters attaining all standards or some standards
• Category 3 - waters with insufficient information to assess water quality standards. These areas deserve follow-up assessment.
• Category 4 - impaired waters that do NOT need a TMDL.
– 4a – TMDL completed
– 4b – Technological solution should bring water body back into attainment
– 4c – Impairment not caused by a pollutant (eg. Dam, habitat modification, etc)
• Category 5 - impaired waters that require a TMDL (Historically known as the 303(d) List).
9
Total Maximum Daily Load (TMDL)
• Category 5 waters – Are Impaired=not supporting the designated use
• Calculation of the maximum amount of a pollutant that a waterbody can receive and still safely meet water quality standards.
• TMDLs influence permiting, water quality monitoring, WIPs, and funding.
10
How does MDE use water quality data?
• Determine if surface water bodies are attaining Designated Uses based on water quality and biology data.
• The status of water bodies are published in the “Integrated Report”.
11
How is the Integrated Report Compiled?
• Conduct statewide data solicitation
• Review data with respect to QAQC plan, and use publicly reviewed listing methodologies to analyze data
• Define geographic scale of impairment
• Determine appropriate IR listing category
12
How is the Integrated Report Compiled?
• Tier 1 data– Used to determine impaired waters (Category 5).
– Should be accompanied by a Quality Assurance Project Plan (QAPP) consistent with EPA guidance and Maryland listing methodologies.
• Tier 2 data– Used to assess the general condition of surface
waters.
– Can be used to place water on Category 2 or 3.
– Volunteer data, land use data, visual observations.
13
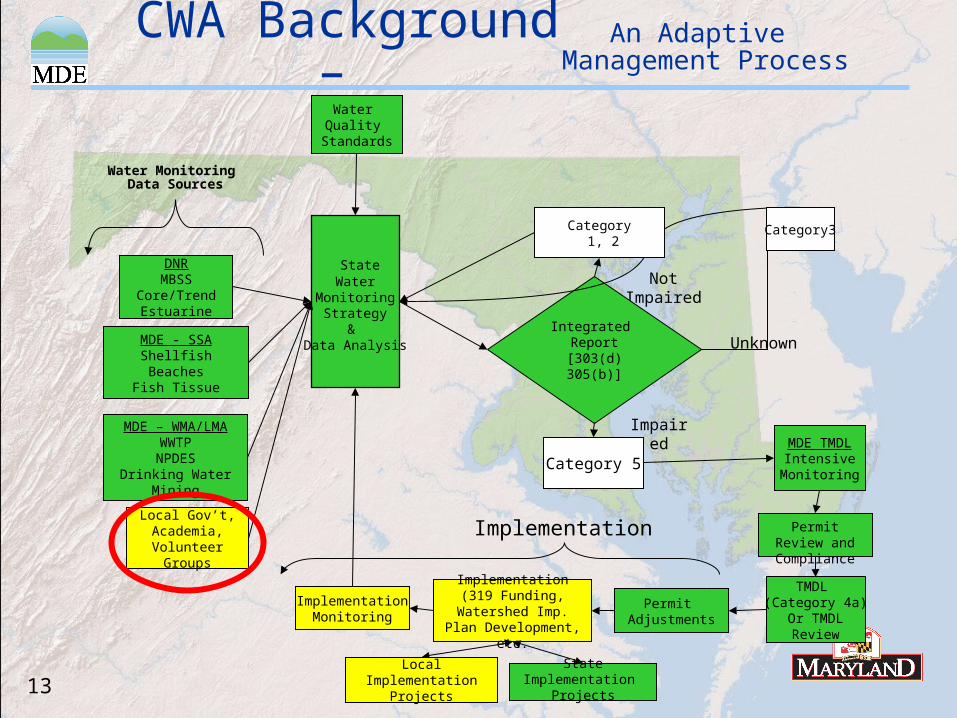
CWA Background –
Unknown
Not Impaired
Integrated Report[303(d)305(b)]
DNRMBSS
Core/TrendEstuarine
MDE - SSAShellfishBeaches
Fish Tissue
MDE TMDLIntensive
Monitoring
TMDL (Category 4a)
Or TMDLReview
StateWater
MonitoringStrategy
& Data Analysis
Water Quality
Standards
Permit Adjustments
Implementation (319 Funding, Watershed Imp. Plan Development, etc.
ImplementationMonitoring
State Implementation Projects
Impaired
Permit Review and Compliance
Local Gov’t, Academia,
Volunteer Groups
MDE – WMA/LMAWWTPNPDES
Drinking WaterMining
Water Monitoring Data Sources
Implementation
Category 1, 2
Category3
Category 5
An Adaptive Management Process
Local ImplementationProjects
14
Parameters measured by BTW
• Dissolved Oxygen (numeric criteria)
• Temperature (numeric criteria)
• Nitrates (narrative criteria)
• Orthophosphates (narrative criteria)
• Turbidity (numeric criteria)
• TDS/conductivity (hope to have numeric criteria soon)
• pH (numeric criteria)
• Fecal Coliform (numeric criteria)
• Biochemical Oxygen Demand
• Flow
15
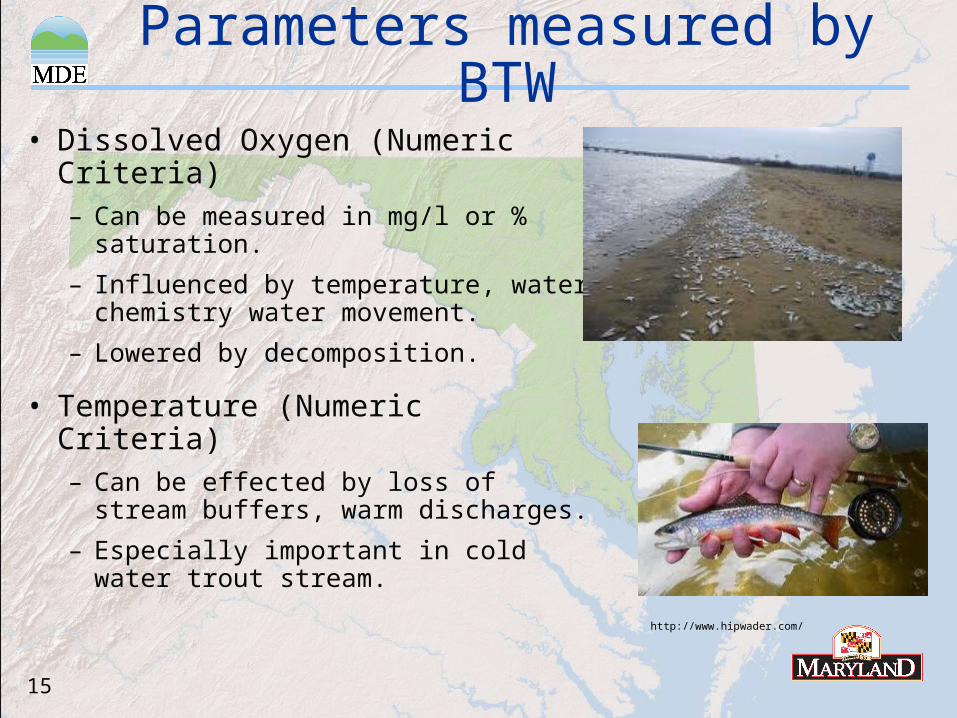
Parameters measured by BTW
• Dissolved Oxygen (Numeric Criteria)– Can be measured in mg/l or %
saturation.
– Influenced by temperature, water chemistry water movement.
– Lowered by decomposition.
• Temperature (Numeric Criteria)– Can be effected by loss of stream
buffers, warm discharges.
– Especially important in cold water trout stream.
http://www.hipwader.com/
16
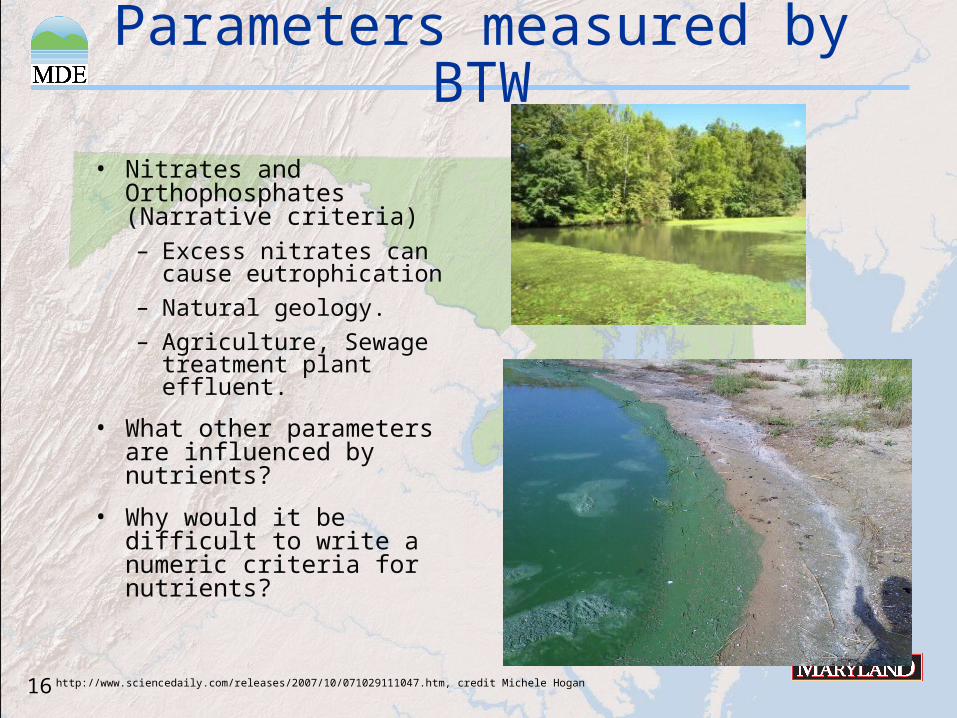
Parameters measured by BTW
• Nitrates and Orthophosphates (Narrative criteria)– Excess nitrates can cause
eutrophication
– Natural geology.
– Agriculture, Sewage treatment plant effluent.
• What other parameters are influenced by nutrients?
• Why would it be difficult to write a numeric criteria for nutrients?
http://www.sciencedaily.com/releases/2007/10/071029111047.htm, credit Michele Hogan
17
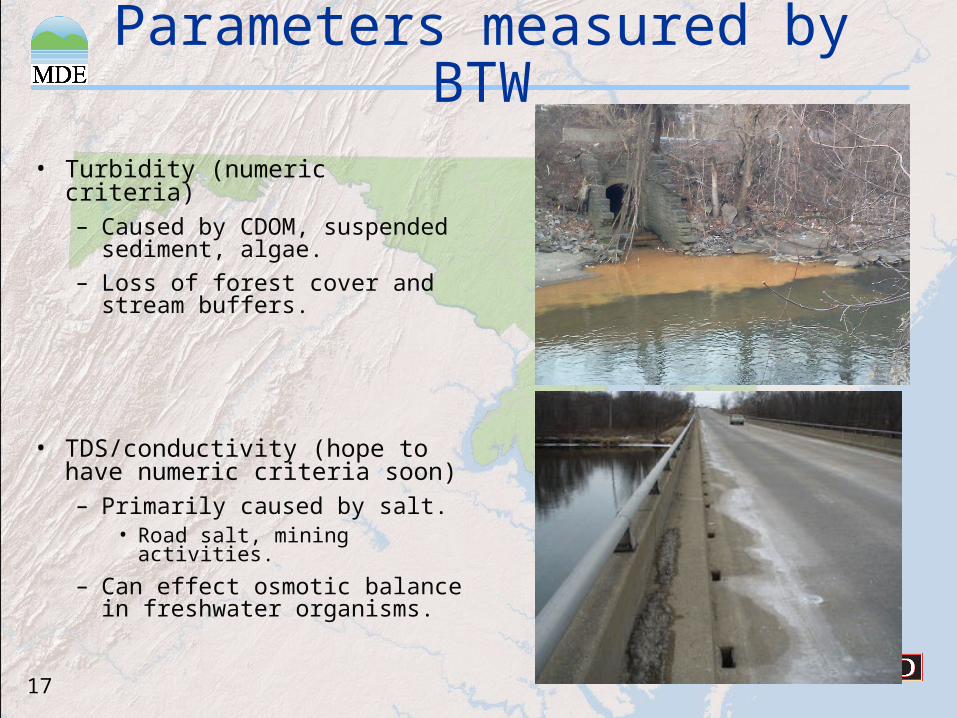
Parameters measured by BTW
• Turbidity (numeric criteria)– Caused by CDOM,
suspended sediment, algae.
– Loss of forest cover and stream buffers.
• TDS/conductivity (hope to have numeric criteria soon)– Primarily caused by salt.
• Road salt, mining activities.
– Can effect osmotic balance in freshwater organisms.
18
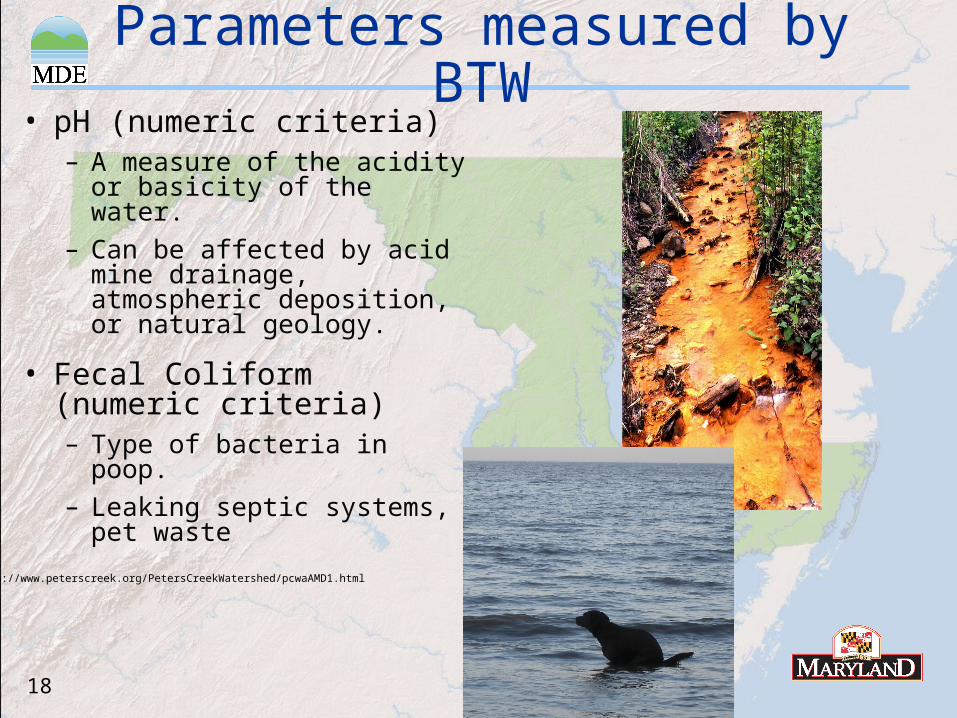
Parameters measured by BTW• pH (numeric criteria)
– A measure of the acidity or basicity of the water.
– Can be affected by acid mine drainage, atmospheric deposition, or natural geology.
• Fecal Coliform (numeric criteria)– Type of bacteria in poop.
– Leaking septic systems, pet waste
http://www.peterscreek.org/PetersCreekWatershed/pcwaAMD1.html
19
Parameters measured by BTW
• Biochemical Oxygen Demand (BOD)
– Oxygen consumed by microbial decomposition of organic waste, and is measured by the change in DO in a sealed water sample.
– Increased by organic waste (WWTP, agriculture, fertilizer).
• Flow
– Influenced by impervious surface, dams, forest buffers.
– Can effect physical habitat.
20
Any Questions?
Main Mapping page - Links to Tier II and Impairment Maps
http://www.mde.state.md.us/programs/Water/TMDL/Integrated303dReports/Pages/WaterQualityMappingCenter.aspx
Impairment Maps
http://www.mde.state.md.us/programs/Water/TMDL/Integrated303dReports/Pages/ImpairmentMaps.aspx
Recommended