Report No. CDOT-DTD-SDHYD-R-96-2
Efficiency of Sediment Basins
Analysis of the Sediment Basins Constructed as Part of the
Straight Creek Erosion Control Project
Rick Moser Colorado Department of Transportation 4201 E. Arkansas Avenue Denver, Colorado 80222
Final Report January 1996
Prepared in cooperation with the U.S. Department of Transportation Federal Highway Administration
OT

Acknowledgments
A number of organizations and people contributed to the successful completion of this research. The author wishes to thank them for their efforts and support - it was very much appreciated.
Thanks to the management of the CDOT Staff Design Branch for their support. Specifically, thanks go to Ken Mauro, Tim Harris, Del Roupp and Gary Johnson for allowing me to complete this research.
The CDOT Hydraulic Design Unit provided valuable assistance; especially Dan Lane, Philipp Sieber, and Steve Smith who helped with surveying of the sediment basins. Philipp and Steve also provided valuable technical comments on the final draft of this report.
Region I provided funds for some of the monitoring equipment. The research could not have been completed without their support. Thanks go to the CDOT Summit County Construction Residency for their support of the monitoring efforts, for collecting soil and water samples, and for surveying help.
Region 1 Maintenance also provided very valuable assistance. The Eisenhower Tunnel Maintenance Section was kind enough to provide personnel and use of their 4,000 gal water tanker for the simulation testing that was done. In addition, Paul Dejulio, from the Silverthome Maintenance Patrol, along with his crew, are to be thanked for their help with collecting runoff samples and for picking up and transporting some of the monitoring equipment. This was not an easy job since the equipment was heavy and bulky and had to be moved up the 1:1 fill slope.
The United States Geologic Survey (USGS), in particular Randy Parker, provided excellent guidance as to the various monitoring alternatives that could be used to determine the efficiency of the sediment basins.
Finally, thanks go the research panel comprised of: Jim Bemelen, Terri Tiehen, and Wes Goff of Region 1; Philipp Sieber and Gary Johnson of Staff Design; and Randy Parker of the USGS.
i

REPORT DOCUMENTATION PAGE FORM APPROVED
OMB NO. 0704-0188
Public reporting burden fOf this collection of informauoois estimated to average 1 hour per t'eS?ons~,includjngtb.e time for reviewing instructions. searchini existing data sources,
,athering and maintainina the c1ata needed, and complctina and reviewing the collection of information. Send comments relarding this burden estimate or any o:her aspect of this
collection of information, including suggestions for reduc:in,a: this burden. to Washington Headquarters Services, Directorate for IofonnationOpcrations and Repc:1S. 1215 Jefferson
Davis Highway. Suite 1204. ArJington, VA 22202-4302.an4 to the Office of Management and Budget, Paperwork Recluction Project (0704-0188), WashinltDn. DC 20503.
1. AGENCY USE ONLY ~I'I'C BIalIk) z. REPORT DATE 3. REPORT T'IIl'E AND DATES COVI!IU!D
January 1996 Final Report, 2-1/2 years -
4. 11TLE AND stJBTlTI.E 5. FUNDING NUMBERS
Efficiency of Sediment Basins 6. AVTHORS(S)
Rick Moser 7. PI!RFORMlNG ORGANIZATION NAME(S) AND ADDIU!SS(S) 8. PI!RFORMlNG ORGANIZATION
Colorado Department of Transportation REPORT NIJMIIKR
4201 E. Arkansas Ave. CDOT -DTD-SDHYD-
Denver, Colorado 80222 R-96-2
9. SPONSORINGIMONITORING AGENCY NAME(S) AND ADDlIFSS(S) 10. SPONSORING/MONITORING
Colorado Department of Transportation AGENCY REPORT NUMBl!'.R
4201 E. Arkansas Ave. CDOT-DTD-SDHYD-
Denver, Colorado 80222 R-96-2
11. SUPPLEMENTARY NOTES
Prepared in Cooperation with the U.S. Department of Transportation, Federal
Highway Administration
lla. DISl1UBUTlONIAVAILABIL1TY STATEMEPn" llb. DISl1UBUTlO:oor CODE
No Restrictions: This report is available to the public through the
National Technical Information Service. Springfield VA 22161 13. ABSTRACI' (Maximum 200 words)
Erosion, sedimentation. and water pollution caused by runoff from the highway system are of concern to Ibe Colorado Department
of Transportation (COOT). Compliance with federal and state water quality regulatory requirements along with a desire to
minimize adverse environmental impacts have led to the need to canuol highway runoff. A variety of practices can be used to improve the
quality of highway runoff and thereby reduce potential impacts to receiVing waters. One such measure that can be constructed is a
sediment basin.
The Straight Creek Erosion Control Project. completed by CnOT in the summer of 1994. included the construction of eleven sediment
basins between the 'toe' of the 1-70 fill slope and Straight Creek. These basins were constructed to reduce highway runoff sediment
loadings into Straight Creek.
This repon provides information about the amount of material capwred by the basins and their efficiency in removing sediment
from the highway runoff. It is hoped that the repon findings will help in future decisions on whether or not sediment basin
construction is warranted and what sediment re~ova1 efficiency can be anticipated.
14. SUBJECT ri:RMs 15. NUMBER OF PAGES
Highway Stormwater Runoff Sediment Control 80
Sediment Basins Stormwater Quality 16. PRICE CODE
Erosion 17. SECURTITY CLASSIFlCATION 18. SECIJRITY CLASSIFlCATION 19. SECIJRITY CLASSInCATION ZOo LlMlTATION OF AllSTRACT
OF REPORT OFTIDSPAGE OF ABSTRACT
Unclassified Unclassified Unclassified
ii

Units of Measurement
Both English and metric (SI) units of measurement are used in this report; however, the English
system is used primarily. This is mostly due to the facts that both the hydraulic design of the
sediment basins and the survey of the sediment basins was performed in English units. The
hydraulic design, completed in 1992, and the surveying, completed in 1993 and 1994, were done
prior to the Colorado Department of Transportation's efforts to produce designs and surveys in
SI units.
Units shown in the text of the report are provided in both English and SI units. English units are
shown first, followed by a "soft" conversion to SI units.
Report figures and tables are in English units. In some of the tables, totals or final results, are
displayed in both English and SI units.
The conventional unit of measurement for sediment sample analysis is SI units. Therefore, su~h
items as sample concentration and sample mass are reported solely in SI units.
111

Executive Summary
Erosion, sedimentation, and water pollution caused by runoff from the highway system are of
concern to the Colorado Department of Transportation (CDOD. Compliance with water quality
regulations along with a desire to minimize adverse environmental impacts have led to the need
for implementing and assessing practices to control highway runoff.
One practice that can be used to control pollutants in highway runoff is a sediment basin.
Sediment basins are either constructed of embankment or excavated into the existing ground.
They intercept and temporarily store a specific volume of stormwater runoff. To provide water
quality enhancement, this runoff is very slowly released from the basin over an extended period
of time. This results in conditions favorable for suspended sediment to settle out of the
stormwater and be deposited on the basin floor. Consequently, water leaving the basin is
"cleaner" than the water entering the basin.
As part of the Straight Creek Erosion Control Project, completed by CDOT in 1994, eleven
sediment basins were constructed between the "toe" of the 1-70 fill slope and Straight Creek.
The basins were built to remove sand and sediment from highway runoff so that sediment
loadings into Straight Creek would be reduced.
How much sand and sediment captured by these sediment basins along with the efficiency of
the basins in removing sediment from the runoff are the primary subjects of this research
report.
This report describes what data was collected and how it was collected. In addition, the data
analysis and findings are presented.
A variety of surveying and monitoring efforts were completed to quantify the amount of
material captured and efficiency of the basins. For example, surveying of the basins was
completed to determine the volume of material captured. Flow measurement equipment was
iv
installed and operated so that the water volume from the monitored runoff events could be
determined. Water samples were collected and the concentration of sediment was determined
for each of the samples. Also, sediment particle size for various soil and water samples was
determined.
A number of conclusions were drawn as a result of this research. Most of the following
conclusions that were reached are described based on the research objective that they support.
Research Object. 1: Quantify the amount of sand captured by the sediment basins.
Conclusion: Based on the surveying efforts and the relationship developed between
drainage area and amount of sediment captured, it is estimated that 985
tons (894 m-ton) of sand and sediment are captured annually by the
eleven sediment basins.
Research Object. 2 : Determine the efficiency of the basins in removing sediment from
runoff.
Conclusion: The efficiency of the sediment basins in removing sediment from runoff
was based on monitoring sediment loading at the sediment basin at
station 328 +03 for a number of runoff events. The calculated TSS
removal efficiency is 90.5 %. In other words 90.5 % of all sand and
sediment that enters the basins will be captured.
Research Object. 3: Determine the quantity of sediment released from the basins into Straight
Creek.
Conclusion: The quantity of sediment released from the basins into Straight Creek
was determined based on the calculated removal efficiency and the
annual quantity of sediment captured in the basins. On an annual basis a
total of 1,088 tons (987 m-ton) will enter the basins. Of this amount,
985 tons (894 m-ton) will be intercepted and captured within the basins.
v

And 103 tons (93.4 m-ton) will be conveyed through the basins into
Straight Creek. Therefore, sand and sediment loading into Straight
Creek was reduced from 1,088 tons (987 m-ton) per year to 104 tons
(93.4 m-ton) per year as a result of construction of the sediment basins.
Research Object. 4: Quantify the sediment loading differences between pavement and cut
slope areas.
Conclusion: Based on the surveying efforts it was estimated that 101 pounds of
sanding material per linear foot of highway (151 kg/m) for EB 1-70 and
101 pounds of sanding material per linear foot of highway (151 kg/m)
for WB 1-70 would be captured annually by the sediment basins. In
terms of pounds per acre of highway pavement, the estimated sand
capture rate is 88,300 Ib/acre (99,000 kglha).
In addition, it was estimated that 58,040 pounds per acre (65,100 kg/ha)
of sediment from the cut slopes would be captured annually by the
sediment basins.
Research Object. 5: Refine the estimate of the required maintenance clean out cycle.
Conclusion: The clean out cycles predicted during the design phase of the Straight
Creek Erosion Control project, for most of the basins, were found to be
reasonable when compared with the anticipated clean out cycle based on
the survey information. Based on the surveyed information, the
anticipated sediment removal cycle varies from once every 0.9 years at
station 401 +00 to once every 9.1 years at station 286+79.
Even with the refined estimate of the necessary basin clean out cycle, it is
very important to keep in mind that CDOT Maintenance forces should
routinely observe the basins to assess sediment removal needs.
vi

Infonnation provided in the October 1993 "Sediment Pond Maintenance
Report" should help Maintenance forces more accurately identify when
sedim~nt removal is required. This is especially necessary considering the
facts that some of the actual constructed volumes of the basins differ from
the design volumes, that the sand application rates will vary from year to
year depending on the weather conditions, and that maintenance practices
may vary.
Other conclusions reached as a result of the research are:
• An analysis of the size of sediment in the runoff exiting the basin was completed.
This showed that for all rainfall, simulation, and snowmelt events: no material
larger than #60 (0.25 mm) sieve left the basin.
• The total cost to construct the basins and the anticipated cost to build the access
road is $864,980. Assuming a 25-year life for the basins, the unit cost to capture
the sanding and sediment material is $35/ton ($39/m-ton). Maintenance costs
were not included.
vii

Table of Contents
Acknowledgments
Technical Report Documentation/Abstract ii
Units of Measurement iii
Ex~utiveSummary ______________________________________________ __ iv
List of Tables x
List of Figures xi
1.0 Introduction 1
2.0 Project Location and Background 2
3.0 Objectives 5
4.0 Existing Information 8 4.1 Hydraulic Design 8 4.2 USGS Report 13 4.3 ~tudy Design for Sediment Basin Monitoring 13
5.0 Monitoring Efforts 14 5.1 Monitoring Equipment 15 5.2 Monitoring Location and Scheme 18
6.0 Data CoU~tion and Analysis 22 6.1 Basin Snrvey and Sediment Accumulation 22
6.1.1 Weight of Sediment Captured 25 6.1.2 Drainage Areas Tributary to the Sediment Basins 26 6.1.3 Estimated Annual Sediment Load Captured by aU Basins_ 27 6.1.4 Basin Clean Out Cycle 32
viii

Table of Contents (cont.)
6.2 Monitoring of Runoff Events 34 6.2.1 Characteristics of the Sediment Basin at 328+03 34 6.2.2 Weir Calibration 38 6.2.3 Parshall Flume 40 6.2.4 Sediment Concentration Analysis 40 6.2.5 Rainfall Events 44 6.2.6 Simulation Events 50 6.2.7 Snowmelt Event 52
6.3 Size of Sediment 57
7.0 Overall Sediment Removal Efficiency 59
8.0 Sediment Load into Straight Creek from Basins 61
9.0 Cost Analysis 62
10.0 Conclusion 64
References 67
ix

List of Tables
Table 5.1 List of Monit~ring Equipment Used 16
Table 6.1 Sediment Volume Captured by tbe Sunreyed Basins 23
Table 6.2 Weigbt of Sediment Captured by the Sunreyed Basins 26
Table 6.3 Drainage Area Tributary to the Sediment Basins 28
Table 6.4 Quantity of Material Captured from tbe Cut Slopes 29
Table 6.5 Quantity of Material Captured Annually by All Eleven Basins 31
Table 6.6 Basin Clean Out Cycle 33
Table 6.7 Station 328+03, Elevation-Area-Volume Relationship 36
Table 6.8 Riser Pipe Hydraulics 37
Table 6.9 Emptying Time ofWQCV 38
Table 6.10 Water-Sediment Samples at Inflow 42
Table 6.11 Water-Sediment Samples at Outflow 43
Table 6.12 Rainfall Events - Summary Information 46
Table 6.13 Simulation and Snowmelt Events - Summary Information 53
Table 6.14 Size of Material in Basin Outflow 58
Table 6.15 Sediment Loading for All Monitored Events 60
x

List of Figures
Figure 2.1 Traction Sand on Roadway (photo) 4
Figure 2.2 Highway Snowmelt Transporting Sand (photo) 4
Figure 2.3 Schematic of Sediment Basin Locations 6
Figure 2.4 Sediment Basin During Construction (photo) 7
Figure 2.5 Sediment Basin in Operation (photo) 7
Figure 4.1 Sediment Basin Configuration 11
Figure 4.2 Release Structure 12
Figure 5.1 Monitoring Scheme 20
Figure 5.2 Sampling Equipment Housing Unit (photo) 21
Figure 5.3 Sampling Equipment (photo) 21
Figure 6.1 Sediment Basin Cross Sections 24
Figure 6.2 Station 328+03, Contour Map 35
Figure 6.3 Riser Pipe 36
Figure 6.4 July 31, 1994 Rainfall Event Hydrograph 47
Figure 6.5 August 9, 1994 Rainfall Event Hydrograph 48
Figure 6.6 August 18, 1994 Rainfall Event Hydrograph 49
Figure 6.7 August 26, 1994 Simulation Event Hydrograph 54
Figure 6.8 August 29, 1994 Simulation Event Hydrograph 55
Figure 6.9 October 8, 1994 Snowmelt Event 56
Figure 6.10 Particle Size of Source Material 57
xi

1.0 Introduction
Erosion, sedimentation, and water pollution caused by runoff from the highway system are of
concern to the Colorado Department of Transportation (COOT). Compliance with federal and
state water quality regulatory requirements along with a desire to minimize adverse
environmental impacts have led to the need to control highway runoff.
A variety of practices can be used to improve the quality of highway runoff and thereby reduce
potential impacts to receiving waters. These include such things as planning and design of the
highway location and configuration with water quality in mind, appropriate maintenance
procedures, and construction of measures to remove pollutants. One such measure that can be
constructed is a sediment basin.
Sediment basins are constructed of embankment or excavated into the existing ground.
Sometimes a combination of excavation and embankment is used to build the basin. They
intercept and temporarily store a specific volume of stormwater runoff. To provide water quality
enhancement, this runoff is very slowly released from the basin over an extended period of time.
This results in conditions favorable for suspended sediment to settle out of the stormwater and be
deposited on the basin floor. Consequently water leaving the basin will be "cleaner" than the
water entering the basin.
The Straight Creek Erosion Control Project, completed by CDOT in the summer of 1994,
included implementation of a number of measures to reduce the water quality impacts to Straight
Creek from highway runoff. One of the prominent measures implemented for the purpose of
reducing sediment loadings into Straight Creek, was the construction of sediment basins. Eleven
basins were constructed between the "toe" of the 1-70 fill slope and Straight Creek.
Evaluation of the quantity of sediment collected by and removal efficiency of the sediment
basins is the primary subject of this research report. To determine this, a number of steps had
1

to be taken and parameters quantified. For example, surveying of the basins was completed to
determine the volume of material captured. Flow measurement equipment was installed and
operated so that the water volume from runoff events could be determined. Water samples
were collected and the concentration of sediment was determined for each of the samples.
Also, sediment particle size for various soil and water samples was determined.
This report describes what data was collected and how it was collected. In addition, the data
analysis and study findings are presented. Finally, conclusions are provided.
2.0 Project Location and Background
The Straight Creek Erosion Control project was located along 1-70, just west of the
Eisenhower Tunnel. The project limits were from the west portal of the tunnel extending
approximately six miles west toward the town of Silverthorne. All of the project construction,
except for one sediment basin, was within 2.5 miles (9.7 km) of the tunnel.
Straight Creek is situated on the south side ofI-70, and the highway parallels the creek. The
Interstate was completed in early 1970. Since then, the creek has been impacted by above
normal sediment loadings from the operation of the highway.
Sources of highway sediment and sand to Straight Creek are:
1) Sheet and rill erosion of the highway cut slope.
2) Sheet and rill erosion of the highway fill slope.
3) Gully erosion of the fill slope where culverts discharge onto the slope.
4) Sanding of the pavement necessary during the winter for vehicle traction purposes.
Of the above listed sources, two contribute sand and sediment into the sediment basins. These
two sources of material are: (1) sheet and rill erosion from the cut slope and (2) sanding of the
2

pavement necessary for vehicle traction purposes. Culvert gully erosion at the sediment basin
locations was repaired by the Straight Creek project; therefore, sediment is not delivered into
the basins from this source. Only a very small fill slope area is tributary to the sediment
basins; therefore, the sediment quantity delivered to the basins from this source is negligible.
The cut and fill slopes within the project corridor are very steep with slopes ranging from 1: 1
(H:V) to 1.5:1. The steep slopes, lack of vegetative cover, and runoff on the slopes have
caused material to be eroded. Some of this eroded material is transported via runoff into
Straight Creek.
In addition, much sand is applied to the highway due to the very difficult climatic and terrain
conditions of the project area. On average, 40 inches (102 em) of precipitation ~all annually.
Most of this is in the form of snow. The elevation within the project area is 10,500 feet
(3,200 m) and the longitudinal grade of I-70 is steep at 6 %. The sand applied by CDOT
Maintenance forces provides the traction necessary to keep I-70 traffic moving in as safe and
efficient manner as possible. Some of this sand is transported via highway runoff to Straight
Creek.
Figure 2.1 is a photo showing sanding material on Westbound (WB) I-70 and also some cut
slope areas . Figure 2.2 is a photo of Eastbound (EB) I-70 with sanding material being
transported during a snowmelt runoff event.
To reduce the sediment loading into Straight Creek, COOT implemented the Straight Creek
Erosion Control project. As part of the project, other erosion control practices were
implemented in addition to the construction of the eleven sediment basins. For example,
approximately 50 acres (20 ha) of the I-70 fill slope were seeded and mulched. This was done
to establish additional vegetation so that the fill slope would be less susceptible to erosion.
Subsequently, less sediment would be eroded from the slopes and transported to Straight
Creek.
3

-. . ~. ~ -~ ~ . 4 .... ,: .. '*.:;Y -.-
Figu..--e 2. ~ - Looldng west at WB 1-70 an~ cut sIo?~ areas. );"ote ~tion sar.d 0::1 roadw.:y and ::llxed "'ith plowed snow. Photo:zken Fail 1995.

. .
Another practice implemented was construction of pipe rundowns on the fill slope. These
rundowns were installed in a number of locations to prevent additional gully erosion of the fill
slope.
Figure 2.3 is a schematic showing the approximate location of the sediment basins. Also
shown is the location of 1-70, Straight Creek, the highway cut slopes, and the highway fill
slopes. It should be noted that the figure is not to scale. Also, there are numerous inlet/pipe
systems and culverts that exist that are not shown. Only those drainage features that carry
runoff into the basins are displayed.
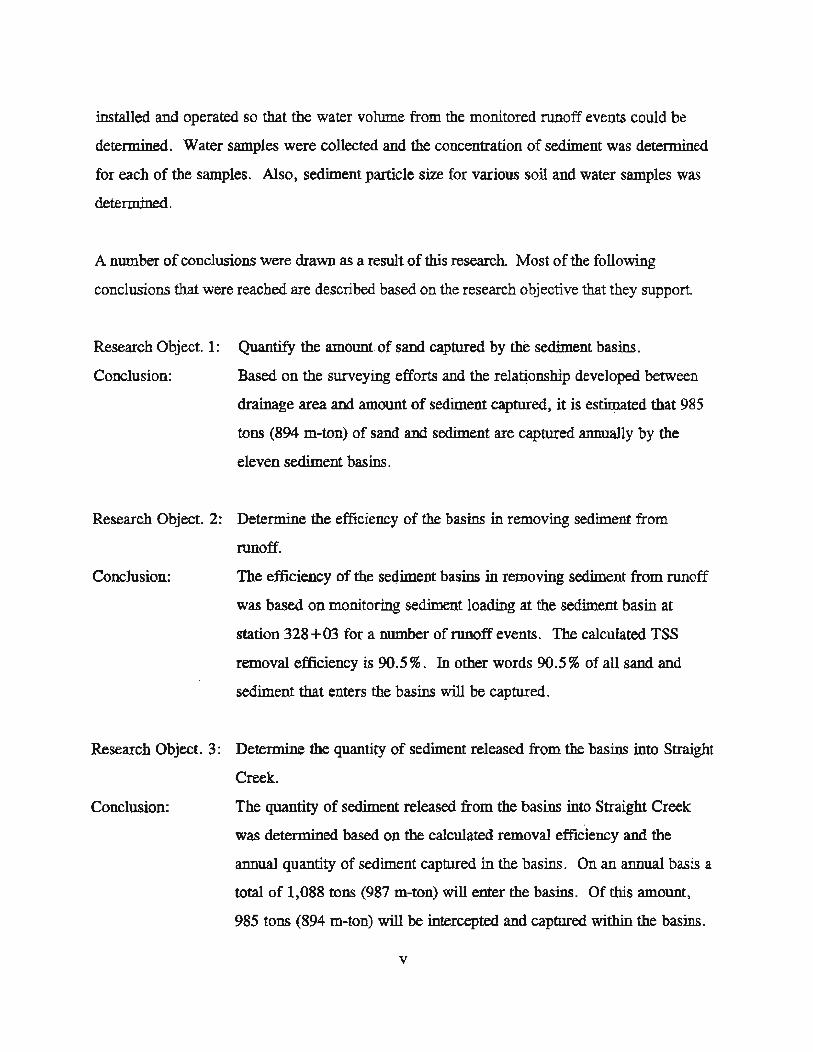
Figures 2.4 and 2.5 illustrate one of the basins (station 369+67) during construction and the
same basin in operation.
3.0 Objectives
In the future CDOT will certainly consider implementing sediment basins similar to the ones
used on the Straight Creek project. One reason for this is more awareness of the potential
adverse impacts to receiving water from sediments. Also, requirements such as the National
Pollutant Discharge Elimination System (NPDES) stormwater regulation requires that
stormwater quality be addressed. Finally, more emphasis is being given by regulatory
agencies such as the Environmental Protection Agency and the Colorado Department of Public
Health and Environment to controlling non-point source pollution.
As a result; it is necessary to evaluate the sediment removal effectiveness of the constructed
sediment basins. The primary objectives of this research were to determine the:
1) quantity of sand captured by the sediment basins.
5

01
North
Schematic of Sediment Basin Locations (Figure 2.3)
t Box Culvert Top of Cut Slope Turnaround ~
J ,/~-----~~~-~~~~~A~;~~~~-----------------------------~c-~;~I~;~-Area~-----
I II 0 l' · .. e 'I ~ ~ _ - Interstat~ 70 : 1 ,! n = , n ~~ . II L-f/)
291+5 ill
Toe of fill slope
Straiaht CreeK
Legend D Sediment Basins
• • Drop Inlet and Pipe
- No Scale. Locations Approximate. - A number of existing inlet/pipe systems and culverts between the Box Culvert Turnaround and the Tunnel that are not shown. Only those that carry runoff into the basins are displayed.
- Sediment basin at 127+00 not shown.

. - •
Figure 2.4 - Se'!i:rent Basin a: 369-67 duf.ng co.~.rc::c:::. P:;o:o taker. S=er : 993.
::g..c:e 2.5 - Sed.ime:::.t B&SID l:t 359+67 iz: op=tic:-.. ?::oco!ike:J. S=me: 1995.
7

2) efficiency of the basins in removing sediment from the runoff.
3) quantity of sediment released from the basins into Straight Creek.
4) sediment loading differences between pavement and cut slope areas.
5) necessary refinement to required maintenance clean out cycle.
This report provides information about the amount of material captured by the basins and their
efficiency in removing sediment from the highway runoff. It is hoped that the report [mdings
will aid in future decisions on whether or not sediment basin construction is warranted and
what sediment removal efficiency can be anticipated.
4.0 EXISTING INFORMATION
Information presented in this section describes the hydraulic design of the sediment basins and
the monitoring planning documents that were prepared. Specifically the following three items
will be discussed:
• COOT hydraulic design of the Straight Creek sediment basins.
• USGS report - "Monitoring of COOT Straight Creek Sediment Ponds. "
• COOT report - Straight Creek Erosion Control Project - "Stndy Oesign for Sediment
Pond Monitoring."
4.1 Hydraulic Design
The hydraulic design of the sediment basins was completed by the COOT Hydraulics Unit in
1992. The primary design focus was twofold. First, the required basin volume for storage of
runoff and sediment had to be determined. Second, an appropriate release structure for
metering the runoff slowly out of the basin had to be designed.
8

Design Volume of the Sediment Basins
The sediment basins were sized for two components: a water quality capture volume (WQCV)
and an expected sediment loading volume. The summation of these two volumes determined
the necessary basin volume.
Computation of the WQCV was based on each basin capturing runoff from 0.5 inches of
precipitation from the tributary drainage area. The WQCV was computed using the following
equation:
WQCV DA x cx O.S x 43,S60 12
where: WQCV = required basin volume for stormwater improvement (ft3)
DA = drainage area (acre)
c = runoff coefficient
Capturing this volume ensures that runoff from the vast majority of precipitation events will be
captured by the basins. An analysis was completed for a previous adjacent CDOT project in
1974 of the precipitation gage near Dillon CO (approximately 7 miles (11 Ian) west of the
project site). For rainfall events occurring from May through September, that exceed 0.1 inch
(0.25 cm), on average only two out of 23 events exceeded 0.5 inch (1.2 cm). In addition, for
l!ll precipitation events (including snow) more than 0.1 inch (0.25 cm), on average only two
out of 50 events exceeded 0.5 inch (1.2 cm). This analysis of the precipitation gage points out
that runoff from the vast majority of precipitation events will be entirely captured by the
sediment basins. It should be mentioned that because the project site is at a higher elevation
than Dillon, the frequency and amount of precipitation at the site are more than that indicated
by the precipitation gage.
Finally, it should be pointed out that between maintenance sediment clean out cycles there wi!:
be excess basin volume for storage of runoff. This sediment storage volume will actually be
9

available for runoff volwne accommodation until the sediment storage volwne has been filled .
If the sediment removal maintenance frequency is implemented as recommended in the
"Sediment Pond Mainte!la.ll£t: Repon" there will be extra volwne for storage of runoff.
As was described earlier in Section 2.0, the sources of sediment loading into the basins
comprise two components. One component is erosion of material from the 1-70 cut slope and
the other is sand from winter sanding operations. The expected annual sediment loading
volume into each basin was estimated using highway sanding application rates provided by
CDOT Maintenance, by estimating the amount of erosion from the cut slopes, and by
predicting how much of the sand and cut slope sediment would be transported by runoff into
the basins.
The basins were sized to have an adequate sediment storage volume to either capture two years
or five years of sediment loading. In some basin locations, the area available for pond
construction was constrained by the steep terrain, encroachment into wetlands, or right-of-way
limits. For these locations the basins were sized for capturing two years of sediment. In other
locations the basins were sized for capturing five years of sediment.
The geometry of each basin was designed similarly. The maximwn depth in each basin for the
WQCV and sediment storage was limited to 4 feet (1.2 m). In addition, each basin was
designed based on a rectangular shape. The longest basin side was set to the nearest 10 feet (3
m) that would provide adequate storage volwne for both the runoff and sediment. The length
of the other side was set at ODe half the length of the longest side. See Figure 4.1.
The longest side of the rectangular basin was set to be parallel with the toe of the 1-70 fill
slope. Ideally, it would have been preferred to have the longest basin dimension oriented
perpendicular to the fill slope. This would have increased the travel distance of the runoff
entering the basin to the release structure. As a result, this may have enhanced sediment
removal efficiency and minimized potential "shon circuiting." However, because of the very
10

Sediment Basin Configuration
~l-~·-" ~
Basin Width
I ~ - Runoff fro m
Basin Length
" Drop Inlet and Riser Pipe
....L. Balin Dis • • ....P
\
/ / ,
Typical Plan
Buln Invert
\ Typical Section
Figure 4.1: Sediment Basin Configuration
24- diameter rundown pipe
from 1-7D ~
1-10
~1 -1
steep terrain it was necessary to construct the long side of the basin parallel to the fill slope so
that the basin embankment would not be excessively long since the embankment slope would
not have "caught" the terrain slope for some distance.
It should be pointed out that the actual constructed basin geometry varied somewhat from the
11

design geometry. The contractor was given some flexibility as to the actual shape, size and
depth of the constructed basins.
DesiIW of the Basin Release Structure
The release structure, installed in each of the sediment basins, consisted of a drop inlet and a 12
inch diameter perforated riser pipe attached to the drop inlet. See Figure 4.2.
r Porto",ted Riser Pipe
Drop Inlet \
•• ••
24 in. Diameter •• •• 4 feet
Outlet PI •• I Basin Invert
(. •• - ••
Figure 4.2: Release Structure
The perforated riser pipe is used to control the rate at which runoff exits the basin. The
perforation size and locations were determined so that runoffwas metered very slowly out of the
basin. The perforation size is 0.5 inch (1.27 cm) diameter. The perforation vertical spacing is
basically on 6 inch (15 cm) centers and there are five to six perforations in each row.
The Urban Drainage and Flood Control District in their Volume 3 Drainage Criteria Manual
recommend a 12-hour release period for sediment basins when used to remove sediment from
runoff from construction activities. Considering that the need of the basins was to remove
sediment, most of which is sand size, it was decided that a release time for the WQCV of
12

approximately 12 hours should provide adequate sediment removal efficiency.
It should be noted that the ~oration size and spacing of all eleven basin riser pipes were
designed to be the same so as to provide consistency for construction purposes. The perforation
design for each sediment basin riser pipe was not modified to try and achieve precisely a l2-hour
release period for the WQCV. The l2-hour emptying time was a target value. Some of the
basins will release the WQCV volume in less than 12 hours. Others will release the WQCV in
more than 12 hours.
For situations where it is desired to remove smaller particles and other pollutants that are typical
of highways where sediment is not the main concern, a 12-hour release time would be too fast
and therefore a slower release time should be used. Guidance is given in COOT's Erosion
Control and Stormwater Quality Guide.
4.2 USGS Report
CDOT requested that United States Geologic Survey (USGS) provide their expertise for
identifying options for monitoring of the sediment basins. Randy Parker from the USGS
assessed and identified these monitoring options. The Apri11994 report, "Monitoring of
CDOT Straight Creek Sediment Ponds," along with discussions and insight provided by
Randy, helped greatly to identify the monitoring considerations and constraints.
4.3 Study Design for Sediment Basin Monitoring
This draft "Study Design for Sediment Pond Monitoring" report was completed in May 1994.
The purpose of the report was to describe monitoring efforts that would be undertaken to
quantify the effectiveness of the basins. Specifically, it was developed to define a monitoring
13

plan that would be used for acquiring data to accomplish the research objectives.
The research objectives identified in the draft study design report are basically the same as those
discussed in Section 3.0 above. Also, the specific steps required to accomplish each of the
objectives was identified. In addition, the needed automatic sampling and flow measurement
equipment was identified. Finally, a schedule for completing the monitoring activities was
included.
5.0 Monitoring Efforts
A variety of monitoring efforts were implemented to determine the quantity of sediment captured
and to determine the efficiency of the sediment basins. These efforts included: surveying of the
basins; installation of primary flow measurement devices, flow recording equipment, and
automatic samplers; determination of the sediment concentration of collected samples; and
sediment size analysis for soil and water samples.
Surveying of the sediment basins was completed to determine the volume of sediment captured
in the basins over a period of time. A survey in the fall of 1993 was completed to establish the
baseline information about the geometry of the basins. One year later, in the fall of 1994, the
same basins were resurveyed.
Most of the monitoring efforts besides surveying were undertaken to provide data to determine
the efficiency of the basins in removing sediment from runoff. The desire was to acquire enough
information through monitoring of runoff and sediment loading to be able to use the principles of
the Mass Balance equation to solve for unknowns about the sediment loading and runoff
volumes. The three mass balance terms evaluated by the monitoring efforts are: basin inflow,
basin outflow, and change in storage. Through monitoring, two of the three mass balance terms
14

can be quantified. The third term can then be found using the Mass Balance equation.
Mass Balance Equation:
O=J±Os
where: 0 = outflow from sediment basin (water or sediment)
I = inflow into sediment basin (water or sediment)
68 = change in storage in the sediment basin (water or sediment)
If needed, additional terms could be inserted into the equation for such parameters as infiltration
into the basin floor or errors that may result from measurement.
After quantifying the sediment inflow, outflow, and change in storage for a runoff event or a
series of runoff events, the efficiency of the basin can be determined. The removal efficiency of
the basin is the percent of sediment entering the basin that is captured.
Removal Efficiency Equation:
[-0 Eff.(%) : __ x I 00 [
where: eff. = percent of sediment removed by the basin
I = defined above
o = defined above
5.1 Monitoring Equipment
Personnel were not available to "chase" storms and be consistently available at the site during
15

. .
runoff events to collect samples and measure flow rates. Due to the temporal and spatial
variability of precipitation events it is not always possible to schedule manpower resources to
routinely collect samples and measure flow. In addition, motorized access to the basins was not _
available. To reach the basins to be monitored, the 250 feet (76 m) long, I: 1, rocky fill slope had
to be descended and climbed. A laptop computer along with other materials had to be hand
carried over the fill. Traversing the fill slope while carrying these materials during storm events
or at night would have been difficult and dangerous. Therefore, due to variability of
precipitation events and poor site access - installation of automatic monitoring equipment was
necessary.
Automatic monitoring equipment needed to complete the research included: primary flow
measurement devices, automatic samplers, pressure transducers, data loggers, and other
equipment. A summary list of the equipment used is shown in Table 5.1.
Table 5.1 List of Monitoring Equipmeut Used
SamIlliDg EqWpment Flow MeasurementEqllipment
2 - ISCO automatic samplers 3" Parshall flume
1- SIGMA automatic sampler 6" Parshall flume
90 0 v-notch weir.
D¢pdt Sensor QIId Da_ Lj)ggers Other Equipment.
I - Keller submersible Pressure 3 - Housing units for monitoring
Transducer equipment
2 - ISCO submersible pressure . deep cycle marine batteries
transducers
1 - Campbell Scientific datalogger laptop computer
2 - ISCO dataloggers sample bottles
16
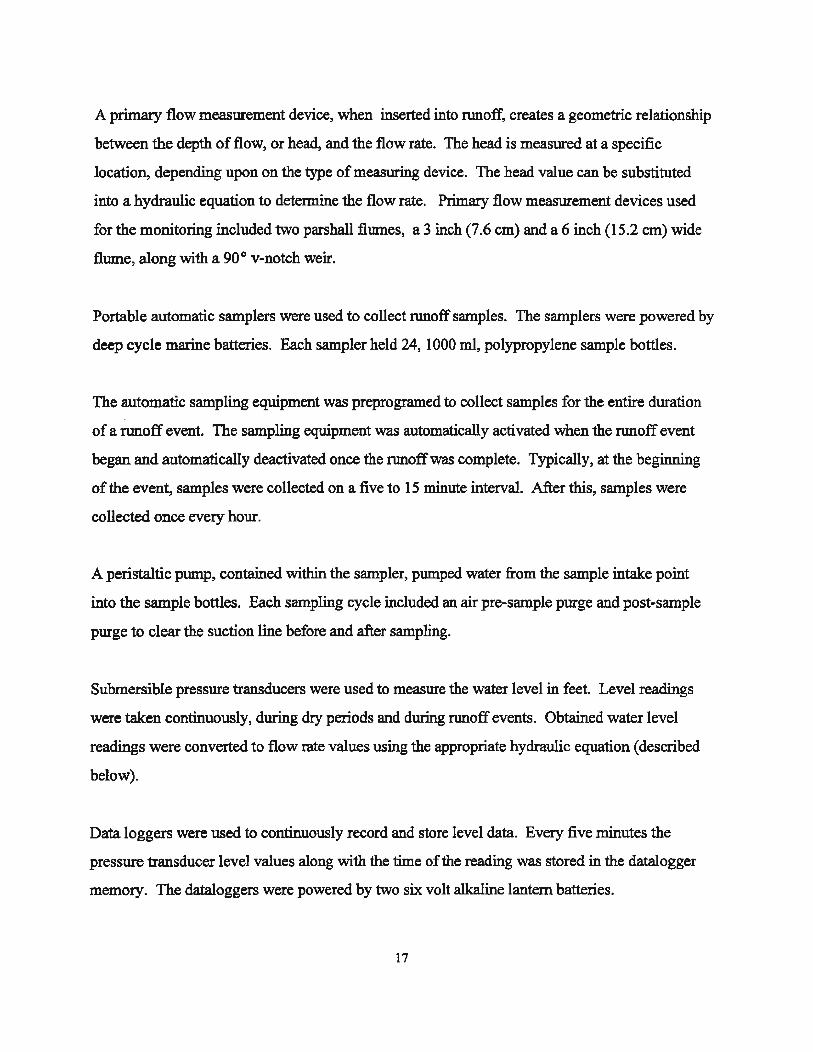
A primaIy flow measurement device, when inserted into runoff, creates a geometric relationship
between the depth of flow, or head, and the flow rate. The head is measured at a specific
location, depending upon on the type of measuring device. The head value can be substituted
into a hydraulic equation to determine the flow rate. Primary flow measurement devices used
for the monitoring included two parshall flumes, a 3 inch (7.6 cm) and a 6 inch (15.2 cm) wide
flume, along with a 90· v-notch weir.
Portable automatic samplers were used to collect runoff samples. The samplers were powered by
deep cycle marine batteries. Each sampler held 24, 1000 mI, polypropylene sample bottles.
The automatic sampling equipment was preprogramed to collect samples for the entire duration
of a runoff event. The sampling equipment was automatically activated when the runoff event
began and automatically deactivated once the runoffwas complete. Typically, at the beginning
of the event, samples were collected on a five to 15 minute interval. After this, samples were
collected once every hour.
A peristaltic pump, contained within the sampler, pumped water from the sample intake point
into the sample bottles. Each sampling cycle included an air pre-sample purge and post-sample
purge to clear the suction line before and after sampling.
Submersible pressure transducers were used to measure the water level in feet. Level readings
were taken continuously, during dry periods and during runoff events. Obtained water level
readings were converted to flow rate values using the appropriate hydraulic equation (described
below).
Data loggers were used to continuously record and store level data. Every five minutes the
pressure transducer level values along with the time of the reading was stored in the datalogger
memory. The dataloggers were powered by two six volt alkaline lantern batteries.
17

A laptop computer was used to extract the level reading data from the data logger.
To prevent theft and vandalism, the monitoring equipment was kept in a housing unit. The
housing unit was locked and it was secured in place by anchors or cables. The housing unit was
made of metal and it was approximately 3 feet (1 m) by 3 feet (1 m) at the base and 2.5 feet (0.8
m) tall.
5.2 Monitoring Location and Scheme
To determine sediment removal efficiency, monitoring of runoff events was undertaken at two
different sediment basins. One of the basins monitored was at station 328+03. The other basin
was at station 342+06.
The monitoring data obtained at 342+06 was not analyzed nor used in this research report since
the data obtained was not reliable. During the monitoring period there were numerous times
when the data logger readings were not reasonable. This problem could have been due to a poor
wiring connection between the battery power source and the datalogger. Or it could have been
due to the datalogger malfunctioning. As a result of the unreliable datalogger values, it is not
possible to accurately determine the hydrograph (flow rate and time relationship) values for
runoff events. In addition, due to the datalogger problems, only a limited number of runoff
samples were collected. Therefore, accurate determination of the sediment concentration for
storm events was not possible.
Fortunately, monitoring runoff and collecting runoff samples presented far fewer problems at the
sediment basin at station 328+03. Therefore, the results of the monitoring at 328+03 will be
used to determine the sediment removal efficiency of the sediment basins.
At station 328+03, the hydrograph values were obtained for stormwater runoff events. The
18

volume of runoff entering the basin and exiting the basin was recorded by the dataloggers.
Runoff samples were collected for both basin inflow and outflow. Also, the sediment
concentration in mg/l was determined for each of the samples.
To obtain the mass of sediment entering and leaving the basin for a runoff event, the sediment
concentration values were multiplied by the appropriate runoff volume. The Mass Balance
equation was then used to determine how much sediment was captured within the basin. Finally,
having quantified the sediment inflow, outflow and amount captured - the sediment removal
efficiency was then determined.
A 3 inch (7.6 em) Parshall flume was installed just downstream of the basin discharge pipe. All
water discharged from the basin was directed through the flume. Head in the flume was
continuously measured by a pressure transducer. A datalogger recorded the head readings during
periods of no flow and during runoff events. Installation of the flume along with continuously
recording of the head in the flume provided the data necessary to determine the volume of runoff
exiting the basin.
A 90-degree v-notch weir was installed in a drop inlet up-gradient of the sediment basin to
facilitate measurement of the inflow volume. The weir head was continuously measured by a
pressure transducer. A datalogger recorded the head readings during periods of no flow and
during runoff events. Installation of the weir along with continuously recording of the head
provided the data necessary to determine the volume of runoff entering the basin.
Flow depth information, saved in both the inflow and outflow dataloggers, were routinely
retrieved. A laptop computer transferred information from the datalogger to an electronic
computer file. These files were then later used to generate basin outflow hydro graph
information.
19
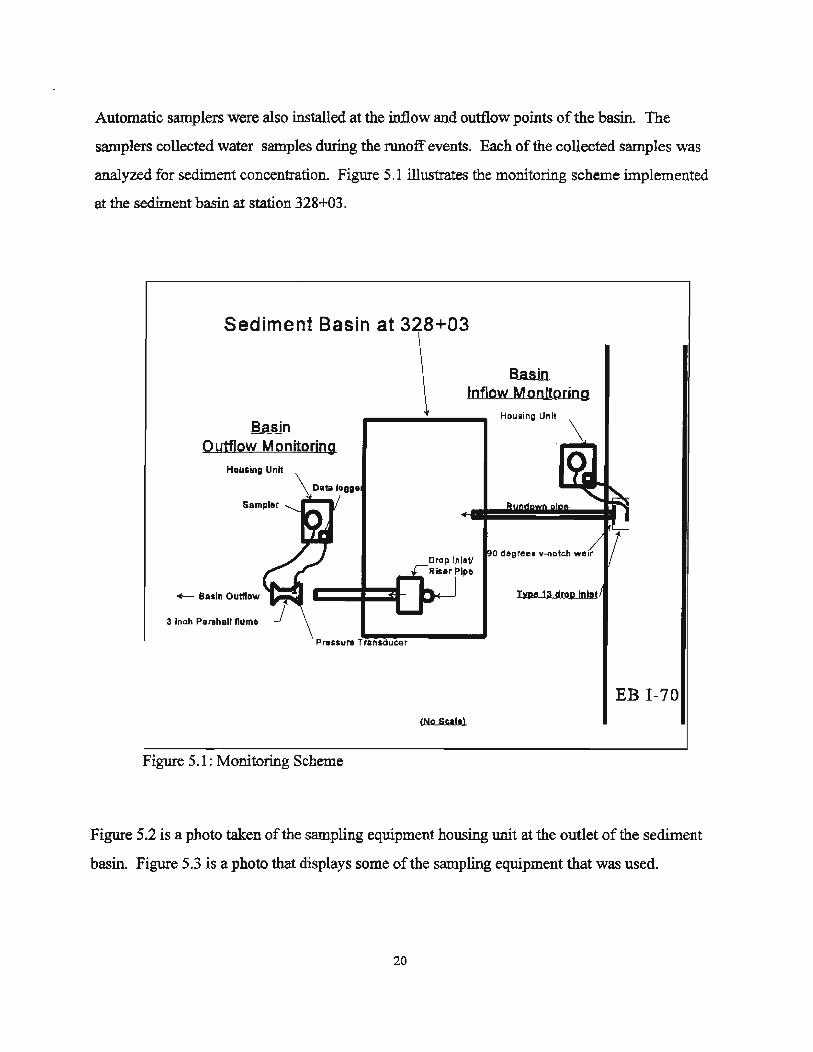
Automatic samplers were also installed at the inflow and outflow points of the basin. The
samplers collected water samples during the runoff events. Each of the collected samples was
analyzed for sediment concentration. Figure 5.1 illustrates the monitoring scheme implemented
at the sediment basin at station 328+03.
Sediment Basin at .;JLO"-U.;J
Basin Outflow Monitoring
Houling UnH
of-- e •• ln Outflow
3 Inch Parshall flume
Figure 5.1: Monitoring Scheme
(NO sc,I,)
B.a.s.in Inflow Monltpring
HOllling Unit
EB 1-70
Figure 5.2 is a photo taken of the sampling equipment housing unit at the outlet of the sediment
basin. Figure 5.3 is a photo that displays some of the sampling equipment that was used.
20

P:gu.--e 5.3 - S=piir.g Equipmer.t. Fron: left to right.: pressu.""e transduce:-, a:l:o:natlc sampler, a,--' ·now '"-'- 'oo-g-......... ~ UU.,.4.o;.. C 101 ....

6.0 Data Collection and Analysis
The following sections describe the data collected and analyzed as part of this research which
includes: basin surveying, nmoff volwne and sediment concentration, and sediment size of soil
and water samples.
6.1 Basin Survey and Sediment Accumulation
Not all eleven basins were surveyed because at the time of the first surveying effort, which was
the Fall of 1993, construction of all the basins had not been completed. To determine the volume
of sediment captured, surveying was completed for the seven sediment basins that had been
constructed.
The 1993 survey established the constructed geometry for each of the basins. Permanent bench
marks were installed around the basin perimeter so that future surveying could be completed
using the same elevation datwn and cross section locations.
A baseline was established between two of the bench marks. These benchmarks were located on
opposite ends of the basin and were installed on the top of the basin embankment. An elevation
of 100 (30 m) was asswned for one of the benchmarks. Elevations of the survey shots were then
determined relative to the asswned elevation.
Cross sections were surveyed throughout the basin interior and at the top of the basin
embankment. The nwnber of cross sections obtained for each basin varied depending upon the
size of the basin. On average, 8 sections were obtained per basin.
In the Fall of 1994 each of the seven sediment basins was re-surveyed. Baselines were
reestablished between the two benchmarks. Cross sections were re-surveyed at the same
22

locations as they had been in 1993.
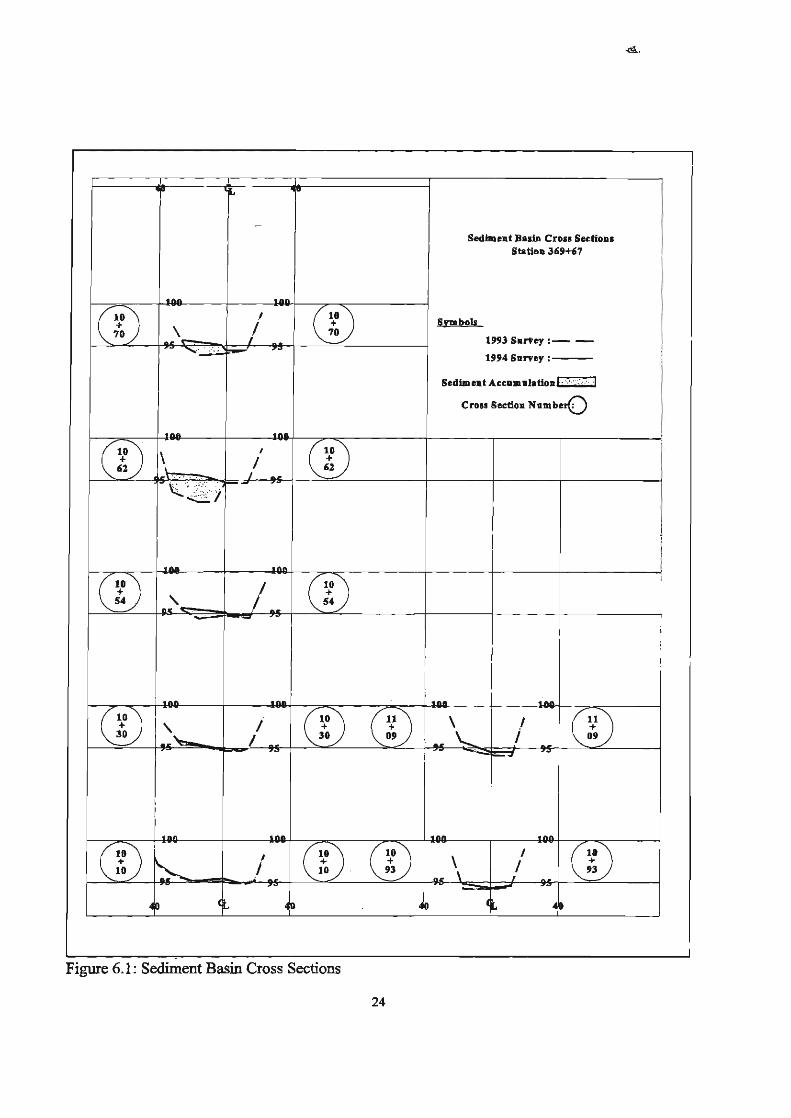
The survey data collected in 1993 and 1994 was entered into the software program Eaglepoint.
This was done so that basin geometry and volume of sediment captured could be determined. In
addition, Eaglepoint and Autocad were used to graphically display the cross sections and review
the survey information. Figure 6.1 is an example of cross sections for one of the basins (station
369+67). Cross section plots, similar to Figure 6.1, were generated for each sediment basin.
Table 6.1 displays the survey dates and the volume of sediment captured for the seven basins. In
all, the sediment basins captured 435 cyl (333 m3) more than a one year period. The actual
number of days between surveys is a little different from 365 days; however, for practical
purposes it can be assumed that the captured volume represents the quantity for one calendar
year. Most of the sediment transport occurs in the spring and early summer during snowmelt
runoff events. Conversely relatively little sediment is transported during the Fall months of
October and November. Therefore, not surveying exactly 365 days after the first survey in the
Fall of the year will not provide significant error.
Table 6.1 Sediment Volume Captured by the Surveyed Basius
Sednnent Basin Volume ()f Captured LOcation Date of 1st sUrvey Date of 2nd Survey S~bnent _ yd3
127+00 Oct 29,1993 Oct 26,1994 11
286+79 Nov 6,1993 Oct 26,1994 14
291+50 Oct 29,1993 Oct 19, 1994 11
328+03 Nov 3,1993 Oct 20,1994 26
334+97 Nov 3,1993 Oct 20, 1994 71
369+67 Oct 28,1993 Oct 26, 1994 89
394+92 Oct 28, 1993 Oct 14, 1994 213
Total Volume Captured ....... 435 yd3 (333 m3)
23
~
-Sed.ba.at aasiD. Croll Sedio.s
Statio. 36'",,7
( ro) I ( ;:) S,..bob \ / 1"3 Sarter:- -
...... " . ' "'-".- .,,4 Sa"e, :--
SedimeatAcc •• alatio.r::::::J
Cro .. Sectioa N •• be0
(~) \ I (~)
". ' " / \;." /i : ;, ~I
! I
I ,
(~) i .:- / (~)
, I , I
I i I
I
--
00 ~--. / (}:) ( ::) \ I (~) \... i i -~
I
I
-'-""-
(~) I (~) (::) \ I (::) r--.... ! -, L 4 4 ~
,
Figure 6.1: Sediment Basin Cross Sections
24

6.1.1 Weight of Sediment Captured
To determine the weight of sediment captured between the date of the first and second surveys,
the volumes obtained from the surveying were multiplied by the unit weight (lb/ft3) of in-situ
sediment.
For unit weight determination two different methods were used. For th~ first method, samples of
captured sediment were collected using a 2.84 inch (7.2 cm) diameter cylinder. Two samples
were obtained from the sediment deposition in the basin at station 394+92 and a third sample
was obtained from the basin at station 342+06.
The cylinder was slowly and carefully pushed into the sediment to avoid disturbing the
surrounding sediment. The sediment sample filled a portion of the cylinder. The cylinder was
then capped and the sample was given to the CDOT Materials Lab for weighing.
The volume and weight for each of the samples were determined. The unit weight was then
determined by dividing the sample weight by the sample volume. The average dry unit weight
from the three samples was 93.8 IblfP (1503 kglm3).
For the second method, a nuclear density gage was used to determine the in-situ unit weight. In
October 1995, CDOT's Region 1 Construction took five representative (different locations
within the basin) density gage tests in one of the sediment basins. The average of the five tests
resulted in a sediment unit weight of 107.5 lb/ftl (1722 kg/m3).
An average of the nuclear density gage and the cylinder results should provide a reasonable
estimate of the unit weight. This average is 101 Ib/ftl (1618 kg/m3). This sediment unit weight
is representative of what would be found in all the basins since the type of material (sanding
material and cut slope sediment) is consistent from basin to basin.
25

The weight of sediment captured within each of the basins was detennined by multiplying the
unit weight of 101 1b/ft3 (1618 kg/m3) by the captured sediment volwne. See Table 6.2.
Table 6.2 Weight of Sediment Captured by the Surveyed Basins
Sediment Basin ¥tllmnil of'C~ 'WeiglttofSediment Location Sedi'ment - ytP Captured -lb
127+00 11 29,997
286+79 14 38,178
291+50 11 29,997
328+03 26 70,902
334+97 71 193,617
369+67 89 242,703
394+92 213 580,851
Total 435 yd3 1,186,245 Ib (333 m3) (538,460 kg)
6.1.2 Drainage Areas Tn"butary to the Sediment Basins
To estimate the amount of sediment captured in the basins that had not been surveyed, it was
necessary to develop a relationship between drainage area or roadway length and the amO\mt of
sediment captured in surveyed basins. The sediment load to the lUl-surveyed basins will vary
depending upon the drainage area size and sediment source (sanding operations or cut slopes).
Table 6.3 is a summary of the pavement, cut slopes, and off site drainage area tributary to each
sediment basin. In addition, the roadway length of WB and EB 1-70 is described.
26

Construction of the entire project had not yet been completed when the 1993 surveying efforts
were undertaken. There were some drainage inlets that were plugged that were to be reopened
prior to completion of the P!9ject in 1994. As a result, some of the drainage areas to the
sediment basins during the surveying/monitoring period were different from what they were after
construction of the project. For this reason, Table 6.3 is separated into two different categories,
one for the monitoring period and one for after construction.
6.1.3 Estimated Annual Sediment Load Captured by all Basins
To estimate the annual amount of highway sand captured by the non-surveyed basins,
information obtained for the basin at 328+03 was used. This basin has the longest distance of
EB roadway contributing sand to it. Also, it is more toward the center of the project. This is
important since the sand application rates vary depending on the basin location. Basins located
more towards Eisenhower Tunnel (these are at a higher elevation) will receive more sand. Those
located at a lower elevation receive less sand.
The amount of sand captured at 328+03 during the one year period was 70,902 pounds (32,184
kg). The length ofEB 1-70 roadway to this basin is 700 feet (213 m). Based on the annual
captured weight and roadway length, the annual capture rate of sanding material per writ length
of roadway is 101lb per ft (151 kgim) ofEB roadway. It should be noted that EB 1-70 has three
travel lanes. The annual capture rate, in terms of pounds per acre of highway pavement (3-12
feet wide driving lanes, 4 feet inside shoulder, and 10 feet outside shoulder), is 88,300 Ib/acre
(99,000 kglha).
Some of the maintenance procedures for plowing, sweeping, and collecting sand for EB 1-70 are
different then they are for WB 1-70. Therefore, the sediment basin capture rate of 101 pounds
per foot (151 kg/m) determined for EB 1-70 will not exactly match that ofWB 1-70. However,
for the purposes of this report it is a reasonable estimate of the sand capture rate for the WB
roadway lanes.
27

Table 6.3 _Drai .d r .. ", T ribut~1"ILk tha roo D~~'~
Monitoring Period - Drainage Areas After Construction - Drainage Areas
Basin PavedDA Road Road Cut Slope
Natural Total DA PavedDA Road Road
Cut slope Natural
Total DA Length-EB Length-WB OIfs~e Length-EB Length-WB Olfs~e
Location (acres) (ft) (ft)
(acres) (acres)
(acres) (acres) (ft) (ft)
(acres) (acres)
(acres)
401+00 nla nla nla nla nla nla 1.24 0 1200 3.444 32 36.68
394+92 3.249 850 2200 5.124 70 78.37 1.544 850 550 0.82 3 5.36
382+00 nla nla nla nla nla nla 2.163 1300 650 0.976 19 22.140
369+67 2.049 1200 650 1 5 8.049 2.049 1200 650 1 5 8.05
351+51 nla nla nfa nla nla nla 2.124 1850 0 0 0 2.124
~ .
342+06 nla nla nla nfa nla nfa 2.226 950 1100 1.928 28 32.15
334+97 1.526 700 700 0.803 9 11 .33 1.526 700 700 0.803 9 11 .33
328+03 0.803 700 0 0 0 0.80 0.803 700 0 0 0 0.80
,
291+50 0.8 400 0 a a 0.8 0.8 400 0 0 a 0.8
286+79 0.8 350 200 0 0 0.8 0.8 350 200 0 0 0.8
127+00 0.568 550 0 0 0 0.588 1.136 550 550 1.136 6.5 8.772
_ .. --

Estimate of Cut Slo.pe Materia! Captured by the Surveyed Basins
Of the sediment basins surveyed, three of these had a source of materia! from the cut slope as
weI! as sand from winter maintenance sanding operations. Using the 101 pounds of sanding
materia! captured per linear foot (lSI kglm) ofEB or WB 1-70, it is then possible to estimate the
amount of sediment captured from the cut slopes.
One thing to note is that the sediment load from the natura! watershed is low relative to the loads
from the cut slopes and sanding operations. Therefore, for purposes of estimating the amount of
materia! contributed from the cut slopes, it is reasonable to ignore sediment load from the natural
watershed.
As displayed in Table 6.4, the estimated average amount of sediment captured in surveyed
sediment basins from cut slope areas is 58,040 lb/acre (65,100 kg!ha).
Table 6.4 Quantity of Material Captured from the Cut Slopes
Sediment 'rotld l'ntalEB (1) ·SediIne ........ .... nt C!¢slope Basin AmOUil.t CutSlupe andWB Amount Amount material . ..
Location C"d Area Road froll'1 Sand frOIl1 cut captured Ott) (acres) Length (it) (Th.) slope (Th) (lb/acre)
394+92 580,851 5.124 3,050 308,050 272,801 53,240
369+67 242,703 I 1850 186,850 55,853 55,853
334+97 193,617 0.803 1400 141,400 52,217 65,027
Average •.••. 58,040 Ib/acre (65,100 kglha)
(1) Based on: roadway length x 1011b/ft.
29

Estimated Annual Capture of all Sediment Basins
For those sediment basins where the tributary drainage area changed and for those basins that
were not surveyed, basin loadings are based on the predicted highway sand capture of 101 lb/ft _
(151 kg/m) for EB 1-70 and 101 lb/ft (151 kg/m) for WB 1-70. In addition, the estimated loading
from cut slope areas is based on 58,040 lb/acre (65,100 kg/ha).
For those surveyed sediment basins where the drainage areas did not change between the
monitoring period and after construction, the amount of captured materia! is based on that found
from the surveying effort.
The estimated amount of sand and sediment captured by all eleven basins annuaIly is 985 tons
(894 m-ton). Of this total amount, approximately 293 tons (265 m-ton) of sediment is captured
from the cut slopes and 692 tons (627 m-ton) of sand is captured from the winter maintenance
sanding operations. See Table 6.S for a breakdown of the annual amount of sediment captured in
each sediment basin.
The 985 tons (894 m-ton) of sediment captured annuaIly is a reasonable estimate of what can be
expected during the operational life of the basins. Factors that win influence the actual annual
capture rate include such things as: changes in sand application rates or clean up practices (such
as sweeping) by CDOT Maintenance forces, climatic conditions which win influence the amount
of sand applied to the pavement, and addition or removal of controls (such as silt fence) that
capture sediment from the cut slope areas.
30
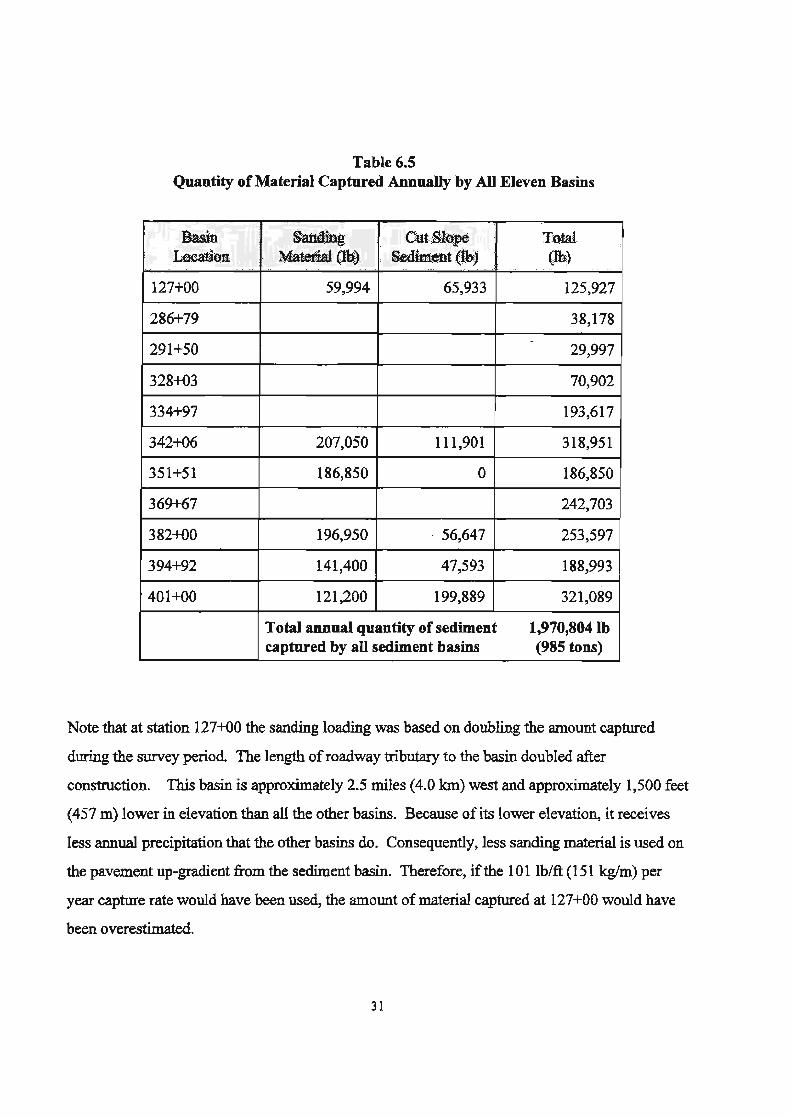
Table 6.5 Quantity of Material Captured Annually by All Eleven Basins
Basin Sanding CutSlt$e Total Location Material (lb) Sedimetlt (lib) (lb)
127+00 59,994 65,933 125,927
286+79 38,178
-291+50 29,997
328+03 70,902
334+97 193,617
342+06 207,050 111,901 318,951
351+51 186,850 0 186,850
369+67 242,703
382+00 196,950 56,647 253,597
394+92 141,400 47,593 188,993
401+00 121,200 199,889 321,089
Total annual quantity ofsediment 1,970,804 Ib captured by all sediment basins (985 tons)
Note that at station 127+00 the sanding loading was based on doubling the amount captured
during the survey period. The length of roadway tributary to the basin doubled after
construction. This basin is approximately 2.5 miles (4.0 Ian) west and approximately 1,500 feet
(457 m) lower in elevation than all the other basins. Because of its lower elevation, it receives
less annual precipitation that the other basins do. Consequently, less sanding material is used on
the pavement up-gradient from the sediment basin. Therefore, if the 101 lb/ft (151 kg/m) per
year capture rate would have been used, the amount of material captured at 127+00 would have
been overestimated.
31

6.1.4 Basin Clean Out Cycle
During the design phase of the Straight Creek Erosion Control project, the amount of sediment
captured by the basins and the basin clean out cycle were estimated. All of the basins, except
the one at station 291 +50, were sized for either two or five years of sediment accumulation.
Since access to the basin at 291+50 was very easy, it was designed for ~ent removal
annually. This section compares the design clean out cycle with that which can be expected
based on survey information. The clean out cycle based on the survey information should
provide a more refined estimate of sediment removal requirements. Table 6.6 summarizes this
information.
As can be seen from the table, the clean out cycles predicted during the design phase for most of
the basins are reasonable when compared with the anticipated clean out cycle based on the
survey information. The anticipated sediment removal cycle varies from once every 0.9 years at
station 401+00 to once every 9.1 years at station 286+79.
The basins at 401+00 and 342+06 will require the most frequent cleaning - at a clean out cycle
of 0.9 year and 1.4 years respectively. The sediment basin at 394+92 is another one to keep an
eye on even though it is estimated that it will require sediment removal only once every 2.2
years. This is due to the fact that this basin captured more sediment than expected during the
survey period. However, some of the runoff that was tributary to the basin during the
monitoring has been diverted to another sediment basin. This should decrease the loading to the
basin.
32

Table 6.6 Basin Clean Out Cycle
-~Tota1 From Survey, (l)Bas~Qn
Sedilllent Design, Clean liilfope¢ied Amlu!il Survey.aevi;sed BaSin Uxilltion Vobnne(fP) Out C}~le (".-J AtnountC~ Cl¢lln O~t cycle
(tta) (Yr')
127+00 2644 (2) 2 1247 - 2.1
286+79 3450 5 378 9.1
291+50 1640 1 297 5.5
328+03 2420 2 702 3.4
334+97 3020 2 1917 1.6
342+06 4290 2 3158 1.4
351+51 6210 2 1850 3.4
369+67 12600 5 2403 5.2
382+00 7120 5 2511 2.8
394+92 4180 2 1871 2.2
401+00 2630 5 3179 0.9
(1) Total deSign volume diVided by the annual amount captured. . (2) As constructed volume, major revision to the basin geometry during construction.
The basins at stations 286+79 and 291 +50 appear to be the most underutilized. These basins can
accommodate additional sediment accumulation without adversely affecting the maintenance
clean out cycle. Under a future project(s), runoff from additional highway drainage areas could
be diverted into these basins.
Even with the above refined estimate of the necessary basin clean out cycle, it is very important
to keep in mind that CDOT Maintenance forces should routinely observe the basins to assess
sediment removal needs. Information provided in the October 1993 "Sediment Pond
33

Maintenance Report" should help Maintenance forces more accurately identify when sedim<:nt
removal is required. This is especially necessary considering the facts that some of the actual
constructed volumes of the basins differ from the design volwnes and that the sand application
rates will vary from year to year depending on the weather conditions.
6.2 Monitoring of Runoff Events
Basin inflow and outflow hydrograph data, sediment concentration data, and information on the
size of sediment in the runoff was collected to determine the efficiency of the basins in
removing sediment from the runoff. This data was collected for the sediment basin at station
.328+03 to estimate the sediment removal efficiency of all basins. To obtain the hydrograph and
sediment concentration data, a variety of monitoring measures were performed.
Monitoring of the runoff events included collection of samples to determine the concentration of
sediment in both the basin inflow and outflow. The runoff flow rate and volwne were also
measured at the basin inflow and outflow. Finally, the size of sediment in the basin outflow was
determined.
Monitoring of the basin at station 328+03 commenced on July 27, 1994 and ended on October
26, 1994. During this time, runoff and sediment concentration data was collected for:
• three rainfall events
• two simulation events
• one snowmelt event
6.2.1 Charaderistics of the Sediment Basin at Station 328+03
Since the volume and release structure for each of the eleven sediment basins were designed
34

similarly, the efficiency results determined from monitoring 328+03 should be representative of
all basins. Also, the WQCV for this basin is on the low side compared with some of the other
larger basins. Therefore, the WQCV will be emptied from the 328+03 basin somewhat faster
than the other basins. As a result, the efficiency results obtained from monitoring may be
slightly less than that of some of the other basins.
This section contains geometric and hydraulic information about the sedjment basin at station
328+03. This information should be useful to fully understand the characteristics of the basin.
Figure 6.2 is a contour drawing of the basin. In addition, Table 6.7 describes the elevation, area
and volume relationship of the sediment basin.
No Seale
Figure 6.2: Station 328+03, Contour Map
35

Table 6.7 Station 328+03, Elevation-Area-Volume Relationship
El¢;Vation CUmll1ative (ft) At:ea{W) Vol1lme (ft3)
93.0 93 0
94.0 880 503
95.0 1340 1658
96.0 1550 . 3103
97.0 1760 4758
Figure 6.3 illustrates the riser pipe and the pipe perforations. The hydraulic perfonnance of the
riser pipe is computed using the orifice equation. This perfonnance is summarized in Table 6.8.
~ 12 inch Diameter Perforated Riser Pipe
I 0.5 inch diameter perforations
Drop Inlet • • · .. ~n • • • r.n
• • • ~n 12 In diil,
• • • Tsin • • •
~n
Note.,
1) The riser hal 7 rowl .fperforations. 2) Bottom. 2 rowl .ave 5 perforationl. Other. hav 3) The riler pipe material i. polyethelene.
• • • Tn • • • J!J!I Elevation of 1st Row = 92.9.
Figure 6.3: Riser Pipe
36

Table 6.8 Riser Pipe Hydraulics
stage DischaJ:ge (gpm) Slev. (tt) .
Row I Row 2 Row 3 Row 4 RowS Row 6 Row 7 Total
92.9 0 0 0 0 0 - 0 0 0
93.4 8.5 0 0 0 0 0 0 8.5
93.9 13.4 8.5 0 0 0 0 0 21.9
94.3 17.0 13.4 10.2 0 0 0 0 40.6
94.9 19.9 17.0 16.1 6.2 0 0 0 59.3
95.4 22.5 19.9 20.4 14.0 6.2 0 0 83.0
95.9 24.8 22.5 23.9 18.7 14.0 6.2 0 110.1
96.4 26.9 24.8 27.0 22.5 18.7 14.0 6.2 140.1
96.9 28.8 26.9 29.7 25.7 22.5 18.7 14.0 166.4
Notes: 1) See the nser pIpe figure for perforation configuration. 2) Row 1 is the lowest row of perforations. Elevation of first row is 92.9. 3) The orifice equation (Q=C* A "'(2*g*H)·S) used to compute the riser pipe discharge. 4) A=opening area, C=discharge coef., 0.6.
Using the riser pipe release discharges in Table 6.8 and the elevation-volume relationship of the
constructed basin shown in Table 6.7, it is possible to compute the emptying time of the WQCV.
This computation shows that the WQCV of 1310 ft3 (37 m3) would empty from the basin in 10.3
hours. See Table 6.9. It should be noted that this computation assumes that the WQCV entirely
enters the basin before emptying begins. There is no accounting for the flow that is released
during the time that the inflow hydrograph is filling the basin.
37

Water EleVl!ti<m €ft;)
94.4 to 94.6
93.9 to 94.4
93.4 to 93.9
92.9 to 93.4
Totals
6.2.2 Weir Calibration
Table 6.9 Emptying Time ofWQCV
Avetage Riser Pipe WQCV Released Release Rate
(ft3) (¢fs)
287 .0100
520 .0700
350 .0336
153 .0095
1310fi3
~T' . . ", , . ·'·lIIle (lit)
0.8
2.1
2.9
4.5
10.3 hours
A 90° v-notch weir was used as a primary flow measurement device to quantify the rate and
volume of runoff entering the sediment basin at 328+03. The weir was installed inside a Type 13
inlet. This inlet was located in the concrete valley gutter along the south side ofl-70. From the
inlet, the runoff was conveyed into a pipe that discharged into the sediment basin. See Figure
5.1.
The hydraulic characteristics of the weir were used to compute the basin inflow rate. The
standard equation for a 90° weir is:
where: Qw= weir discharge (cfs)
H=head(ft)
The flow conditions at the weir were not ideal. Water entering the Type 13 inlet, just in front of
38

the weir, was somewhat turbulent. Also, the small size of the inlet did not allow measurement of
head at the standard distance behind the weir. Finally, sediment buildup behind the weir had
potential to affect the weir hydraulics. It should be mentioned that throughout the monitoring
period the weir was observed for sediment buildup. The sediment depth did reach an equilibrium
point behind the weir.
To compensate for these non-ideal flow condition for weir flow, calibration of the weir equation
was undertaken. This was accomplished by using the flow monitoring results from the August
26 and August 29 simulation events. These events are described in a following section.
For the simulation events, a known volume of water was discharged from a water tanker through
the weir and into the sediment basin. The volume of water delivered from the water tanker was
1,069 ft3 (30.3 m3).
During the simulation events, the head at the weir was recorded at one minute intervals. The
standard weir equation was then used to determine weir discharge. Using the computed
discharge values, the event volume was then computed.
For the August 26 event, the computed volume using the standard weir equation was 904.6 ft3
(25.6 m3). The actual volume, 1,069 ft3 (30.3 m3), exceeded the computed volume by 18.2%.
For the August 29 event, the computed volume using the standard weir equation was 917.5 ft3
(26 m3). The actual volume, 1,069 ft3 (30.3 m3), exceeded the computed volume by, 16.5%.
The conclusion reached was that the standard weir equation was underestimating the actual flow
rate by 17.5% (average of 18.2% and 16.5%). Consequently, all computed inflow discharges for
monitored events were increased by 17.5%.
39
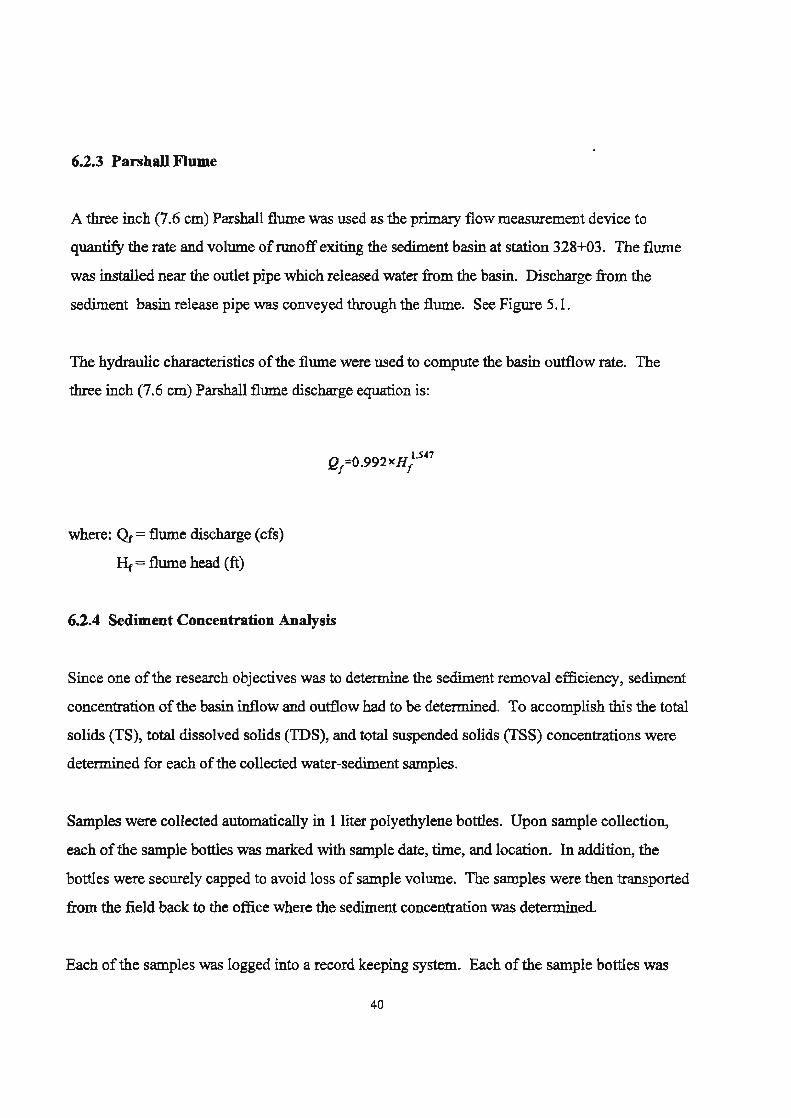
6.2.3 Parshall Flume
A three inch (7.6 cm) Parshall flume was used as the primary flow measurement device to
quantify the rate and volume of runoff exiting the sediment basin at station 328+03. The flume
was installed near the outlet pipe which released water from the basin. Discharge from the
sediment basin release pipe was conveyed through the flume. See Figure 5.1.
The hydraulic characteristics of the flume were used to compute the basin outflow rate. The
three inch (7.6 cm) Parshall flume discharge equation is:
where: Qf= flume discharge (cfs)
Hr= flume head (ft)
6.2.4 Sediment Coneentration Analysis
Since one of the research objectives was to determine the sediment removal efficiency, sediment
concentration of the basin inflow and outflow had to be determined. To accomplish this the total
solids (TS), total dissolved solids (IDS), and total suspended solids (TSS) concentrations were
determined for each of the collected water-sediment samples.
Samples were collected automatically in 1 liter polyethylene bottles. Upon sample collection,
each of the sample bottles was marked with sample date, time, and location. In addition, the
bottles were securely capped to avoid loss of sample volume. The samples were then transported
from the field back to the office where the sediment concentration was determined.
Each of the samples was logged into a record keeping system. Each of the sample bottles was
40

assigned a number based on the location, date and sample number. For example, for the sample
number 818/18-1, the first character 8 stands for the sediment basin at station 328+03, I
designates the sample was talcen at the inflow, 8/18 is the sample date, and -1 represents the first
sample collected for that set of samples. In addition, the time of the sample was recorded.
The first step in the concentration analysis procedure was to determine IDS. A HACH
conductivitylTDS meter was then used to determine the TDS value. A probe from the IDS
meter was inserted into the sample and the IDS value was digitally displayed. The meter has a
readability to 0.1 mg/l.
The sample was then shaken vigorously to uniformly distribute the sediment within the sample.
Approximately 70 ml of the sample was placed into an evaporative dish. The empty weight of
the dish along with the dish plus sample weight was recorded using an electronic scale. The
scale, a Sartorius electronic precision balance, was used to determine sample weights. The
balance, Model BA 210S, has a weighing capacity of210 g and a readability of 0.0001 g.
The sample was then oven dried at a temperature of approximately 100 degrees Celsius. Care
was taken to ensure the temperature did not exceed this value so that sample volume would not
be boiled off. The dry residue weight was then determined and the TS concentration was found
by the following equation:
TS(mg/l) =(ppm) dryresidueweight x 1,000,000 water-sed.weight
Finally, the sample TSS concentration was determined by subtracting the TDS value from the TS
concentration.
In all, 90 samples were collected, analyzed and the results used to determine the sediment
loading entering and exiting the basin. For the basin inflow 39 samples were used and at the
basin outflow 51 samples were used. See Table 6.1 0 and Table 6.11.
41

-pie N"nIher »ato
0''7'''.' 'u131
OM'''.'. 'ul l1 .. _- . , ..... .,,, ....... J"'31
.""'''.'7 'u131
.''71'11'.0 Jul31
.''71'11'.0 '01'1
.Mn ••• n 'u· l1
.''71'11'.'''' ' •• 11 ... " ....... h.1
.,."." h.'
.'."." A.ul
O'RIO •• haO
o'RIO.' 4 .. 00
.UIO.' "uuO
I ••• 10 .... AuaO
I .u"' .• Ana 0
.• '.10-" AuaO
.'R/Q.7 AuaO
.'lIIO.lI AooQ
.'.10..0 AuoQ
.'R/Q.1R AaoQ
~.~ .. ~ . hoI. ~.~.-~ . Au. 1. ~.~ .-~ . Au. 1. ~.~-~ A .. ol. .T.". ~ Auo 1R
~.~ -~ - AnD 10
I .'."0.'7 Ano.Q ~.~ .. ~ ~ Ano'O
~.-.- n.t.
~.-~- . net. ~ .. ~- . n..t.
I •• u_ • n.tll 1 .... _ • n..tll I ftO •• __
Clrt.
no •• n..t8
n •••
Table 6.10 Water-Sediment Samples at Inflow
TDS TS T ..... (1IlW!) (mlifl)
,n·", ''70 1133.n
'n·.~ .m S20A
,.n·An ~. A 3''7~
".M .,0 .. .. ,..,n 'OA 03.4 ,. . .,. .A. ""A
".dR A~7 adO
, •• ,n "'7 A >MA
,. .~ dRO ad.A ·
M·dR .,~ 610
n.·1n A •• 73.7
m·,n dR. ~OR
.o·.~ • O,.A 714.<
.0·An '7V' S<3.0
,n·w " .. 4'4-'
'0'" ""0 '04.6 ,n·.~ ' •. A 2.'<.2
'0'4~ '0< 3<1 .•
,0·" '76 22U
,1 ·0< '<.'1 162_'
21· .. '7.' 3Il'.0
,1·2. 30./1 11<'1
20'1~ lOR. <96.8
,0·20 .... 312.0
n·~ 101. U •.•
n·~~ .. ,. 290.'
on·2~ ... 261.'
nO·'R •• R 1.0.-
OO·An .0. 10l.R
O.·M 16~ 28.0
.0·16 QdR lldOO
.R·lO 77R _10
11-11/1 ~ S42'7'l ..... <n 5373 .•
11·10 .20 I568S.6
12·M 2M 2062.1
12.'0 lQ/1 2454.S
12 •• < 16.' 2352.6 n . .,. .. " '''A6
42
TSS (,.,.!l)
o .... n
A'O~
,~,
80.2
~An
'A' .0 ,
.~. n
A'~
'0 •
"'.A
71.'7
~u • •• n.<
.no .•
" • . 7 106 .•
.,2.'
10'.<
'16.A
'7<.7
.<.1
'0 •. /1
107.A
"7.0
1~. 7
,R47
a7'
.10
a _,
104M
6'1141
<;34;7.
4lIOO .•
I<I~
26R2.1
2264 .•
21R9.6
'OA'76

~!!le N"",bolr
S07/31-1 S07/31-2© S07131-3© 807131-7© 808l1-9© 80811-11
808/9-1 808/9-2 808/9-3 80819-4 S08l9-5
80819-7 S08l9-S
808119-1 808119-2 808119-3 808119-4 808119-5 808119-6 SOS/19-7 S08l19-8
808126-1 808126-2 808126-3 SOS/26-4 S08126-5 S08l26-6 S08l26-7 SOS126-S SOSI26-9 S08l26-1O SOS126-11 S08l29-1 808129-2 R08l29-3 S08l29-4 B08l29-~
SOS/29-6 SOSI29-7 S08/29-S S08l29-9 SOS129-10 808129-11 801018-1 SOI018-2 SOI018-3 SOI018-4 SOIO/S-5 SOIO/8-6
Table 6.11 Water-Sediment Samples at Outflow
IUS 'I'll nlOte Time (mg.l!) (mgll)
JuI31 20:45 85.4 359.4 JuI31 20:50 58.4 313.0 JuI31 21:05 43.9 205.7 JuI31 23:15 42.0 20S.6 Auel 01:15 3S.7 83.7 Au~1 02:45 38.9 85.2
Au9 20:40 72.0 237.8 Aue9 20:45 59.9 196.0 Au .. 9 20:50 52.9 175.6 Au9 21:00 45.0 130.8. Au~9 21:10 38.0 118.8 AUI!9 21:40 30.5 115.3 Au9 22:40 29.0 98.6 Au9 23:40 31.6 251.4
Au 19 00:40 67.5 417.5 Au~19 00:45 54.0 222.7 AUI! 19 00:55 41.8 273.1 Au~19 01:25 27.7 29D.1 Au.e:19 02:25 24.5 161.3 AUI! 19 03:25 24.3 400.7 Aup19 04:25 24.7 350.3 Aue19 05:25 26.5 293.7
Au .. 26 11:00 3S.3 122.7 Au~26 11:05 38.9 13S.4 Au .. 26 11:15 36.6 110.3 Au~26 11:45 35.9 104.1 AUI!26 12:36 35.9 108.6 Au~26 12:45 35.7 129.7 AUI!26 12:47 35.1 112.7 Au .. 26 12:52 34.8 101.3 AU·I!26 13:02 34.4 105.0 Au~26 13:32 34.6 92.4 Au~26 14:32 35.6 75.6 Au .. 29 09:55 39.9 171.3 AUI!29 10:00 3S.9 131.4 Aup29 10:10 36.4 132.S AUI! 29 10:36 35.2 9S.1 Aup29 10:~S 34.1 77.S AUI!29 11:03 33.9 164.0 Au" 29 11:13 33.7 S2.6 Aue29 11:43 32.9 96.0 Au .. 29 12:43 32.6 96.0 Au~29 13:43 33.1 76.S Au .. 29 14:43 34.5 132.8 OetS 10:37 832 9963 OetS 10:47 834 10215 OetS 11:35 793 8229 Oet S 11:49 772 7639 OdS 12:49 71S 5535 OdS 13:49 655 46S4 OetR 14:30 611 407~
43
.• 1»
(mjlll)
274.0 254.6 161.S 166.6 45.0 46.3
165.8 136.1 122.7 S5.8 SO.S 84.8 69.6
219.8
350.0 168.7 231.3 262.4 136.8 376.4 325.6 267.2
84.4 99.5 73.7 68.2 72.7 94.0 77.6 66.5 70.6 57.S 40.0 131.4 92.5 96.4 62.9 43.7 130.1 4R.9 63.1 63.4 43.7 9S.3 9131 93S2 7436 6867 4817 4029 3464

6.2.5 Rainfall Events
The three monitored rainfall events at the basin at 328+03 occurred on July 31 ,1994; August 9, _
1994; and August 18, 1994.
Important to note is that the sand on the pavement, up-gradient from the sediment basin had been
removed by CDOT Maintenance. Prior to monitoring of the rainfall evepts, they had swept the
roadway and shoulder areas to remove the sanding material. Therefore, there was not a source of
sand material available for transport into the basin. In addition, sanding material was not applied
to the roadway during the monitoring of rainfall events.
For all three rainfall events, the TSS load was determined for both the basin inflow and outflow.
The hydrograph was discretized into incremental volumes. The TSS load for the incremental
runoff volume was then calculated by multiplying the sample's TSS concentration by the
appropriate incremental volume. The incremental loads were then added together to determine
the total event mass loading into and out of the basin.
The event mean concentration (EMC) was also calculated for the basin inflow and outflow by
dividing the total mass loading by the runoff volume.
The sediment removal efficiency results were computed based on two different methods. Both
methods use the principles of the Mass Balance Equation. The first method used was based on
the event totals ofTSS mass loading.
Eff.(%) TSSMass(injlow)- TSSMass(ouf) x 100 TSSMass(injlow)
The second method used to compute the sediment removal efficiency was based on the EMCs.
The sediment removal efficiency based on the total mass loading method results in a higher
44

Eff.(%) EMC(injlow)-EMC(out)xlOO EMC(injlow)
sediment removal efficiency than the EMC method. This is due to the fact that much
(approximately 40%) of the runoff volume entering does not exit the basin. Instead, it infiltrates
into the bottom and sides of the basin. The reduced runoff volume exiting the basin results in a
reduced mass of sediment leaving the basin.
The runoff depth from the drainage area for the three events ranged from 0.225 inch (0.64 cm) to
0.448 inch (1.14 cm).
Considering the fact that the size of the sediment transported into the basin was small (there was
no sanding material available for transport - it had been swept by CDOT Maintenance), the basin
showed good removal efficiency for the July 31 and August 9 event. The TSS removal
efficiency, based on storm mass loading, was 55.5% and 72.1 % for the July 31 and August 9
events respectively.
On the other hand, the basin performed poorly for the August 18 event. The basin actually had a
negative efficiency for this event. The total load that entered the basin was 2,209 g and 4,265 g
actually left the basin.
All measured sample TSS concentrations for runoff leaving the basin for the August 18 event
were typically higher than the other rainfall events. Also, the EMC for the outflow was 255.3
mg/l. This is much higher than the other two events. One possible reason for the outflow
sediment concentration being so high was maybe there was some erosion of the slope adjacent to
the basin. The eroded material could have been transported into the basin causing high TSS
concentrations thereby giving unexpectedly high concentration in the outflow.
The basin total TSS mass inflow for the three rainfall events was 12,946 g. Total TSS mass
45
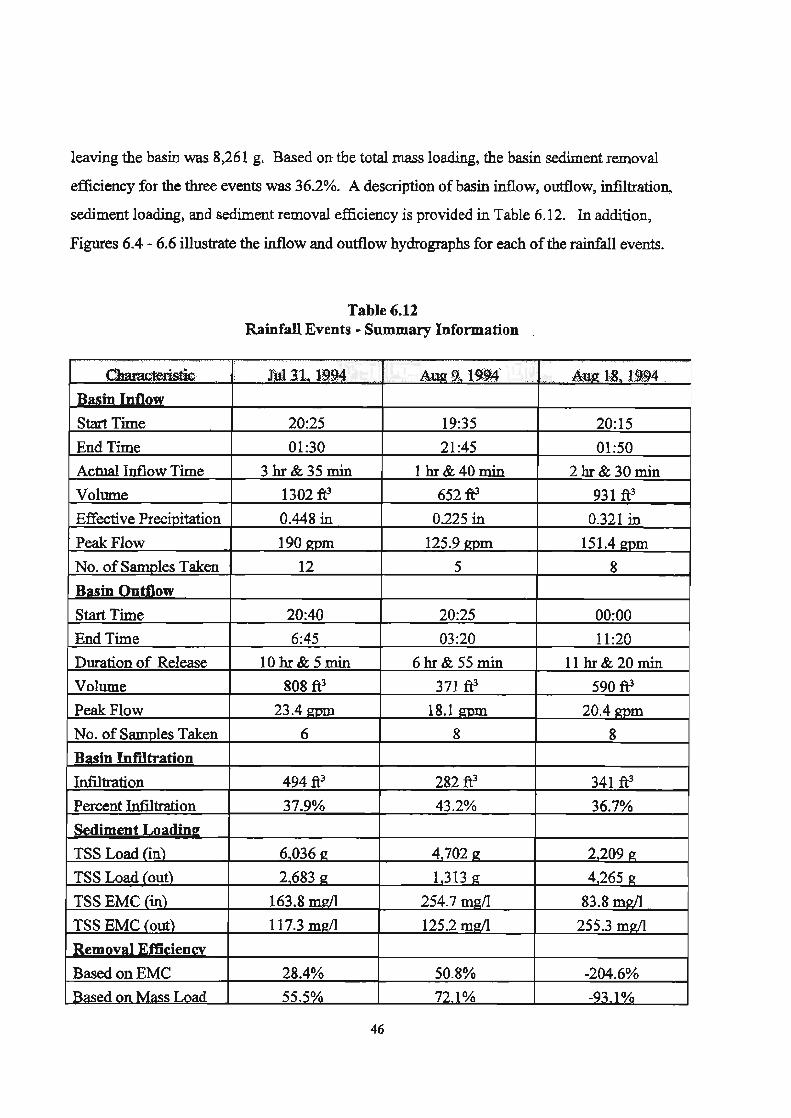
leaving the basin was 8,261 g. Based on the total mass loading, the basin sediment removal
efficiency for the three events was 36.2%. A description of basin inflow, outflow, infiltration,
sediment loading, and sediment removal efficiency is provided in Table 6.12. In addition,
Figures 6.4 - 6.6 illustrate the inflow and outflow hydrographs for each of the rainfall events.
Table 6.12 Rainfall Events - Summary Information
Characteristic lulU 1994 AWl 9 1994 . AtW; 18 1994 .
Basin Inflow
Start Time 20:25 19:35 20:15
End Time 01:30 21:45 01:50
Actual Inflow Time 3 hr& 35 min 1 hr&40min 2hr& 30 min
Volume 1302 ft3 652 ft3 931 fe
Effective Precioitation 0.448 in 0.225 in 0.321 in
Peak Flow 190 IZOm 125.9 IZOm 151.4 IZOm
No. ofSamoles Taken 12 5 8 Huin.n. ... w
Start Time 20:40 20:25 00:00
End Time 6:45 03:20 11:20
Duration of Release 10 hr & 5 min 6hr& 55 min 11 hr& 20 min
Volume 808 ft3 371 ft3 590 ft3 Peak Flow 23.4 IZOm 18.1 IZOm 20.4 gpm
No. of Samples Taken 6 8 8
Basin I tion
Infiltration 494 ft3 282 ft3 341 ft3 Percent Infiltration 37.9% 43.2% 36.7% ., .,J, entLoadinl!'
TSS Load (in) 60362 47022 22092
TSS Load (9ut) 2683 II; 1313 g 426511;
TSS EMC (in) 163.8 m2ll 254.7 m2/l 83.8 ml!!l
TSS EMC (out) 117.3 mg/l 125.2 mwl 255.3 ml!!l ~ vllu;tIWelKV
BasedonEMC 28.4% 50.8% -204.6%
Ra.~ed on Ma.~. Load 55.5% 721% -93.1%
46

~
[ S
Rainfall Runoff - July 31,1994 (Fig. 6.4) Sediment Basin at 328+03
200 "--------------------------______________________________________________________________________ ___
150
Summary Peak Flow (in) = 190 gpm Peak Flow (oul) = 23.4 gpm Time Evenl Started: 20:25 TSS Removal Efficiency: Based on TSS Mass Loading = 55.5%
" 100 • Inflow
• Outflow ~
50
I ."~- "~.ieoo 720 ~~'1t ... '''''i>;~''1!',,(,...'('''J~'>Q;c,!l£U . 600 ~ I 480 I I 360
... ! I 240 Time (min)
• I o 00" 120 o

- --
Rainfall Runoff - August 9, 1994 (Fig. 6.5) Sediment Basin at 328+03
160
sum~ Peak Flow !in) 2 1 5.9 gpm Peak Flow out) = 18.1 fm Time Event Started: 19: 5 TSS Ramoval Efficiency: Based on TSS Mass Loading = 72.1 %
100
E 0.
~ S
• Inflow !! .. <> Outflow II:
~ SO
/ )<: .• ,,/ ~~~~.~ II- .. -.,. ....... >_""~
N~ . ,~ ""i" ~.~~~~ .~~ ~.
100 200 300 400 500 Time (min)

200
150
E c. s t l 11 100
" 0:
~ Ii:
50
o o 200
Rainfall Runoff - August 18, 1994 (Fig. 6.6) Sedimenl ea.in at 328+03
Summary Peak Flow !in) = 151.4 gpm Peak Flow 001) = 20.4 rs TIme Event Started: 20: 5 ISS Removal Efficiency: Based on TSS Mass Loading = -93.1 %
..... ~~:""""""'''''' .. -~nMO(';'; ..... 'l_ ..... ~ __ ;.:.
400 600 600 n me.,{min
1000
• Inflow
-t- Outflow

It should be pointed out that the TSS EMC inflow values for the three events are fairly typical of
highway runoff (without a high source of sanding material). The EMC inflow was 158.3 mg/l.
For comparison purposes, the 1-701I-25 monitoring that was completed as part ofa Federal
Highway Administration study resulted in a TSS of 344.7 mgll. In addition, the TSS values
obtained from the COOT monitoring ofl-225 highway runoff were even higher at 1419 mg/l.
These higher values illustrate that there was no sand being transported into the basin from the
tributary drainage area during the rainfall events.
6.2.6 Simulation Events
The months of the monitoring period were July through October. During this period, the
snowfall, ice, and temperature conditions do not require the application of much sanding
material. Instead, the vast majority of sanding material is applied between the months of
November and May. Monitoring of the basins would be very difficult during the winter and
spring. The snowpack usually remains until late spring. This makes access to the basins difficult
for both sample collection and runoff data collection. In addition, freezing temperatures would
cause operating problems with the automatic sampling equipment. This is because water in the
sampler intake line would freeze preventing samples from being collected.
It was necessary to simulate conditions where sand was available for transport since monitoring
of the basins during the winter months would be very difficult and since CDOT maintenance had
swept and removed the sand on the roadway.
The simulation involved using a water tanker to deliver water into the basin. Sand was mixed
into this water after it was discharged from the tanker. COOT Maintenance provided the water
tanker. The 4,000 gallon (15.1 m3) tanker was parked uphill from the drop inlet leading to the
basin. A valve on the tanker was opened and water was released into a concrete gutter. This
water flowed into the drop inlet. At this point sand was added to the water. The sand-water
50

mixture was then conveyed into a pipe that discharged into the sediment basin.
The 4,000 (15.1 m3) gallon water tanker was emptied in approximately 40 minutes. The tanker
was then driven to the West Portal of Eisenhower Tunnel to be refilled. Upon returning to the
site another 4,000 (15.1 m3)gallons were delivered into the basin. Approximately one hour
elapsed between the time the first tanker was emptied and the beginning of emptying the second
tanker.
Two simulation events, one on August 26, 1994 and the other on August 29, 1994 were
implemented. Two full tankers were used for each event. In all, 8,000 gallons (30.3 m3) were
delivered into the basin for each simulation.
A target EMC of 3,000 mgll was selected for the inflow into the basin. To accomplish this 200
pounds of sand was added to the water entering the basin. The 200 pounds (90.8 kg) of sand was
input into the water throughout the entire duration of the event. It should be noted that TS was
used for determining efficiency rather than TSS since the total weight for the sediment entering
the basin was known. The fraction that was dissolved or suspended was not determined.
The basin showed excellent removal efficiency for the sanding material. The efficiency based on
the average TS mass sediment loading for the two events was 98.6%. The average efficiency
based on TS EMCs was 96.6%.
One interesting thing to note was the high amount of infiltration. The average percent of inflow
that infiltrated into the basin floor was 63%. This is higher than the 40% infiltrated during the
rainfall events. This is probably due to the fact that the antecedent moisture condition was higher
for the rainfall events than during the simulation event. This would result in less inflltration
during the rain events. In addition, during rain events there is some runoff contribution into or
on the basin that does not go through the basin inflow monitoring point. For example,
precipitation that falls directly on the basin adds volume to the basin outflow. Runoff into the
51

basin from the basin's slopes also adds to the outflow volume. Both of these factors help explain
why the infiltration percentage was less for rainfall events than for the simulation events.
A description of the basin inflow, outflow, infiltration, and sediment loading, and sediment
removal efficiency is provided in Table 6.13. In addition, Figures 6.7 and 6.8 illustrate the
inflow and outflow hydrographs for the simulation events.
6.2.7 Snowmelt Event
Snowfull occurred during the afternoon and evening of October 7, 1994 and sanding material
was applied to the roadway. The temperatures warmed on October 8, 1994 and the snow began
to melt at about 10:00 A.MoO
For the snowmelt event the basin showed very good removal efficiency. The efficiency based on
the TSS mass loading was 95.2%. The efficiency based on TSS EMCs was 85.4%.
The amount of sand transported into the basin was very large compared to the rainfall and
simulation events. For example, 385,000 g of sand was transported into the basin during the one
snowmelt event as compared to only 13,000 g for all three rainfall events. The mass of material
transported into the basin for the snowmelt was 30 times more than the rainfall event.
A description of the basin inflow, outflow, infiltration, sediment loading, and sediment removal
efficiency is provided in Table 6.13. In addition, Figure 6.9 illustrates the inflow and outflow
hydrograph for the snowmelt event.
52

Table 6.13 Simulation and Snowmelt Events - Summary Information
Charaotenstic Aug 26, 1994 Allg29., 1994 Oct 8.1994 Simulation Event Simulation Event Shl}wmelt Bv.ent
Ba..in Inflow .
Start Time 10:42 9:35 10:13
End Time 12:59 11 :36 14:50
Actual Inflow Time 1 hr&9min Ohr& 59 min 4hr& 37 min
Volume 1069 ft3 1069 ft3 348 ft3
Effective Precimtation 0.368 in 0.368 in 0.120 in
Peak Flow 315 from 322 from 60.5 froID
No. ofSamnles Taken nJa nJa 9
Basin w
Start Time 10:50 9:40 10:15
End Time 20:05 19:00 18:35
Duration of Release 9hr& 15 min 9 hr & 20 min 8hr&20min
Volume 388 ft3 442ft3 114ft3
Peak Flow 15.9 from 18.1 froID 2.5 from
No. of Samples Taken 11 II 6
Ba.cin...llW!.tratinn
Infiltration 682 ft3 627 ft3 234 ft3
Percent Infiltration 63.8% 58.7% 67.2%
S . Loadinl!:
TSS Load (in) 90 800 II (TS) 90 800 II (TS) 384645 II
TSS Load (out) 1063 II (TS) 1 330 ~ (TS) 18 383 ~
TSSEMC(in) 3001 mgf! 3001 mgf! 39040 mgf!
TSS EMC (out) 96.9mgf! 106.3 mwl 5694mWI
Removal Eflicie1ltV
Based on EMC 96.8% 96.5% 85.4% ~ .~ on Mass Load 98.8% 98.5% 95.2%
53
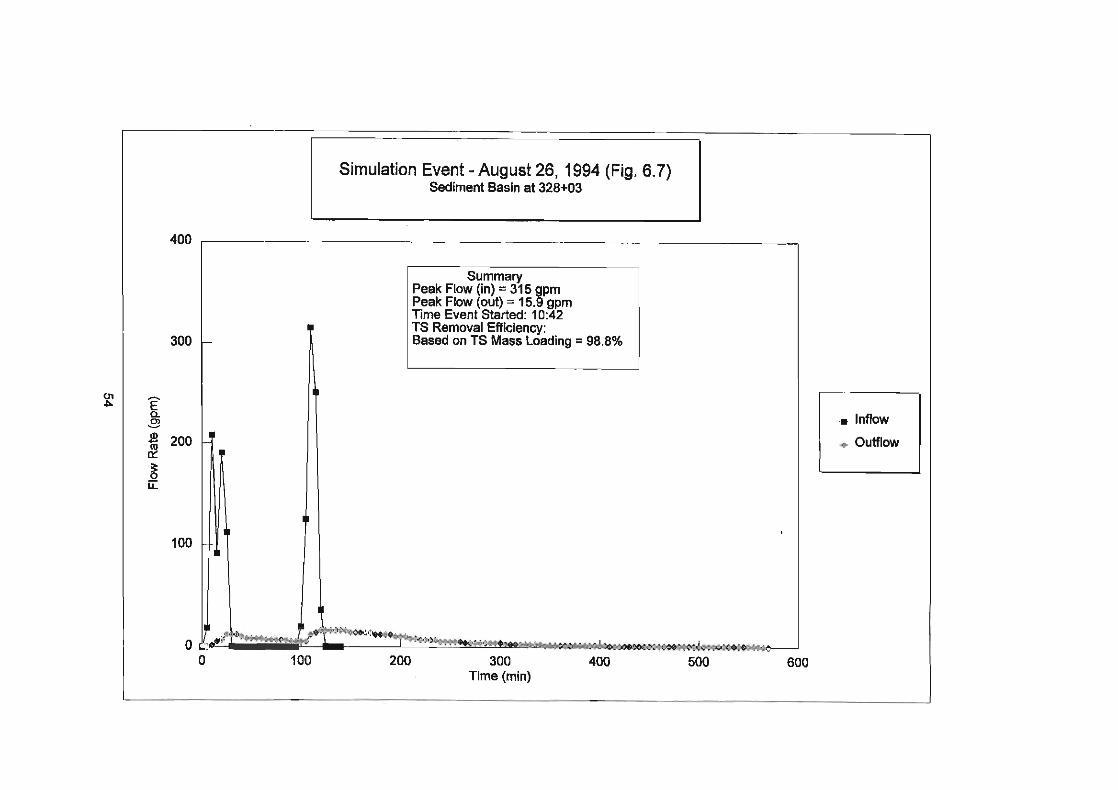
~ I
400
300 f-
~
E
Simulation Event - August 26, 1994 (Fig. 6.7) Sediment Basin at 328+03
Summary Peak Flow (in) = 315 gpm Peak Flow (out) = 15.9 gpm Time Event Started: 10:42 TS Removal Efficiency: Based on TS Mass Loading = 98.8%
r 200 k 1\ I ~ LL
H f 100
.. t·~·"~, .1~')~. .. . y . ' ~ ............. (,""~ .... ~ _, o ~;';; ! '~N I ...... ~>:;;
o 100 200 300 Time (min)
,~~~.)O:<":~,~:(..::.,..,. .... ,,,, __
400 500 600
I .. Inflow
+ Outflow
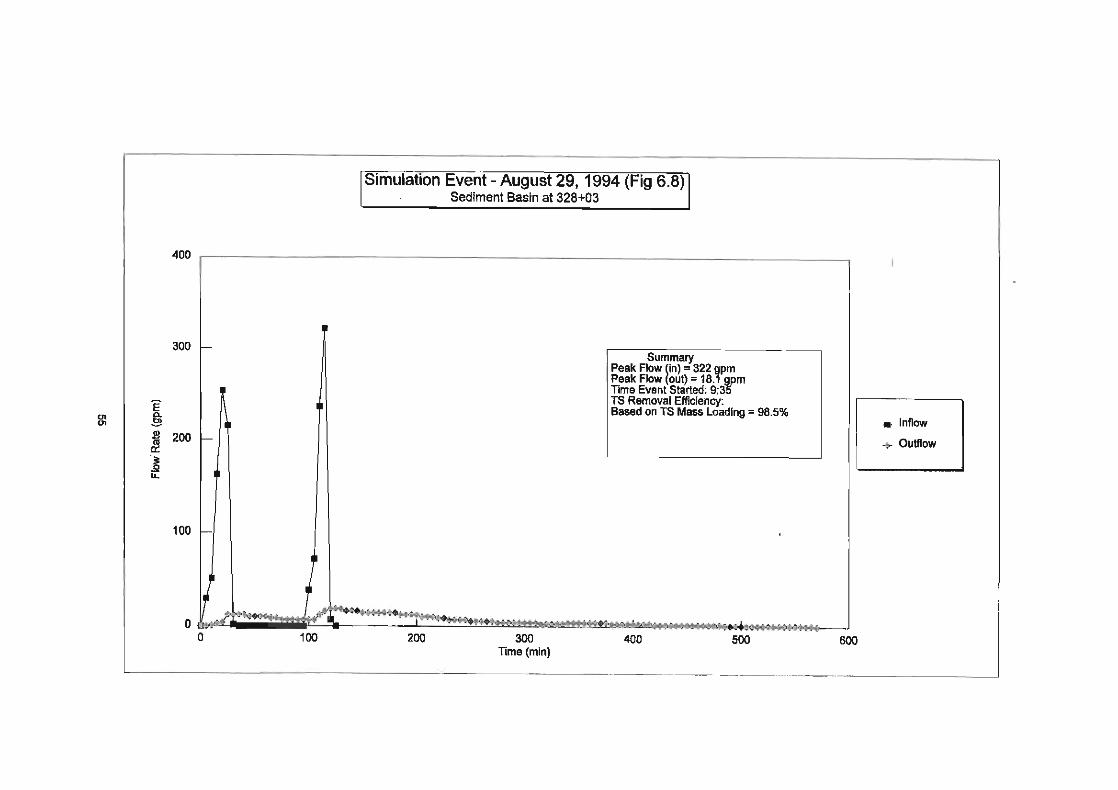
'" '" "[ .!!l
Simulauon Event - August 29, 1994 (Fig 6.8) I . Sediment Basin at 328+03
400 ,---------____________________________________________________ --.
~I-Summary
Peak Flow (In) = 322 gpm Peak Flow (out) = 18.1 gpm Tine Evant Started: 9:35 TS Removal Efficiency: Based on TS Mass Loading = 98.5%
J!! 200 I-.. a: ~ u:
100 I-
I
.J~.,..., !" k;~:. ... ioC+i~ .. M.~\. ... ~ ... ,~~ ... ... ....,... ,.,~.t?+!.(!!I*';. e0111 :, ••• ~:;~»H+c o ~ ~ ~ ~ ~
o 100 Tune (min)
I~
600
• Inflow
... Outflow

E C-Ol ~ en
m
* a:
~ u.
Snowmelt Runoff - October 8,1994 (Fig. 6.9) Sediment Basin at 328+03
80 r--------------------------------------------------------,
60
40
20
o \l,0e"-----"
1000 1200 1400
Summary Peak Flow (in) = 60.5 gpm Peak Flow (out) = 2.5 gpm Time Event Started: 10:13 TSS Removal Efficiency: Based on TSS Mass Loading = 95.2%
1600 1800 Time (min)
2000
• Inflow
... Outflow

6.3 Size of Sediment
As was mentioned above, the sources of sand and sediment transported into the basins are from
maintenance sanding operations and from the cut slopes. To better understand the particle size
distribution of the source materials, several soil samples were collected. A sieve analysis was
performed by the COOT Materials Lab for each sample. Figure 6.1 0, below, displays the
gradation results.
C> c:: '(ij as a. -c::
~ Q) a. "iii -0 I-
(wash) 270 200
100
90
SO
70
80
50
40
30
20
100
~,§ ;i .eo 0>0 r" ;.!i n~ /. ~
.4P 10 ~
0 270 200
(wash) 100
50 30 16 S 4 3/8'"
./ /'/ V
/ / $
,CO V~ .~, ,~ / #. I '!>' /
c-.: ~h~ /' .... ~
V":)- 1;\09" .......-t .~
:::.- .....-V ""'"
50 40 30 16 10 S 4 31S"
Sieve Number
Figure 6.10: Particle Size of Source Material
314" 1-112" 3" 100
90
so
70
60
/ /
V
V /
50
40
30
20
10
o 3/4" 1" 1-112" 3"
Represented on the figure is cut slope material taken approximately 10 feet above the roadway at
station 395+00, accumulated sand along the outside shoulder of eastbound 1-70 near station
287+00, and stockpiled sand prior to being used.
57

As can be seen, the size of the particles from the cut slope is larger than the shoulder or stockpile
areas. Notice that only 55% of the cut slope material passes the 3/8 inch (9.5 mm) sieve.
Whereas 100% of the shoulder and stockpiled sand pass the 3/8 inch (9.5 mm) sieve.
Another thing to point out is that the shoulder sand material appears to be slightly larger than the
stockpile material. This is probably due to the fact that runoff has washed the fine grain material
out of the sand that is deposited along the shoulder.
The size of material exiting the basin in the discharge through the release structure was also
determined. This information is summarized in Table 6.14.
Table 6.14 Size of Material in Basin Outflow
.. Type of'EVent Sieve Number -Percent Passing
#45 #60 #80 #100 #120 #170 #200 #230
Rainfall 100 100 98 97 96 95 95 94
Simulation 100 100 94 93 91 91 90 89
Snowmelt 100 100 75 53 24 11 10 6
Table 6.4 shows that the size of sediment found in the outflow release did not exceed the #60
sieve (0.25 mm). This is true for the rainfall, simulation, and snowmelt runoff events.
The fact that no material left the basin larger than the #60 (0.25 mm) sieve can be evaluated
against the size of the source material. This can be done to assess the percentage of the source
material that would be captured in the basin. Such a comparison shows that at least 78 percent
(approx. 22 percent is smaller than the #60 (0.25 mm) sieve) of the source material should be
intercepted and captured by the sediment basins. See Figure 6.1 O.
58

7.0 Overall Sediment Removal Efficiency
Ideally, it would have been prefeITed to monitor all runoff events that entered and left the
sediment basin at station 328+03 for an entire year or more. However, due to weather, budget,
and manpower constraints - it was not possible to obtain such extensive data. In addition, the
results obtained from the completed monitoring will provide a reasonable estimate of the overall
annual sediment removal efficiency of the basin.
The results from the six monitored runoff events were used to estimate the overall annual
sediment basin removal efficiency. Monitored runoff events included: the three summer rainfall
events, the two events to simulate conditions when sand is available for transport, and the one
snowmelt event. They represent both rainfall and snowmelt conditions and should provide a
reasonable estimate of annual sediment basin removal efficiency.
It is important to note that there was no sanding material transported into the basin during the
rainfall events since the sand had been swept and removed from the pavement by CDOT
Maintenance. Therefore, the TSS load and EMC values for the rainfall events were much lower
than the other events.
To illustrate this fact, the TSS loads generated by the summer rainfall events and by the
snowmelt event can be compared. For all three rainfall events, only 29 Ib (13 kg) of sediment
was transported into the basin. In comparison, for just one snowmelt event (October 8, 1994),
8471b (385 kg) was transported into the basin. The single snowmelt event produced 30 times
more material than did all three rainfall events. Therefore, the sediment removal performance of
the basin during the snowmelt event should, and will, significantly influence the overall annual
sediment removal efficiency.
Table 6.15 summarizes the loading for all the events.
59

Table 6.15 Sediment Loading for All Monitored Events
TSSLoad TSSLoadOut TSSEMC!nto TSS.EMCOut l'ypeof$vent Into th~ Bash!. . of~Basin theBa$l of the Basin
Mo:rntored (g) ". ", (g) (tngll) (mgft)
BlinfaU EV~Dts
July 31,1994 6,036 2,683 163.8 117.3
August 9,1994 4,702 1,313 254.7 125.2
August 18, 1994 2,209 4,265 83 .8 255.3
Simulation EYCillI
August 26, 1994 90,800 (TS) 1,063 (TS) 3,001 mgII (TS) 96.9 (TS)
August 29,1994 90,800 (TS) 1,330 (TS) 3,001 mgII (TS) 106.3 (TS)
SDlI!I::melt Evenl
Det8,1994 384,645 18,383 39,040 5,694
Total TSS Mass 579,192 g 29,037 g Efficiency based on total load: Load (579, 192 - 29,037)/579,192
=95%.
Ave. TSS EMC Efficiency based on EMC: 7,591 mgII 1,066 mgII (7,591 -1,066)n,591 =86%.
The efficiency of the sediment basin in removing sediment from the runoff was computed based
on the principles of the Mass Balance Equation. The overall efficiency for based on both the
total TSS mass load and the average TSS EMC is:
•
•
•
Efficiency (based on mass load)
Efficiency (based on EMC)
Efficiency (ave. of mass load & EMC)
60
=
=
=
95.0%
86.0%
90.5%
. .
At the time of monitoring, the efficiency results based on the mass load are the most accurate.
This is because the infiltration rate into the basin bottom is high and it has a significant influence
on the amount of sediment that exits the basin. Computation of efficiency based on the load
entering and leaving the basin more accurately accounts for this infiltration.
However, as time goes by the sediment deposited within the basin will tend to seal the basin
bottom. Consequently, there will be less inti.Jtration. As a result, the se9iment removal
efficiency will move towards that value estimated by the EMC method. For the purposes of this
study, it is reasonable to use the average of the mass load and EMC method to estimate the
sediment removal efficiency. Therefore, the overall annual ISS removal efficiency for the
sediment basin at station 328+03 is 90.5%.
8.0 Sediment Load into Straight Creek from the Basins
Io answer the question - how much sediment load is contributed to Straight Creek from the
sediment basins, two things have to be known. First, the amount of sand captured by the basins
has to be quantified. Second, the efficiency of the basins in removing sediment from the runoff
has to be quantified. Both of these items were determined as part of this research.
As far as the quantity amount of sand captured by the basins, in Section 6.1.3 it was estimated
that 985 tons (894 m-ton) of sand and sediment would be captured annually by the eleven
sediment basins.
As far as the sediment removal efficiency, it is reasonable to use the efficiency results obtained
for the monitoring of the sedimeilt basin at station 328+03. In Section 7.0, it was estimated that
the 90.5% of sediment (ISS) entering the basin would be removed. It is reasonable to use this
efficiency for all eleven basins for a couple of reasons.
61

First, the design of all sediment basins was similar. All eleven basins were designed to capture
runoff from a 0.5 inch (1.27 cm) precipitation event. In addition, extra volume was included in
each basin for sand and sediment storage. The depth of all the basins was set at four feet (1.2 m)
for runoff and sediment storage .. Finally, the release structure, which slowly meters runoff out of
the basins, was designed the same for all basins.
Second, the source and type of material entering the basins doesn't change that much from basin
to basin. The type and size of sanding material applied to the road for vehicle traction purposes
does not vary since it's physical properties are designated by CDOT Maintenance specifications.
Therefore, because the physical properties are uniform, the sand will settle out of the runoff at
the same rate from basin to basin. Also, the size of particles from the 1-70 cut slope are
somewhat similar to the sanding material. In fact, according to Figure 6.10, the cut slope
material size is larger than the sand and subsequently should settle at a somewhat faster rate.
To estimate the annual sediment load that enters the basin, the annual amount captured - 985 tons
(894 m-ton) is divided by the sediment removal efficiency - 90.5%. To determine the annual
amount leaving the baSins and entering Straight Creek, the load captured by the basins is
subtracted from the load that enters the basins.
• Annual Load that Enters the Basins (985 tons / 90.5%) =
• Annual Load Captured by the Basins =
• Annual Load that Enters Straight Creek from the Basins =
9.0 Cost Analysis
1,088 tons
985 tons
103 tons
The question that will be addressed in this section is the cost of implementing the sediment
basins. On an annual basis, the sediment basins will prevent approximately 985 tons (894 m-ton)
of sand and sediment from entering the creek. This section describes how much money, in terms
62

of construction dollars, was required to reduce the Straight Creek sediment loading by 985 tons
(894 m-ton) per year.
The sediment basin construction costs described below include cost for both the construction of
the basins and construction of the maintenance access road.
Sediment basin features constructed and included in this cost analysis include: embankment
material, the release structure, outlet pipe, structure excavation, structure backfill, loose riprap,
geotextile, and grouted riprap. In addition, a percentage of the project costs for mobilization,
clearing and grubbing and construction surveying was also included in the basin cost. It should
be pointed out that costs for the fill slope pipe rundowns and for construction of the drainage
collection system along the 1-70 shoulder were not included in the basin cost. Cost for sediment
basin construction was $367,325.
In 1995, construction ofa maintenance access road was started. The access road project is to be
completed in the spring of 1996. The entire cost for this project, based on the contractor's bid is
$497,655.
Total cost for sediment basin and access road construction is $864, 980. The average cost for the
eleven basins is $78,635 per basin.
Ifa 25-year life of the sediment basins is assumed, 24,625 tons (22,339 m-ton) of sand and
sediment material will have been captured. The unit cost (excludes maintenance costs) to capture
this material would be $35/ton ($864,980124,625 tons) ($39/m-ton).
The construction costs for the basins were higher than what would be expected for similar work
on a less challenging site. This is due to a number of factors. Delivery and use of equipment and
materials for the construction of these basins was very difficult since there was no access from
the bottom of the fill slope. All construction efforts had to be staged from the shoulder ofI-70
63

and the sediment basins were 300 feet (90 m) down the I: I fill slope. Finally, the construction
season duration is shorter than most locations because of weather conditions.
It should be pointed out that the cost of construction of additional basins in this project area will
be significantly less. This is due to the fact that an access road will be available to deliver
equipment, materials and labor directly to a location for basin construction. In addition there will
be no cost for maintenance road construction since it will have already b.een built.
10.0 Conclusions
A number of conclusions can be drawn as a result of this research. Most of the following
conclusions are described based on the research objective that they support.
Research Object. 1: Quantify the amount of sand captured by the sediment basins.
Conclusion: Based on the surveying efforts and the relationship developed between
drainage area and amount of sediment captured, it is estimated that 985
tons (894 m-ton) of sand and sediment are captured annually by the
eleven sediment basins.
Research Object. 2: Determine the efficiency of the basins in removing sediment from
runoff.
Conclusion: 1be efficiency of the sediment basins in removing sediment from runoff
was based on monitoring sediment loading at the sediment basin at
station 328+03 for a number of runoff events. The calculated TSS
removal efficiency is 90.5%. In other words 90.5% of all sand and
sediment that enters the basins will be captured.
Research Object. 3: Determine the quantity of sediment released from the basins. into Straight
64

Conclusion:
Creek.
The quantity of sediment released into Straight Creek from the basins
was determined based on the calculated removal efficiency and the
annual quantity of sediment captured in the basins. On an annual basis a
total of 1,088 tons (987 m-ton) will enter the basins. Of this amount,
985 tons (894 m-ton) will be intercepted and captured within the basins.
And 103 tons (93.4 m-ton) will be conveyed thrQugh the basins into
Straight Creek. Therefore, sand and sediment loading into Straight
Creek was reduced from 1,088 tons (987 m-ton) per year to 104 tons
(93.4 m-ton) per year as a result of construction of the sediment basins.
Research Object. 4: Quantify the sediment loading differences between pavement and cut
slope areas.
Conclusion: Based on the surveying efforts it was estimated that 101 pounds of
sanding material per linear foot of highway (151 kg/m) for EB 1-70 and
101 pounds of sanding material per linear foot of highway (151 kg/m)
for WB 1-70 would be captured annually by the sediment basins. In
terms of pounds per acre of highway pavement, the estimated sand
capture rate is 88,300 lb/acre (99,000 kg/ha).
In addition, it was estimated that 58,040 pounds per acre (65,100 kglha)
of sediment from the cut slopes would be captured annually by the
sediment basins.
Research Object. 5: Refine the estimate of the required maintenance clean out cycle.
Conclusion: The clean out cycles predicted during the design phase of the Straight
Creek Erosion Control project for most of the basins were found to be
reasonable when compared with the anticipated clean out cycle based on
65

the survey infonnation. Based on the surveyed infonnation, the
anticipated sediment removal cycle varies from once every 0.9 years at
statio~ 401+00 to once every 9.1 years at station 286+79.
Even with the refined estimate of the necessary basin clean out cycle, it is
very important to keep in mind that CDOT Maintenance forces should
routinely observe the basins to assess sediment removal needs.
Infonnation provided in the October 1993 "Sediment Pond Maintenance
Report" should help Maintenance forces more accurately identify when
sediment removal is required. This is especially necessary considering the
facts that some of the actual constructed volumes of the basins differ from
the design volumes, that the sand application rates will vary from year to
year depending on the weather conditions, and that maintenance practices
may vary.
Other conclusions reached as a result of the research are:
• An analysis of the size of sediment in the runoff exiting the basin was completed.
This showed that for all rainfall, simulation, and snowmelt events: no material
larger than #60 (0.25 mm) sieve left the basin.
• The total cost to construct the basins and the anticipated cost to build the access
road is $864,980. Assuming a 25-year life for the basins, the unit cost to capture
the sanding and sediment materia! is $35lton ($39/m-ton). Maintenance costs
were not included.
66

References
1) Erosion Control and Stormwater Quality Guide, Colorado Department of Transportation,
June 1995.
2) Laboratory Theory and Methods for Sediment Analysis, Book 5 Chapter C 1, United
States Geologic Survey, 1977.
3) Monitoring of CDOT Straight Creek Ponds, United States Geologic Survey and Colorado
Department of Transportation, April 6, 1994.
4) Sediment Pond Maintenance - Straight Creek Erosion Control Project, Colorado
Department of Transportation, October 1993.
5) Study Designfor Sediment Pond Monitoring, Draft Report, Colorado Department of
Transportation, May 31,1994.
6) Urban Storm Drainage Criteria Manual, Volume 3, Best Management Practices, Urban
Drainage and Flood Control District, September 1992.
67
Recommended