Energy savings in wastewater
treatment plants: optimization
and modelling
Daniel A. NolascoDirector, International Water Association
President, NOLASCO y Asociados S. [email protected] www.nolasco.ca
• Use of energy in wastewater treatment
• Energy modelling
• Energy recovery
• Optimization tools and technologies
• Conclusions
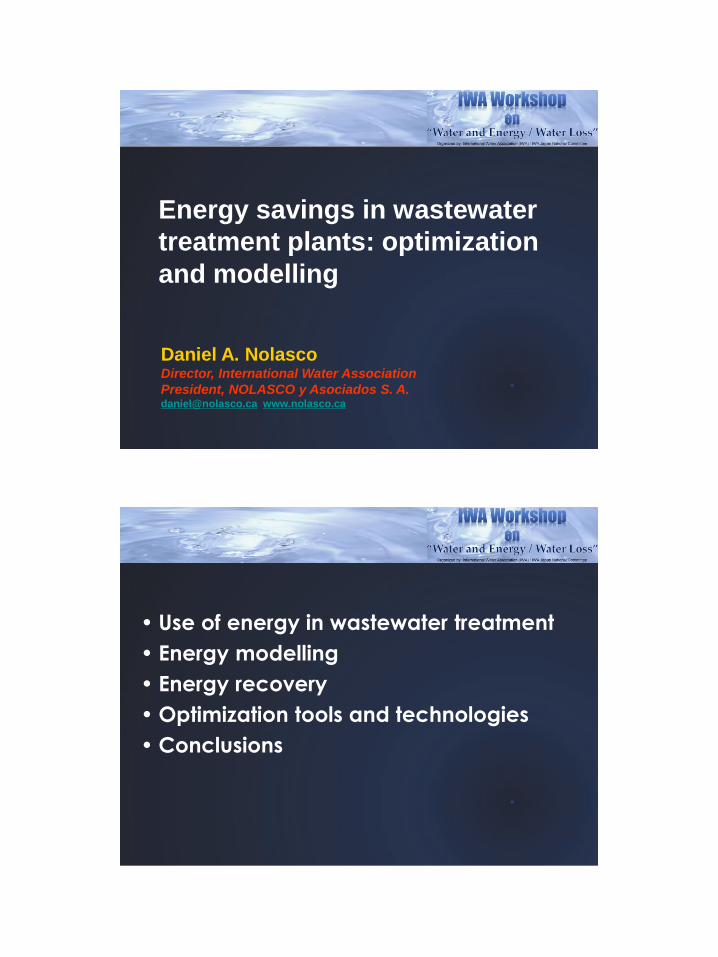
AERATION & ENERGY FOOTPRINT
Aeration cost = 45-75% of plant energy (w/o influent/effluent pumping)
Rosso and Stenstrom (2005) Wat. Res. 39: 3773-3780
Figure 1. Estimated power usage for a typical 20MGD activated
sludge facility performing wastewater treatment with nitrogen
removal in the United States (MOP32, 2009).
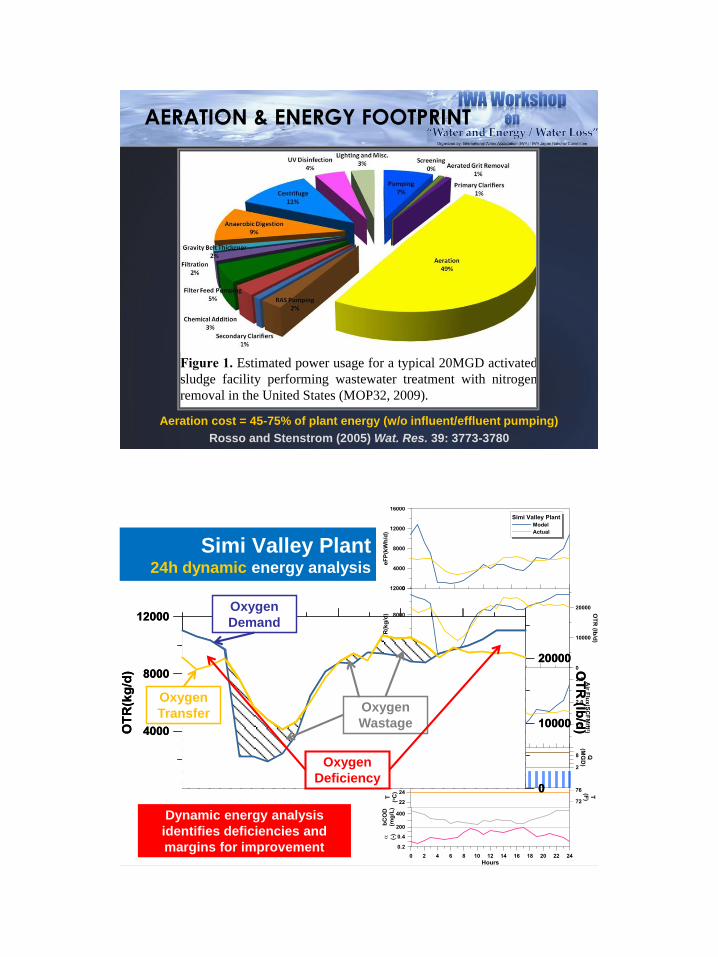
Simi Valley Plant24h dynamic energy analysis
Oxygen
Demand
Oxygen
TransferOxygen
Wastage
Oxygen
Deficiency
Dynamic energy analysis
identifies deficiencies and
margins for improvement

ENERGY MODELING
Information availability and
capacity for improvementRosso et al (2012) Wat. Practice Technol.
eFPTOT
= eFPi
i=1
n
å = nj×p
j×h
j× t
jj=1
m
åi=1
n
å
#units power efficiency time in operation
eFP: Energy Footprint
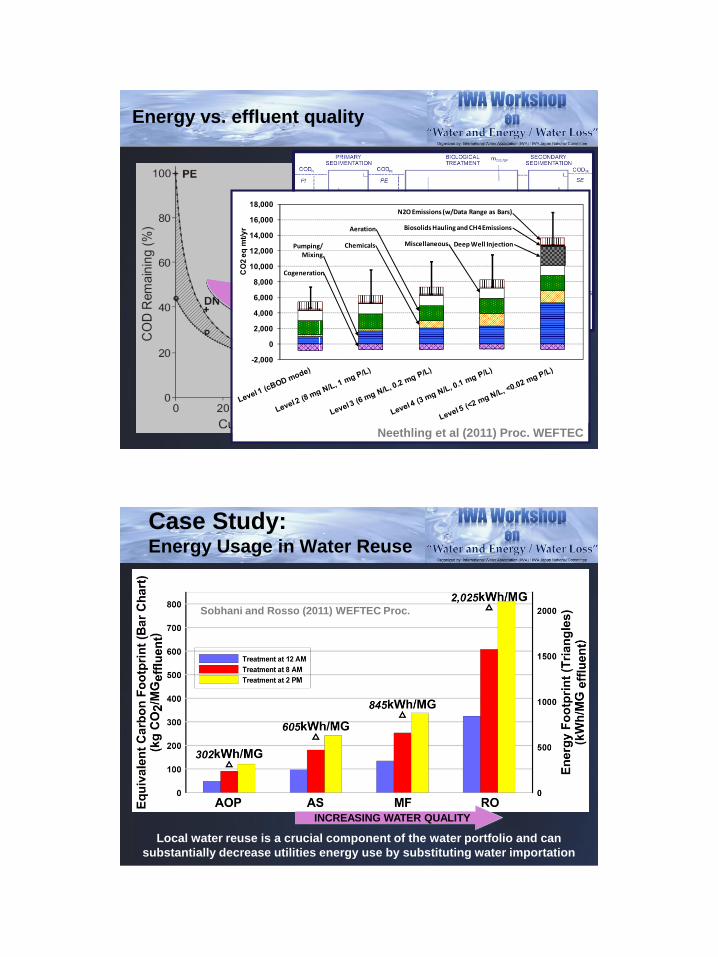
Energy vs. effluent quality
Neethling et al (2011) Proc. WEFTEC
Case Study:Energy Usage in Water Reuse
Local water reuse is a crucial component of the water portfolio and can
substantially decrease utilities energy use by substituting water importation
Sobhani and Rosso (2011) WEFTEC Proc.
INCREASING WATER QUALITY
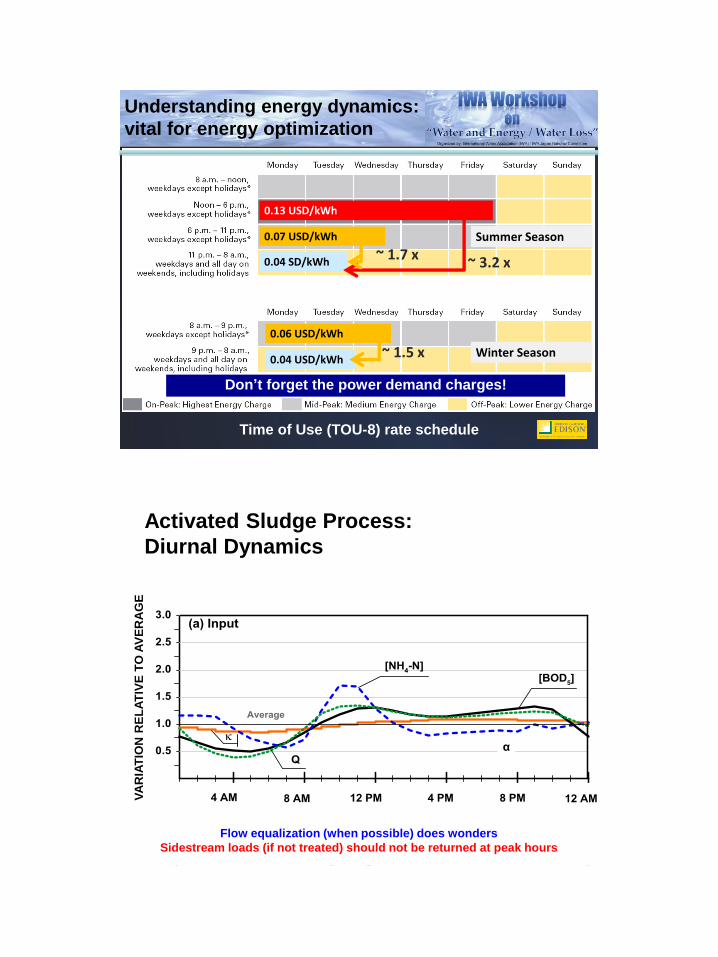
Time of Use (TOU-8) rate schedule
Summer Season
Winter Season
0.04 SD/kWh
0.07 USD/kWh
0.13 USD/kWh
~ 3.2 x~ 1.7 x
0.06 USD/kWh
0.04 USD/kWh~ 1.5 x
Understanding energy dynamics:
vital for energy optimization
Don’t forget the power demand charges!
Activated Sludge Process:
Diurnal Dynamics
α
VA
RIA
TIO
N R
EL
AT
IVE
TO
AV
ER
AG
E
Flow equalization (when possible) does wonders
Sidestream loads (if not treated) should not be returned at peak hours
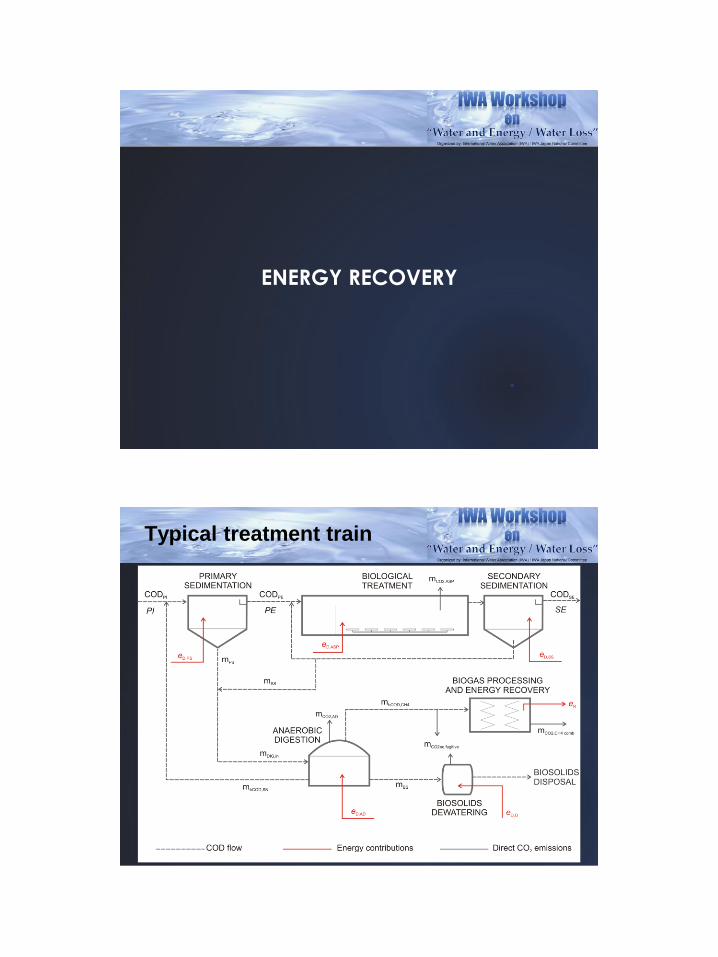
ENERGY RECOVERY
Typical treatment train
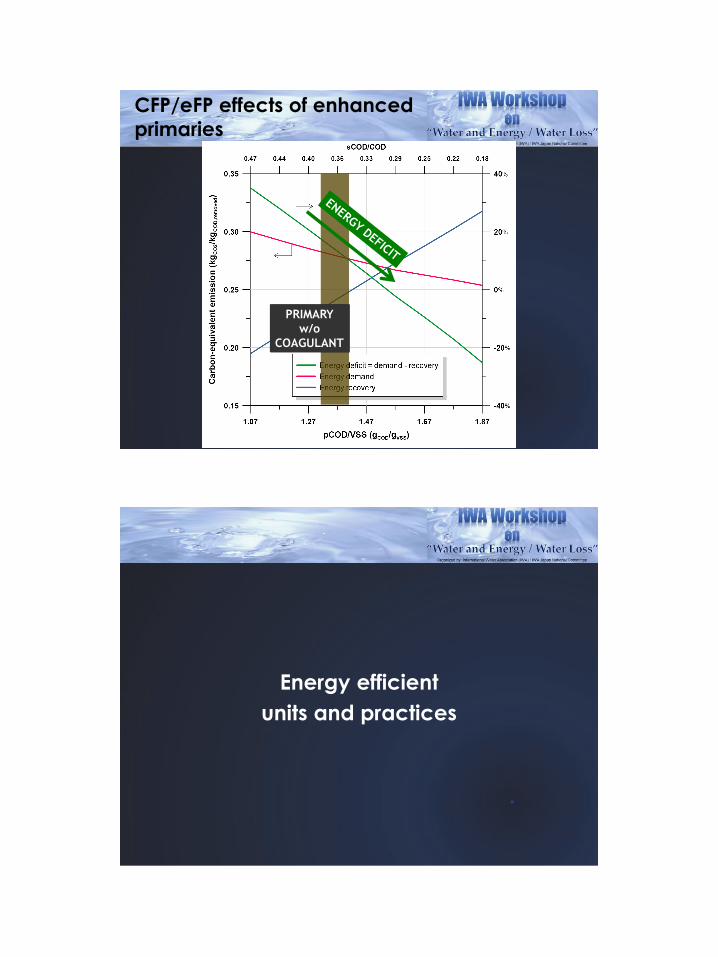
CFP/eFP effects of enhanced
primaries
PRIMARY
with
COAGULANT
PRIMARY
w/o
COAGULANT
Energy efficient
units and practices
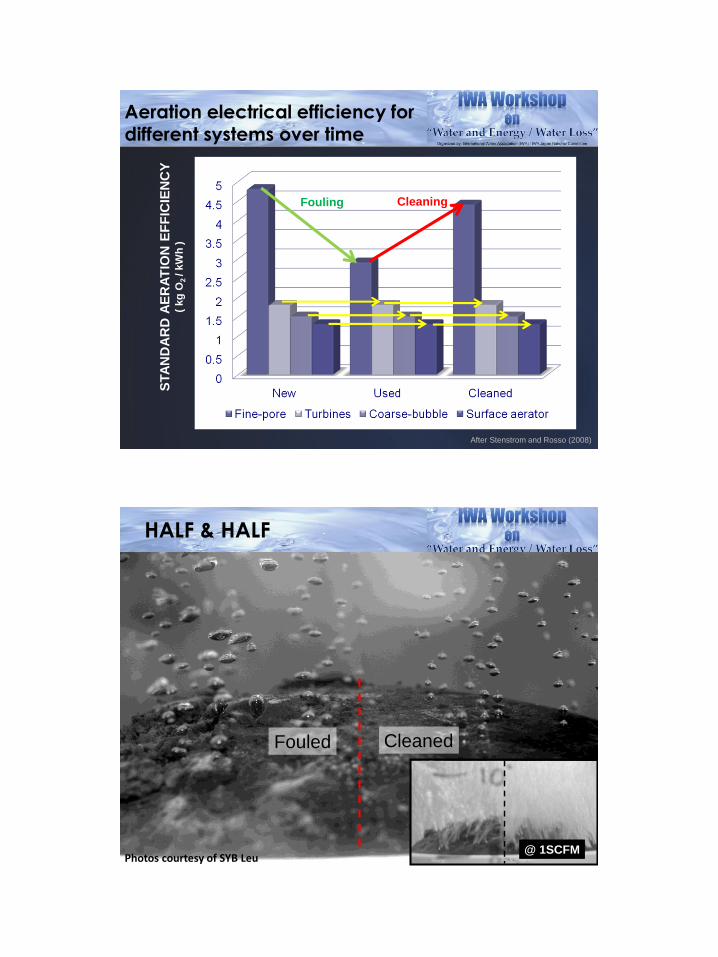
Aeration electrical efficiency for different systems over time
STA
ND
AR
D A
ER
AT
ION
EF
FIC
IEN
CY
( kg
O2 / k
Wh
)
After Stenstrom and Rosso (2008)
Fouling Cleaning
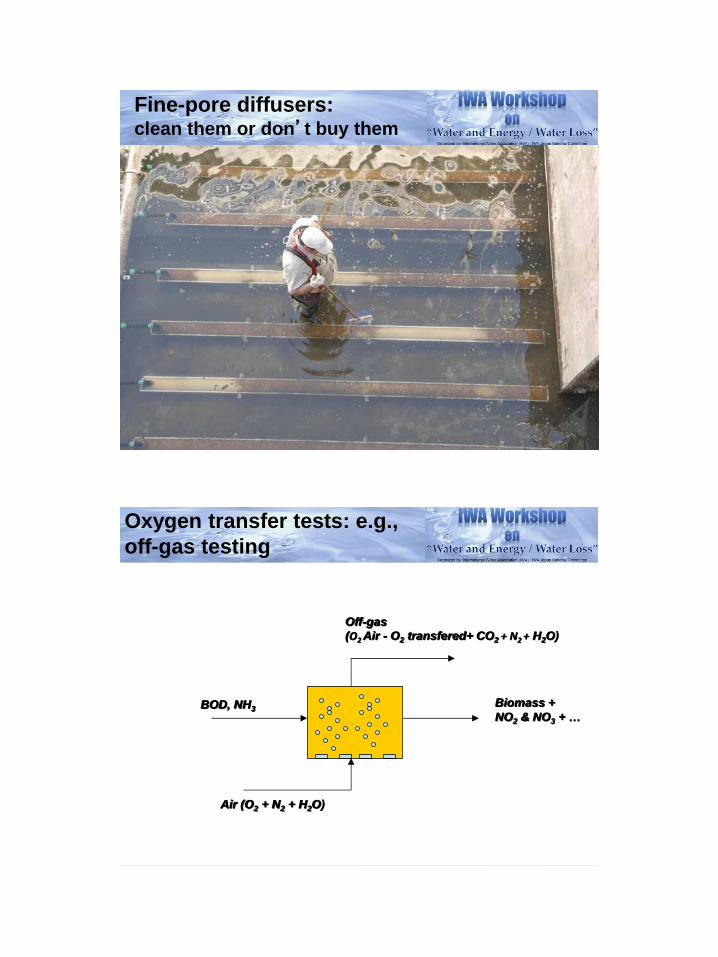
HALF & HALF
CleanedFouled
@ 1SCFMPhotos courtesy of SYB Leu
Fine-pore diffusers:clean them or don’t buy them
Oxygen transfer tests: e.g.,
off-gas testing
Air (O2 + N2 + H2O)
Off-gas
(O2 Air - O2 transfered+ CO2 + N2 + H2O)
BOD, NH3Biomass +
NO2 & NO3 + …
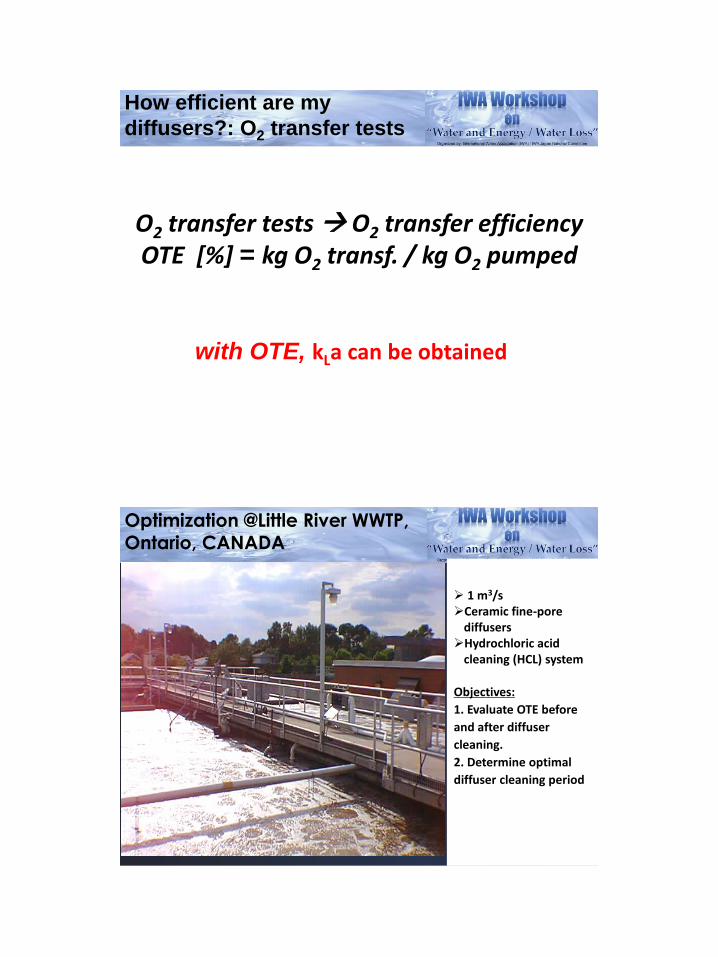
How efficient are my
diffusers?: O2 transfer tests
O2 transfer tests O2 transfer efficiencyOTE [%] = kg O2 transf. / kg O2 pumped
with OTE, kLa can be obtained
1 m3/sCeramic fine-pore
diffusersHydrochloric acid
cleaning (HCL) system
Objectives:
1. Evaluate OTE before
and after diffuser
cleaning.
2. Determine optimal
diffuser cleaning period
Optimization @Little River WWTP, Ontario, CANADA
O2 analyzer
Off-gas collection hood
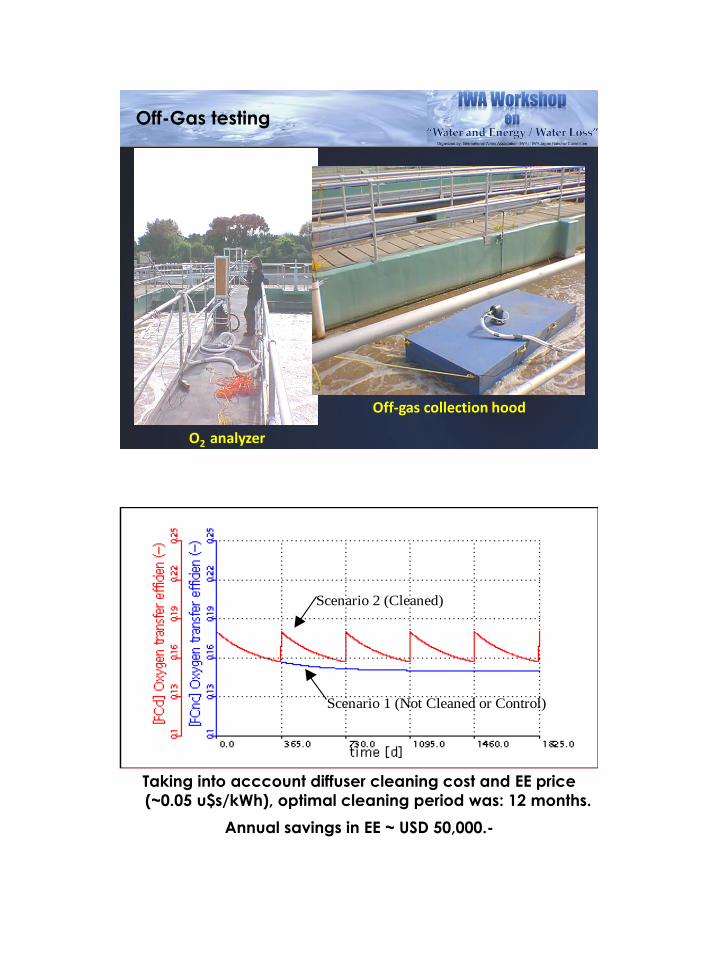
Off-Gas testing
Scenario 2 (Cleaned)
Scenario 1 (Not Cleaned or Control)
Taking into acccount diffuser cleaning cost and EE price
(~0.05 u$s/kWh), optimal cleaning period was: 12 months.
Annual savings in EE ~ USD 50,000.-
Digester maintenance: key to optimize
EE production and biosolids quality
• Activated sludge plant in Ontario: 93.000 m3/d
• 2 anaerobic digesters + dewatering centrifuges
biosolids for agricultural use + biogas for EE
generation
• VS destruction + biosolids quality + biogas
production deteriorated over time
• Temperature?: OK
• Mixing? Not OK CapEx for mixing system
upgrade: US$4.5M
• Digester tracer studies using LiCl were proposed
to evaluate cleaned vs. not cleaned digester
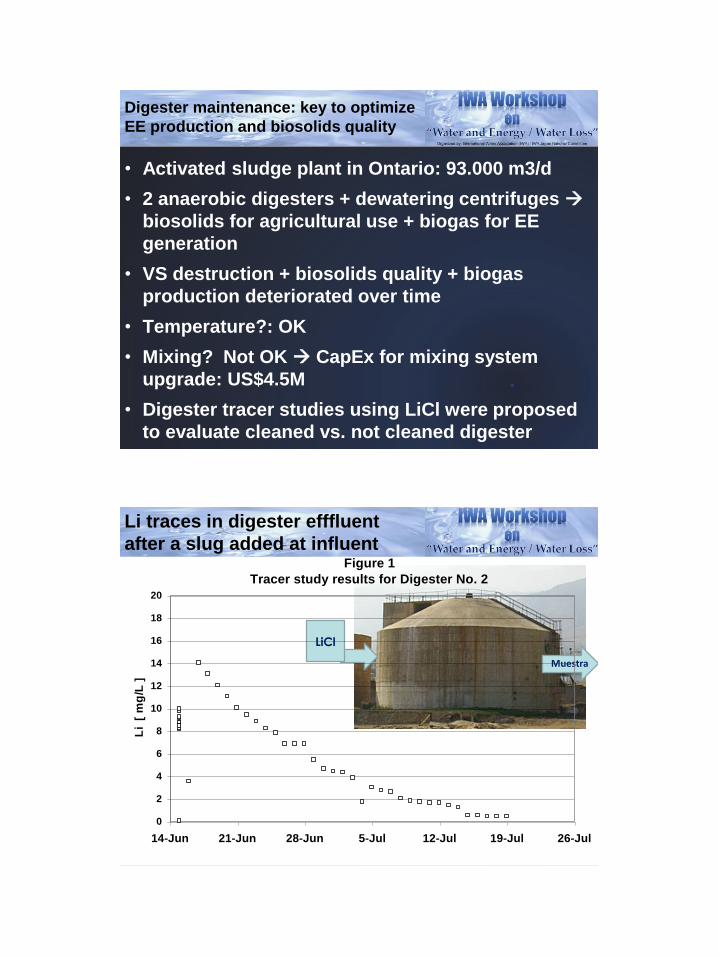
Muestra
LiCl
Li traces in digester efffluent
after a slug added at influentFigure 1
Tracer study results for Digester No. 2
0
2
4
6
8
10
12
14
16
18
20
14-Jun 21-Jun 28-Jun 5-Jul 12-Jul 19-Jul 26-Jul
Li [
mg
/L ]
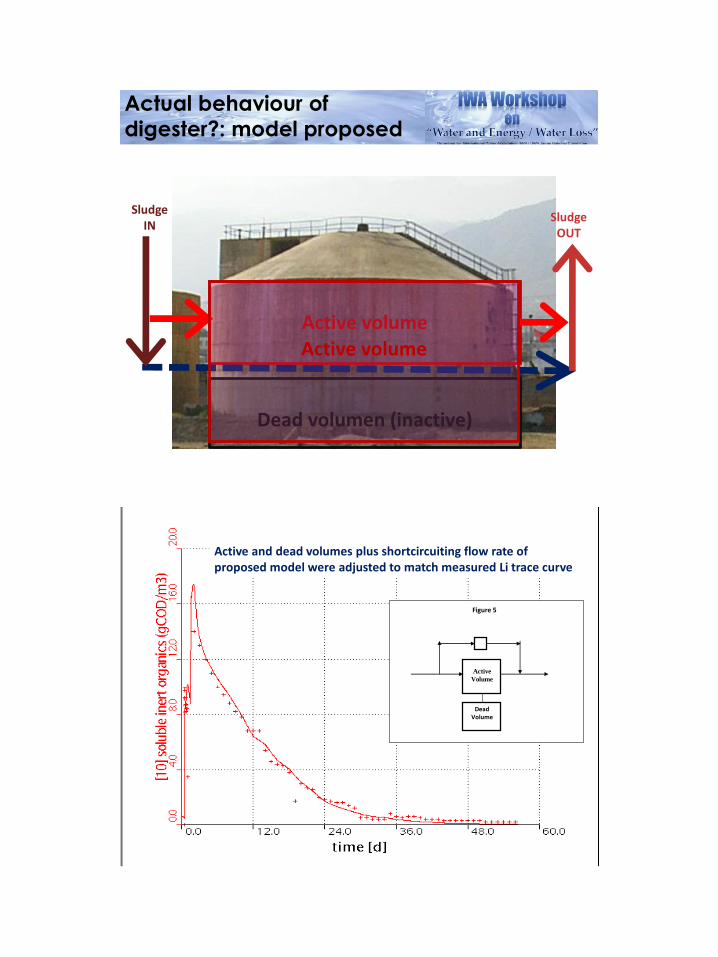
Actual behaviour of
digester?: model proposed
Dead volumen (inactive)
Active volume
SludgeIN
SludgeOUT
Active volume
Active and dead volumes plus shortcircuiting flow rate of proposed model were adjusted to match measured Li trace curve
Active
Volume
Dead Volume
Figure 5
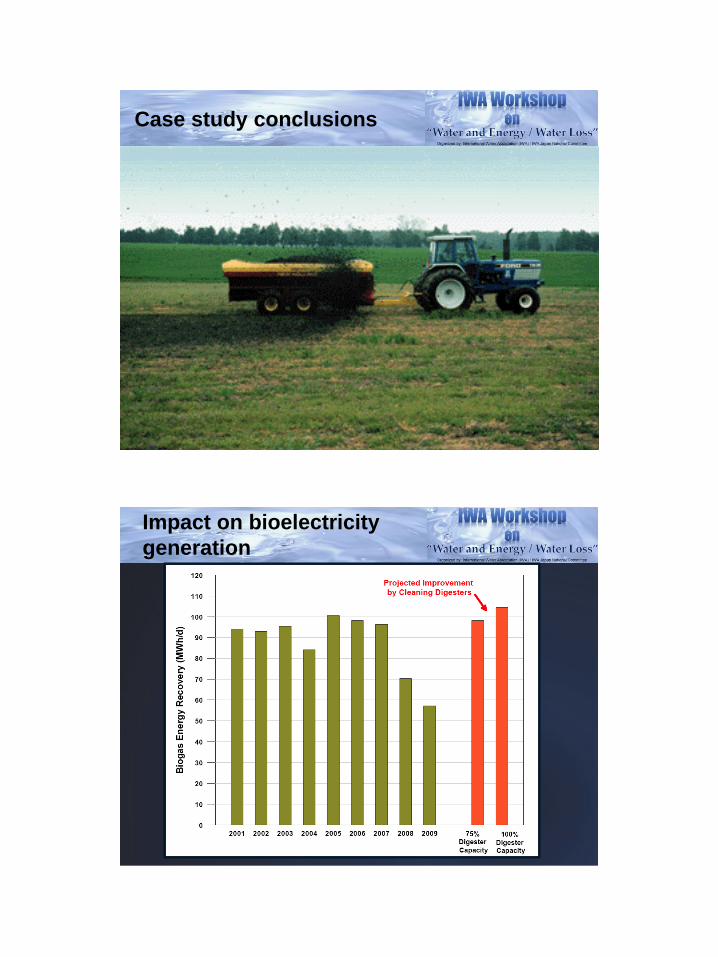
Case study conclusions
• Actual active volume, HRT, volatile destruction and biogas generation were matched by model calibrated using tracer results.
• HRT clean digester = 25 days= 2 x “dirty” digester
• Active volume of “dirty” digester = 35% of total V!
• Digester cleaning optimized mixing New mixing system was not necessary
• CapEx savings of US$4.5M vs. US$0.3M digester cleaning costs (LiCl testing inexpensive)
• Volatile destruction optimized more CH4 (and associated EE generation) + better biosolids qual.
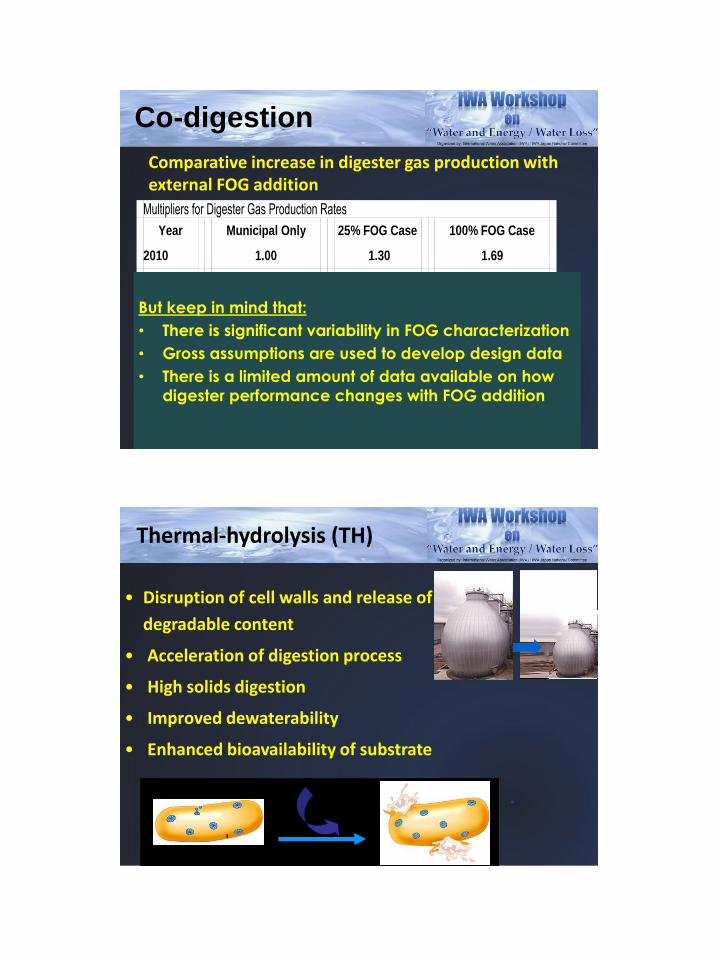
Impact on bioelectricity
generation
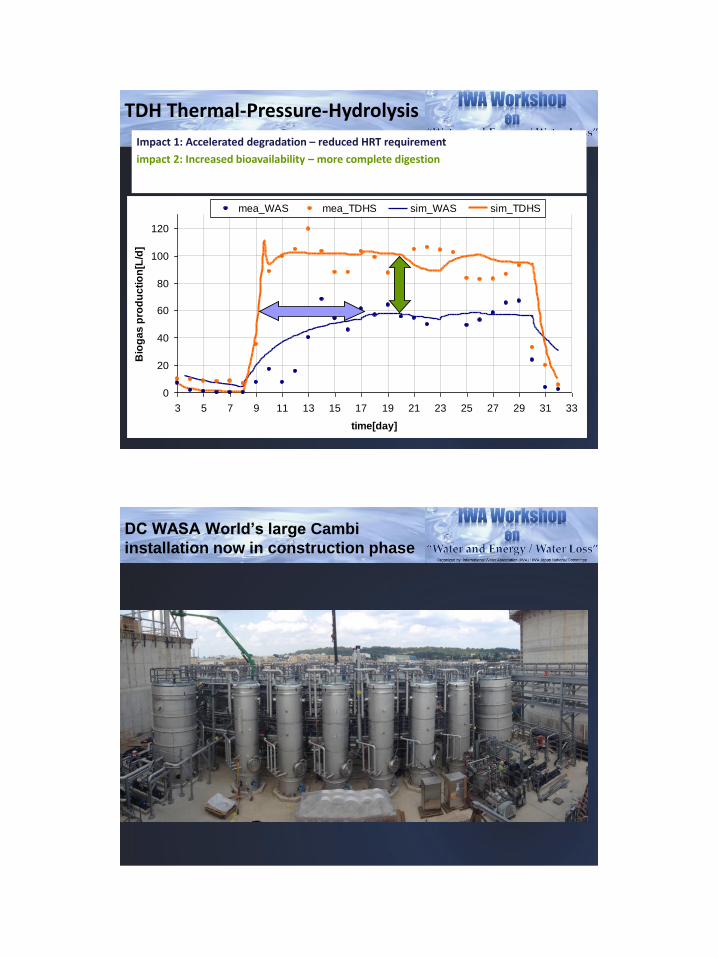
Co-digestion
Comparative increase in digester gas production with external FOG addition
Multipliers for Digester Gas Production Rates
Year Municipal Only 25% FOG Case 100% FOG Case
2010 1.00 1.30 1.69
2015 1.08* 1.38 1.71
2025 1.24* 1.54 1.87
2035 1.44* 1.74 2.03
But keep in mind that:
• There is significant variability in FOG characterization
• Gross assumptions are used to develop design data
• There is a limited amount of data available on how
digester performance changes with FOG addition
Thermal-hydrolysis (TH)
• Disruption of cell walls and release of
degradable content
• Acceleration of digestion process
• High solids digestion
• Improved dewaterability
• Enhanced bioavailability of substrate
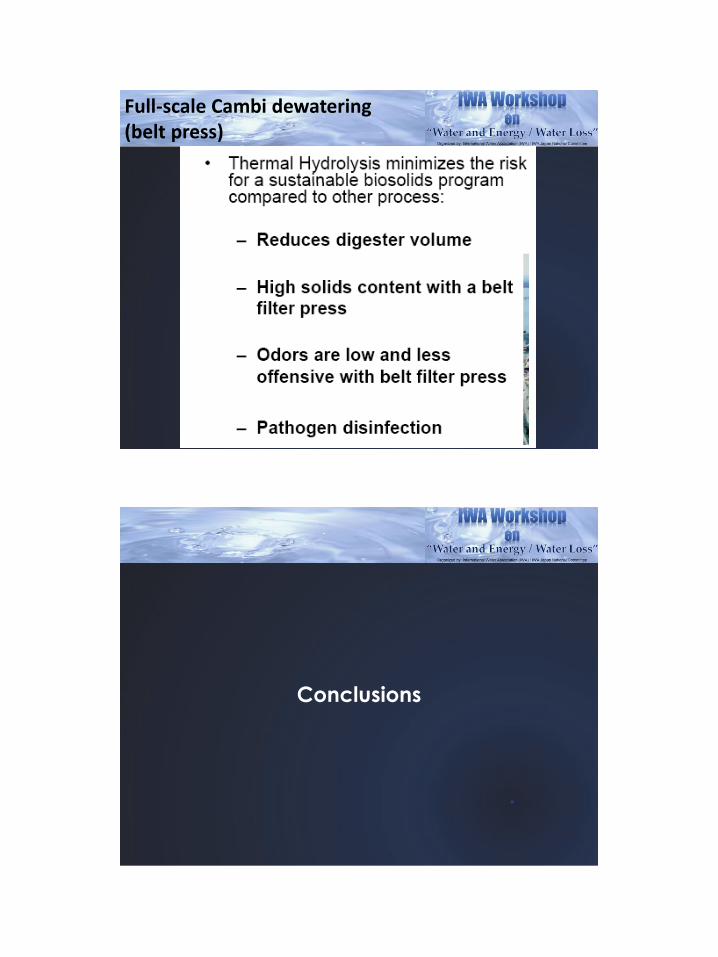
TDH Thermal-Pressure-Hydrolysis
Impact 1: Accelerated degradation – reduced HRT requirement
impact 2: Increased bioavailability – more complete digestion
0
20
40
60
80
100
120
3 5 7 9 11 13 15 17 19 21 23 25 27 29 31 33
time[day]
Bio
ga
s p
rod
uc
tio
n[L
/d]
mea_WAS mea_TDHS sim_WAS sim_TDHS
DC WASA World’s large Cambi
installation now in construction phase
Full-scale Cambi dewatering(belt press)
Conclusions
CONCLUSIONS
• Compounding dynamics amplify energy consumption
peaks: need to take into account tariff structure, C
emissions, organic loading, recycle streams, α factor,
equipment efficiency curves!!
• Smart primary treatment (e.g., CEPT), sludge enrichment
(e.g., co-digesting sludge with FOG), sludge conditioning
(thermal hydrolysis) may assist in reaching neutrality
(both C & EE)
• Equipment evaluation and maintenance is key (diffuser
and digester cleaning are good examples)
• Dynamic modelling: powerful tool to optimize
Many thanks!
Dr. Hiroaki Furumai, University of Tokyo
Dr. Diego Rosso, U. of California @ Irvine
Dr. Suthir Murthy, DC WASA
Daniel A. [email protected]
Recommended