© OECD/IEA 2011
Post Fukushima Energy Strategy : Energy Security and Sustainability in Asia
2012/10/31 Tokyo
Sasagawa Peace Foundation and W. Wilson Center
Nobuo TANAKAFormer Executive Director of the IEAGlobal Associate of Energy Security and Sustainability, IEEJ
Energy Demand grows in Asia. Energy Security is the issue for Asian countries.
Growth in primary energy demand
Global energy demand increases by one‐third from 2010 to 2035, with China, India and other Asia accounting for two thirds of the growth
0
500
1 000
1 500
2 000
2 500
3 000
3 500
4 000
4 500
2010 2015 2020 2025 2030 2035
Mtoe
China
India
Other developing Asia
Russia
Middle East
Rest of world
OECD
IEA WEO 2011
2

New Policies Scenario assumes Natural gas & renewables become increasingly important.
World primary energy demand
Renewables & natural gas collectively meet almost two‐thirds of incremental energy demand in 2010‐2035
Additional to 2035
2010
0
1 000
2 000
3 000
4 000
5 000
Oil Coal Gas Renewables Nuclear
Mtoe
IEA WEO 2011
3

Net imports of oil
0
2
4
6
8
10
12
14
European Union
United States
Japan China India ASEAN
Mb/
d
2000
2010
2035
Oil supply security is particularly the issue for Asia Oil supply security is particularly the issue for Asia in the 21in the 21stst Century.Century.
US oil imports drop due to rising domestic output & improved transport efficiency:
North American Energy Independence is coming! ( WEO 2012 )
IEA WEO 2011
4

Iran Crisis and the Hormuz Strait
5
17 mbd of petroleum (20% of global demand )
82 million tons of LNG pa (30% of global demand)
85% of Japanese oil import
20% of Japanese LNG import
85% of Japanese oil import20% of Japanese LNG importBut if no nuclear reactors are running,,,,,,?
5

1974 disruption was 4.3mbd. 1979 was 5.6mbd. Hormuz blockage is13 mbd.
IEA Petroleum Strategic Stock can relieve 2mbd disruption for 24 months.
6

Strategic Petroleum Reserve: Does the Strategic Petroleum Reserve: Does the current IEA system continue to work?current IEA system continue to work?
Growing share of non‐OECD oil demand results in declining global demand cover from IEA oil stocks
7
‐
5
10
15
20
25
30
35
40
0%
10%
20%
30%
40%
50%
60%
days of world oil de
mand cover
% sh
are of w
orld oil de
mand
IEA 90 days of stockholding, share of world demand with Chinawith Indiawith ASEANShare of non‐OECD in global oil demand
IEA stockholding cover of global oil demand

Compounding Crisis may hit Japan
• Blockage of the Strait of Hormuz– Oil Price may double to $160 / barrel– Japan’s current account surplus ( 9 trillion yen in 2011 )
may turn to deficit of 6 trillion yen.– Without further restarting of nuclear power plants,
deficits may reach 12 trillion yen.• Confidence on Japan’s public finance may be lost.
– Current Account surplus is the basis for confidence– Persisting Deficit may lead to capital flight from Japan– Power crisis enhances flight of manufacturing industries
• Loss of Confidence in JGB and Yen.
8

The Golden Age for Natural Gas ?The Golden Age for Natural Gas ?Shale Gas Revolution.Shale Gas Revolution.
Largest natural gas producers in 2035
Unconventional natural gas supplies 40% of the 1.7 tcm increase in global supply,but best practices are essential to successfully address environmental challenges
0 200 400 600 800 1 000
Norway
India
Australia
Algeria
Canada
Qatar
Iran
China
United States
Russia
bcm
Conventional
Unconventional
IEA WEO 2011
9

Figure 2.18 Natural gas demand and the share of imports by region in theNew Policies Scenario, 2009 and 2035
0
100
200
300
400
500
600
700
800 Imports
Domes cproduc on
2009 2035 2009 2035 2009 2035 2009 20352009 2035 2009 2035
United States Japan European Union Other AsiaChina India
bcm
Note: Other Asia had net natural gas exports of 56 bcm in 2009.
The Golden Age for Natural Gas?Asian Demand Increase is the game changer.
China’s demand is 97 BCM in 2009, same as Germany,In 2035 it grows to 502 BCM same as Europe as a whole in 2009
IEA WEO 2011
10
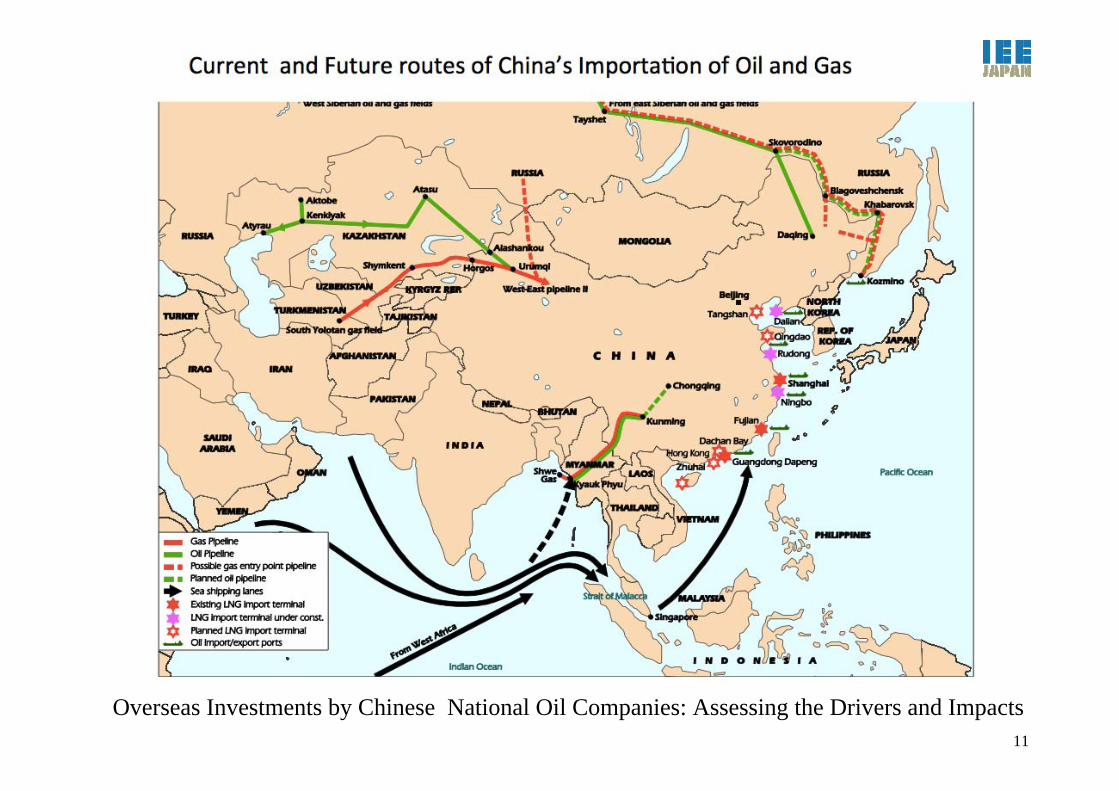
Overseas Investments by Chinese National Oil Companies: Assessing the Drivers and Impacts 11

RussiaRussia’’s focus will move to the East s focus will move to the East
Russian revenue from fossil fuel exports
An increasing share of Russian exports go eastwards to Asia,providing Russia with diversity of markets and revenues
2010$255 billion
61%16%
21%
2035$420 billion
48%
EuropeanUnion
17%Other
20%China
15%
OtherEurope
EuropeanUnionOther
Europe
China2%
Other
IEA WEO 2011
12

Figure 8.15 Major gas fields and supply infrastructure in Russia
Harbin
Northern Ligh ts
Nord Stream
ExporttoEurope
Moscow
Yamburg
Medvezhye
Daqing
Shtokman
Urengoy
MongoliaSyria NorthKorea
China
Irkutsk
Japan
Slov. Rep.
Cz.Rep.
Poland
Germany
SwedenDen.
R U S S I A SakhalinIsland
Komsomolsk
Khabarovsk
Bovanenkovo
SouthTambei
Neth.
Chayandin
ZapolyarnoeS. Russkoe
Krasnoyarsk
Yakutsk
Export toFinland
St. Petersburg
Estonia
Norway
Finland
Latvia
SouthStream
China
Novosibirsk Kemerovo
Tomsk
Surgut
Kazakhstan
U b ki
Tyumen
Orenburg
Astrakhan
Khvalynskoe
TsentralnoeTurkey
Georgia
Azer.Arm.
Volgograd
Ukhta
Vladivostok
Murmansk
YamalPeninsula
Kovykta
ExporttoEurope
RomaniaMol.
Hungary Sakhalin
Other offshore Arctic
Other ArcticoffshoreBarents Sea
Eastern Siberia
Western Siberia
Volga/Urals
TimanPechora
Caspian
Ukraine
Lithuania
Belarus
Selected gas field
Existing gas pipeline
Pipeline planned/under const.
Existing LNG export terminal
Planned LNG export terminal
This map is for illustrative purposes and is without prejudice to the status of or sovereignty over any territory covered by this map.
SeaofOkhotsk
LaptevSea
EastSiberianSea
ChukchiSea
BeringSea
CaspianSea
BlackSea
BalticSea
KaraSeaBarentsSea
Russian Natural Gas Pipelines IEA WEO 2011
13

International Gas PricesHow can we reduce Asian Premium?
0
5
10
15
20
25USD
/MBtu
Henry Hub NBP German border price Japan LNG Brent Asian coal marker
IEA Mid Term Gas Market Review 201214
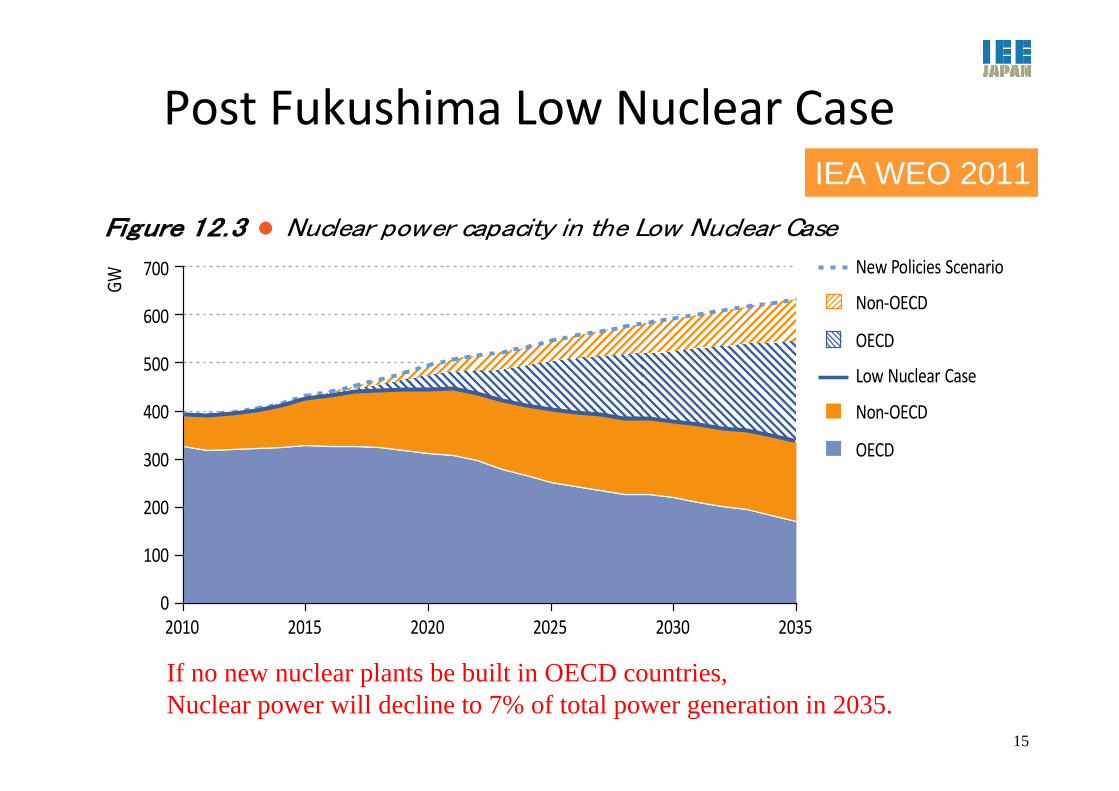
Post Fukushima Low Nuclear Case
Figure 12.3 Nuclear power capacity in the Low Nuclear Case
0
100
200
300
400
500
600
700
2010 2015 2020 2025 2030 2035
GW
Non‐OECD
OECD
Low Nuclear Case
New Policies Scenario
Non‐OECD
OECD
If no new nuclear plants be built in OECD countries,Nuclear power will decline to 7% of total power generation in 2035.
IEA WEO 2011
15

• Power generation by fuel in the New Policies Scenarioand Low Nuclear Case
• The biggest chunk of the lost nuclear generation is replaced by power generation from gas and coal, leading to a 6% or 0.9 GT increase in CO2 emissions in the power sector
Less nuclear means more of Less nuclear means more of everything else + CO2 everything else + CO2
0
2 000
4 000
6 000
8 000
10 000
12 000
14 000
Nuclear Coal Gas Renewables
TWh 2009
2035:New Policies Scenario
2035:Low Nuclear Case
IEA WEO 2011
16

Figure 12.5 Global primary coal and gas demand and annual spendingon imports in the Low Nuclear Case
Spending on coalimports
Spending on gasimports
0
150
300
450
600
750
Billio
ndo
llars(2010) 2009
2035:New PoliciesScenario
2035:Low NuclearCase
0
1 000
2 000
3 000
4 000
5 000
Coaldemand
Gasdemand
Mtoe
Note: Calculated as the value of net imports at prevailing average international prices.
Additional $90 billion is needed to import gas and coal.
17

Germany may need much more Gas to phase Germany may need much more Gas to phase out Nuclear by 2022out Nuclear by 2022
Germany needs to import 16 BCM of gas to achieve electricity mix with 10% demand reduction, no nuclear, 35% renewables and CO2 at the target level
twh
18

Power Grid Connection in Europe
Physical energy flows between European countries, 2008 (GWh)
Source: ENTSO-E
19

• Mobilize all possible resources to phase out Nuclear Power Generation during 2030s.– Strict 40 years life of reactors. Restart reactors with
approval by the new NRC. No new construction. • Green Energy Revolution
– 10% Power saving and 19% energy efficiency by 2030.– Triple Renewables by 2030. ( x8 excluding hydro)
– R&D for new generation vehicles, Hydrogen system, CCS.• Expand LNG gas power, Combined Heat & Power.• Reform of power market.• Flexible review of the decision.
Innovative Energy & Environment StrategyDecision by the Energy & Environment Council , GOJSeptember 14th, 2012
20

Power grid in Japan
Source: Agency for Natural Resources and Energy, The Federation of Electric Power Companies of Japan, Electric Power System Council of Japan, The International Energy Agency
Tokyo
Hokkaido
Tohoku
HokurikuKansaiChugoku
Kyushu29GW Shikoku
12GW
Chubu 40GW
Okinawa2GW
Hydro
Oil
Gas
Nuclear
Coal
OtherPower utility company
Generating company
In‐house generation
--- 50 hz
60 hz <-------
21
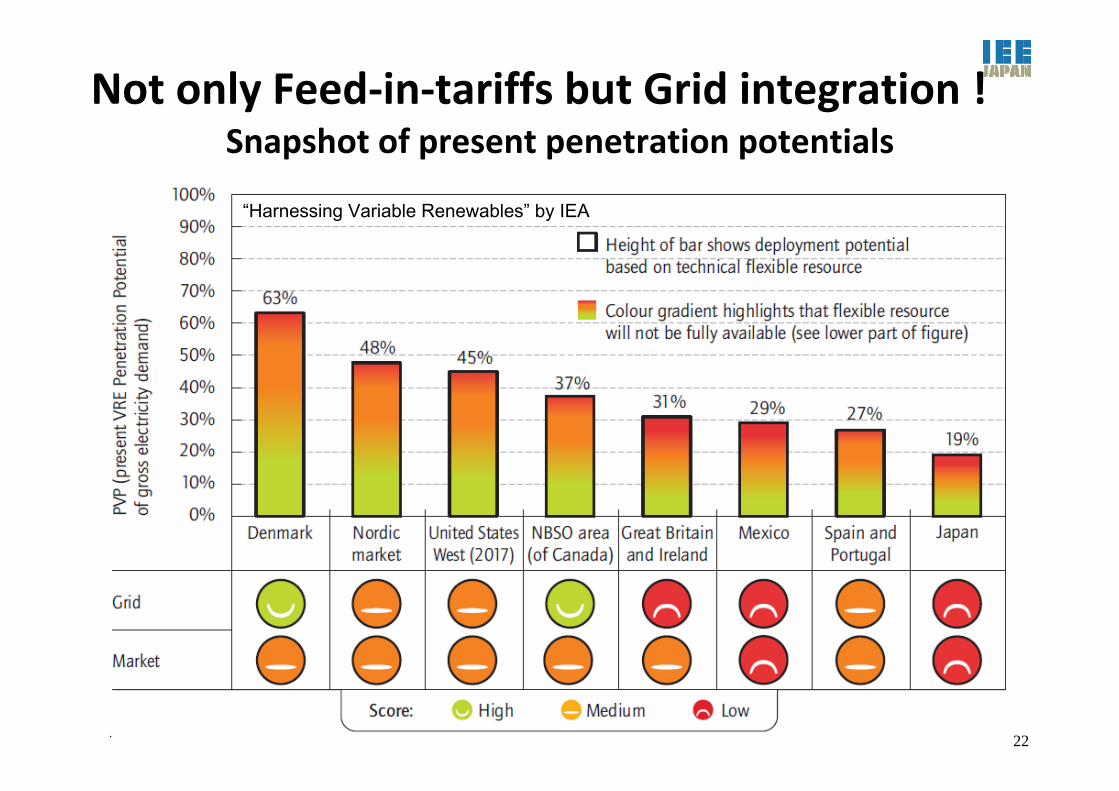
Snapshot of present penetration potentialsNot only Feed‐in‐tariffs but Grid integration !
“Harnessing Variable Renewables” by IEA
22

Lessons of the Fukushima• Lessons to be Shared
– Think about the unthinkable; Tsunami and Station Black Out. Large scale Blackout. Change total mind set for “Safety”.
– Prepare for the severe accidents by defense in depth, common cause failure & compound disasters.
– Clarify why it happened only to Fukushima Daiichi and NOT to Fukushima Daini, Onagawa nor Tokai daini.
• Safety Principles– Fukushima accident was caused by human error and should have been avoided. (Mr.
Hatamura, Parliament Investigation Commission report )– International Cooperation : A nuclear accident anywhere is an accident everywhere.– Independent Regulatory authority ; Transparency and Trust, “Back Fitting” of
regulation
• Secured supply of Electricity– Power station location– Strengthened interconnection of grid lines
• Once disaster has happened, Recovery from disaster is at least as important as preparing for it.
– FEMA like organization and training of the nuclear emergency staff including the self defense force ; integration of safety and security.
– New Technology. New type of Reactors. 23
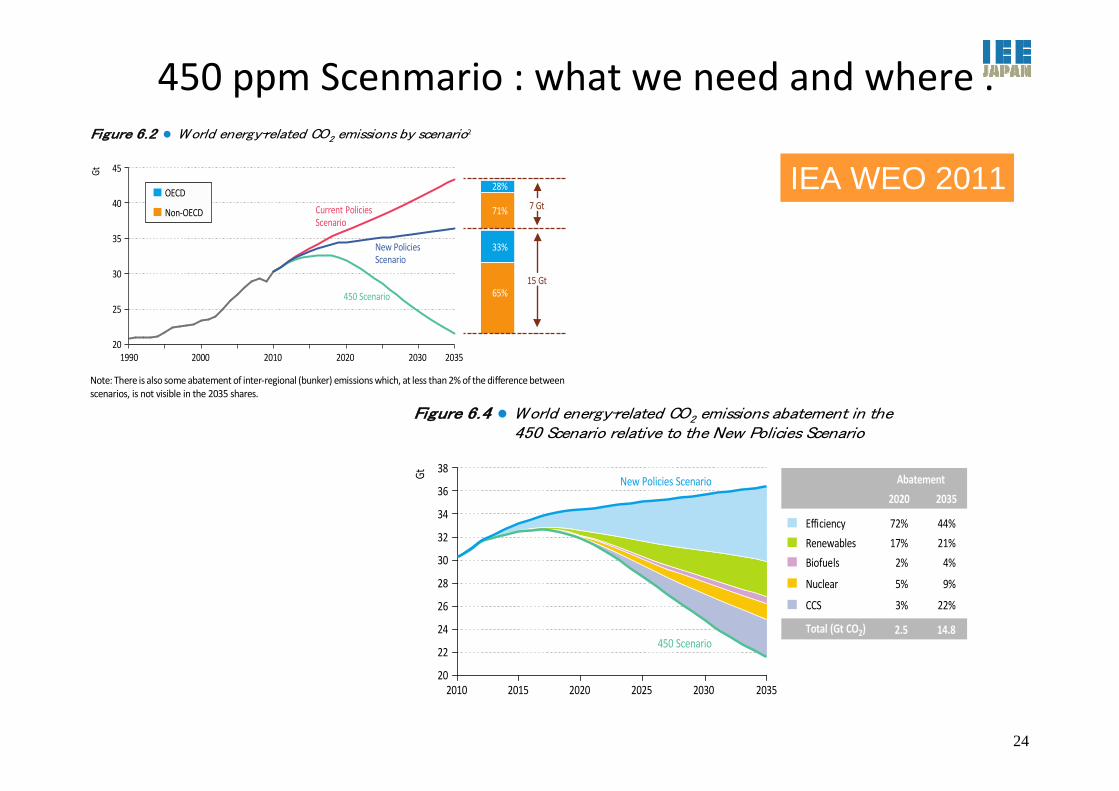
450 ppm Scenmario : what we need and where .Figure 6.2 World energy-related CO2 emissions by scenario2
20
25
30
35
40
45
1990 2000 2010 2020 2030 2035
Gt
15 Gt
7 Gt71%
65%
33%
28%OECD
Non‐OECD Current PoliciesScenario
450 Scenario
New PoliciesScenario
Note: There is also someabatement of inter‐regional (bunker) emissionswhich, at less than2%of thedifferencebetweenscenarios, is not visible in the 2035 shares.
Figure 6.4 World energy-related CO2 emissions abatement in the450 Scenario relative to the New Policies Scenario
Gt
2020 2035
Efficiency
Renewables
Biofuels
Nuclear
72%
17%
2%
5%
44%
21%
4%
9%
3% 22%
Abatement
Total (Gt CO2)
CCS
20
22
24
26
28
30
32
34
36
38
2010 2015 2020 2025 2030 2035
New Policies Scenario
450 Scenario2.5 14.8
IEA WEO 2011
24

Sustainability helps Energy Security
Figure 6.11 Oil-import bills in selected regions by scenario
0
100
200
300
400
500
600
Japan United States India European Union China
Billio
ndo
llars(2010) 2010
2035: New PoliciesScenario
2035: 450 Scenario
IEA WEO 2011
25
What is Energy Security in the 21st Century?
26

Diversity means Energy Security .Diversity means Energy Security .””Safety and certainty in oil lie in variety and variety alone.Safety and certainty in oil lie in variety and variety alone.”” ( Churchill )( Churchill )
Nuclear is an important option for countries with limited indigenous energy resources .
Self sufficiency =inland production / tpes(2010 estimates)
27
Energy Self -Sufficiency rates by fuels in 2010
IEA

North American Gas Infrastructure
Mid-Term Oil & Gas Market 2010, IEA
28

ロシア以外からのパイプライン
LNG基地(建設中・計画中)
LNG基地(2000年以降運開)
LNG基地(1999年までに運開)
ロシアからのパイプライン
現在
Gas Infra in Europe: New Pipelines and LNG ports.
29

Gas Pipeline system in Japan is very weak. IEA Japan review 2008
30

ASEAN is working on Gas Pipeline System.ASEAN is working on Gas Pipeline System.
Figure 15.16 The Trans-ASEAN Gas Pipeline (TAGP)
0 500Km
Bontang
Tangguh
West Java
LumutLubuan
Bintulu MLNG
Arun
East Java Masela
Jurong Isl.
MarivelesLNG(Baatan)
EAST TIMOR
Kalimantan Senipah
Surabaya
Plaju
Sungiasalak
Dumai
Medan
Krabi
Khanom
Pasuruan
Natuna
Palawan
Ho Chi Minh
Mindanao
Luzon
Dili
Sumatra
Java
BaliLombok
Sumbawa Flores
Sulawesi SeramPapua
Map Ta Phut
M A L A Y S I A
SINGAPORE
CAMBODIA
LAOSMYANMAR
Phnom Penh
Vientiane
Yangon
Bandar SeriBegawan
Manila
Kuala Lumpur
I N D O N E S I A
Jakarta
Hanoi
CHINAINDIA
Bangkok VIETNAM
PHILIPPINES
T H A I L A N D
BRUNEI
Existing gas pipeline
Planned LNG regasification terminal
Planned LNG liquifaction plant
Planned or under construction gas pipeline
Gas production area
LNG liquifaction plant
The boundaries and names shown and the designations used on maps included in this publication do not imply official endorsement or acceptance by the IEA.
Source: ASCOPE Secretariat
31
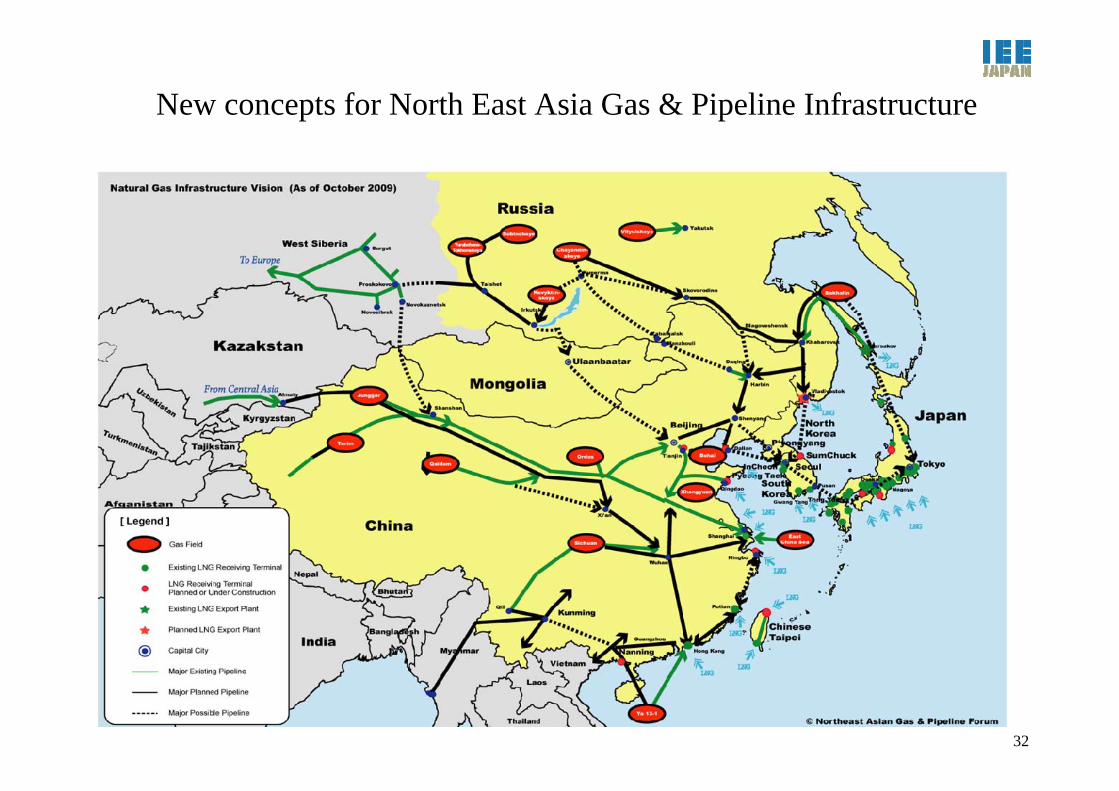
New concepts for North East Asia Gas & Pipeline Infrastructure
32

ASEAN is working on Power Grid Interconnections.
33

Connecting MENA and Europe: " Desertec" as visionary “Energy for Peace"
Source: DESRETEC Foundation34

BhutanBhutan
Gobi DesertGobi Desert
ShanghaiShanghai
TaipeiTaipei
DelhiDelhi
MumbaiMumbai
SingaporeSingapore
VladivostokVladivostok
ChengduChengdu
BeijingBeijing SeoulSeoul
ManilaManila
DaccaDacca
AsiaSuper Grid
Total 36,000km
Phase 3
BangkokBangkok
Hong KongHong Kong
Kuala LumpurKuala Lumpur
TokyoTokyo
Demand Leveling
(Time Zone & Climate Difference)
Stable Supply
(through regional interdependence)
Fair Electricity Price
Presentation by Mr. Masayoshi SON
Energy for Peace in Asia. A New Asian Vision?
35

Technology helps! Hydrogen Community with MCH• Large volume Hydrogen transportation & storage technology will be essential to build ‘Hydrogen Community’.
• ‘Hydrogen Community’ realizes Low Emission Carbon Recycling Society, with empowered resistance against disasters.
• New path toward the Hydrogen Society will enhance innovation and create New Industries.
MCHSolar
Wind
・Pure H2/ Mixed Fuel・Fuel Cell
City Gas
MCH
Steel
Petroleum
Tanker / Ferry
Hydrogen / H2‐CNGFueling Station
・FCV・H2‐CNG Engine
Residential Sector
Logistics Sector
Office & Commercial Sector
Hydrogen Supply(Dehydrogenation)
House / Condominium
・Feedstock
・H2 Reduction
・Desulfurization・Cracking
・H2 Mixture
・Elec. Stabilizer・Stand‐by for Emergency
DistributedPower Gen. Distributed
Power Gen.
・CO2 Recycle( CO2 + H2→CO+H2O)
Clean Hydrogen(Hydrocarbon Sources)
DHC・Boiler / Chiller (Pure H2/mixed)
・Cogeneration・Backup Power・Energy Storage
・Fuel Cells・H2 mixed fuel Engine
・Fuel Cell Ship・Hydrogen mixed fuel Engine
MCH
Car
Bus
Truck
・FCV・H2‐CNG Engine
・FCV・CNG mixed engine
Office & CommercialBuilding
MCH
Hydrogen
MCH
Heat
Electricity
・Heat Recycle
・Heat Recycle
MCH
Strategic Energy Reserve(Large volume)
MCH
MCH
MCH
(Note) MCH : Methylcyclohexane FC : Fuel Cell FCV : Fuel Cell Vehicle GHP : Gas Heat Pump DHC : District Heating and Cooling
Train
・Fuel Cell Train・H2 mixed fuel Engine
Renewable Energy (Local)
MCH
Green Hydrogen(Renewable Sources)
Renewable Energy (Global)
・FC forklift・H2mixed Fuel GHP
Logistics ・FC /EnginesPort Facility
ChemicalPower Gen.
Industrial Sector
Power Storage
MCH
MCH
MCH
MCH
MCH
Energy Sector
・Petro/Chem. By‐product・SRM with EOR/CCS・Gasification
36

Technology helps. Case of Smart Grid
Source: Cities, Towns and Renewable Energy, IEA (2009)
“ Yes in My Front Yard ”
37

Integral Fast Reactor and Pyroprocessing
IFR has features as Inexhaustible Energy Supply ,Inherent Passive Safety ,Long-term Waste Management Solution , Proliferation-Resistance , Economic Fuel Cycle Closure.
Dr. YOON IL CHANGArgonne National Laboratory
38

$39 Trillion and more Investment is needed for energy Infrastructure.
Figure 2.21 Cumulative investment in energy-supply infrastructure byregion in the New Policies Scenario, 2011-2035
0 1 2 3 4 5 6 7 8
OECD Americas
China
OECD Europe
Africa
La n America
Other Asia
Russia
Middle East
India
OECD Asia Oceania
Other E. Europe/Eurasia
Trillion dollars (2010)
Power
Oil
Gas
Coal
Biofuels
IEA WEO 2011
39

One cannot enhance energy security by risking someone else‘s.
-Lesson of the Quake and Tsunami : Think about the unthinkable.-Energy Security for the 21st Century must be Comprehensive Electricity Supply Security under sustainability constraints.-EU Model of Collective Energy Security be applied to the growing Asia. Develop Regional Power Grid interconnection & Gas Pipelines including Russia.-Innovation in Power supply: Efficiency, Decentralized Renewables, EVs, Smart Grids, Storage, etc. -Develop gas resources and infrastructure. Diversify supply and demand. Russia remains as a key player.-For coal to remain the backbone of power supply, CCS readiness & highly efficient power plants are needed.-Nuclear Power will continue to play a major role in the world. Japan’s role after Fukushima is to share the lessons learned for safer Nuclear Power deployment in Asia and elsewhere. Develop safer and more proliferation-free reactor models, e.g. Integral Fast Reactor as the 4G or Modular. -New technologies help; hydrogen economy, Methane-hydrate , Super-conductivity grid.
40
Recommended