Engaging African American StudentsCompare Student Engagement and Student Satisfaction at HBCUs and their Self-Identified PWIs using National Survey of Student Engagement (NSSE) Data
Pu-Shih Daniel Chen
Ted Ingram
Lowell K. DavisIndiana University
Center for Postsecondary Research

OVERVIEW
• Background Information• Literature Review• Methods• Findings• Applications for Institutions

Education for African Americans
The citizenship status of African Americansin the American colonies were loosely
defined during the country's infancy. Incolonial America, there were free blacks aswell as enslaved blacks. But as the colonies
began to rely on a slave labor economy,education of blacks was restricted, and then
outlawed.
With the close of the Civil War 4.4 millionfree African Americans embark upon aneducational journey. Blacks, missionaries,
and the federal government work togetherto create schools.

Current Status of HBCUs
• One hundred and seventy-two years after their inception, historically black colleges and universities stand at the crossroad, ready to take on the future.
• Affirmative Action
• Prepared for Greatness

Importance of Topic• Historically Black College and
Universities are compared with self selected peers
• We attempt to determine the relationship between engagement and student satisfaction
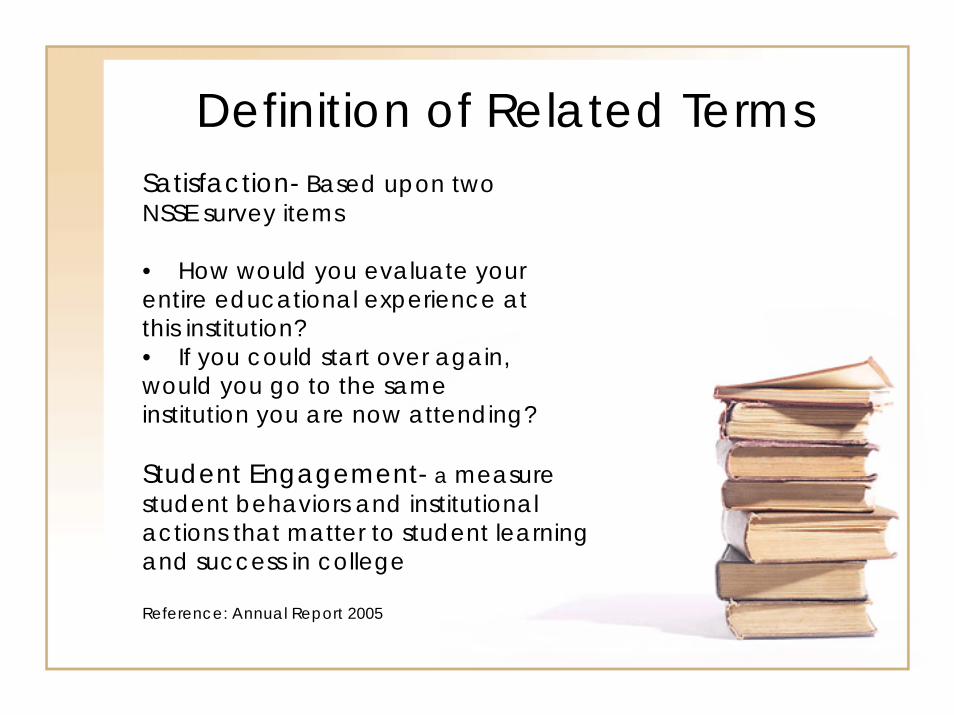
Definition of Related TermsSatisfaction- Based upon twoNSSE survey items
• How would you evaluate yourentire educational experience atthis institution?• If you could start over again,would you go to the sameinstitution you are now attending?
Student Engagement- a measurestudent behaviors and institutional actions that matter to student learningand success in college
Reference: Annual Report 2005

Background of NSSE• Measure effective educational
practices• Began in 2000• Surveyed more than 1000 four-year
colleges and universities• More than 528 colleges and
universities participated in 2005 (17 HBCUs)
• Average response rate ~40%

Survey Administration• How do undergraduates spend
their time and what do they gain from attending college?
• Spring administration
• Survey items examine: student-faculty interaction, satisfaction, academic preparation and execution, out-of-class activities, etc.

NSSE Survey Administration• Paper ,Web, Web+• Paper: Contact students by
mail, students can respond by mail or web
• Web: Solely Electronic Communication
• Web+: Hardcopy paper survey is used to supplement web survey
• Student potentially contacted 5x’s

Research Questions• Do African American/Black
students have the same level of education engagement at HBCUs vs. PWIs?
• Do African American students have the same level of satisfaction with their collegiate experience at HBCUs vs. PWIs?
• What factor may drive the differences, if any, in student satisfaction between HBCUs and PWIs?

Black student engagement at HBCUs
• More likely to be involved in student government (Sutton & Kimbrough, 2001)
• Spent more time utilizing campus facilities and participating in clubs and organizations (Watson & Kuh, 1996)
• Direct effects on self-reported gains in:– understanding the arts and
humanities – Personal and social development– Understanding science and
technology– Intellectual developing and writing
skills (Flowers, 2002)
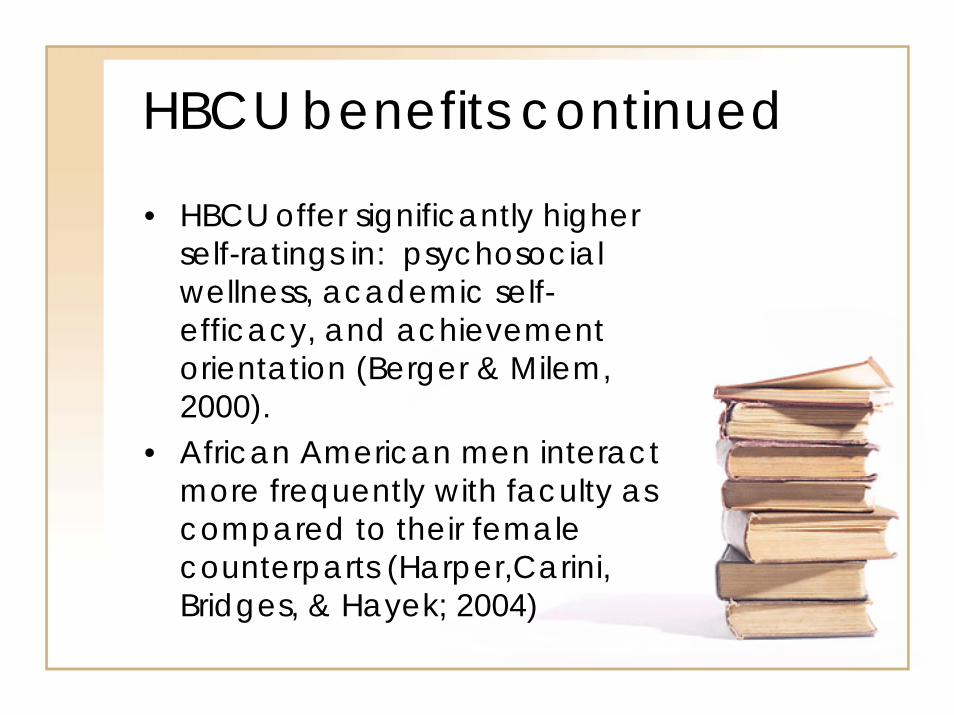
HBCU benefits continued
• HBCU offer significantly higher self-ratings in: psychosocial wellness, academic self-efficacy, and achievement orientation (Berger & Milem, 2000).
• African American men interact more frequently with faculty as compared to their female counterparts (Harper,Carini, Bridges, & Hayek; 2004)

Research Methods• Sample:
– 1,631 seniors from 17 HBCU– 2,939 seniors from 246 PWI
• Instrument– National Survey of Student
Engagement (2005)

Research Methods (continued)
• Dependent Variables– NSSE Benchmarks of Effective
Educational Practices– Deep Learning Scales– Gain Scales– Satisfaction Scale

Dependent Variables• NSSE Benchmarks of Effective
Educational Practice
– Level of Academic Challenge
– Active and Collaborative Learning
– Student-Faculty Interaction
– Enriching Educational Experiences
– Supportive Campus Environment
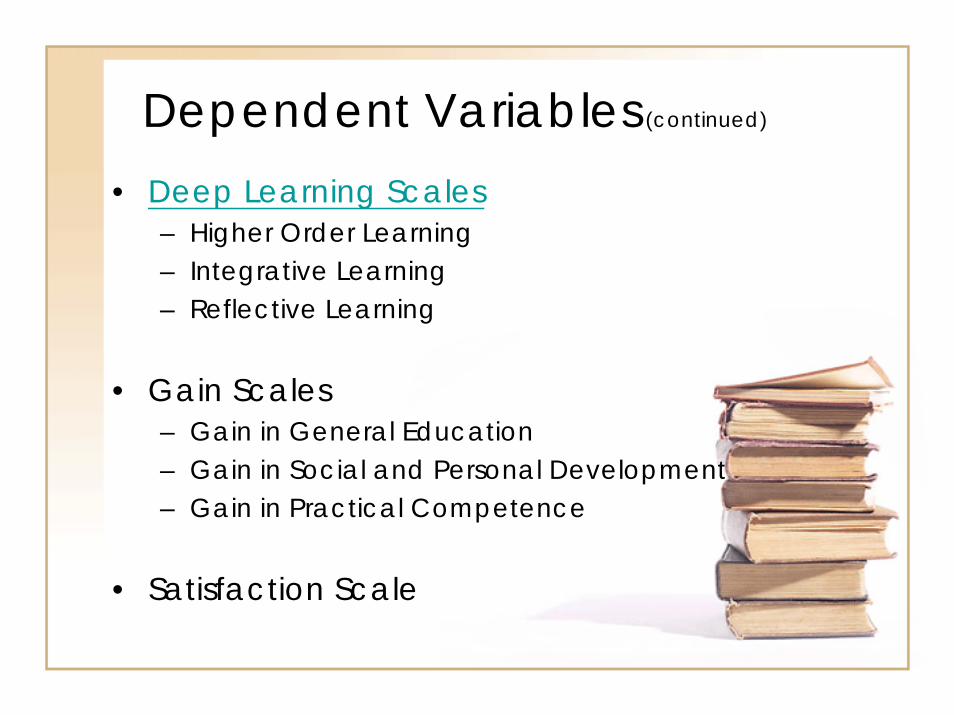
Dependent Variables (continued)
• Deep Learning Scales– Higher Order Learning– Integrative Learning– Reflective Learning
• Gain Scales– Gain in General Education– Gain in Social and Personal Development– Gain in Practical Competence
• Satisfaction Scale

Data Analysis• Analysis of Covariance
(ANCOVA)– IV: HBCU Status– DV: NSSE Scales– Covariables:
• Public/private• Student enrollment size• Average faculty salary

Institutional Characteristics HBCU PWI Number of Institutions 17 246 African American Student Percentage 89% 8% Average Full-time Enrollment (FTE) 3,872 5,695 Average Percentage of Faculty with Terminal Degree 67% 80% Average salary equated to 9-month contracts of full-time instructional faculty - all ranks 54,064 56,458
Carnegie Classifications (2000 version) Doctoral Extensive 0% 2% Doctoral Intensive 6% 10% Master’s 65% 39% Baccalaureate – Liberal Arts 0% 28% Baccalaureate – General 29% 20% Institutional Control Public 82% 55% Private 18% 45%

35
40
45
50
55
60
65
HBCU
PWI
HBCU 56.28 58.9 49.63 43.05 58.41
PWI 55.92 53.1 43.77 41.64 58.73
Level ofAcademicChallenge
Active &Collaborative
Learning
Student-Faculty
Interaction
EnrichingEducationalExperiences
SupportiveCampus
Environment
NSSE Benchmarks

58
60
62
64
66
68
70
72
74
HBCU
PWI
HBCU 71.72 64.25 65.73
PWI 69.96 60.91 63.67
Higher Order Learning Integrative Learning Reflective Learning
Deep Learning Scales
50
55
60
65
70
75
80
HBCU
PWI
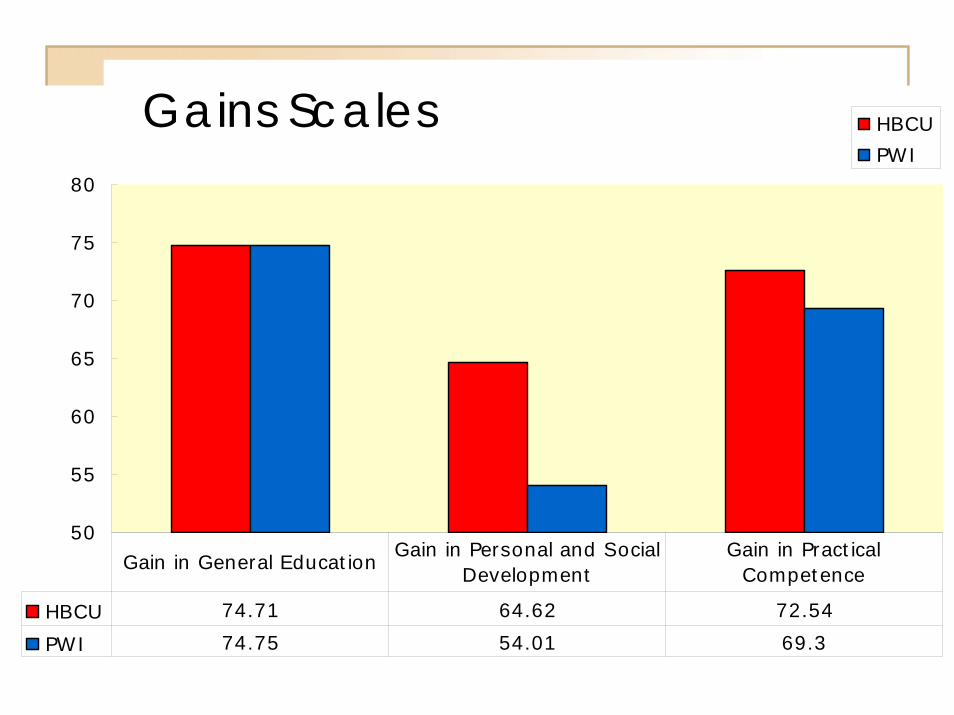
HBCU 74.71 64.62 72.54
PWI 74.75 54.01 69.3
Gain in General EducationGain in Personal and Social
DevelopmentGain in Practical
Competence
Gains Scales

55
60
65
70
75
80
85
HBCU
PWI
HBCU 66.2 63.00 79.50 71.50
PWI 69.92 69.00 83.70 75.80
OverallSatisfaction
Academic Advising Entire EducationalExperience
Would you AttendAgain?
Student Satisfaction

Data Analysis (continued)
• Correlational Analysis– Satisfaction scale– All NSSE Items
• ANCOVA– IV: HBCU status– DV: NSSE Items that have a
correlation coefficient with satisfaction scale greater than .3

Factors that Affect Satisfaction• Relationship with other students• Relationship with faculty members• Relationship with administrative
personnel and offices• Institution emphasizes in providing
the support you need to help you succeed academically
• Institution emphasizes in encouraging contact among students from different economic, social, and racial or ethnic backgrounds
• Institution emphasizes in providing the support you need to thrive socially

2
2.5
3
3.5
4
4.5
5
5.5
6
HBCU
PWI
HBCU 5.78 5.35 4.21 2.9 2.45 2.36
PWI 5.51 5.42 4.89 2.96 2.45 2.22
Relationship withother students
Relationship withfaculty members
Relationship withadministrative
personnel
Institutionemphasis:
academic support
Institutionemphasis: diverse
contacts
Institutionemphasis: social
support
Factors that Affect Satisfaction

Applications for Institutions• HBCU’s are doing a good job in
providing an educationally engaging environment for African American students
• Relationship with administrative personnel and offices play an important role in student satisfaction

Questions
Recommended