Equitile Investments ACS
Interim Report (Unaudited)
For the period 01 January 2017 to 30 June 2017
Interim Financial Statements (Unaudited) June 2017
2
Table of Contents
General information .................................................................................................................... 3
ACS Manager’s Report ................................................................................................................ 4
Sub-Fund Review ........................................................................................................................ 6
Financial Statements of the Sub-Fund ....................................................................................... 14
Summary of Significant Accounting Policies .............................................................................. 16
Disclaimer ................................................................................................................................. 17
Interim Financial Statements (Unaudited) June 2017
3
General information
1. ACS Manager -
Equitile
Investments Ltd
Directors
Andrew McNally
George Cooper
Nigel Hellewell
Thor Johan Furuholmen
Xiyang He
Head office :
20 St Dunstan’s Hill,
London, EC3R 8ND,
United Kingdom
Registered Office :
Bridge House,
4 Borough High Street,
London SE1 9QR,
United Kingdom
2. Depositary HSBC Bank Plc 8 Canada Square,
London E14 5HQ,
United Kingdom
3. Registrar
HSBC Bank Plc 8 Canada Square,
London E14 5HQ,
United Kingdom
4. Independent
Auditors
PricewaterhouseCoopers LLP 7 More London,
Riverside,
London SE1 2RT
United Kingdom
Interim Financial Statements (Unaudited) June 2017
4
ACS Manager’s Report
Equitile Investments ACS Overview
Equitile Investments ACS (the "Scheme") is an Authorised Contractual Scheme which is constituted
as an umbrella Co-Ownership Scheme as defined under section 235A(2) of FSMA and for the
purposes of the EU Regulation, the UCITS Directive, the UCITS Regulation, the Collective
Investment in Transferable Securities (Contractual Scheme) Regulations 2013 (SI 2013/1388) and
the FCA Handbook (including the COLL Sourcebook) made under FSMA, and any other applicable
rules made under FSMA from time to time in force. Equitile Investments Ltd (a Private Limited
Company (the “Company”)) is the appointed ACS Manager (the “Manager”) and HSBC Bank Plc, is
the appointed Depositary to whom the Scheme Property is entrusted for safekeeping.
The Scheme has segregated liability between sub-funds of the Scheme (“Funds”). The Scheme was
authorised by the FCA on 16 December 2015. The Scheme is organised as an umbrella Co-
Ownership Scheme comprising separate Sub-Funds and segregated portfolio of assets.
Accordingly, the Funds’ assets are allocated exclusively to that Sub-Fund and shall not be used or
made available to discharge (directly or indirectly) the liabilities of, or claims against, any other
person or body, including any other Sub-Funds that may be established under the Scheme on a
later date and shall not be available for any other purpose.
Except where otherwise stated or the context requires, capitalised terms have the meaning given
to them in the Prospectus of the Scheme dated 30 September 2016.
Investment objective and policy
Equitile Resilience Fund
The Scheme currently has one sub-fund, Equitile Resilience Fund (the “Sub-Fund”), a UCITS
Scheme under the COLL Sourcebook. The Sub-Fund was authorised by the FCA on 16 December
2015.
The Sub-Fund aims to deliver capital growth by investing in the equities
of resilient companies, meaning those assessed as being well-managed, conservatively financed
and benefiting from strong corporate governance. Additionally, the Sub-Fund may choose to
invest in bonds and money market instruments as part of strategy diversification. Investors may
assess the success of this strategy by considering, in combination, the average annual return of
the Sub-Fund and the average annual maximum loss of the Sub-Fund where the annual maximum
loss is defined as the largest percentage loss which an investor could have incurred by investing
into and subsequently redeeming from the Sub-Fund within a given year.
In normal market conditions, the Sub-Fund will be close to fully invested in equity securities (e.g.
shares). Allocations to bonds and cash may be made periodically for the purpose of capital
preservation. Use may be made of cash holdings, hedging and other investment techniques for
the purposes of efficient portfolio management as permitted by the COLL Sourcebook. The Sub-
Fund will not utilise borrowing or leverage in order to achieve the investment objective. Short term
Interim Financial Statements (Unaudited) June 2017
5
Equitile Investments ACS Overview
borrowing may be used for the purposes of efficient portfolio management. The Sub-Fund may
utilise derivatives for efficient portfolio construction and for hedging purposes.
ACS Manager’s Statement
In accordance with the Regulations, we hereby certify the report on behalf of the Directors of
Equitile Investments Ltd.
Andrew Christopher McNally William Nigel Hellewell
Chief Executive Officer (of the ACD) Chief Operating officer (of the ACD)
21 August 2017
Interim Financial Statements (Unaudited) June 2017
6
Sub-Fund Review
As at 30 June 2017, the Scheme had 1 active sub-fund.
Fund Launch date Base currency
Equitile Resilience Fund 29 February 2016 GBP
The specific investment objectives and policies for the Sub-Fund are formulated by the Directors
and set out in the Scheme’s prospectus and other Scheme literature.
Investment Review
Please note this investment review is for the period from 31 December 2016 to 30 June 2017.
Performance and Market Review
The Sub-Fund (the “Fund”) has seen a good start to 2017, which will be its first full calendar year
of operation. In the long-term we anticipate the investment strategy deployed by the Fund will
deliver high single-digit percentage point returns per year, on average, over the economic cycle.
Although the returns generated during the first-half of this year have exceeded this expectation,
they remain consistent with our broader expectations for the Fund’s strategy given the market
environment.
For equity investors more broadly, it has been a good start to the year with markets in both the
US and Europe seeing positive returns. Despite much hope on behalf of many market participants
that European equity markets would finally start to outperform US equities, this has not been
realised. Although European indices were ahead at the very start of the year, the US market soon
recovered its poise – leaving the broader US market indices with approximately twice the return
of the major European indices.
The political environment remains febrile. Uncertainty around the stability of the Trump
administration in the US and the likely path of the Brexit negotiations, which are now well under
way, continue to dominate the narrative. Although equity markets in aggregate have shrugged off
this uncertainty, it has been at the heart of developments at the sectoral and regional level. Initial
enthusiasm for the potential positive impact of Trump’s policies on economic growth, and the
subsequent shift into more cyclical companies, soon waned and investors’ shift into European
equities at the very start of the year has now been subsumed by a resurgence in interest in US
growth stocks - particularly in areas such as healthcare and technology where your Fund has
strong representation.
Having started with around 80% of your Fund invested in North American companies, there has
been incremental investment in Europe as the year has progressed. Companies such as luxury
goods manufacturers, LVMH and Kering, the Finnish healthcare company, Orion, and mid-sized
Dutch specialist engineer, Aalberts Industries.
Interim Financial Statements (Unaudited) June 2017
7
Sub-Fund Review
From an industry perspective, the most meaningful shift has been out of consumer staples into
more technology rich sectors. In particular, Procter & Gamble, Ingredion, Saputo and Tyson Foods
were sold during the period while additional investments were made into existing holdings in the
semi-conductor manufacturing space. In addition, a new investment was made in that most
recognisable of all technology companies, Apple.
Outlook
Equities will remain our preferred investment for some time to come. Although a rise in
protectionism will contribute to inflationary pressure over time, central banks around the world
continue struggling to deal with high levels of debt, making it difficult for them to increase interest
rates to a level normally associated with increasing inflation or accelerating economic growth.
Consequently, as interest rates continue for the foreseeable future to lag behind where one would
conventionally expect them to be, given broad levels of growth and inflation, the main challenge
is to protect our investors’ against inflationary pressure. We see equities as one of the main
investments to achieve this.
In particular, by investing your Fund only in companies we deem financially resilient, we aim to
manage risk while achieving superior growth over the long term.
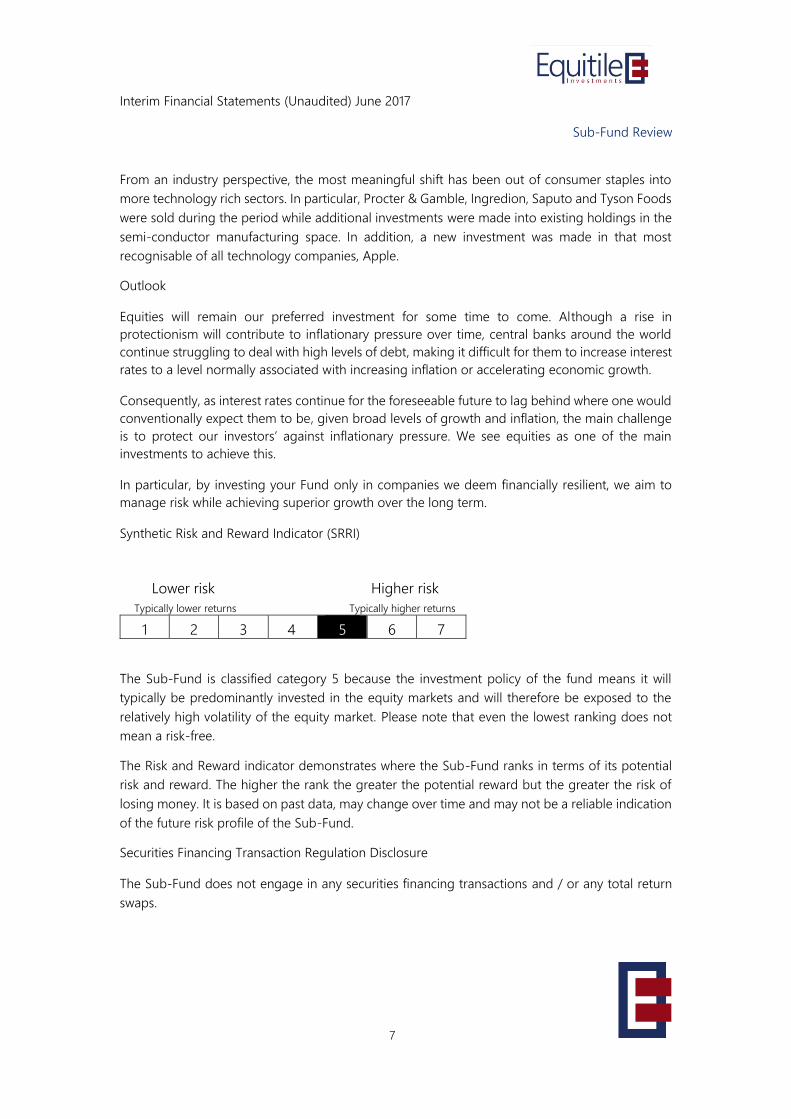
Synthetic Risk and Reward Indicator (SRRI)
Lower risk Higher risk
Typically lower returns Typically higher returns
1 2 3 4 5 6 7
The Sub-Fund is classified category 5 because the investment policy of the fund means it will
typically be predominantly invested in the equity markets and will therefore be exposed to the
relatively high volatility of the equity market. Please note that even the lowest ranking does not
mean a risk-free.
The Risk and Reward indicator demonstrates where the Sub-Fund ranks in terms of its potential
risk and reward. The higher the rank the greater the potential reward but the greater the risk of
losing money. It is based on past data, may change over time and may not be a reliable indication
of the future risk profile of the Sub-Fund.
Securities Financing Transaction Regulation Disclosure
The Sub-Fund does not engage in any securities financing transactions and / or any total return
swaps.
Interim Financial Statements (Unaudited) June 2017
8
Sub-Fund Review
Comparative Tables
The Comparative Tables are prepared in accordance with Appendix A of IMA SORP 2014, on pages
8 & 9 give the performance of each active share class in the Sub-Fund.
The ‘Return after operating charges’ disclosed in the Comparative Tables is calculated as the return
after operating charges per share divided by the opening net asset value per share. It differs from
the Sub-Fund’s performance disclosed in the Manager's report which is calculated based on the
latest published price.
Portfolio transaction costs are incurred when investments are bought or sold by the Sub-Fund in
order to achieve the investment objective. Direct transaction costs include broker commission
and taxes. Broker commission includes the fee to a broker to execute the trades and research
costs.
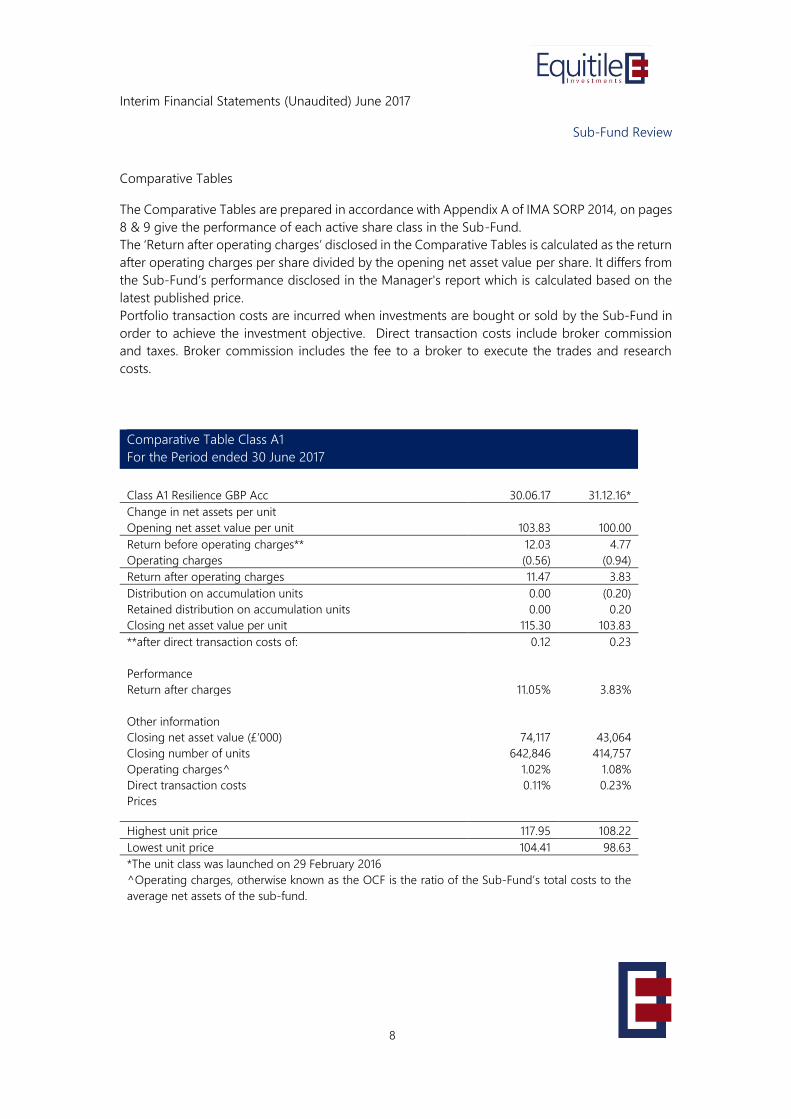
Comparative Table Class A1
For the Period ended 30 June 2017
Class A1 Resilience GBP Acc 30.06.17 31.12.16*
Change in net assets per unit
Opening net asset value per unit 103.83 100.00
Return before operating charges** 12.03 4.77
Operating charges (0.56) (0.94)
Return after operating charges 11.47 3.83
Distribution on accumulation units 0.00 (0.20)
Retained distribution on accumulation units 0.00 0.20
Closing net asset value per unit 115.30 103.83
**after direct transaction costs of: 0.12 0.23
Performance
Return after charges 11.05% 3.83%
Other information
Closing net asset value (£’000) 74,117 43,064
Closing number of units 642,846 414,757
Operating charges^ 1.02% 1.08%
Direct transaction costs 0.11% 0.23%
Prices
Highest unit price 117.95 108.22
Lowest unit price 104.41 98.63
*The unit class was launched on 29 February 2016
^Operating charges, otherwise known as the OCF is the ratio of the Sub-Fund’s total costs to the
average net assets of the sub-fund.
Interim Financial Statements (Unaudited) June 2017
9
Sub-Fund Review
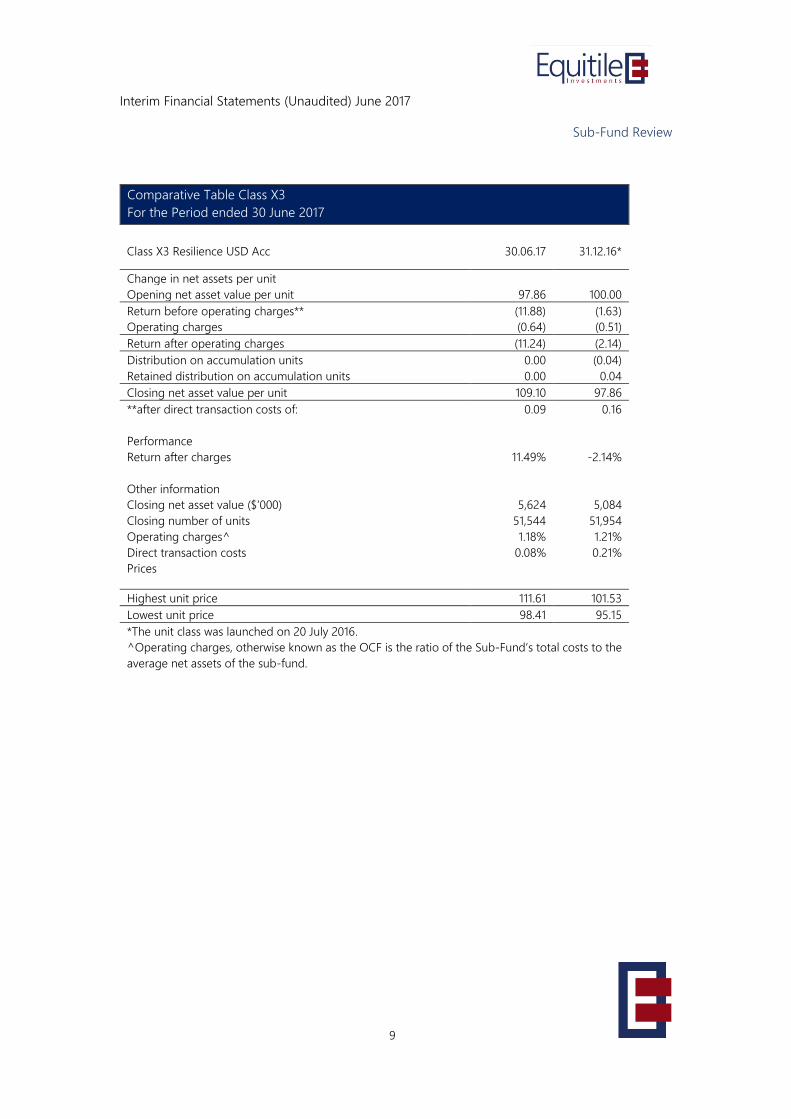
Comparative Table Class X3
For the Period ended 30 June 2017
Class X3 Resilience USD Acc 30.06.17 31.12.16*
Change in net assets per unit
Opening net asset value per unit 97.86 100.00
Return before operating charges** (11.88) (1.63)
Operating charges (0.64) (0.51)
Return after operating charges (11.24) (2.14)
Distribution on accumulation units 0.00 (0.04)
Retained distribution on accumulation units 0.00 0.04
Closing net asset value per unit 109.10 97.86
**after direct transaction costs of: 0.09 0.16
Performance
Return after charges 11.49% -2.14%
Other information
Closing net asset value ($’000) 5,624 5,084
Closing number of units 51,544 51,954
Operating charges^ 1.18% 1.21%
Direct transaction costs 0.08% 0.21%
Prices
Highest unit price 111.61 101.53
Lowest unit price 98.41 95.15
*The unit class was launched on 20 July 2016.
^Operating charges, otherwise known as the OCF is the ratio of the Sub-Fund’s total costs to the
average net assets of the sub-fund.
Interim Financial Statements (Unaudited) June 2017
10
Sub-Fund Review
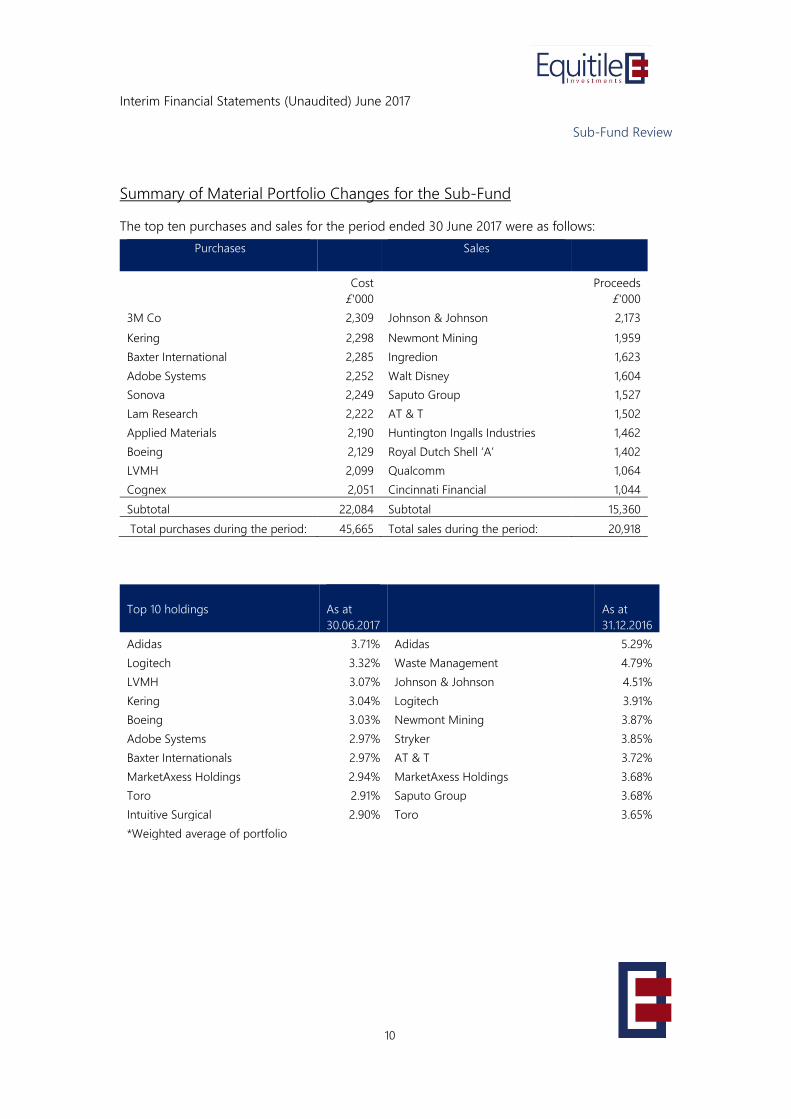
Summary of Material Portfolio Changes for the Sub-Fund
The top ten purchases and sales for the period ended 30 June 2017 were as follows:
Purchases
Sales
Cost Proceeds
£'000 £'000
3M Co 2,309 Johnson & Johnson 2,173
Kering 2,298 Newmont Mining 1,959
Baxter International 2,285 Ingredion 1,623
Adobe Systems 2,252 Walt Disney 1,604
Sonova 2,249 Saputo Group 1,527
Lam Research 2,222 AT & T 1,502
Applied Materials 2,190 Huntington Ingalls Industries 1,462
Boeing 2,129 Royal Dutch Shell ‘A’ 1,402
LVMH 2,099 Qualcomm 1,064
Cognex 2,051 Cincinnati Financial 1,044
Subtotal 22,084 Subtotal 15,360
Total purchases during the period: 45,665 Total sales during the period: 20,918
Top 10 holdings
As at
30.06.2017
As at
31.12.2016
Adidas 3.71% Adidas 5.29%
Logitech 3.32% Waste Management 4.79%
LVMH 3.07% Johnson & Johnson 4.51%
Kering 3.04% Logitech 3.91%
Boeing 3.03% Newmont Mining 3.87%
Adobe Systems 2.97% Stryker 3.85%
Baxter Internationals 2.97% AT & T 3.72%
MarketAxess Holdings 2.94% MarketAxess Holdings 3.68%
Toro 2.91% Saputo Group 3.68%
Intuitive Surgical 2.90% Toro 3.65%
*Weighted average of portfolio
Interim Financial Statements (Unaudited) June 2017
11
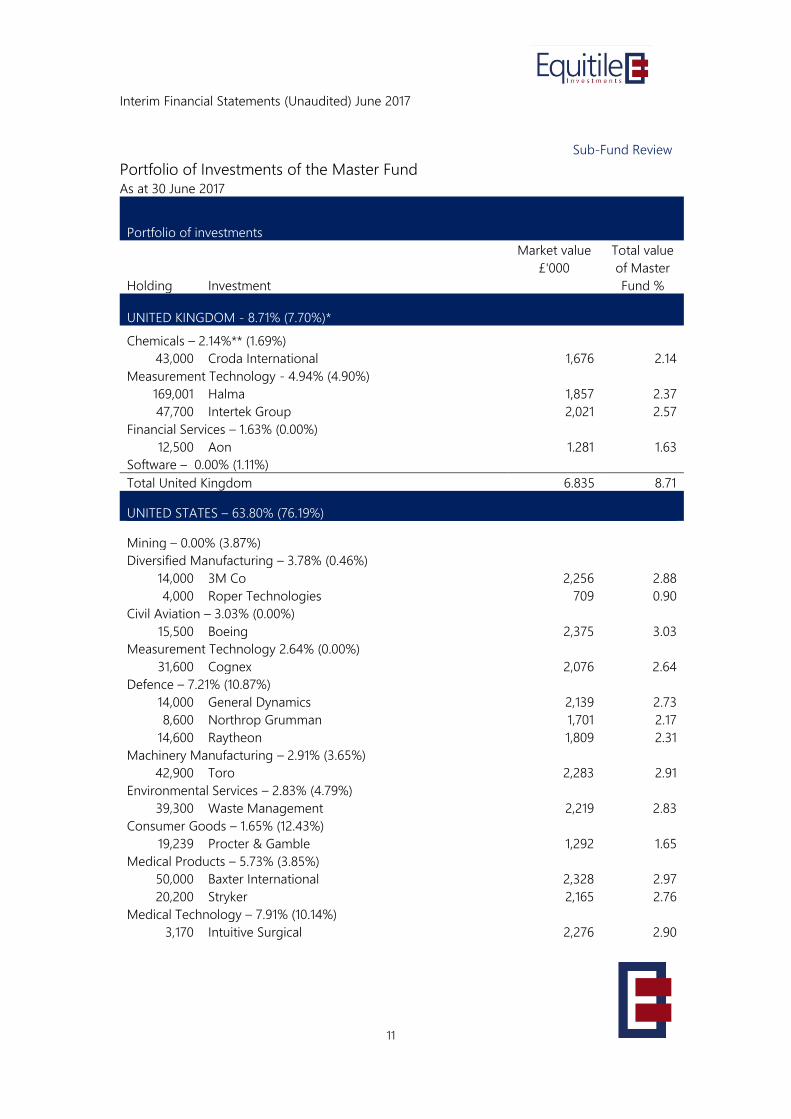
Sub-Fund Review
Portfolio of Investments of the Master Fund As at 30 June 2017
Portfolio of investments
Holding Investment
Market value
£'000
Total value
of Master
Fund %
UNITED KINGDOM - 8.71% (7.70%)*
Chemicals – 2.14%** (1.69%)
43,000 Croda International 1,676 2.14
Measurement Technology - 4.94% (4.90%)
169,001 Halma 1,857 2.37
47,700 Intertek Group 2,021 2.57
Financial Services – 1.63% (0.00%)
12,500 Aon 1.281 1.63
Software – 0.00% (1.11%)
Total United Kingdom 6.835 8.71
UNITED STATES – 63.80% (76.19%)
Mining – 0.00% (3.87%)
Diversified Manufacturing – 3.78% (0.46%)
14,000 3M Co 2,256 2.88
4,000 Roper Technologies 709 0.90
Civil Aviation – 3.03% (0.00%)
15,500 Boeing 2,375 3.03
Measurement Technology 2.64% (0.00%)
31,600 Cognex 2,076 2.64
Defence – 7.21% (10.87%)
14,000 General Dynamics 2,139 2.73
8,600 Northrop Grumman 1,701 2.17
14,600 Raytheon 1,809 2.31
Machinery Manufacturing – 2.91% (3.65%)
42,900 Toro 2,283 2.91
Environmental Services – 2.83% (4.79%)
39,300 Waste Management 2,219 2.83
Consumer Goods – 1.65% (12.43%)
19,239 Procter & Gamble 1,292 1.65
Medical Products – 5.73% (3.85%)
50,000 Baxter International 2,328 2.97
20,200 Stryker 2,165 2.76
Medical Technology – 7.91% (10.14%)
3,170 Intuitive Surgical 2,276 2.90
Interim Financial Statements (Unaudited) June 2017
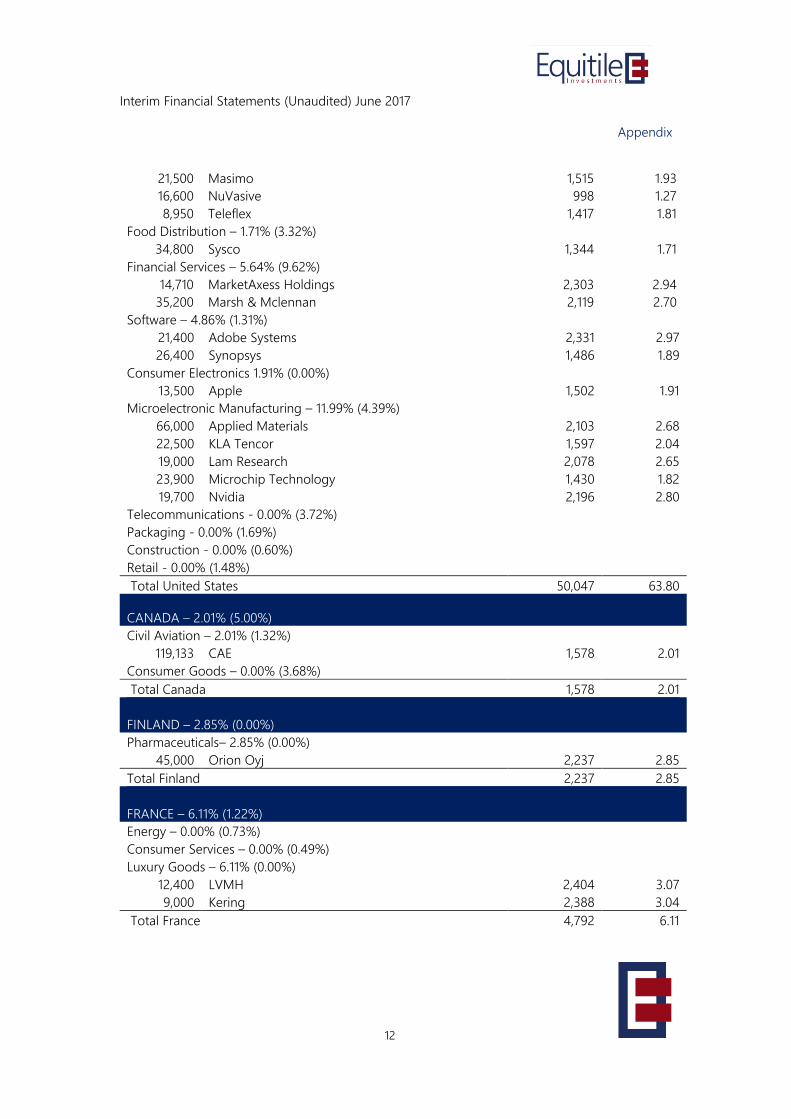
12
Appendix
21,500 Masimo 1,515 1.93
16,600 NuVasive 998 1.27
8,950 Teleflex 1,417 1.81
Food Distribution – 1.71% (3.32%)
34,800 Sysco 1,344 1.71
Financial Services – 5.64% (9.62%)
14,710 MarketAxess Holdings 2,303 2.94
35,200 Marsh & Mclennan 2,119 2.70
Software – 4.86% (1.31%)
21,400 Adobe Systems 2,331 2.97
26,400 Synopsys 1,486 1.89
Consumer Electronics 1.91% (0.00%)
13,500 Apple 1,502 1.91
Microelectronic Manufacturing – 11.99% (4.39%)
66,000 Applied Materials 2,103 2.68
22,500 KLA Tencor 1,597 2.04
19,000 Lam Research 2,078 2.65
23,900 Microchip Technology 1,430 1.82
19,700 Nvidia 2,196 2.80
Telecommunications - 0.00% (3.72%)
Packaging - 0.00% (1.69%)
Construction - 0.00% (0.60%)
Retail - 0.00% (1.48%)
Total United States 50,047 63.80
CANADA – 2.01% (5.00%)
Civil Aviation – 2.01% (1.32%)
119,133 CAE 1,578 2.01
Consumer Goods – 0.00% (3.68%)
Total Canada 1,578 2.01
FINLAND – 2.85% (0.00%)
Pharmaceuticals– 2.85% (0.00%)
45,000 Orion Oyj 2,237 2.85
Total Finland 2,237 2.85
FRANCE – 6.11% (1.22%)
Energy – 0.00% (0.73%)
Consumer Services – 0.00% (0.49%)
Luxury Goods – 6.11% (0.00%)
12,400 LVMH 2,404 3.07
9,000 Kering 2,388 3.04
Total France 4,792 6.11
Interim Financial Statements (Unaudited) June 2017
13
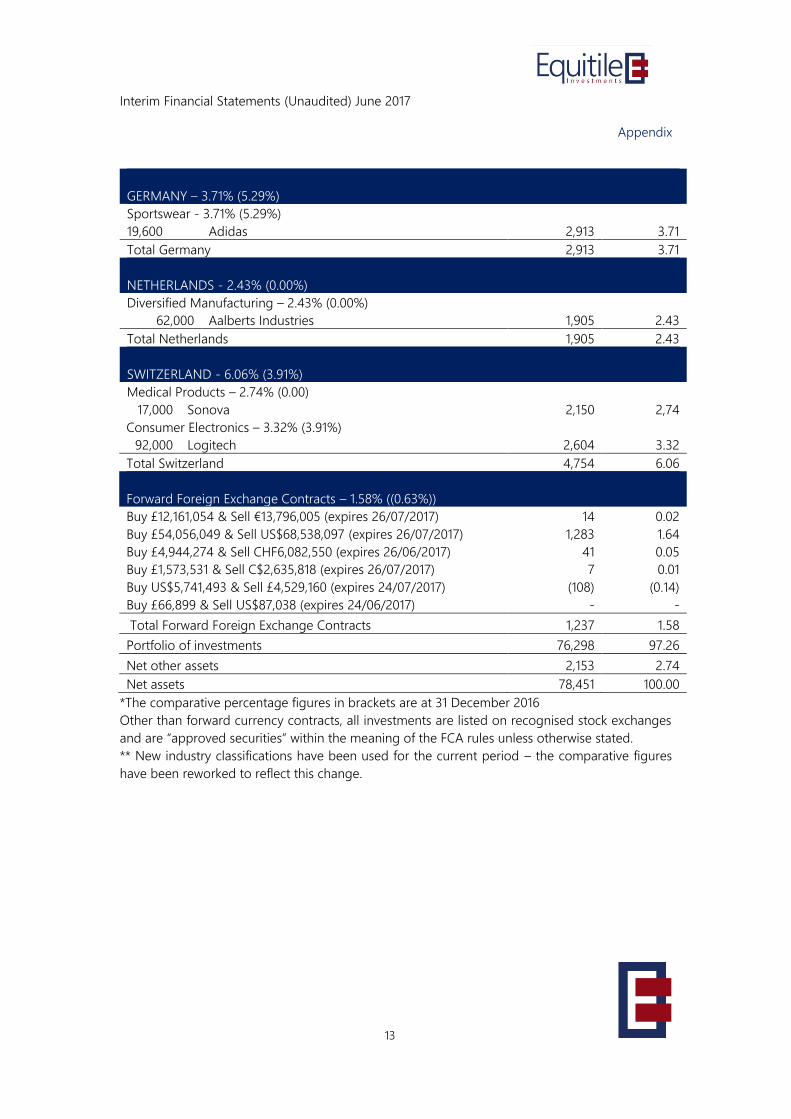
Appendix
GERMANY – 3.71% (5.29%)
Sportswear - 3.71% (5.29%)
19,600 Adidas 2,913 3.71
Total Germany 2,913 3.71
NETHERLANDS - 2.43% (0.00%)
Diversified Manufacturing – 2.43% (0.00%)
62,000 Aalberts Industries 1,905 2.43
Total Netherlands 1,905 2.43
SWITZERLAND - 6.06% (3.91%)
Medical Products – 2.74% (0.00)
17,000 Sonova 2,150 2,74
Consumer Electronics – 3.32% (3.91%)
92,000 Logitech 2,604 3.32
Total Switzerland 4,754 6.06
Forward Foreign Exchange Contracts – 1.58% ((0.63%))
Buy £12,161,054 & Sell €13,796,005 (expires 26/07/2017) 14 0.02
Buy £54,056,049 & Sell US$68,538,097 (expires 26/07/2017) 1,283 1.64
Buy £4,944,274 & Sell CHF6,082,550 (expires 26/06/2017) 41 0.05
Buy £1,573,531 & Sell C$2,635,818 (expires 26/07/2017) 7 0.01
Buy US$5,741,493 & Sell £4,529,160 (expires 24/07/2017) (108) (0.14)
Buy £66,899 & Sell US$87,038 (expires 24/06/2017) - -
Total Forward Foreign Exchange Contracts 1,237 1.58
Portfolio of investments 76,298 97.26
Net other assets 2,153 2.74
Net assets 78,451 100.00
*The comparative percentage figures in brackets are at 31 December 2016
Other than forward currency contracts, all investments are listed on recognised stock exchanges
and are “approved securities” within the meaning of the FCA rules unless otherwise stated.
** New industry classifications have been used for the current period – the comparative figures
have been reworked to reflect this change.
Interim Financial Statements (Unaudited) June 2017
14
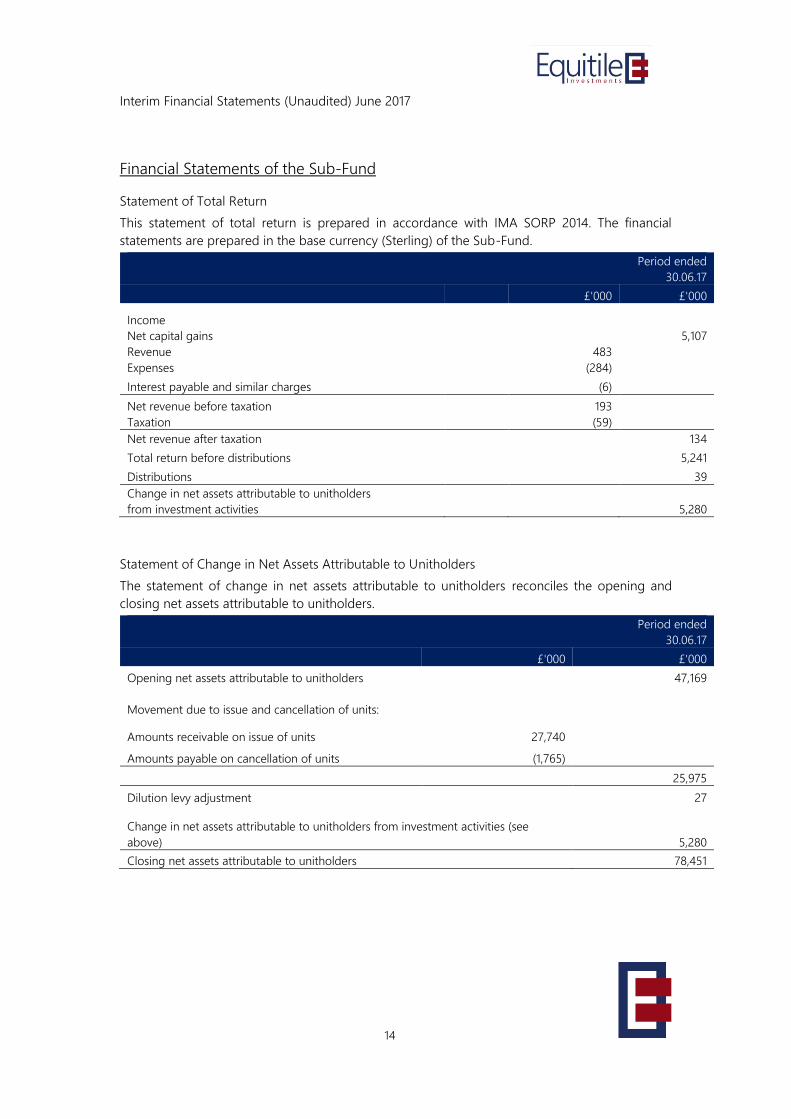
Financial Statements of the Sub-Fund
Statement of Total Return
This statement of total return is prepared in accordance with IMA SORP 2014. The financial
statements are prepared in the base currency (Sterling) of the Sub-Fund.
Period ended
30.06.17
£'000 £'000
Income Net capital gains 5,107
Revenue 483
Expenses (284)
Interest payable and similar charges (6)
Net revenue before taxation 193 Taxation (59)
Net revenue after taxation 134
Total return before distributions 5,241
Distributions 39
Change in net assets attributable to unitholders
from investment activities 5,280
Statement of Change in Net Assets Attributable to Unitholders
The statement of change in net assets attributable to unitholders reconciles the opening and
closing net assets attributable to unitholders.
Period ended
30.06.17
£'000 £'000
Opening net assets attributable to unitholders -47,169
Movement due to issue and cancellation of units:
Amounts receivable on issue of units 27,740
Amounts payable on cancellation of units (1,765)
25,975
Dilution levy adjustment 27
Change in net assets attributable to unitholders from investment activities (see
above) 5,280
Closing net assets attributable to unitholders 78,451
Interim Financial Statements (Unaudited) June 2017
15
Financial Statements of the Sub-Fund
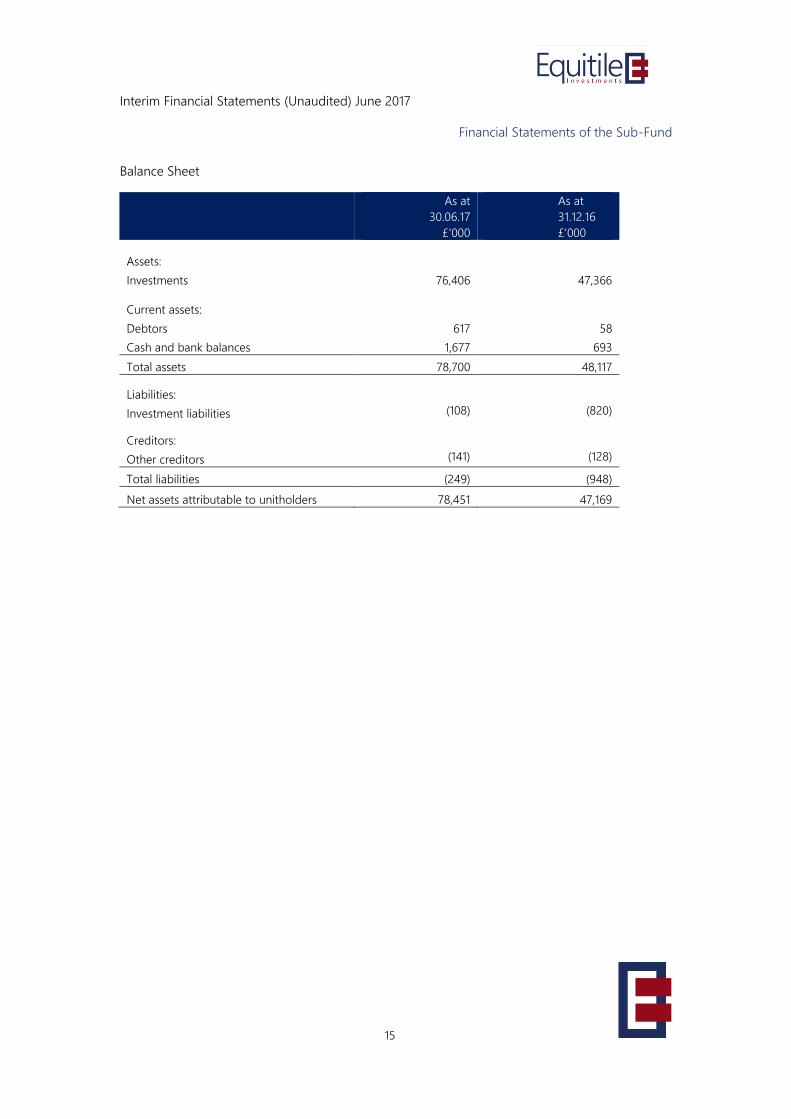
Balance Sheet
As at
30.06.17
£'000
As at
31.12.16
£'000
Assets:
Investments 76,406 47,366
Current assets:
Debtors 617 58
Cash and bank balances 1,677 693
Total assets 78,700 48,117
Liabilities:
Investment liabilities (108) (820)
Creditors:
Other creditors (141) (128)
Total liabilities (249) (948)
Net assets attributable to unitholders 78,451 47,169
Interim Financial Statements (Unaudited) June 2017
16
Summary of Significant Accounting Policies
The accounting policies applied are consistent with those of the annual financial statements for
the year ended 31 December 2016 and are described in those annual financial statements.
The Financial Statements have been prepared on a going concern basis, under the historical cost
convention as modified by the revaluation of certain financial assets and liabilities measured at fair
value through profit or loss and in accordance with FRS 102, the Financial Reporting Standards
applicable in the UK and Republic of Ireland, and with the Statement of Recommended Practice
for Financial Statements of Authorised Funds issued by the Investment Association in May 2014.
Interim Financial Statements (Unaudited) June 2017
17
Disclaimer
This document is being provided solely for informational purposes. The value of an investment
may fall or rise. All investments involve risk and past performance is not a guide to future returns.
Equitile offers no guarantee against loss or that investment objectives will be achieved. Equitile
does not offer investment advice. Please read the Key Investor Information Document, Prospectus,
and any other offer documents carefully and consult with your own legal, accounting, tax and
other advisors in order to independently assess the merits of an investment. Investors and any
potential investors should be aware of local laws governing investments and should read all the
relevant documents including any reports and accounts and scheme particulars as appropriate.
Recommended